the Creative Commons Attribution 4.0 License.
the Creative Commons Attribution 4.0 License.
 | 26 Jul 2023
Global physics-based database of injection-induced seismicity
Iman R. Kivi
Auregan Boyet
Haiqing Wu
Linus Walter
Sara Hanson-Hedgecock
Francesco Parisio
Victor Vilarrasa
Fluid injection into geological formations for energy resource development frequently induces (micro)seismicity. Moderate- to large-magnitude induced earthquakes may cause injuries and/or economic loss, with the consequence of jeopardizing the operation and future development of these geo-energy projects. To achieve an improved understanding of the mechanisms of induced seismicity, develop forecasting tools and manage the associated risks, it is necessary to carefully examine seismic data from reported cases of induced seismicity and the parameters controlling them. However, these data are challenging to gather together and are time-consuming to collate as they come from different disciplines and sources. Here, we present a publicly available, multi-physical database of injection-induced seismicity (Kivi et al., 2022a; https://doi.org/10.20350/digitalCSIC/14813), sourced from an extensive review of published documents. Currently, it contains 158 datasets of induced seismicity caused by various subsurface energy-related applications worldwide. Each dataset covers a wide range of variables, delineating general site information, host rock properties, in situ geologic and tectonic conditions, fault characteristics, conducted field operations, and recorded seismic activities. We publish the database in flat-file formats (i.e., .xls and .csv tables) to facilitate its dissemination and utilization by geoscientists while keeping it directly readable by computer codes for convenient data manipulation. The multi-disciplinary content of this database adds unique value to databases focusing only on seismicity data. In particular, the collected data aim at facilitating the understanding of the spatiotemporal occurrence of induced earthquakes, the diagnosis of potential triggering mechanisms, and the development of scaling relations of maximum possible earthquake magnitudes and operational parameters. The database will boost research in seismic hazard forecasting and mitigation, paving the way for increasing contributions of geo-energy resources to meeting net-zero carbon emissions.
- Article
(4732 KB) - Full-text XML
- BibTeX
- EndNote


Fluid injection into and withdrawal from the subsurface, deep underground mining, and reservoir impoundment are some of the most prominent causes of induced seismicity, which became a global problem in the past decade (see Foulger et al., 2018, for a comprehensive review). In this period, the rate of induced earthquakes with magnitudes M>3 has grown 3-fold in western Canada (Atkinson et al., 2020) and 10-fold in Oklahoma (Ellsworth, 2013). While the increased levels of seismicity in western Canada are broadly attributed to the hydraulic fracturing of ultralow-permeability shales to commercially exploit unconventional oil and gas (Bao and Eaton, 2016), seismic activity in the midwestern United States has increased principally as a result of large-volume wastewater disposal in deep formations (Shirzaei et al., 2016). Several large earthquakes have also been triggered in the course of geothermal energy exploitation in response to fluid injection, extraction and circulation and, more importantly, hydraulic stimulation of naturally low-permeability hot formations to develop enhanced geothermal systems (EGSs, Evans et al., 2012; Buijze et al., 2019). Earthquakes induced by these geo-energy activities were occasionally felt by the local population and even resulted in injuries to people and damage to buildings and infrastructure, causing early termination of projects and loss of investment (Häring et al., 2008; Cesca et al., 2014; Lee et al., 2019). Utilization of the subsurface for energy purposes is likely to intensify in the upcoming decades, mainly driven by applications connected to the energy transition, such as geologic carbon capture and storage (CCS) (Ringrose et al., 2021) and geologic hydrogen storage (Heinemann et al., 2021). Injection-induced seismicity remains one of the largest liabilities of geo-energy projects and can potentially have a vast societal, environmental and economic impact (Verdon, 2014; Vilarrasa et al., 2019). Therefore, minimizing the risks associated with induced earthquakes is a prerequisite for the secure and sustainable deployment of geo-energy applications worldwide (see Fig. 1 for an overview of geo-energy projects triggering seismicity).
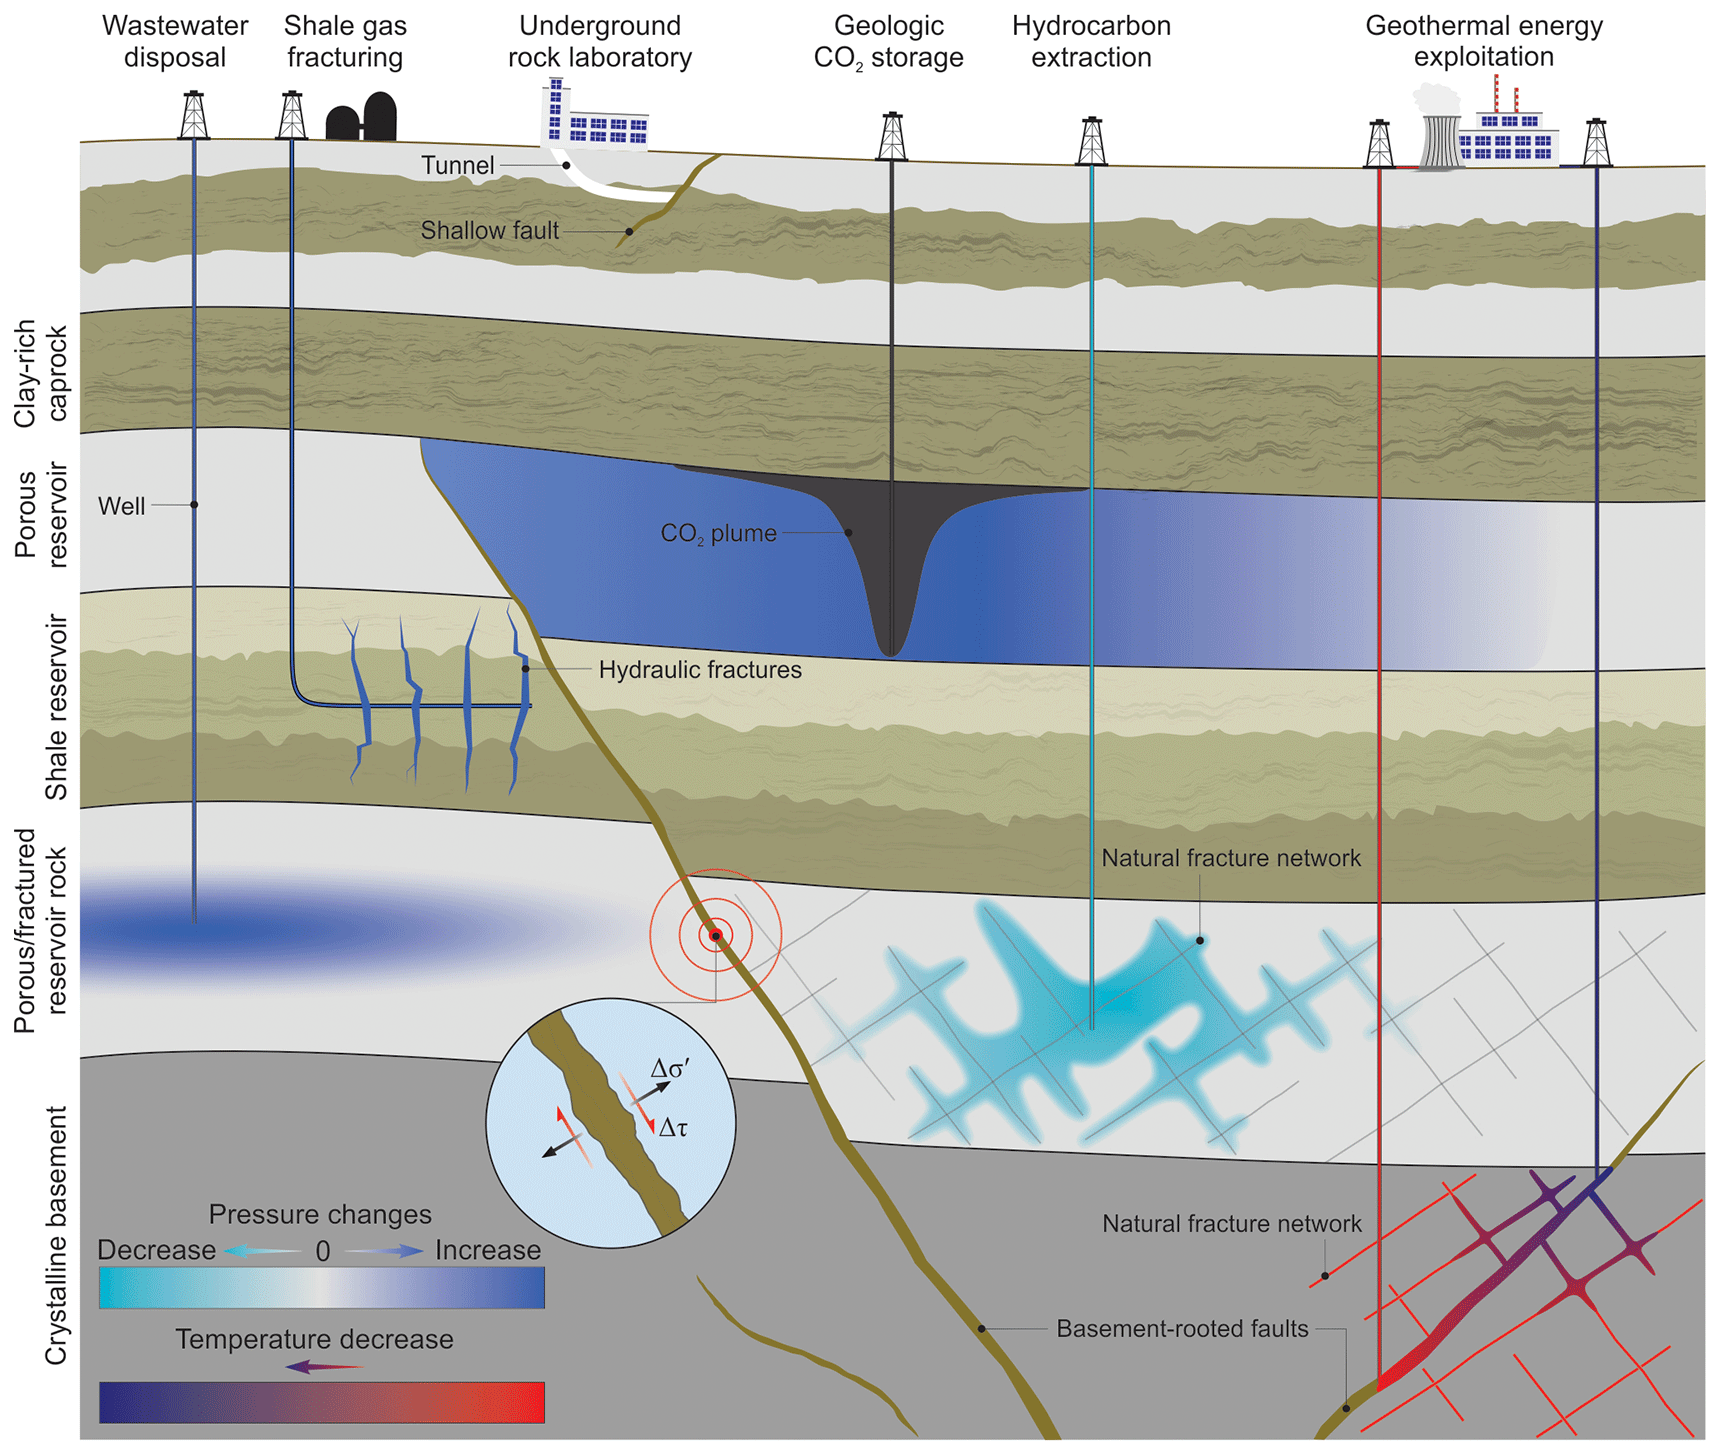
Figure 1Schematic illustration of geo-energy applications linked with induced seismicity. Earthquakes have reportedly been induced by tight and shale gas fracturing, conventional oil and gas development activities, deep wastewater disposal, geologic storage of natural gas or CO2, and geothermal energy exploitation and research projects.
The recent surge in the number of injection-induced earthquakes has drawn considerable attention in the seismological and hydrogeological research communities. Scientific efforts are mainly focused on understanding the triggering mechanisms of induced earthquakes, forecasting the seismic risk and hazards, and developing mitigation and management strategies. There are a variety of approaches to seismic hazard forecasting and management, which are commonly categorized into probability- and physics-based approaches depending on the utilized input data, applied processing methods and outcomes.
Probability-based techniques, independent of the physics that induce the earthquakes, strive to develop a quasi-real-time prediction of the seismicity rate and magnitude evolution. To this end, these approaches inherit two fundamental laws from statistical seismology (Ogata, 1988; Shapiro et al., 2010; Bachmann et al., 2011): the Gutenberg–Richter (G–R) law (Gutenberg and Richter, 1942), which describes the frequency–magnitude distribution of earthquakes, and the Omori–Utsu law (Utsu, 1961), delineating the aftershock decay. Both statistical approaches are based on model calibration against catalogs of monitored induced seismicity. However, the statistics evolve with fluid injection, presenting more frequent small earthquakes during injection and more larger earthquakes after the stop of injection (e.g., Ruiz-Barajas et al., 2017). Such evolution trends of the earthquake magnitudes limit the predictive capability of probability-based methods.
Physics-based approaches aim at constraining the spatiotemporal evolution of seismicity by considering the underlying triggering mechanisms. A fault reactivates when the shear stress acting on the fault plane exceeds its frictional strength (Jaeger et al., 2009). Accordingly, stress perturbations and/or strength alterations on seismogenic faults (faults prone to seismic slip), driven by coupled thermal–hydraulic–mechanical–chemical (THMC) processes of fluid flow in porous and/or fractured rocks, may result in earthquakes. The impacts of THMC processes on induced seismicity have been largely acknowledged in recent years, mainly by incorporating them into process-based modeling of induced earthquakes (Cappa and Rutqvist, 2011; Ghassemi and Zhou, 2011; De Simone et al., 2017; Vilarrasa et al., 2021; Kivi et al., 2022b). Nevertheless, the governing mechanisms of seismic sequences (1) unexpectedly triggered after the causative operation ceased, i.e., post-injection seismicity (Segall and Lu, 2015; Johann et al., 2016); (2) located tens of kilometers away from the operation sites (Goebel et al., 2017; Yeck et al., 2017); or (3) vertically offset by up to several kilometers from the fluid injection and/or withdrawal horizon (Eyre et al., 2019; Vilarrasa et al., 2021; Zhai et al., 2021) remain largely elusive. Using physically sound models with varying degrees of sophistication to reproduce seismicity recorded in case examples around the world gives invaluable insights into the causes of these challenging seismic sequences. Indeed, such studies should enable advancement on two fronts: shedding light on earthquake-triggering mechanisms and developing a proactive framework for future seismic hazard quantification and management. However, these modeling efforts rely on access to several parameters, including geological setting, multi-physical reservoir rock and fault properties, in situ stress, pressure and temperature distributions across the reservoir, and details of the conducted industrial operations and recorded seismicity. The main limitation is that these variables are scattered across multiple disciplines and are hardly gathered together in reported sites of induced seismicity.
Considerable efforts have been devoted to predicting or drawing bounds on the maximum earthquake magnitude, Mmax, by scaling it with (1) the cumulative injected fluid volume (McGarr, 2014; Galis et al., 2017), (2) the initial stress state (Li et al., 2021), (3) the number of induced earthquakes (van der Elst et al., 2016), (4) the dimensions of the stimulated volume (Shapiro et al., 2011) or (5) the elapsed time from the onset of injection to the earthquake occurrence (Shapiro et al., 2021). However, caution should be taken when employing scaling relations of induced seismicity as their seismic-forecasting capability is limited. For example, the 2017 Mmax 5.5 Pohang earthquake in Korea, triggered by stimulation of an EGS, is a well-known outlier in the magnitude-scaling relations, where the injected fluid volume was 500 times smaller than the amount expected to induce the earthquake (Lee et al., 2019). Data emerging with the growing incidences of induced earthquakes present an unprecedented opportunity to verify the reliability of the existing seismicity models and to develop alternatives that are more indicative of the underlying physics.
Many review articles and reports scrutinizing induced seismicity (Suckale, 2009; Evans et al., 2012; National Research Council, 2013; Gaucher et al., 2015; Grigoli et al., 2017; Keranen and Weingarten, 2018; Vilarrasa et al., 2019; Ge and Saar, 2022) converge on a common conclusion: a comprehensive and publicly accessible database of seismicity and parameters controlling it from historical cases would be of utmost value to improving the characterization of induced seismicity and informed management of its risks. Wilson et al. (2017) and Foulger et al. (2018) presented an exhaustive inventory of all (potentially) induced earthquakes called the HiQuake database, with the most recent updates being available in an online repository (the Human-Induced Earthquake Database (HiQuake) (2022): https://inducedearthquakes.org/, last access: 3 June 2022). Nevertheless, the data covered by HiQuake are primarily restricted to seismicity catalogs and relatively few operational parameters, while key tectonic, rock and fault properties are missing; filling the gap is the main goal of this study.
We have developed a multi-physical database of injection-induced seismicity in the framework of the ERC-funded project GEoREST (predictinG EaRthquakES induced by fluid injecTion, grant agreement no. 801809). The database gathers a publicly accessible compilation of parameters that control injection-induced seismicity and that are relevant to geo-energy developments. Here, we provide an overview of the database content and structure, present the resources and the criteria considered for the collection and curation of data, and formally release the current state of the database as its first version in flat-file formats (Kivi et al., 2022a; https://doi.org/10.20350/digitalCSIC/14813). In total, 71 parameters, categorized into 7 disciplines, have been collected for 158 cases of induced seismicity. The database will be updated in the future for new cases of induced earthquakes and already-missing case histories, particularly those from the petroleum industry, if data become available. The large number of case examples and the diversity of input parameters make the collected datasets very well suited to testing new scaling relations for maximum earthquake magnitude forecasting.
2.1 Database structure
The database is licensed under the Creative Commons CC BY 4.0 International License and is publicly accessible. The compilation contains 158 notable cases of injection-induced seismicity together with multi-physical parameters characterizing the seismic events. It should be noted that the terms induced and triggered are occasionally employed in the literature to discriminate between human-made earthquakes depending on their origin or causing mechanisms (McGarr et al., 2002; Ellsworth et al., 2019; Buijze et al., 2019). We, however, do not distinguish between induced and triggered earthquakes hereafter in the article and in the database and consistently use the term induced for all earthquakes of anthropogenic origin. The database practices FAIR guiding principles for data management that assist in making the database findable, accessible, interoperable and reusable by humans and machines (Wilkinson et al., 2016). We provide the database in two flat-file formats: the first as a single Microsoft Excel spreadsheet to keep it as simple and friendly as possible to researchers and inexperienced end-users and the second as a .csv file, representing a standard machine-readable format for direct implementation of data in model developments.
We build our database mainly upon HiQuake, the holistic and invaluable compilation of earthquakes proposed, on scientific grounds, to be induced by human activities. However, Wilson et al. (2017) and Foulger et al. (2018) point to varying degrees of certainty, from strongly unlikely to virtually certain, that the reported earthquakes in HiQuake have been anthropogenically induced. Thus, judging if the earthquakes were definitely human induced is sometimes challenging and subjected to inevitably varying opinions among researchers. These uncertainties mainly grow when discriminating between natural and induced earthquakes if located at seismically active plate boundaries. Thus, we neither independently assess nor negate the induced or natural essence of these cases.
The database puts exclusive emphasis on injection-induced earthquakes. Our attempts to develop this collection consist of (1) complementing data entries for general site characteristics, operational parameters, and seismicity data to which HiQuake has been restricted and (2) collecting data for 41 additional input parameters concerning reservoir rock properties, fault characteristics, and in situ stress and pressure data through comprehensively reviewing nearly 500 scientific resources. This extensive set of input parameters is necessary to achieve a mechanistic understanding of induced seismicity and to develop forecasting models.
A fundamental criterion for sites to be included in the database is data availability on a publicly accessible scientific basis (Sect. 2.2.9). Thus, we do not list in the database several cases associated, in particular, with conventional hydrocarbon development projects that lack information about the hydrogeological and geomechanical properties, i.e., porosity, permeability, stiffness and strength properties of the reservoir rock as well as the state of stress and pore pressure, potentially due to confidentiality (see Sect. 2.3 for more details about data curation). We categorize the remaining injection-induced earthquakes based on the geo-energy application types into (1) geologic gas storage (including both natural gas and CO2 storage), (2) geothermal energy exploitation, (3) tight and shale gas fracturing, (4) research projects, and (5) wastewater disposal, all playing prominent roles in sustainable and green-energy transition (IPCC, 2018).
Every case of induced seismicity belonging to an individual project or to separate phases of a project is listed in a distinct row. The latter case scenarios are particularly relevant to the circulation, injection or stimulation phases of the same geothermal plant (e.g., the Cooper, Insheim or Soultz geothermal sites) and multistage hydraulic fracturing of shale gas resources from a single well pad (e.g., Fox Creek sequences). In contrast, only one sequence possessing the largest maximum magnitude is considered for long-lived injection operations, like the Geysers EGS project, which presumably results in multiple distinct seismic sequences, and for repeating scientific injections at centimeter- or decameter-scale rock laboratories. The collected cases are sorted alphabetically with reference to the project type, then to the country and finally to the site location. The users can simply adapt the sorting to any order of interest.
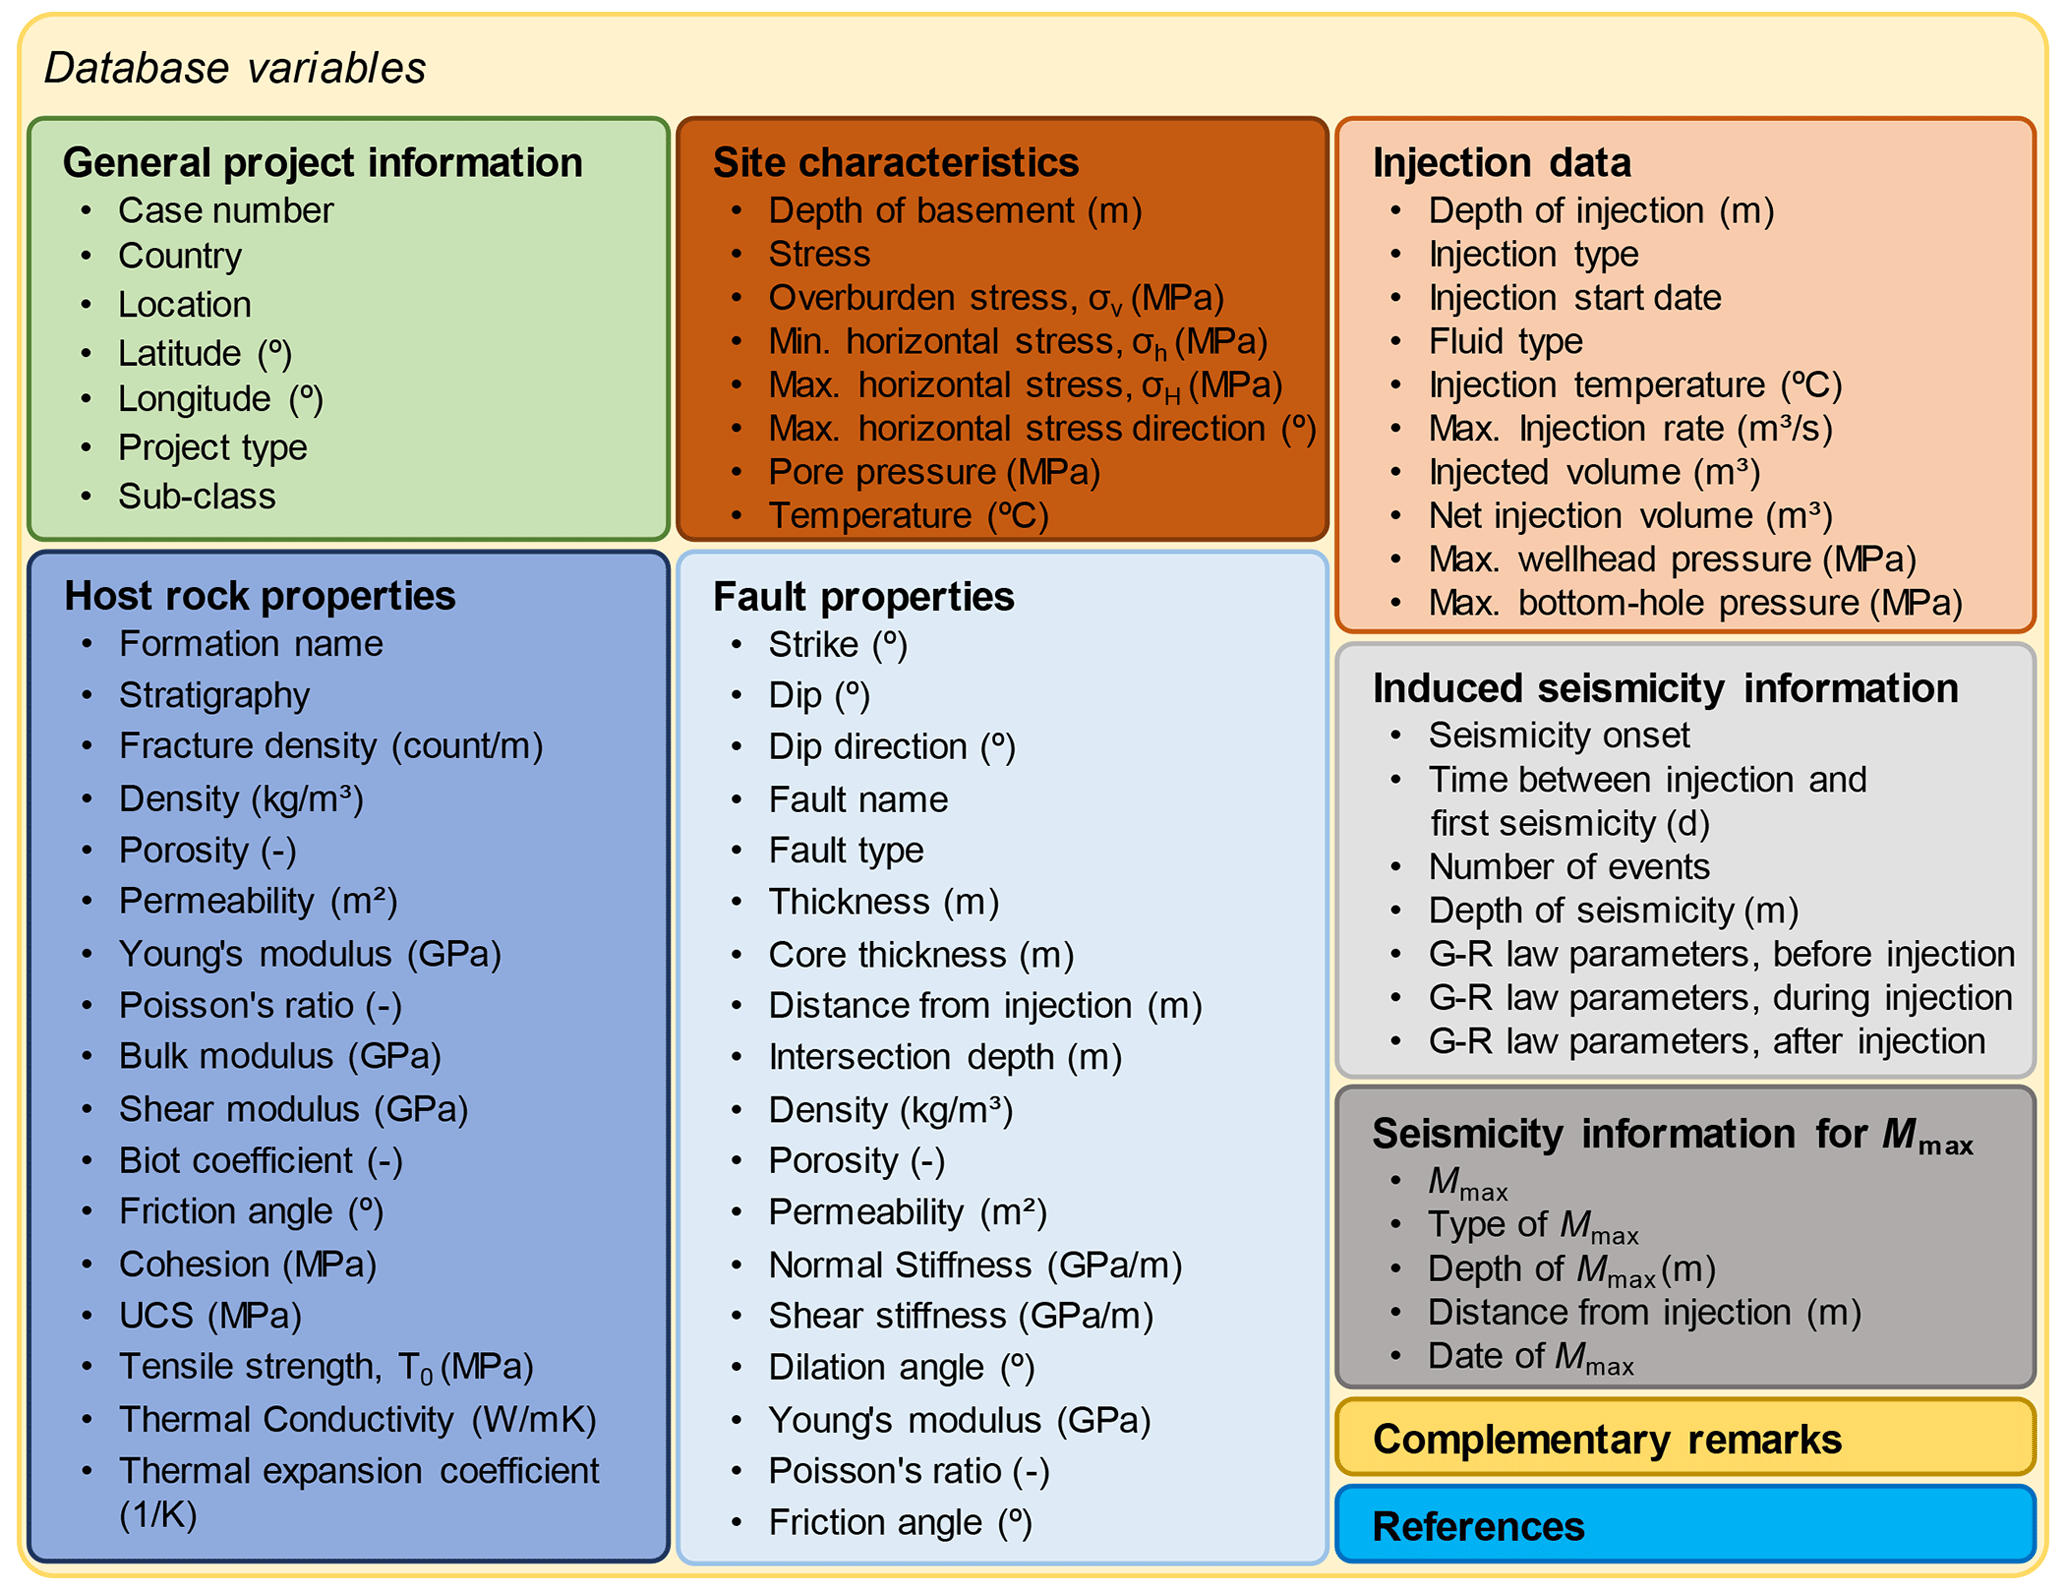
Figure 2Schematic structure of the database representing different sub-tables and the associated properties.
The parameters are listed in separate columns and structured into seven main sub-tables, succeeded by two single entities of complementary remarks and references, to increase readability and facilitate data usage (see Fig. 2 for a complete list of database parameters). The first row of the database contains the sub-table headings, which respectively comprise a series of interconnected entries of project information, reservoir rock properties, in situ tectonic and pressure data of the site, fault characteristics, injection data, general seismic records, and the maximum-magnitude event information. A total of 71 individual input parameters delineate each case of induced earthquake and are labeled with their units in the second row. Subdivisions may apply to some parameters, essentially to present a range instead of a single value. The aforementioned three levels of parameter definition are merged into a unified, short and self-explanatory naming convention in the format of data type_parameter name_subdivisions in the fourth row. For example, fault_dens_min points to the minimum value of the density of the rock forming the fault [kg m−3]. The adopted naming convention enables us to render the database in separate single-header and uniquely described columns to make it machine readable and, thus, easy to process by other researchers. The database is accompanied by a dictionary that maps the abbreviated names of all parameters to their full meaning. A detailed explanation of all entities, divided into different data types, is documented in Sect. 2.2.
2.2 Input parameters
We describe in the following parameters included in our database. In the context of physics- or statistic-based approaches, supported by field observations on availability, we argue how different parameters are relevant to the improved understanding and forecasting of induced seismicity. We also comment on the availability of data, common approaches to measure (or record) the data and the way we report them.
2.2.1 General project information
This sub-table comprises all data relevant to the type and location of the project that led to the respective induced earthquake. The first column contains the project number. We subsequently list the country, name and coordinates (i.e., latitude and longitude in the WGS84 reference system in decimal degrees) of the place or site where the project was conducted. The project name distinguishes between separate phases of a project leading to independent seismic sequences in the spatial and temporal domains. We complement project information by documenting both the project category and sub-category.
The sub-category is of particular importance to induced seismicity in geothermal reservoirs in which the rate and the total net volume of injected fluid vary widely among different sub-categories. Various operations during geothermal energy exploitation have reportedly been associated with induced seismicity, offering corresponding sub-categories for this project type: drilling, preliminary hydraulic test, circulation, injection and enhanced geothermal systems (EGSs). While the produced and injected fluid masses during circulation are commonly balanced, huge amounts of fluid at elevated rates and pressures are injected during the stimulation phase of EGS projects (Evans et al., 2012). The sub-categories also differentiate between research projects injecting fluid into centimeter-scale specimens, decameter-scale underground rock laboratories (URLs) and deep boreholes.
We gather together natural gas storage and CCS projects under the broader framework of geologic gas storage because they may share common operational characteristics, physical properties of the injected fluid and seismicity-triggering mechanisms. Megatonne geologic carbon storage projects have been accompanied by low seismic activity (Vilarrasa and Carrera, 2015; Ge and Saar, 2022). However, the need for rapid and massive CCS scale-up raises concerns about basin-wide pore pressure buildups and, thus, the likelihood of triggering induced earthquakes (Zoback and Gorelick, 2012; Verdon, 2014). These concerns are consistent with the notable case of the 2013 moment magnitude (Mw) 4.2 earthquake at Castor, Spain, linked to underground natural gas storage (Vilarrasa et al., 2021) and encourage revisiting in more detail the issue of induced seismicity during large-scale underground gas storage.
2.2.2 Reservoir rock properties
This sub-table provides data on the thermal and hydrogeological properties of the host rock that may affect induced seismicity calculations. We include the target formation name and the stratigraphy in the first and second columns of this sub-section, respectively. Information about the formation name facilitates cross-linking rock properties in different projects targeting the same formation. Such correlations help arrive at rough estimates of rock properties where direct measurements are missing (see Sect. 2.3). We provide 15 different rock parameters representing physical, hydraulic, poroelastic, thermal and failure characteristics of the formations (see Fig. 2 for a detailed list of these parameters). In particular, we include elastic moduli, Biot coefficient, porosity and permeability of the rock, which are crucial in assessing triggering mechanisms and forecasting the timing and magnitude of induced earthquakes, as briefly described below.
The temporal and spatial evolution of pore pressure in porous media, rendering a basic mechanism for inducing seismicity, is controlled by hydraulic diffusivity , in which k, μ and S denote the rock permeability, dynamic fluid viscosity and storage coefficient, respectively (Rice and Cleary, 1976). Although the storage coefficient takes different formulations depending on the applied loading conditions, it primarily depends on the rock porosity φ and the bulk moduli of the fluid Kf, solid grains Ks, and rock skeleton under drained conditions K (Cheng, 2016). Pore pressure changes give rise to poroelastic stresses whose magnitudes depend on the rock stiffness (elastic moduli) and the Biot effective stress coefficient, defined as . Besides, cooling effects driven by long-term cold fluid injection (particularly during geologic carbon storage and geothermal energy exploitation) result in thermoelastic stresses proportional to the rock stiffness and linear rock expansion coefficient, αT (De Simone et al., 2017). Accordingly, McGarr (2014) has argued that the stiffer the rock, the larger the pore pressure enhancement resulting from a constant volume of injected fluid and, thus, the larger the shear stress buildup on the fault and the maximum expected earthquake magnitude.
The main data source for this class of parameters is commonly laboratory measurements on rock specimens retrieved preferably from depth, otherwise from outcrops, but also wireline-logging interpretations and field tests. It should be borne in mind that field tests may better represent the in situ rock mass behavior, particularly if it is intensively fractured. The measured values may significantly differ from laboratory inspections of nominally intact specimens, featuring differences in intrinsic permeabilities of several orders of magnitude in fractured crystalline and argillaceous rocks (Brace, 1980). To account for the inherent heterogeneity of the rock and measurement uncertainties (see Sect. 2.3 for further details), we give the minimum and maximum values of the collected data pool. Laboratory measurements of rock porosity, permeability and elastic moduli are more common and may span a wide range. Therefore, we also report for these parameters the average value, dealing partly with the statistical distribution of the measured data. In addition, if the measurements only contain a single data point, particularly for values deduced from field tests, it is given as the average value across the injection interval.
2.2.3 In situ geologic and tectonic characteristics
In this section, we primarily verify the approximate depth of the crystalline basement where the crust is widely accepted to be critically stressed (Townend and Zoback, 2000) and the strength properties of faults render them more susceptible to seismic slip (seismogenic faults, Verberne et al., 2020). These characteristics of the crystalline basement are consistent with observations of the nucleation of the vast majority of large earthquakes in the basement (Horton, 2012; Goebel et al., 2017; Buijze et al., 2019; Williams-Stroud et al., 2020). A notable example comes from wastewater disposal in Oklahoma, where the released seismic moment was found to be strongly correlated with injection depth relative to the crystalline basement (Verdon, 2014; Hincks et al., 2018). We also describe the present-day in situ stress magnitudes, directions and regime, as well as the reservoir pressure and temperature. These factors play a first-order role in earthquake rupture and coupled THMC processes that control the evolution of seismic hazards in time and space. The influence of the regional stress regime on fault stability changes induced by poroelastic and thermoelastic stresses has been well acknowledged through numerical simulations (Vilarrasa, 2016; Fan et al., 2019).
The magnitudes of the stress components and pressure are assumed to follow linear relationships with depth, characterized by gradient m and surface value n. The linear trends are commonly forced to pass through the origin, which entails n=0 (zero value at the surface). The linearity assumption is routinely adopted to evaluate in situ stress and pressure profiles and is deemed valid for relatively homogeneous, short depth intervals. We calculate, based on the established linear fittings, the maximum and minimum values of pressure and stress components corresponding to the bottom and top of the injection interval, respectively. Thus, missing either of the two values means that the injection depth interval is not constrained on one side.
The overburden stress and pore pressure gradients are inferred in a straightforward manner from density logs and well test data, respectively. On the contrary, a range of wellbore measurements and techniques should be combined to delineate in situ horizontal stresses: (1) caliper or imagery detection of breakouts and drilling-induced tensile fractures (DITF) from which horizontal stress directions can be deduced, (2) leak-off or mini-frac tests to estimate the minimum horizontal stress magnitude, and finally (3) theoretical replication of the breakout and DITF occurrences within the crustal strength bounds to constrain the maximum horizontal stress magnitude (Haimson and Cornet, 2003; Zoback et al., 2003). The stress magnitude and regime determined from this integrated approach are widely found to correlate well with focal mechanisms of induced earthquakes, for instance, in Fox Creek (Shen et al., 2019) or Basel (Valley and Evans, 2019). If data from these sources are not available, we do not rely on focal-plane solutions of natural earthquakes, accessible from the well-documented world stress map (Heidbach et al., 2018). The reason is that natural earthquakes likely belong to the deep crust, where stress conditions do not necessarily coincide with injection depths.
2.2.4 Fault properties
We collect a wide range of fault parameters including the name, type (normal, strike–slip and reverse or a combination), orientation (strike and dip), total thickness, core thickness, location with respect to injection, and hydraulic and mechanical characteristics (Fig. 2 presents the full list of parameters). Knowing the fault name, valuable additional information may be inferred from the existing databases of fault properties (e.g., Scibek, 2020, provide a worldwide database of fault permeability). The considered parameters in the database are essential to assess the slipping tendency of the fault. The pore pressure and stress distribution along the faults, originating from remote injection source(s), are usually calculated numerically. The numerical models represent the fault either as approximately planar discontinuities or as equivalent-continuum porous media (Cappa and Rutqvist, 2011; Berre et al., 2019). While the former approach treats the fault explicitly using its normal and shear stiffnesses, the latter needs two independent elastic moduli describing the deformation of fault-forming material. Thus, we list both sets of parameters, although they can be approximated from each other by knowing the density of fractures or planes of weakness along the fault strike (Zareidarmiyan et al., 2020). We document the static friction and dilation angles, respectively, as measures of the intrinsic resistance of the fault against slip initiation and the fault's tendency to dilate as a result of slipping. From the hydraulic point of view, faults can act as barriers or conduits to flow along and across them (Caine et al., 1996), the choice of which may strongly impact fault stability (Vilarrasa et al., 2016; Wu et al., 2021; Kivi et al., 2022b). The fault architecture may be extremely complex, producing anisotropic and heterogeneous permeability fields (Rinaldi et al., 2014). However, given the data scarcity, we do not account for such complexities and use single-value (scalar) hydromechanical parameters to represent isotropic and homogeneous faults.
The fault orientation and slip types are primarily derived from the earthquake focal mechanisms. The hydraulic permeability, stiffness and frictional strength of faults can be directly measured from laboratory tests on representative outcrop samples or retrieved cores from depth. These parameters can also be determined from appropriately designed and monitored injection experiments either at underground rock laboratories or field scales. Assuming that pore pressure perturbations (diffusion-like process) stand solely as the triggering mechanism for induced earthquakes, observations of the spatiotemporal migration of seismic events may provide valuable estimates of the average fault permeability (Shapiro et al., 1997; Talwani et al., 2007). Arguably, the inferred values pose an upper-bound limit to the possible range of fault permeability.
2.2.5 Injection data
We document the operational parameters that are of paramount importance in understanding and predicting induced earthquakes, as well as in the mitigation of seismic risks (Ge and Saar, 2022). Data include the injection depth interval together with the start date and specific remarks on the injection. These remarks mainly concern fluid injection protocols (commonly constant-rate, stepwise-rate increases and cyclic schemes) and applications not already mentioned in the project category or sub-category lists (e.g., pre-injection tests, the main injection stages or reinjections). We also list the fluid type, injection temperature and viscosity if explicitly reported in the literature. Otherwise, one can estimate the viscosity from the fluid type and the injection temperature using appropriate equations of state. Besides, the temperature difference between the injected fluid and the reservoir generates thermal stresses that may control the stability of adjacent (Parisio et al., 2019) and even distant faults (Kivi et al., 2022b). Although these thermal effects are more pronounced in geothermal systems, unambiguously due to elevated differential temperatures, non-negligible impacts are anticipated during geologic carbon storage (Vilarrasa and Rutqvist, 2017).
We gather together information on the cumulative volume of injected fluid and the maximum injection pressure and rate. These parameters primarily control the disturbance of pore pressure and stress in the subsurface and, thus, the possibility of inducing earthquakes, as described in the following. McGarr (2014) pioneered a relationship between the maximum anticipated earthquake magnitude and the injected fluid volume, turning to a popular and widely cited approach to deal with the injection-induced seismicity risk. Besides, induced seismicity observed early during the stimulation phase and adjacent to the wellbore in a number of geothermal reservoirs has been closely correlated with high injection pressures (Zang et al., 2014). In contrast, adopting a poroelastic model of earthquake nucleation, Alghannam and Juanes (2020) argued that the likelihood of triggering seismicity depends strongly on the injection rate rather than the magnitude of generated overpressure. In this sense, for a given total volume of injected fluid, the faster and larger the injection rate increase, the more frequent the seismicity. Statistical analyses also show that the dramatic growth of seismic activities in the central and eastern USA that began in 2009 is more likely to be linked to high-rate water disposal wells than low-rate wells (Weingarten et al., 2015; Langenbruch and Zoback, 2016). These analyses suggest that the fluid injection rate, among other operational parameters, may pose a first-order control on seismicity risk. Ongoing research into understanding the interplay between the mentioned operational parameters may help come up with novel strategies to forecast and mitigate induced seismicity.
We discriminate between the total and net fluid volumes injected up to the time of the maximum-magnitude earthquake (the latter is simply defined as the injected minus produced fluid volumes). The net injection volume for fluid circulation during geothermal energy exploitation may or may not equal zero, depending on the (im)balance between injection and production rates. Missing records of either of the two rates would lead to high uncertainty in estimating the net injection volume in long-term circulation systems. Furthermore, we consider two measures for the injection pressure: wellhead pressure and bottom-hole pressure. The geothermal gradient and friction of the working fluid generated in the annulus may impose non-trivial impacts on the bottom-hole pressure (Pan and Oldenburg, 2014; Vilarrasa and Rutqvist, 2017). We report the bottom-hole pressure only if it is measured or calculated.
2.2.6 General seismicity records
General seismicity records include available information regarding the onset of seismicity (or its recording after a delayed installation of detecting networks), the seismicity lag time from the start of the operation, the number of events and their occurrence depth range. The number of events comprises a brief text describing the number of all recorded events, not limited to the sequence of the maximum magnitude. We also document the a and b values of the Gutenberg–Richter empirical law, which stands as a reference for statistical forecasting of the seismic hazard by explaining the magnitude–frequency distribution of earthquakes (Gutenberg and Richter, 1942):
where N is the number of events with magnitudes equal to or larger than M. The a and b values denote the sequence productivity and the relative abundance of large- to small-magnitude events, respectively, and are extracted from earthquake catalogs. For tectonic earthquakes, the b value commonly approaches 1, meaning that events of magnitude M≥2 are statistically 10 times more frequent than events of magnitude M≥3 for a given time window (Kanamori and Brodsky, 2004). The larger the b value during induced seismicity, the larger the predominance of small earthquakes. From a physical point of view, high b values may coincide with microseismicity and the opening of new fractures (tensile events) due to elevated overpressure close to the injection wellbore. Low b values may denote reactivation (shear event) of pre-existing, critically stressed faults, reflected in large stress drops and the corresponding moment magnitudes (Goertz-Allmann and Wiemer, 2013; Zang et al., 2014). Nevertheless, establishing a physically sound link between seismological observables and the geomechanical behavior of the subsurface remains a hot topic of active research.
The seismic hazard has reportedly been augmented with an increased tendency to induce larger events in the post-injection phase compared to co-injection seismicity for a number of high-profile induced earthquakes. These observations entail a reduced b value after wellbore shut-in. For instance, between co- and post-injection seismicity, the b value has shown meaningful reductions from 1.58±0.05 to 1.15±0.07 in the Basel, Switzerland (Bachmann et al., 2011), deep geothermal project and from 2.0±0.3 to 1.1±0.1 in the Castor, Spain (Ruiz-Barajas et al., 2017), underground gas storage project. As a result, we report distinct parameter values for three different seismicity subsets: the background seismicity prior to the operation, seismic events during the injection phase and seismicity trailing the wellbore shut-in.
2.2.7 The maximum-magnitude event
In addition to general seismicity information, we record detailed information about the maximum-magnitude event, including the possible depth range, the occurrence date and the approximate distance from the injection borehole, along with its magnitude and the magnitude field. We report moment magnitude MW whenever available; otherwise, we cite local magnitude ML and hardly any duration magnitude MD and body wave magnitude mb. If multiple magnitude types are available, we preferentially include the moment magnitude in the cell and give the others in the comment. Converting the magnitude types is not straightforward and is left up to the end-users.
2.2.8 Complementary remarks
We designate a brief text to disclose the potential causal mechanism(s) of the induced earthquakes (see the Introduction section) if resolved. Particularly, induced earthquakes are occasionally linked to multiple simultaneous anthropogenic activities in the subsurface. For instance, regionally induced earthquakes in the Delaware Basin, Texas, are attributed to widespread shale fracking and wastewater disposal into deep and shallow aquifers (Zhai et al., 2021), giving rise to debates about the causative contribution of each activity. Insights obtained from analytical and numerical inspection of the temporal and spatial evolution of induced earthquake sequences and anthropogenic activities may help clarify such ambiguities. We also present any additional notes that help delineate the project, injection conditions and observed seismicity. Specially, we highlight features that may affect earthquake risk management, such as the aftershock sequence or the rupture nucleation beyond the target injection layer.
2.2.9 Data sources
The reported data in the database come from publicly available resources, including scientific publications (books, peer-reviewed journal papers or proceedings), relevant databases, and published reports or dissertations. Accordingly, researchers can refer to the references alphabetically cited in this part of the database to acquire further information. The references are linked to an accompanying bibliography list provided at the database repository (see the Data availability section). As the input parameters for the database come from various disciplines, multiple references are commonly used to complete data for each case. The reference(s) for each data entry is given as a comment on the corresponding cell in the Excel format.
2.3 Data curation
The vast majority of case examples of induced seismicity included in the database correspond to those compiled in the HiQuake database (Wilson et al., 2017), commonly referred to as a reference for human-induced earthquakes. Our primary auditing of the HiQuake database recognizes 551 case examples of injection-induced earthquakes, excluding those triggered during the development of conventional oil and gas resources essentially due to data scarcity. We find 349 of the cases to be inappropriate for inclusion in our database. A total of 320 discarded (micro)seismic sequences are associated with the hydraulic fracturing of shale gas plays in Oklahoma, for which the links with particular operating wells or injection programs are missing (Skoumal et al., 2018b). The majority of these hydraulic fracturing datasets (233 operations) suffer from a lack of the associated maximum earthquake magnitude data. Likewise, we discard an additional 22 fracturing-induced (micro)earthquake swarms in the Dawson–Septimus area of Canada (Roth et al., 2020) and 7 individual, sparsely located events attributed to geothermal operations, all missing similar basic seismic information. Collectively, we structure our database by considering 202 reported injection-induced earthquakes from HiQuake, complemented by five additional sequences: two recorded at the geologic CO2 storage pilot sites of Heletz, Israel, and Hontomin, Spain, and three recorded during injection into centimeter-scale rock specimens in the laboratory.
We organize a comprehensive and systematic search for the variables described in Sect. 2.2. However, a handful of historical induced earthquakes lack rigorous characterization studies. For these events, many associated key parameters may be unavailable, with the corresponding cells in the database left blank. Therefore, we perform the second level of data auditing to exclude cases that lack basic information, such as injection data or host rock properties.
Data concerning fault properties are rare, primarily due to characterization limitations: (1) earthquakes are frequently induced on unmapped faults without prior characterization; (2) the reactivated fault is not necessarily crossed by any borehole and neither samples for laboratory studies nor wireline logging is available; and (3) sufficient and appropriately located field observations that enable in situ evaluation of the fault behavior, including microseismicity, pressure and deformation measurements, scarcely exist. Consequently, the reported information in the database for many cases is limited to the faulting regime, strike and dip inferred from the analysis of earthquake focal mechanisms. Nevertheless, we retain cases for which fault properties, in situ stress data or some reservoir properties are unavailable to allow the users to benefit from the remaining reported parameters in special analyses. For instance, we keep cases for which the hydromechanical properties of the host rock are known as this information is valuable for developing theoretical scaling relations between possible earthquake magnitudes and injection parameters.
Inputs for data fields can be either quantitative or qualitative and, thus, of either numeric, date or text formats. Although data types may vary from one column to the other, all entries in each database column are necessarily of a unique type. Particularly, we avoid entering any explanatory text into numeric fields but only integers or floats. Dates consistently conform to the ISO 8601 format, representing the year, followed by the month and the day, i.e., yyyy/mm/dd. Exact dates may be underreported in the public domain for some historical or even new cases of induced earthquakes, possibly due to inappropriate monitoring or recording. We replace missing dates on the month and day levels with the first month of the year and the first day of the month, respectively. If this is the case, explanatory comments are provided in the Excel file. Furthermore, we unify the database by converting all numeric values to SI units. Accordingly, the database allows for direct calculations and data processing without requiring any unit and/or format conversion by other researchers.
We grade the entries for the host rock properties based on the data source as follows: A for direct measurements of the parameter at the injection place, B for representative values of the same formation in an adjacent field or basin, and C for those rendering the typical behavior of the corresponding stratigraphy. We provide the grade of each entry in the comment for the corresponding cell in the Excel file. We prioritize citing data in the order of reliability, i.e., grades A to C, narrowing down uncertainties of ensuing studies that users may build upon this database. The included grade-C values are published estimates of rock properties, commonly for numerical simulations, whose reliability in reproducing the rock behavior was adequately justified. If none of the graded information is available, we avoid making independent and unverified assumptions to fill in the respective column for an event. Values resulting from grade-B information can also be accompanied by non-trivial levels of uncertainty because the rock structure and its behavior may vary from place to place depending on the tectonic and environmental conditions undergone by the rock. In addition, different direct measurement techniques may give rise to discrepancies in the inferred parameter values. In cases where grade-A information is available, the values refer to laboratory evaluations unless otherwise stated in the comment. If measurements from multiple approaches are available, laboratory data are set as a reference for the sake of consistency with the remaining part of the database. The values derived from other sources are provided in the comment, notwithstanding the notion that in situ field measurements may be more representative of the average rock mass behavior (Vilarrasa et al., 2013; Neuzil, 2019). Similar concerns could arise in parameter extraction from independent evaluations by different studies. For conflicting cases, we either merge the inferred data (ranges) or choose among them depending on the supremacy of the input data, techniques and assumptions applied for their assessment. The former strategy is commonly adopted for laboratory measurements of rock properties, whereas the latter usually takes place for in situ stress evaluations.
The configuration of predefined structure, styling, terminology and data inspection criteria enables simultaneous data collection and curation. Nonetheless, we establish an ultimate integration phase to combine entries from individual contributors and provide a single unified representation of the database. Particularly, we scrutinize early grade-C data entries and whether they can be replaced with grade A or B from new insights obtained in the course of the database development. The database could be updated in the future to add new data and/or modify the existing information if required.
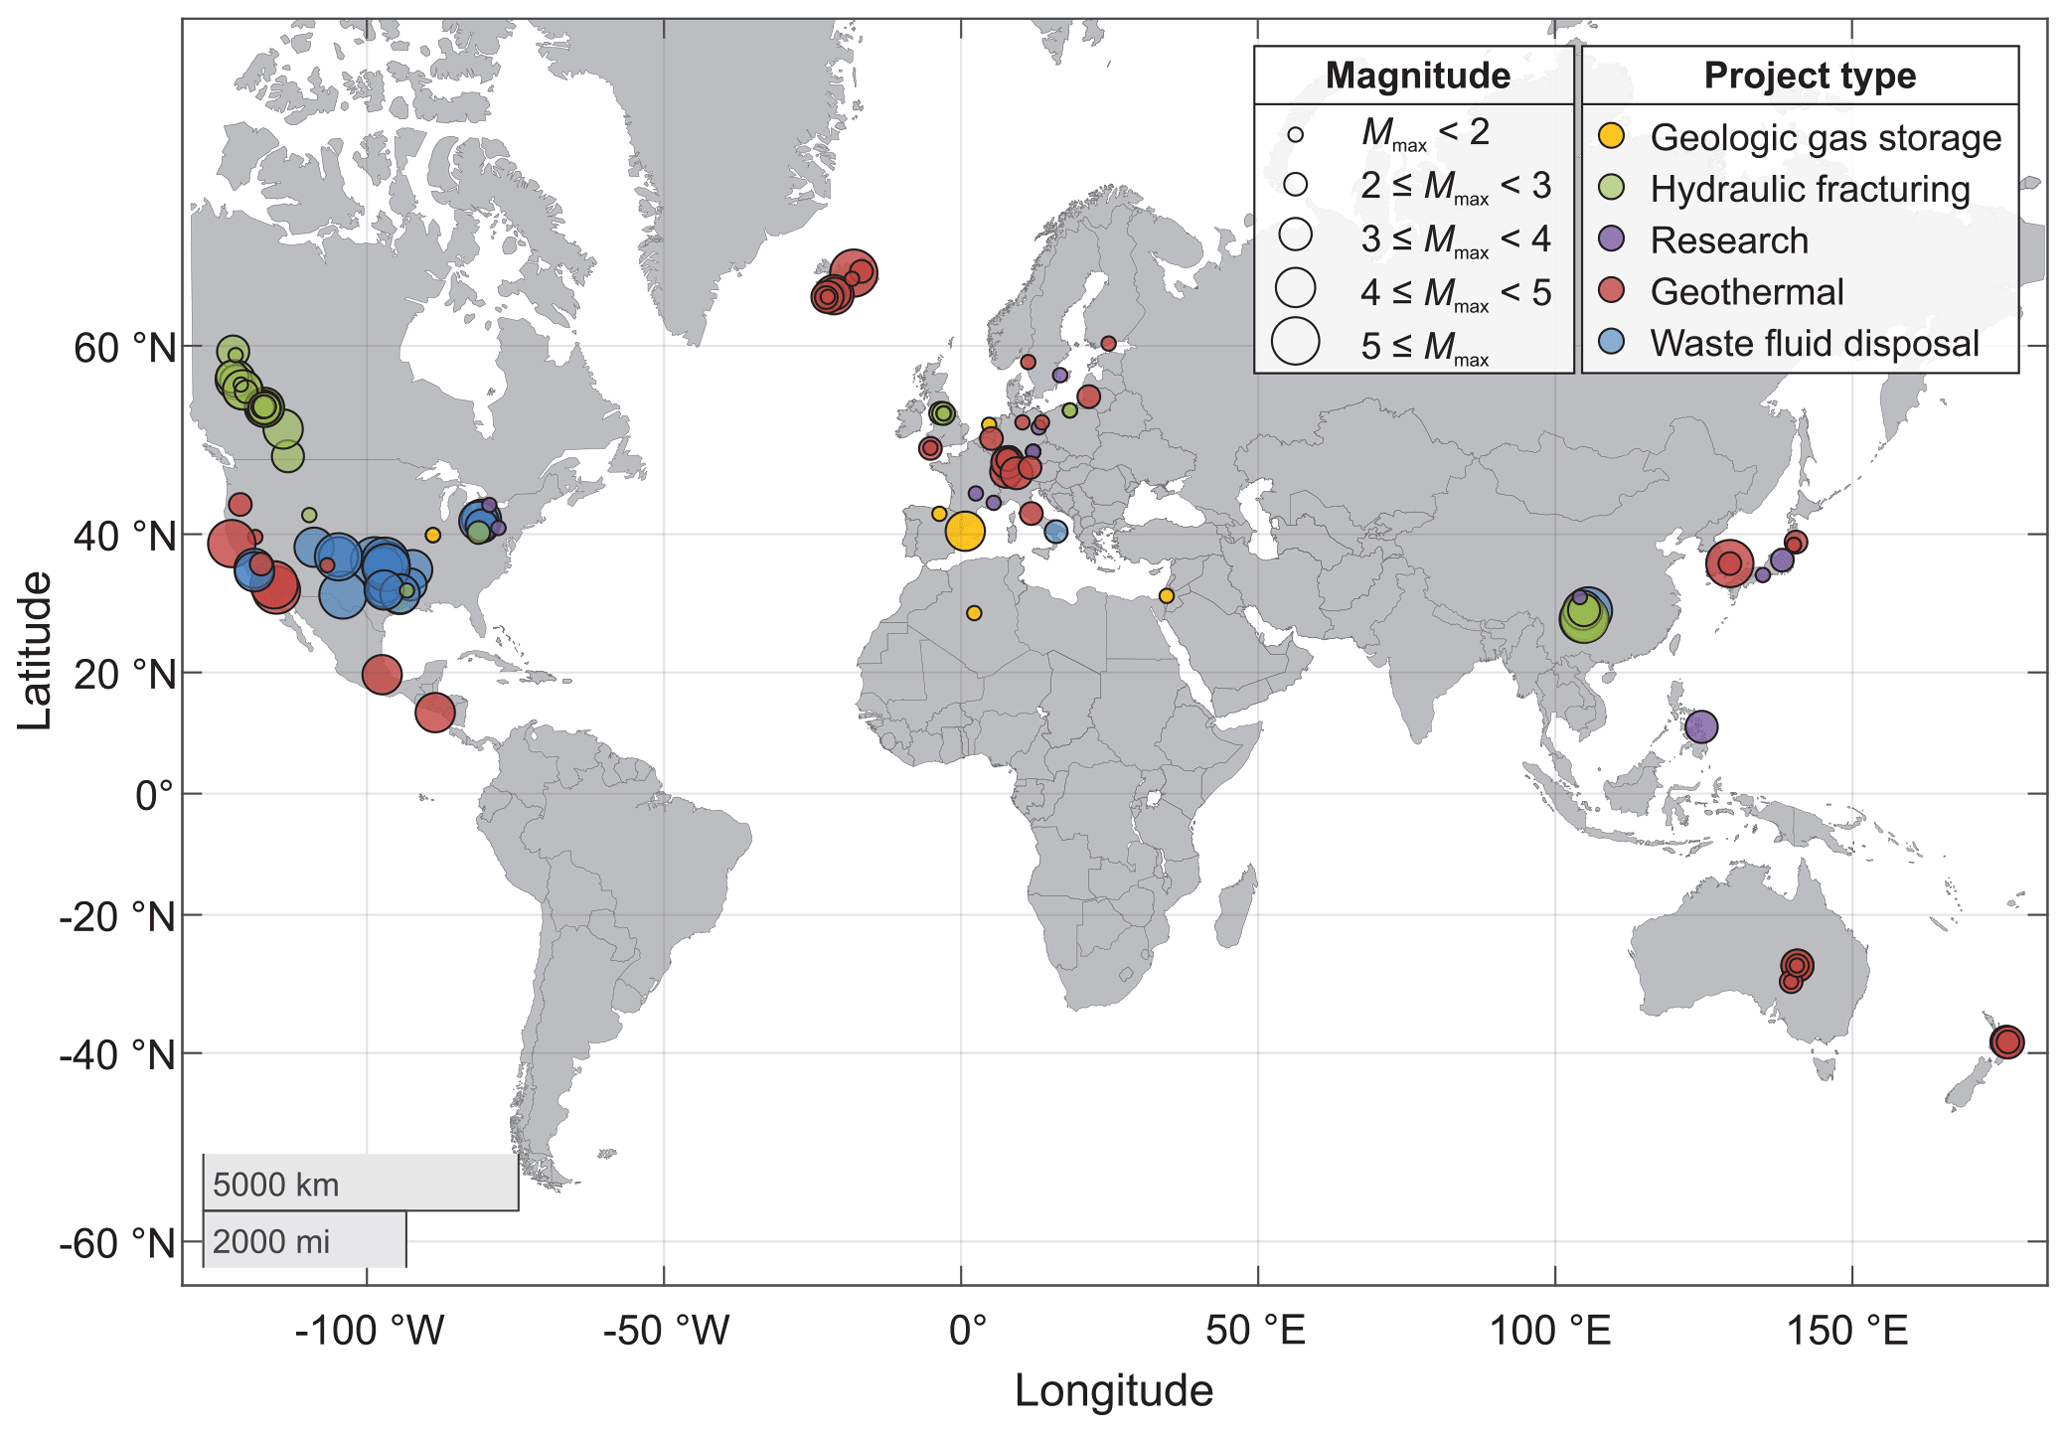
Figure 3The worldwide distribution of injection-induced seismicity cases included in the database.
3.1 Earthquake distribution
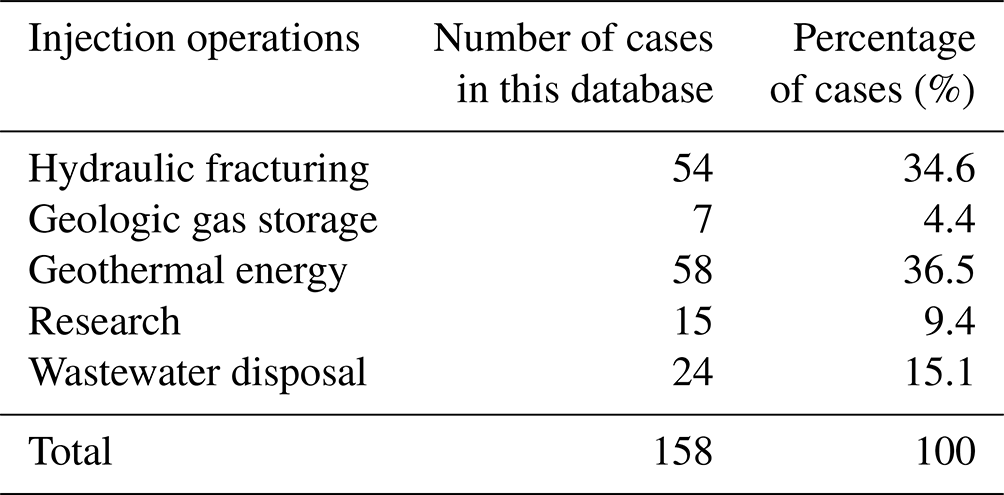
We have collected, so far, data for 158 cases of injection-induced seismicity from 7 geologic gas storage projects (two natural gas and five carbon storage sites), 15 research projects, 54 tight and shale gas hydraulic fracturing projects, 58 deep geothermal programs, and 24 wastewater disposal activities (summary in Table 1 and distribution map in Fig. 3). The numbers show that geothermal operations contribute the most to our induced seismicity database (36.5 %), closely followed by hydraulic fracturing operations (34.6 %), wastewater disposal (15.1 %), research projects (9.4 %) and underground gas storage (4.4 %).
Table 1The number of collected induced earthquakes for each type of underground injection activity and their proportion in the database.
The database gathers data from 5 continents and 25 countries. However, neither the number nor the type of induced earthquakes is uniformly distributed around the globe. While the number of data entries is limited to one in African countries, the United States and Canada host 43 and 32 seismogenic injection operations, respectively. Furthermore, more than 58 % of geothermal cases belong to European countries, 56 % of hydraulic fracturing projects belong to Canada and 91 % of wastewater disposal activities belong to the US. Nevertheless, the observed distribution patterns do not necessarily come up with a conclusive argument in favor of how seismogenic the conducted project types are in different countries; they could rather be attributed to the non-uniform distribution of geo-energy resources and development policies among different countries. The scatter in the recorded induced earthquakes is especially consistent with the overriding interest and growing investment of European countries in renewable energies, among them geothermal resources (Haas et al., 2011), and the prevalence of oil and gas resources in the US and Canada. Other key factors that could drive the observed trends are seismicity monitoring and reporting regulations that can vary among different project types and countries (Grigoli et al., 2017).
Interestingly, frequent hydraulic fracturing of shale gas reservoirs in the US has experienced little to no publicized induced earthquakes (Verdon and Bommer, 2021), consistent with only 11 relevant cases reported in our database. We observe a similar lack of reported induced earthquakes for recent developments of shale gas plays in South America, although natural earthquakes are prevalent in this region (Caruso, 2017). The paucity of fracturing-induced seismicity in these regions can be attributed to (1) detection limits, resulting mainly from inadequate installed monitoring networks; (2) underreporting when the seismicity is not deemed to pose safety risks and hazards to the local population and industrial operations, which is usually the case for regions of low population density (Wilson et al., 2017); (3) differences in operation and monitoring protocols and rules; and (4) systematic dissimilarities arising on regional and basin-wide bases from variations in the state of stress and the characteristics of the stratigraphical setting. Skoumal et al. (2018a) argued that nearly aseismic stimulations of the Bakken and Marcellus shale plays in the central and eastern US stem from their distance to the seismogenic crystalline basement or the presence of isolating sediments diminishing hydraulic connections with the basement.
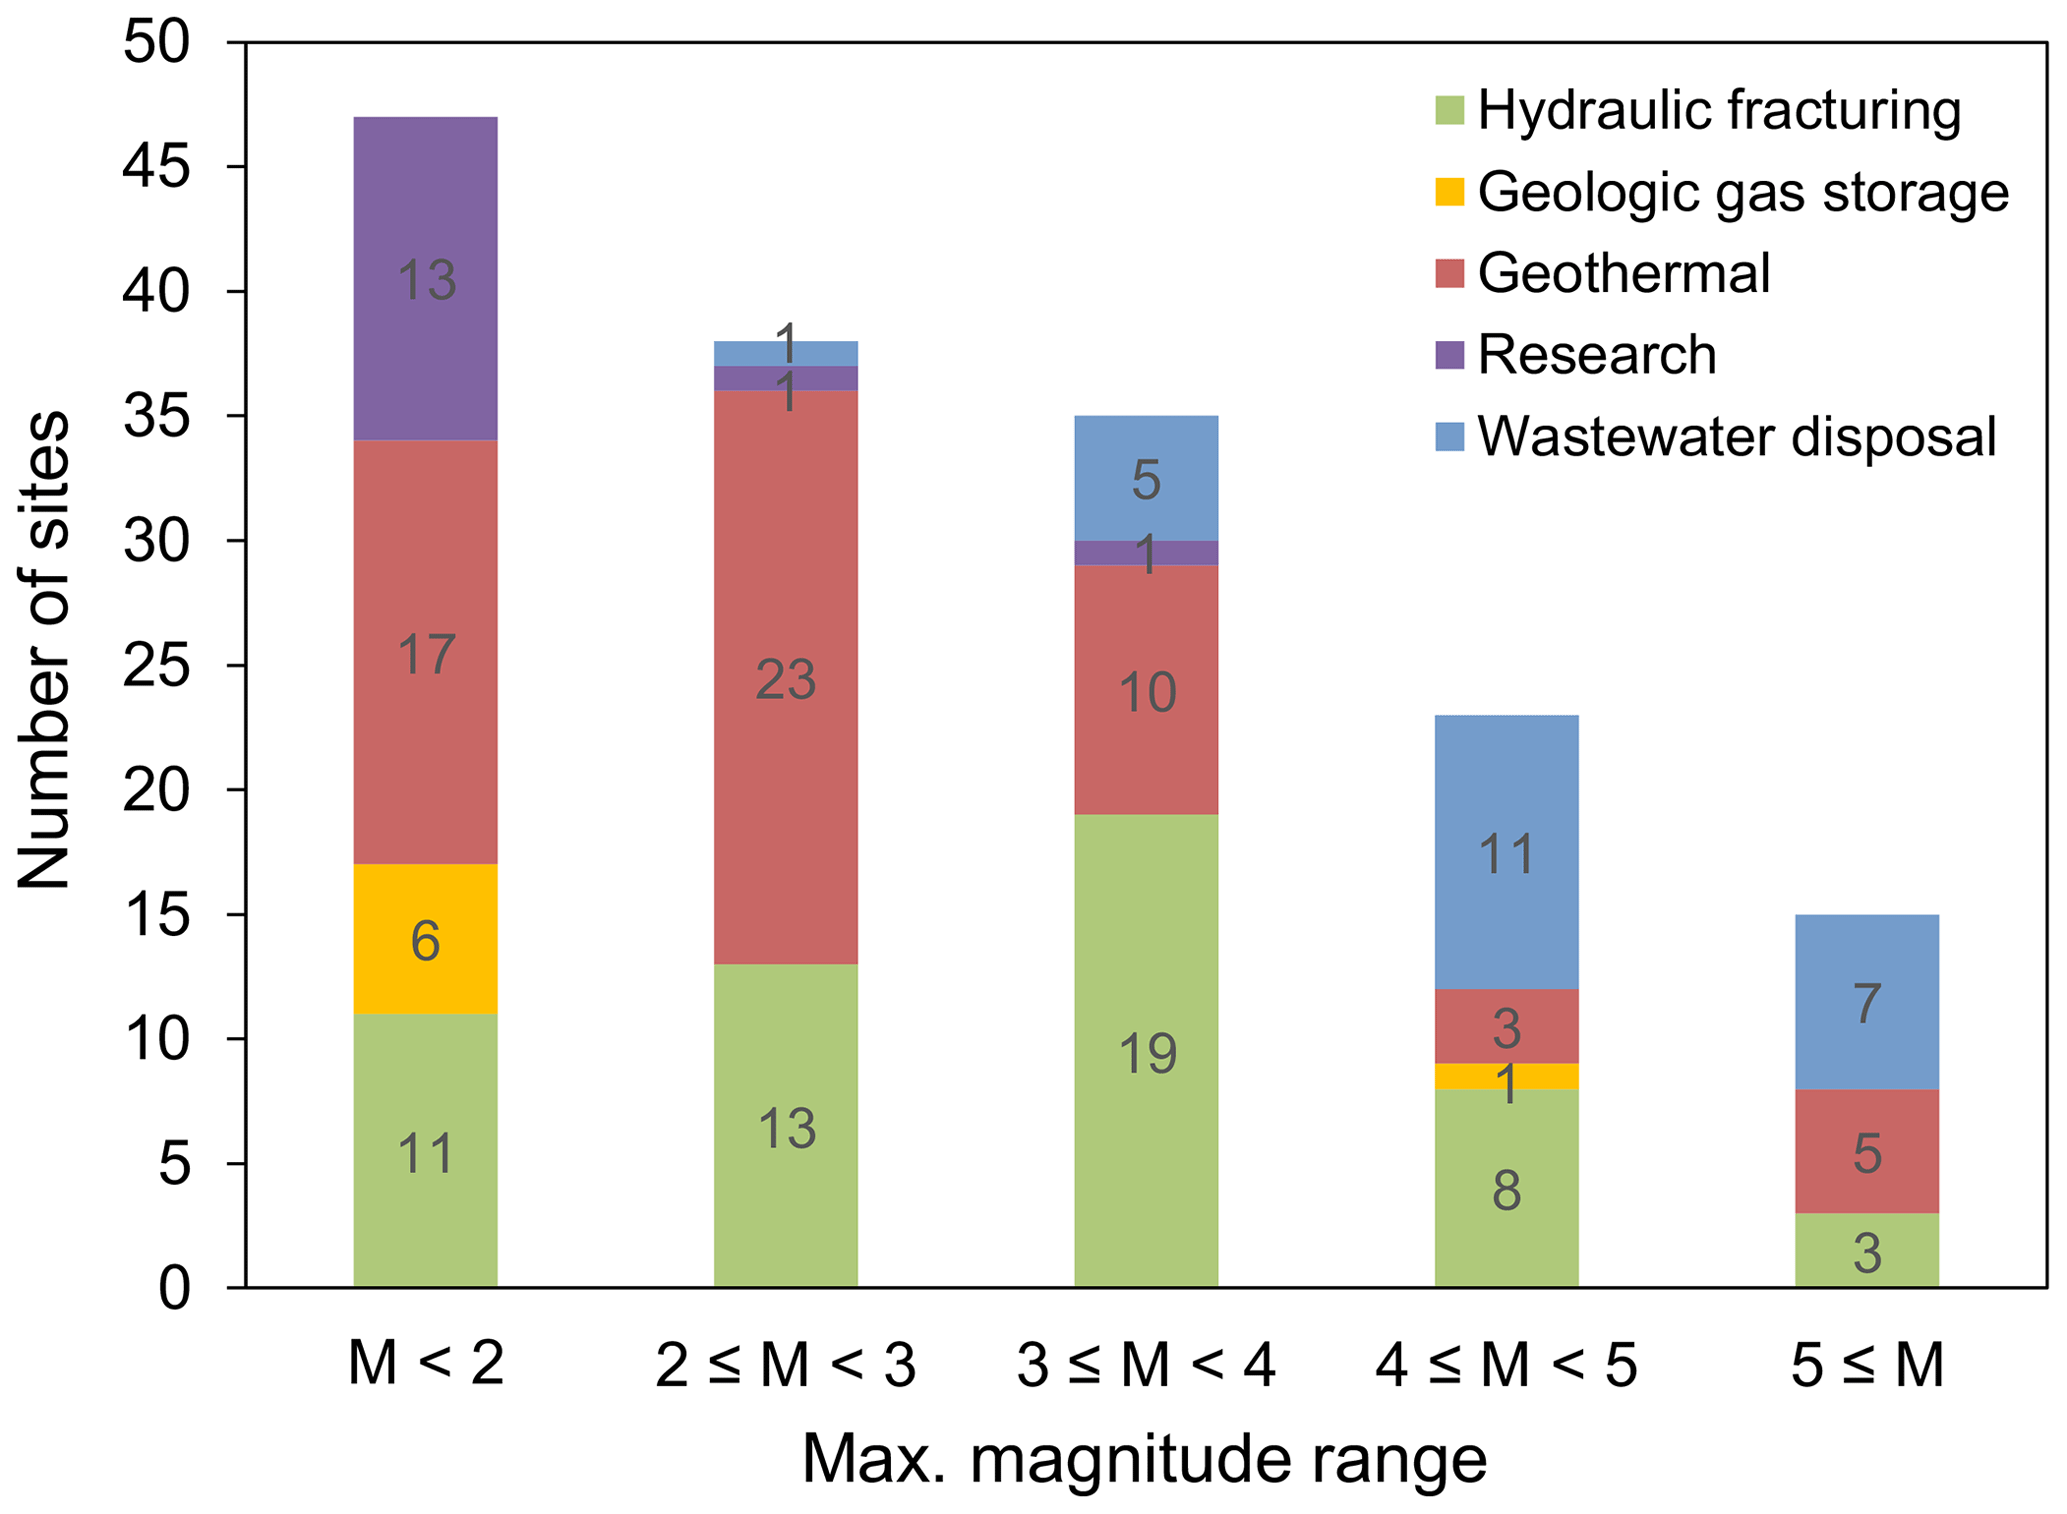
Figure 4Distribution of project types for different ranges of maximum earthquake magnitudes. Note that the data in this figure reflect the cases of reported induced seismicity. There are many other underground energy-related projects that are not included here. These cases would fall within the category of induced microseismicity that is not felt on the surface, i.e., M<2.
3.2 Earthquake magnitudes
The listed maximum earthquake magnitudes span a wide range from MW −7, detected in the laboratory during centimeter-scale fracture slip experiments (Goodfellow et al., 2015), to ML 6.6 at the Laugaland geothermal site, which is interestingly attributed to cold-water reinjection at depths shallower than 1000 m (Flóvenz et al., 2015). An equally sized large earthquake occurred in connection with heat extraction at the Cerro Prieto geothermal field in Mexico (Glowacka and Nava, 1996). The database contains 36 M>4 (∼23 %) events showing a meaningful high contribution by wastewater disposal projects. A total of 73 events (∼46 %) are considered, with maximum magnitudes in the range between M 2 and M 4, which are dominantly linked with hydraulic fracturing of shale gas resources and geothermal field exploitation. The remaining cases, constituting a sizable portion of the recorded earthquakes (counting up to 30 % and corresponding to 47 cases), have M<2 (Fig. 4). The M 2 is widely adopted as a threshold below which the earthquakes may not be felt at the surface (Evans et al., 2012; Buijze et al., 2019). The vast majority of seismicity records of research projects and all CCS-induced seismicity cases belong to this magnitude range. It is very likely that many other fluid injection projects would fall into this category with Mmax<2, but they have not received attention because the induced seismicity was not perceived by the local population, and thus, they are not included here or in other datasets.
3.3 Geological setting
The included projects target 105 sedimentary rocks, comprising carbonates, sandstones and shales, and 53 crystalline basement rocks. The crystalline basement is referred to here as all stratigraphic units underneath the sediments and is mainly composed of igneous (e.g., granite, basalt and diorite) and metamorphic rocks (gneiss and schist). Crystalline rocks serve as the main host to EGS projects. Only 13 earthquakes in the database, whose magnitudes are generally below M 3, were induced in sedimentary geothermal reservoirs. In addition, some of these events are associated with injection or circulation in sediments lying directly over or proximal to the crystalline basement, where the existing faults are critically stressed and more seismogenic. Very prominent examples are (1) the ML 2.4 Unterhaching (Megies and Wassermann, 2014) and (2) the ML 3.5 Sankt Gallen (Diehl et al., 2017) in the Molasse Basin of Germany and Switzerland, respectively, and (3) the ML 2.4 Insheim and (4) the ML 2.7 Landau in the Upper Rhine Graben, Germany (Küperkoch et al., 2018). For these cases, a large share of seismicity has demonstrably occurred in the crystalline basement. These observations are in agreement with multiple large-magnitude earthquakes that were nucleated on basement faults in Oklahoma and Texas, USA, as a result of wastewater disposal in shallower aquifers (Verdon, 2014). Importantly, large-volume water injections into the Arbuckle Group in close proximity to the basement are tightly linked with the MW 5.8 Pawnee, MW 5.7 Prague, MW 5.1 Fairview and MW 5.0 Cushing earthquakes. A variety of mechanisms, e.g., direct hydraulic connection, poroelastic stress perturbations and static stress transfer following fault slip, have been proposed to govern the earthquake initiation in or rupture towards the crystalline basement, either jointly or alone (Johann et al., 2016; Vilarrasa et al., 2021; Zhai et al., 2021; Ge and Saar, 2022; Luu et al., 2022). Nevertheless, ample lines of evidence from hydraulic fracturing of shales show that sedimentary rocks are prone to seismicity: the database contains cases that locate the majority of seismicity and the maximum-magnitude event within the target sedimentary formation (e.g., the March 2019 ML 4.18 earthquake in Red Deer, Canada; Wang et al., 2020), in the overlying sediments (e.g., the January 2016 MW 4.1 earthquake in Fox Creek, Canada; Eyre et al., 2019) or in the underlying sediments (e.g., the December 2018 ML 5.7 and January 2019 ML 5.3 earthquakes in the Sichuan Basin, China; Lei et al., 2019), although along faults that may have their root in the basement.
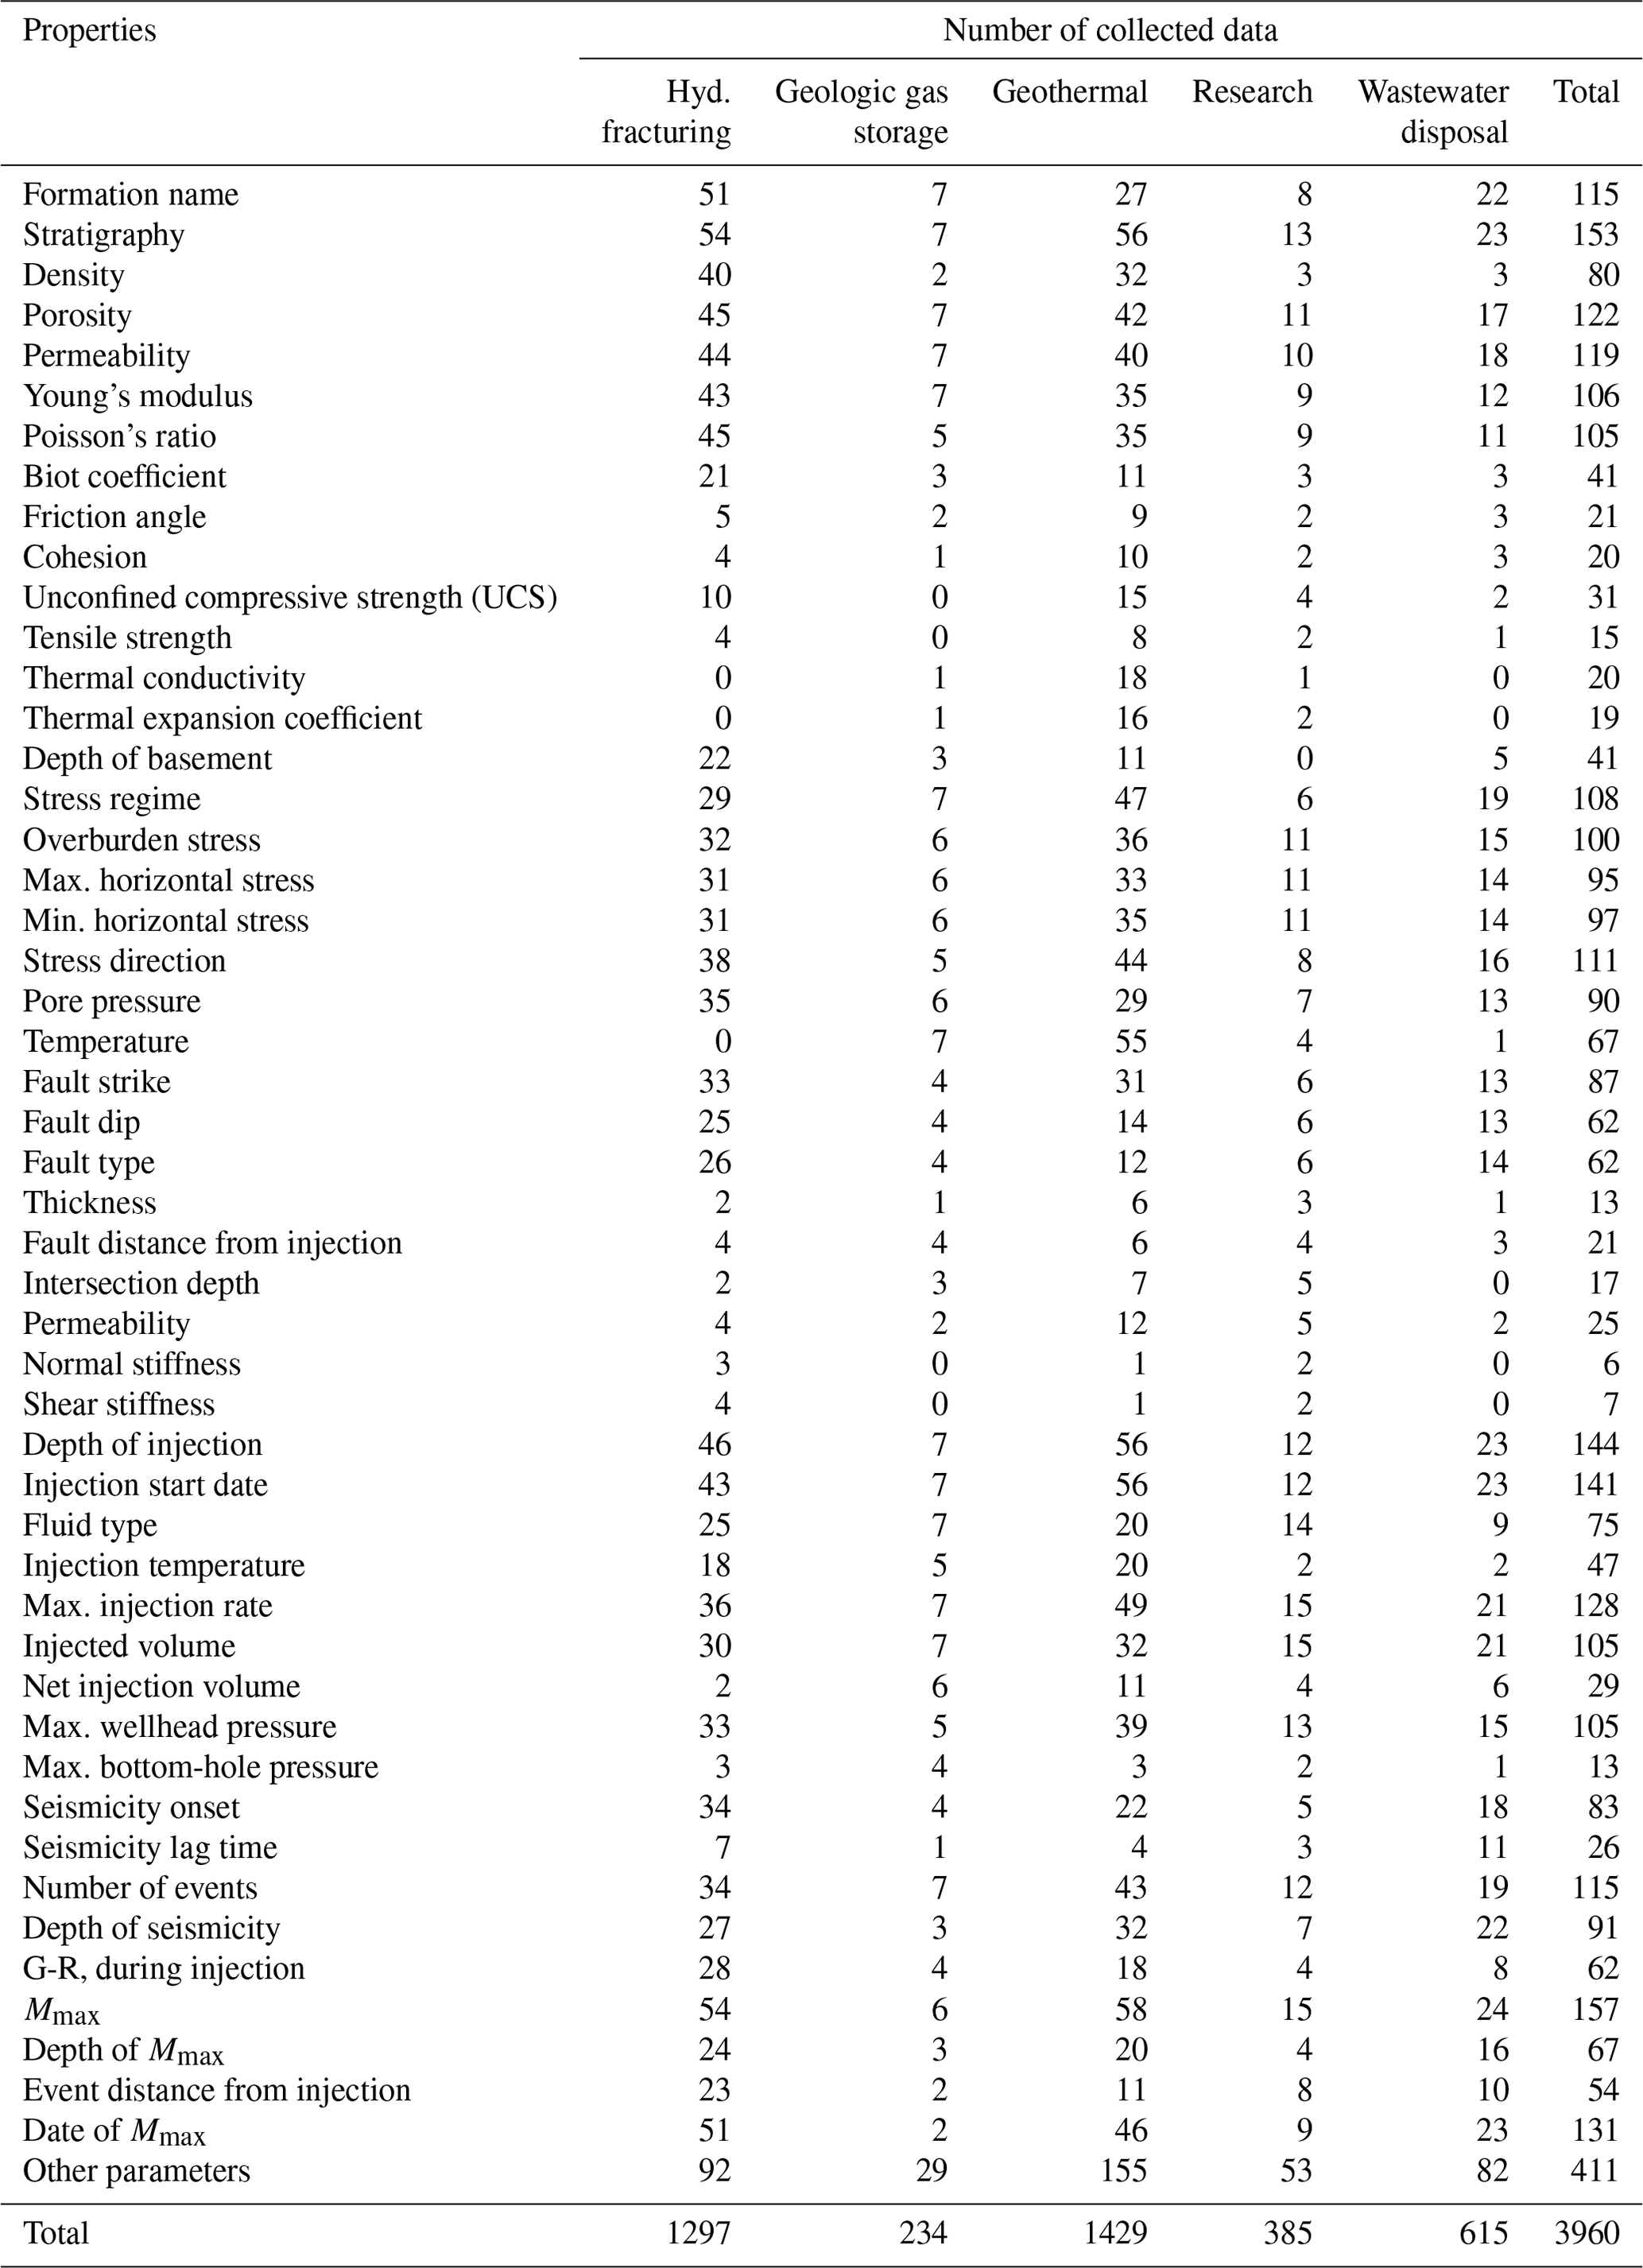
Table 2Number of collected data for different properties, presented in divisions defined by the project types.
3.4 Database statistics
Excluding data ranges by considering a representative average value for all parameters, as well as complementary remarks and references, the database so far comprises nearly 4000 data entries (Table 2). In total, 36 % of data entries (n=1429) belong to geothermal exploitation, 33 % (n=1297) to hydraulic fracturing of shales, 15 % (n=615) to wastewater disposal, 10 % (n=385) to research projects and the remaining 6 % (n=234) to geologic gas storage. We observe almost identical distributions of database events and entered values across different operations (compare Tables 1 and 2), implying that the considered induced-earthquake categories are equally represented in the database. However, the total number of measurements may vary substantially from one variable to the other. For instance, formation names and stratigraphy information are known for the vast majority of the reported cases, enabling geological correlations between projects to help fill in data gaps for rock properties. Other extensively assessed parameters are hydraulic properties and stiffness of the host rock, in situ stress conditions, and fluid injection parameters (including total injected fluid volume and maximum injection rate and wellhead pressure). All these variables are key parameters for constraining the spatiotemporal evolution of seismicity. The database compiles this information for more than two-thirds of induced earthquakes. In contrast, fault properties have rarely been evaluated. Particularly, more than 85 % of the datasets have no entries for fault thickness, permeability and stiffness.
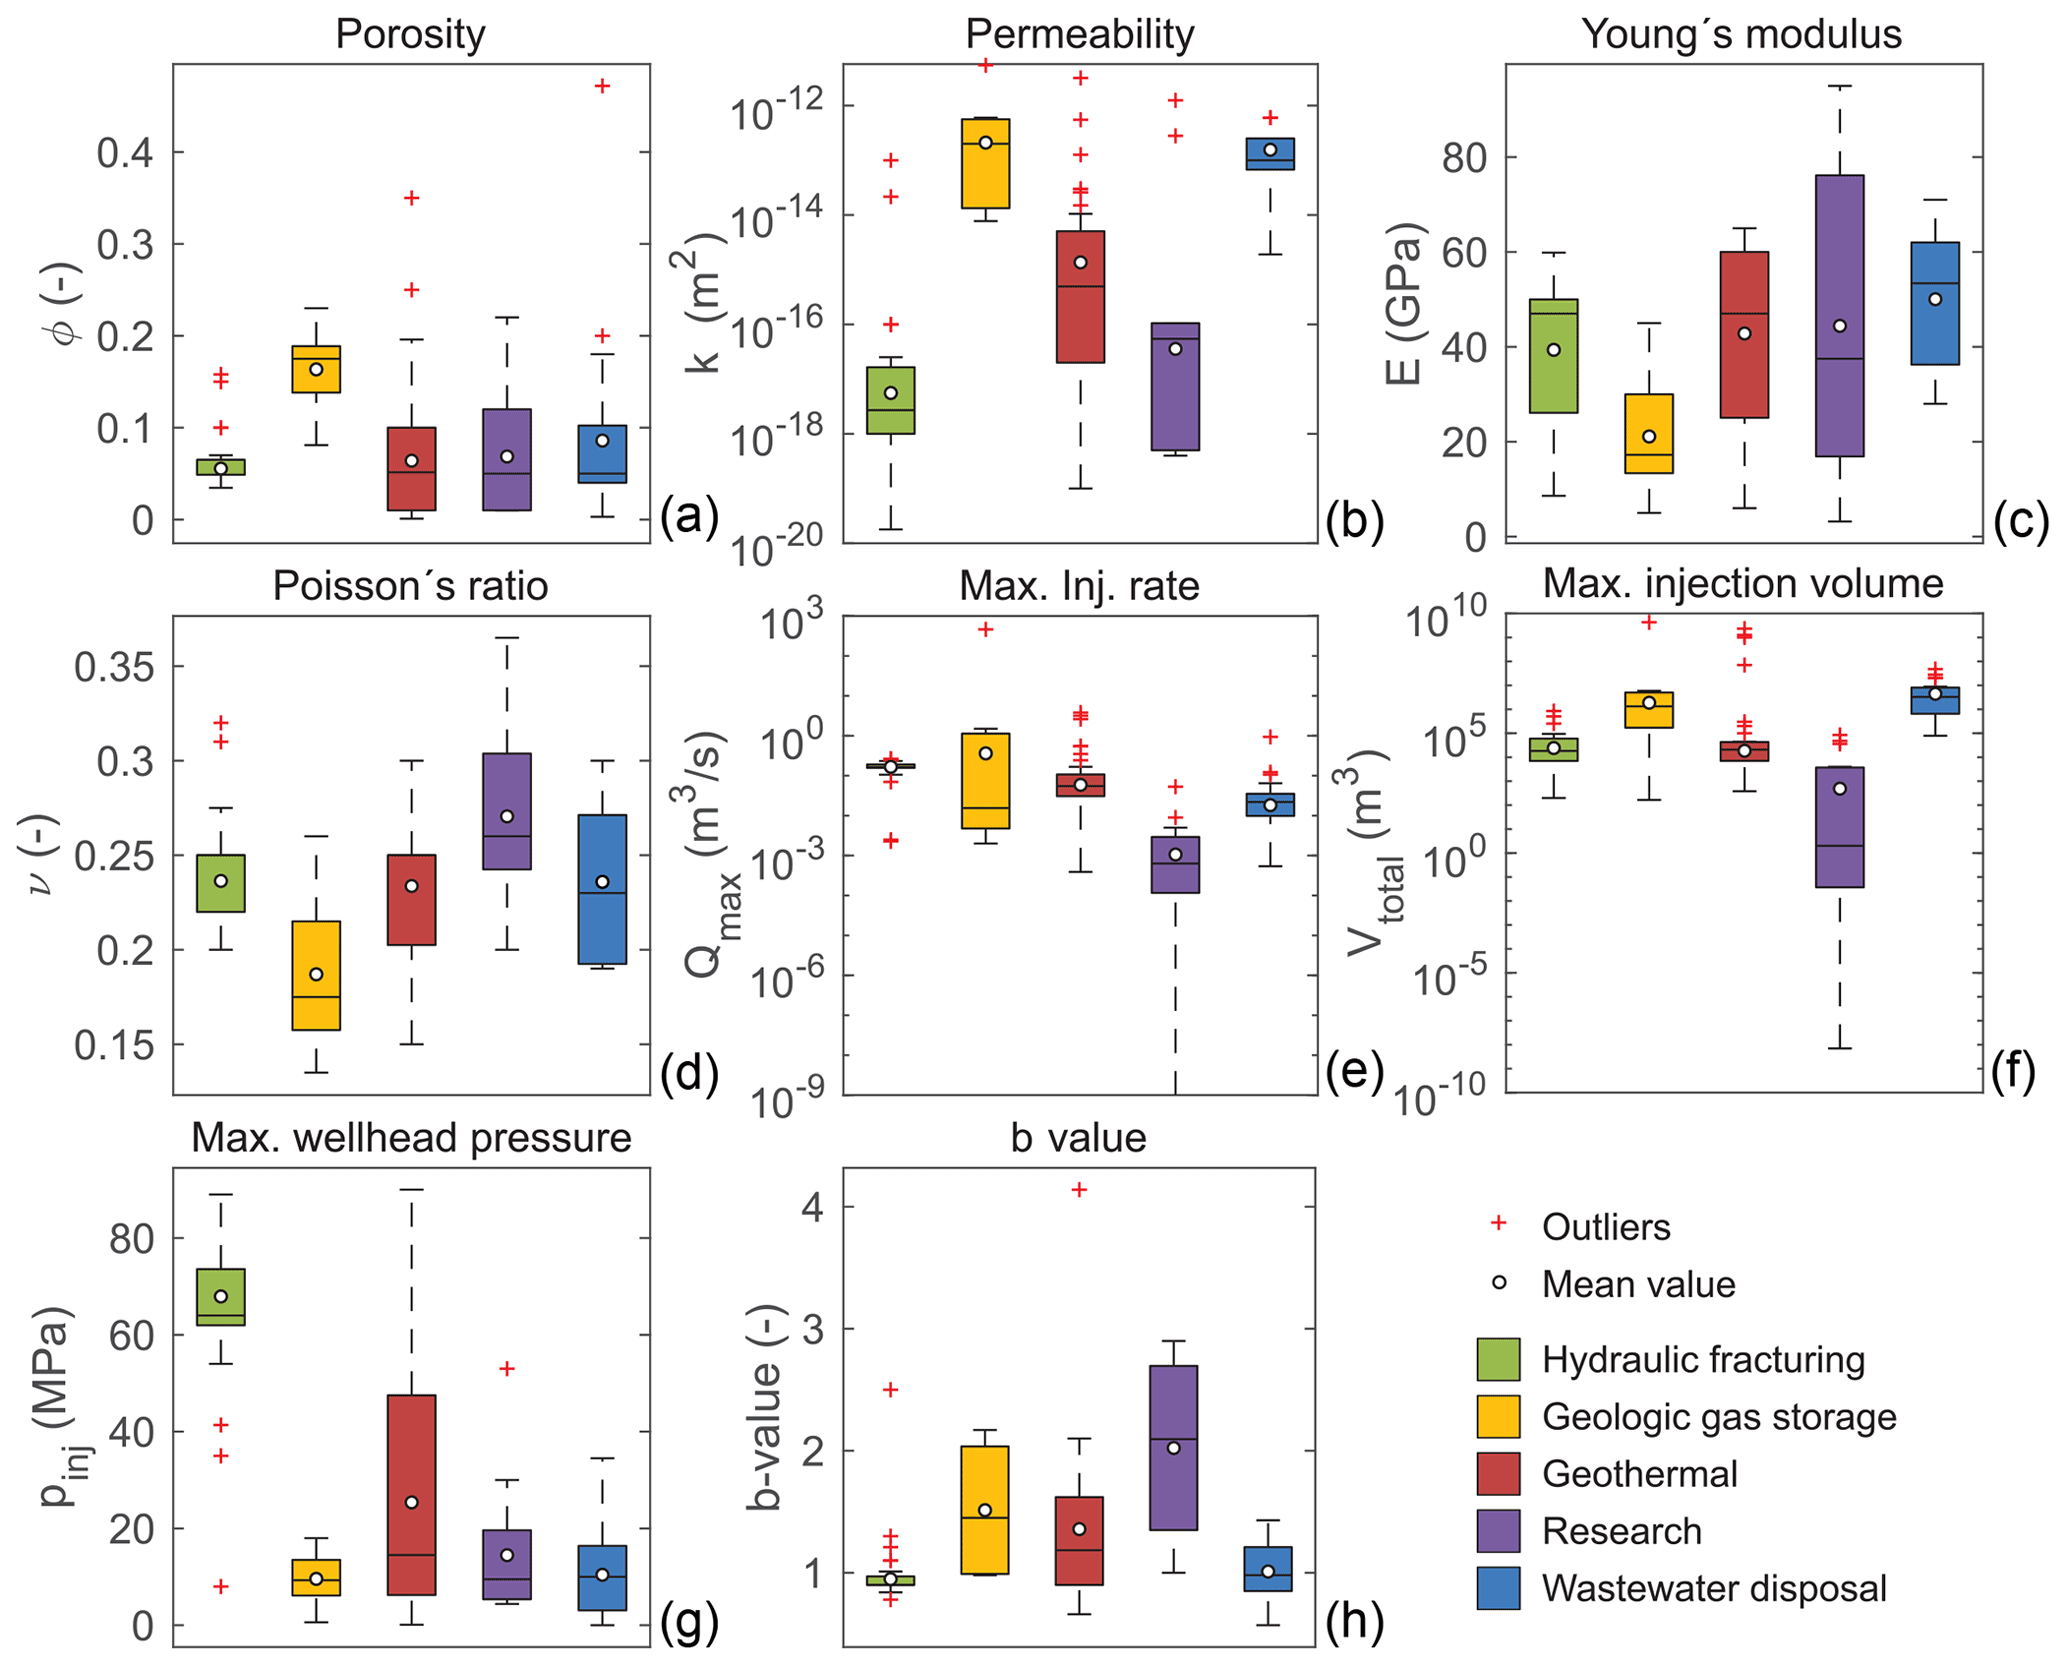
Figure 5Boxplot for a number of database parameters. From bottom to top, the box indicates the first quartile, median and third quartile of the data. Whiskers represent the minimum and maximum values, excluding outliers. The mean values are also calculated after excluding outliers. Outliers reside outside the range defined by 1.5 times the interquartile range added to the third quartile and subtracted from the first quartile.
Key insights into the hydromechanical, operational and seismic characteristics of geo-energy projects can be gleaned through a careful statistical inspection of the database (Fig. 5). Sediments targeted for geologic gas storage and wastewater disposal unsurprisingly feature high porosity and intrinsic permeability, which enable injection of significantly large fluid volumes at high rates and concurrently low wellhead pressures. The Bergermeer underground gas storage project in the Netherlands has by far the highest injection rate (463 m3 s−1) and total injected fluid volume (4.3 billion m3) among all collected cases. On the contrary, the majority of geothermal reservoirs, located in the deep crystalline basement, are characterized by low porosity and permeability. In these cases, earthquakes have frequently occurred during EGS stimulation, during which the fluid injection pressures and rates are exceedingly high. However, peak injection volumes (>1 billion m3) and rates (>1 m3 s−1) in geothermal projects are associated with long-term circulation operations in extensively fractured and highly permeable sedimentary, volcanic or metamorphic reservoirs (namely the Cerro Prieto, Mexico, and The Geysers and Salton Sea, USA, geothermal fields). It is worth stressing that these circulation systems may even involve no component of net injection volume depending on the simultaneous injection–extraction rates. Correspondingly, geothermal projects reflect a broad range of wellhead pressure, from 90 MPa achieved during hydraulic stimulation of a 6.1 km deep reservoir in Helsinki, Finland, at one extreme down to near-atmospheric injections under gravity drive into an under-pressured reservoir of The Geysers, USA, at the other.
Hydraulic fracturing of shale gas reservoirs shares a number of commonalities with EGS stimulations. These common features mainly include the extremely low permeability of the reservoir rock and substantially high injection pressures and rates required to induce and propagate hydraulic fractures. Furthermore, the target gas-bearing shales often possess comparable stiffness (high Young's modulus and low Poisson's ratio) compared to those of geothermal reservoirs and sediments subjected to wastewater injection. Corroborating this observation, high stiffness is inferred as a proxy for brittle shales, which are, by design and intent, appropriate for creating and maintaining hydraulically conductive fractures (Vafaie and Rahimzadeh Kivi, 2020). Certainly, these brittle shales are different from clay-rich shales that stand within the lower bounds of Young's modulus and the upper bounds of Poisson's ratio variations for research projects and, likewise, the entire database. This low extreme of stiffness is documented for Opalinus clay at the Mont Terri URL, Switzerland, and an upper Toarcian shale at the Tournemire URL, France, which are widely considered to be representative caprocks for geologic CO2 storage and hosts to nuclear waste disposal. The rock stiffness range is bounded by a high Young's modulus value of 95 GPa, measured for a gneiss rock in a deep-injection research project in eastern Bavaria, Germany. Research projects broaden the registered ranges of injection rate and volume by orders of magnitude down to m3 s−1 and m3, respectively. These lower bounds of injection parameters were drawn by fracture slip experiments on centimeter-scale specimens.
Eventually, variations of the b value (indicative of the relative magnitude distribution of earthquakes) could give a picture of the discriminative features of earthquake sequences induced by different activities. We highlight the following two groups of seismicity: seismicity with an average b value of around 1, characterizing the recorded events during hydraulic fracturing and wastewater disposal operations, and higher b-value seismicity (b value >1.4), observed during geothermal and geologic gas storage and research projects. Conceptually, the former group is associated with the shear activation of major fault–fracture zones and a higher probability of large-magnitude earthquakes, whereas the latter points to the dominance of spread and structureless microseismic clouds (Zang et al., 2014). Nevertheless, evaluations of the b value are commonly accompanied by large errors that challenge the treatment of the variations in the b value as statistically meaningful. Hence, conclusive statements on the differences between induced seismicity patterns solely based on this parameter should be avoided (Shi and Bolt, 1982).
The .xls and .csv files of the database are available at the institutional repository Digital.CSIC: https://doi.org/10.20350/digitalCSIC/14813 (Kivi et al., 2022a). An associated list of references that were used to develop the database and a dictionary, including the definitions for all database parameters, are also provided in .docx format at the same address.
In this study, we have developed a comprehensive multi-physical database of injection-induced seismicity from various geo-energy applications: geothermal energy exploitation, shale gas development, underground gas storage, wastewater disposal and research projects. The database comprises a great variety of relevant properties, including general project information, rock properties, in situ site characteristics, fault attributes, operational parameters and recorded seismicity data. In the current release, nearly 4000 data entries, covering 71 distinct variables for 158 projects (or project phases), are compiled from a critical review of more than 500 publications. Neither the frequency of earthquakes nor the type of triggering activities are uniformly distributed worldwide. The parameters span wide ranges of values, varying substantially among different project types. We organize the database in simple flat-file formats to facilitate its utilization by researchers while keeping data directly readable by computer codes for implementation in model developments. All gathered data comply with a unique set of standards and quality requirements, ensuring high comparability, accuracy and coherency of the data.
The high quality and large quantity and diversity of the collected data, integrating knowledge from geology, petrophysics, geomechanics and seismology, opens up opportunities for
-
improved assessment of the temporal and spatial occurrence of induced earthquakes
-
recognizing the causative mechanisms of induced seismicity through direct data inspection or indirect inferences from physics-based numerical modeling, depending heavily on the provided data for parameterization and calibration
-
highlighting possible relations between seismicity and operational parameters
-
developing and validating empirical and/or theoretical scaling relations between the maximum earthquake magnitude and injection parameters.
These collectively favor meaningful progress in forecasting induced seismicity hazards and proposing practical injection strategies to mitigate them. In addition, the collated data extend the opportunity to constrain both analytical and numerical modeling efforts addressing other challenges in the safe and economical utilization of geological resources. Consequently, the database in a broader context contributes to unlocking the subsurface potential to accelerate achieving carbon neutrality.
Compiling data for a wide variety of parameters, plenty of induced seismicity events, such as those associated with shale gas fracturing in Oklahoma (Skoumal et al., 2018b), fail to fulfill the minimum requirements for being reported. Besides, the distribution of the existing data records is inhomogeneous, with frequently missing information for fault properties. This database is envisioned not to be static but rather to be updated and extended by exploring newly published or potentially not-yet-considered data resources. We envisage potential improvements in data accessibility through the establishment of collaborations with operators of geo-energy projects and authors of the existing compilations of relevant data fields, for example, physical and mechanical rock properties (P3 database, Bär et al., 2020), fault properties (Scibek, 2020), in situ stress data (world stress map, Heidbach et al., 2018), and induced seismicity (Wilson et al., 2017). We also plan to create a publicly editable database interface on the GEoREST project website (http://www.georest.eu, last access: 23 July 2023), to which we welcome contributions from all users to complement the database. Future improvements to the database include incorporating full induced seismicity catalogs and detailed injection data (including time series of wellhead pressure and flow rate). This information allows for the unveiling of correlations in time and space between subsurface fluid injection and seismic activities. Following these extensions, the database would be organized in a mixed flat-file and rational structure to facilitate the desired data extraction and to link with other rational databases, e.g., the P3 database (Bär et al., 2020), using query-based languages (Gard et al., 2019).
VV, FP and IRK conceptualized the work. IRK, AB, HW, LW, SHH and VV collected the induced seismicity cases. IRK, FP and VV analyzed the data. IRK unified the database and wrote the paper with contributions from all the authors.
The contact author has declared that none of the authors has any competing interests.
Publisher's note: Copernicus Publications remains neutral with regard to jurisdictional claims in published maps and institutional affiliations.
The authors acknowledge funding from the European Research Council (ERC) under the European Union's Horizon 2020 Research and Innovation Program through the starting grant GEoREST (http://www.georest.eu, last access: 23 July 2023) under grant agreement no. 801809. Iman R. Kivi and Victor Vilarrasa also acknowledge support by the PCI2021-122077-2B project (http://www.easygeocarbon.com, last access: 23 July 2023), funded by MCIN/AEI/10.13039/501100011033 and the European Union NextGenerationEU/PRTR. Haiqing Wu acknowledges the financial support received from the Secretariat for Universities and Research of the Ministry of Business and Knowledge of the Government of Catalonia (AGAUR) and the European Social Fund (FI-2019). Haiqing Wu also acknowledges the Becas Santander Research Scholarship from the Technical University of Catalonia (UPC) and Santander. Francesco Parisio and Victor Vilarrasa acknowledge funding from the European Union's Horizon 2020 Research and Innovation Programme through the Marie Skłodowska-Curie Action ARMISTICE under grant agreement no. 882733. IDAEA-CSIC is a Centre of Excellence Servero Ochoa (Spanish Ministry of Science and Innovation, grant no. CEX2018-000794-S, funded by MCIN/AEI/10.13039/501100011033). IMEDEA is an accredited “Maria de Maeztu Excellence Unit” (grant no. CEX2021-001198, funded by MCIN/AEI/10.13039/501100011033).
This research has been supported by the H2020 European Research Council (grant nos. 801809 and 882733) and the Agencia Estatal de Investigación (grant nos. PCI2021-122077-2B, CEX2021-001198 and CEX2018-000794-S).
This paper was edited by Kirsten Elger and reviewed by G. R. Foulger and Kwang-Il Kim.
Alghannam, M. and Juanes, R.: Understanding rate effects in injection-induced earthquakes, Nat. Commun., 11, 3053, https://doi.org/10.1038/s41467-020-16860-y, 2020.
Atkinson, G. M., Eaton, D. W., and Igonin, N.: Developments in understanding seismicity triggered by hydraulic fracturing, Nat. Rev. Earth Environ., 1, 264–277, https://doi.org/10.1038/s43017-020-0049-7, 2020.
Bachmann, C. E., Wiemer, S., Woessner, J., and Hainzl, S.: Statistical analysis of the induced Basel 2006 earthquake sequence: introducing a probability-based monitoring approach for Enhanced Geothermal Systems, Geophys. J. Int., 186, 793–807, https://doi.org/10.1111/j.1365-246X.2011.05068.x, 2011.
Bao, X. and Eaton, D. W.: Fault activation by hydraulic fracturing in Western Canada, Science, 354, 1406–1409, https://doi.org/10.1126/science.aag2583, 2016.
Bär, K., Reinsch, T., and Bott, J.: The PetroPhysical Property Database (P3) – a global compilation of lab-measured rock properties, Earth Syst. Sci. Data, 12, 2485–2515, https://doi.org/10.5194/essd-12-2485-2020, 2020.
Berre, I., Doster, F., and Keilegavlen, E.: Flow in fractured porous media: A review of conceptual models and discretization approaches, Transp. Porous Media, 130, 215–236, https://doi.org/10.1007/s11242-018-1171-6, 2019.
Brace, W. F.: Permeability of crystalline and argillaceous rocks, Int. J. Rock Mech. Min. Sci. Geomech. Abstract, 17, 241–251, https://doi.org/10.1016/0148-9062(80)90807-4, 1980.
Buijze, L., van Bijsterveldt, L., Cremer, H., Paap, B., Veldkamp, H., Wassing, B. B. T., van Wees, J. D., van Yperen, G. C. N., and ter Heege, J. H.: Review of induced seismicity in geothermal systems worldwide and implications for geothermal systems in the Netherlands, Neth. J. Geosci., 98, e13, https://doi.org/10.1017/njg.2019.6, 2019.
Caine, J. S., Evans, J. P., and Forster, C. B.: Fault zone architecture and permeability structure, Geology, 24, 1025–1028, https://doi.org/10.1130/0091-7613(1996)024<1025:FZAAPS>2.3.CO;2, 1996.
Cappa, F. and Rutqvist, J.: Modeling of coupled deformation and permeability evolution during fault reactivation induced by deep underground injection of CO2, Int. J. Greenhouse Gas Control, 5, 336–346, https://doi.org/10.1016/j.ijggc.2010.08.005, 2011.
Caruso, G. D.: The legacy of natural disasters: The intergenerational impact of 100 years of disasters in Latin America, J. Dev. Econ., 127, 209–233, https://doi.org/10.1016/j.jdeveco.2017.03.007, 2017.
Cesca, S., Grigoli, F., Heimann, S., González, A., Buforn, E., Maghsoudi, S., Blancg, E., and Dahm, T.: The 2013 September–October seismic sequence offshore Spain: a case of seismicity triggered by gas injection?, Geophys. J. Int., 198, 941–953, https://doi.org/10.1093/gji/ggu172, 2014.
Cheng, A. H.-D.: Poroelasticity, edited by: Hassanizadeh, S. M., Springer, Berlin, https://doi.org/10.1007/978-3-319-25202-5, 2016.
De Simone, S., Carrera, J., and Vilarrasa, V.: Superposition approach to understand triggering mechanisms of post-injection induced seismicity, Geothermics, 70, 85–97, https://doi.org/10.1016/j.geothermics.2017.05.011, 2017.
Diehl, T., Kraft, T., Kissling, E., and Wiemer, S.: The induced earthquake sequence related to the St. Gallen deep geothermal project (Switzerland): Fault reactivation and fluid interactions imaged by microseismicity, J. Geophys. Res.-Sol. Ea., 122, 7272–7290, https://doi.org/10.1002/2017JB014473, 2017.
Ellsworth, W. F.: Injection-induced earthquakes, Science, 341, 1225942, https://doi.org/10.1126/science.1225942, 2013.
Ellsworth, W. L., Giardini, D., Townend, J., Ge, S., and Shimamoto, T.: Triggering of the Pohang, Korea, earthquake (Mw 5.5) by enhanced geothermal system stimulation, Seismol. Res. Lett., 90, 1844–1858, https://doi.org/10.1785/0220190102, 2019.
Evans, K. F., Zappone, A., Kraft, T., Deichmann, N., and Moia, F.: A survey of the induced seismic responses to fluid injection in geothermal and CO2 reservoirs in Europe, Geothermics, 41, 30–54, https://doi.org/10.1016/j.geothermics.2011.08.002, 2012.
Eyre, T. S., Eaton, D. W., Garagash, D. I., Zecevic, M., Venieri, M., Weir, R., and Lawton, D. C.: The role of aseismic slip in hydraulic fracturing–induced seismicity, Sci. Adv., 5, eaav7172, https://doi.org/10.1126/sciadv.aav7172, 2019.
Fan, Z., Eichhubl, P., and Newell, P.: Basement fault reactivation by fluid injection into sedimentary reservoirs: Poroelastic effects, J. Geophys. Res.-Sol. Ea., 124, 7354–7369, https://doi.org/10.1029/2018JB017062, 2019.
Flóvenz, Ó. G., Ágústsson, K., Guðnason, E. A., and KristjÁnsdóttir, S.: Reinjection and induced seismicity in geothermal fields in Iceland, Proceedings World Geothermal Congress 2015, 19–25 April 2015, Melbourne, Australia, 2015.
Foulger, G. R., Wilson, M. P., Gluyas, J. G., Julian, B. R., and Davies, R. J.: Global review of human-induced earthquakes, Earth Sci. Rev., 178, 438–514, https://doi.org/10.1016/j.earscirev.2017.07.008, 2018.
Galis, M., Ampuero, J. P., Mai, P. M., and Cappa, F., Induced seismicity provides insight into why earthquake ruptures stop, Sci. Adv., 3, eaap7528, https://doi.org/10.1126/sciadv.aap7528, 2017.
Gard, M., Hasterok, D., and Halpin, J. A.: Global whole-rock geochemical database compilation, Earth Syst. Sci. Data, 11, 1553–1566, https://doi.org/10.5194/essd-11-1553-2019, 2019.
Gaucher, E., Schoenball, M., Heidbach, O., Zang, A., Fokker, P. A., van Wees, J. D., and Kohl, T.: Induced seismicity in geothermal reservoirs: A review of forecasting approaches, Renew. Sustain. Energ. Rev., 52, 1473–1490, https://doi.org/10.1016/j.rser.2015.08.026, 2015.
Ge, S. and Saar, M. O.: Review: Induced seismicity during geoenergy development – A hydromechanical perspective, J. Geophys. Res.-Sol. Ea., 127, e2021JB023141, https://doi.org/10.1029/2021JB023141, 2022.
Ghassemi, A. and Zhou, X.: A three-dimensional thermo-poroelastic model for fracture response to injection/extraction in enhanced geothermal systems, Geothermics, 40, 39–49, https://doi.org/10.1016/j.geothermics.2010.12.001, 2011.
Glowacka, E. and Nava, F. A.: Major earthquakes in Mexicali Valley, Mexico, and fluid extraction at Cerro Prieto Geothermal Field, B. Seismol. Soc. Am., 86, 93–105, https://doi.org/10.1785/BSSA08601A0093, 1996.
Goebel, T. H. W., Weingarten, M., Chen, X., Haffener, J., and Brodsky, E. E.: The 2016 Mw5.1 Fairview, Oklahoma earthquakes: Evidence for long-range poroelastic triggering at >40 km from fluid disposal wells, Earth Planet. Sc. Lett., 472, 50–61, https://doi.org/10.1016/j.epsl.2017.05.011, 2017.
Goertz-Allmann, B. P. and Wiemer, S.: Geomechanical modeling of induced seismicity source parameters and implications for seismic hazard assessment, Geophysics, 78, KS25–KS39, https://doi.org/10.1190/geo2012-0102.1, 2013.
Goodfellow, S. D., Nasseri, M. H. B., Maxwell, S. C., and Young, R. P.: Hydraulic fracture energy budget: Insights from the laboratory, Geophys. Res. Lett., 42, 3179–3187, https://doi.org/10.1002/2015GL063093, 2015.
Grigoli, F., Cesca, S., Priolo, E., Rinaldi, A. P., Clinton, J. F., Stabile, T. A., Dost, B., Garcia Fernandez, M., Wiemer, S., and Dahm, T.: Current challenges in monitoring, discrimination, and management of induced seismicity related to underground industrial activities: A European perspective, Rev. Geophys., 55, 310–340, https://doi.org/10.1002/2016RG000542, 2017.
Gutenberg, B. and Richter, C. F.: Earthquake magnitude intensity, energy, and acceleration, B. Seism. Soc. Am., 32, 163–191, https://doi.org/10.1785/BSSA0320030163, 1942.
Haas, R., Panzer, C., Resch, G., Ragwitz, M., Reece, G., and Held, A.: A historical review of promotion strategies for electricity from renewable energy sources in EU countries, Renew. Sustain. Energ. Rev., 15, 1003–1034, https://doi.org/10.1016/j.rser.2010.11.015, 2011.
Haimson, B. C. and Cornet, F. H.: ISRM suggested methods for rock stress estimation – Part 3: hydraulic fracturing (HF) and/or hydraulic testing of pre-existing fractures(HTPF), Int. J. Rock Mech. Min. Sci., 40, 1011–1020, https://doi.org/10.1016/j.ijrmms.2003.08.002, 2003.
Häring, M. O., Schanz, U., Ladner, F., and Dyer, B. C.: Characterisation of the Basel 1 enhanced geothermal system, Geothermics, 37, 469–495, https://doi.org/10.1016/j.geothermics.2008.06.002, 2008.
Heidbach, O., Rajabi, M., Cui, X., Fuchs, K., Müller, B., Reinecker, J., Reiter, K., Tingay, M., Wenzel, F., Xie, F., Ziegler, M. O., Zoback, M.-L., and Zoback, M.: The world stress map database release 2016: Crustal stress pattern across scales, Tectonophysics, 744, 484–449, https://doi.org/10.1016/j.tecto.2018.07.007, 2018.
Heinemann, N., Alcalde, J., Miocic, J. M., Hangx, S. J., Kallmeyer, J., Ostertag-Henning, C., Hassanpouryouzband, A., Thaysen, E. M., Strobel, G. J., Schmidt-Hattenberger, C., and Edlmann, K.: Enabling large-scale hydrogen storage in porous media–the scientific challenges, Energy Environ. Sci., 14, 853-864, https://doi.org/10.1039/d0ee03536j, 2021.
Hincks, T., Aspinall, W., Cooke, R., and Gernon, T.: Oklahoma's induced seismicity strongly linked to wastewater injection depth, Science, 359, 1251–1255, https://doi.org/10.1126/science.aap7911, 2018.
Horton, S.: Disposal of hydrofracking waste fluid by injection into subsurface aquifers triggers earthquake swarm in central Arkansas with potential for damaging earthquake, Seismol. Res. Lett., 83, 250–260, https://doi.org/10.1785/gssrl.83.2.250, 2012.
IPCC: Special report on Global warming of 1.5 ∘C, Incheon, 93–175, South Korea, IPCC, 2018.
Jaeger, J. C., Cook, N. G., and Zimmerman, R.: Fundamentals of rock mechanics, John Wiley & Sons, ISBN 978-1-444-30891-4, 2009.
Johann, L., Dinske, C., and Shapiro, S. A.: Scaling of seismicity induced by nonlinear fluid-rock interaction after an injection stop, J. Geophys. Res., 121, 8154–8174, https://doi.org/10.1002/2016JB012949, 2016.
Kanamori, H. and Brodsky, E.: The physics of earthquakes, Rep. Prog. Phys., 67, 1429–1496, https://doi.org/10.1088/0034-4885/67/8/R03, 2004.
Keranen, K. M. and Weingarten, M.: Induced seismicity. Annu. Rev. Earth Planet. Sc., 46, 149–174, https://doi.org/10.1146/annurev-earth-082517-010054, 2018.
Kivi, I. R., Boyet, A., Wu, H., Walter, L., Hanson-Hedgecock, S., Parisio, F., and Vilarrasa, V.: Global physics-based database of injection-induced seismicity, CSIC [data set], https://doi.org/10.20350/digitalCSIC/14813, 2022a.
Kivi, I. R., Pujades, E., Rutqvist, J., and Vilarrasa, V.: Cooling-induced reactivation of distant faults during long-term geothermal energy production in hot sedimentary aquifers, Sci. Rep., 12, 2065, https://doi.org/10.1038/s41598-022-06067-0, 2022b.
Küperkoch, L., Olbert, K., and Meier, T.: Long-term monitoring of induced seismicity at the Insheim geothermal site, Germany, B. Seismol. Soc. Am., 108, 3668–3683, https://doi.org/10.1785/0120170365, 2018.
Langenbruch, C. and Zoback, M. D.: How will induced seismicity in Oklahoma respond to decreased saltwater injection rates?, Sci. Adv., 2, e1601542, https://doi.org/10.1126/sciadv.1601542, 2016.
Lee, K.-K., Ellsworth, W. L., Giardini, D., Townend, J., Ge, S., Shimamoto, T., Yeo, I.-W., Kang, T.-S., Rhie, J., and Sheen, D.-H.: Managing injection-induced seismic risks, Science, 364, 730–732, https://doi.org/10.1126/science.aax1878, 2019.
Lei, X., Wang, Z., and Su, J.: The December 2018 ML 5.7 and January 2019 ML 5.3 earthquakes in South Sichuan Basin induced by shale gas hydraulic fracturing, Seismol. Res. Lett., 90, 1099–1110, https://doi.org/10.1785/0220190029, 2019.
Li, Z., Elsworth, D., and Wang, C.: Constraining maximum event magnitude during injection-triggered seismicity, Nat. Commun., 12, 1528, https://doi.org/10.1038/s41467-020-20700-4, 2021.
Luu, K., Schoenball, M., Oldenburg, C. O., and Rutqvist, J.: Coupled hydromechanical modeling of induced seismicity from CO2 injection in the Illinois Basin, J. Geophys. Res.-Sol. Ea., 127, e2021JB023496, https://doi.org/10.1029/2021JB023496, 2022.
McGarr, A.: Maximum magnitude earthquakes induced by fluid injection, J. Geophys. Res., 119, 1008–1019, https://doi.org/10.1002/2013jb010597, 2014.
McGarr, A., Simpson, D., and Seeber, L.: Case histories of induced and triggered seismicity, in: International handbook of earthquake and engineering seismology, edited by: Lee, W., Kanamori, H., Jennings, P., and Kisslinger, C., Elsevier, Chap. 40, v81A, 647–661, 2002.
Megies, T. and Wassermann, J.: Microseismicity observed at a non-pressure-stimulated geothermal power plant, Geothermics, 52, 36–49, https://doi.org/10.1016/j.geothermics.2014.01.002, 2014.
National Research Council: Induced seismicity potential in energy technologies, Natl. Acad. Press, Washington, D.C., 225 pp., 2013.
Neuzil, C. E.: Permeability of clays and shales, Annu. Rev. Earth Planet. Sci., 47, 247–273, https://doi.org/10.1146/annurev-earth-053018-060437, 2019.
Ogata, Y.: Statistical-models for earthquake occurrences and residual analysis for point-processes, J. Am. Stat. Assoc., 83, 9–27, https://doi.org/10.1080/01621459.1988.10478560 (1988).
Pan, L. and Oldenburg, C. M.: T2Well – an integrated wellbore-reservoir simulator, Comput. Geosci., 65, 46–55, https://doi.org/10.1016/j.cageo.2013.06.005, 2014.
Parisio, F., Vilarrasa, V., Wang, W., Kolditz, O., and Nagel, T.: The risks of long-term re-injection in supercritical geothermal systems, Nat. Commun., 10, 4391, https://doi.org/10.1038/s41467-019-12146-0, 2019.
Rice, J. R. and Cleary, M. P.: Some basic stress diffusion solutions for fluid-saturated elastic porous media with compressible constituents, Rev. Geophys., 14, 227–241, https://doi.org/10.1029/RG014i002p00227, 1976.
Rinaldi, A. P., Jeanne, P., Rutqvist, J., Cappa, F., and Guglielmi, Y.: Effects of fault-zone architecture on earthquake magnitude and gas leakage related to CO2 injection in a multi-layered sedimentary system, Greenhouse Gases Sci. Technol., 4, 99–120, https://doi.org/10.1002/ghg.1403, 2014.
Ringrose, P. S., Furre, A.-K., Gilfillan, S. M. V., Krevor, S., Landrø, M., Leslie, R., Meckel, T., Nazarian, B., and Zahid, A.: Storage of carbon dioxide in saline aquifers: physicochemical processes, key constraints, and scale-up potential, Annu. Rev. Chem. Biomol. Eng., 12, 471–494, https://doi.org/10.1146/annurev-chembioeng-093020-091447, 2021.
Roth, M. P., Verdecchia, A., Harrington, R. M., and Liu, Y.: High-resolution imaging of hydraulic-fracturing-induced earthquake clusters in the Dawson-Septimus area, Northeast British Columbia, Canada, Seismol. Res. Lett., 91, 2744–2756, https://doi.org/10.1785/0220200086, 2020.
Ruiz-Barajas, S., Sharma, N., Convertito, V., Zollo, A., and Benito, B.: Temporal evolution of a seismic sequence induced by a gas injection in the Eastern coast of Spain, Sci. Rep., 7, 1–15, https://doi.org/10.1038/s41598-017-02773-2, 2017.
Scibek, J.: Multidisciplinary database of permeability of fault zones and surrounding protolith rocks at world-wide sites, Sci. Data, 7, 95, https://doi.org/10.1038/s41597-020-0435-5, 2020.
Segall, P. and Lu, S.: Injection-induced seismicity: Poroelastic and earthquake nucleation effects, J. Geophys. Res., 120, 5082–5103, https://doi.org/10.1002/2015JB012060, 2015.
Shapiro, S. A., Huenges, E., and Borm, G.: Estimating the crust permeability from fluid-injection-induced seismic emission at the KTB site, Geophys. J. Int., 131, F15–F18, https://doi.org/10.1111/j.1365-246X.1997.tb01215.x, 1997.
Shapiro, S. A., Dinske, C., Langenbruch, C., and Wenzel, F., Seismogenic index and magnitude probability of earthquakes induced during reservoir fluid stimulations, The Leading Edge, 29, 304–309, https://doi.org/10.1190/1.3353727, 2010.
Shapiro, S. A., Krüger, O. S., Dinske, C., and Langenbruch, C.: Magnitudes of induced earthquakes and geometric scales of fluid-stimulated rock volumes, Geophysics, 76, WC55–WC63, https://doi.org/10.1190/geo2010-0349.1, 2011.
Shapiro, S. A., Kim, K. H., and Ree, J. H.: Magnitude and nucleation time of the 2017 Pohang Earthquake point to its predictable artificial triggering, Nat. Commun., 12, 1–9, https://doi.org/10.1038/s41467-021-26679-w, 2021.
Shen, L. W., Schmitt, D. R., and Haug, K.: Quantitative constraints to the complete state of stress from the combined borehole and focal mechanism inversions: Fox Creek, Alberta, Tectonophysics, 764, 110–123, https://doi.org/10.1016/j.tecto.2019.04.023, 2019.
Shi, Y. and Bolt, B. A.: The standard error of the magnitude-frequency b value, B. Seismol. Soc. Am., 72, 1677–1687, https://doi.org/10.1785/BSSA0720051677, 1982.
Shirzaei, M., Ellsworth, W. L., Tiampo, K. F., González, P. J., and Manga, M.: Surface uplift and time-dependent seismic hazard due to fluid injection in eastern Texas, Science, 353, 1416–1419, https://doi.org/10.1126/science.aag0262, 2016.
Skoumal, R. J., Brudzinski, M. R., and Currie, B. S.: Proximity of Precambrian basement affects the likelihood of induced seismicity in the Appalachian, Illinois, and Williston Basins, central and eastern United States, Geosphere, 14, 1365–1379, https://doi.org/10.1130/GES01542.1, 2018a.
Skoumal, R. J., Ries, R., Brudzinski, M. R., Barbour, A. J., and Currie, B. S.: Earthquakes induced by hydraulic fracturing are pervasive in Oklahoma, J. Geophys. Res.-Sol. Ea., 123, 10918–10935, https://doi.org/10.1029/2018JB016790, 2018b.
Suckale, J.: Induced seismicity in hydrocarbon fields, Adv. Geophys., 51, 55–106, https://doi.org/10.1016/S0065-2687(09)05107-3, 2009.
Talwani, P., Chen, L., and Gahalaut, K.: Seismogenic permeability, ks, J. Geophys. Res., 112, B07309, https://doi.org/10.1029/2006JB004665, 2007.
The Human-Induced Earthquake Database (HiQuake): https://inducedearthquakes.org/, last access: 3 June 2022.
Townend, J. and Zoback, M. D.: How faulting keeps the crust strong, Geology, 28, 399–402, https://doi.org/10.1130/0091-7613(2000)28<399:HFKTCS>2.0.CO;2, 2000.
Utsu, T.: A statistical study on the occurrence of aftershocks, Geophys. Mag., 30, 521–605, 1961.
Vafaie, A. and Rahimzadeh Kivi, I.: An investigation on the effect of thermal maturity and rock composition on the mechanical behavior of carbonaceous shale formations, Mar. Pet. Geol., 116, 104315, https://doi.org/10.1016/j.marpetgeo.2020.104315, 2020.
Valley, B. and Evans, K. F.: Stress magnitudes in the Basel enhanced geothermal system, Int. J. Rock Mech. Min. Sci., 118, 1–20, https://doi.org/10.1016/j.ijrmms.2019.03.008, 2019.
van der Elst, N. J., Page, M. T., Weiser, D. A., Goebel, T. H. W., and Hosseini, S. M.: Induced earthquake magnitudes are as large as (statistically) expected, J. Geophys. Res., 121, 4575–4590, https://doi.org/10.1002/2016JB012818, 2016.
Verberne, B. A., van den Ende, M. P. A., Chen, J., Niemeijer, A. R., and Spiers, C. J.: The physics of fault friction: insights from experiments on simulated gouges at low shearing velocities, Solid Earth, 11, 2075–2095, https://doi.org/10.5194/se-11-2075-2020, 2020.
Verdon, J. P.: Significance for secure CO2 storage of earthquakes induced by fluid injection, Environ. Res. Lett., 9, 064022, https://doi.org/10.1088/1748-9326/9/6/064022, 2014.
Verdon, J. P. and Bommer, J.: Green, yellow, red, or out of the blue? An assessment of traffic light schemes to mitigate the impact of hydraulic fracturing-induced seismicity, J. Seismolog., 24, 301–326, https://doi.org/10.1007/s10950-020-09966-9, 2021.
Vilarrasa, V.: The role of the stress regime on microseismicity induced by overpressure and cooling in geologic carbon storage, Geofluids, 16, 941–953, https://doi.org/10.1111/gfl.12197, 2016.
Vilarrasa, V. and Carrera, J.: Geologic carbon storage is unlikely to trigger large earthquakes and reactivate faults through which CO2 could leak, P. Natl. Acad. Sci. USA, 112, 5938–5943, https://doi.org/10.1073/pnas.1413284112, 2015.
Vilarrasa, V. and Rutqvist, J.: Thermal effects on geologic carbon storage, Earth-Sci. Rev., 165, 245–256, https://doi.org/10.1016/j.earscirev.2016.12.011, 2017.
Vilarrasa, V., Carrera, J., and Olivella, S.: Hydromechanical characterization of CO2 injection sites, Int. J. Greenhouse Gas Control, 19, 665–677, https://doi.org/10.1016/j.ijggc.2012.11.014, 2013.
Vilarrasa, V., Makhnenko, R., and Gheibi, S.: Geomechanical analysis of the influence of CO2 injection location on fault stability, J. Rock Mech. Geotech. Eng., 8, 805–818, https://doi.org/10.1016/j.jrmge.2016.06.006, 2016.
Vilarrasa, V., Carrera, J., Olivella, S., Rutqvist, J., and Laloui, L.: Induced seismicity in geologic carbon storage, Solid Earth, 10, 871–892, https://doi.org/10.5194/se-10-871-2019, 2019.
Vilarrasa, V., De Simone, S., Carrera, J., and Villaseñor, A.: Unraveling the causes of the seismicity induced by underground gas storage at Castor, Spain, Geophys. Res. Lett., 48, e2020GL092038, https://doi.org/10.1029/2020GL092038, 2021.
Wang, J., Li, T., Gu, Y. J., Schultz, R., Yusifbayov, J., and Zhang, M.: Sequential fault reactivation and secondary triggering in the March 2019 Red Deer induced earthquake swarm, Geophys. Res. Lett., 47, e2020GL090219, https://doi.org/10.1029/2020GL090219, 2020.
Weingarten, M. B., Ge, S., Godt, J. W., Bekins, B. A., and Rubinstein, J. L.: High-rate injection is associated with the increase in U.S. mid-continent seismicity, Science, 348, 1336–1340, https://doi.org/10.1126/science.aab1345, 2015.
Wilkinson, M., Dumontier, M., Aalbersberg, I., Appleton, G., Axton,M., Baak, A., Blomber, N., Boiten, J.-W., da silca Santos, L. B., Bourne, P. E., Bouwman, J., Brookes, A. J., Clark, T., Crosas, M., Dillo, I., Dumon, O., Edmunds, S., Evelo, C. T., Finkers, R., Gonzalez-Beltran, A., Gray, A. J. G., Groth, P., Goble, C., Grethe, J. S., Heringa, J., Hoen, P. A. C., Hooft, R., Kuhn, T., Kok, R., Kok, J., Lusher, S. J., Martone, M. E., Mons, A., Packer, A. L., Persson, B., Rocca-Serra, P., Roos, M., van Schaik, R., Sansone, S.-A., Schultes, E., Sengstag, T., Slater, T., Strawn, G., Swertz, M. A., Thompson, M., van der Lei, J., van Mulligen, E., Velterop, J., Waagmeester, A., Wittenburg, P., Wolstencroft, K., Zhao, J., and Mons, B.: The FAIR guiding principles for scientific data management and stewardship, Sci Data, 3, 160018, https://doi.org/10.1038/sdata.2016.18, 2016.
Williams-Stroud, S., Bauer, R., Leetaru, H., Oye, V., Stanek, F., Greenberg, S., and Langet, N.: Analysis of microseismicity and reactivated fault Size to assess the potential for felt events by CO2 injection in the Illinois Basin, B. Seismol. Soc. Am., 110, 2188–2204, https://doi.org/10.1785/0120200112, 2020.
Wilson, M. P., Foulger, G. R., Gluyas, J. G., Davies, R. J., and Julian, B. R.: HiQuake: The human-induced earthquake database, Seismol. Res. Lett., 88, 1560–1565, https://doi.org/10.1785/0220170112, 2017.
Wu, H., Vilarrasa, V., De Simone, S., Saaltink, M., and Parisio, F.: Analytical solution to assess the induced seismicity potential of faults in pressurized and depleted reservoirs, J. Geophys. Res.-Sol. Ea., 126, e2020JB020436, https://doi.org/10.1029/2020JB020436, 2021.
Yeck, W., Hayes, G., McNamara, D., Rubinstein, J., Barnhart, W., Earle, P., and Benz, H.: Oklahoma experiences largest earthquake during ongoing regional wastewater injection hazard mitigation efforts, Geophys. Res. Lett., 44, 711–717, https://doi.org/10.1002/2016GL071685, 2017.
Zang, A., Oye, V., Jousset, P., Deichmann, N., Gritto, R., McGarr, A., Majer, E., and Bruhn, D.: Analysis of induced seismicity in geothermal reservoirs – An overview, Geothermics, 52, 6–21, https://doi.org/10.1016/j.geothermics.2014.06.005, 2014.
Zareidarmiyan, A., Salarirad, H., Vilarrasa, V., Kim, K.-I., Lee, J., and Min, K.-B.: Comparison of numerical codes for coupled thermo-hydro-mechanical simulations of fractured media, J. Rock Mech. Geotech. Eng., 12, 850–865, https://doi.org/10.1016/j.jrmge.2019.12.016, 2020.
Zhai, G., Shirzaei, M., and Manga, M.: Widespread deep seismicity in the Delaware Basin, Texas, is mainly driven by shallow wastewater injection, P. Natl. Acad. Sci. USA, 118, e2102338118, https://doi.org/10.1073/pnas.2102338118, 2021.
Zoback, M. D. and Gorelick, S. M.: Earthquake triggering and large-scale geologic storage of carbon dioxide, P. Natl. Acad. Sci. USA, 109, 10164–10168, https://doi.org/10.1073/pnas.1202473109, 2012.
Zoback, M. D., Barton, C. A., Brudy, M., Castillo, D. A., Finkbeiner, T., Grollimund, B. R., Moos, D. B., Peska, P., Ward, C. D., and Wiprut, D. J.: Determination of stress orientation and magnitude in deep wells, Int. J. Rock Mech. Min. Sci., 40, 1049–1076, https://doi.org/10.1016/j.ijrmms.2003.07.001, 2003.