the Creative Commons Attribution 4.0 License.
the Creative Commons Attribution 4.0 License.
 | 20 Jul 2023
Spectral Library of European Pegmatites, Pegmatite Minerals and Pegmatite Host-Rocks – the GREENPEG project database
Joana Cardoso-Fernandes
Douglas Santos
Cátia Rodrigues de Almeida
Alexandre Lima
Ana C. Teodoro
The New Exploration Tools for European Pegmatite Green-Tech Resources (GREENPEG) spectral database contains the spectral signature, obtained through reflectance spectroscopy studies, of European pegmatites and minerals as well as their host rocks. Samples include pegmatites of the Nb–Y–F (NYF) and Li–Cs–Ta (LCT) chemical types and host rocks from pegmatite locations in Austria, Ireland, Norway, Portugal, and Spain. The database contains the reflectance spectra (raw and continuum-removed spectra), sample photographs, and main absorption features automatically extracted by a self-proposed Python routine. Whenever possible, spectral mineralogy was interpreted based on the continuum-removed spectra. A detailed description of the database, its content and structure, the measuring instrument, and interoperability with geographic information system (GIS) tools is available in this database report. Moreover, examples of how the data can be used and interpreted are also provided. The advantages and added value of the presented dataset reside in its European scale, with representative samples from pegmatites with distinct genesis, mineralogy, structure, and host rocks that can be used as a reference for pegmatite exploration at a global scale via, for example, satellite image processing. The reported spectral mineral assemblages can also be of interest when considering resource estimation or ore processing. Thus, it is expected that this open dataset, available on the Zenodo platform https://doi.org/10.5281/zenodo.6518318 (Cardoso-Fernandes et al., 2022b), will be a reference for distinct types of users, ranging from academia to industry.
- Article
(11612 KB) - Full-text XML
- BibTeX
- EndNote


For a long time, hyperspectral data were considered to be an expensive tool for detecting and mapping the Earth's surface minerals. However, with the launch of the Earth Observing-1 (EO-1) satellite in November 2000, which included Hyperion, the first spaceborne imaging spectrometer, remote-sensing research was given a new low-cost tool (Nikolakopoulos et al., 2007). In recent years, a new generation of hyperspectral satellites has become available that can take the application of remote-sensing data and techniques to a whole new level. PRISMA (Precursore Iperspettrale della Missione Applicativa) is an Italian Earth observation satellite launched in March 2019 that has a spectral range of 400–2500 nm (Guarini et al., 2018), and EnMAP (Environmental Mapping and Analysis Program) is a German hyperspectral satellite launched in April 2022 that has a spectral range of 420–2450 nm (Chabrillat et al., 2022). Both satellite products have a spatial resolution of 30 m and are expected to be used for a wide range of applications, including land use and land cover mapping as well as mineral and resource exploration (Cardoso-Fernandes et al., 2022a; Lazzeri et al., 2021; Santos et al., 2022a; Schodlok et al., 2022; Vangi et al., 2021; Wocher et al., 2022). To make such applications more successful, it is fundamental to provide researchers and other users with mineral and rock reference spectra in an open, ready-to-use format.
A spectral database was built in the framework of the New Exploration Tools for European Pegmatite Green-Tech Resources (GREENPEG) project (https://www.greenpeg.eu/, last access: 7 June 2023), funded by the European Commission Horizon 2020 programme, which aims to develop multi-method exploration tool sets for the identification of buried, small-scale (0.01–5×10⁶ m3) European pegmatite ore deposits of the Nb–Y–F (NYF) and Li–Cs–Ta (LCT) chemical types (Müller et al., 2022a). Moreover, the GREENPEG project also aims to enhance European databases of petrophysical and reflectance properties, for example adding new data on the properties of pegmatites and their green raw materials, including their spectral signature obtained through reflectance spectroscopy studies. This database is publicly available on the Zenodo platform: https://doi.org/10.5281/zenodo.6518319 (Cardoso-Fernandes et al., 2022b).
The main objectives of this work are to present (i) the spectral library composed within the framework of the GREENPEG project, (ii) the formats in which the database is made available and the interoperability with geographic information system (GIS) software, (iii) how the spectral library is organised, and (iv) how the data can be used and interpreted.
Previous databases have been published concerning pegmatite exploration. Cardoso-Fernandes et al. (2021b) provided a dedicated spectral library only for the Fregeneda–Almendra aplite–pegmatite field in the central Iberian Peninsula. The samples corresponded to LCT pegmatites considered to be the result of fractional crystallisation of peraluminous granites derived from the partial melting of highly peraluminous, calcium-poor, and phosphorus-rich metasedimentary rocks of Neoproterozoic age, during the Variscan orogeny (Roda-Robles et al., 2018). Despite its relevance to the state of the art, the previous database lacks spectral reflectance data for other types of pegmatites, with distinct mineralogy, textures, and genesis. Fabre et al. (2021) presented a broader database of laser-induced breakdown spectroscopy (LIBS) spectra from multiple locations around the world, such as the Fregeneda–Almendra and Gonçalo pegmatite fields in the Iberian Peninsula as well as from Canada and Brazil. Although this database comprised samples from distinct pegmatites, the main focus was on Li minerals and, therefore, samples from LCT pegmatites.
Taking this into account, the GREENPEG spectral reflectance database presents several advantages and high added value when compared with the already available datasets: (i) it is the first database of this kind built at a European scale; (ii) it includes samples from distinct pegmatites with different mineralogy, structure, host rocks, and genesis (anatectic and granite-related); and (iii) it is the first open database providing data on pegmatites of the NYF chemical type. Samples include LCT- and NYF-type pegmatites and host rocks from pegmatite locations in Austria, Ireland, Norway, Portugal, and Spain.
Therefore, this extensive database provided in multiple formats represents a high-quality dataset to be used by multiple users of different backgrounds, from academia to the mining industry. For better comprehension of the dataset, representative spectra were selected as an example to demonstrate how the spectral mineralogy included in the database was interpreted. To complement the metadata already provided within the spectral library (Cardoso-Fernandes et al., 2022b), this work presents in detail its structure, content, the process of sample preparation and data acquisition, and useful tips on the usability and accessibility of the data. The expected use of the spectral library is (i) to provide spectral properties of LCT and NYF pegmatites and possible host rocks, namely, the overall spectral behaviour, the most important absorption features, and the respective interpreted spectral mineralogy, and (ii) to serve as input for spectral band selection for satellite-based identification of outcropping pegmatites, as already shown in previous studies (Santos et al., 2022b). Moreover, the data collected is of high significance to potential users, as it demonstrates how the dominant spectral mineralogy can differentiate from the mineralogy identified by visual inspection of a hand sample. Users can leverage the curated dataset with raw, continuum-removed, and resampled spectra; extracted absorptions features; and interpreted spectral mineralogy for pegmatite identification and mapping using remote-sensing data and techniques.
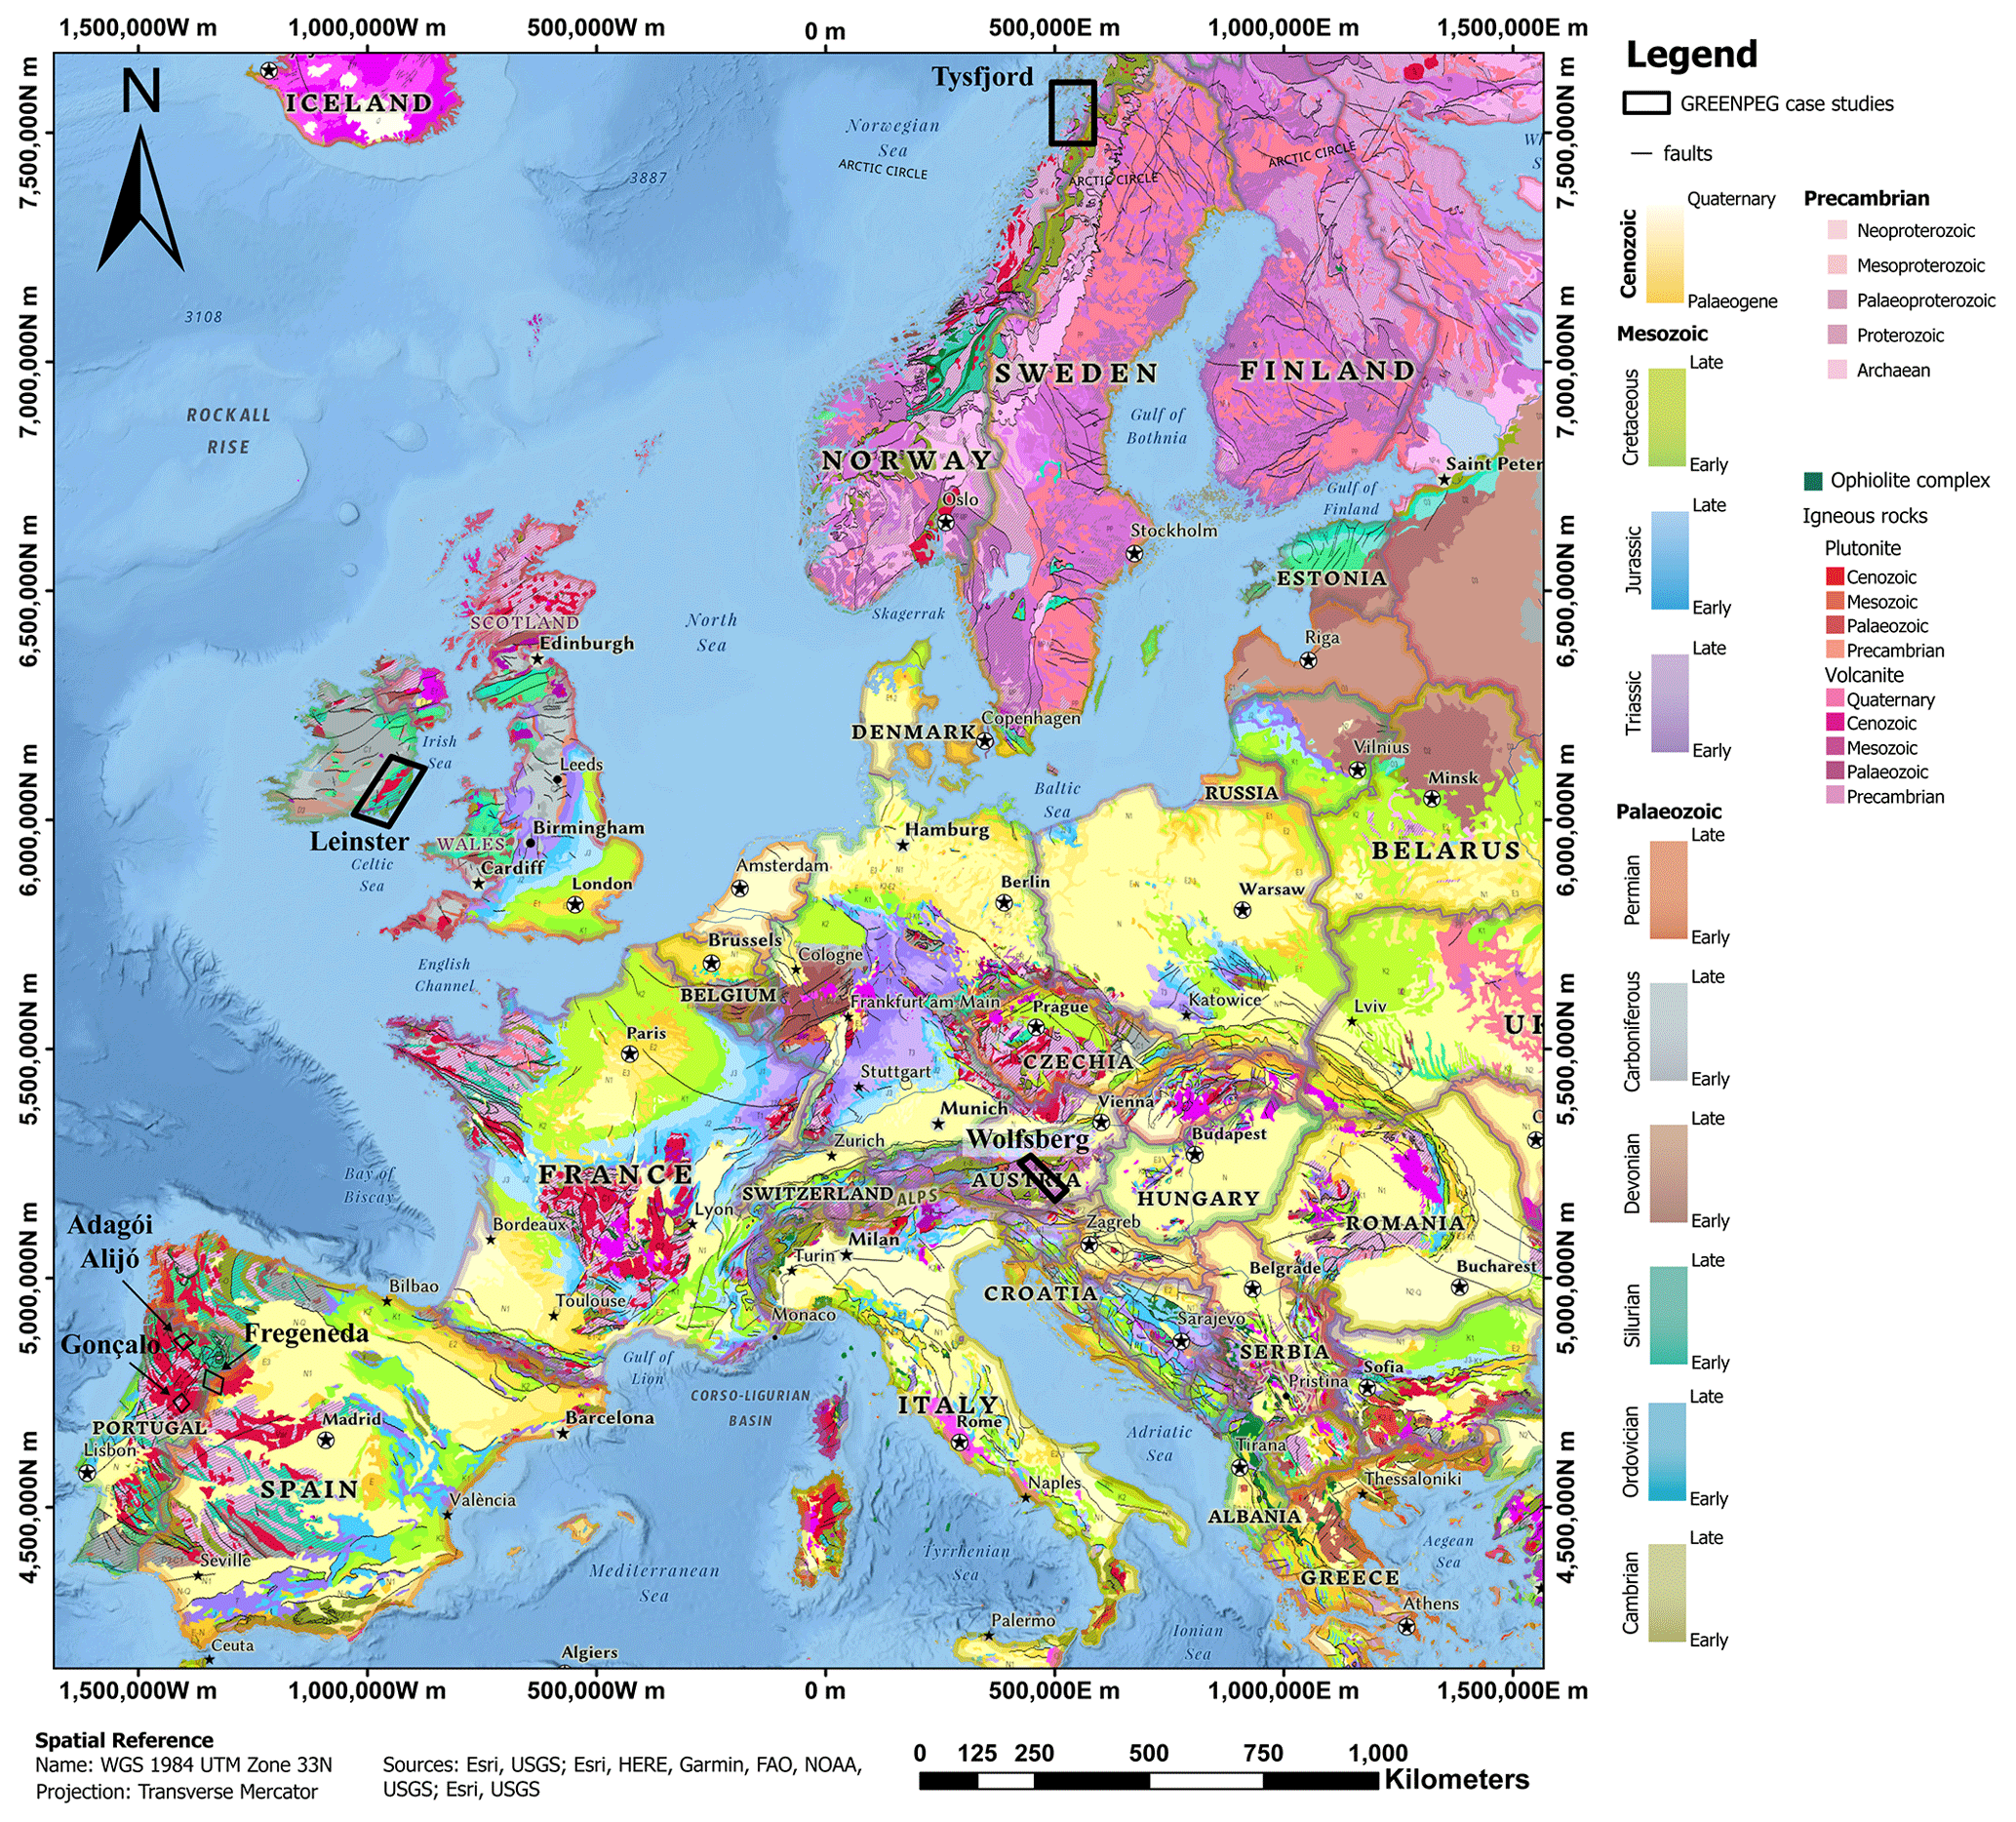
Figure 1Location of the distinct sampled pegmatite fields in Norway (Tysfjord), Austria (Wolfsberg), Ireland (Leinster), Portugal (Adagói, Alijó, and Gonçalo), and Spain (La Fregeneda) overlaid on the International Geological Map of Europe and Adjacent Areas (IGME 5000) at a 1:5 000 000 scale (adapted from Asch, 2005, and available at the European Geological Data Infrastructure, EGDI, platform – https://www.europe-geology.eu/, last access: 10 November 2022). Basemap provided by Esri, NOAA, USGS, FAO, Garmin Ltd. (© 1996–2022), and HERE (© 2022).
Case studies
The GREENPEG project develops research at various scales at three European demonstration sites (Fig. 1): (i) Leinster (Ireland), (ii) Wolfsberg (Austria), and (iii) Tysfjord (Norway). As part of the project, complementary prospective areas in Spain and Portugal were selected for testing the developed methodologies, including the usefulness of reference spectral data (Müller et al., 2022a).
Pegmatites can be economically enriched in a variety of critical and other rare metals as well as industrial minerals or gemstones. Raw materials (minerals) of interest in pegmatites include the following (Müller et al., 2022a): quartz, ceramic feldspar, industrial mica, Li mica, columbite–tantalite, and beryl (in both LCT and NYF pegmatites); allanite and monazite (only in NYF); and spodumene, petalite, amblygonite, and pollucite (only in LCT).
The pegmatite field in the Tysfjord area (Norway) has an extension of about 20 km2 with 22 known NYF dikes emplaced in granite-type rocks (Müller et al., 2022a). Two groups of pegmatites were mapped, both emplaced in the Tysfjord granite gneiss (Müller et al., 2022b). The first group consists of older Palaeoproterozoic and metamorphosed pegmatites with lens- to cigar-shaped forms reaching up to 400 m in size, formed from residual melts of the host granitic gneiss. The second group, in contrast, is composed of younger, smaller undeformed pegmatites (400–379 Ma) formed by anatexis due to partial melting of the granitic gneiss during late Caledonian events (Müller et al., 2022b). The pegmatite samples for the spectral library were collected in 14 distinct pegmatite locations (either in situ or from historical drill cores) but with an emphasis on the Håkonhals and Jennyhaugen pegmatites, both exposed in large open-pit areas allowing for detailed remote-sensing studies to be carried out in the scope of the GREENPEG project (Santos et al., 2022b; Teodoro et al., 2021). These granitic pegmatites are known for their mineral diversity (with 157 identified minerals), and the most common accessory minerals are allanite-(Ce), fergusonite-(Y), columbite-(Fe), beryl, various sulfides, and fluorite, besides the major minerals quartz, plagioclase, K-feldspar (variety “amazonite”), and biotite (Müller et al., 2017).
The pegmatite field in the Leinster area in Ireland shows around 70 km2 of extension and with 18 known LCT pegmatites emplaced in either Paleozoic granitic or metasedimentary rocks (Barros and Menuge, 2016; Müller et al., 2022a). The pegmatites are mainly hosted along a 3 km wide NE–SW regional structure along the eastern margin of the S-type Leinster Batholith (emplaced around 400 Ma) known as the East Carlow Deformation Zone (Barros et al., 2020; Barros and Menuge, 2016). The unzoned to weakly zoned pegmatite dikes can range from a few metres to up ∼ 20 m in thickness and are considered to be of anatectic origin (Barros et al., 2020; Barros and Menuge, 2016). The pegmatites are characterised by the predominance of spodumene associated with variable amounts of quartz, plagioclase, microcline, and muscovite; accessory minerals include columbite–tantalite, cassiterite, F-apatite, lithiophilite, spessartine, beryl, schorl, and pyrite (Barros et al., 2020). Due to a lack of pegmatite outcrops, some samples were collected from boulders dispersed in agricultural fields, but most of the samples come from a diamond drilling campaign conducted in the Moylisha area.
The Wolfsberg pegmatite field in Austria corresponds to an area of 25 km2, where 14 known LCT dikes are emplaced in either amphibolite or mica-schist rocks (Gourcerol et al., 2019; Müller et al., 2022a). The LCT pegmatites are spatially associated with simple pegmatites and leucogranites formed during an extensional event in Permian times (Knoll et al., 2018). The pegmatites are mostly unzoned bodies (Göd, 1989). The mineral assemblage consists of K-feldspar, quartz, plagioclase, muscovite, garnet, tourmaline, spodumene, and other accessory phases such as beryl, apatite, cassiterite, or Nb–Ta phases (Knoll et al., 2018). Recent studies seem to indicate that the LCT pegmatites resulted from anatectic melts produced from the simple pegmatites and leucogranites, followed by fractionated crystallisation (Knoll et al., 2018). Both pegmatites and leucogranites were overprinted during the Alpine orogeny with different intensities, affecting both structure and chemistry (Göd, 1989; Knoll et al., 2018). All samples analysed in this study were collected in recent drilling campaigns.
The samples from complementary test sites were collected in three distinct LCT pegmatite fields in Iberia: the Fregeneda–Almendra, Barroso–Alvão, and Gonçalo fields (Roda-Robles et al., 2018). All samples from Spain come from the Fregeneda side of the Fregeneda–Almendra pegmatite field (Roda-Robles et al., 1999; Vieira, 2010). The aforementioned pegmatite field spreads across a ∼ 30 km long and ∼ 7 km wide W–E belt of Neoproterozoic to Cambrian metasediments with 11 distinct types of dykes identified but with only five types of metasediment-hosted pegmatites worth mentioning (Errandonea-Martin et al., 2022; Roda-Robles et al., 1999; Vieira et al., 2011): (i) concordant barren pegmatites, (ii) petalite-bearing pegmatites, (iii) spodumene-bearing pegmatites, (iv) lithium (Li) mica pegmatites, and (v) spodumene and Li mica pegmatites. The samples collected in Portugal are distributed among the remaining pegmatite fields. The Barroso–Alvão pegmatite field comprises both the Adagói and Alijó pegmatite sites. Martins (2009) defined distinct types of dykes in the region: (i) intragranitic pegmatites, (ii) quartz–andalusite dykes, (iii) barren pegmatites, (iv) spodumene pegmatites, (v) petalite pegmatites, and (vi) lepidolite pegmatites, all intruding metasedimentary rocks of Silurian age. While only spodumene crystals were identified in Alijó, both spodumene, petalite, and eucryptite were found in Adagói (Lima, 2000). Finally, the Gonçalo pegmatite field is characterised by granite-hosted sub-horizontal dykes with complex rhythmic layering with lepidolite-rich, albite-rich, and quartz-rich layers, alternating with different textures (Neiva and Ramos, 2010; Roda-Robles et al., 2018). The aplite–pegmatite sills belong to the lepidolite and amblygonite subtypes, from the complex type of the LCT family of the rare-element class of pegmatites (Černý and Ercit, 2005).
In general, the LCT pegmatites from Iberia display different dips (from sub-vertical to sub-horizontal), reduced thicknesses (from < 50 cm up to ≈ 30 m), and lengths usually below 1 km (Roda-Robles et al., 2022). Moreover, these dykes do not present internal zoning but show variable grain size, from aplitic to pegmatitic textures, with the biggest crystals being usually less than 12 cm long (Roda-Robles et al., 2022, 2018). Textures indicative of unidirectional solidification are commonly observed, mainly comb crystals of alkali feldspars and/or Li aluminosilicates, and/or a layering parallel to the contacts with the host rocks, whereas graphic textures or quartz cores are not commonly observed (Roda-Robles et al., 2022, 2018). Roda-Robles et al. (2018) proposed a petrogenetic link between peraluminous granites and the LCT aplite–pegmatite bodies of the Central Iberian Zone.
The spectral library is mainly focused on the spectral signature of the GREENPEG project demonstration sites in Norway (Tysfjord), Ireland (Leinster), and Austria (Wolfsberg). The spectral measurements were conducted on surface-collected and drill core samples provided by the GREENPEG project partners. Field campaigns allowed for the spectral signature from representative samples from the test site in Portugal to be obtained (Adagói). Additional samples from Portugal (Alijó and Gonçalo) and Spain (La Fregeneda) that had previously been collected were analysed and included in the spectral database. In order to ensure the representativity and completeness of the database, multiple samples from different parts of each pegmatite (including fresh and weathered regions) and samples from different pegmatites were collected. Drill core samples provided the continuous exposure of pegmatite dykes, allowing for the assessment of the spatial distribution of mineral assemblages. In the case of zoned pegmatites, samples from each zone were collected. For further details on sample collection, the reader is referred to Haase et al. (2022) and (Haase and Pohl, 2022).
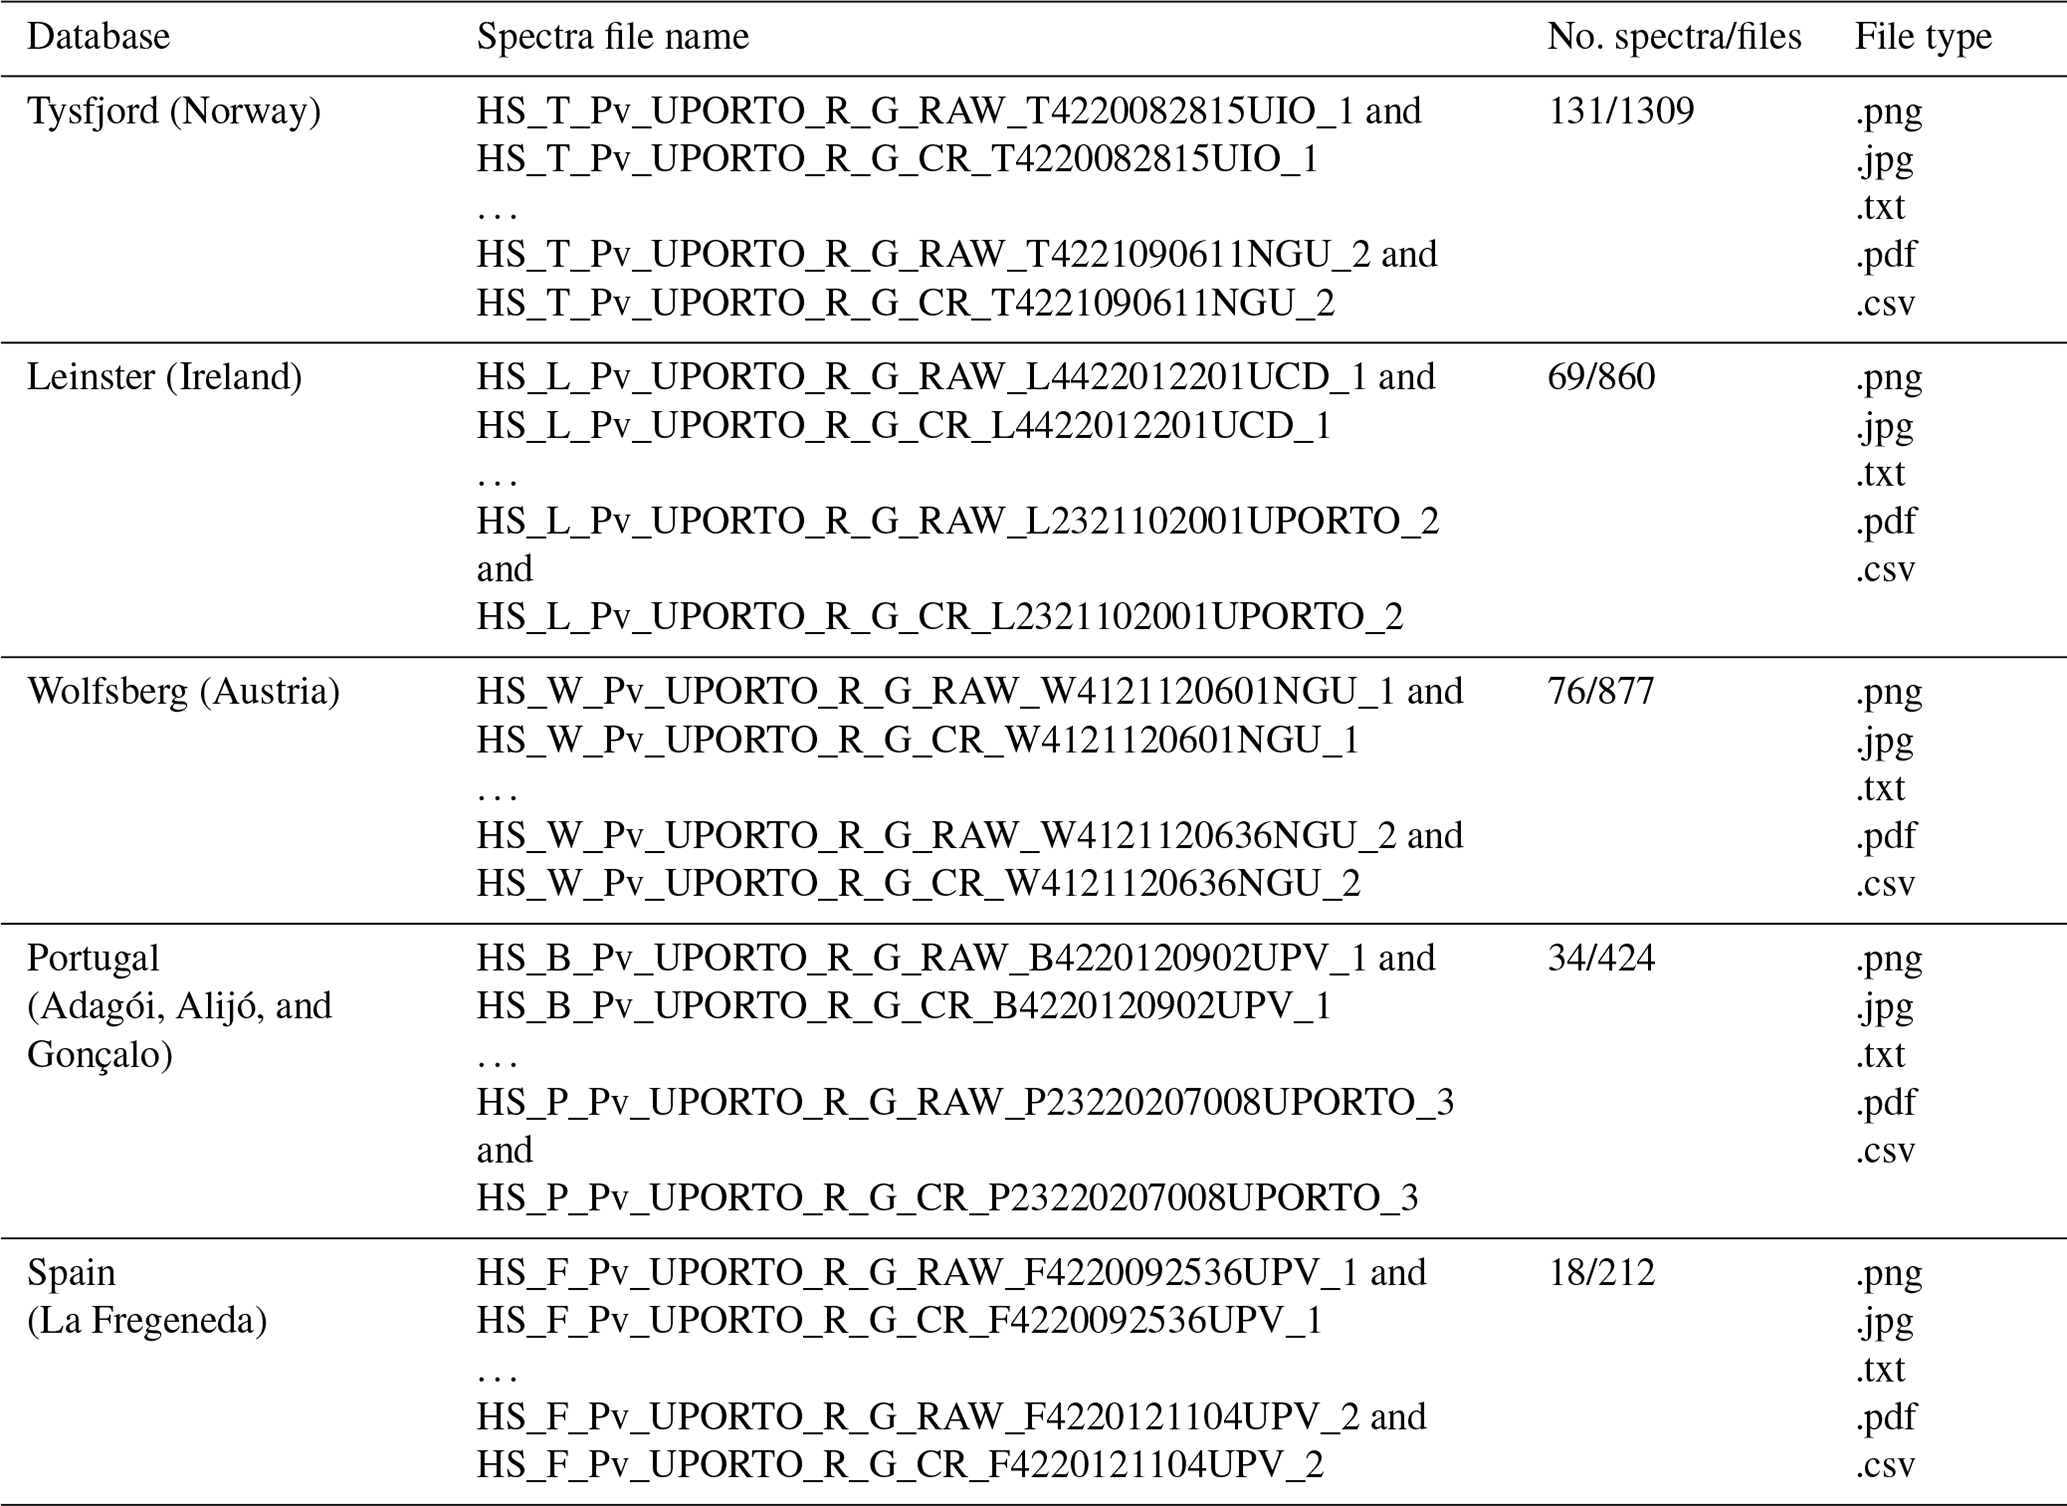
Table 1Structure and content of the data available in the Zenodo database.
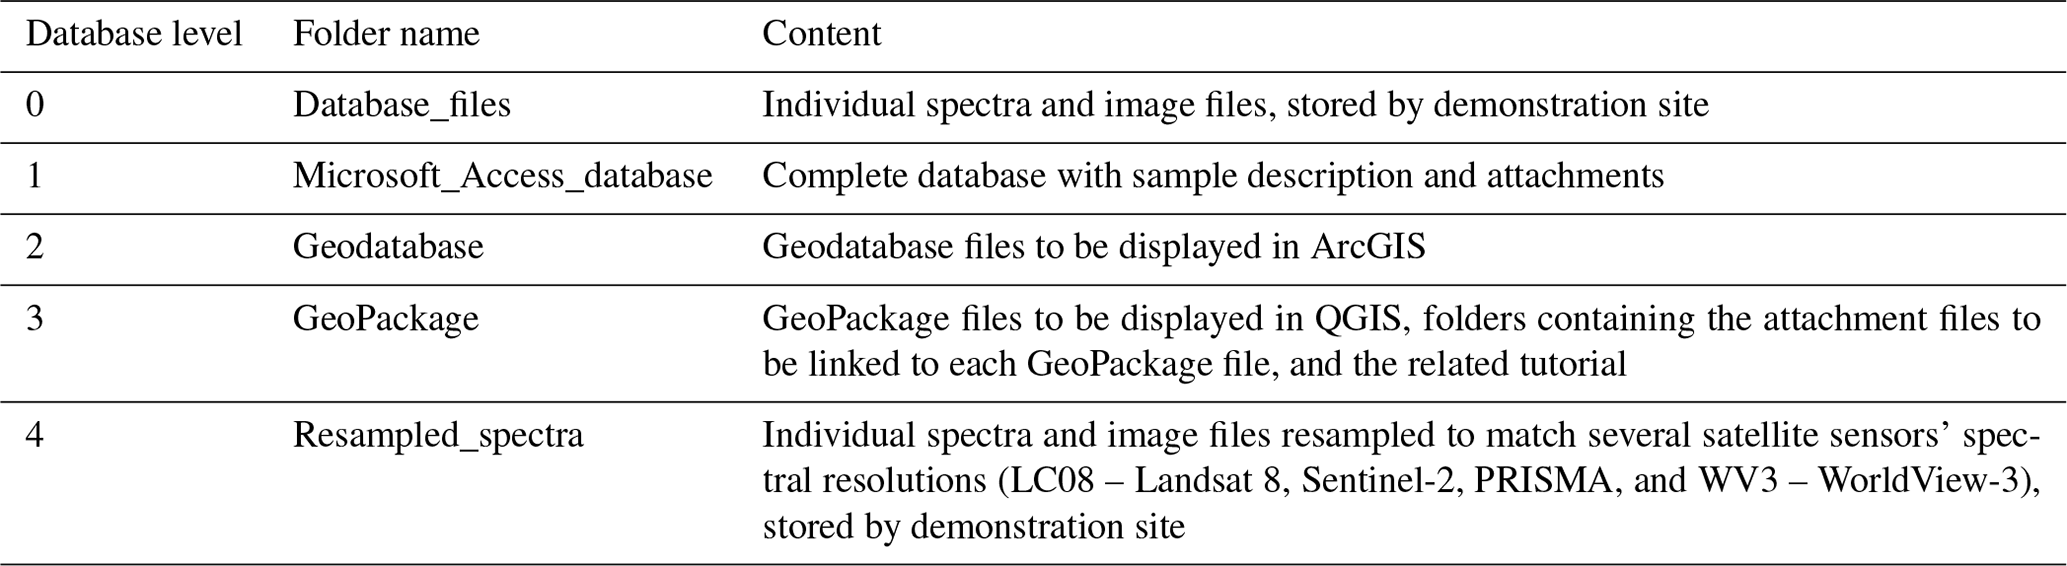
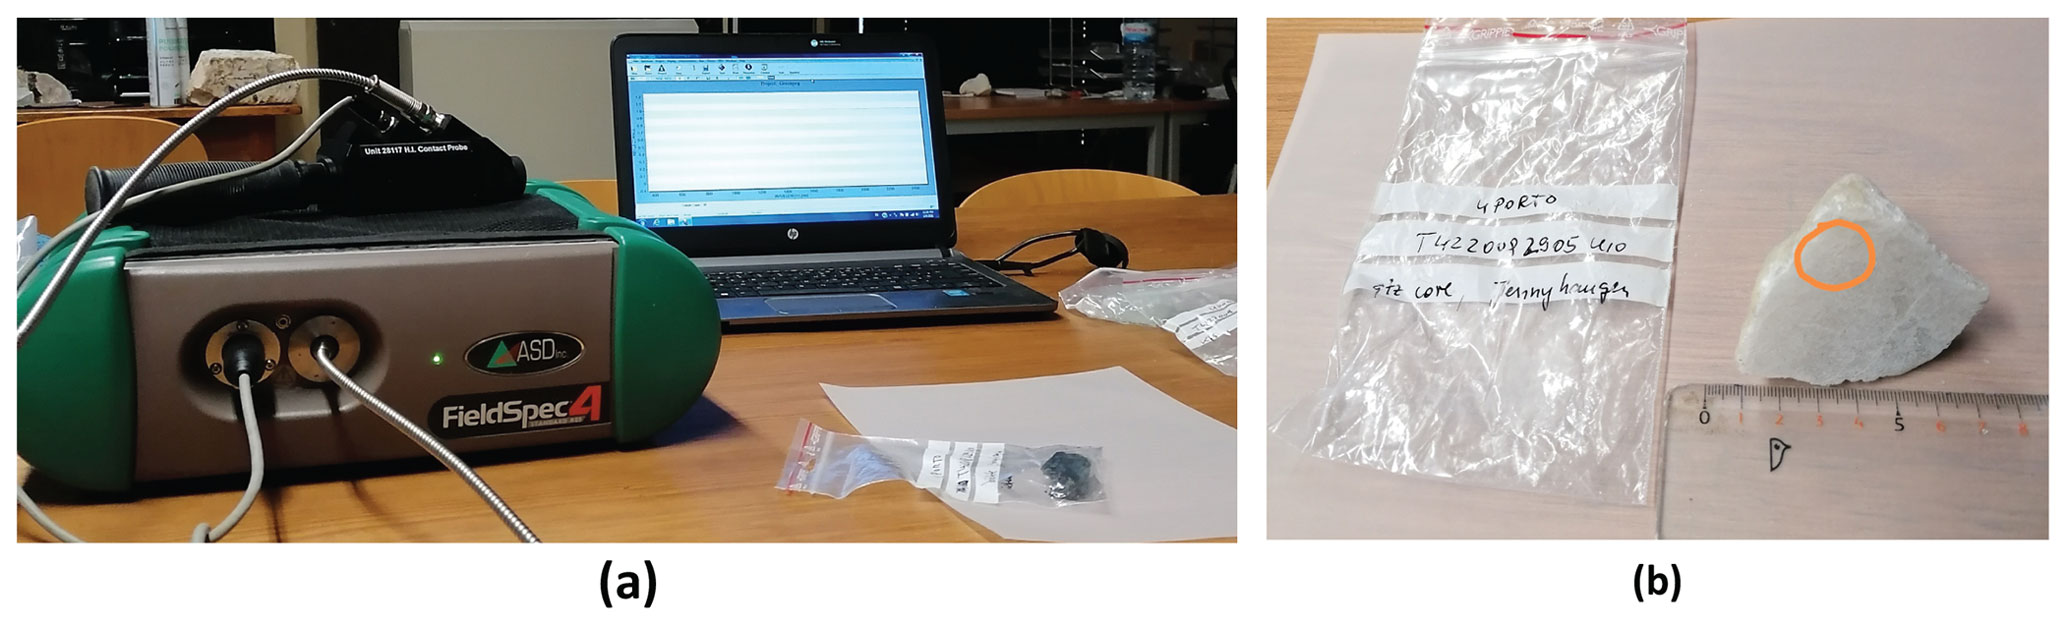
Figure 2(a) FieldSpec 4 (ASD, Inc.) standard resolution spectroradiometer. (b) Example of an annotated photograph of the measurement spot in a sample from Tysfjord. A similar photograph accompanies each analysed spot in the spectral library.
The database was originally created in a Microsoft Access database format (see Sect. 2.2), but it was then converted to geodatabase/GeoPackage formats for interoperability with GIS software (see Sect. 4) – ArcGIS (Esri, Redlands, CA, USA) and QGIS, respectively. Original raw data were also resampled to match different satellite sensors. Therefore, users should (1) select the folder(s) of interest, (2) download the .zip file, (3) extract the files, and (4) follow the available tutorials if necessary. The structure of the database is presented in Table 1. Each database level is separated according to the country of the collection site: (i) Norway (Tysfjord), (ii) Austria (Wolfsberg), (iii) Ireland (Leinster), (iv) Portugal (Adagói, Alijó, and Gonçalo), and (v) Spain (La Fregeneda).
2.1 Sample preparation and data acquisition
All samples were dried at ≈ 50 ∘C in a muffle furnace to remove any moisture (which can influence the spectral behaviour) from the sample. The measurements were conducted in a dark room using the FieldSpec 4 (ASD Inc., Boulder, CO, USA) standard-resolution spectroradiometer covering the spectral range between 350 and 2500 nm with the following resolution: 3.0 nm at 700 nm, 10.0 nm at 1400 nm, and 10.0 nm at 2100 nm (Fig. 2a). A contact probe with an internal light source provided by a halogen bulb and a spot size of 10 mm was used for the laboratory measurements. Reflectance calibration was achieved with a Spectralon (Labsphere) plate with a maximum reflectance higher than 95 % for the 250 to 2500 nm range and higher than 99 % for the 400 to 1500 nm range. To increase the signal-to-noise ratio, each measurement comprises an average of 40 scans with four additional measurements acquired in each analysed spot that were later averaged into a final spectrum (Cardoso-Fernandes et al., 2021b), as demonstrated in Appendix A (Fig. A1). For each spot analysed, a description was made regarding the sample colour and type of surface (e.g. fresh/weathered or exposed/freshly broken). The location of each measurement was annotated and photographed (Fig. 2b). Taking into account the spatial variability of mineral assemblages within the pegmatite samples, several spots within the samples were measured to obtain representative spectra. Considering the spot size of 10 mm and the variable grain size within pegmatites, it is expected that individual mineral spectra will be obtained in coarser-grained areas (pegmatitic texture), whereas the spectra of each spot will represent a rock spectrum of the mineral assemblage within that spot in fine-grained regions (aplitic texture).
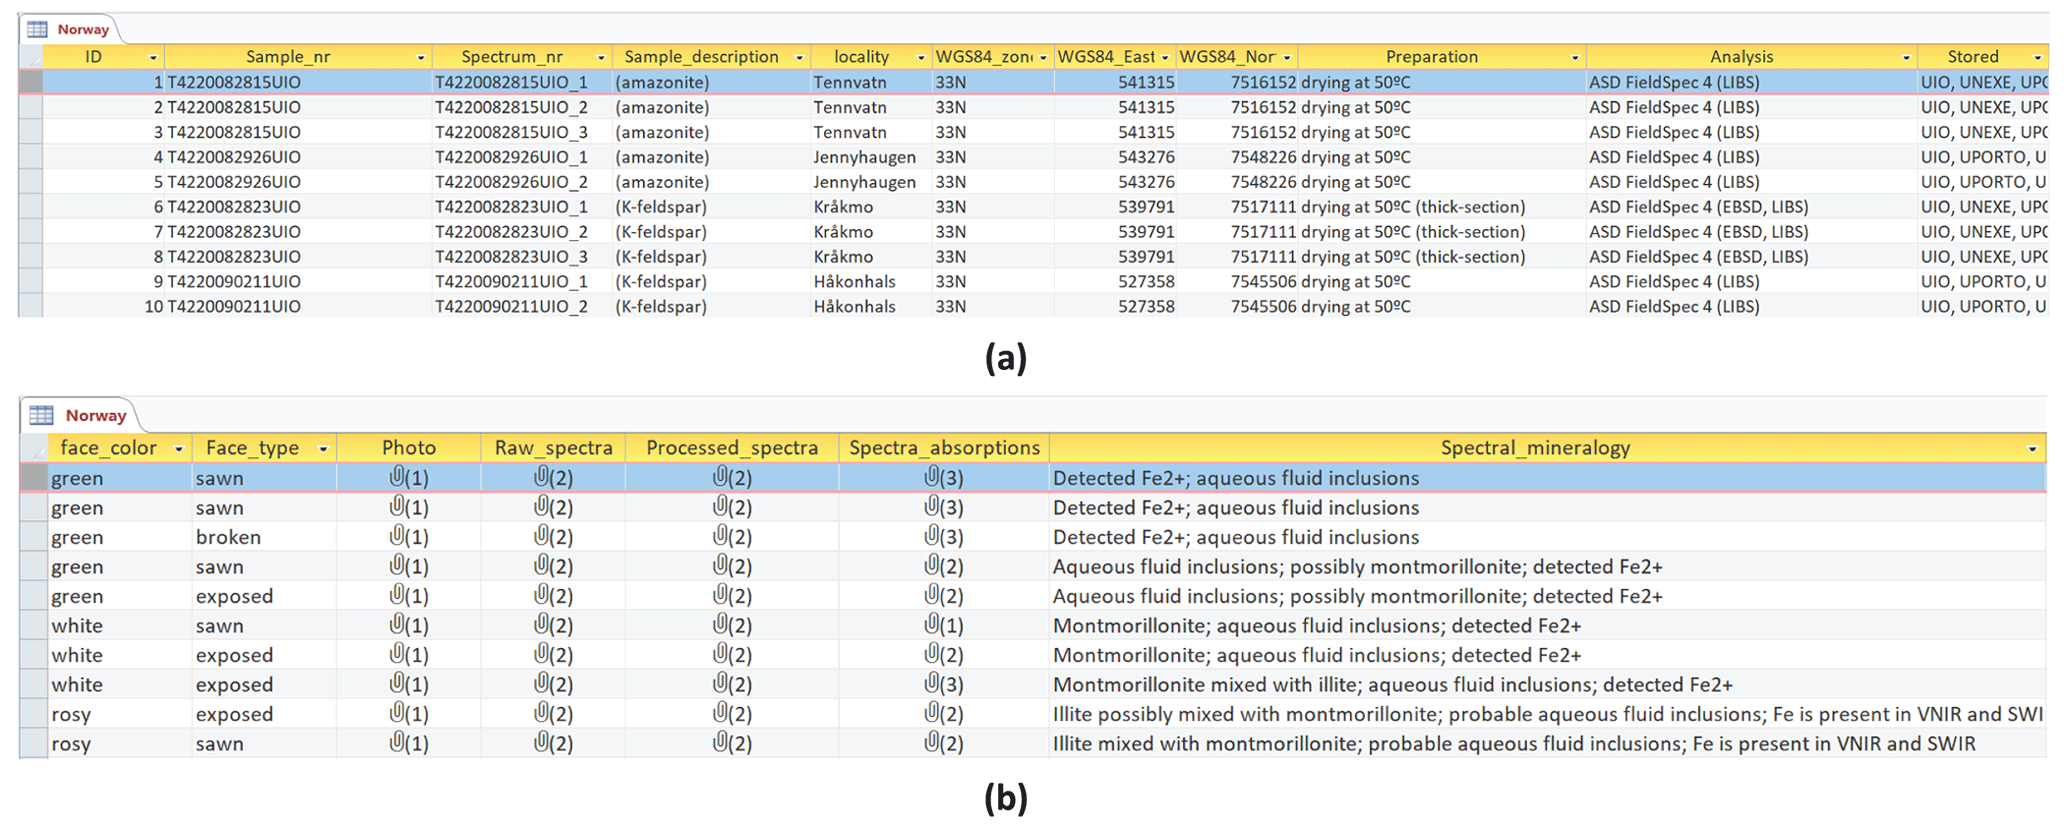
Figure 3Database table preview for the Tysfjord demonstration site: (a) recommended content of hard-rock sample list and (b) content specifically related to the spectral database (©Microsoft 2022).
For spectral post-processing, a self-proposed Python routine, using the PySptools library (Therien, 2013), was applied to eliminate the spectra continuum (normalisation) and to automatically extract the main absorption features and associated statistics (Cardoso-Fernandes et al., 2021b). To avoid the creation of artefacts and distortions, the continuum removal and respective feature statistics calculation were computed over the entire spectrum and over specific parts of the spectrum where the main absorption features are expected to occur, namely, OH (1350–1550 nm), water (1880–2040 nm), Al–OH (2160–2230 nm), Fe–OH (2230–2296 nm), and Mg–OH/CO3 (2300–2370 nm). A comparison between performing the continuum removal over the entire spectrum and over specific parts of the spectrum is shown in Fig. A2.
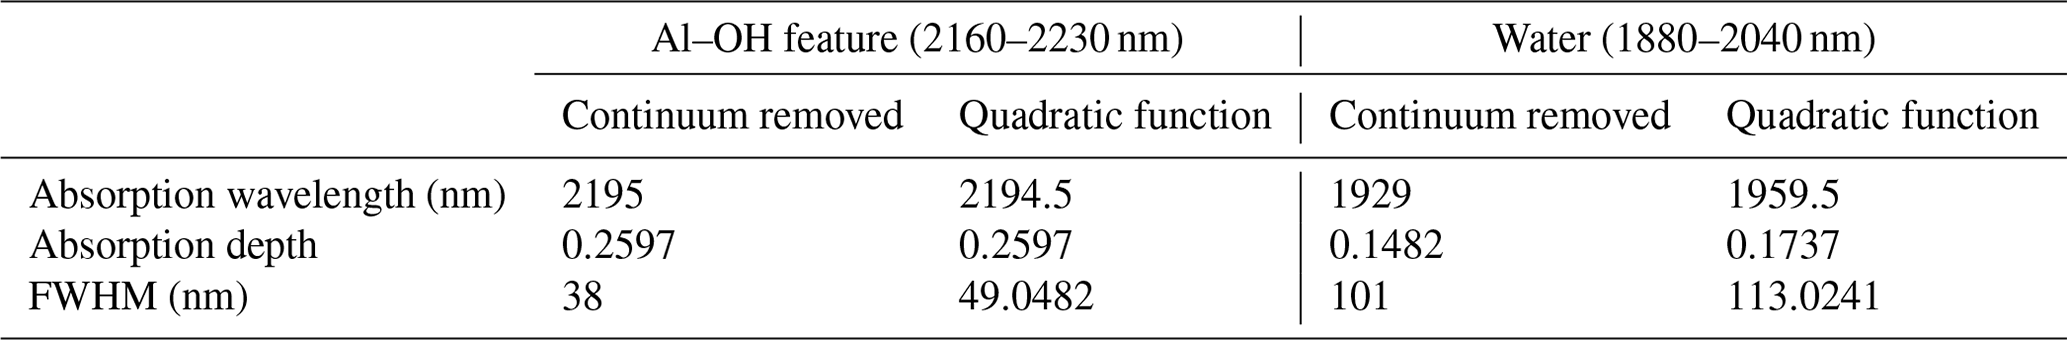
However, absorption feature statistics, such as the central wavelength position and the depth of one main absorption feature, can be extracted in two ways: in the first, the statistics are computed based on the channel with the minimum value in the continuum-removed feature; the second relies on the central wavelength of a quadratic function fitted to the band centre and one channel on each side. The band centre from the quadratic function and the wavelength position of the band centre channel may be very close in value when the feature contains a large number of channels. However, the quadratic function is less subject to noise in the spectrum because it uses more than one channel (Kokaly, 2011, 2008). Thus, in this study, the Python routine includes both statistics (one following the approach of continuum removal and the other based on the quadratic-function fit method). The results between the two methods can be similar or show some differences from one case to another (see Fig. A3 and Table A1).
In the end, raw spectra were resampled to correspond to the spectral resolutions of multispectral and hyperspectral sensors, namely, Landsat 8 Operational Land Imager (OLI), Sentinel-2 Multispectral Instrument (MSI), WorldView-3, and PRISMA. While there are potential limitations of resampling the laboratory spectra to match the spectral resolution of multispectral and hyperspectral satellite data, due to the loss of narrow and sharp diagnostic absorption features, resampling the spectral library can still provide valuable information for satellite image classification and lithological mapping (see Sect. 3).
2.2 Microsoft Access database
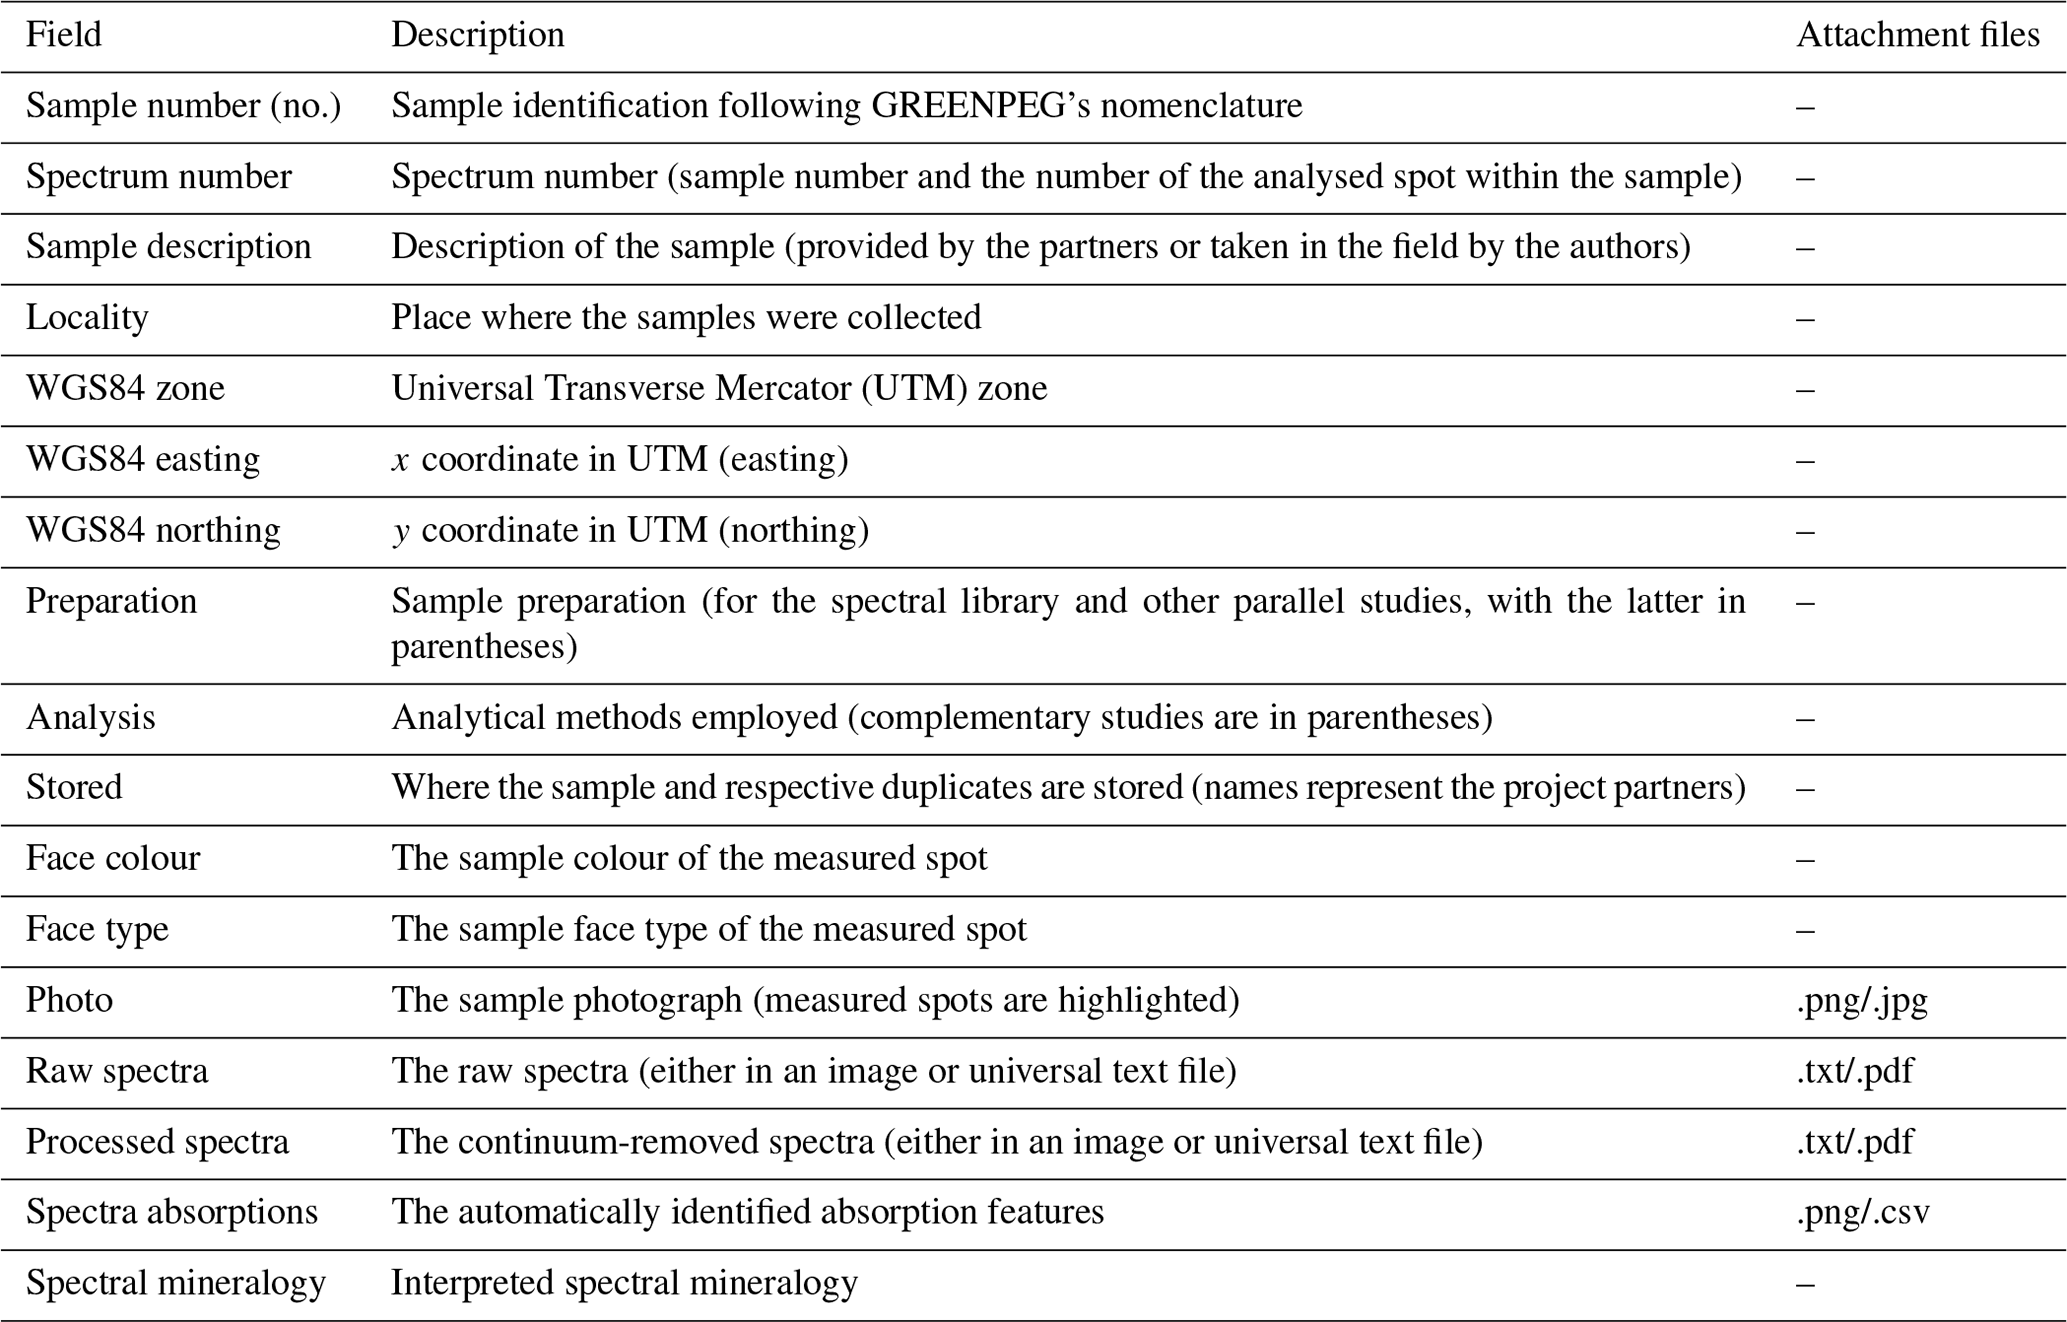
The database contains a table for each demonstration site and additional tables for the Portuguese and Spanish test sites. Each table follows the recommended nomenclature and content for hard-rock samples defined in the GREENPEG Project Management Plan (GREENPEG D1.1, 2020), namely, (i) sample number (no.), (ii) sample description, (iii) locality, (iv) WGS84 zone, (v) WGS84 easting coordinate, (vi) WGS84 northing coordinate, (vii) preparation, (viii) analysis, and (ix) place where the samples are stored (Fig. 3a). The columns also provide information for each measurement, namely, (i) a photograph of the sample, (ii) the observed sample colour, (iii) the type of sample surface, (iv) the raw spectrum (as an image and universal text file), (v) the normalised spectrum (either in an image or universal text file), (vi) the automatically identified absorption features, and (vii) the interpreted spectral mineralogy (Fig. 3b) by comparing the acquired spectra to known reference spectra from the USGS spectral library and other published sources (Clark et al., 1990; Hunt, 1977; Pontual et al., 2008). A careful interpretation of the results was made in the context of the known mineralogy and geological setting of the area. Several database columns contain attachments (paperclip icons) that can be previewed or saved to a local desktop. The number next to these icons indicates the number of available attachments (Fig. 3b). Additionally, Microsoft Access automatically adds an ID column, where a primary key (number) is attributed to each entry in the database. The content of the database and the type of attachments are summarised in Table 2, and the detailed content is presented in Appendix A (Table A2).
All users should be aware that the sample description in the database was obtained by visual inspection and lithological or mineralogical identification based on the hand samples. Thus, at specific points on the rock or mineral sample, other spectrally active minerals may be present and contribute to the spectral signature captured at those locations, not just the mineral(s) identified in hand samples (see Sect. 2.2.1).
Data interpretation and use
The identified spectral mineralogy of the investigated samples was achieved through the comparison of the measured absorption spectrum with reference material spectra of the United State Geological Survey (USGS) spectral library (Clark, 1999; Clark et al., 2003; Kokaly et al., 2017) and other published libraries (Clark et al., 1990; Hunt, 1977; Pontual et al., 2008). The interpretation was done in the continuum-removed spectra by looking at the shape, symmetry, depth, and wavelength position of the main absorption features. This process followed the steps proposed by Pontual et al. (2008): (i) the deepest absorption feature in the 2050–2450 nm region was identified as well as the corresponding mineral spectral group; (ii) within the spectral group, the reference spectra that were the closest match to the acquired spectra will be used to represent the dominant spectral mineral; (iii) as spectral mixtures are often observed, other absorption features can be used to identify other minerals. For specific details on the spectral interpretation of pegmatite minerals, the reader is referred to Cardoso-Fernandes et al. (2021a) and references therein.
Our results show that the spectral mineralogy identified does not necessarily match the minerals identified from hand specimen and optical microscopy observations. This is because some silicates do not necessarily present diagnostic absorption features (Spatz, 1997) or because the spectra are dominated by alteration minerals that are spectrally very active due to the presence of water/hydroxyl groups and superimpose unaltered mineral domains (Hunt and Ashley, 1979). It is noteworthy that some of these clay minerals can dominate the spectra, even in the most preserved, fresh samples, as demonstrated by Cardoso-Fernandes et al. (2021a). However, according to the previously mentioned study, the absorption depth of these alteration minerals appears to correlate with the degree of alteration of the analysed mineral.
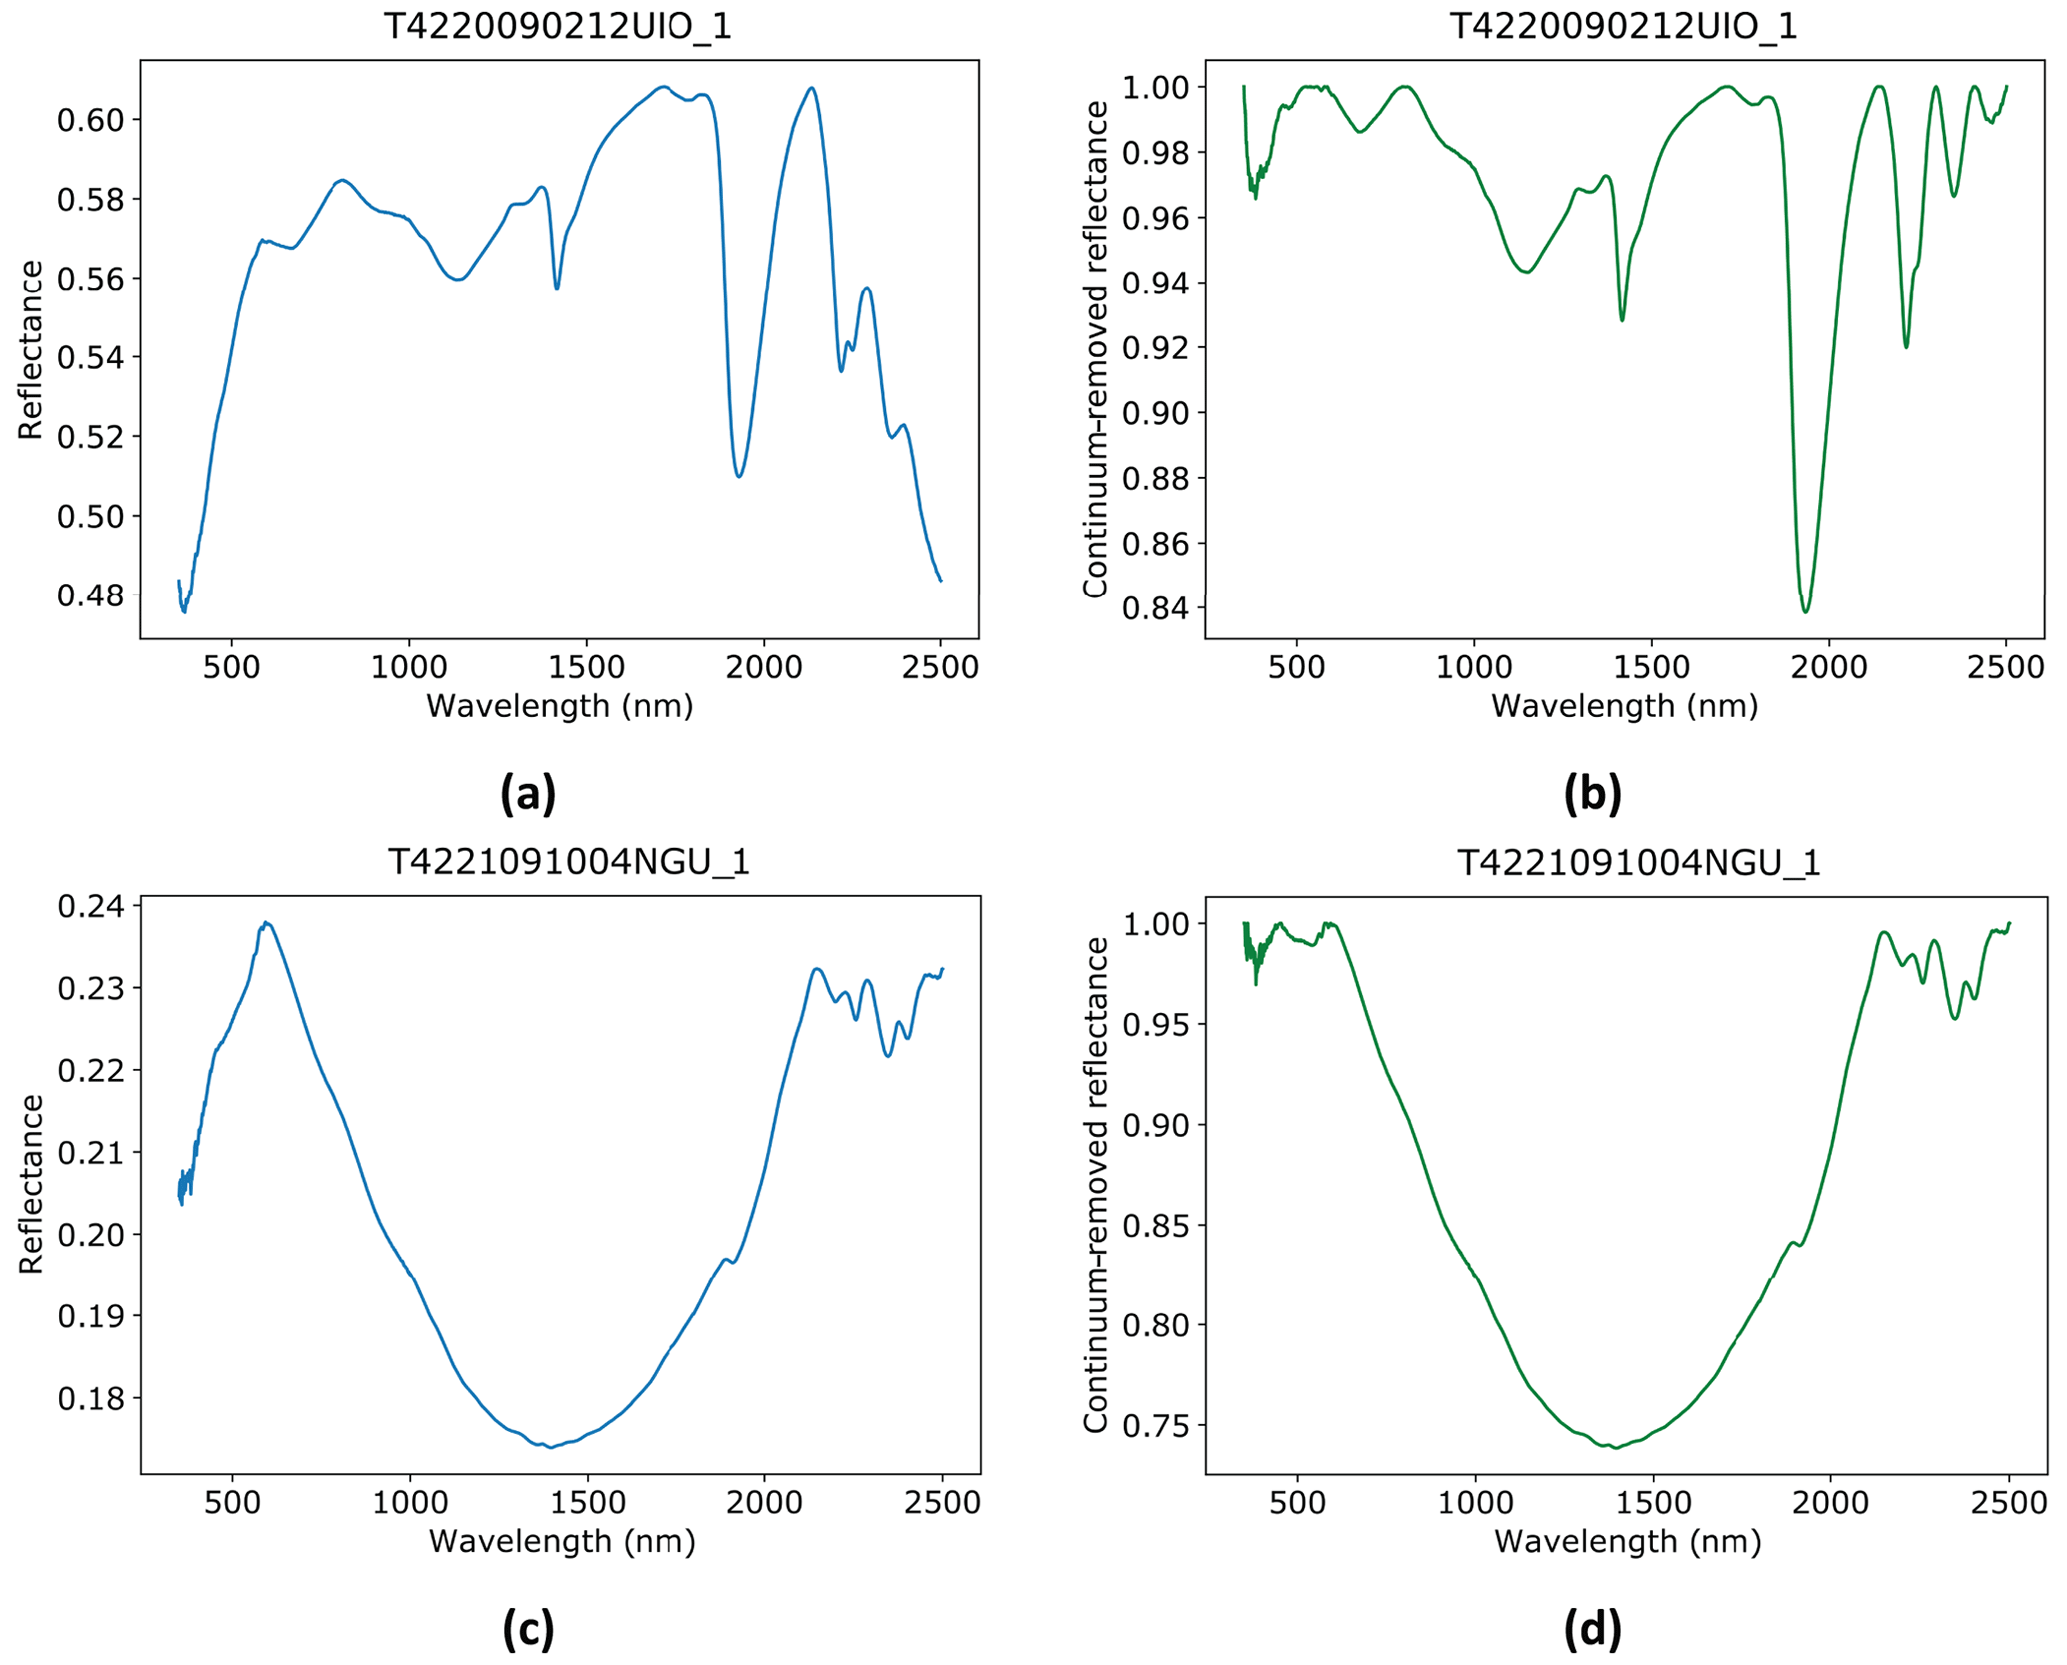
Figure 4Representative spectra of samples from the Tysfjord demonstration site: raw (a) and normalised (b) spectra of pegmatitic plagioclase showing features of illite mixed with montmorillonite and biotite and crystallographic water and/or water of microfluid inclusions; raw (c) and normalised (d) spectra of granitic gneiss displaying a strong ramp-like Fe2+ absorption and chlorite/biotite mixed with white mica.
The representative reflectance spectra stored in the libraries can be utilised for satellite image processing, namely, in the image classification tasks. To do so, the acquired spectra can be resampled to match the satellite sensors' spectral resolution and used as a target for algorithm training instead of the image pixels. This approach is, for example, an alternative satellite image processing method for the Leinster and Wolfsberg demonstration sites, where there are insufficient outcrops of pegmatite in the target area to serve as training areas in the satellite image processing, thus preventing the application of machine learning algorithms (GREENPEG D2.3, 2021). Moreover, by comparing the location of the reflectance anomalies of the reference spectra with the location of the satellite sensor bands, it is possible to select the most indicative bands for image processing and improve the previously employed approaches (Santos et al., 2022b). Thus, the spectral library will be extremely helpful for the processing of WorldView-3 images, in particular, due to the increased spatial and spectral resolution.
This section selects representative spectra for each demonstration site to illustrate how the data available in the database can be interpreted using some examples of the spectra figure files.
Spectra of pegmatite samples from Tysfjord (Norway) are characterised by biotite/chlorite features mixed with crystallographic water, microfluid inclusions, and alteration minerals, such as montmorillonite and illite (Fig. 4a, b). Granitic gneiss samples are characterised by strong Fe2+ ramp-like absorptions caused by biotite/chlorite mixed with white mica, illite, and/or montmorillonite (Fig. 4c, d).
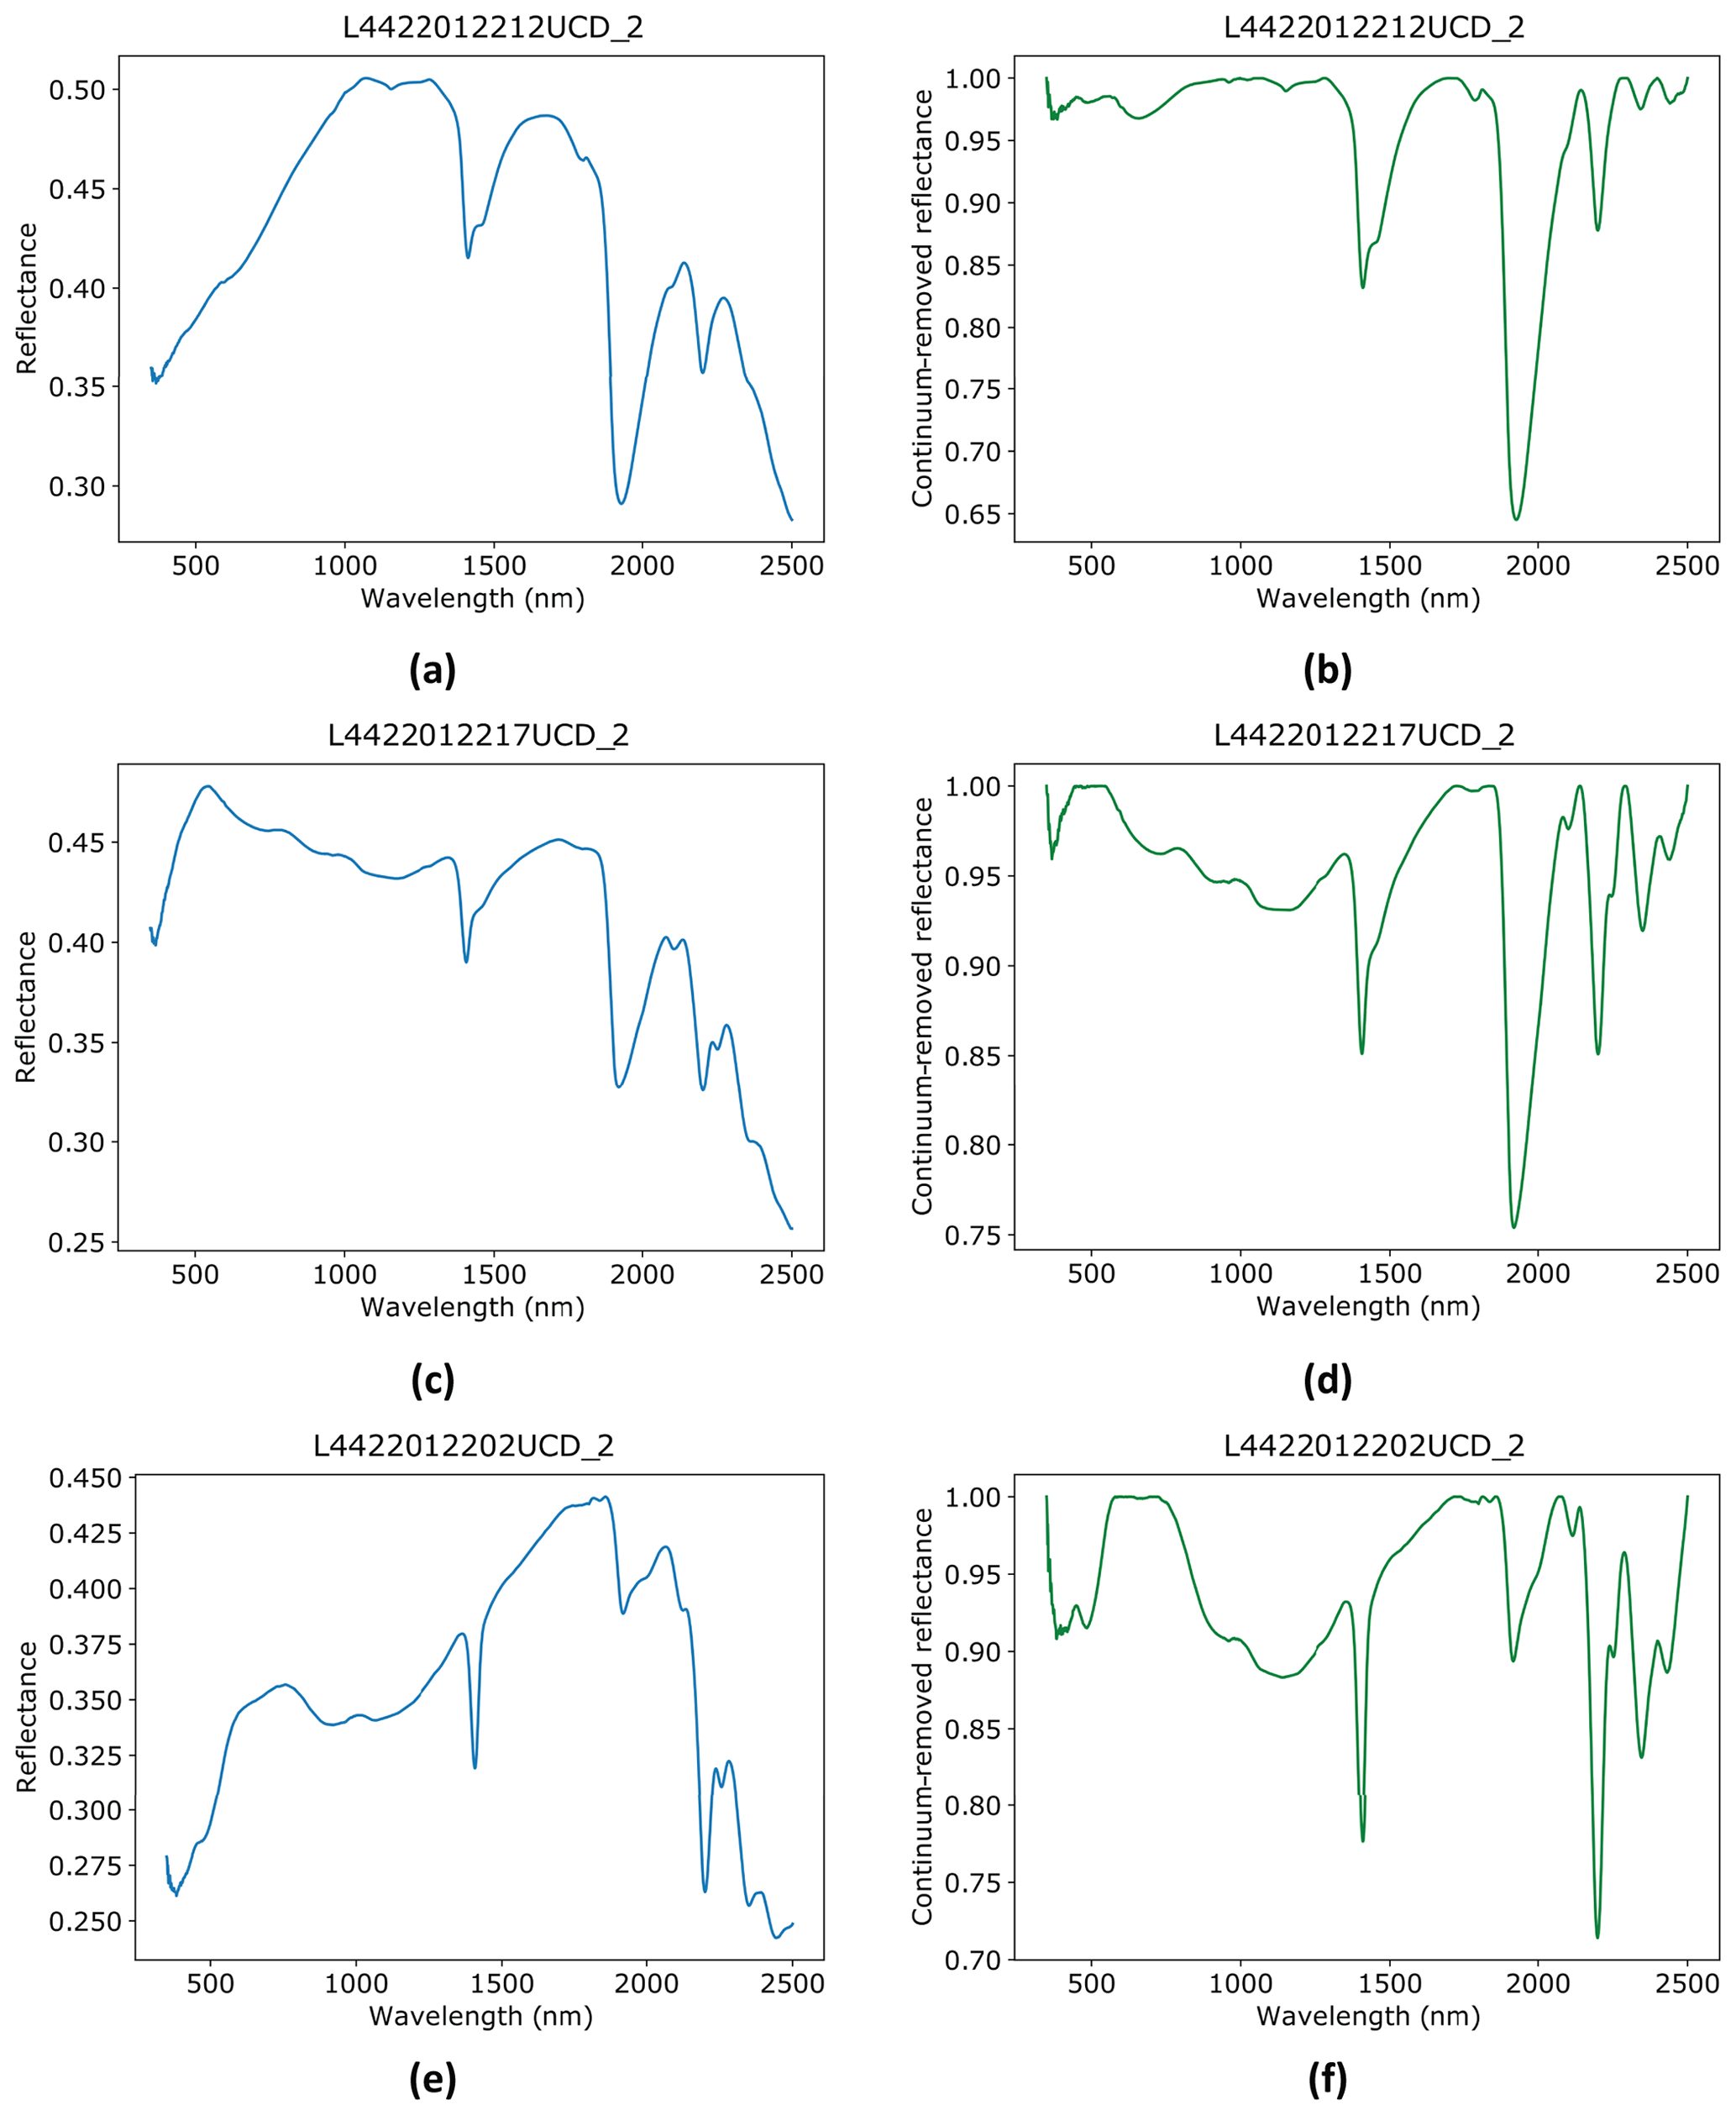
Figure 5Representative spectra of samples from the Leinster demonstration site: raw (a) and normalised (b) spectra of an albitised pegmatite sample showing spectral features of montmorillonite mixed with white mica/illite; raw (c) and normalised (d) spectra of a granite sample showing a ramp-like Fe2+ absorption and features of biotite mixed with chlorite, illite, and montmorillonite; raw (e) and normalised (f) spectra of a schist sample showing spectral features of hydrated white mica, probably sericite mixed with chlorite/biotite.
The spectra of pegmatite samples from Leinster (Ireland) are dominated by illite and/or montmorillonite features (Fig. 5a, b), sometimes mixed with white mica or orthoclase. Granite samples are characterised by Fe2+ ramp-like absorptions caused by biotite/chlorite mixed with white mica, illite, and/or montmorillonite (Fig. 5c, d). The schist samples have spectral features of white mica or hydrated white mica (probably sericite) mixed with chlorite/biotite (Fig. 5e, f). Altered samples are dominated by alteration minerals, such as illite or montmorillonite.
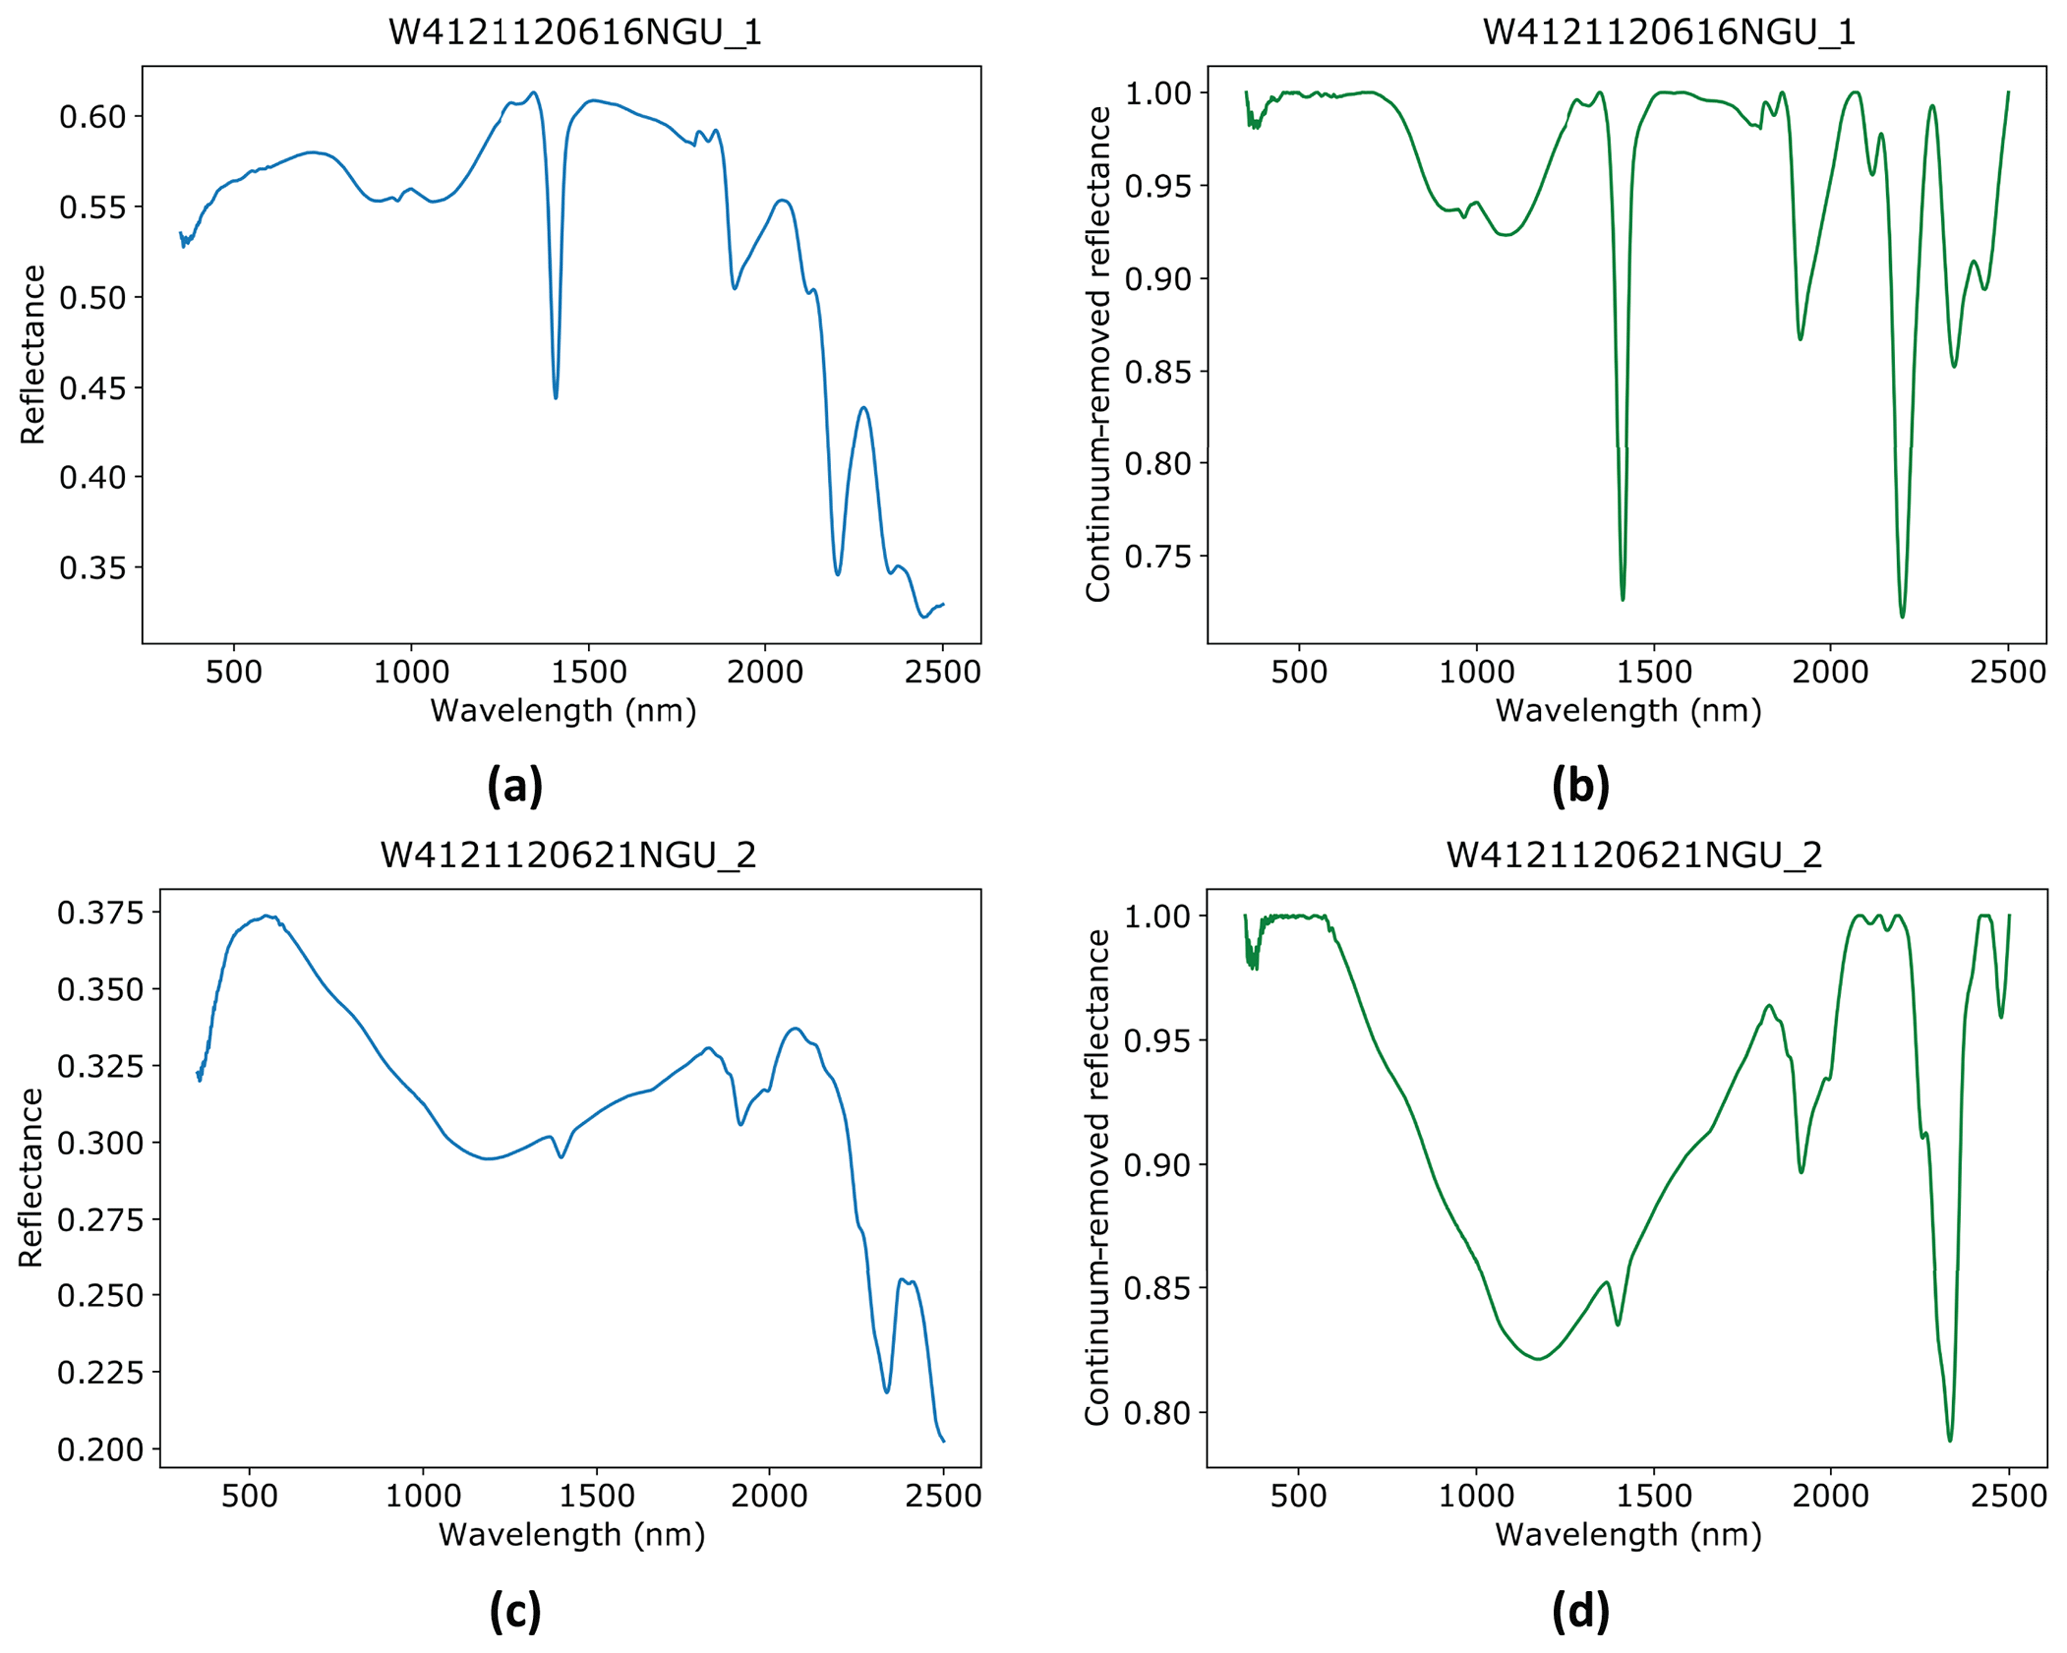
Figure 6Representative spectra of samples from the Wolfsberg demonstration site: raw (a) and normalised (b) spectra of a pegmatite sample showing spectral features of hydrated white mica, probably sericite; raw (c) and normalised (d) spectra of the pegmatite host rock (probable amphibolite) sample showing Fe2+ ramp-like absorption spectral feature diagnostics for carbonates (siderite) possibly mixed with chlorite.
The spectra of pegmatite samples from Wolfsberg (Austria) are dominated by white mica or hydrated white mica (probably sericite) sometimes mixed with illite or montmorillonite (Fig. 6a, b). The pegmatite host rock samples display features diagnostic for white mica, chlorite, biotite, phlogopite, and/or carbonates, such as siderite and magnesite (Fig. 6c, d).
While it is clear that the overall spectral signature of LCT pegmatites is mostly associated with alteration minerals such as clays, as observed in previous studies (Cardoso-Fernandes et al., 2021a), the spectral behaviour of NYF pegmatites is more dominated by biotite/chlorite features. As biotite and chlorite (to the exception of cookeite) are not expected to appear in LCT pegmatites, the characteristic Fe and Mg features allow one to spectrally discriminate between NYF and LCT pegmatites. Moreover, although not identified in this study, diagnostic, sharp absorption features of rare earth elements (REEs) in the visible spectrum (∼ 400 to 700 nm), caused by f → f transitions of the 4f electrons (Möller and Williams-Jones, 2018; Rowan et al., 1986; White, 1967), could be observed associated with allanite or monazite mineral phases. However, if these minerals are not present in NYF samples, distinguishing different types of pegmatite solely through spectral features and mineral identification can be challenging.
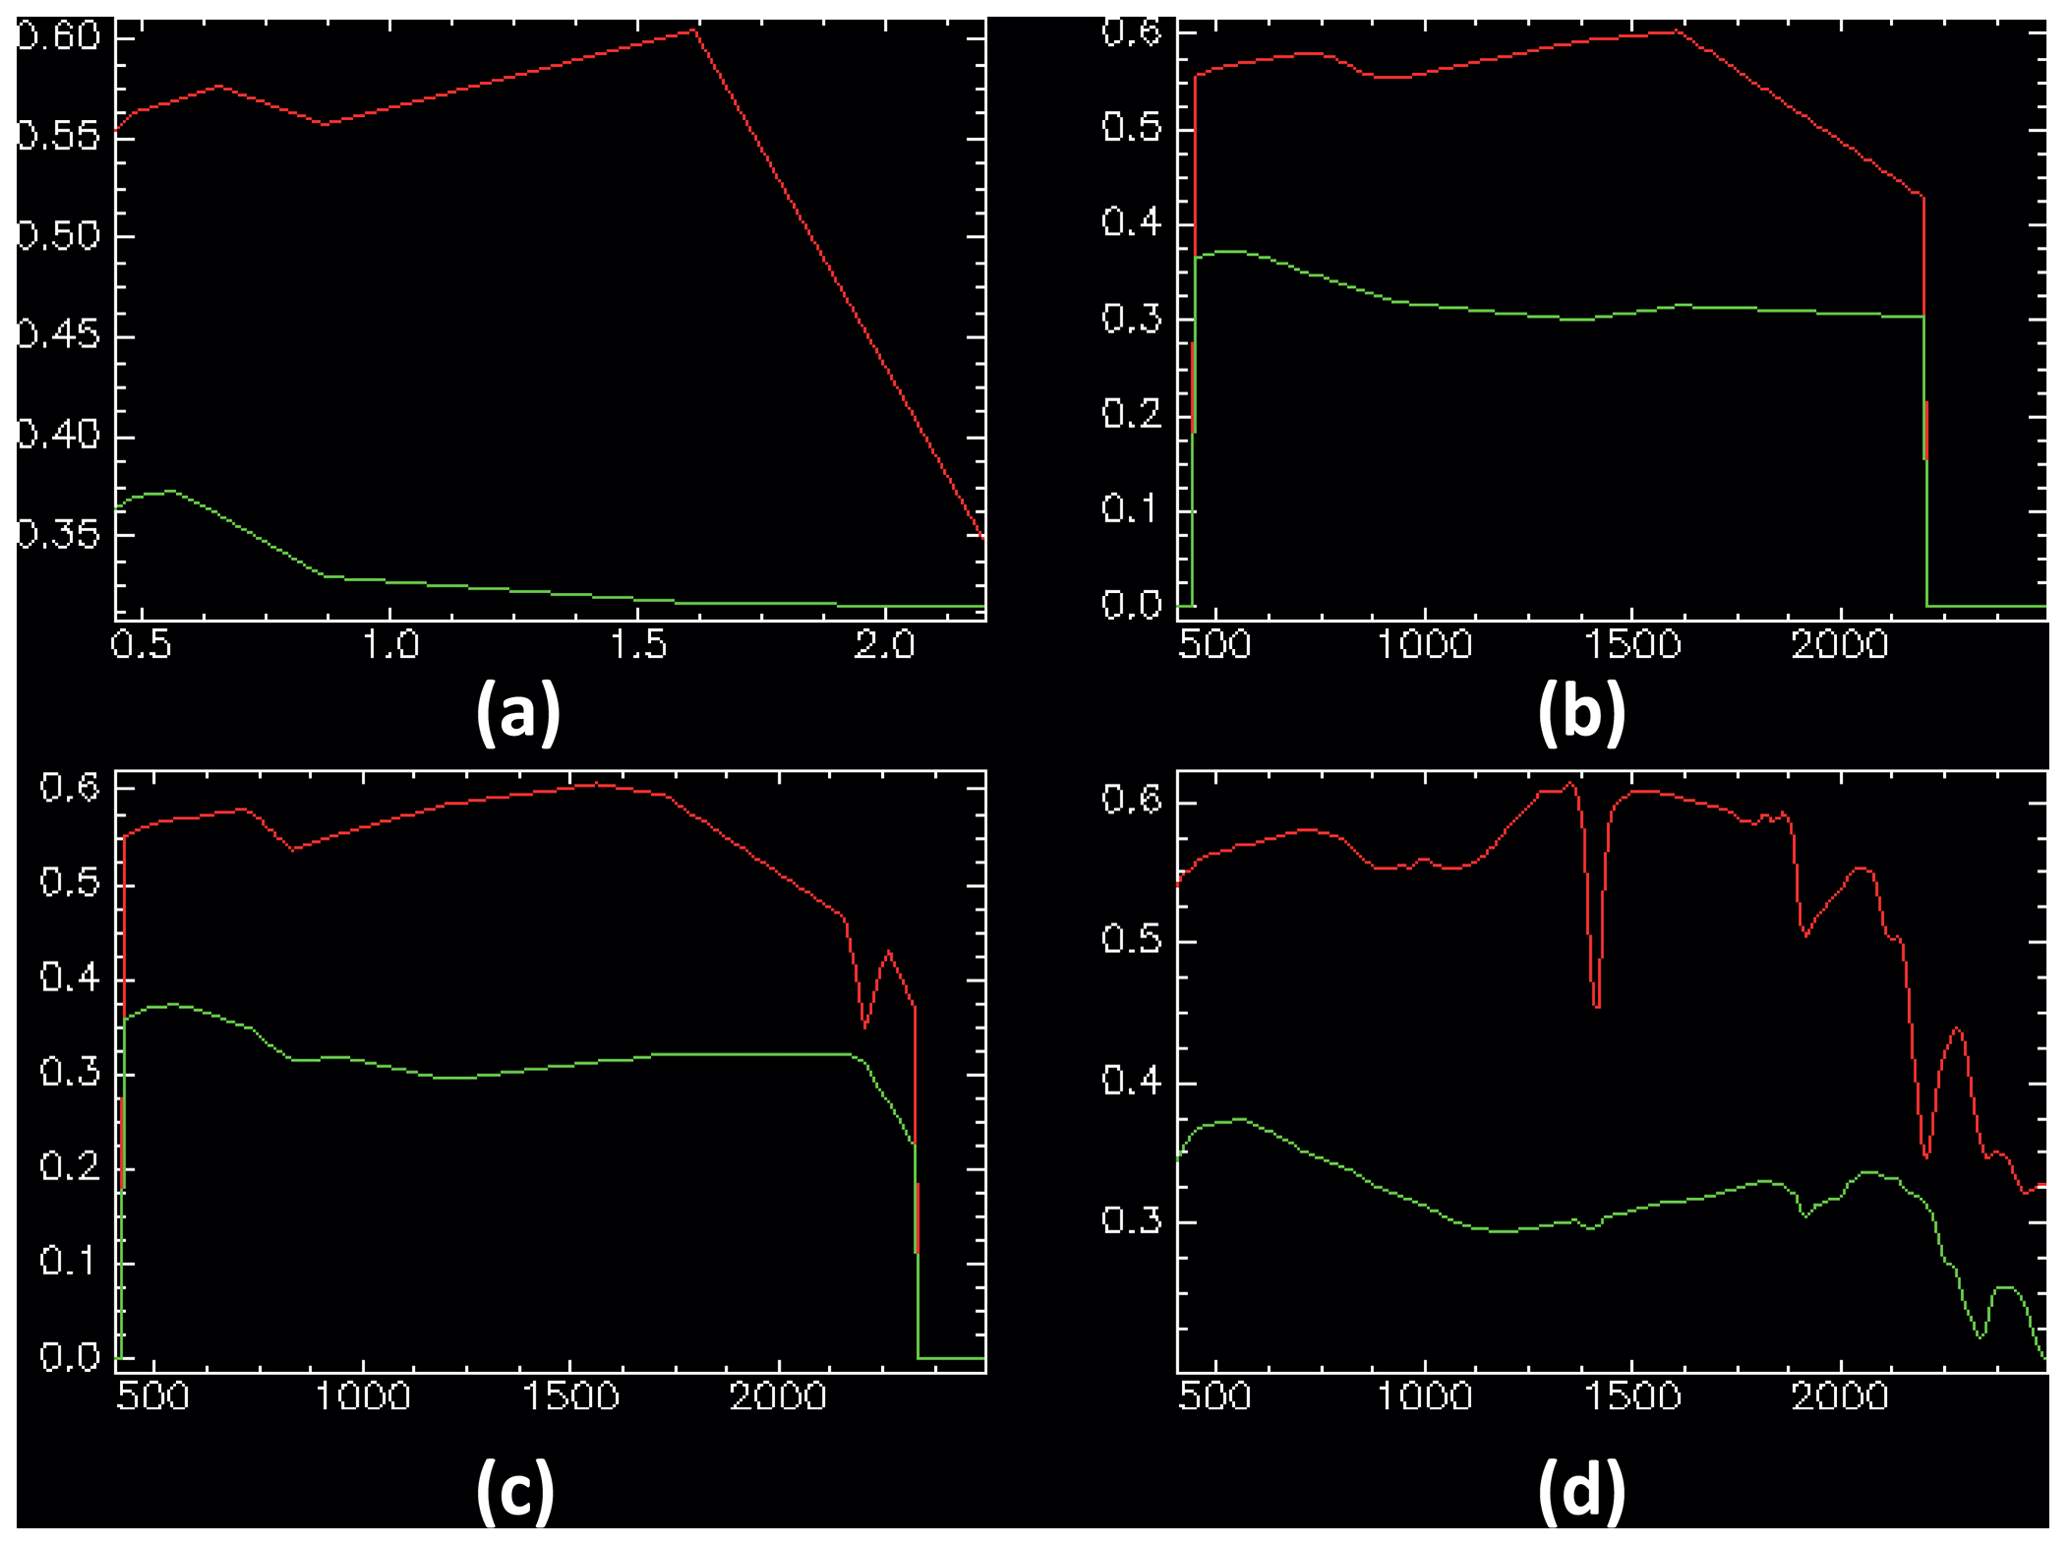
Figure 7Comparison of the pegmatite (red) and host-rock (green) spectra from Wolfsberg (Fig. 6) resampled to match the spectral resolution of different satellite sensors: (a) Landsat 8 Operational Land Imager (OLI), (b) Sentinel-2 Multispectral Instrument (MSI), (c) WorldView-3, and (d) PRISMA. The x-axis units are in micrometres (a) and nanometres (b–d).
The superposition of the satellite bands over the reference spectra or the resampled spectra to match the satellite sensors' resolutions is very useful to select the most crucial bands for image processing through band ratios, RGB combinations, or image classification, as has been demonstrated by previous research works (Nikolakopoulos and Papoulis, 2016; Santos et al., 2022b). To assess the potential use of resampled spectra, Fig. 7 shows the spectra of pegmatite and host rocks from Wolfsberg according to different multi- and hyperspectral sensors. Sentinel-2 (Fig. 7b) shows the lowest discrimination between the host rocks and pegmatite, followed by Landsat 8 (Fig. 7a), WorldView 3 (Fig. 7c), and PRISMA (Fig. 7d) with the closest spectral range to the laboratory spectroradiometer. In the case of Landsat 8 (Fig. 7a), Band 6 (1.57–1.65 µm) is crucial for lithological discrimination with pegmatite, as pegmatite shows a reflectance peak in that range that is not observed in the host rocks. The higher spectral resolution of WorldView-3 (Fig. 7c) allows for greater discrimination with the Al–OH absorption feature: this feature is well marked for pegmatite within the short-wave infrared (SWIR)-6 band (2185–2225 nm), whereas host rocks only show carbonate absorption within the SWIR-8 band (2295–2365 nm).
Nonetheless, it should be noted that the acquired spectra only cover the visible and near-infrared (VNIR) and SWIR regions which provide useful information for the identification of clays, micas, and alteration minerals in pegmatites. For a complete characterisation of pegmatites and their major rock-forming minerals (i.e. quartz and feldspar), a sensor covering the thermal region would be needed, as such silicates only present diagnostic absorption features in that range (Spatz, 1997). However, most satellite data products either do not cover this thermal region or, when they do, the spatial resolution is too coarse to be of use for pegmatite identification. Thus, the spectra in the GREENPEG database are representative of the signature captured by satellite sensors. Careful use and interpretation of the spectra must be made by any potential user, as it has been established that the pegmatite dominant spectral mineralogy might not be exclusive of pegmatite rocks (Cardoso-Fernandes et al., 2021a).
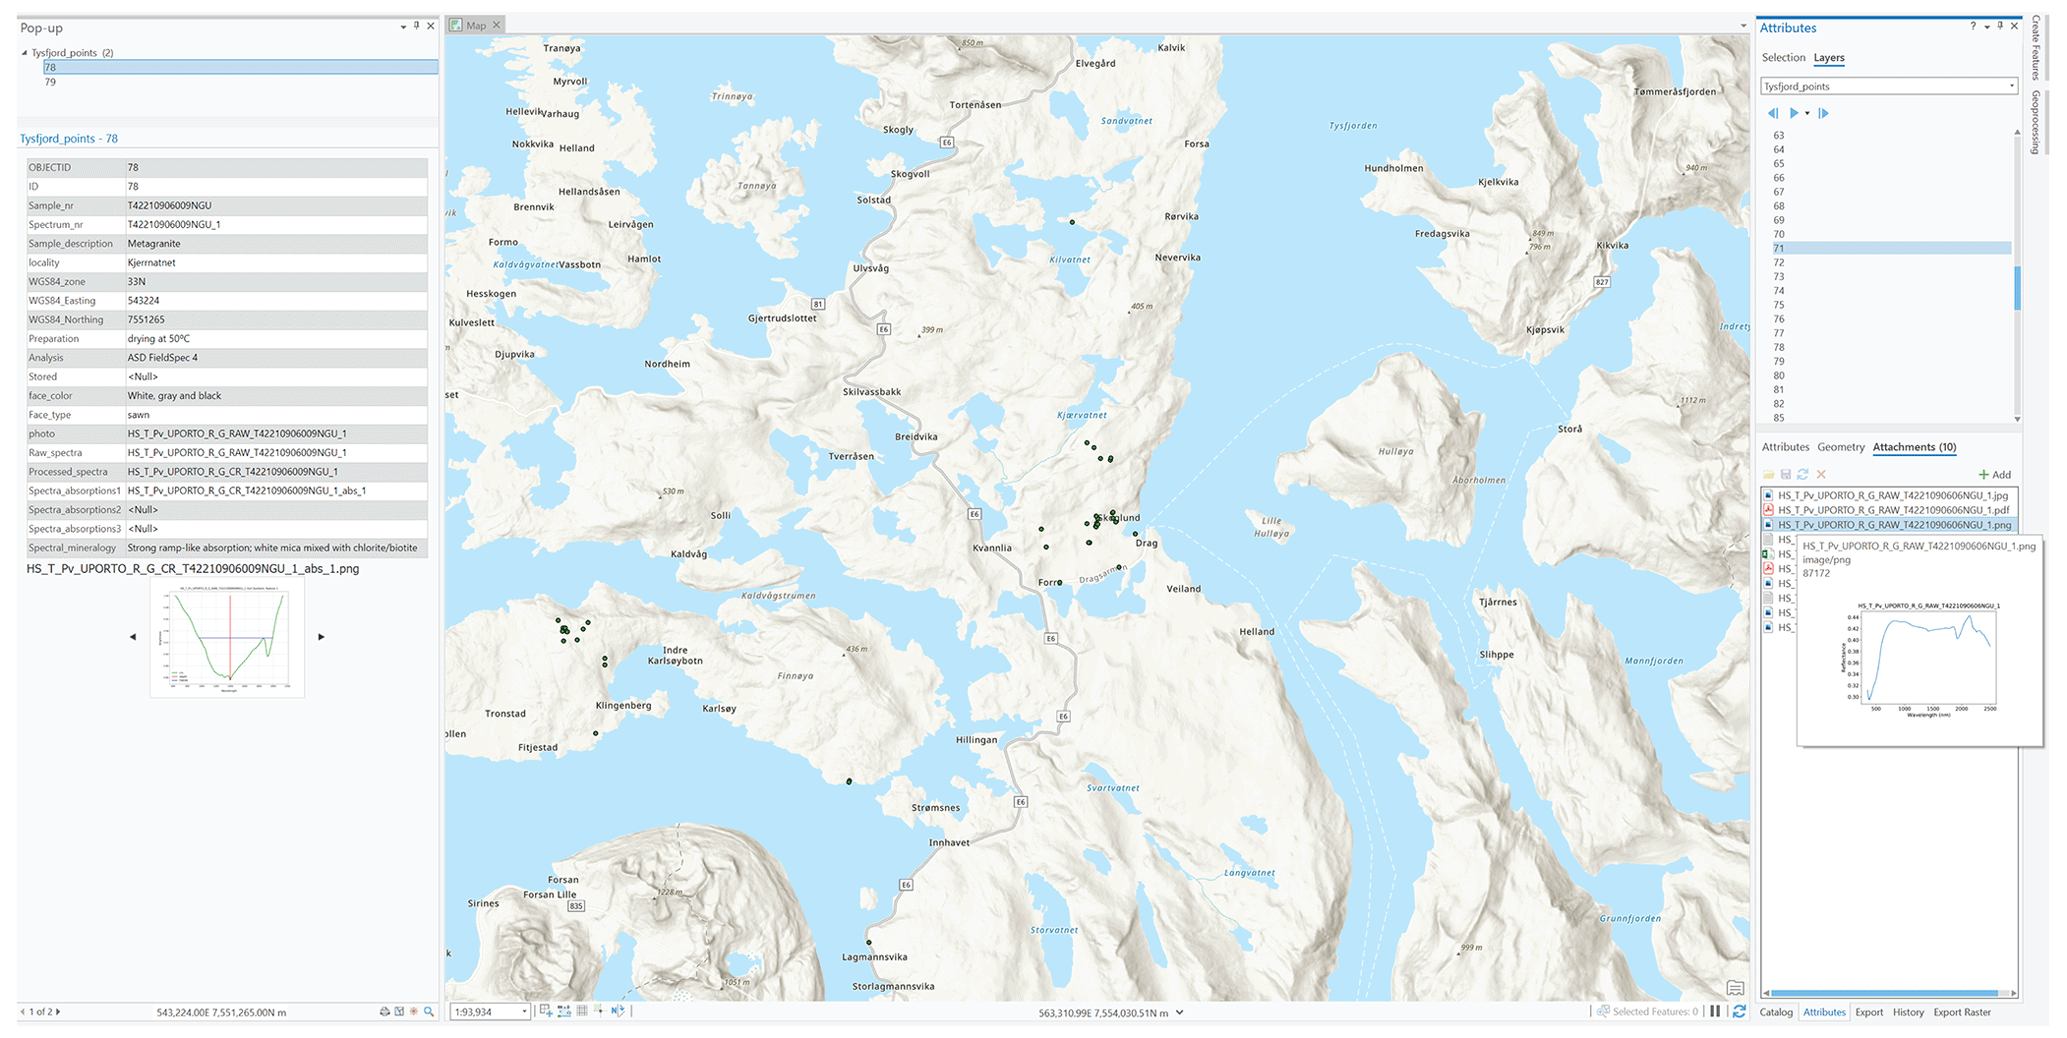
Figure 8Illustration of how to use the geodatabase in ArcGIS Pro, employing the Tysfjord demonstration site as an example: the “Explore” tool is shown in the left panel and the “Attributes” tab is presented in the right panel. The basemap was provided by Esri.
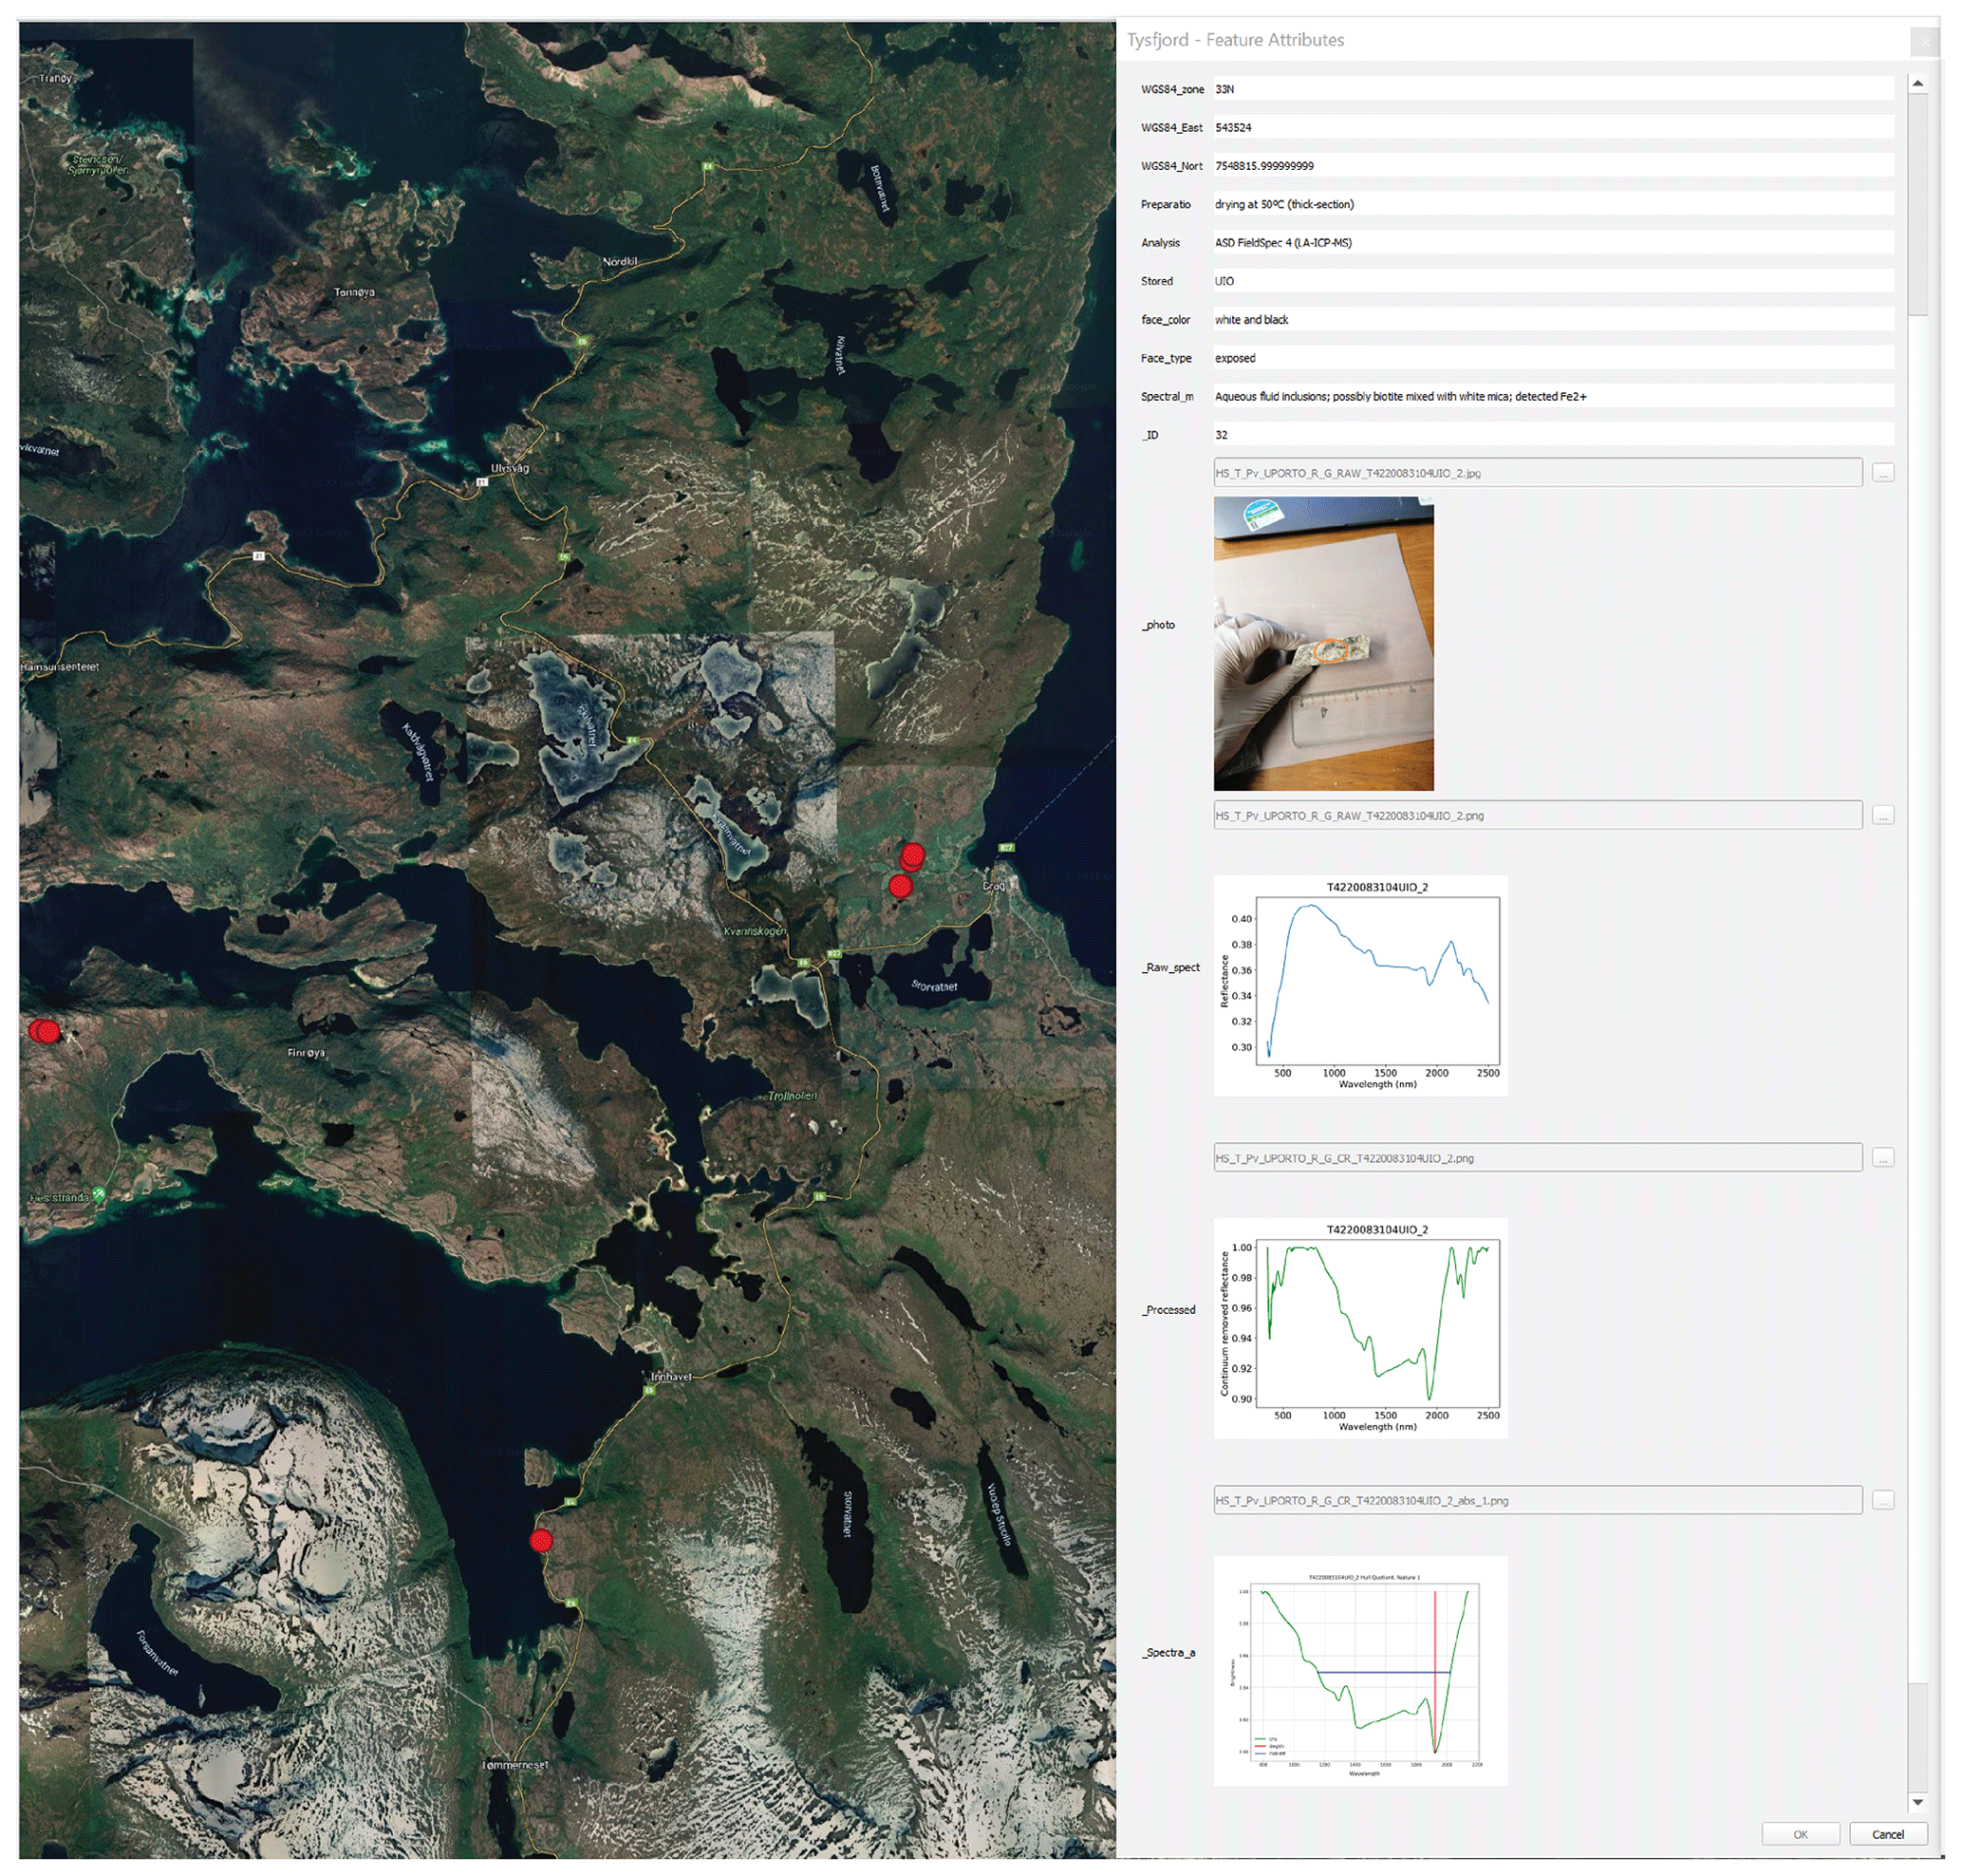
Figure 9Illustration of how to use the GeoPackage file in QGIS employing the Tysfjord demonstration site as an example: the “Identify” tool opens a pop-up window with the attachments (right panels). The basemap was provided by Google Earth (© Google Earth 2022).
Interoperability of the spectral database with a GIS environment is crucial for the successful exploitation of the spectral library and established dataset. Therefore, the spectral database is provided in two additional formats: a geodatabase file format (.gdb) and a GeoPackage file format (.gpk). The geodatabase file can be opened in ArcMap or ArcGIS Pro (Esri, Redlands, CA, USA), and the attachments are automatically previewed or opened because they are stored within the geodatabase (Fig. 8). The information from the spectral library, including attachments, can be easily previewed using (i) the “Explore” tool, which opens a pop-up window (left panel of Fig. 8), or (ii) by accessing the “Attributes” tab (right panel of Fig. 8). In this panel, the user can double-click each file to open them in the system default program according to the file type.
For QGIS users, the processing is manual; thus, the files are stored externally. For this approach, the GeoPackage file is provided along with a folder with related attachments. The QGIS user needs to relink the attachments in the folder with the paths stored in the columns of the layer's attribute table of the GeoPackage file. A tutorial for this latter step is also provided within the respective database level along with the GeoPackage file. After linking the files, the attachments can be previewed in QGIS (Fig. 9). The information from the spectral library, including attachments, can be easily previewed using the “Identify” tool that opens a pop-up window (right panels of Fig. 9). It should be noted that, unlike with the geodatabase, the GeoPackage file only allows for the preview of image files (e.g. .png or .jpeg.).
As the GREENPEG project is committed to an Open Research Data Pilot (ORDP), the spectral library is openly available on the Zenodo platform (https://www.zenodo.org/communities/greenpeg-project, last access: 7 June 2023) with the DOI identifier https://doi.org/10.5281/zenodo.6518318 (Cardoso-Fernandes et al., 2022b), following the GREENPEG ORDP (Reimer and Brönner, 2022). All formats (Microsoft Access, geodatabase, and GeoPackage) and individual spectral library files are stored as previously described for easy accessibility and use. File naming and metadata records follow the rules established in the Project Management Plan and Data Management Plan (GREENPEG D1.1, 2020; Reimer and Brönner, 2022). However, the spectral library version available on the Zenodo platform has had confidential and sensitive information redacted, as requested by GREENPEG's industry partners.
The original Python routine is available as supplementary material to the work of Cardoso-Fernandes et al. (2021b) (https://www.mdpi.com/2306-5729/6/3/33/s1).
The GREENPEG European spectral database presented in this work aims to add new data on the properties of pegmatites and their green raw materials as well as different host rocks, allowing for the evaluation of the potential of discriminating between the two (pegmatites and host rocks). The advantages and added value of the presented dataset reside in its European scale, allowing for the presentation of reference spectra for pegmatites of both NYF and LCT chemical types as well as representative samples from pegmatites with distinct genesis, mineralogy, structure, and host rocks.
This spectral database is also relevant because the results show that the spectral mineralogy identified does not necessarily match the minerals identified from hand specimen and optical microscopy observations. Such information is crucial for users trying to detect other pegmatites worldwide. The reported spectral mineral assemblages can also be of interest when considering resource estimation or ore processing due to the large amount of information provided for the distinct pegmatites sampled.
As this dataset is aimed to be used as a reference for pegmatite exploration at a global scale and distinct types of users are expected to benefit from its content, data usability and accessibility were a priority; thus, there was a focus on ensuring a multi-format database and clear interoperability with a GIS environment to fully exploit the data provided.
The reflectance spectra stored in the database can (i) enable the accurate identification and characterisation of pegmatites, thereby aiding in understanding their formation and evolution; (ii) facilitate comparative analysis of pegmatites from different locations, providing insights into regional variations due to the library's comprehensive collection of spectra; and (iii) be utilised for satellite image processing and image classification in the early stages of pegmatite exploration. Currently, the spectral library is being used for the processing of WorldView-3 images over the Tysfjord (Norway) case study.
Overall, this library empowers researchers and professionals to better understand, characterise, and map pegmatites, contributing to advancements in geology, mineralogy, and resource exploration.
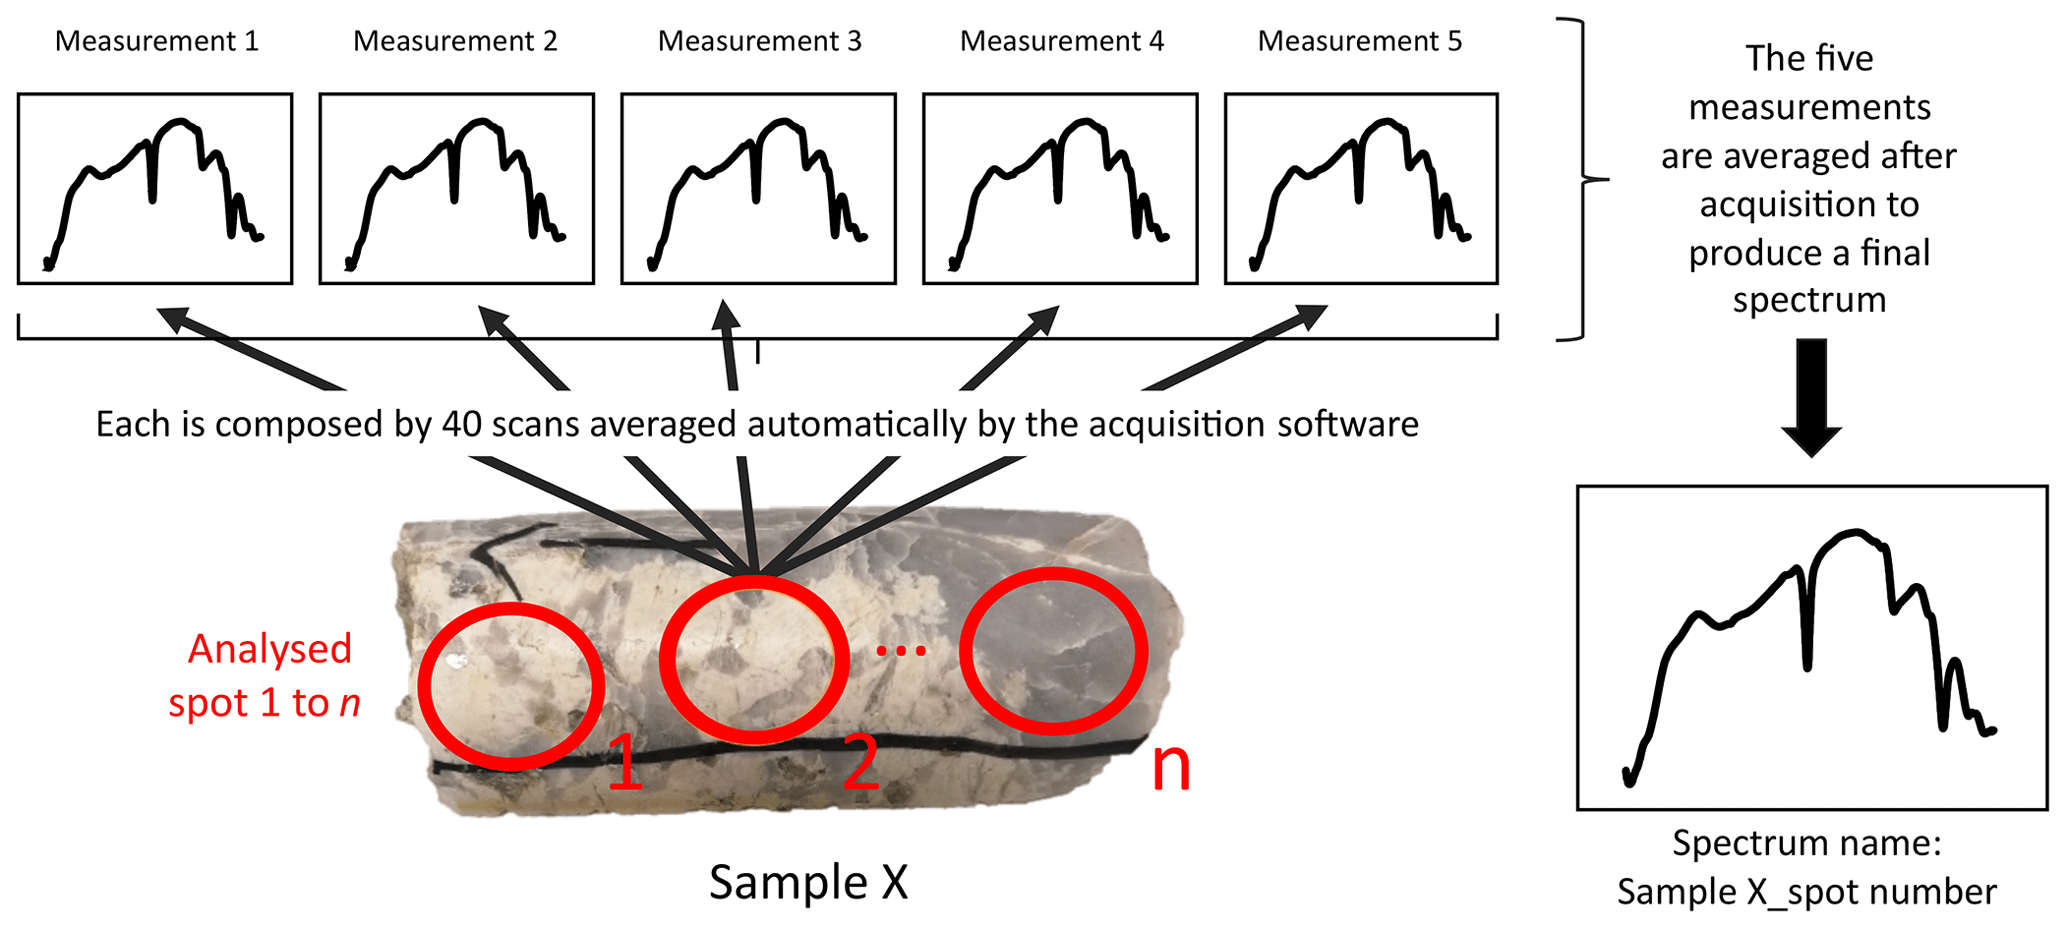
Figure A1Schematic representation of the spectra acquisition process. Several spots are analysed within one sample. For each spot, five measurements are done in a row. Each measurement is the automatic average of 40 scans. A final spectrum is created by averaging the five measurements, and the spectra name contains the sample name and the corresponding stop number to discriminate it from other spectra acquired in other spots within the same sample.
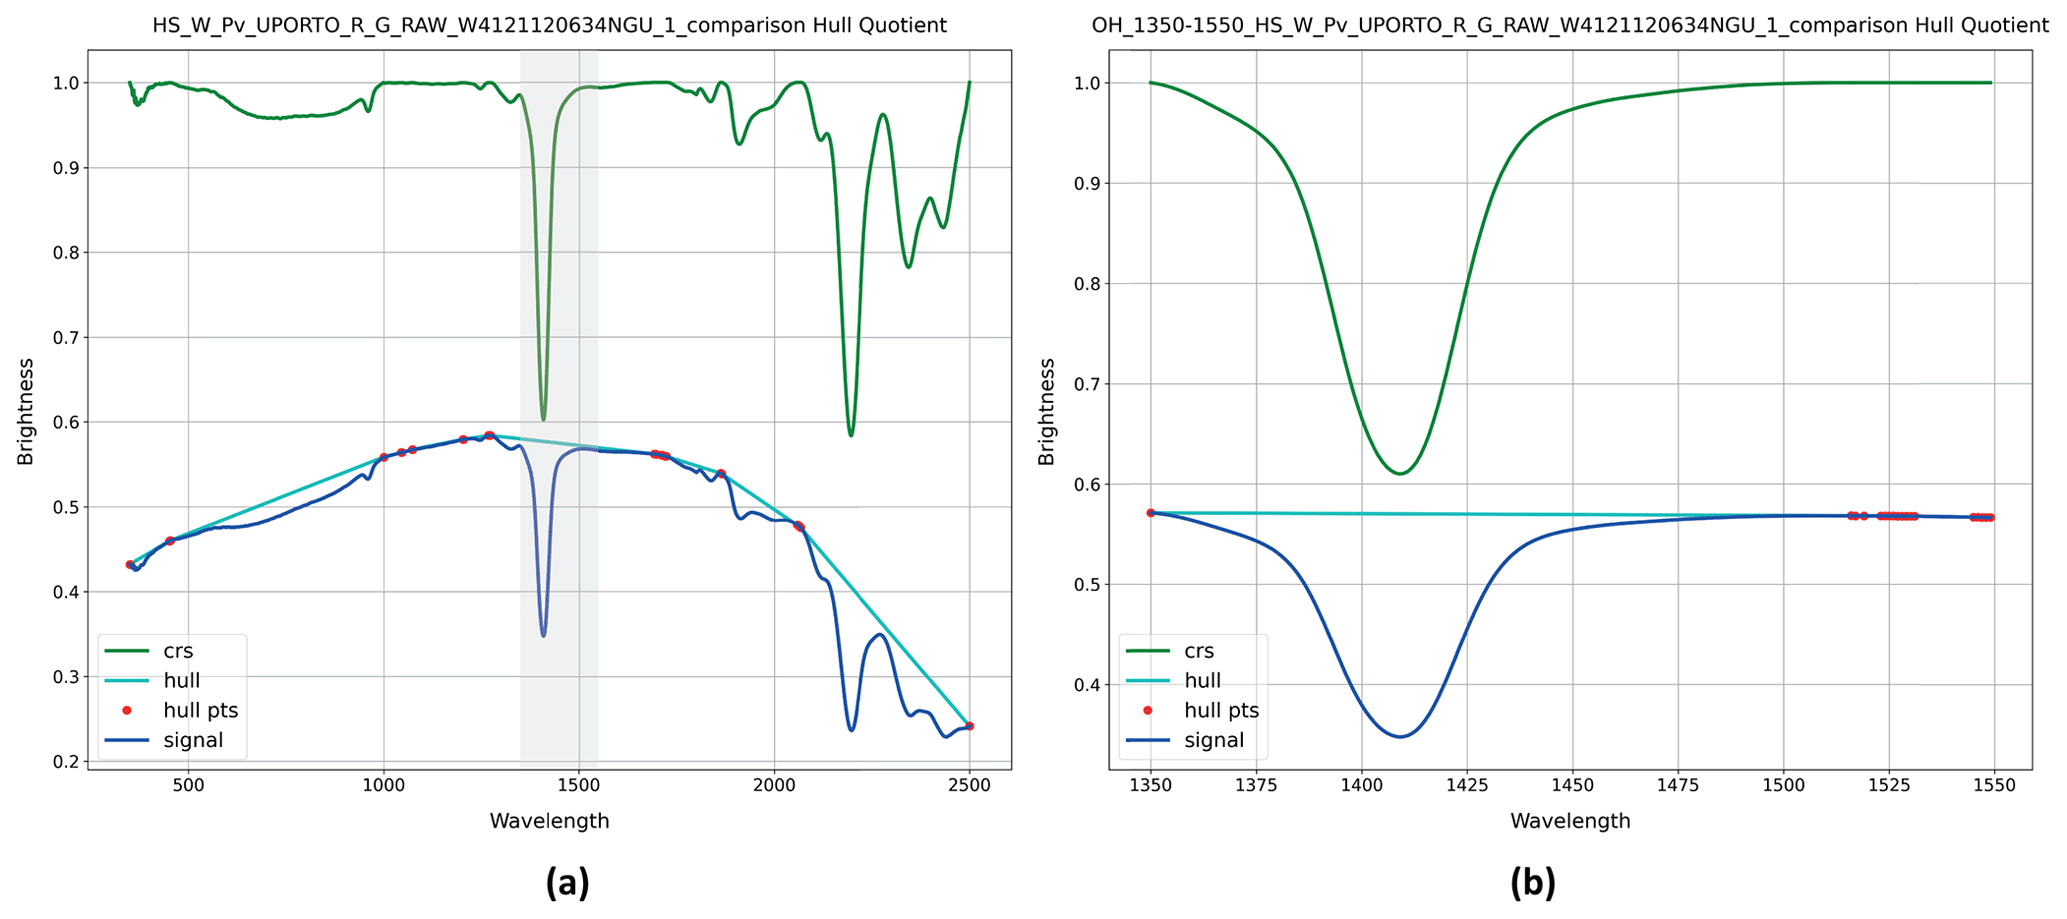
Figure A2Comparison between performing the continuum removal over the entire spectrum (a) and over specific parts of the spectrum (b). In this case, to extract the OH absorption shown in panel (b), the convex hull was fitted in the 1350–1550 nm range, corresponding to the grey rectangle in panel (a). crs represents continuum-removed spectra and pts denotes points.
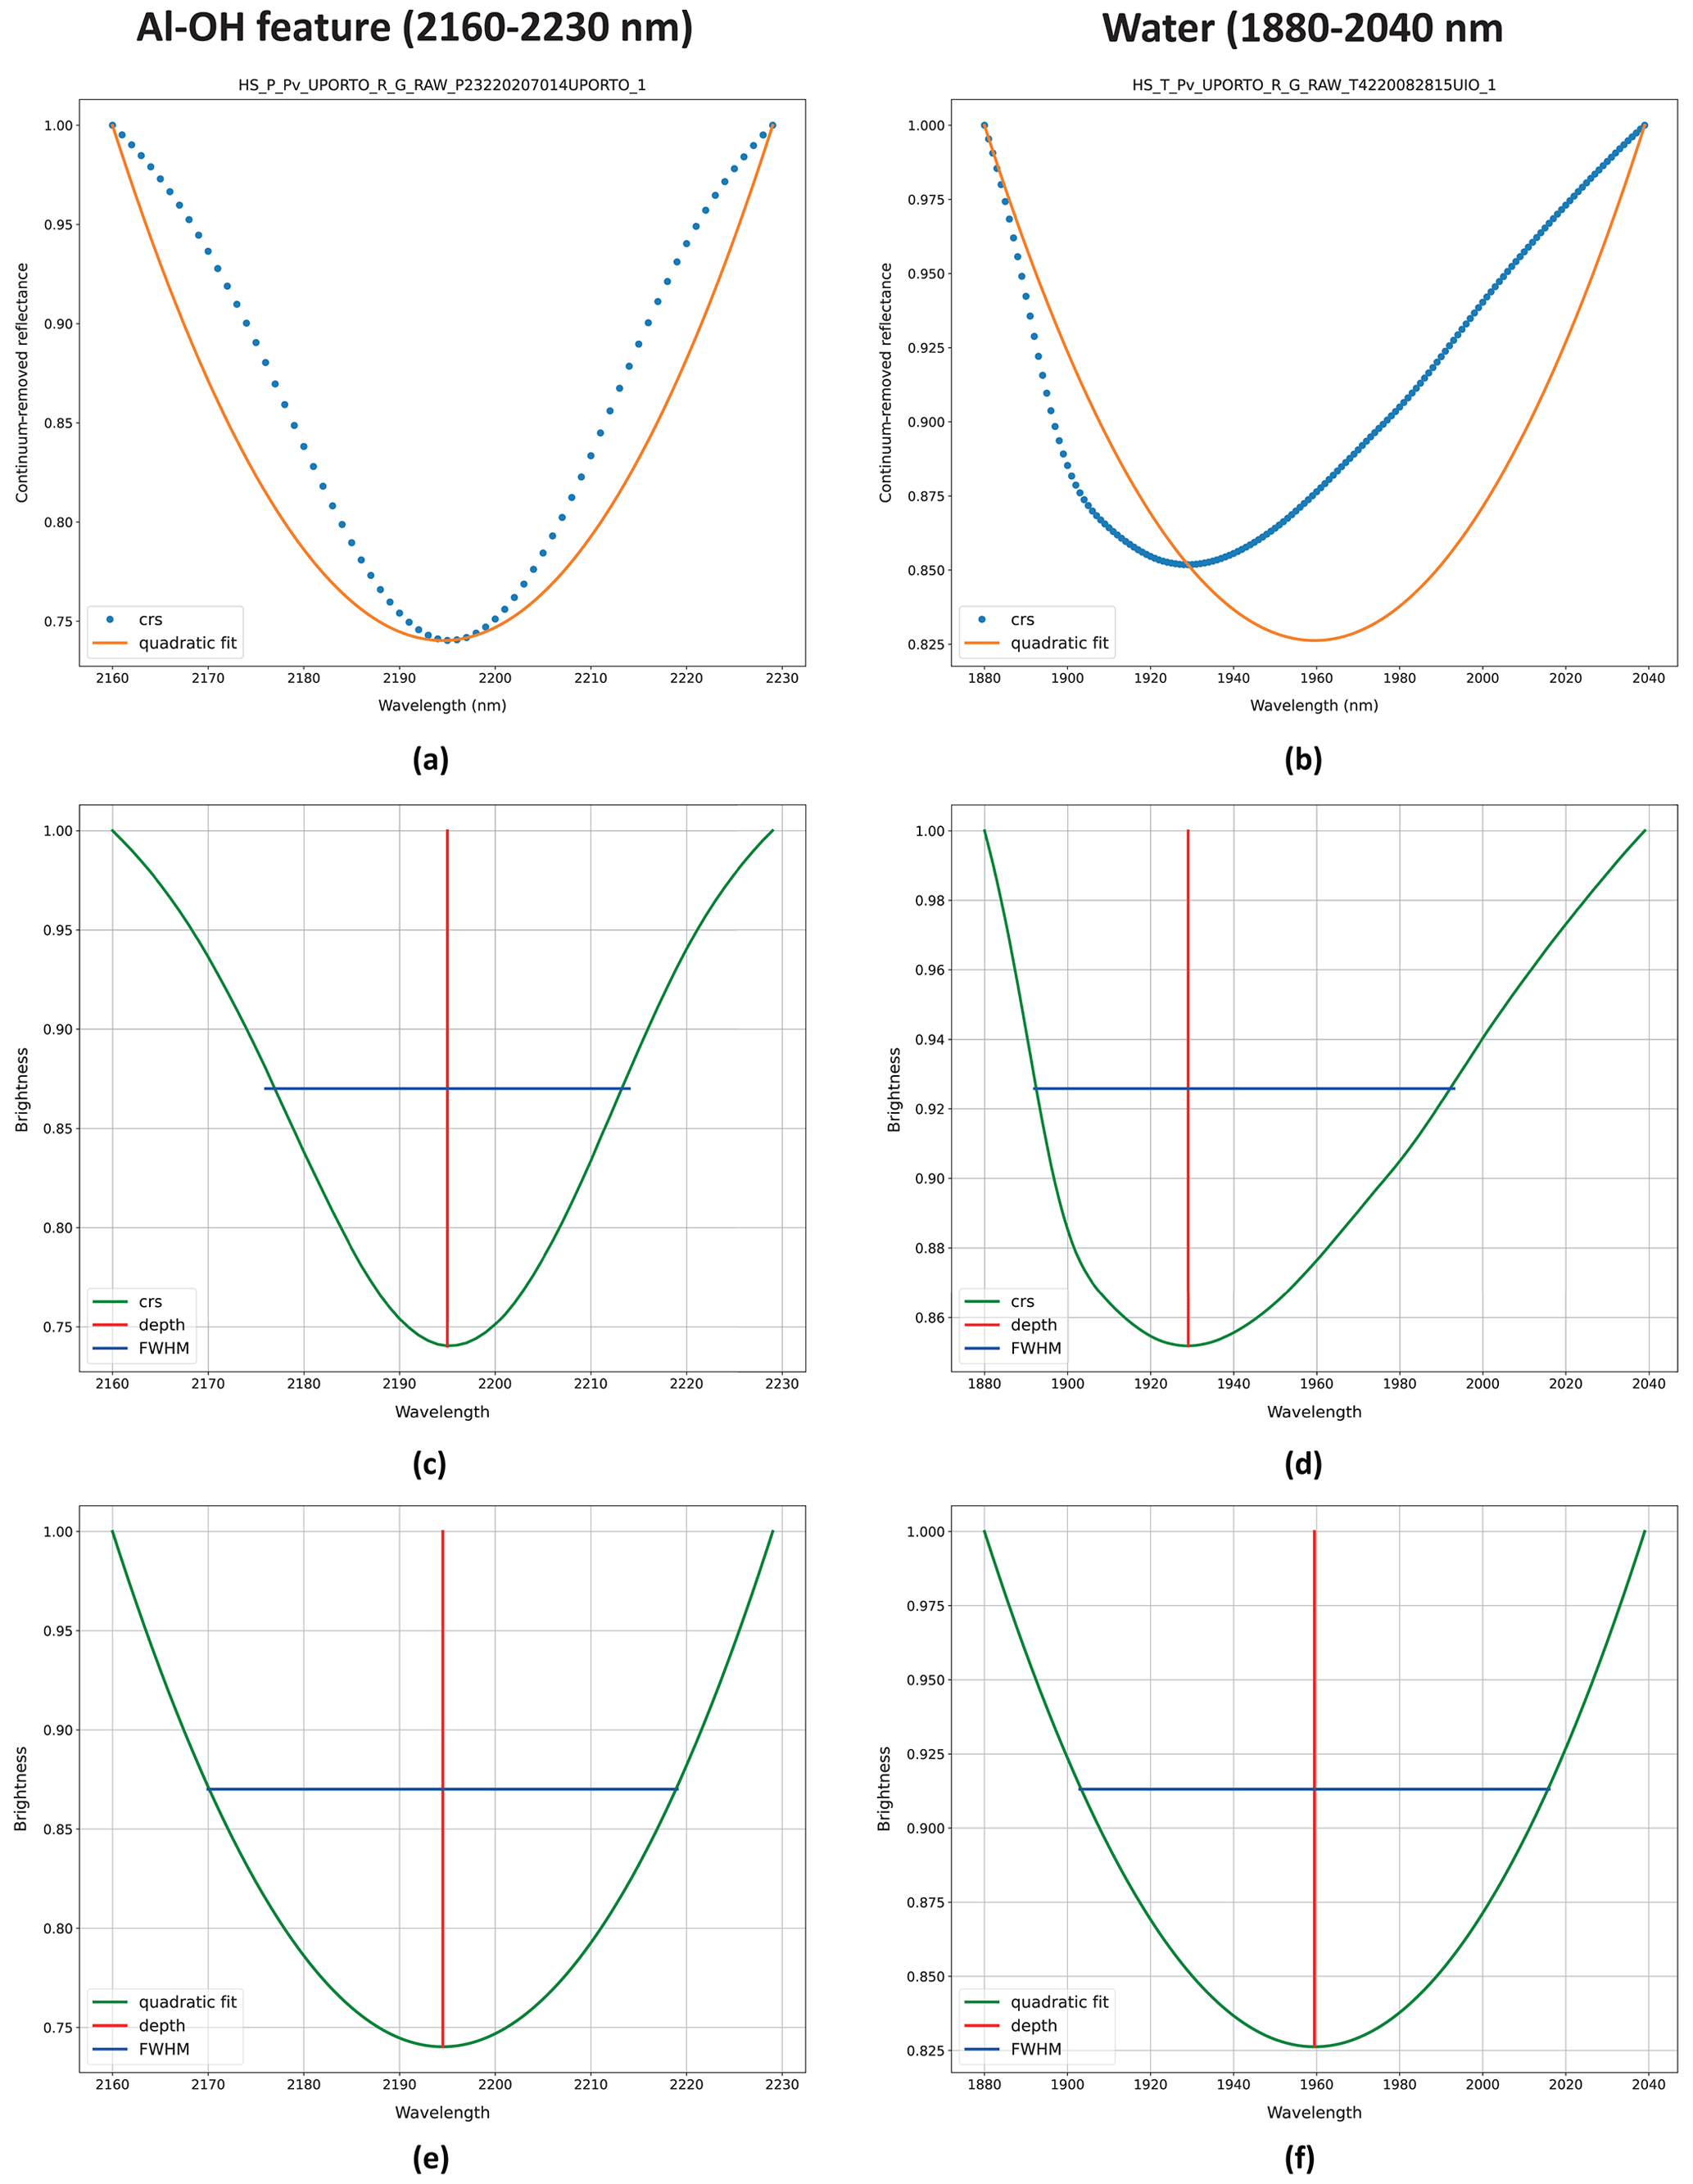
Figure A3Comparison of feature extraction (a, b) using the (c, d) continuum-removed spectra (crs) or the (e, f) quadratic-function fit; where the two methods show minimal (Al–OH feature) or accentuated (water feature) differences. FWHM represents the full width at half maximum.
Table A1Comparison of feature statistics when employing the continuum-removal or the quadratic-function fit methods for feature extraction (Fig. A3). FWHM represents the full width at half maximum.
Joana Cardoso-Fernandes, Ana C. Teodoro, Douglas Santos, Cátia Rodrigues de Almeida, and Alexandre Lima from the University of Porto, Portugal; Axel Müller and William Keyser from the University of Oslo, Norway; Kerstin Saalmann, Claudia Haase, and Marco Brönner from the Geological Survey of Norway, Norway; Julian Menuge from the University College Dublin, Ireland; Ralf Steiner from Geo Unterweissacher GmbH, Austria; and Encarnación Roda Robles, Jon Errandonea-Martin, and Idoia Garate-Olave from the Universidad del País Vasco-UPV/EHU, Spain.
Conceptualisation: JCF, ACT, and AL; data curation: JCF, DS, and CRdA; formal analysis: JCF; funding acquisition: AL; investigation: JCF, DS, CRdA, and AL; methodology: JCF and ACT; project administration: AL; resources: JCF, ACT, and AL; software: JCF; supervision: JCF, ACT, and AL; validation: JCF, ACT, and DS; visualisation: JCF; writing – original draft preparation: JCF; writing – review and editing: ACT, DS, CRdA, and AL.
The contact author has declared that none of the authors has any competing interests.
Publisher's note: Copernicus Publications remains neutral with regard to jurisdictional claims in published maps and institutional affiliations.
The authors thank European Lithium ECM in Austria and Blackstairs Lithium Limited in Ireland for providing samples from their drill cores. We are also grateful to Axel Müller, Julian Menuge, Kerstin Saalmann, Ralf Steiner, William Keyser, Encarnación Roda Robles, Claudia Haase, and Marco Brönner for collecting and/or sharing the samples.
This study has been funded by the European Commission's Horizon 2020 Research and Innovation programme (grant no. 869274) within the framework of the GREENPEG: New Exploration Tools for European Pegmatite Green-Tech Resources project. The Portuguese partners also received support from the Portuguese National Funds through the FCT – Fundação para a Ciência e a Tecnologia, I.P. (Portugal), project nos. UIDB/04683/2020 and UIDP/04683/2020 (Institute of Earth Sciences). Cátia Rodrigues de Almeida benefits from a PhD grant provided by FCT (grant no. PRT/BD/153518/2021).
This paper was edited by Birgit Heim and reviewed by two anonymous referees.
Asch, K.: IGME 5000: 1:5 Million International Geological Map of Europe and Adjacent Areas, Federal Institute for Geosciences and Natural Resources (BGR) Hannover, Germany, 2005.
Barros, R. and Menuge, J. F.: The Origin of Spodumene Pegmatites Associated with the Leinster Granite in Southeast Ireland, Can. Mineral., 54, 847–862, https://doi.org/10.3749/canmin.1600027, 2016.
Barros, R., Kaeter, D., Menuge, J. F., and Škoda, R.: Controls on chemical evolution and rare element enrichment in crystallising albite-spodumene pegmatite and wallrocks: Constraints from mineral chemistry, Lithos, 352–353, 105289, https://doi.org/10.1016/j.lithos.2019.105289, 2020.
Cardoso-Fernandes, J., Silva, J., Perrotta, M. M., Lima, A., Teodoro, A. C., Ribeiro, M. A., Dias, F., Barrès, O., Cauzid, J., and Roda-Robles, E.: Interpretation of the Reflectance Spectra of Lithium (Li) Minerals and Pegmatites: A Case Study for Mineralogical and Lithological Identification in the Fregeneda–Almendra Area, Remote Sens.-Basel, 13, 3688, https://doi.org/10.3390/rs13183688, 2021a.
Cardoso-Fernandes, J., Silva, J., Dias, F., Lima, A., Teodoro, A. C., Barrès, O., Cauzid, J., Perrotta, M., Roda-Robles, E., and Ribeiro, M. A.: Tools for Remote Exploration: A Lithium (Li) Dedicated Spectral Library of the Fregeneda–Almendra Aplite–Pegmatite Field, Data, 6, 33, https://doi.org/10.3390/data6030033, 2021b (code available at: https://www.mdpi.com/2306-5729/6/3/33/s1, last access: 11 July 2023).
Cardoso-Fernandes, J., Santos, D., Lima, A., and Teodoro, A. C.: Assessing the PRISMA Potential for Mineral Exploration to Vector Low-Grade Lithium Deposits, IGARSS 2022 – 2022 IEEE International Geoscience and Remote Sensing Symposium, Kuala Lumpur, Malaysia, 17–22 July 2022, 5985–5988, https://doi.org/10.1109/IGARSS46834.2022.9884607, 2022a.
Cardoso-Fernandes, J., Teodoro, A. C., Santos, D., Rodrigues de Almeida, C., and Lima, A.: Spectral Library of European Pegmatites, Pegmatite Minerals and Pegmatite Host-Rocks – The Greenpeg Database, Zenodo [data set], https://doi.org/10.5281/zenodo.6518318, 2022b.
Černý, P. and Ercit, T. S.: Classification of granitic pegmatites revisited, Can. Mineral., 43, 2005–2026, 2005.
Chabrillat, S., Segl, K., Foerster, S., Brell, M., Guanter, L., Schickling, A., Storch, T., Honold, H. P., and Fischer, S.: EnMAP Pre-Launch and Start Phase: Mission Update, IGARSS 2022 - 2022 IEEE International Geoscience and Remote Sensing Symposium, Kuala Lumpur, Malaysia, 17–22 July 2022, 5000–5003, https://doi.org/10.1109/IGARSS46834.2022.9884773, 2022.
Clark, R. N.: Spectroscopy of rocks and minerals and principles of spectroscopy, Chapter 1 in: Remote Sensing for the Earth Sciences: Manual of Remote Sensing, 3rd edn., edited by: Ryerson, R. A., 3, John Wiley & Sons, Inc., New York, USA, ISBN 978-0-471-29405-4, 1999.
Clark, R. N., King, T. V. V., Klejwa, M., Swayze, G. A., and Vergo, N.: High spectral resolution reflectance spectroscopy of minerals, J. Geophys. Res.-Sol. Ea., 95, 12653–12680, https://doi.org/10.1029/JB095iB08p12653, 1990.
Clark, R. N., Swayze, G. A., Wise, R., Livo, K. E., Hoefen, T. M., Kokaly, R. F., and Sutley, S. J.: USGS digital spectral library splib05a, U.S. Geological Survey, Open File Report 03-395, https://pubs.usgs.gov/of/2003/ofr-03-395/ (last access: 8 January 2021), 2003.
Errandonea-Martin, J., Garate-Olave, I., Roda-Robles, E., Cardoso-Fernandes, J., Lima, A., Ribeiro, M. d. A., and Teodoro, A. C.: Metasomatic effect of Li-bearing aplite-pegmatites on psammitic and pelitic metasediments: Geochemical constraints on critical raw material exploration at the Fregeneda–Almendra Pegmatite Field (Spain and Portugal), Ore Geol. Rev., 150, 105155, https://doi.org/10.1016/j.oregeorev.2022.105155, 2022.
Fabre, C., Ourti, N. E., Mercadier, J., Cardoso-Fernandes, J., Dias, F., Perrotta, M., Koerting, F., Lima, A., Kaestner, F., Koellner, N., Linnen, R., Benn, D., Martins, T., and Cauzid, J.: Analyses of Li-Rich Minerals Using Handheld LIBS Tool, Data, 6, 68, https://doi.org/10.3390/data6060068, 2021.
Göd, R.: The spodumene deposit at “Weinebene”, Koralpe, Austria, Miner. Deposita, 24, 270–278, https://doi.org/10.1007/BF00206391, 1989.
Gourcerol, B., Gloaguen, E., Melleton, J., Tuduri, J., and Galiegue, X.: Re-assessing the European lithium resource potential – A review of hard-rock resources and metallogeny, Ore Geol. Rev., 109, 494–519, https://doi.org/10.1016/j.oregeorev.2019.04.015, 2019.
GREENPEG D1.1: Deliverable 1.1; Project Management Plan – July 2020, GREENPEG Horizon2020 GA 869274, 47, https://cordis.europa.eu/project/id/869274/results (last access: 13 July 2023), 2020.
GREENPEG D2.3: Deliverable 2.3; New algorithms for satellite image processing, GREENPEG Horizon2020 GA 869274, 29, https://cordis.europa.eu/project/id/869274/results (last access: 13 July 2023), 2021.
Guarini, R., Loizzo, R., Facchinetti, C., Longo, F., Ponticelli, B., Faraci, M., Dami, M., Cosi, M., Amoruso, L., De Pasquale, V., Taggio, N., Santoro, F., Colandrea, P., Miotti, E., and Di Nicolantonio, W.: Prisma Hyperspectral Mission Products, IGARSS 2018 – 2018 IEEE International Geoscience and Remote Sensing Symposium, Valencia, Spain, 22–27 July 2018, 179–182, https://doi.org/10.1109/IGARSS.2018.8517785, 2018.
Haase, C. and Pohl, C. M.: Petrophysical Database for European Pegmatite Exploration—EuroPeg, Minerals, 12, 1498, https://doi.org/10.3390/min12121498, 2022.
Haase, C., Brönner, M., Pohl, C. M., Osinska, M., and Gellein, J.: EuroPeg_PetroDB: A petrophysical database of European pegmatite ores and wall rocks, Zenodo [data set], https://doi.org/10.5281/ZENODO.6497985, 2022.
Hunt, G. R.: Spectral signatures of particulate minerals in the visible and near infrared, Geophysics, 42, 501–513, https://doi.org/10.1190/1.1440721, 1977.
Hunt, G. R. and Ashley, R. P.: Spectra of altered rocks in the visible and near infrared, Econ. Geol., 74, 1613–1629, https://doi.org/10.2113/gsecongeo.74.7.1613, 1979.
Knoll, T., Schuster, R., Huet, B., Mali, H., Onuk, P., Horschinegg, M., Ertl, A., and Giester, G.: Spodumene Pegmatites and Related Leucogranites from the AustroAlpine Unit (Eastern Alps, Central Europe): Field Relations, Petrography, Geochemistry, and Geochronology, Can. Mineral., 56, 489–528, https://doi.org/10.3749/canmin.1700092, 2018.
Kokaly, R. F.: View_SPECPR: Software for Plotting Spectra (Installation Manual and User's Guide, Version 1.2), Report 2008-1183, U.S. Geological Survey, https://doi.org/10.3133/ofr20081183, 2008.
Kokaly, R. F.: PRISM: Processing routines in IDL for spectroscopic measurements (installation manual and user's guide, version 1.0), Reston, VA, Report 2011-1155, U.S. Geological Survey, https://doi.org/10.3133/ofr20111155, 2011.
Kokaly, R. F., Clark, R. N., Swayze, G. A., Livo, K. E., Hoefen, T. M., Pearson, N. C., Wise, R. A., Benzel, W. M., Lowers, H. A., Driscoll, R. L., and Klein, A. J.: USGS Spectral Library Version 7, Reston, VA, Report 1035, 68, U.S. Geological Survey, https://doi.org/10.3133/ds1035, 2017.
Lazzeri, G., Frodella, W., Rossi, G., and Moretti, S.: Multitemporal Mapping of Post-Fire Land Cover Using Multiplatform PRISMA Hyperspectral and Sentinel-UAV Multispectral Data: Insights from Case Studies in Portugal and Italy, Sensors, 21, 3982, https://doi.org/10.3390/s21123982, 2021.
Lima, A.: Estrutura, mineralogia e génese dos filões aplitopegmatíticos com espodumena da região do Barroso-Alvão, PhD thesis, Universidade do Porto, Porto, Portugal, 270 pp., 2000.
Martins, T.: Multidisciplinary study of pegmatites and associated Li and Sn–Nb–Ta mineralisation from the Barroso-Alvão region, PhD thesis, Faculdade de Ciências da Universidade do Porto, Porto, Portugal, 2009.
Möller, V. and Williams-Jones, A. E.: A hyperspectral study (V-NIR-SWIR) of the Nechalacho REE–Nb–Zr deposit, Canada, J. Geochem. Explor., 188, 194–215, https://doi.org/10.1016/j.gexplo.2018.01.011, 2018.
Müller, A., Husdal, T., Sunde, Ø., Friis, H., Andersen, T., Johnsen, T., Werner, R., Thoresen, Ø., and Olerud, S.: Norwegian Pegmatites I: Tysfjord-Hamarøy, Evje-Iveland, Langesundsfjord. Geological Guides 6-2017, Norsk Geologisk Forening, Trondheim, Norway, 2017.
Müller, A., Reimer, W., Wall, F., Williamson, B., Menuge, J., Brönner, M., Haase, C., Brauch, K., Pohl, C., Lima, A., Teodoro, A., Cardoso-Fernandes, J., Roda-Robles, E., Harrop, J., Smith, K., Wanke, D., Unterweissacher, T., Hopfner, M., Schröder, M., Clifford, B., Moutela, P., Lloret, C., Ranza, L., and Rausa, A.: GREENPEG – Exploration for pegmatite minerals to feed the energy transition: First steps towards the Green Stone Age, Geological Society, London, Special Publications, 526, SP526-2021-2189, https://doi.org/10.1144/SP526-2021-189, 2022a.
Müller, A., Romer, R. L., Augland, L. E., Zhou, H., Rosing-Schow, N., Spratt, J., and Husdal, T.: Two-stage regional rare-element pegmatite formation at Tysfjord, Norway: implications for the timing of late Svecofennian and late Caledonian high-temperature events, Int. J. Earth Sci., 111, 987–1007, https://doi.org/10.1007/s00531-022-02166-5, 2022b.
Neiva, A. M. R. and Ramos, J. M. F.: Geochemistry of granitic aplite-pegmatite sills and petrogenetic links with granites, Guarda-Belmonte area, central Portugal, Eur. J. Miner., 22, 837–854, https://doi.org/10.1127/0935-1221/2010/0022-2072, 2010.
Nikolakopoulos, K., Skianis, G. A., and Vaiopoulos, D.: EO-1 Hyperion and ALI bands simulation to Landat 7 ETM+ bands and comparison, Proc. SPIE 6742, Remote Sensing for Agriculture, Ecosystems, and Hydrology IX, 67420K, Florence, Italy, https://doi.org/10.1117/12.737941, 2007.
Nikolakopoulos, K. G. and Papoulis, D. A.: Preliminary Comparison between Landsat-8 OLI and Sentinel-2 MSI for Geological Applications, Living Planet Symposium, Prague, Czech Republic, 9–13 May, 203, 2016.
Pontual, S., Merry, N. J., and Gamson, P.: Spectral interpretation field manual. GMEX Spectral analysis guides for mineral exploration, 3rd, AusSpec International Ltd., Victoria, 2008.
Reimer, W. and Brönner, M.: GREENPEG Deliverable D8.1_Communication Plan, Project Identity kit and Data Management Plan (Version v1), Zenodo, https://doi.org/10.5281/zenodo.6411903, 2022.
Roda-Robles, E., Pesquera, A., Velasco, F., and Fontan, F.: The granitic pegmatites of the Fregeneda area (Salamanca, Spain): characteristics and petrogenesis, Mineral. Mag., 63, 535–558, 1999.
Roda-Robles, E., Villaseca, C., Pesquera, A., Gil-Crespo, P. P., Vieira, R., Lima, A., and Garate-Olave, I.: Petrogenetic relationships between Variscan granitoids and Li-(F-P)-rich aplite-pegmatites in the Central Iberian Zone: Geological and geochemical constraints and implications for other regions from the European Variscides, Ore Geol. Rev., 95, 408–430, https://doi.org/10.1016/j.oregeorev.2018.02.027, 2018.
Roda-Robles, E., Gil-Crespo, P. P., Pesquera, A., Lima, A., Garate-Olave, I., Merino-Martínez, E., Cardoso-Fernandes, J., and Errandonea-Martin, J.: Compositional Variations in Apatite and Petrogenetic Significance: Examples from Peraluminous Granites and Related Pegmatites and Hydrothermal Veins from the Central Iberian Zone (Spain and Portugal), Minerals, 12, 1401, https://doi.org/10.3390/min12111401, 2022.
Rowan, L. C., Kingston, M. J., and Crowley, J. K.: Spectral reflectance of carbonatites and related alkalic igneous rocks; selected samples from four North American localities, Econ. Geol., 81, 857–871, https://doi.org/10.2113/gsecongeo.81.4.857, 1986.
Santos, D., Cardoso-Fernandes, J., Lima, A., and Teodoro, A. C.: The potential of spectral unmixing method applied to PRISMA hyperspectral images in the identification of Li minerals: an evaluation for prospecting purposes, SPIE Remote Sensing, Earth Resources and Environmental Remote Sensing/GIS Applications XIII, Berlin, Germany, 26 October 2022, https://doi.org/10.1117/12.2636034, 2022a.
Santos, D., Cardoso-Fernandes, J., Lima, A., Müller, A., Brönner, M., and Teodoro, A. C.: Spectral Analysis to Improve Inputs to Random Forest and other Boosted Ensemble Tree-Based Algorithms for Detecting NYF Pegmatites in Tysfjord, Norway, Remote Sens.-Basel, 14, 3532, https://doi.org/10.3390/rs14153532, 2022b.
Schodlok, M. C., Frei, M., and Segl, K.: Implications of new hyperspectral satellites for raw materials exploration, Mineral Economics, 35, 495–502, https://doi.org/10.1007/s13563-022-00327-1, 2022.
Spatz, D. M.: Remote sensing characteristics of the sediment- and volcanic-hosted precious metal systems: Imagery selection for exploration and development, Int. J. Remote Sens., 18, 1413–1438, https://doi.org/10.1080/014311697218205, 1997.
Teodoro, A. C., Santos, D., Cardoso-Fernandes, J., Lima, A., and Brönner, M.: Identification of pegmatite bodies, at a province scale, using machine learning algorithms: preliminary results, Proc. SPIE 11863, Earth Resources and Environmental Remote Sensing/GIS Applications XII, SPIE Remote Sensing, online, 12 September 2021, https://doi.org/10.1117/12.2599600, 2021.
Therien, C.: Welcome to the PySptools Documentation, https://pysptools.sourceforge.io/ (last access: 22 July 2020), 2013.
Vangi, E., D'Amico, G., Francini, S., Giannetti, F., Lasserre, B., Marchetti, M., and Chirici, G.: The New Hyperspectral Satellite PRISMA: Imagery for Forest Types Discrimination, Sensors, 21, 1182, 2021.
Vieira, R.: Aplitopegmatitos com elementos raros da região entre Almendra (V. N. de Foz Côa) e Barca d'Alva (Figueira de Castelo Rodrigo). Campo aplitopegmatítico da Fregeneda–Almendra, PhD thesis, Faculdade de Ciências da Universidade do Porto, Porto, Portugal, XXVI, 273 pp., 2010.
Vieira, R., Roda-Robles, E. n., Pesquera, A., and Lima, A.: Chemical variation and significance of micas from the Fregeneda-Almendra pegmatitic field (Central-Iberian Zone, Spain and Portugal), Am. Mineral., 96, 637–645, https://doi.org/10.2138/am.2011.3584, 2011.
White, W. B.: Diffuse-Reflectance Spectra of Rare-Earth Oxides, Appl. Spectrosc., 21, 167–171, https://doi.org/10.1366/000370267774385173, 1967.
Wocher, M., Berger, K., Verrelst, J., and Hank, T.: Retrieval of carbon content and biomass from hyperspectral imagery over cultivated areas, ISPRS J. Photogramm., 193, 104–114, https://doi.org/10.1016/j.isprsjprs.2022.09.003, 2022.
- Abstract
- Introduction
- Spectral library formats, structure, and use
- Representative spectra of the demonstration sites
- Interoperability with GIS
- Data availability
- Code availability
- Conclusions
- Appendix A
- Team list
- Author contributions
- Competing interests
- Disclaimer
- Acknowledgements
- Financial support
- Review statement
- References