the Creative Commons Attribution 4.0 License.
the Creative Commons Attribution 4.0 License.
 | 12 Jul 2023
A global database of historic glacier lake outburst floods
Natalie Lützow
Georg Veh
Oliver Korup
Ongoing atmospheric warming has accelerated glacier mass loss in many mountain regions worldwide. Glacier lakes trap part of the glacial meltwater and have increased by about 50 % in number and area since the 1990s. Some of these glacier lakes may empty catastrophically and pose hazards to mountain communities, infrastructure, and habitats. Such glacier lake outburst floods (GLOFs) have caused millions of dollars of damages and fatalities and are one of many concerns about future changes in the magnitude, frequency, and impacts of processes of a shrinking mountain cryosphere. Consistently compiled inventories are thus vital to assess regional and local trends in GLOF occurrence, hazard, and risk. To this end, we studied 769 literature and internet sources and developed a standardized database with 57 attributes that describe and quantify the location, dam type, size, timing, and impacts of GLOFs in nine glaciated mountain regions. Our GLOF inventory also includes details about the lake area before and after the outburst for 391 cases that we manually mapped from optical satellite images since 1984. In total, we compiled 3151 reported GLOFs that occurred in 27 countries between 850 and 2022 CE. Most GLOFs have been reported in NW North America (26 %) and Iceland (19 %). However, the reporting density in our inventory varies. During the 20th century alone, the number of yearly documented GLOFs increased 6-fold. Less than one-quarter of all reported cases feature hydrodynamic characteristics such as flood peak discharge or volume or estimates of loss and damage. Our inventory more than doubles the number of reported GLOFs in a previous global inventory, though gaps in attributes remain. Our data collection process emphasizes the support of local experts in contributing previously undocumented cases, and we recommend applying protocols when reporting new cases. The global database on historic GLOFs is archived at https://doi.org/10.5281/zenodo.7330344 (Lützow and Veh, 2023a) and regularly updated at http://glofs.geoecology.uni-potsdam.de/ (last access: 9 May 2023).
- Article
(4680 KB) - Full-text XML
- BibTeX
- EndNote


Population growth and socio-economic development have increased the exposure of people and infrastructure to natural hazards in high mountain areas (Hock et al., 2019). These regions host glaciers and permafrost and have been highly sensitive to rapidly rising air temperatures in the past decades (Koven et al., 2013; Hugonnet et al., 2021). While the resulting losses of ice are one symptom of a dwindling cryosphere, further consequences include changes to stream flow seasonality, decreased freshwater availability and hydropower potential, and potential socio-economic tension along rivers originating from glaciated high mountains (Kääb et al., 2005; Hock et al., 2019; Pritchard, 2019). Fed by ongoing glacier retreat, large masses of meltwater can be temporarily trapped in deglaciated depressions or at the margins of glaciers. Between 1990 and 2018, global glacier lake volume increased by around 48 % to 156.5 km3, and lake abundance increased by 53 % (Shugar et al., 2020).
Stable and long-lived lakes can become viable resources for drinking water and irrigation (Farinotti et al., 2019). However, some lakes have unstable dams and may pose hazards to downstream communities if they fail suddenly (Lütschg, 1915; Mathews and Clague, 1993; Clague and Evans, 2000). Hundreds of such glacier lake outburst floods (GLOFs) have been observed in glaciated mountain regions in the past centuries (Fig. 1). GLOFs are sudden pulses of water and debris from a meltwater body and can disturb river reaches tens to hundreds of kilometres downstream from their sources with high damage potential (Kääb et al., 2005; Carrivick and Tweed, 2016; Hock et al., 2019). The high hydraulic head of the flood source promotes high flow velocities and peak discharges, in many cases similar to or higher than meteorological floods (Cenderelli and Wohl, 2001; Emmer, 2017; Jacquet et al., 2017; Cook et al., 2018). Ecologic and geomorphic disturbances from GLOFs range from eroded vegetation along riverbanks to alluvial fans and deltas with thick deposits of woody debris and sediments, destroyed or debris-covered forests, and impacts on aquatic wildlife, for example, by killing fish populations or hindering salmon spawning (Cenderelli and Wohl, 2001; Otto, 2019; Pitman et al., 2021; Geertsema et al., 2022). In populated areas, GLOFs can destroy houses, roads, and bridges as well as farmland and livestock, causing millions of dollars of losses for the local economy and property (Carrivick and Tweed, 2016). Owing to their short warning times and limited monitoring capabilities, GLOFs have caused many fatalities, such as during the failure of Cirenmaco (Zhangzangbo) lake in 1981. This particular outburst flood alone killed more than 200 people (Xu, 1988; Shrestha et al., 2010; Wang et al., 2018).
Despite growing evidence of more and larger historic glacier lakes, estimates of whether GLOF hazard and risk have increased commensurately remain controversial (Richardson and Reynolds, 2000; Harrison et al., 2018; Nie et al., 2018; Veh et al., 2020; Bazai et al., 2021; Stuart-Smith et al., 2021; Compagno et al., 2022). We find that GLOF reporting has been inconsistent across different countries and study regions without any standardized procedures (Carrivick and Tweed, 2016). Information on GLOF timing, magnitude, and impacts varies between case studies, reflecting the different focus on hydrodynamic flood characteristics (Osti and Egashira, 2009), geomorphic changes (Tomczyk et al., 2020), or societal impacts (Carey, 2005). The few available regional inventories also cover different time intervals. Hence, appraisals of regional GLOF trends remain challenging. Scientists can draw on only two published global catalogues by Carrivick and Tweed (2016) and Harrison et al. (2018), and the latter focuses on GLOFs from moraine-dammed lakes only. Both studies discussed issues of incomplete, non-systematic GLOF monitoring and reporting and called for standardized procedures and data sharing. Here we meet this demand for better documentation and pave the way to objectively monitor GLOF occurrence, hazard, and risk (Kääb et al., 2005; Emmer et al., 2016; Emmer, 2017). Our goal is to present a global database that covers the largest number of reported GLOFs consistently and comprehensively.
2.1 Data sources
We reviewed a total of 769 resources to collect information on historic (i.e. documented) GLOFs in nine major glaciated regions: the Andes (i.e. Argentina, Bolivia, Chile, and Peru), NW North America (i.e. western Canada and the western USA), Greenland, Iceland, Scandinavia (i.e. Norway and Sweden), the European Alps (i.e. Switzerland, Italy, and Austria), the Caucasus (i.e. Georgia and Russia), High Mountain Asia (HMA; i.e. Bhutan, China, India, Kazakhstan, Kyrgyzstan, Tajikistan, Afghanistan, Nepal, and Pakistan), and New Zealand. The Caucasus and New Zealand had few reported cases and are thus part of the region “Other” in the following. Our study regions are similar in extent to those of the major regions in the Randolph Glacier Inventory Version 6.0 (RGI; RGI Consortium, 2017, http://www.glims.org/RGI/, last access: 29 October 2022) (Fig. 1).
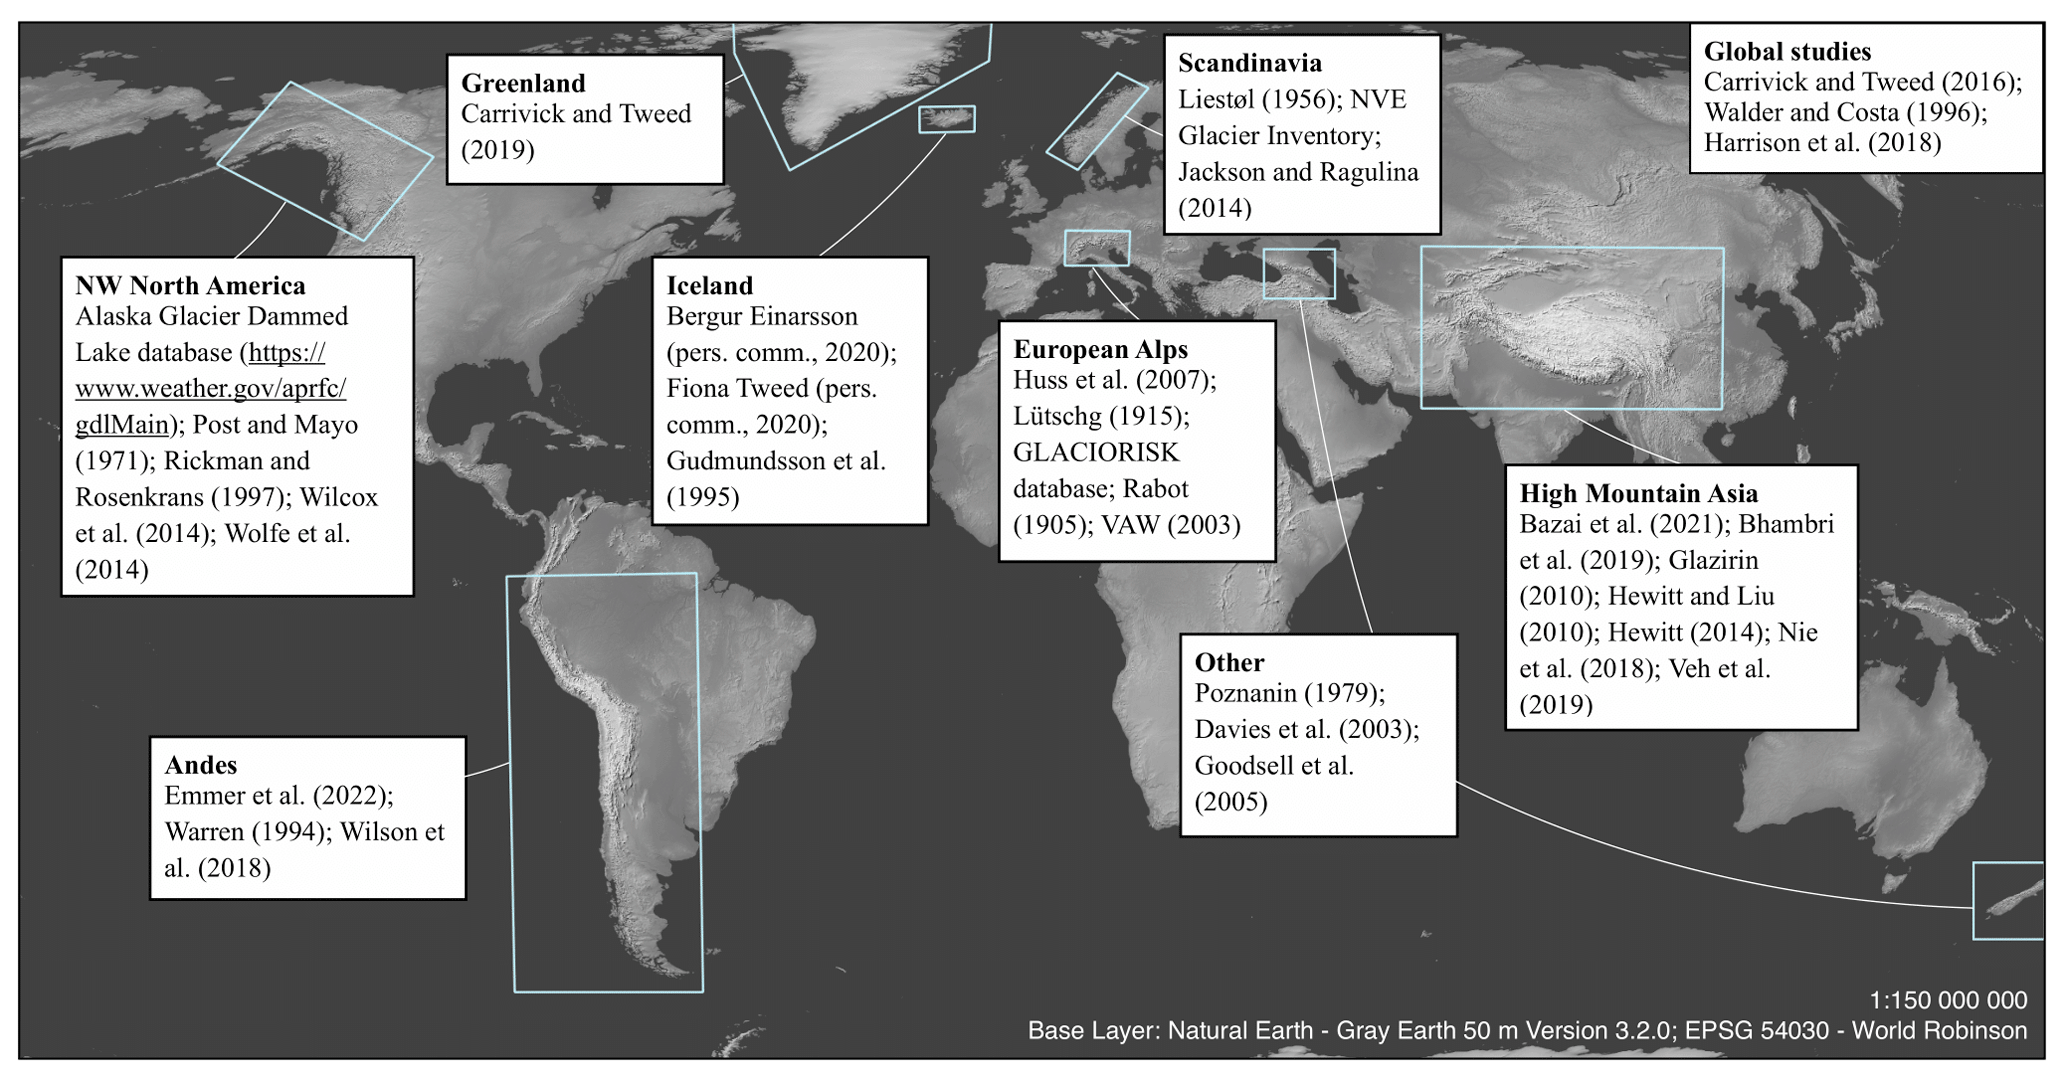
Figure 1Global map of the major study regions. Boxes show sources that we regard as key sources in a given region.
We compiled these sources by searching online literature archives (e.g. Web of Science) and web platforms that are commonly used by researchers, governmental agencies, or newspapers to spread news and new research (e.g. ResearchGate, Google Scholar, Twitter). We have repeatedly revisited these databases over a 4-year period (2019–2022) to include any updates and new literature in our inventory. Guided by previous literature reviews (Emmer, 2018; Emmer et al., 2022c), we used a keyword search on these platforms including terms in the English language such as “glacial lake”, “glacial lake outburst flood”, “glacier floods”, and “glacier hazards” and added local or regional names such as “Himalaya”, “Canada”, or “Patagonia” to obtain more specific research items. We traced back each reported GLOF to the original source and contacted the authors or consulted libraries if the sources were not available online. We divided previous work in these regions into primary sources (55 %), where we had direct access to the original report, and secondary sources (45 %), such as summaries or reviews of historical cases without direct access to the original reference (Fig. 2a). Most sources are peer-reviewed publications (76 %). The remainder includes non-peer-reviewed literature (18 %) such as official reports, local databases, and conference abstracts, as well as news and social media content (6 %), including videos, blog posts, web articles, and newspaper articles (Fig. 2b). We have compiled GLOFs from literature sources written in English, Russian, German, Spanish, Icelandic, and Chinese. Sources not written entirely in English must include at least an abstract and keywords in English to meet our search criteria. We were also supported by 14 local researchers, who reviewed our compilation and contributed additional cases with their local knowledge (see Acknowledgements). With their help, we were able to expand the previously available catalogue of GLOFs substantially, especially in Iceland and central Asia (Carrivick and Tweed, 2016). Most of our sources report on GLOFs from High Mountain Asia (n=229) and the European Alps (n=213), while Greenland, Scandinavia, and the study region “Other” had the lowest research output (Fig. 2a). The European Alps are covered by a comprehensive database of glacier-related hazards arising from the GLACIORISK project (http://www.nimbus.it/glaciorisk/gridabasemainmenu.asp, last access: 27 October 2022), although we had limited direct access to the literature for some of the GLOFs.
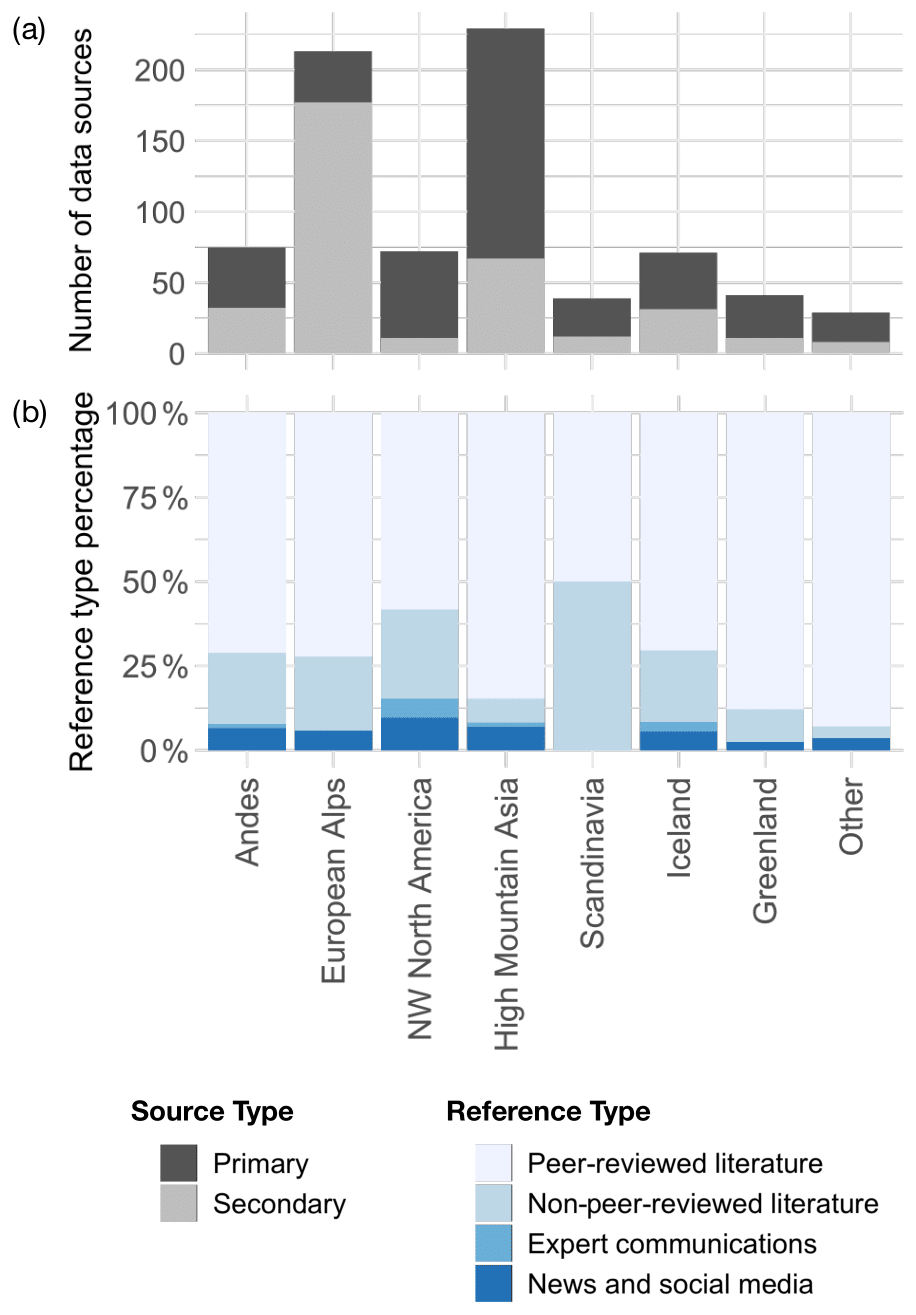
Figure 2Data sources of GLOFs by study region. (a) Number of primary and secondary data sources and (b) the proportion of the reference types in each region.
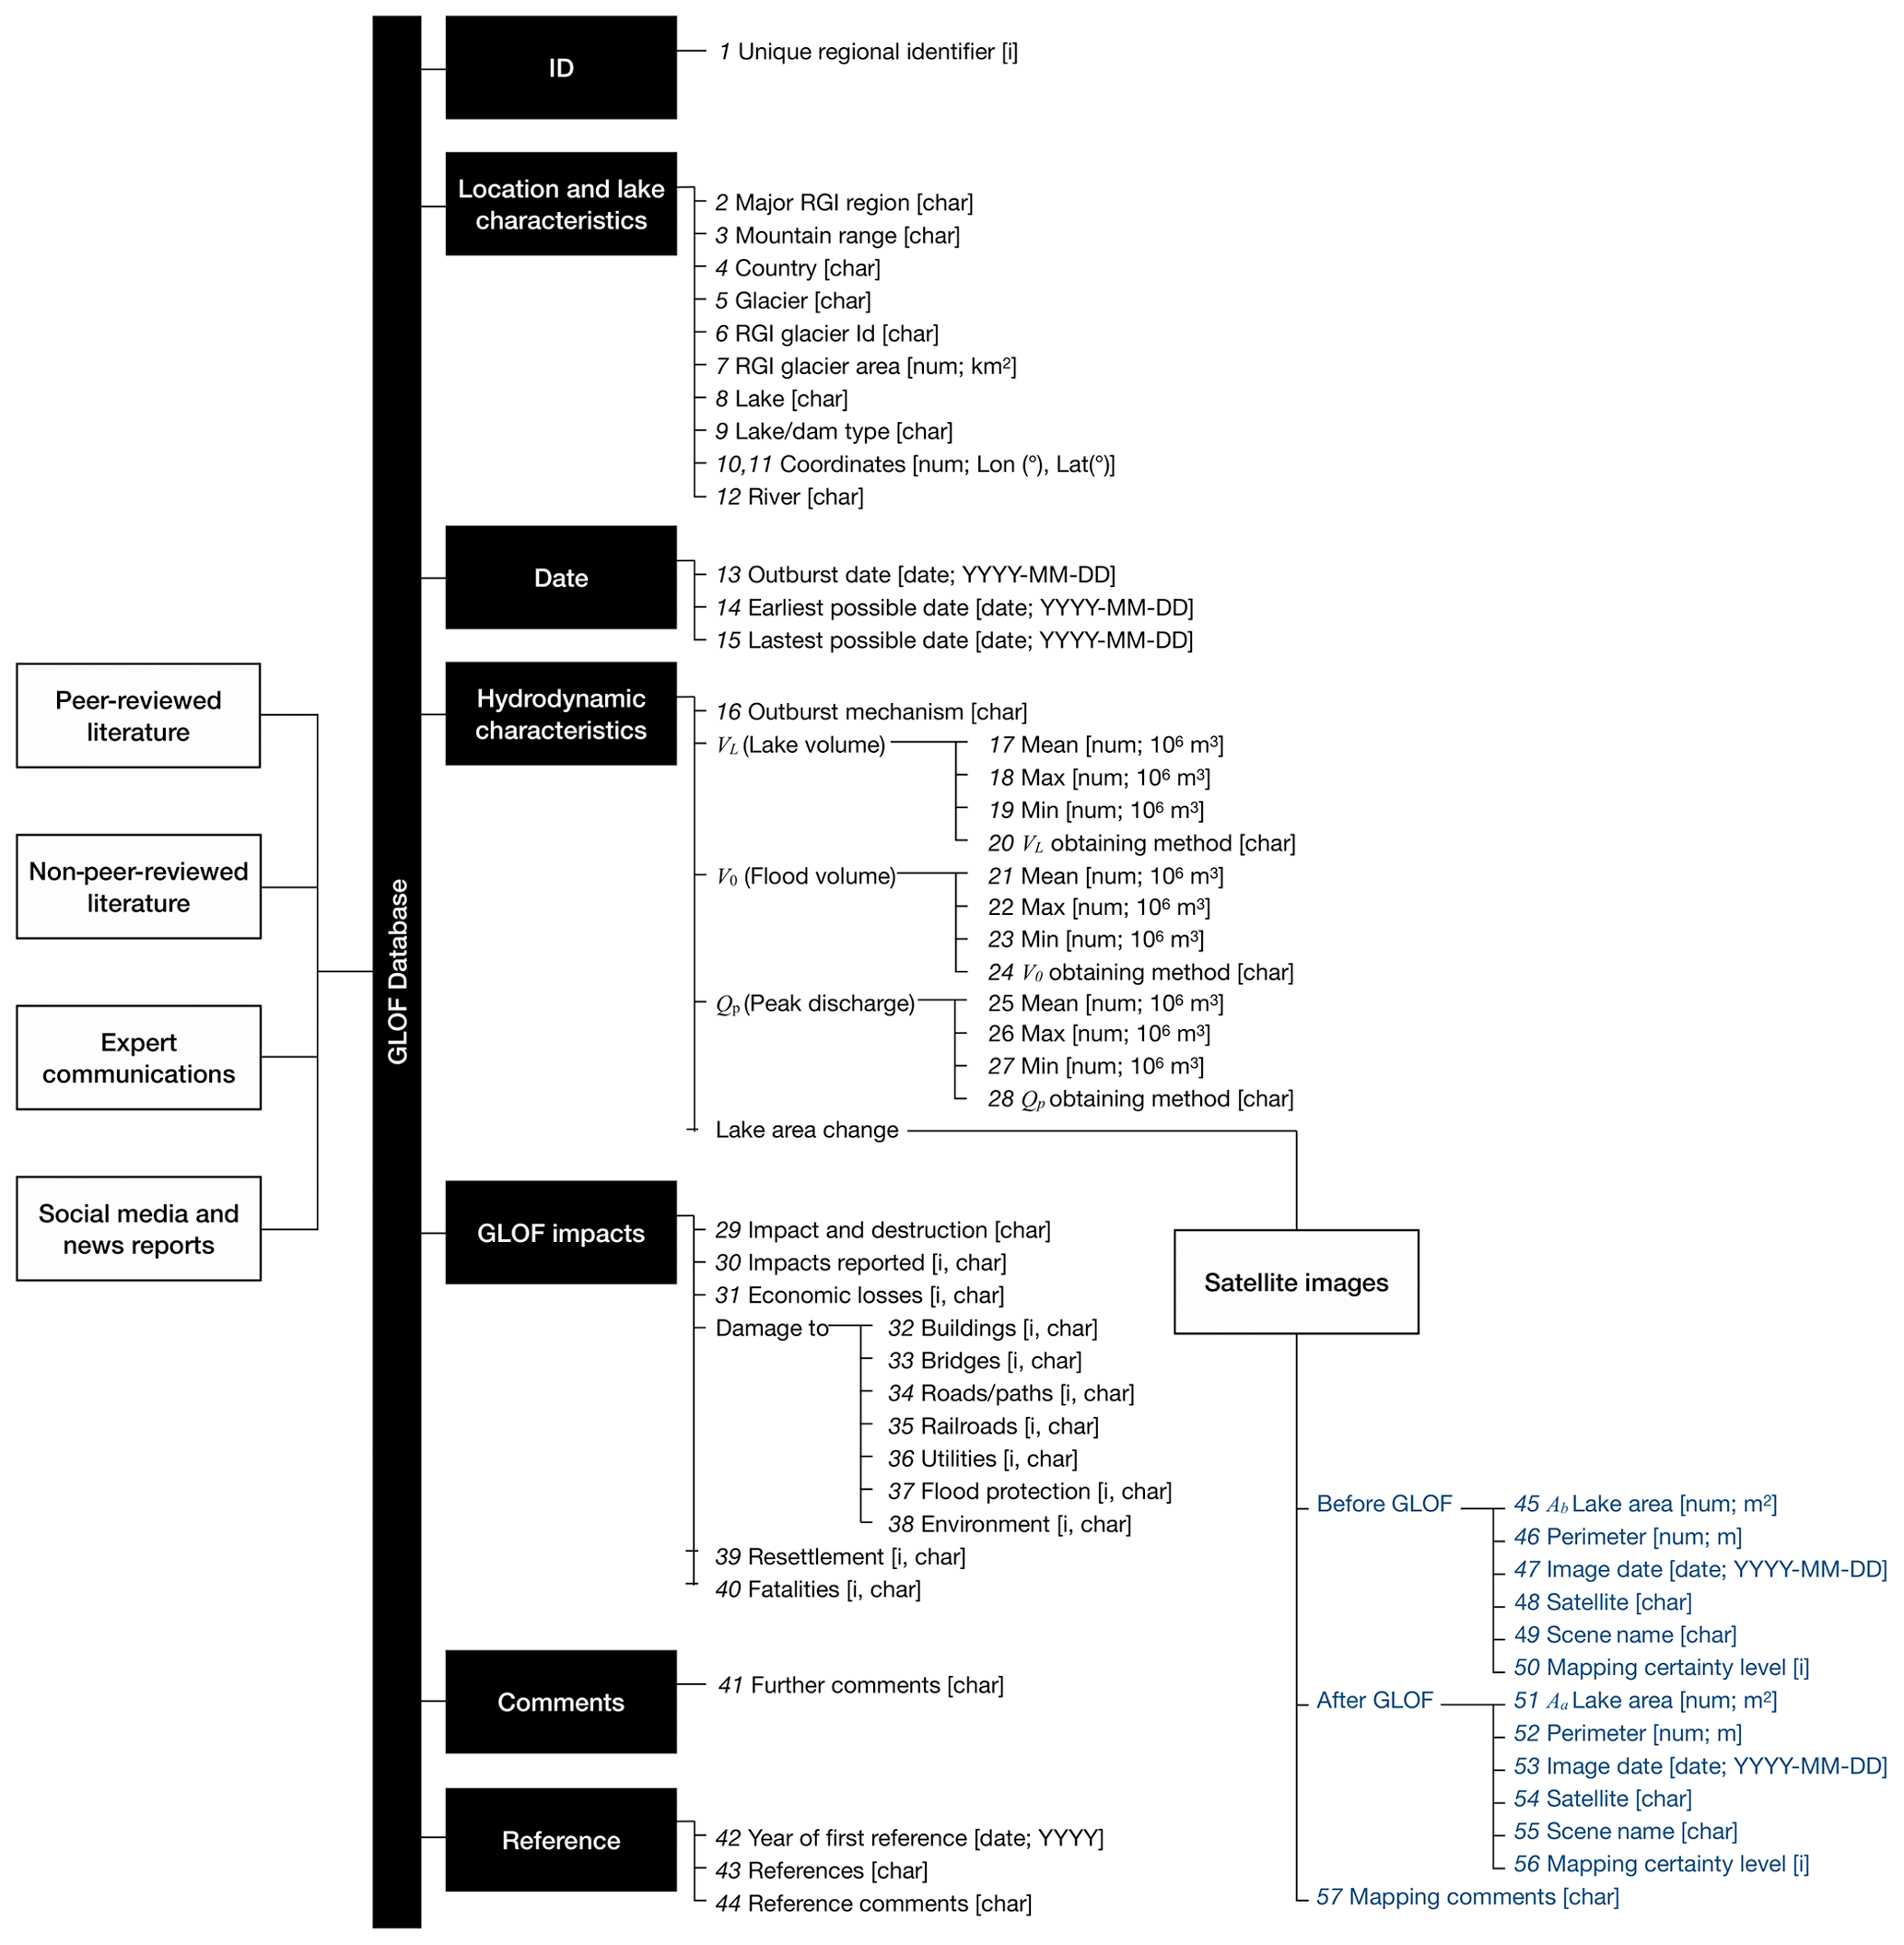
Figure 3Structure of the GLOF database. White boxes are input data. Black backgrounds show major categories of GLOF attributes, including finer branches that specify these parameters. Parameters with black fonts are gathered from the literature, and parameters with blue fonts are derived from additional data. Data types and units of the parameters are given in square brackets, [i] integer, [char] character, [num] numeric, [YYYY] year, [MM] month, and [DD] day.
2.2 Structure of the database
All resources were comprehensively checked for any available information on GLOF events. We compiled 57 attributes to capture quantitative and qualitative information on location, timing, hydrodynamic characteristics, socio-economic and geomorphic impacts, and references associated with all reported GLOFs in our database (Fig. 3). We summarize these attributes below.
ID. We separated the GLOFs by study regions and gave each case a unique identifier.
Location and lake characteristics. We included 11 metrics describing each GLOF such as the geographic coordinates and the local name of the source lake, mountain range, country, glacier name, and the river impacted by the lake drainage, if available. We used the Randolph Glacier Inventory version 6.0 (RGI Consortium, 2017, http://www.glims.org/RGI/, last access: 29 October 2022) to add the ID and the area of the parent glacier as additional information. We also report or assess the type of dam impounding the lake and the mechanism that led to drainage. We differentiated between lakes dammed by glacier ice, moraines, bedrock, or a combination thereof, as well as englacial water pockets, and subglacial lakes associated with geothermal or volcanic activity (Carrivick and Tweed, 2013; Emmer et al., 2022a). Bedrock-dammed lakes form in topographic depressions and overdeepenings, for example, by glacial erosion (U.S. Department of Agriculture, 2016). Moraine-dammed lakes trap water behind lateral or terminal moraines (Otto, 2019). Ice-dammed lakes can be impounded by trunk glaciers in ice-free tributary valleys or by advancing glaciers that temporarily block surface runoff (Iturrizaga, 2011). Further types of ice-dammed lakes include supraglacial lakes (on top of glaciers) and water pockets within or beneath the glacier (Haeberli, 1983; Benn and Evans, 2010). We differentiated supraglacial lakes and water pockets from subaerial glacier-dammed lakes to emphasize differences in dam shapes and breach dynamics. Where unavailable in the literature, we used optical satellite imagery from Google Earth Engine and digital topographic maps (OpenStreetMap, 2022; ESRI, 2022) to infer the type of dam.
Date. The reported date of each GLOF is essential to learn more about changes in GLOF occurrence and timing. Some sources offer a range of plausible dates, especially where the floods were determined by comparing two satellite images showing changes in characteristic geomorphic diagnostics of GLOFs such as a loss of lake area or sediment deposition downstream (Nie et al., 2018; Veh et al., 2019; Emmer et al., 2022a). For cases without a reported date, we used optical satellite imagery (e.g. Landsat, RapidEye, and PlanetScope) to determine a range of plausible dates. We further used this approach to narrow reported date ranges when feasible.
Hydrodynamic GLOF characteristics. The outburst mechanism controls the average and maximum flow rate, velocity, and volume and thus the shape of the hydrograph. Different dam types allow for different shapes of the discharge path during the outburst (Röthlisberger, 1972; Fowler, 1999; Westoby et al., 2014; Walder et al., 2015). Ice-dammed lakes may drain through one or more subglacial tunnels, flotation, incision, or failure of the dam (Walder and Costa, 1996; Otto, 2019). Some of these mechanisms allow ice-dammed lakes to fill and drain repeatedly, for example, if subglacial tunnels open during and are sealed after an outburst flood (Nye, 1976; Clarke, 1982). The stability of a moraine dam depends, among others, on the dam geometry, internal structure, and material properties (Weidinger et al., 2002; Korup and Tweed, 2007). Failure occurs when the strength of the material is exceeded, for example, due to shear stresses because of seepage or an increased load on the dam due to rising lake levels (Korup and Tweed, 2007). Melting ice cores in moraine dams may decrease stability, leading to breach in some cases (Richardson and Reynolds, 2000). Overtopping is a commonly observed outburst mechanism for moraine- and bedrock-dammed lakes and often a consequence of displacement waves from mass movements (ice, snow, or rock avalanches) into the lake (Haeberli et al., 2017). Another mechanism leading to overtopping is excessive runoff due to intense rainfall, snowmelt, or glacier recession (Costa and Schuster, 1988). Overtopping can destroy a moraine dam by eroding the dam through drainage channels (Costa and Schuster, 1988).
Lake volume (VL), flood volume (V0), and peak discharge (Qp) are important baseline parameters to quantify GLOF magnitude. Where studies provided ranges of these values, we reported minima, maxima, and the arithmetic mean. To acknowledge the reliability of reported values of V0 and Qp, we distinguished between gauged, estimated, and unknown flood quantities. V0 is considered gauged if the flood volume was obtained from a hydrograph and estimated if the lake had one or several bathymetric surveys before or after the flood.
We manually mapped the outlines of lakes where outbursts occurred between 1984 and 2021 using multispectral optical images from eight satellite missions: Landsat 4, 5 (TM), 7 (ETM+), and 8 (OLI); Geo-Eye 1; RapidEye; Sentinel-2; and PlanetScope (Table 1). Ground sampling distance and revisiting times over a given location vary throughout the dataset. Overall, we obtained Landsat imagery from the Google Earth Engine Data Catalog (https://developers.google.com/earth-engine/datasets/catalog/landsat, last access: 29 October 2022) and PlanetScope, RapidEye, and Sentinel-2 imagery from the Planet Explorer (2022) operated by Planet Labs PBC (https://www.planet.com/products/explorer/, last access: 29 October 2022). Most of the images (n=359) were from the Landsat-5 mission, which started in 1984 and ended in 2012. In each case, we selected images as temporally close as possible before and after the outburst date, filtering images with cloud cover of <20 %, and minimum snow and shadow cover. For cases with a known outburst date, the median time difference between image date and the outburst date is 14 d before the GLOF and 20 d after the GLOF. We mapped lake area before (Ab) and after the GLOF (Aa) from 839 images for 32 % of all GLOFs after 1984 (391 outbursts) as polygon features in QGIS V3.18. This allows users to calculate changes in lake area owing to the GLOF. Lake area is a rough proxy of the GLOF size because estimated values of VL, V0, and Qp often originate from different empirical scaling relationships (Clague and Mathews, 1973; Evans, 1986; Walder and Costa, 1996).
Table 1Resolution and source satellite missions of images used to map glacier lake areas before and after outbursts.
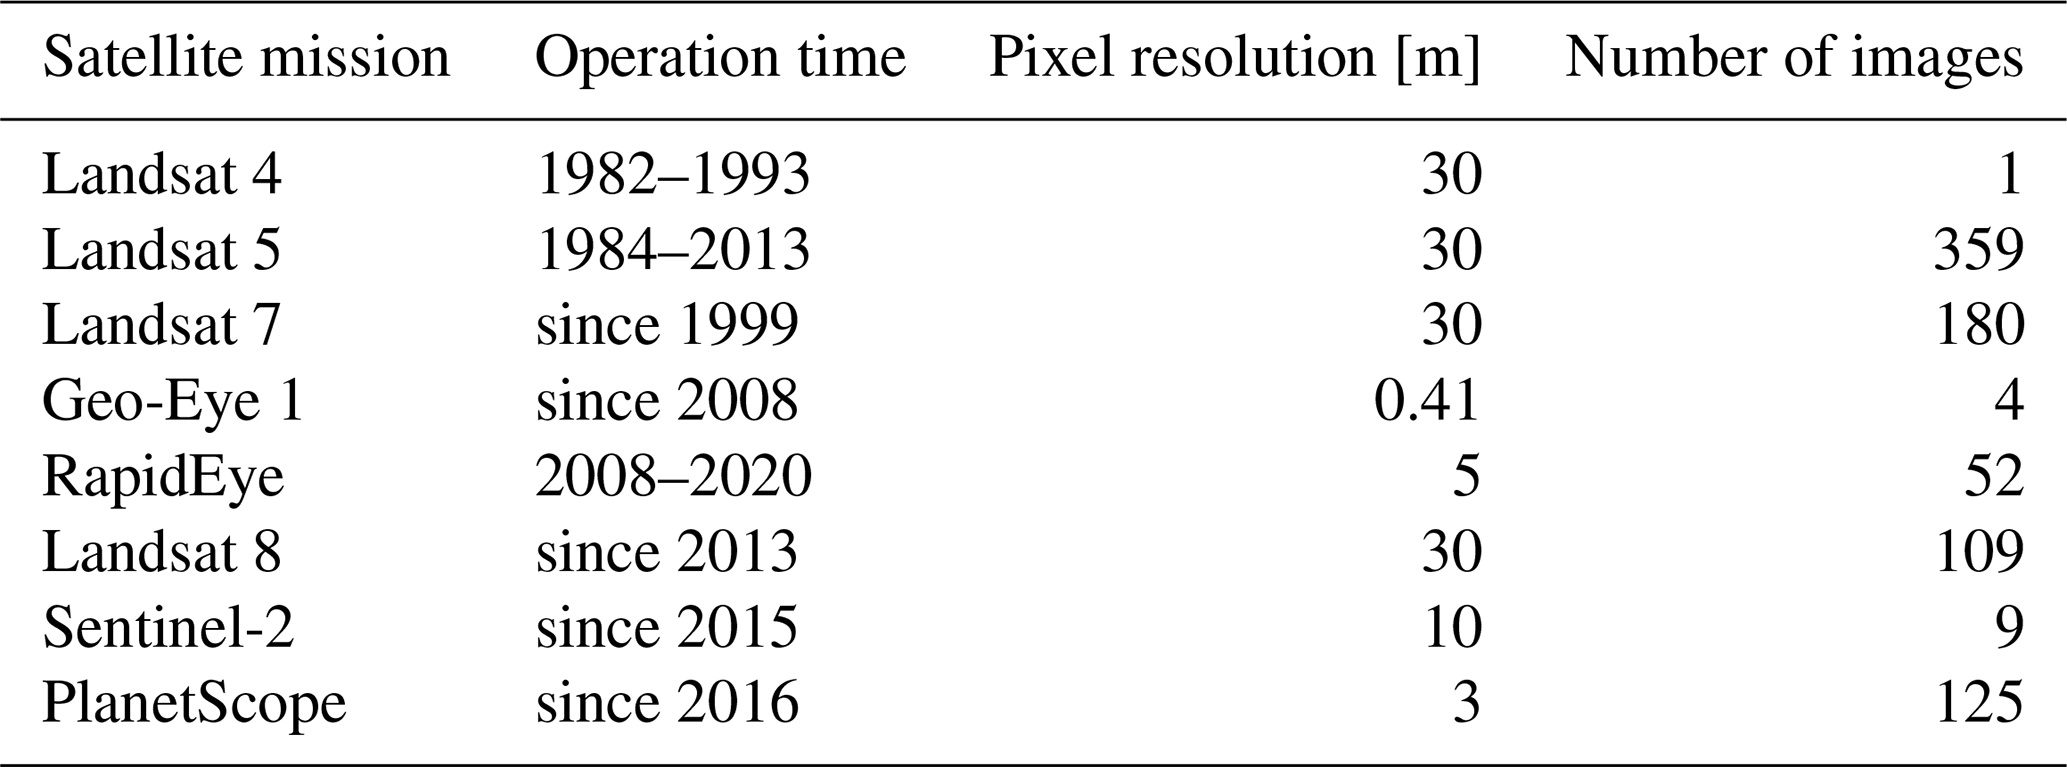
The pixel resolution refers to the resolution of the spectral bands that we used to visually map lakes.
We also included in our database the lake outlines from 11 GLOFs mapped by Bazai et al. (2021) in the Karakoram and 9 GLOFs mapped by Eide (2021) in Scandinavia. We have not yet mapped lake areas in Greenland but plan to include them in a future update of our database. We mapped the lake polygons in the local UTM (Universal Transverse Mercator) projection using image enhancement such as clipping band histograms or changing image contrast and colour saturation. False-colour composites further increased the visual difference between vegetation, soil, water, and ice. We found the near-infrared (NIR) bands useful to map lakes using colour composites such as [NIR1, red, green] or [NIR1, NIR2, red]. From the mapped lake polygons, we calculated lake area and perimeter with the statistical programming software R (2022) using the st_area and st_perimeter function included in the sf package in the local UTM projection (V1.0-7; Pebesma, 2018). For all mapped lake areas, we included the name of the satellite scene, the image date, and the lake perimeter. We also added an estimate of reliability for the mapped lake areas. We assigned “low confidence” to lake perimeters that were partially shrouded by ice, shadows, or clouds and “high confidence” to clear views onto the lake surface.
Impacts. We compiled and split reported flood impacts into 10 categories to rank socio-economic impacts. Our damage categories expand on those of the global GLOF assessment by Carrivick and Tweed (2016). We distinguished between economic and infrastructural losses, environmental impacts, and social consequences with regard to fatalities or a need for resettlement of the affected population. Economic losses include, for example, damage to farmland or destruction of touristic facilities. Furthermore, damage to infrastructure was separated into buildings, bridges, roads, railroads, and utilities such as water and electricity supply and communication services. If available, we also documented the number of damaged features of each category. Where information on GLOF impacts was vague, we distinguished between features that were damaged (x) or only affected (a) without structural damage, for example, by covering a road with debris. When damage was reported without information on the affected features, the cases are marked with a “u” (unknown) in the parameter of the reported impacts.
Comments. We documented any additional information from our sources, such as extreme weather events involved in triggering lake outbursts; the mean discharge during the GLOF; information on river stages; or anecdotal, non-numerical descriptions of the course of the flood and its characteristics, such as flood duration, flow type, or sediment load or subjective descriptions of the flood magnitude (e.g. minor, large, or extensive flood).
References. Finally, we listed all sources from which we extracted information on GLOFs. We highlighted earlier published information that was cited in more recent publications by linking them with “CITED IN”, independent of the accessibility to the cited source. If we had access to a cited reference, we always searched for the original source to validate the provided information. If a publication provided multiple sources for an event (e.g. in data tables), the cited references were connected with an “&” operator. Single sources were separated by semicolons. Lastly, we noted the year of the first reference found that cited the event.
3.1 Spatial distribution of GLOFs
Our database has a total of 3151 GLOFs that originated in 27 countries between 850 and 2022 CE (Fig. 4). With 833 reported cases, NW North America is the region with the highest number of outbursts, followed by Iceland (n=590) and High Mountain Asia (n=569). Few GLOFs were reported in Scandinavia (n=192) and Greenland (n=153) (Fig. 5b). The Andes had the highest number of outburst sources (n=218) but only a few more GLOFs (n=337) (Fig. 5a, b). The database contains about 3 times more GLOFs than GLOF source locations in High Mountain Asia, 4 times more in the European Alps, 5 times more in Scandinavia, 7 times more in Iceland, and 9 times more in NW North America (Fig. 5c). Overall, 64 % of all individual source locations in the database had exactly one outburst, with up to 91 % of single drainage events located in the Andes. Most lakes with multiple outbursts were in NW North America, where 30 lakes produced at least five outbursts each.
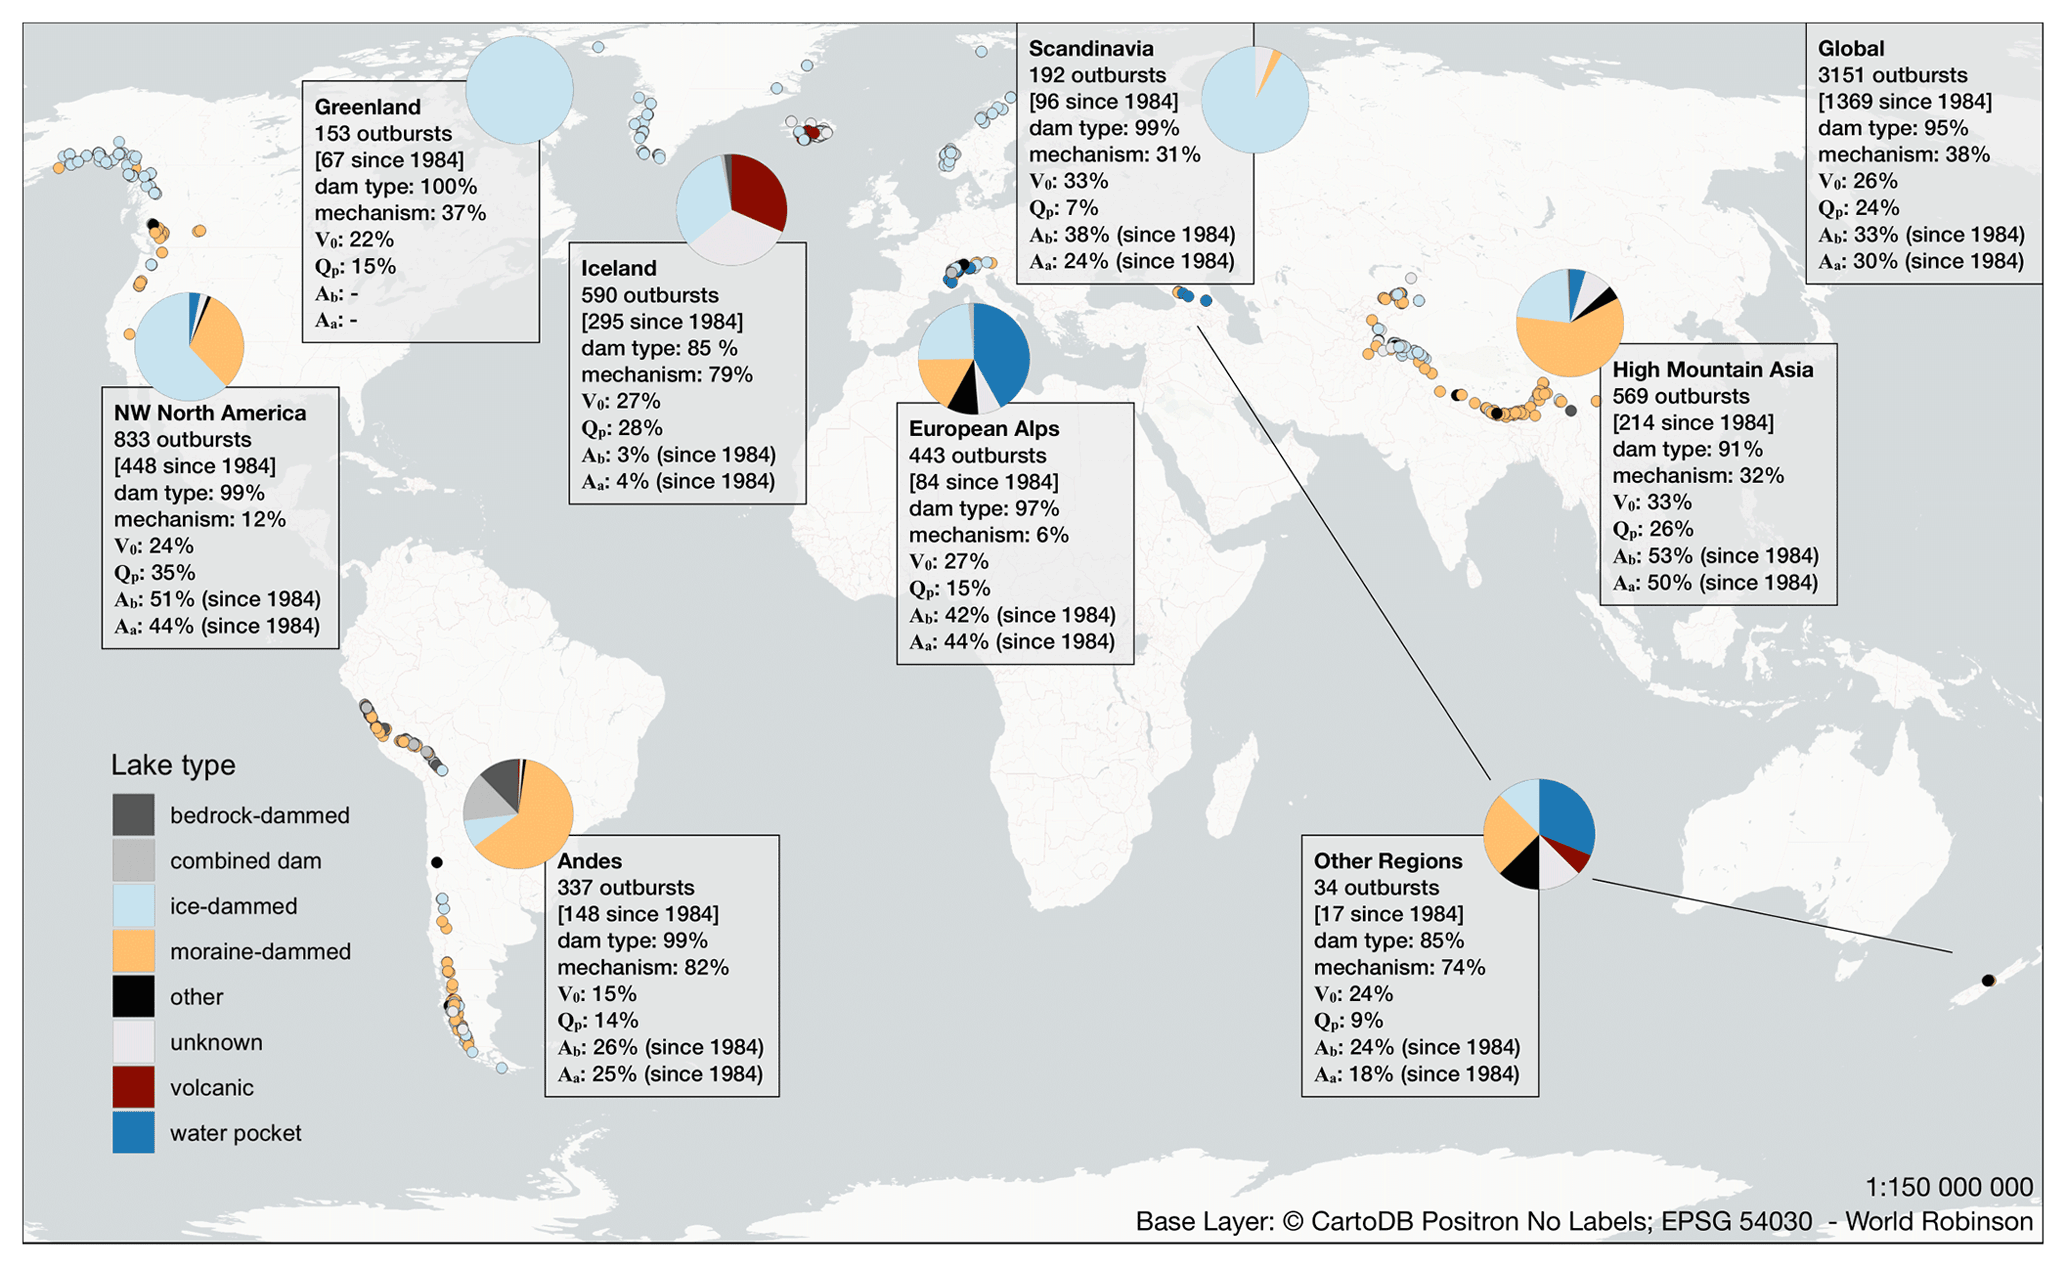
Figure 4Overview map of the source locations of GLOFs and selected regional database contents. Colours show the lake type of the GLOF locations (bubbles) and proportions of GLOF locations in each region (pie charts). Boxes are regional statistics on the total number of outbursts (and the number of outbursts of GLOFs since the availability of satellite images); the percentage of cases with reported dam type and drainage mechanisms; and parameters on GLOF magnitude such as peak discharge (Qp), flood volume (V0), and the area before (Ab) and after (Aa) the GLOF.
Dam type is one of the most consistently reported attributes and available for 95 % of all cases. Most reported lake outbursts involved lakes dammed by ice including ice marginal lakes dammed by the glacier body (65 %), ice-dammed lakes affected by geothermal or volcanic activity (8 %), and englacial water pockets (5 %). Failures of moraine-dammed lakes account for 13 % of all documented outbursts. GLOFs from bedrock-dammed lakes and lakes with combined dams or other sources, such as supraglacial lakes, are rare in our database (4 %). We note that this global distribution differs regionally. In NW North America and Scandinavia, most GLOFs originated from ice-dammed lakes (Fig. 4). In contrast, High Mountain Asia and the Andes had many outbursts from moraine-dammed lakes. Scandinavia had only one moraine-dammed lake that generated reported outburst floods (Breien et al., 2008). In NW North America, every third source lake with at least one observed GLOF is a moraine-dammed lake, mostly reported in British Columbia (McKillop and Clague, 2007). By contrast, outbursts from ice-dammed lakes prevailed in Alaska (Post and Mayo, 1971). The Andes are the only region with many known outbursts of bedrock-dammed lakes (n=27). Water pockets have been rarely reported to experience outbursts in all regions except the European Alps, where they represent 49 % of the reported outburst sources. Few GLOFs (n=14) from water pockets were also reported in the Russian part of the Caucasus and in New Zealand (region “Other”). Iceland is the only region with a high proportion of reported GLOFs from subglacial lakes linked to geothermal or volcanic activity (45 % of all Icelandic GLOFs). Another 40 % of GLOFs in Iceland originated from subaerial ice-dammed lakes dammed in tributary valleys.
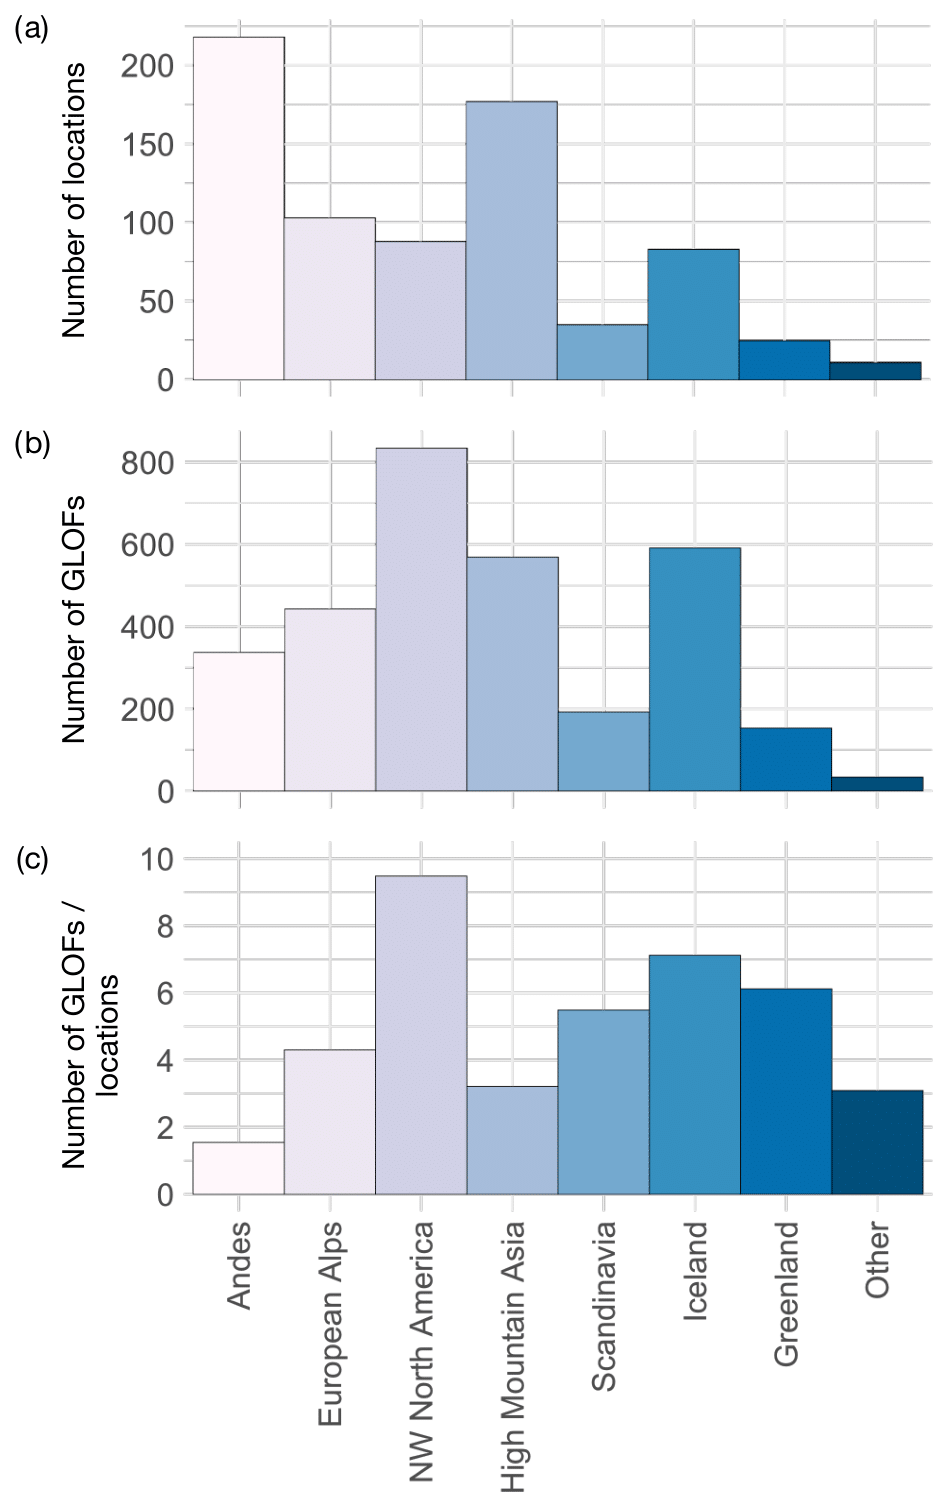
Figure 5Regional distribution of reported (a) GLOF source locations, (b) all GLOFs, and (c) ratio of the number of GLOFs and source locations.
3.2 Temporal distribution of GLOFs
Our database spans more than 12 centuries. The earliest GLOF occurred in the year 850, where a volcanic eruption caused a subglacial lake outburst at Mýrdalsjökull, Iceland (GLACIORISK, 2022). Before 1900, reporting activity was low, with 371 cases, i.e. 12 % of the total count (Fig. 6). About half of all GLOFs before 1900 were reported in the European Alps where research interest had been high, judging from many local archives, chronicles, and surveys about glacier changes and hazards (De Tillier, 1738; Baretti, 1880; Forel et al., 1882; Richter, 1892). In contrast, the Andes had only five reported GLOFs before 1900. Between 1900 and 2022, the decadal average of annually reported GLOFs increased 6-fold. Until the 1970s, the average increased at a rate of about five GLOFs per decade (Fig. 6). Between the 1970s and the 2000s, the increase in the reporting rate lowered to about one to two more reported annual GLOFs per decade, followed by an increase of the decadal average by 14 GLOFs between the 2000s and the 2010s. About 39 % of all outbursts took place after the start of the Landsat-5 mission in 1984.
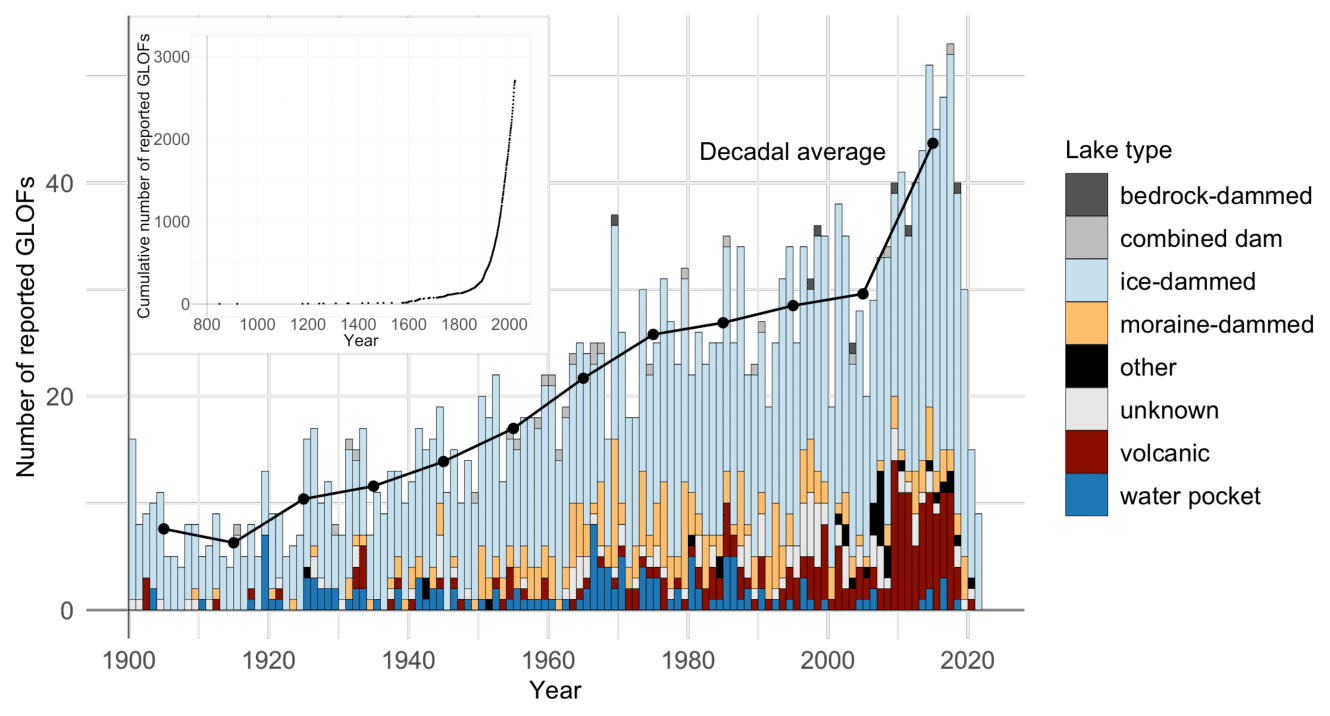
Figure 6Global annual number of reported GLOFs since 1900. Colours distinguish the dam types. Inset shows the cumulative number of reported GLOFs since 850.
GLOFs from ice-dammed lakes have been reported yearly since 1900 and also most frequently compared to all other lake types. However, moraine-dammed lake outbursts were also observed annually after 1950 with four exceptions (1996, 2007, 2021, 2022). Outbursts associated with volcanic activity and water pockets were reported less regularly, especially between 1900 and 1930. From 2010 to 2019, draining lakes associated with volcanic activity had a higher proportion of the total annual GLOF count compared to the rest of the observation period (Fig. 6). In contrast, GLOFs from bedrock-dammed lakes are only reported for a few years, all after the 1960s.
3.3 Hydrodynamic GLOF characteristics
Information on the outburst mechanism is available only for 38 % of all cases, and even fewer GLOFs have estimated or gauged peak discharges Qp (24 %) or flood volumes V0 (26 %). The data density of Qp or V0 changes with time. Before 1900, only 9 % of the reported GLOFs had one of these diagnostics described. The relative proportion of available data has increased since, especially between 1900 and 1950 (Fig. 7). After 1950, the proportion of available data levelled out to about one-third until the end of the observation period. Data density also differs between the study regions (Fig. 4). More information on Qp is available in NW North America, High Mountain Asia, and Iceland (∼30 %), as opposed to Scandinavia, the Andes, Greenland, and the European Alps (<15 %). Data on V0 are available for 20 %–35 % of GLOFs in all regions except the Andes (15 %). We were able to map lake areas for about half of the reported outbursts in High Mountain Asia, NW North America, and the European Alps since 1984. Due to high cloud cover, lake area could only be mapped for 4 % of the outbursts in Iceland since 1984. The outburst mechanism is reported for most GLOFs in Iceland and the Andes but only few GLOFs in NW North America and the European Alps.
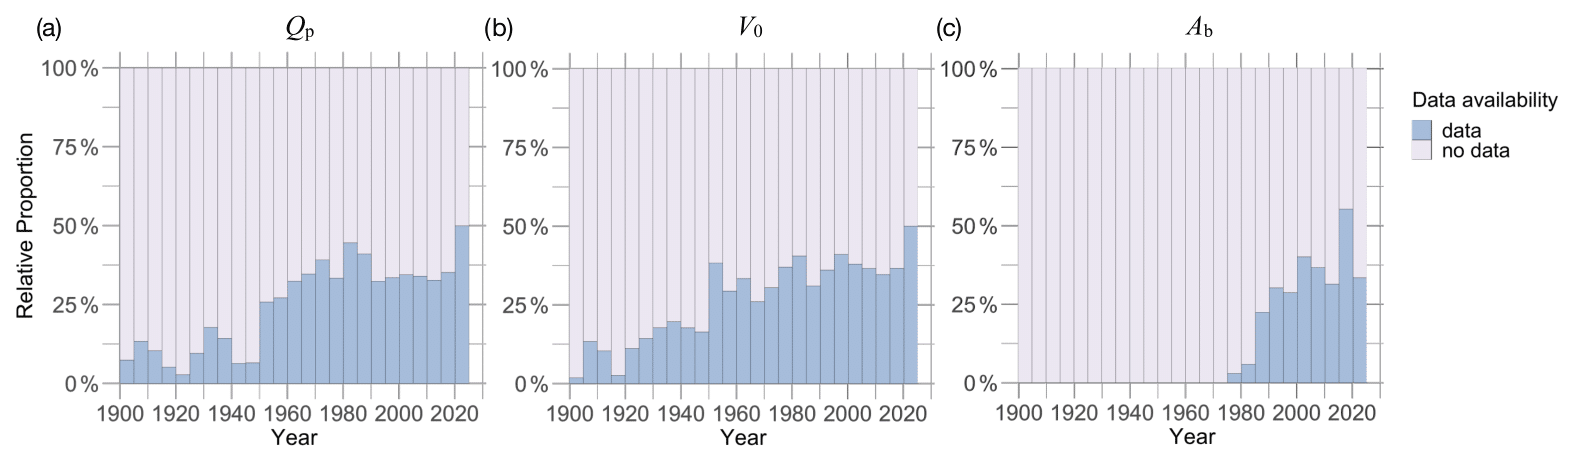
Figure 7Proportion of GLOFs with reported values of (a) peak discharge Qp, (b) flood volume V0, and (c) lake area before the GLOF Ab in 5-year bins. Consistent values for Ab became available with the start of the Landsat era in the 1980s.
3.4 GLOF impacts
According to our database, 44 GLOFs have killed at least 3636 people. Out of 29 GLOFs with reported number of victims, 6 are known to have killed more than 100 people each. Most fatalities (n=3093) were reported in HMA; Iceland only had a few (n=7), and Scandinavia and Greenland had no reported fatalities. Many sources remained vague or offered estimates about the number of fatalities (e.g. Fushimi, 1985; Fort, 2015), mostly due to missing information. We note that quantifying the absolute amount of damage and the absolute number of fatalities from individual GLOFs can be prone to both over- and underestimation. For example, GLOFs may coincide with monsoonal flash floods (Allen et al., 2016), and it remains difficult to distinguish the contribution of either type of flooding to observed damage. Landslides from undercut hillslopes may occur with a time lag to the outburst flood (Cook et al., 2018), so this damage may not be included in the initial estimate of damage. Many references therefore resorted to reporting only, if at all, the overall presence or absence of loss and damage. Flood damage is mentioned for 404 GLOFs. Almost half of the GLOFs with reported damage were associated with ice-dammed lakes (49 %), followed by moraine-dammed lakes (20 %), and water pockets (17 %) (Fig. 8). The majority of GLOFs with reported damage occurred in HMA (34 %), the European Alps (27 %), and NW North America (22 %). Hardly any societal impacts from GLOFs were reported in Greenland according to our database. The most commonly reported impacts were destroyed bridges (n=248), economic losses (n=127), and damaged or debris-covered roads (n=104). High Mountain Asia had at least 122 destroyed bridges, about half of the bridges that were globally reported to be destroyed by GLOFs. Most GLOFs that caused economic losses or damage to bridges, buildings, and roads originated from ice-dammed lakes (Fig. 8). In HMA, Scandinavia, Iceland, the Andes, and the European Alps, economic losses most commonly include agricultural damage, for instance, the loss of crops, farmland, and cattle. In contrast, in the Pacific NW, economic losses mainly affect the touristic sector, for instance, flooding or destruction of campgrounds. At least 33 GLOFs caused damage to utilities, for example, by cutting off or shortening the local water supply, destroying pipes, or causing damage to hydropower plants. Most of the GLOFs that caused damage to utilities originated from moraine-dammed lakes (Fig. 8).
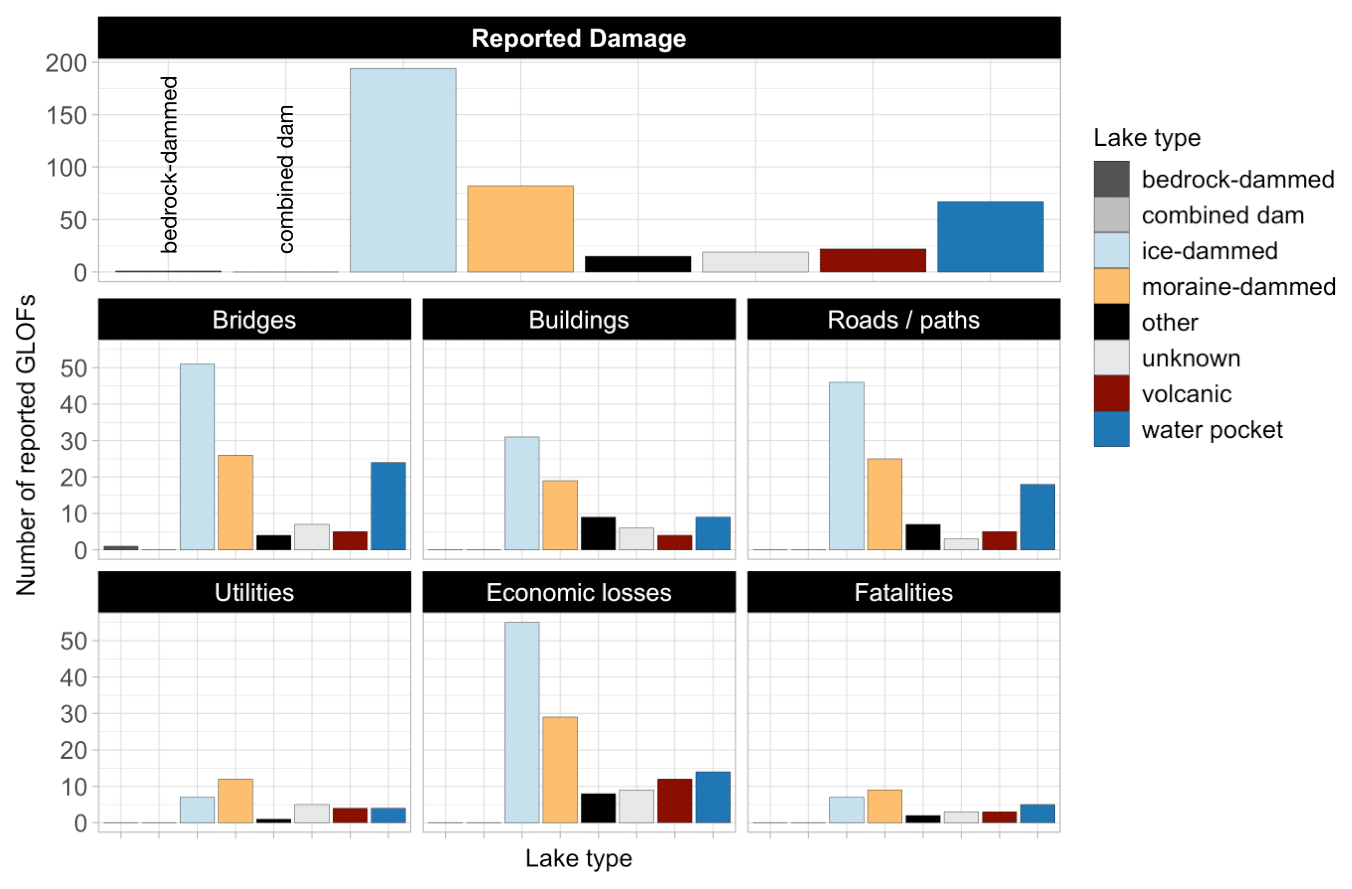
Figure 8Number of GLOFs with reported damage sorted by lake type. Top row shows the total number of reported flood events for all lake types. Smaller panels show the number of reported GLOFs that caused damage to bridges, buildings, roads, and utilities; economic losses; or fatalities.
A total of 76 % (n=309) of those GLOFs with reported damage occurred after 1900. However, between 1900 and the present, only 12 % of all reported GLOFs (n=2484) had damage. The decadal average of annually reported GLOFs that caused damage has increased 3-fold since, from about two GLOFs in the first decade of the 20th century to about six in the 2010s (Fig. 9a). Only 21 (17 %) of all years since 1900 have remained without information on loss or damage, and since 1950, only 5 years have had no noteworthy GLOF impacts. The ratio between annually occurring GLOFs with reported damage and the total number of reported events varied only slightly throughout the 21st century (Fig. 9b). However, in the first half of this century, the ratio was >0.2 in about 60 % of years with reported GLOFs, which applies to only 3 years (5 %) with reported GLOFs since 1950.
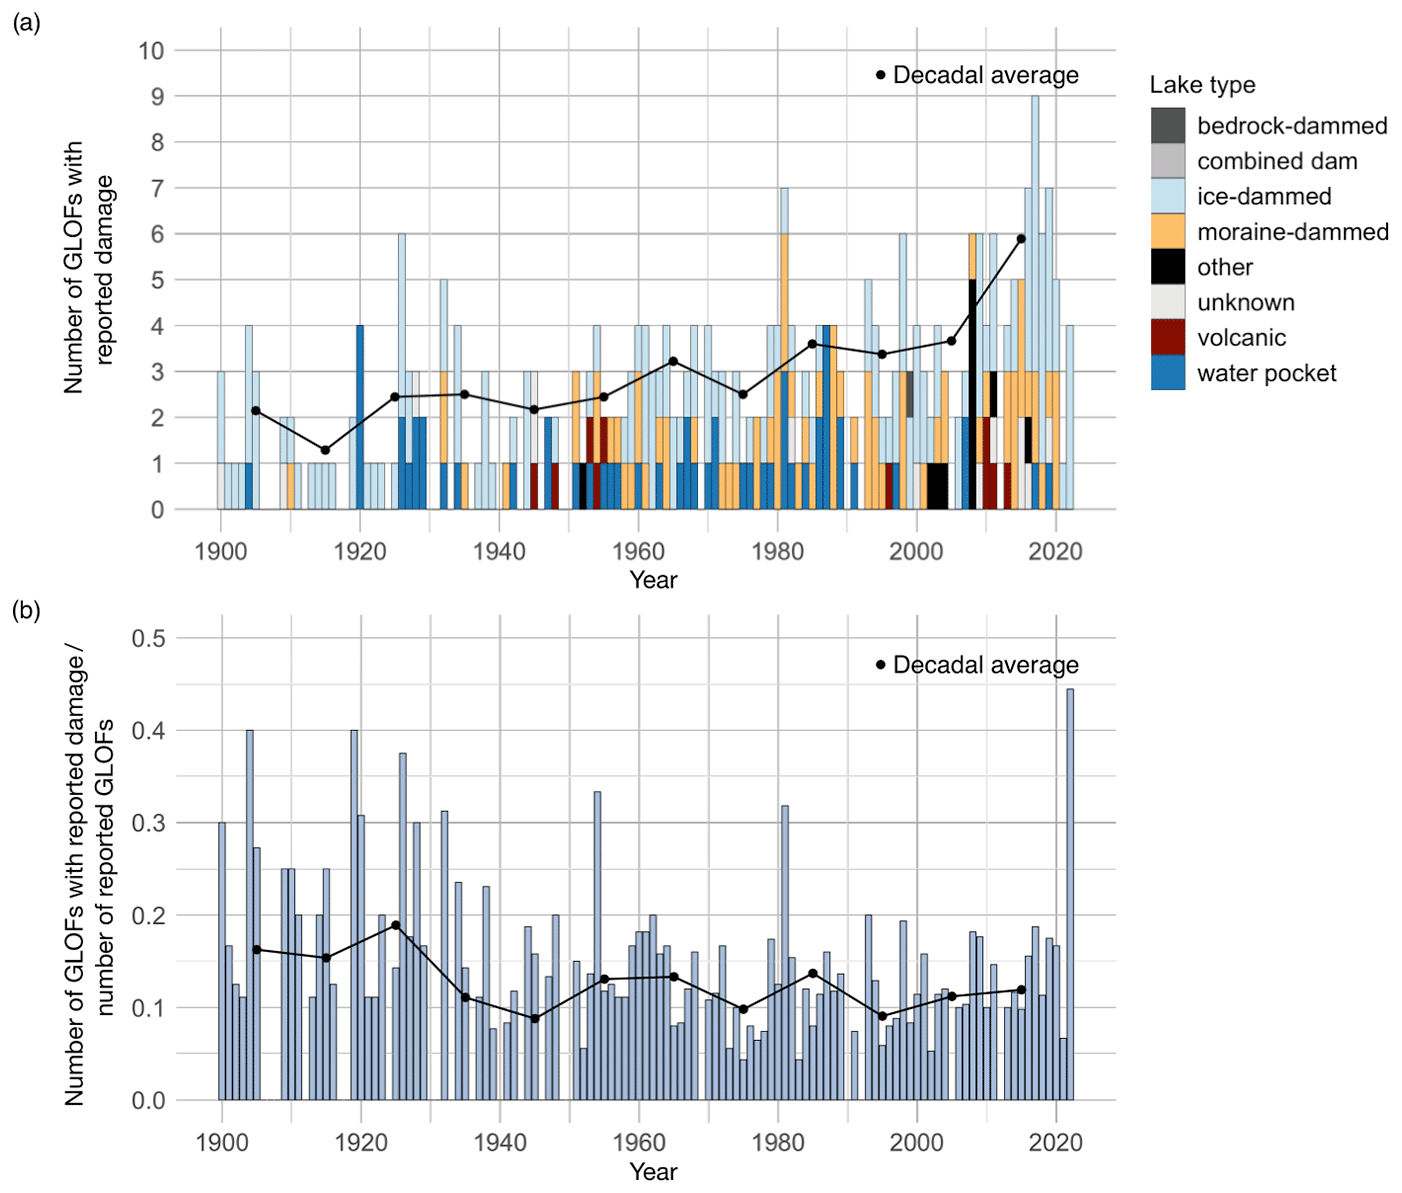
Figure 9Temporal distribution of GLOFs with reported damage (1900–2022). (a) Annual number of GLOFs with reported damage by lake type. (b) Fraction of yearly reported GLOFs with details of damage. The black line is the decadal average of the annual count.
4.1 Comparison with previous global databases
Our database is an important step towards approximating the historic and current frequency and size of GLOFs. We reviewed and compiled information from local and regional data sources and substantially increased the number of, and level of detail about, GLOFs in existing compilations. Compared to the global survey by Carrivick and Tweed (2016), the number of reported GLOFs has increased from 1348 to 3151 cases (+134 %). We have been able to add 240 new GLOFs to our inventory alone since the publication of the study by Carrivick and Tweed (2016). By truncating both databases to the same time interval (1500–2015), we find that NW North America had the highest increase in the absolute number of reported GLOFs, with 319 (+88 %) additional cases (Fig. 10). Greenland only had 22 GLOFs in the previous global database, and our inventory raises the GLOF count there 6-fold, followed by High Mountain Asia (+155 %) and Iceland (+92 %). In the Andes, the European Alps, Scandinavia, and Greenland, the increase in the number of GLOFs is evenly distributed with time (Fig. 10). In contrast, most newly added events in NW North America, High Mountain Asia, and Iceland cover the period after 1950. The strong increase in the reported GLOFs in only 6 years following the study of Carrivick and Tweed (2016) might mirror the increase in research interest in this glacial hazard and better documentation. In High Mountain Asia and Greenland, the increase is mainly attributable to recently published reviews by Bhambri et al. (2019), Carrivick and Tweed (2019), and Bazai et al. (2021). These studies systematically compiled all accessible information on previously reported cases, while reporting only a few newly detected GLOFs. In NW North America and Scandinavia, publicly available online databases have offered better access to data (NVE Glacier inventory, 2022; Alaska Glacier Dammed Lake Database, 2022). In Iceland, the increase in reported GLOFs is due local experts, granting us access to internal reports from the government agencies and translated publications written in the Icelandic language. Using this newly accessible information, we were able to add 321 GLOFs to that region. Among those, 251 cases occurred before 2016, accounting for 43 % of the GLOFs that have been reported in Iceland.
Moreover, the substantial increase in GLOF reports since the study by Carrivick and Tweed (2016) highlights the advances in data collection. Many recent publications and web resources used remote sensing to detect GLOFs. For example, Emmer et al. (2022b) used multi-temporal aerial and satellite imagery, obtained between 1948 and 2022, to detect and analyse GLOFs that occurred in Peru and Bolivia and tripled the number of previously reported events in these regions. Veh et al. (2019) doubled the known number of moraine-dam failures in the Himalayas between 1988 and 2017 by evaluating time series of Landsat images. Published hydrometric data also improved reporting in sparsely populated regions. The Alaska Glacier Dammed Lake Database (https://www.weather.gov/aprfc/gdlMain, last access: 19 October 2022) reported 83 GLOFs for the period after 2015 alone, mainly based on USGS (2022) hydrometric station records. These data account for 81 % of the reported GLOFs in NW North America since 2015.
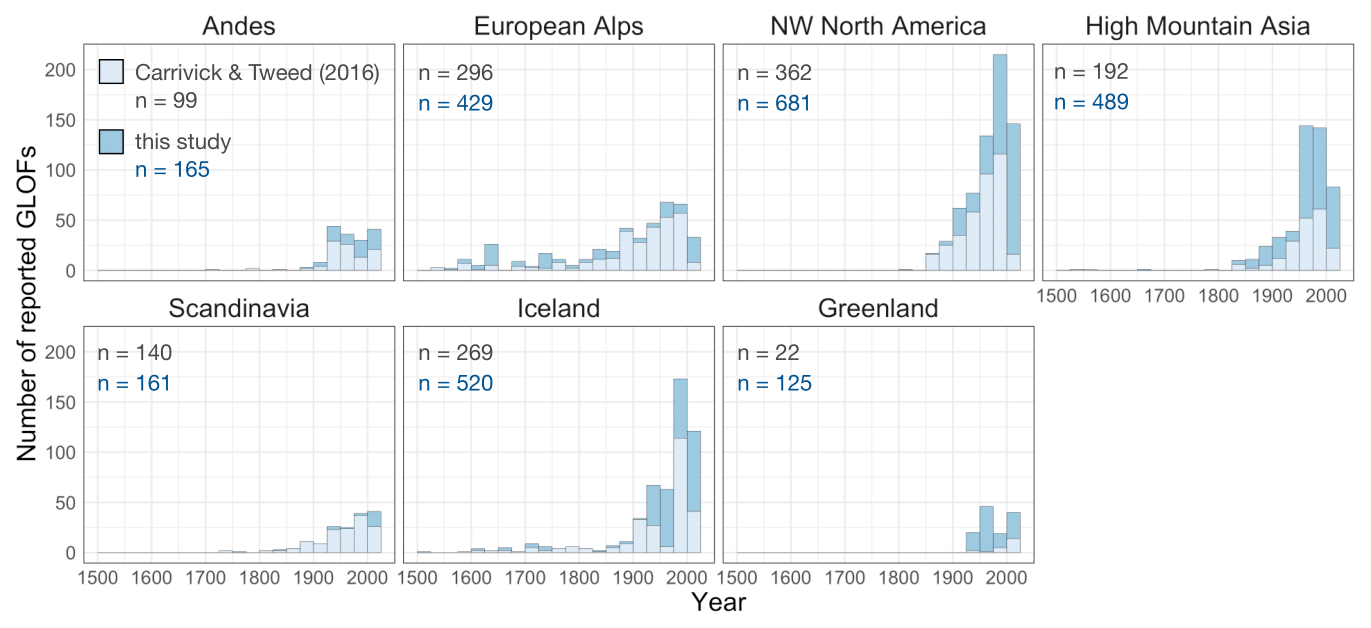
Figure 10Number of reported GLOFs with yearly timestamps in 25-year bins. We compare data from Carrivick and Tweed (2016) and our study between 1500 and 2015 and exclude five GLOFs that happened before 1500 for display purposes.
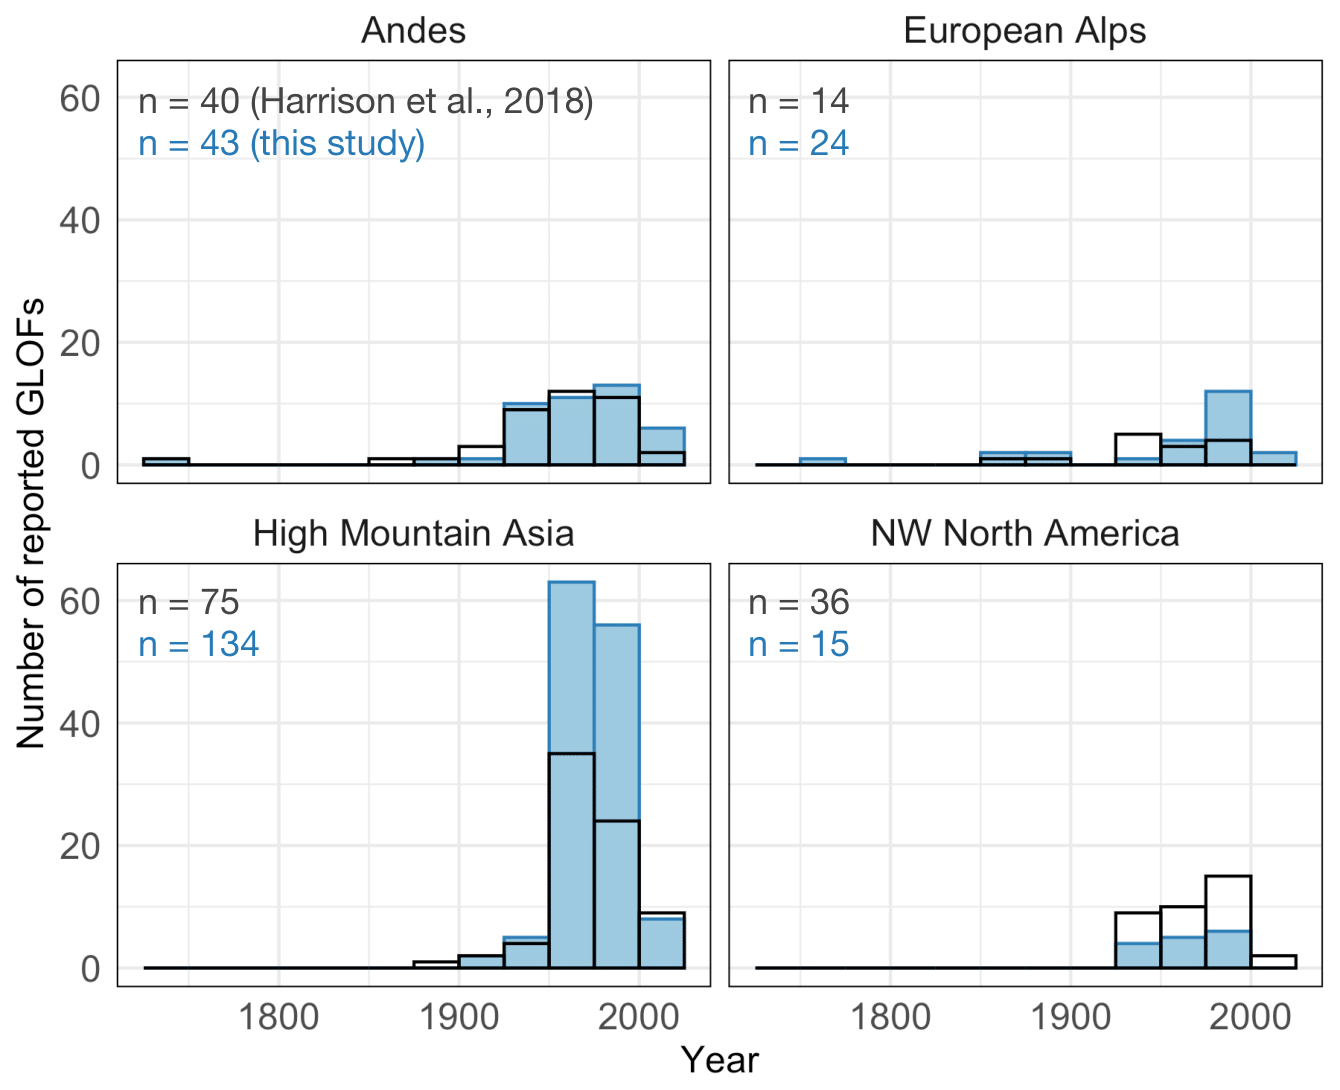
Figure 11Number of reported outbursts from moraine-dammed lakes with explicit year reported by Harrison et al. (2018) and this study. Data are aggregated into 25-year bins and refer to the same regions and period (1725–2011).
We filtered our database for moraine-dammed lakes and compared them to the study by Harrison et al. (2018) during the same observation period (1725–2011). We find that our database contains 51 additional cases (+31 %) but fewer cases in NW North America (Fig. 11). We recall that our main criteria for data selection are accurate information on location and timing and a reference. Hence, we discarded all cases with vague descriptions of their origin (i.e. only country or mountain range), without a distinct timestamp or time range of occurrence, or without a reference. For example, we excluded two GLOFs from moraine-dammed lakes in British Columbia, in 1965, and Pakistan, in 1878, due to the lack of further locational information or any further description of the flood.
4.2 Limitations and possibilities for improvement
Our inventory shows that most GLOFs were reported with some delay, likely causing the decrease in the annual number of reported GLOFs between 2020 and 2022 (Fig. 6). Immediately reported GLOFs such as those determined by hydrometric stations, field photographs and videos, or satellites with high repeat rates are usually published through governmental websites or social media. These platforms help detect recent changes in GLOF activity and magnitude and have the potential to inform early-warning systems (Huggel et al., 2020; Wang et al., 2022). Most social media posts in our database were published either by public institutions (e.g. UNDP Pakistan, 2022) or researchers and therefore can be considered reliable. In a few cases, posts on social networks mistook mass flows such as debris flows, flash floods, or rock ice avalanches for GLOFs. Future validation processes could be eased and improved using remote sensing products offering high spatial and temporal resolution. However, at present, access to these products is often restricted to specific user groups or to commercial licenses. In such cases, local experts are important for identifying and validating individual GLOFs and maintaining quality standards of our database. We acknowledge that our database misses an unknown number of GLOFs because these cases are neither reported, nor are the underlying data freely accessible. Consequently, we thoroughly analysed possible reporting biases on an earlier version (V2.0) of our inventory (Veh et al., 2022). Our estimates indicate that in the early 20th to mid-20th century, on average two to four out of five GLOFs might have gone unnoticed. Since the 1970s, remote sensing has improved GLOF detection and reporting, in particular with the launch of continuous satellite missions such as the Landsat programme (Wulder et al., 2022).
We further acknowledge that some of our numeric parameters such as VL, V0, and Qp come with uncertainties since reporting standards might not be consistent throughout the database. Stream gauges sample GLOF discharges at different distances from the source, as flood data are often obtained close to built-up areas (Krabbenhoft et al., 2022). Gauged or estimated values of Qp may or may not include the baseflow of the affected river (Carrivick and Tweed, 2016). Moreover, installing stream gauges largely depends on the accessibility and the local river properties, making a standardized gauging scheme less practical on global scale. We accounted for these differences in measuring and reporting by compiling all available information on how values were obtained in our inventory. However, some data services publish information on GLOF peak discharge and volume without information on the underlying methods and might need further quality control. Regional inventories offer extensive collections of flood magnitudes from previous studies but hardly disclose how those measurements were obtained (Alaska Glacier Dammed Lake Database; https://www.weather.gov/aprfc/gdlMain, last access: 19 October 2022; Bhambri et al., 2019; Bazai et al., 2021). Hence, the method for estimating flood volume or the technical equipment for measuring flood discharges remains unknown in some cases. We recommend that future studies are explicit on how values were obtained given that V0 and Qp have become the most commonly used parameters to describe GLOF magnitudes (Walder and Costa, 1996; Harrison et al., 2018).
Many of the missing parameter values might be explained by the lower emphasis and less detailed description in former studies. For example, damage data might be less complete in some regions because governmental responsibilities and political priorities are unclear or difficult to follow (Carrivick and Tweed, 2016). Some studies simply put GLOFs in a broader context, such as in describing regional geomorphology or hazards, with less focus on the flood characteristics of single outbursts (Brabets, 1996; Fort, 2015). Consequently, some of the included parameters leave room for improvement with regards to data density. For example, the number of cases with reported lake volume VL and flood volume V0 could potentially be improved by using our mapped lake area data, for example, by intersecting the lake outline with bathymetric data (Muñoz et al., 2020). Estimates of VL and V0 might also come from empirical relationships between lake area and volume (Cook and Quincey, 2015; O'Connor et al., 2001) or geometric lake parameters such as the lake width to length ratio (Qi et al., 2022) because the lake bathymetry is often unknown. Similarly, data density of Qp could potentially be improved by using scaling relationships between Qp and V0 (Clague and Mathews, 1973; Evans, 1986) or the diameter of transported boulders (Strand, 1977; Costa, 1983; Gurung et al., 2017). Radar data with high spatial resolution and comparably short revisit times, such as Sentinel-1 (2022), could be used to improve the data density of Ab and Aa. Radar is particularly useful in regions with frequent cloud cover such as Iceland because the signal can penetrate clouds (Wangchuk and Bolch, 2020).
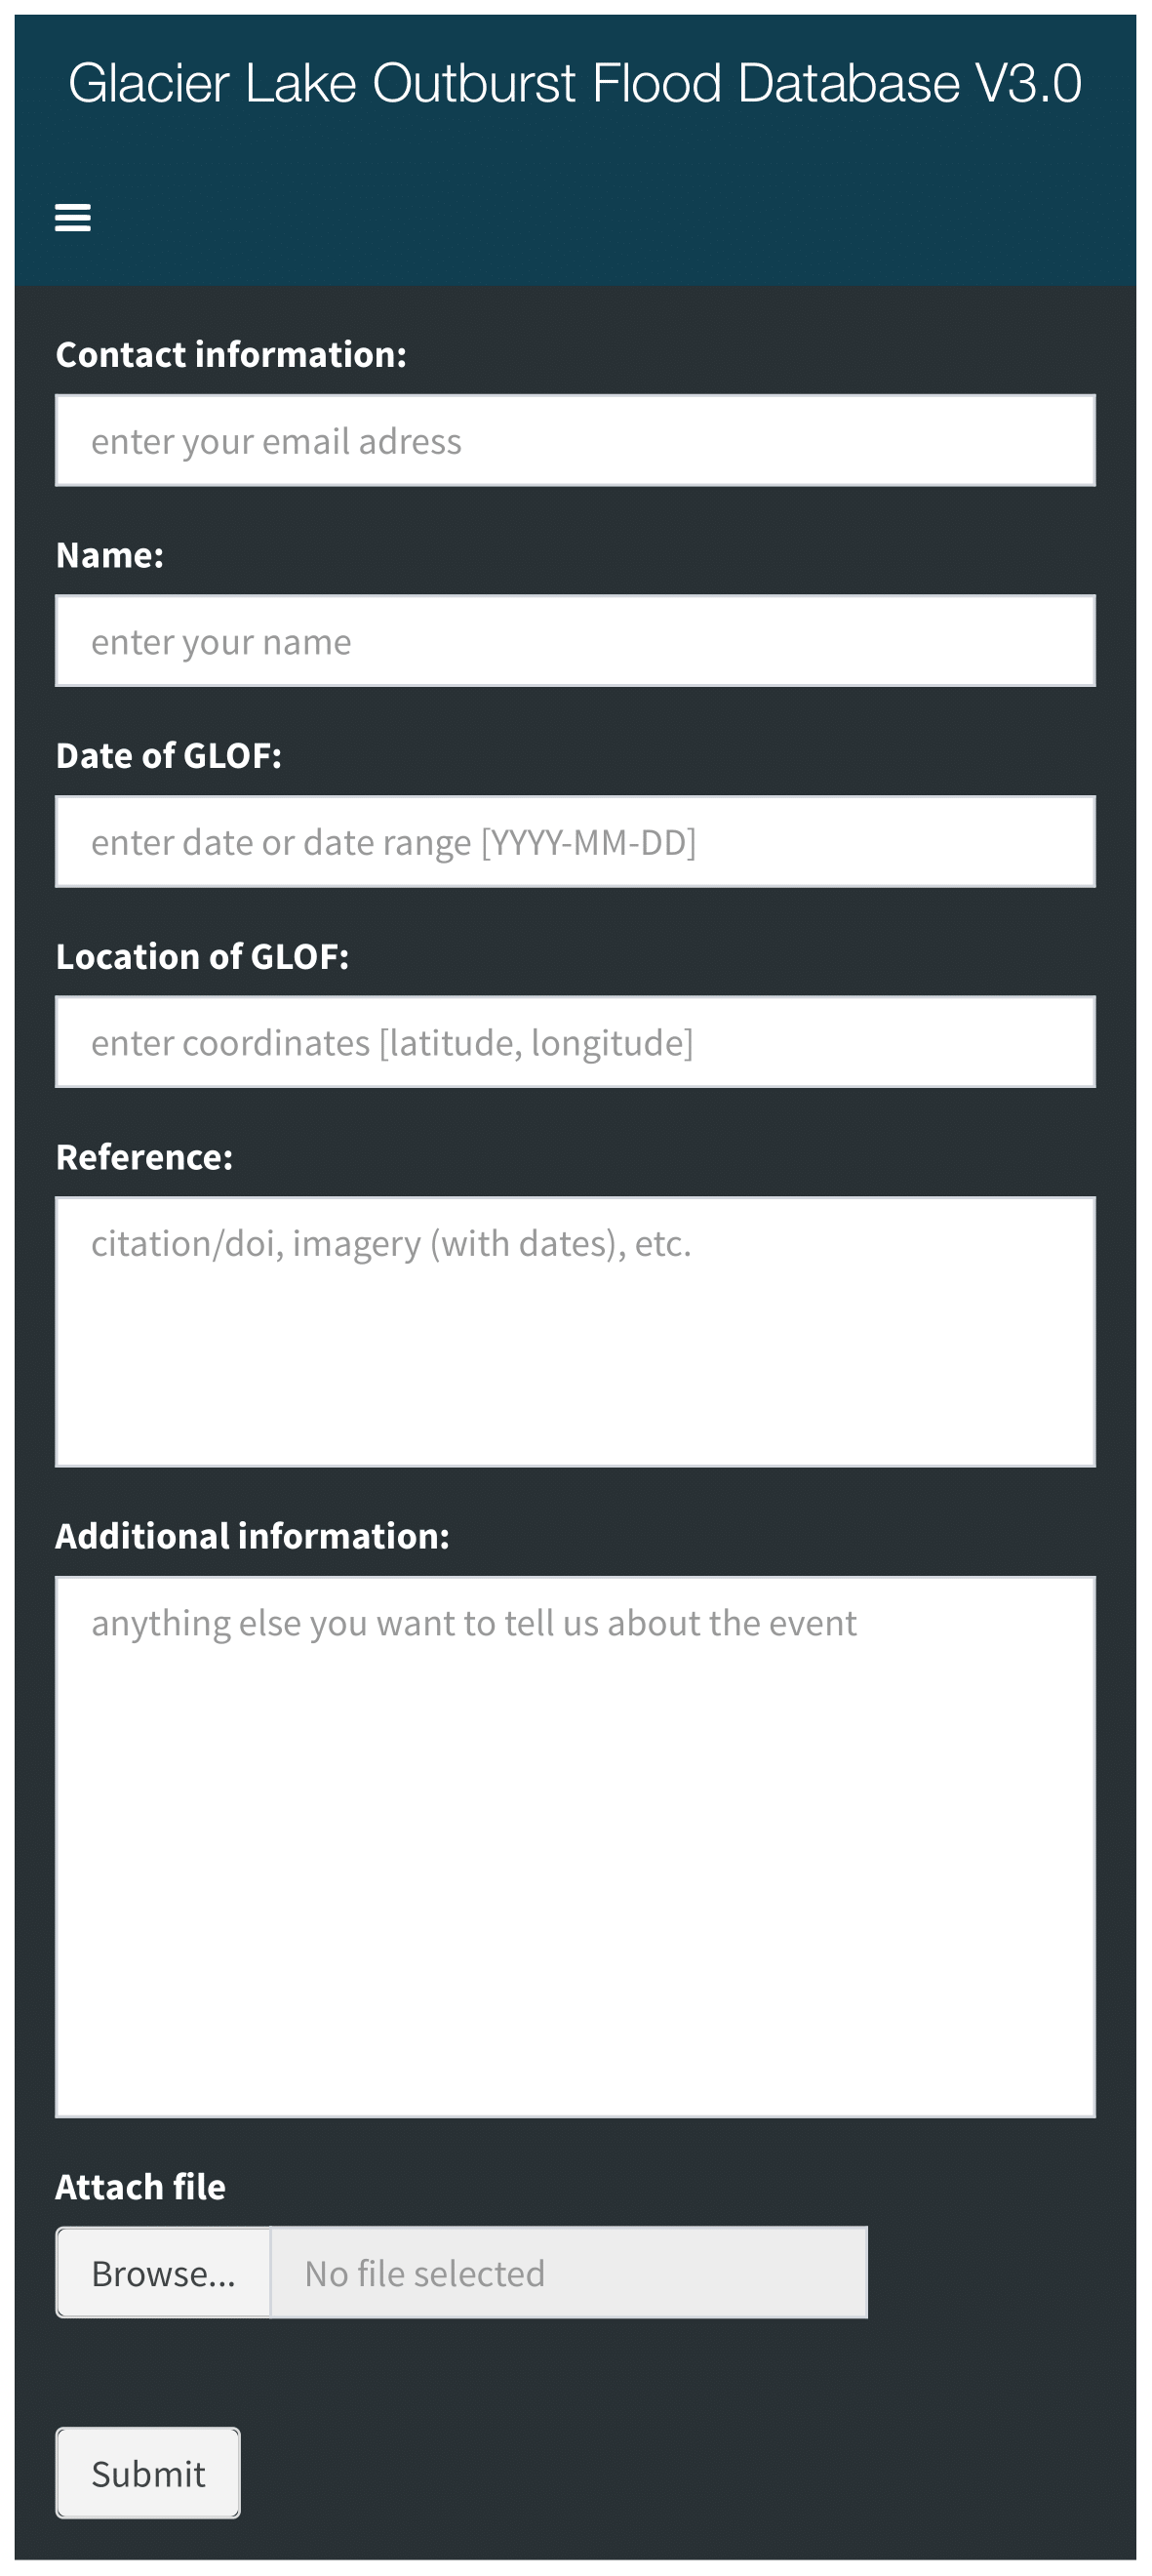
Figure 12Submission form on http://glofs.geoecology.uni-potsdam.de (last access: 9 May 2023) that users can use to report missing or recently occurred GLOFs.
Following our parameter scheme, any newly available information on historic and recent GLOFs can now be categorized and implemented in our inventory. Our database can be extended by parameters that may become necessary for future analysis to assess links between GLOF triggers, glacier decay, and GLOF activity and magnitude. For example, the glacier area derived from the RGI provides important insights into local glacier settings but shows only a snapshot of the ice extent in a given year. This issue became particularly visible at some former GLOF locations at which the local glacier had already disappeared until the time the RGI was created. Thus, the RGI data are less suitable to quantify and link local glacier changes with the reported GLOFs, especially given accelerating rates of glacier retreat in recent years (Hugonnet et al., 2021). Therefore, parameters describing the dynamic glacier properties, for instance, the surge or retreat rate, might be more useful than the glacier area and thus could be included in future versions of our database. Additional parameters might also be added to better differentiate between GLOF triggers. New parameters might address if a GLOF followed extreme weather events, such as exceptionally high precipitation, or if the outburst is likely or known to be triggered by other external sources, for example, avalanches or landslides into the lake. For now, any information about the cause of a GLOF is only stored in the comments section. Parameters describing the local river system could further provide a base for the assessment of downstream flood impact. Informative parameters might include the length or width of the stream and the type and amount of transported material. However, these attributes might be prone to change since some of the floods have major geomorphic impacts and reshape the river. We further aim to extend our global inventory by focusing on regions beyond our main study regions (Fig. 1), for example, remote regions such as NE Canada, Antarctica, and Arctic Russia.
The global GLOF database (V3.1) is archived at https://doi.org/10.5281/zenodo.7330344 (Lützow and Veh, 2023a). The data are split by regions into separate tables in an OpenDocument spreadsheet that can be opened with free software such as LibreOffice or Apache OpenOffice. In each table, the columns denote the parameters, and rows are unique GLOFs.
Our database is an ongoing project, and we offer a web-based, interactive map that grants access to the most recent state of the database (http://glofs.geoecology.uni-potsdam.de, Lützow and Veh, 2023b). This website includes a submission form that enables the user to report missing or recently occurred GLOFs (Fig. 12). Users can also download all previous versions of the database from this interface.
The initial version (V1.0) of the database was released on 10 June 2021 and included information on GLOF location, timing, outburst characteristics, and references. Data on manually mapped lake areas were added with version 2.0 (1 March 2022). The current version, V3.1 (11 May 2023), offers categorized data on damage.
We collated a global GLOF inventory that more than doubles the number from previous appraisals. We propose a standardized protocol for reporting characteristic GLOF diagnostics such as location, date, hydrodynamic flood characteristics, flood impact, and reference. Following this approach, our collated database allows for objective comparisons on different spatial or temporal scales. Potential analysis based on the data might concern trends in GLOF occurrence, magnitude, and impact, providing a valuable base for future hazard, risk assessment, and early warning. Local analyses could address GLOF recurrence intervals to better reconcile them with design floods in river flood hydrology. On a global and regional scale, our database could help quantify the impact of global warming on the frequency, timing, and magnitude of GLOFs and investigate links between population growth and reported GLOF impacts. We find regional differences in GLOF reporting, reflected in the type and number of available research items. Areas with comparably high GLOF activity are potentially attributable to reporting biases. In this context, we acknowledge gaps in our database. Some of these gaps could be filled using the current parameters in combination with additional datasets. This study strongly benefited from the work with local experts, highlighting the importance of joint contribution within the research community. This motivates a versioned, continuously updated inventory, ultimately required to improve flood impact mitigation, including new strategies for sustainable socio-economic development and the management of the fragile ecosystems that get temporarily disturbed by these floods.
NL and GV designed the study and collected data of historic GLOFs. NL led the writing of the manuscript, produced all figures, curated the database, and maintains the web interface. All authors contributed to the writing of the manuscript.
At least one of the (co-)authors is a member of the editorial board of Earth System Science Data. The peer-review process was guided by an independent editor, and the authors also have no other competing interests to declare.
Publisher’s note: Copernicus Publications remains neutral with regard to jurisdictional claims in published maps and institutional affiliations.
We are indebted to many colleagues who have helped collect data and shared their knowledge on historic outbursts: Pablo Iribarren Anacona, Jonathan Carrivick, Bergur Einarsson, Adam Emmer, Marten Geertsema, Matthias Huss, Miriam Jackson, Rex Johnston, Varvara Kharlamova, Dmitry Petrakov, Vanessa Round, Jakob Steiner, Fiona Tweed, and Mauro Werder. We thank Jenny Tamm for mapping the outlines of glacier lakes. We acknowledge a basic licence from the Education and Research programme from Planet Labs Inc. through the Planet Explorer (https://www.planet.com/, last access: 29 October 2022) and free access to the Landsat archive via the USGS Earth Explorer (https://earthexplorer.usgs.gov/, last access: 19 December 2022) to map glacier lakes.
This research has been supported by the Deutsche Forschungsgemeinschaft (grant no. VE 1363/2-1).
This paper was edited by Alexander Gelfan and reviewed by Adam Emmer and two anonymous referees.
Alaska Glacier Dammed Lake Database: https://www.weather.gov/aprfc/gdlMain, last access: 19 October 2022.
Allen, S. K., Rastner, P., Arora, M., Huggel, C., and Stoffel, M.: Lake outburst and debris flow disaster at Kedarnath, June 2013: hydrometeorological triggering and topographic predisposition, Landslides, 13, 1479–1491, https://doi.org/10.1007/s10346-015-0584-3, 2016.
Baretti, M.: Il lago del Rutor (Alpi Graie Settentrionali), Boll. Club Alpino It. N., 14, 43–95, 1880.
Bazai, N. A., Cui, P., Carling, P. A., Wang, H., Hassan, J., Liu, D., Zhang, G., and Jin, W.: Increasing glacial lake outburst flood hazard in response to surge glaciers in the Karakoram, Earth-Sci. Rev., 212, 103432, https://doi.org/10.1016/j.earscirev.2020.103432, 2021.
Benn, D. and Evans, D. J. A.: Glaciers and Glaciation, 2nd ed., Routledge, https://doi.org/10.4324/9780203785010, 2010.
Bhambri, R., Hewitt, K., Kawishwar, P., Kumar, A., Verma, A., Snehmani, Tiwari, S., and Misra, A.: Ice-dams, outburst floods, and movement heterogeneity of glaciers, Karakoram, Global Planet. Change, 180, 100–116, https://doi.org/10.1016/j.gloplacha.2019.05.004, 2019.
Brabets, T. P.: Geomorphology of the lower Copper River, Alaska, U.S. Geological Survey Professional Paper 1581, https://doi.org/10.3133/ofr96500, 1996.
Breien, H., De Blasio, F. V., Elverhøi, A., and Høeg, K.: Erosion and morphology of a debris flow caused by a glacial lake outburst flood, Western Norway, Landslides, 5, 271–280, https://doi.org/10.1007/s10346-008-0118-3, 2008.
Carey, M.: Living and dying with glaciers: people's historical vulnerability to avalanches and outburst floods in Peru, Global Planet. Change, 47, 122–134, https://doi.org/10.1016/j.gloplacha.2004.10.007, 2005.
Carrivick, J. L. and Tweed, F. S.: Proglacial Lakes: character, behaviour and geological importance, Quaternary Sci. Rev., 78, 34–52, 2013.
Carrivick, J. L. and Tweed, F. S.: A global assessment of the societal impacts of glacier outburst floods, Global Planet. Change, 144, 1–16, https://doi.org/10.1016/j.gloplacha.2016.07.001, 2016.
Carrivick, J. L. and Tweed, F. S.: A review of glacier outburst floods in Iceland and Greenland with a megafloods perspective, Earth-Sci. Rev., 196, 102876, https://doi.org/10.1016/j.earscirev.2019.102876, 2019.
Cenderelli, D. A. and Wohl, E. E.: Peak discharge estimates of glacial-lake outburst floods and “normal” climatic floods in the Mount Everest region, Nepal, Geomorphology, 40, 57–90, https://doi.org/10.1016/S0169-555X(01)00037-X, 2001.
Clague, J. J. and Evans, S. G.: A review of catastrophic drainage of moraine-dammed lakes in British Columbia, Quaternary Sci. Rev., 19, 1763–1783, https://doi.org/10.1016/S0277-3791(00)00090-1, 2000.
Clague, J. J. and Mathews, W. H.: The Magnitude of Jökulhlaups, J. Glaciol., 12, 501–504, https://doi.org/10.3189/S0022143000031907, 1973.
Clarke, G. K. C.: Glacier Outburst Floods From “Hazard Lake”, Yukon Territory, and the Problem of Flood Magnitude Prediction, J. Glaciol., 28, 3–21, https://doi.org/10.3189/S0022143000011746, 1982.
Compagno, L., Huss, M., Zekollari, H., Miles, E. S., and Farinotti, D.: Future growth and decline of high mountain Asia's ice-dammed lakes and associated risk, Commun. Earth Environ., 3, 191, https://doi.org/10.1038/s43247-022-00520-8, 2022.
Cook, K. L., Andermann, C., Gimbert, F., Adhikari, B. R., and Hovius, N.: Glacial lake outburst floods as drivers of fluvial erosion in the Himalaya, Science, 362, 53–57, https://doi.org/10.1126/science.aat4981, 2018.
Cook, S. J. and Quincey, D. J.: Estimating the volume of Alpine glacial lakes, Earth Surf. Dynam., 3, 559–575, https://doi.org/10.5194/esurf-3-559-2015, 2015.
Costa, J. E.: Paleohydraulic reconstruction of flash-flood peaks from boulder deposits in the Colorado Front Range, GSA Bulletin, 94, 986–1004, https://doi.org/10.1130/0016-7606(1983)94<986:PROFPF>2.0.CO;2, 1983.
Costa, J. E. and Schuster, R. L.: The formation and failure of natural dams, GSA Bulletin, 100, 1054–1068, https://doi.org/10.1130/0016-7606(1988)100<1054:TFAFON>2.3.CO;2, 1988.
Davies, T. R. H., Smart, C. C., and Turnbull, J. M.: Water and sediment outbursts from advanced Franz Josef Glacier, New Zealand, Earth Surf. Proc. Land., 28, 1081–1096, https://doi.org/10.1002/esp.515, 2003.
De Tillier, J.-B.: Histoire du Duché d'Aoste, 1738.
Eide, S.: Glacial-lake outburst floods of Harbardsbreen, Western Norway, and their relationship to long-term glacier mass balance and climate change, Master thesis, Western Norway University of Applied Sciences, https://hdl.handle.net/11250/2824935 (last access: 4 July 2023), 2021.
Emmer, A.: Glacier Retreat and Glacial Lake Outburst Floods (GLOFs), Oxford Research Encyclopedia of Natural Hazard Science, https://doi.org/10.1093/acrefore/9780199389407.013.275, 2017.
Emmer, A.: GLOFs in the WOS: bibliometrics, geographies and global trends of research on glacial lake outburst floods (Web of Science, 1979–2016), Nat. Hazards Earth Syst. Sci., 18, 813–827, https://doi.org/10.5194/nhess-18-813-2018, 2018.
Emmer, A., Vilímek, V., Huggel, C., Klimeš, J., and Schaub, Y.: Limits and challenges to compiling and developing a database of glacial lake outburst floods, Landslides, 13, 1579–1584, https://doi.org/10.1007/s10346-016-0686-6, 2016.
Emmer, A., Mergili, M., and Veh, G.: 4.17 – Glacial Lake Outburst Floods: Geomorphological Agents and Hazardous Phenomena, in: Treatise on Geomorphology (Second Edition), edited by: Shroder, J. F., Academic Press, Oxford, 313–329, https://doi.org/10.1016/B978-0-12-818234-5.00057-2, 2022a.
Emmer, A., Wood, J. L., Cook, S. J., Harrison, S., Wilson, R., Diaz-Moreno, A., Reynolds, J. M., Torres, J. C., Yarleque, C., Mergili, M., Jara, H. W., Bennett, G., Caballero, A., Glasser, N. F., Melgarejo, E., Riveros, C., Shannon, S., Turpo, E., Tinoco, T., Torres, L., Garay, D., Villafane, H., Garrido, H., Martinez, C., Apaza, N., Araujo, J., and Poma, C.: 160 glacial lake outburst floods (GLOFs) across the Tropical Andes since the Little Ice Age, Global Planet. Change, 208, 103722, https://doi.org/10.1016/j.gloplacha.2021.103722, 2022b.
Emmer, A., Allen, S. K., Carey, M., Frey, H., Huggel, C., Korup, O., Mergili, M., Sattar, A., Veh, G., Chen, T. Y., Cook, S. J., Correas-Gonzalez, M., Das, S., Diaz Moreno, A., Drenkhan, F., Fischer, M., Immerzeel, W. W., Izagirre, E., Joshi, R. C., Kougkoulos, I., Kuyakanon Knapp, R., Li, D., Majeed, U., Matti, S., Moulton, H., Nick, F., Piroton, V., Rashid, I., Reza, M., Ribeiro de Figueiredo, A., Riveros, C., Shrestha, F., Shrestha, M., Steiner, J., Walker-Crawford, N., Wood, J. L., and Yde, J. C.: Progress and challenges in glacial lake outburst flood research (2017–2021): a research community perspective, Nat. Hazards Earth Syst. Sci., 22, 3041–3061, https://doi.org/10.5194/nhess-22-3041-2022, 2022c.
ESRI: World Topographic Map, https://www.arcgis.com/home/item.html?id=7dc6cea0b1764a1f9af2e679f642f0f5, last access: 19 December 2022.
Evans, S. G.: The maximum discharge of outburst floods caused by the breaching of man-made and natural dams, Can. Geotech. J., 23, 385–387, https://doi.org/10.1139/t86-053, 1986.
Farinotti, D., Huss, M., Fürst, J. J., Landmann, J., Machguth, H., Maussion, F., and Pandit, A.: A consensus estimate for the ice thickness distribution of all glaciers on Earth, Nat. Geosci., 12, 168–173, https://doi.org/10.1038/s41561-019-0300-3, 2019.
Forel, F. A., Du Pasquier, L., and Mercanton, P.-L.: Les variations périodiques des glaciers des Alpes, Annuaire du C.A.S. Staempfli Berne, 1882.
Fort, M.: Natural hazards versus climate change and their potential impacts in the dry, northern Himalayas: focus on the upper Kali Gandaki (Mustang District, Nepal), Environ. Earth Sci., 73, 801–814, https://doi.org/10.1007/s12665-014-3087-y, 2015.
Fowler, A. C.: Breaking the seal at Grímsvötn, Iceland, J. Glaciol., 45, 506–516, https://doi.org/10.3189/S0022143000001362, 1999.
Fushimi, H.: Nepal case study: catastrophic floods, Techniques for prediction of runoff from glacierized areas, International Association of Hydrological Sciences, 149, 125–130, 1985
Geertsema, M., Menounos, B., Bullard, G., Carrivick, J. L., Clague, J. J., Dai, C., Donati, D., Ekstrom, G., Jackson, J. M., Lynett, P., Pichierri, M., Pon, A., Shugar, D. H., Stead, D., Del Bel Belluz, J., Friele, P., Giesbrecht, I., Heathfield, D., Millard, T., Nasonova, S., Schaeffer, A. J., Ward, B. C., Blaney, D., Blaney, E., Brillon, C., Bunn, C., Floyd, W., Higman, B., Hughes, K. E., McInnes, W., Mukherjee, K., and Sharp, M. A.: The 28 November 2020 Landslide, Tsunami, and Outburst Flood – A Hazard Cascade Associated With Rapid Deglaciation at Elliot Creek, British Columbia, Canada, Geophys. Res. Lett., 49, e2021GL096716, https://doi.org/10.1029/2021GL096716, 2022.
GLACIORISK: GLACIORISK Glacier risks data base, http://www.nimbus.it/glaciorisk/gridabasemainmenu.asp, last access: 27 October 2022.
Goodsell, B., Anderson, B., Lawson, W. J., and Owens, I. F.: Outburst flooding at Franz Josef Glacier, South Westland, New Zealand, New Zeal. J. Geol. Geop., 48, 95–104, https://doi.org/10.1080/00288306.2005.9515101, 2005.
Google Earth Engine Data Catalog: https://developers.google.com/earth-engine/datasets/catalog/landsat, last access: 29 October 2022.
Gudmundsson, M. T., Björnsson, H., and Pálsson, F.: Changes in jökulhlaup sizes in Grímsvötn, Vatnajökull, Iceland, 1934-91, deduced from in-situ measurements of subglacial lake volume, J. Glaciol., 41, 263–272, https://doi.org/10.3189/S0022143000016166, 1995.
Gurung, D. R., Khanal, N. R., Bajracharya, S. R., Tsering, K., Joshi, S., Tshering, P., Chhetri, L. K., Lotay, Y., and Penjor, T.: Lemthang Tsho glacial Lake outburst flood (GLOF) in Bhutan: cause and impact, Geoenvironmental Disasters, 4, 17, https://doi.org/10.1186/s40677-017-0080-2, 2017.
Haeberli, W.: Frequency and Characteristics of Glacier Floods in the Swiss Alps, Ann. Glaciol., 4, 85–90, https://doi.org/10.3189/S0260305500005280, 1983.
Haeberli, W., Schaub, Y., and Huggel, C.: Increasing risks related to landslides from degrading permafrost into new lakes in de-glaciating mountain ranges, Geomorphology, 293, 405–417, https://doi.org/10.1016/j.geomorph.2016.02.009, 2017.
Harrison, S., Kargel, J. S., Huggel, C., Reynolds, J., Shugar, D. H., Betts, R. A., Emmer, A., Glasser, N., Haritashya, U. K., Klimeš, J., Reinhardt, L., Schaub, Y., Wiltshire, A., Regmi, D., and Vilímek, V.: Climate change and the global pattern of moraine-dammed glacial lake outburst floods, The Cryosphere, 12, 1195–1209, https://doi.org/10.5194/tc-12-1195-2018, 2018.
Hewitt, K.: Glaciers of the Karakoram Himalaya, in: Encyclopedia of Snow, Ice and Glaciers, edited by: Singh, V. P., Singh, P., and Haritashya, U. K., Springer Netherlands, Dordrecht, 429–436, https://doi.org/10.1007/978-90-481-2642-2_313, 2014.
Hewitt, K. and Liu, J.: Ice-Dammed Lakes and Outburst Floods, Karakoram Himalaya: Historical Perspectives on Emerging Threats, Phys. Geogr., 31, 528–551, https://doi.org/10.2747/0272-3646.31.6.528, 2010.
Hock, R., Rasul, G., Adler, C., Cáceres, B., Gruber, S., Hirabayashi, Y., Jackson, M., Kääb, A., Kang, S., Kutuzov, S., Milner, A., Molau, U., Morin, S., Orlove, B., and Steltzer, H.: High Mountain Areas, in: IPCC Special Report on the Ocean and Cryosphere in a Changing Climate, Cambridge University Press, Cambridge, UK and New York, NY, USA, 131–202, https://doi.org/10.1017/9781009157964.004, 2019.
Huggel, C., Cochachin, A., Drenkhan, F., Fluixa-Sanmartin, J., Frey, H., Garcia Hernandez, J., Jurt, C., Muñoz Asmat, R., Price, K., and Vicuña, L.: Glacier Lake 513, Peru: Lessons for early warning service development, WMO Bulletin, 69, 45–52, 2020.
Hugonnet, R., McNabb, R., Berthier, E., Menounos, B., Nuth, C., Girod, L., Farinotti, D., Huss, M., Dussaillant, I., Brun, F., and Kääb, A.: Accelerated global glacier mass loss in the early twenty-first century, Nature, 592, 726–731, https://doi.org/10.1038/s41586-021-03436-z, 2021.
Huss, M., Bauder, A., Werder, M., Funk, M., and Hock, R.: Glacier-dammed lake outburst events of Gornersee, Switzerland, J. Glaciol., 53, 189–200, https://doi.org/10.3189/172756507782202784, 2007.
Iturrizaga, L.: Trends in 20th century and recent glacier fluctuations in the Karakoram Mountains, Z. Geomorphol., 55, 205–231, https://doi.org/10.1127/0372-8854/2011/0055S3-0059, 2011.
Jackson, M. and Ragulina, G.: Inventory of glacier-related hazardous events in Norway, Report 83 (Norwegian Water Resources and Energy Directorate), https://doi.org/10.13140/2.1.3462.0480, 2014.
Jacquet, J., McCoy, S. W., McGrath, D., Nimick, D. A., Fahey, M., O'kuinghttons, J., Friesen, B. A., and Leidich, J.: Hydrologic and geomorphic changes resulting from episodic glacial lake outburst floods: Rio Colonia, Patagonia, Chile, Geophys. Res. Lett., 44, 854–864, https://doi.org/10.1002/2016GL071374, 2017.
Kääb, A., Reynolds, J. M., and Haeberli, W.: Glacier and Permafrost Hazards in High Mountains, in: Global Change and Mountain Regions: An Overview of Current Knowledge, edited by: Huber, U. M., Bugmann, H. K. M., and Reasoner, M. A., Springer Netherlands, Dordrecht, 225–234, https://doi.org/10.1007/1-4020-3508-X_23, 2005.
Korup, O. and Tweed, F.: Ice, moraine, and landslide dams in mountainous terrain, Quaternary Sci. Rev., 26, 3406–3422, https://doi.org/10.1016/j.quascirev.2007.10.012, 2007.
Koven, C. D., Riley, W. J., and Stern, A.: Analysis of Permafrost Thermal Dynamics and Response to Climate Change in the CMIP5 Earth System Models, J. Climate, 26, 1877–1900, https://doi.org/10.1175/JCLI-D-12-00228.1, 2013.
Krabbenhoft, C. A., Allen, G. H., Lin, P., Godsey, S. E., Allen, D. C., Burrows, R. M., DelVecchia, A. G., Fritz, K. M., Shanafield, M., Burgin, A. J., Zimmer, M. A., Datry, T., Dodds, W. K., Jones, C. N., Mims, M. C., Franklin, C., Hammond, J. C., Zipper, S., Ward, A. S., Costigan, K. H., Beck, H. E., and Olden, J. D.: Assessing placement bias of the global river gauge network, Nature Sustainability, 5, 586–592, https://doi.org/10.1038/s41893-022-00873-0, 2022.
Liestøl, O.: Glacier Dammed Lakes in Norway, Norsk Geogr. Tidsskr., 15, 122–149, https://doi.org/10.1080/00291955608542772, 1956.
Lütschg, O.: Der Marjelensee und seine Abflussverhaltnisse, Annalen der Schweizerischen Landeshydrographie, 358 pp., 1915.
Lützow, N. and Veh, G.: Glacier Lake Outburst Flood Database, Zenodo [data set], https://doi.org/10.5281/zenodo.7330344, 2023a.
Lützow, N. and Veh, G.: Glacier Lake Outburst Flood Database, Version 3.1, http://glofs.geoecology.uni-potsdam.de, last access: 9 May 2023b.
Mathews, W. H. and Clague, J. J.: The record of jökulhlaups from Summit Lake, northwestern British Columbia, Can. J. Earth Sci., 30, 499–508, https://doi.org/10.1139/e93-039, 1993.
McKillop, R. J. and Clague, J. J.: Statistical, remote sensing-based approach for estimating the probability of catastrophic drainage from moraine-dammed lakes in southwestern British Columbia, Global Planet. Change, 56, 153–171, https://doi.org/10.1016/j.gloplacha.2006.07.004, 2007.
Muñoz, R., Huggel, C., Frey, H., Cochachin, A., and Haeberli, W.: Glacial lake depth and volume estimation based on a large bathymetric dataset from the Cordillera Blanca, Peru, Earth Surf. Proc. Land., 45, 1510–1527, https://doi.org/10.1002/esp.4826, 2020.
Nie, Y., Liu, Q., Wang, J., Zhang, Y., Sheng, Y., and Liu, S.: An inventory of historical glacial lake outburst floods in the Himalayas based on remote sensing observations and geomorphological analysis, Geomorphology, 308, 91–106, https://doi.org/10.1016/j.geomorph.2018.02.002, 2018.
NVE Glacier inventory: http://glacier.nve.no/Glacier/viewer/GLOF/en/, last access: 2 November 2022.
Nye, J. F.: Water Flow in Glaciers: Jökulhlaups, Tunnels and Veins, J. Glaciol., 17, 181–207, https://doi.org/10.3189/S002214300001354X, 1976.
O'Connor, J. E., Hardison, J. H., and Costa, J. E.: Debris flows from failures of neoglacial-age moraine dams in the Three Sisters and Mount Jefferson Wilderness areas, Oregon, U.S. Geological Survey Professional Paper 1606, https://doi.org/10.3133/pp1606, 2001.
OpenStreetMap: OpenTopoMap, https://opentopomap.org/credits, last accessed: 19 December 2022.
Osti, R. and Egashira, S.: Hydrodynamic characteristics of the Tam Pokhari glacial lake outburst flood in the Mt. Everest region, Nepal, Hydrol. Process., 23, 2943–2955, https://doi.org/10.1002/hyp.7405, 2009.
Otto, J.-C.: Proglacial Lakes in High Mountain Environments, in: Geomorphology of Proglacial Systems: Landform and Sediment Dynamics in Recently Deglaciated Alpine Landscapes, edited by: Heckmann, T. and Morche, D., Springer International Publishing, Cham, 231–247, https://doi.org/10.1007/978-3-319-94184-4_14, 2019.
Pebesma, E.: Simple Features for R: Standardized Support for Spatial Vector Data, R Journal 10, 439–446, https://doi.org/10.32614/RJ-2018-009, 2018.
Pitman, K. J., Moore, J. W., Huss, M., Sloat, M. R., Whited, D. C., Beechie, T. J., Brenner, R., Hood, E. W., Milner, A. M., Pess, G. R., Reeves, G. H., and Schindler, D. E.: Glacier retreat creating new Pacific salmon habitat in western North America, Nat. Commun., 12, 6816, https://doi.org/10.1038/s41467-021-26897-2, 2021.
Planet Explorer: https://www.planet.com/products/explorer/, last access: 29 October 2022.
Post, A. and Mayo, L. R.: Glacier dammed lakes and outburst floods in Alaska, Hydrologic Atlas 455, https://doi.org/10.3133/ha455, 1971.
Poznanin, V. L.: A mechanism on debris flow bursts of the Kakhab Rosona moraine lake in Dagestan, Data of Glaciological studies, A A Balkema Publishers, 36, 218–222, 1979.
Pritchard, H. D.: Asia's shrinking glaciers protect large populations from drought stress, Nature, 569, 649–654, https://doi.org/10.1038/s41586-019-1240-1, 2019.
Qi, M., Liu, S., Wu, K., Zhu, Y., Xie, F., Jin, H., Gao, Y., and Yao, X.: Improving the accuracy of glacial lake volume estimation: A case study in the Poiqu basin, central Himalayas, J. Hydrol., 610, 127973, https://doi.org/10.1016/j.jhydrol.2022.127973, 2022.
R Core Team: R: A language and environment for statistical computing, R Foundation for Statistical Computing, Vienna, Austria, https://cran.r-project.org/, last access: 15 November 2022.
Rabot, C.: Glacial Reservoirs and Their Outbursts, Geogr. J., 25, 534–548, https://doi.org/10.2307/1776694, 1905.
RGI Consortium: Randolph Glacier inventory Version 6.0, http://www.glims.org/RGI/ (last access: 29 October 2022), 2017.
Richardson, S. D. and Reynolds, J. M.: An overview of glacial hazards in the Himalayas, Quatern. Int., 65–66, 31–47, https://doi.org/10.1016/S1040-6182(99)00035-X, 2000.
Richter, E.: Urkunden über die Ausbrüche des Vernagt- und Gurglergletschers im 17. und 18. Jahrhundert aus den Innsbrucker Archiven, vol. 4, Engelhorn, Stuttgart, 1892.
Rickman, R. L. and Rosenkrans, D. S.: Hydrologic conditions and hazards in the Kennicott River Basin, Wrangell-St. Elias National Park and Preserve, Alaska, U.S. Geological Survey Water-Resources Investigations Report 96-4296, https://doi.org/10.3133/wri964296, 1997.
Röthlisberger, H.: Water Pressure in Intra- and Subglacial Channels, J. Glaciol., 11, 177–203, https://doi.org/10.3189/S0022143000022188, 1972.
Sentinel-1: https://sentinels.copernicus.eu/web/sentinel/missions/sentinel-1, last access: 14 November 2022.
Shrestha, A. B., Eriksson, M., Mool, P., Ghimire, P., Mishra, B., and Khanal, N. R.: Glacial lake outburst flood risk assessment of Sun Koshi basin, Nepal, Geomatics, Natural Hazards and Risk, 1, 157–169, https://doi.org/10.1080/19475701003668968, 2010.
Shugar, D. H., Burr, A., Haritashya, U. K., Kargel, J. S., Watson, C. S., Kennedy, M. C., Bevington, A. R., Betts, R. A., Harrison, S., and Strattman, K.: Rapid worldwide growth of glacial lakes since 1990, Nat. Clim. Change, 10, 939–945, https://doi.org/10.1038/s41558-020-0855-4, 2020.
Strand, R. I.: Design of small dams, Reservoir sedimentation, US Bureau of Reclamation, Water Resources Technical Publications, 767–796, 1977.
Stuart-Smith, R. F., Roe, G. H., Li, S., and Allen, M. R.: Increased outburst flood hazard from Lake Palcacocha due to human-induced glacier retreat, Nat. Geosci., 14, 85–90, https://doi.org/10.1038/s41561-021-00686-4, 2021.
Tomczyk, A. M., Ewertowski, M. W., and Carrivick, J. L.: Geomorphological impacts of a glacier lake outburst flood in the high arctic Zackenberg River, NE Greenland, J. Hydrol., 591, 125300, https://doi.org/10.1016/j.jhydrol.2020.125300, 2020.
UNDP Pakistan: https://mobile.twitter.com/undp_pakistan, last accessed: 14 November 2022.
U.S. Department of Agriculture: National Soil Survey Handbook, Title 430 – VI – Part 629 Glossary of Landform and Geologic Terms, U.S. Department of Agriculture N.R.C.S, 2016.
USGS Earth Explorer: https://earthexplorer.usgs.gov/, last access: 19 December 2022.
VAW: Inventar gefährlicher Gletscher in der Schweiz, ETH Zürich, Versuchsanstalt für Wasserbau Mitteilungen 182, ISSN 0374-0056, 2003.
Veh, G., Korup, O., von Specht, S., Roessner, S., and Walz, A.: Unchanged frequency of moraine-dammed glacial lake outburst floods in the Himalaya, Nat. Clim. Change, 9, 379–383, https://doi.org/10.1038/s41558-019-0437-5, 2019.
Veh, G., Korup, O., and Walz, A.: Hazard from Himalayan glacier lake outburst floods, P. Natl. Acad. Sci. USA, 117, 907–912, https://doi.org/10.1073/pnas.1914898117, 2020.
Veh, G., Lützow, N., Kharlamova, V., Petrakov, D., Hugonnet, R., and Korup, O.: Trends, Breaks, and Biases in the Frequency of Reported Glacier Lake Outburst Floods, Earth's Future, 10, e2021EF002426, https://doi.org/10.1029/2021EF002426, 2022.
Walder, J. S. and Costa, J. E.: Outburst floods from glacier-dammed lakes: The effect of mode of lake drainage on flood magnitude, Earth Surf. Proc. Land., 21, 701–723, https://doi.org/10.1002/(SICI)1096-9837(199608)21:8<701::AID-ESP615>3.0.CO;2-2, 1996.
Walder, J. S., Iverson, R. M., Godt, J. W., Logan, M., and Solovitz, S. A.: Controls on the breach geometry and flood hydrograph during overtopping of noncohesive earthen dams, Water Resour. Res., 51, 6701–6724, https://doi.org/10.1002/2014WR016620, 2015.
Wang, W., Gao, Y., Iribarren Anacona, P., Lei, Y., Xiang, Y., Zhang, G., Li, S., and Lu, A.: Integrated hazard assessment of Cirenmaco glacial lake in Zhangzangbo valley, Central Himalayas, Geomorphology, 306, 292–305, https://doi.org/10.1016/j.geomorph.2015.08.013, 2018.
Wang, W., Zhang, T., Yao, T., and An, B.: Monitoring and early warning system of Cirenmaco glacial lake in the central Himalayas, Int. J. Disast. Risk Re., 73, 102914, https://doi.org/10.1016/j.ijdrr.2022.102914, 2022.
Wangchuk, S. and Bolch, T.: Mapping of glacial lakes using Sentinel-1 and Sentinel-2 data and a random forest classifier: Strengths and challenges, Science of Remote Sensing, 2, 100008, https://doi.org/10.1016/j.srs.2020.100008, 2020.
Warren, C. R.: Freshwater calving and anomalous glacier oscillations: recent behaviour of Moreno and Ameghino Glaciers, Patagonia, Holocene, 4, 422–429, https://doi.org/10.1177/095968369400400410, 1994.
Weidinger, J. T., Wang, J., and Ma, N.: The earthquake-triggered rock avalanche of Cui Hua, Qin Ling Mountains, P. R. of China—the benefits of a lake-damming prehistoric natural disaster, Quatern. Int., 93–94, 207–214, https://doi.org/10.1016/S1040-6182(02)00019-8, 2002.
Westoby, M. J., Glasser, N. F., Brasington, J., Hambrey, M. J., Quincey, D. J., and Reynolds, J. M.: Modelling outburst floods from moraine-dammed glacial lakes, Earth-Sci. Rev., 134, 137–159, https://doi.org/10.1016/j.earscirev.2014.03.009, 2014.
Wilcox, A. C., Wade, A. A., and Evans, E. G.: Drainage events from a glacier-dammed lake, Bear Glacier, Alaska: Remote sensing and field observations, Geomorphology, 220, 41–49, https://doi.org/10.1016/j.geomorph.2014.05.025, 2014.
Wilson, R., Glasser, N. F., Reynolds, J. M., Harrison, S., Anacona, P. I., Schaefer, M., and Shannon, S.: Glacial lakes of the Central and Patagonian Andes, Global Planet. Change, 162, 275–291, https://doi.org/10.1016/j.gloplacha.2018.01.004, 2018.
Wolfe, D. F. G., Kargel, J. S., and Leonard, G. J.: Glacier-dammed ice-marginal lakes of Alaska, in: Global Land Ice Measurements from Space, edited by: Kargel, J. S., Leonard, G. J., Bishop, M. P., Kääb, A., and Raup, B. H., Springer Berlin Heidelberg, Berlin, Heidelberg, 263–295, https://doi.org/10.1007/978-3-540-79818-7_12, 2014.
Wulder, M. A., Roy, D. P., Radeloff, V. C., Loveland, T. R., Anderson, M. C., Johnson, D. M., Healey, S., Zhu, Z., Scambos, T. A., Pahlevan, N., Hansen, M., Gorelick, N., Crawford, C. J., Masek, J. G., Hermosilla, T., White, J. C., Belward, A. S., Schaaf, C., Woodcock, C. E., Huntington, J. L., Lymburner, L., Hostert, P., Gao, F., Lyapustin, A., Pekel, J.-F., Strobl, P., and Cook, B. D.: Fifty years of Landsat science and impacts, Remote Sensi. Environ., 280, 113195, https://doi.org/10.1016/j.rse.2022.113195, 2022.
Xu, D.: Characteristics of debris flow caused by outburst of glacial lake in Boqu river, Xizang, China, 1981, GeoJournal, 17, 569–580, https://doi.org/10.1007/BF00209443, 1988.