the Creative Commons Attribution 4.0 License.
the Creative Commons Attribution 4.0 License.
 | 21 Jun 2023
The UKSCAPE-G2G river flow and soil moisture datasets: Grid-to-Grid model estimates for the UK for historical and potential future climates
Victoria A. Bell
Helen N. Davies
Rosanna A. Lane
Alison C. Rudd
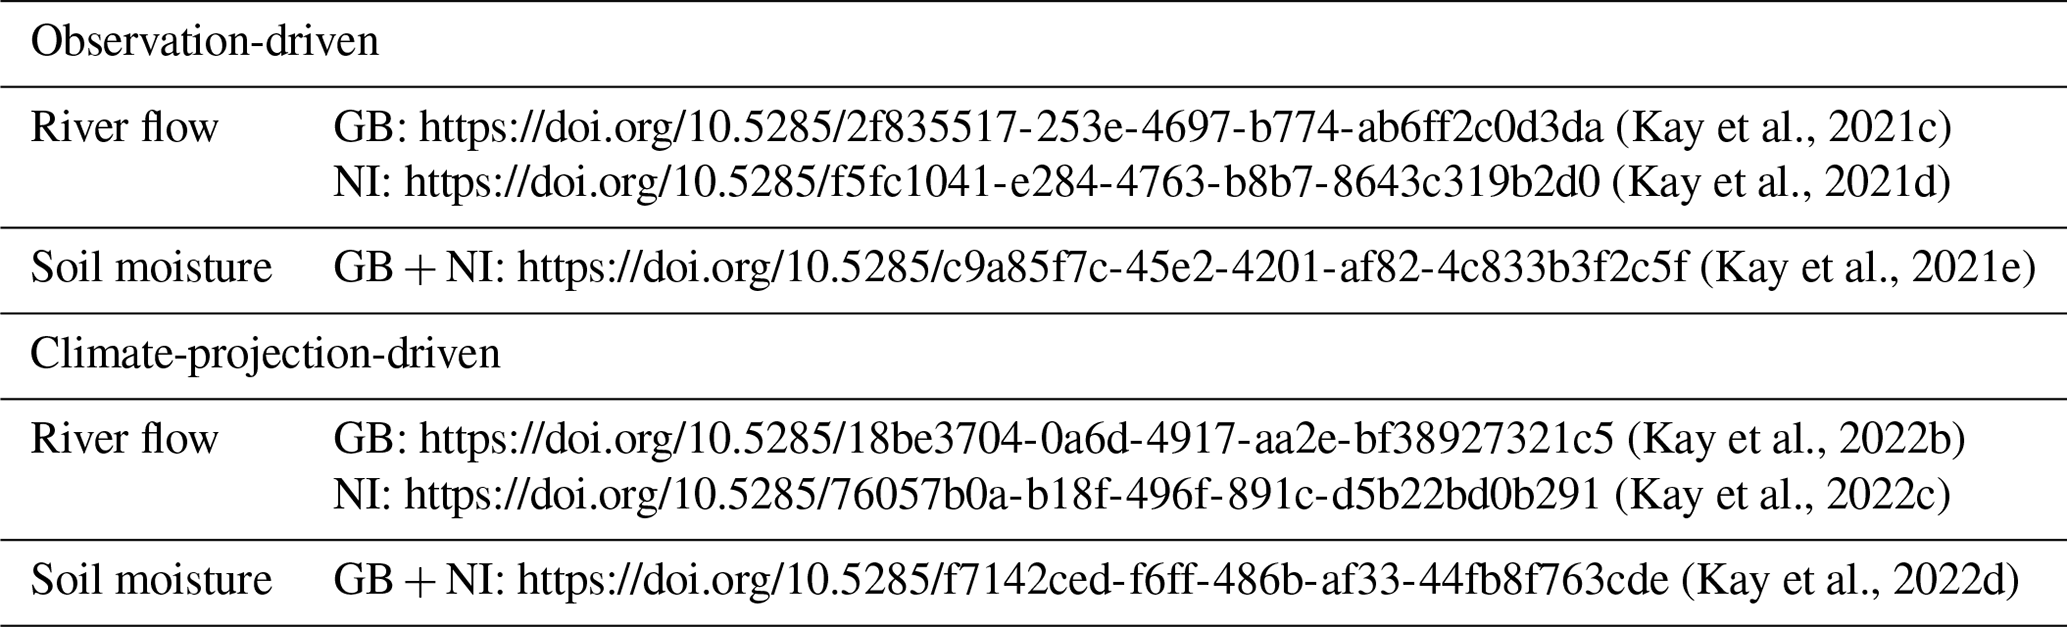
Appropriate adaptation planning is contingent upon information about the potential future impacts of climate change, and hydrological impact assessments are of particular importance. The UKSCAPE-G2G datasets were produced, as part of the Natural Environment Research Council (NERC) UK-SCAPE (UK Status, Change and Projections of the Environment) programme, to contribute to this information requirement. They use the Grid-to-Grid (G2G) national-scale hydrological model configured for both Great Britain and Northern Ireland (and the parts of the Republic of Ireland that drain to rivers in NI). Six separate datasets are provided, for two sets of driving data – one observation-based (1980–2011) and one climate-projection-based (1980–2080) – for both river flows and soil moisture on 1 km × 1 km grids across Great Britain and Northern Ireland. The river flow datasets include grids of monthly mean flow, annual maxima of daily mean flow, and annual minima of 7 d mean flow (m3 s−1). The soil moisture datasets are grids of monthly mean soil moisture content (m water m soil), which should be interpreted as depth-integrated values for the whole soil column. The climate-projection-based datasets are produced using data from the 12-member 12 km regional climate model ensemble of the latest UK climate projections (UKCP18), which uses RCP8.5 emissions. The production of the datasets is described, along with details of the file format and how the data should be used. Example maps are provided, as well as simple UK-wide analyses of the various outputs. These suggest potential future decreases in summer flows, annual minimum 7 d flows, and summer/autumn soil moisture, along with possible future increases in winter flows and annual maximum flows. References are given for published papers providing more detailed spatial analyses, and some further potential uses of the data are suggested. The datasets are listed in Table 1.
- Article
(10282 KB) - Full-text XML
- BibTeX
- EndNote


Information on the potential future impacts of climate change is crucial to enable appropriate adaptation planning, and impacts on the hydrological cycle and river flows are one of the main ways by which climate change will affect both society and the natural environment. UK-SCAPE (UK Status, Change And Projections of the Environment; https://uk-scape.ceh.ac.uk/, last access: 15 June 2023) is a 5-year programme funded by the Natural Environment Research Council (NERC) as part of a National Capability Science Single Centre award, and the main aim of Work Package 2.2 (WP2.2) of UK-SCAPE is to deliver data and analyses showing how future climate change could influence water quantity. The hydrological datasets presented here were produced as part of UK-SCAPE WP2.2.
The datasets consist of 1 km × 1 km gridded outputs from a national-scale hydrological model (Grid-to-Grid) and include both river flows and soil moisture for Great Britain (GB) and Northern Ireland (NI). The model has been driven with observation-based data and with an ensemble of regional climate model (RCM) data from the latest climate projections for the UK (UKCP18; Lowe et al., 2018). A summary of the six available datasets, including references, is provided in Table 1. The datasets have been used within UK-SCAPE WP2.2 to support analyses of potential future changes in river flows and soil moisture (Kay, 2021; Lane and Kay, 2021; Kay et al., 2021a, 2022a) but could also be used to support other hydrological research and wider studies such as ecological and agricultural modelling.
Section 2 describes how the datasets were produced, including the hydrological model and the driving data applied. Section 3 presents some high-level analyses of the datasets and describes the results of more detailed analyses presented in other published papers. Section 4 discusses potential uses and caveats, with conclusions in Sect. 6.
2.1 The hydrological model
Grid-to-Grid (G2G) is a national-scale grid-based hydrological model which typically operates on a 1 km × 1 km grid at a 15 min time step (Bell et al., 2009), with an optional snow module (Bell et al., 2016). It was originally configured to cover Great Britain (GB), on a spatial domain aligned with the GB national grid, but more recently a version was configured to cover Northern Ireland (NI) and areas in the Republic of Ireland (RoI) that drain into NI, also on a domain aligned with the GB national grid (Kay et al., 2021a). The G2G model is configured using spatial datasets (e.g. soil types, land cover, flow directions) in preference to parameter identification via calibration. Where model parameters are required (such as the wave speeds used in lateral routing), nationally applicable values are applied (Bell et al., 2009).
G2G has been shown to perform well for a wide range of catchments across GB and NI, including for the modelling of high flows/floods and low flows/droughts (Bell et al., 2009, 2016; Rudd et al., 2017; Formetta et al., 2018; Kay et al., 2021a, b). This is particularly the case for catchments with more natural flow regimes, as the model does not routinely account for artificial influences like abstractions/discharges (Rameshwaran et al., 2022). While the effect of urban/suburban land cover on runoff is accounted for, the effect of lake/reservoir storage and regulation is generally neglected at the national scale; lake grid cells are treated as though they were rivers. This has a minimal effect across most of GB; the largest lake in Scotland, Loch Lomond, has an area of ∼71 km2, and the largest lake in England, Windermere, has an area of ∼15 km2. But in NI the dominant presence of Lough Neagh (∼390 km2) limits model performance downstream (the Lower Bann river; Kay et al., 2021a), and Lough Erne in the south-west of NI is also relatively large (Upper and Lower Lough Erne have a combined area of ∼144 km2).
2.2 Observation-based driving data
Gridded time series of precipitation and potential evaporation (PE) are required to drive G2G, plus temperature for the snow module. The observation-based driving data are applied as follows:
-
Daily 1 km grids of precipitation (CEH-GEAR; Tanguy et al., 2016) are divided equally over each model time step within a day. For use in NI, they are first reprojected from the Irish national grid to the GB national grid.
-
Monthly 40 km grids of PE for short grass (MORECS; Hough and Jones, 1997) are copied down to the 1 km grid and then divided equally over each model time step within a month. For use in NI, they are first reprojected from the Irish national grid to the GB national grid. The data do not cover all the required parts of the UK, so they have been extended where necessary (i.e. some coastal areas and some parts of the RoI that drain into NI) by copying from the nearest cell with data.
-
Daily 1 km grids of min and max temperature (HadUK-Grid; Met Office, 2019) are interpolated through the day using a sine curve (Kay and Crooks, 2014). The data do not cover the required parts of the RoI, so they have been infilled from the nearest cell with data, using a lapse rate with elevation data (Morris and Flavin, 1990).
2.3 Climate-projection-based driving data
The climate change simulations use data from the UKCP18 Regional projections (Met Office Hadley Centre, 2018). These comprise a 12-member perturbed parameter ensemble (PPE) of the Hadley Centre ∼12 km regional climate model (RCM) nested in an equivalent PPE of their ∼60 km global climate model (GCM) (Murphy et al., 2018). Ensemble member 01 represents the standard parameterisation, with members 02–15 representing a range of credible variations in parameters (note that there are no RCM equivalents for GCM PPE members 02, 03, and 14). The data cover December 1980–November 2080 under just one emissions scenario, RCP8.5 (Riahi et al., 2011), and have a 360 d year (twelve 30 d months). The data are available reprojected from the native climate model grid onto a 12 km grid aligned with the GB national grid – the latter are used here.
The climate projection data are applied as follows:
-
Daily 12 km grids of precipitation are directly available from the UKCP18 Regional projections. These are first adjusted for bias using 12 km grids of monthly correction factors derived by comparing baseline values against CEH-GEAR data averaged up to the 12km resolution (Kay, 2021; Kay et al., 2021a). They are then spatially downscaled to 1 km using patterns of average annual rainfall (1961–1990; Bell et al., 2007; Kay et al., 2023) and divided equally over each model time step within a day (as for observed data).
-
Daily 12 km grids of PE are not directly available from the UKCP18 Regional projections. Instead, they are calculated from other meteorological variables in a way which closely replicates MORECS (as in Robinson et al., 2021, 2022, but using the bias-adjusted precipitation in the interception component). PE is only estimated for 12 km “land” RCM boxes; where PE is required for boxes classed as “sea” in the RCM, it is copied from the nearest 12 km “land” box. The method also includes increased stomatal resistance under future higher atmospheric CO2 concentrations (Rudd and Kay, 2016; Guillod et al., 2018). The 12 km PE data are copied down to the 1 km grid, then divided equally over each model time step within a month (as for observed data).
-
Daily 12 km grids of min and max temperature are directly available from the UKCP18 Regional projections. These are downscaled to 1 km using a lapse rate with elevation data, and they are interpolated through the day using a sine curve (as for observed data).
2.4 Hydrological model runs and outputs
The observation-based simulation (hereafter “SIMOBS”) is initialised using a states file saved at the end of a prior observation-based run (January 1970–November 1980). The same state initialisation file is used for each RCM-based simulation (hereafter “SIMRCM”).
Model outputs consist of 1 km × 1 km gridded time series of
-
monthly mean river flow (m3 s−1);
-
annual maxima (AMAX) of daily mean river flow (m3 s−1), for water years (October–September);
-
annual minima (AMIN) of 7 d mean river flow (m3 s−1), for years spanning December–November; and
-
monthly mean soil moisture content (m water m soil).
While it is possible to output 1 km × 1 km gridded daily time series from G2G, these are not typically produced as they are very large files (especially if long time periods are covered, as is the case for the SIMRCM runs). Instead, the AMAX and AMIN flows are calculated and saved during the model run, to enable analyses of high and low flows without saving daily gridded flows. The AMAX of daily mean flows are extracted for water years (October–September), to try to avoid extraction of the same high-flow event from consecutive years. AMIN extraction would usually use calendar years, but December–November is used here to match the climate model data running from December 1980 to November 2080, whilst still trying to avoid extraction of the same low-flow event from consecutive years.
The flow variables are provided for all non-sea and non-tidal 1 km cells with a catchment drainage area of at least 50 km2, while the soil moisture is provided for all non-sea 1 km cells. G2G soil moisture estimates are provided as monthly averages of daily mean soil moisture in the unsaturated zone, which can be interpreted as volumetric soil moisture content θ, where . In G2G soil depth can vary from a few centimetres to several metres, and soil moisture estimates should be interpreted as depth-integrated values for the whole soil column.
2.5 Format of the gridded datasets
The 1 km × 1 km gridded data are provided as a NetCDF4 file for each variable, following UK Centre for Ecology & Hydrology (UKCEH) gridded dataset conventions. The file naming convention is described in Table 2 for the observation-based datasets and Table 3 for the climate-projection-based datasets.
Table 2The file naming convention for the observation-based datasets.
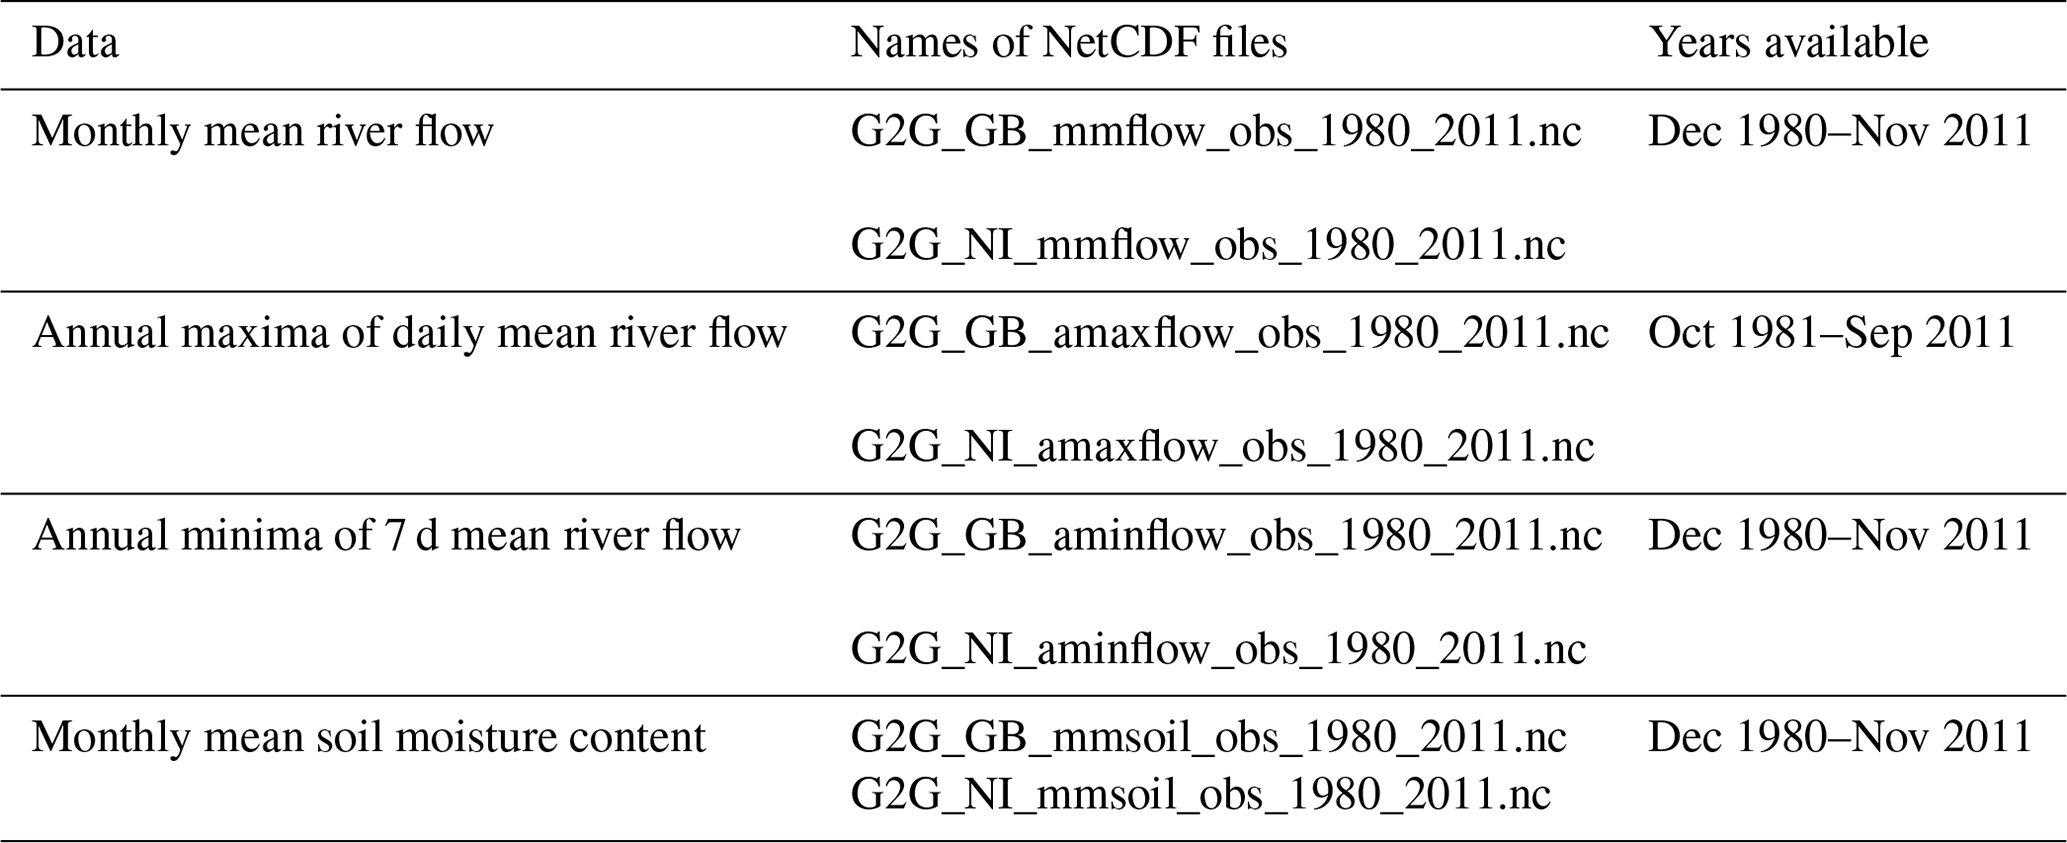
Table 3The file naming convention for the climate-projection-based datasets.
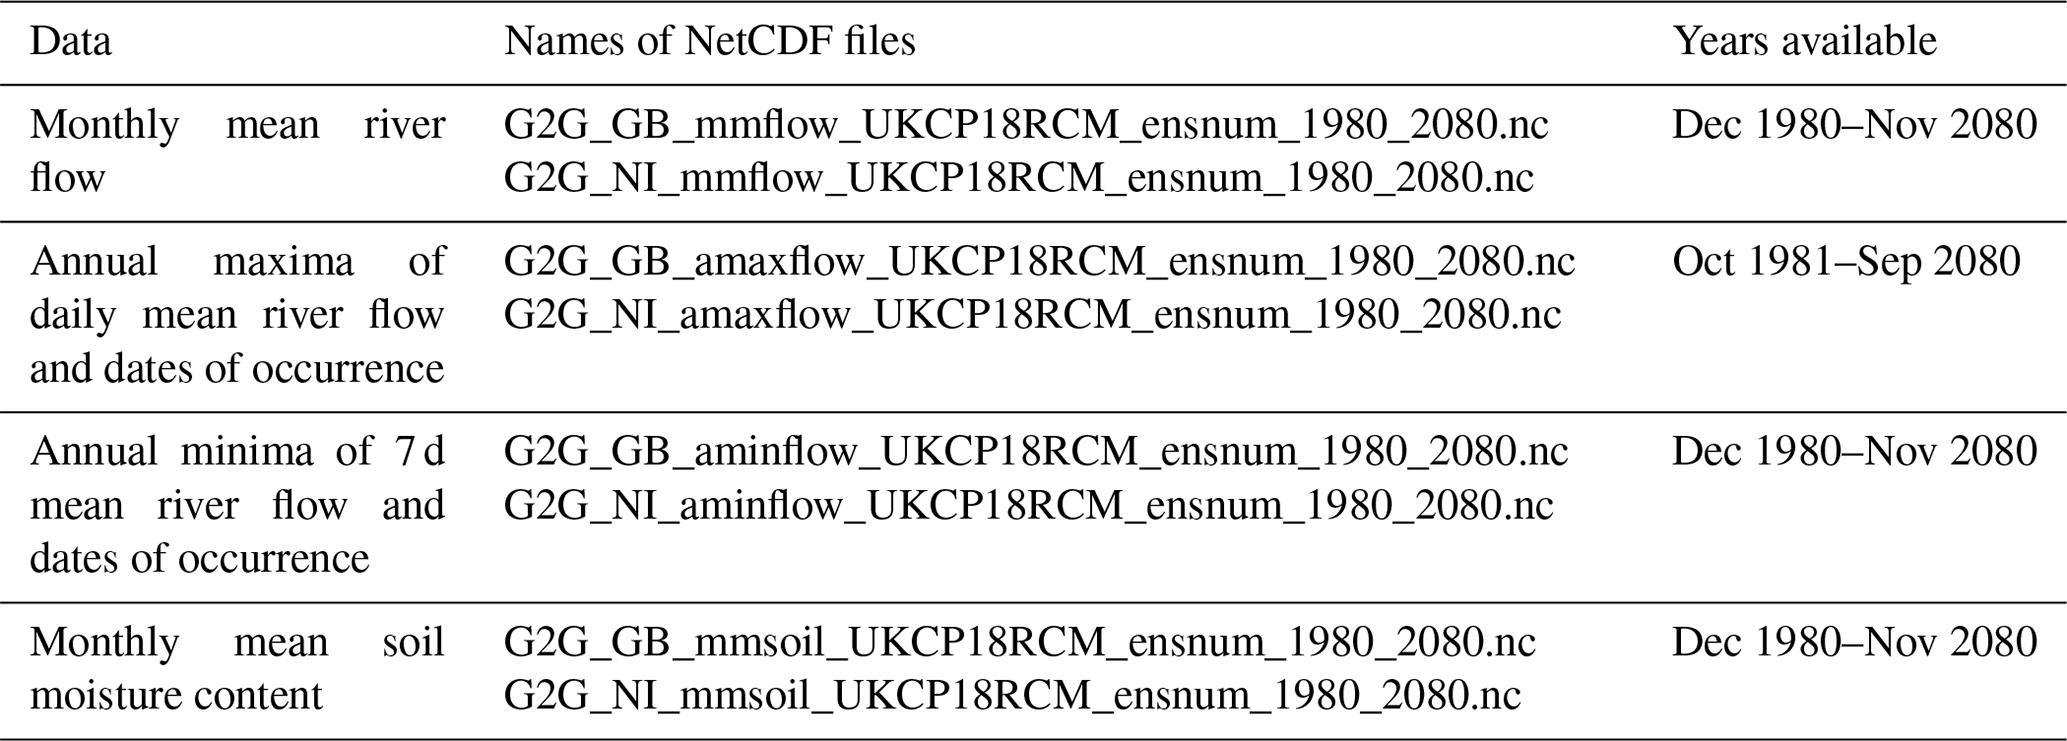
“ensnum” is the number of the ensemble member (01, 04, 05, 06, 07, 08, 09, 10, 11, 12, 13, 15).
For the observation-based datasets, the time stamp in the NetCDF files is “days since 1900-01-01”, and the monthly mean river flows and monthly mean soil moisture are nominally assigned to the first day of the month. The annual maximum/minimum flow values are nominally assigned to the start year of the 12-month period over which they are calculated, e.g. the annual maximum flow assigned to 1981 is for 1 October 1981–30 September 1982 (water years), while the annual minimum flow assigned to 1981 is for 1 December 1981–30 November 1982 (December–November years). The “time_bnds” variable gives the start and end dates of the time period over which the annual maximum or minimum flow are extracted.
For the climate-projection-based datasets, the data have 30 d months due to the “360_day” calendar of the Hadley Centre climate model. The files are otherwise as above, except that the dates of occurrence of the annual maximum and minimum flows are also provided as additional variables in the “amaxflow” and “aminflow” NetCDF files, respectively.
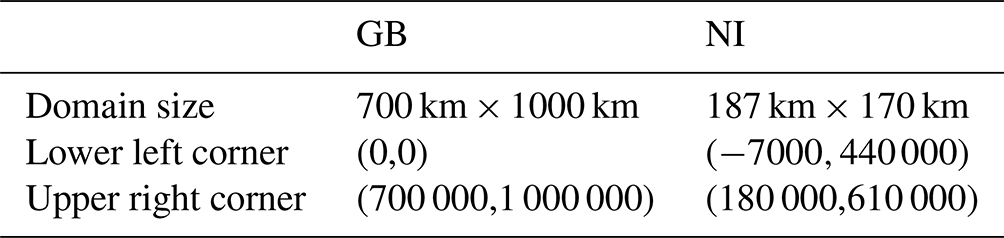
Table 4 summarises the spatial domains covered by the GB and NI datasets. River flows are only provided for non-sea and non-tidal river cells with a catchment area of at least 50 km2 and are set to missing elsewhere. Soil moisture estimates are provided for all non-sea cells and are set to missing elsewhere.
Table 4Summary of domain sizes and extents, including the Ordnance Survey National Grid (OSGB) co-ordinates for the lower left and upper right corners (m).
To aid use of the datasets, further data files are provided for both GB and NI, including catchment area grids, grids identifying majority lake cells, and grids identifying the approximate locations of river flow gauging stations (Table 5). The catchment area grids are mapped in Fig. 1, while the majority lake cells and gauging station locations are mapped in Fig. 2 (note that although GB and NI are mapped together, the data for GB and NI are provided separately). At the gauging station locations, the G2G flow estimates can be compared to observed river flows.
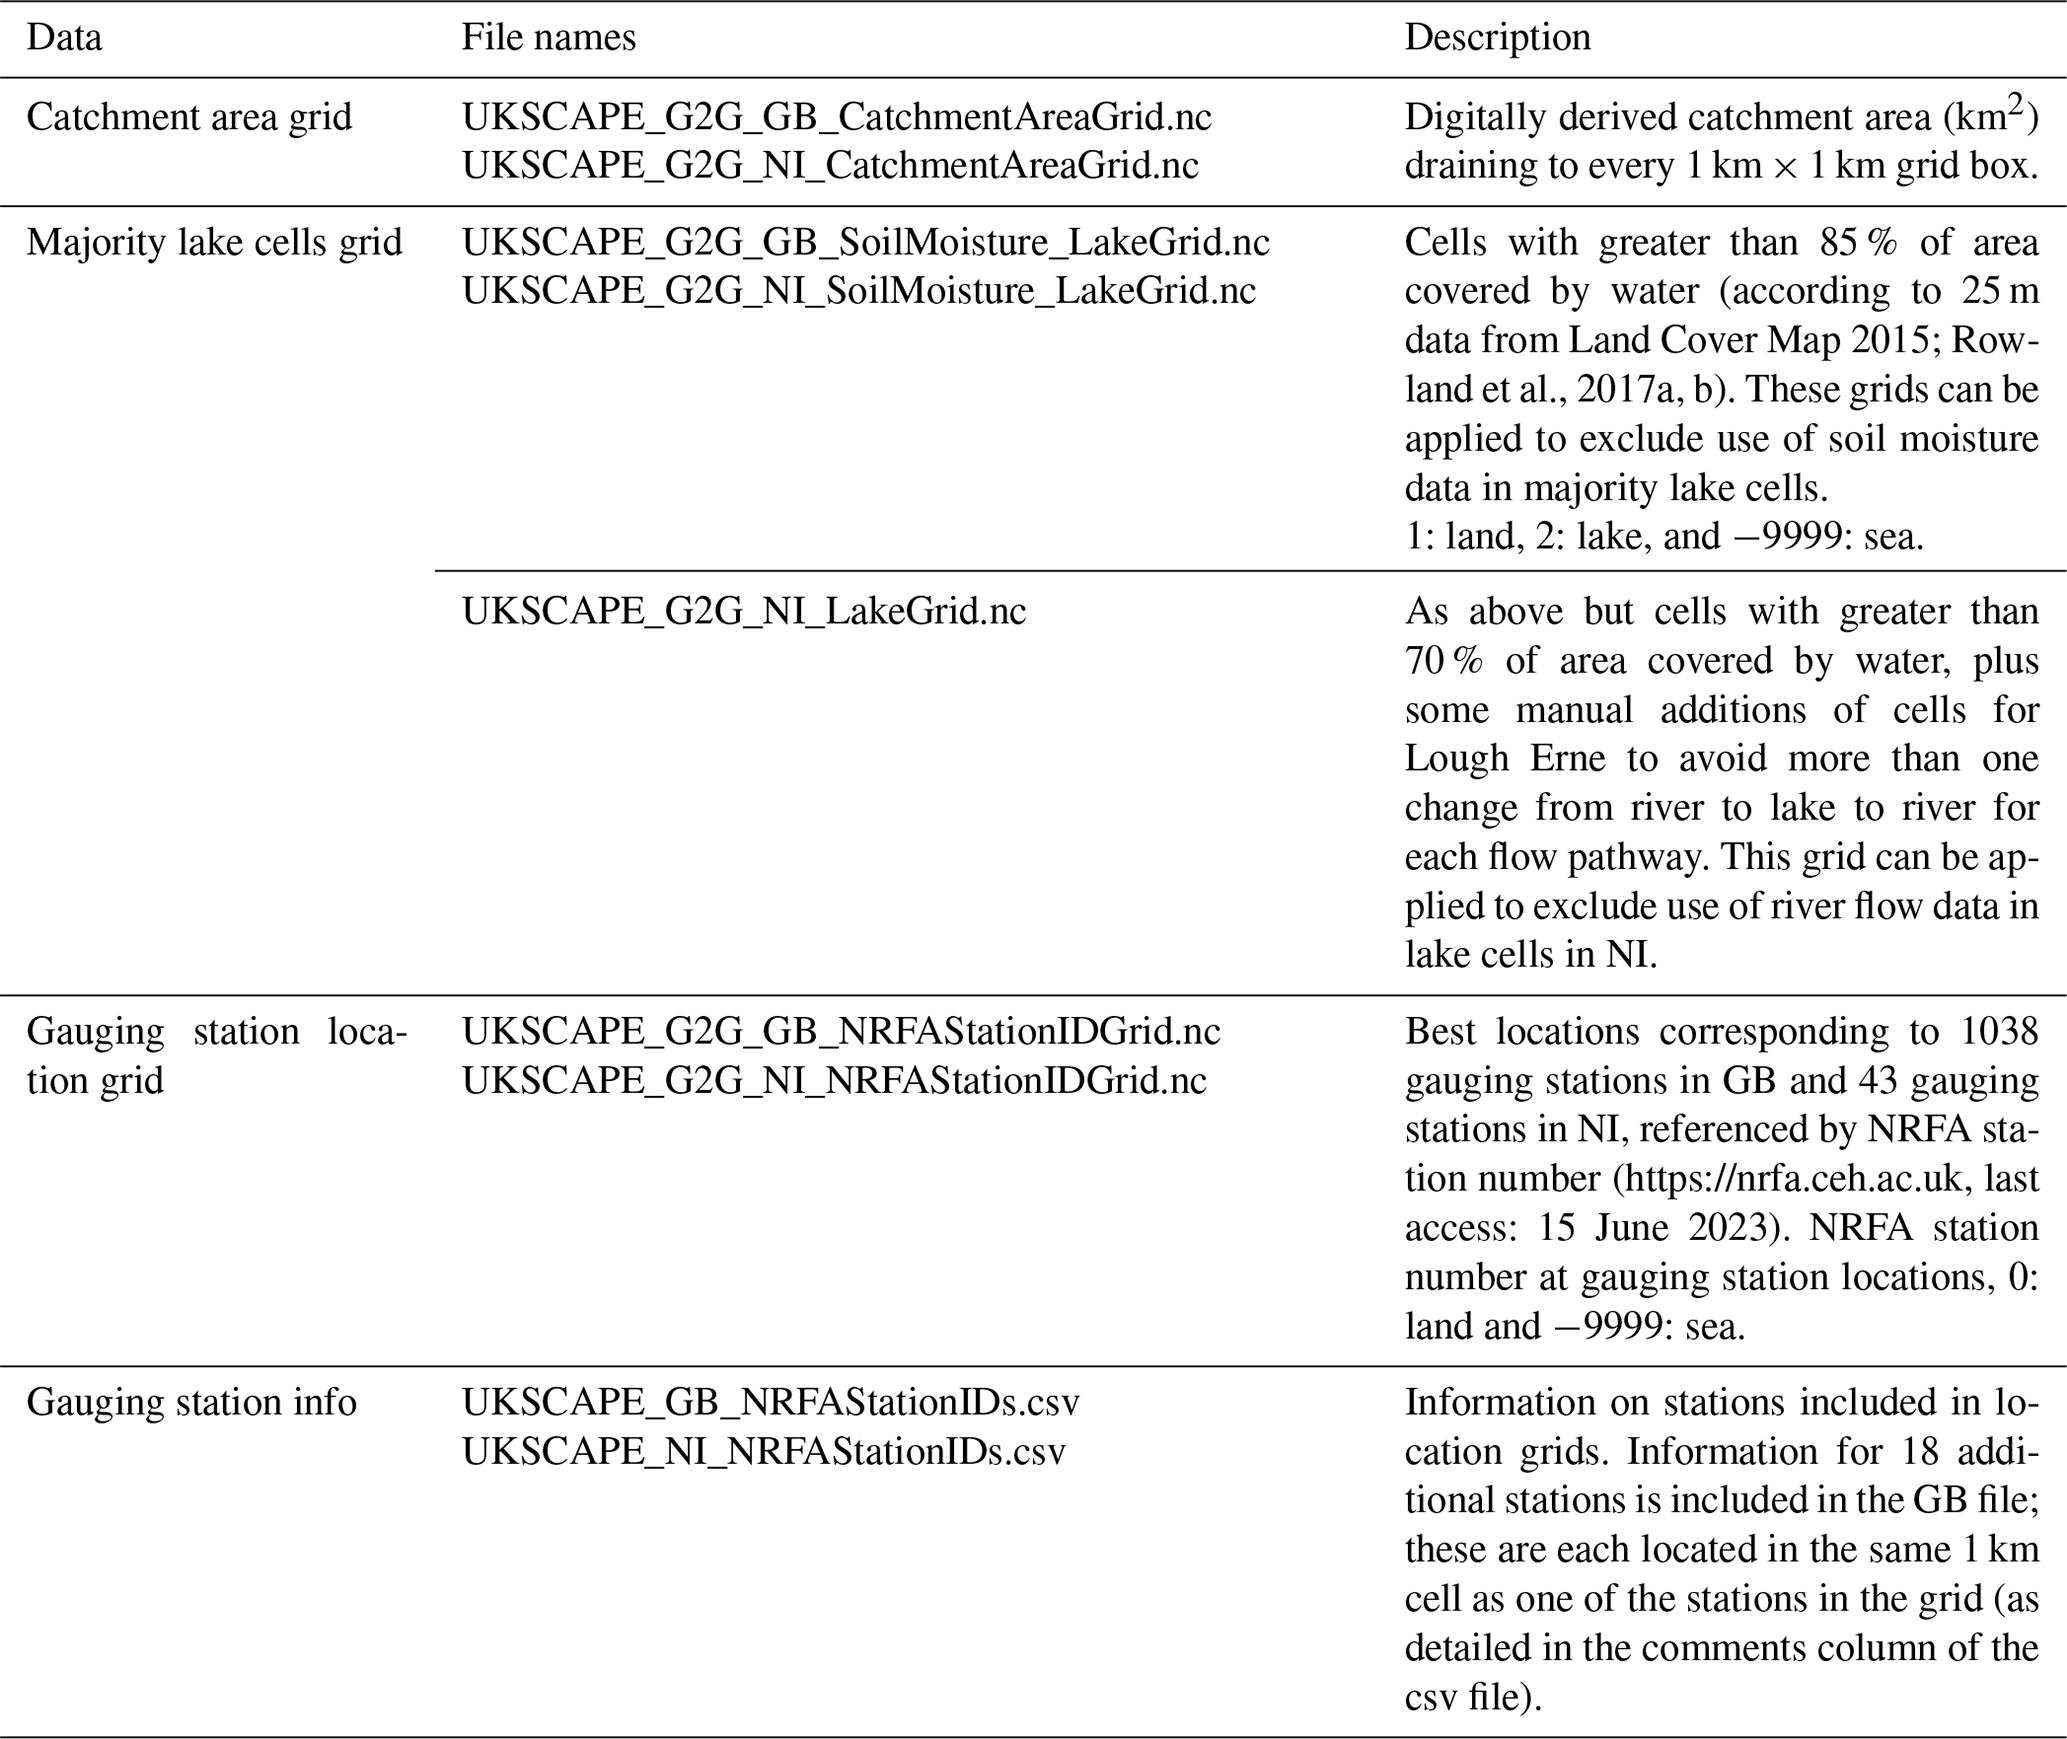
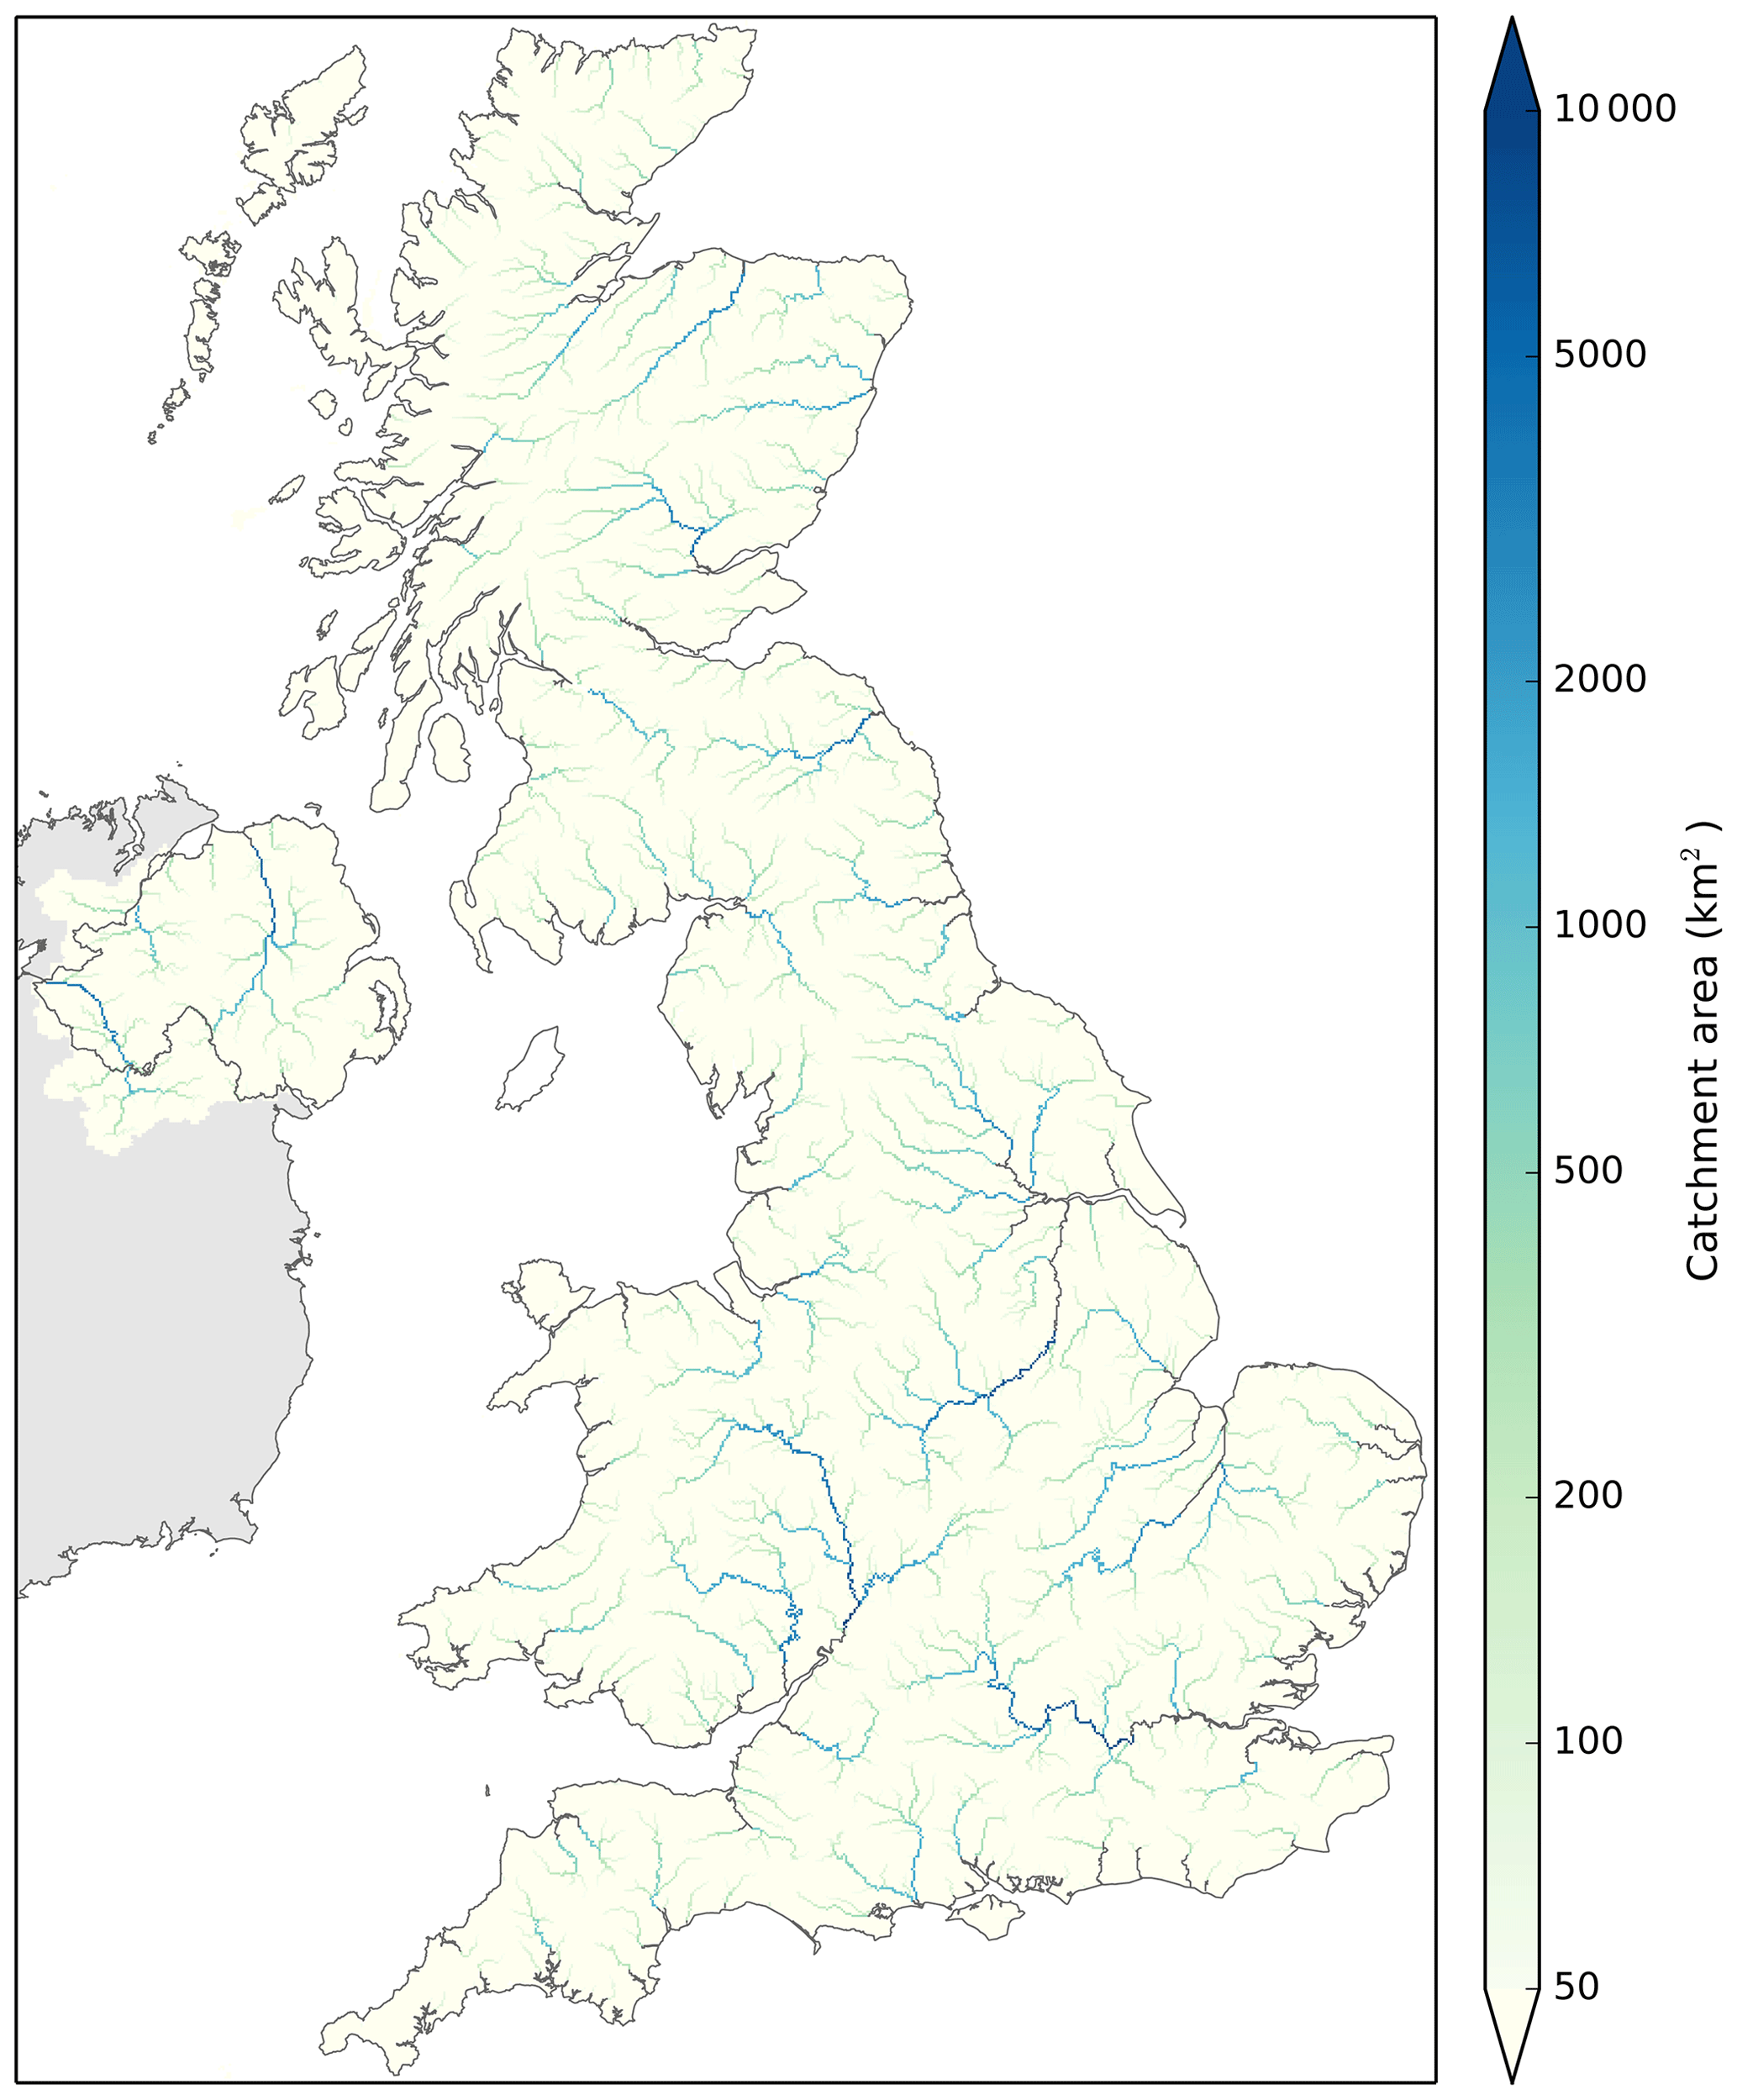
Figure 1Map showing the catchment area grids for GB and NI (see Table 5).
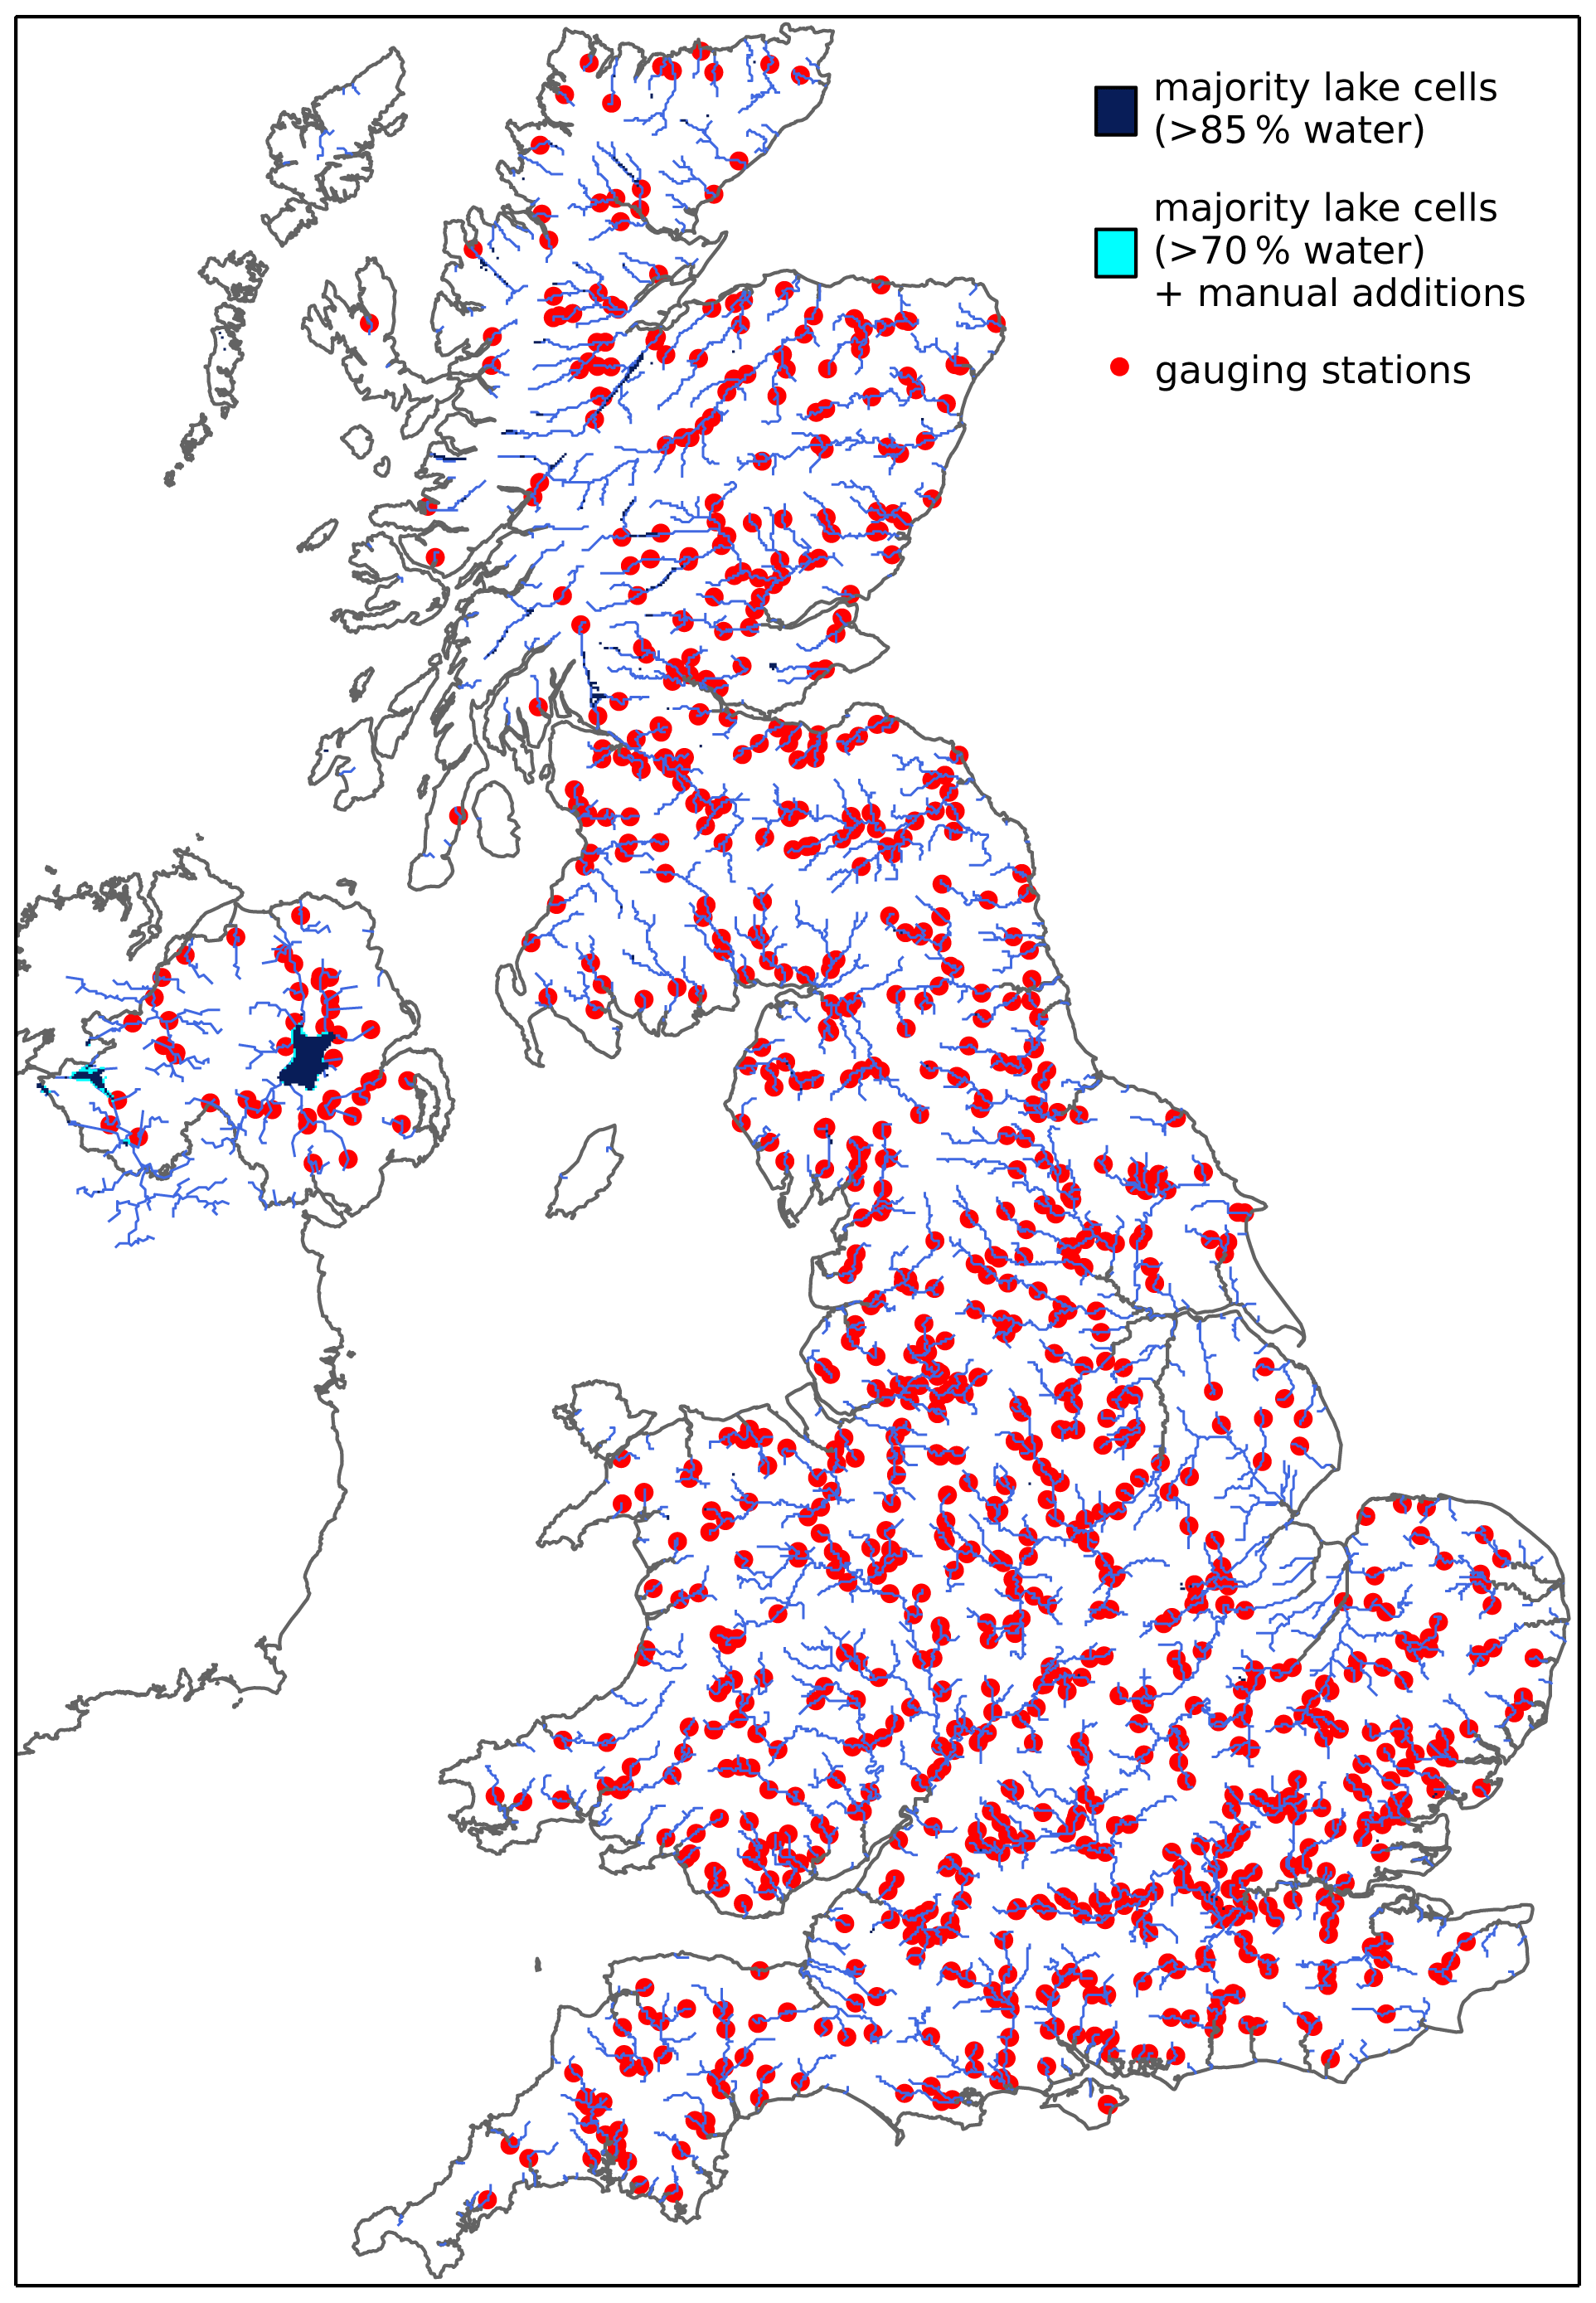
Figure 2Map showing the majority lake cells and gauging station locations for GB and NI (see Table 5), along with the main rivers (catchment area ≥50 km2; blue lines). Note that the “majority lake cells (>70 % water)” cover small areas around Lough Neagh and Lough Erne in Northern Ireland only.
2.6 How to use the datasets
River flows from the observation-based simulation can be compared to observed (gauged) river flows (e.g. from the National River Flow Archive, NRFA; https://nrfa.ceh.ac.uk), and to facilitate such comparisons files identifying gauging station locations on the 1 km G2G model grid for GB and NI are provided (see Table 5). However, it should be borne in mind that G2G provides natural flow estimates, so comparisons in catchments affected by artificial influences like abstractions and discharges may not be as good as those in catchments with relatively natural flow regimes (Rameshwaran et al., 2022). Also, although the gauging station locations have been identified as the G2G cell closest in terms of geographical location and catchment area, and checks have been undertaken to ensure that the G2G flows are for the correct river rather than a nearby river with a similar catchment area, in some cases the derived catchment area draining to the 1 km × 1 km cell will be different to the “observed” NRFA catchment area. This problem can particularly affect smaller catchments, for which discretisation to a 1 km × 1 km grid can lead to proportionally larger errors, although flow data provided here are in any case limited to catchments with drainage areas of at least 50 km2. The catchment area grids (Table 5) can be used to check the drainage area of gauged catchments and could also be used to identify the most appropriate 1 km × 1 km cell corresponding to any particular ungauged catchment of interest.
Users should be aware that the effect of water bodies such as lakes and reservoirs is not accounted for within the model; any impact of lake storage and regulation on downstream river flows has been neglected, and lake grid cells are treated as though they were rivers. The data files thus include “river flows” and “soil moisture” for 1 km cells located within lakes. Additional files identify majority lake cells in GB and NI, so that these can be excluded from analyses if desired (see Table 5).
The historical portion of the climate-projection-based river flow and soil moisture datasets can be compared to the observation-based datasets (or to observed data). However, comparisons in either case should only be made statistically (over multi-decadal periods) not directly (time point by time point), as there will be no equivalence between observed weather features and those in the RCM PPE at the same date. An example of such a comparison is presented in Supp. Fig. 4 of Kay et al. (2021a), where mean monthly flows, flood frequency curves, and low-flow frequency curves are compared for the baseline SIMRCM ensemble and SIMOBS, for eight catchments in NI. Comparison of climate-projection-based simulations to the observation-based simulation will indicate how both natural variability and (remaining) biases in the climate projection data affect the hydrological model simulations for the baseline period, while comparison to observed data themselves will be additionally affected by the accuracy of the G2G model.
The climate-projection-based datasets for baseline (historical) and future periods can be compared statistically, to investigate the potential future impacts of climate change on river flows (e.g. Kay, 2021; Lane and Kay, 2021; Kay et al., 2021a) and soil moisture (e.g. Kay et al., 2022a). Analyses should use the full ensemble; each member should be considered a different but plausible realisation. Comparison between periods should use the same ensemble member for each period not a baseline from one member and a future from another member.
The observation-based datasets for GB can be considered updates to MaRIUS-G2G-MORECS-monthly flow and soil moisture data (Bell et al., 2018a). The main differences are the shorter simulation period here (December 1980–November 2011 vs. 1960–2015 or 1891–2015), the inclusion here of the optional snow module, some changes to the land–sea mask, some changes related to infilling of missing soil type data, and minor changes to the discretised river flow network to improve the G2G model catchment areas (thus the additional spatial datasets provided here may differ in places to those provided with the MaRIUS dataset).
The climate-projection-based datasets for GB are analogous to the MaRIUS-G2G-WAH2-monthly flow and soil moisture data (Bell et al., 2018b), which were driven by weather@home climate model data (Guillod et al., 2017). The main differences, as well as the factors listed above for the observation-based datasets, are the climate model version, the smaller ensemble size here (12 members vs. 100 members), and the provision here of transient rather than time-slice data (December 1980–November 2080 vs. 1900–2006, 2020–2049, and 2070–2099). Note that, as far as the authors are aware, there has been no comparison between the weather@home and UKCP18 RCM climate datasets.
Figure 3Maps of monthly mean river flows (m3 s−1) for January and July 1982, from SIMOBS (a, d) and two SIMRCM ensemble members (01 – b, e, and 15 – c, f). Also shown are Lough Neagh and Lough Erne in NI (bright blue shading).
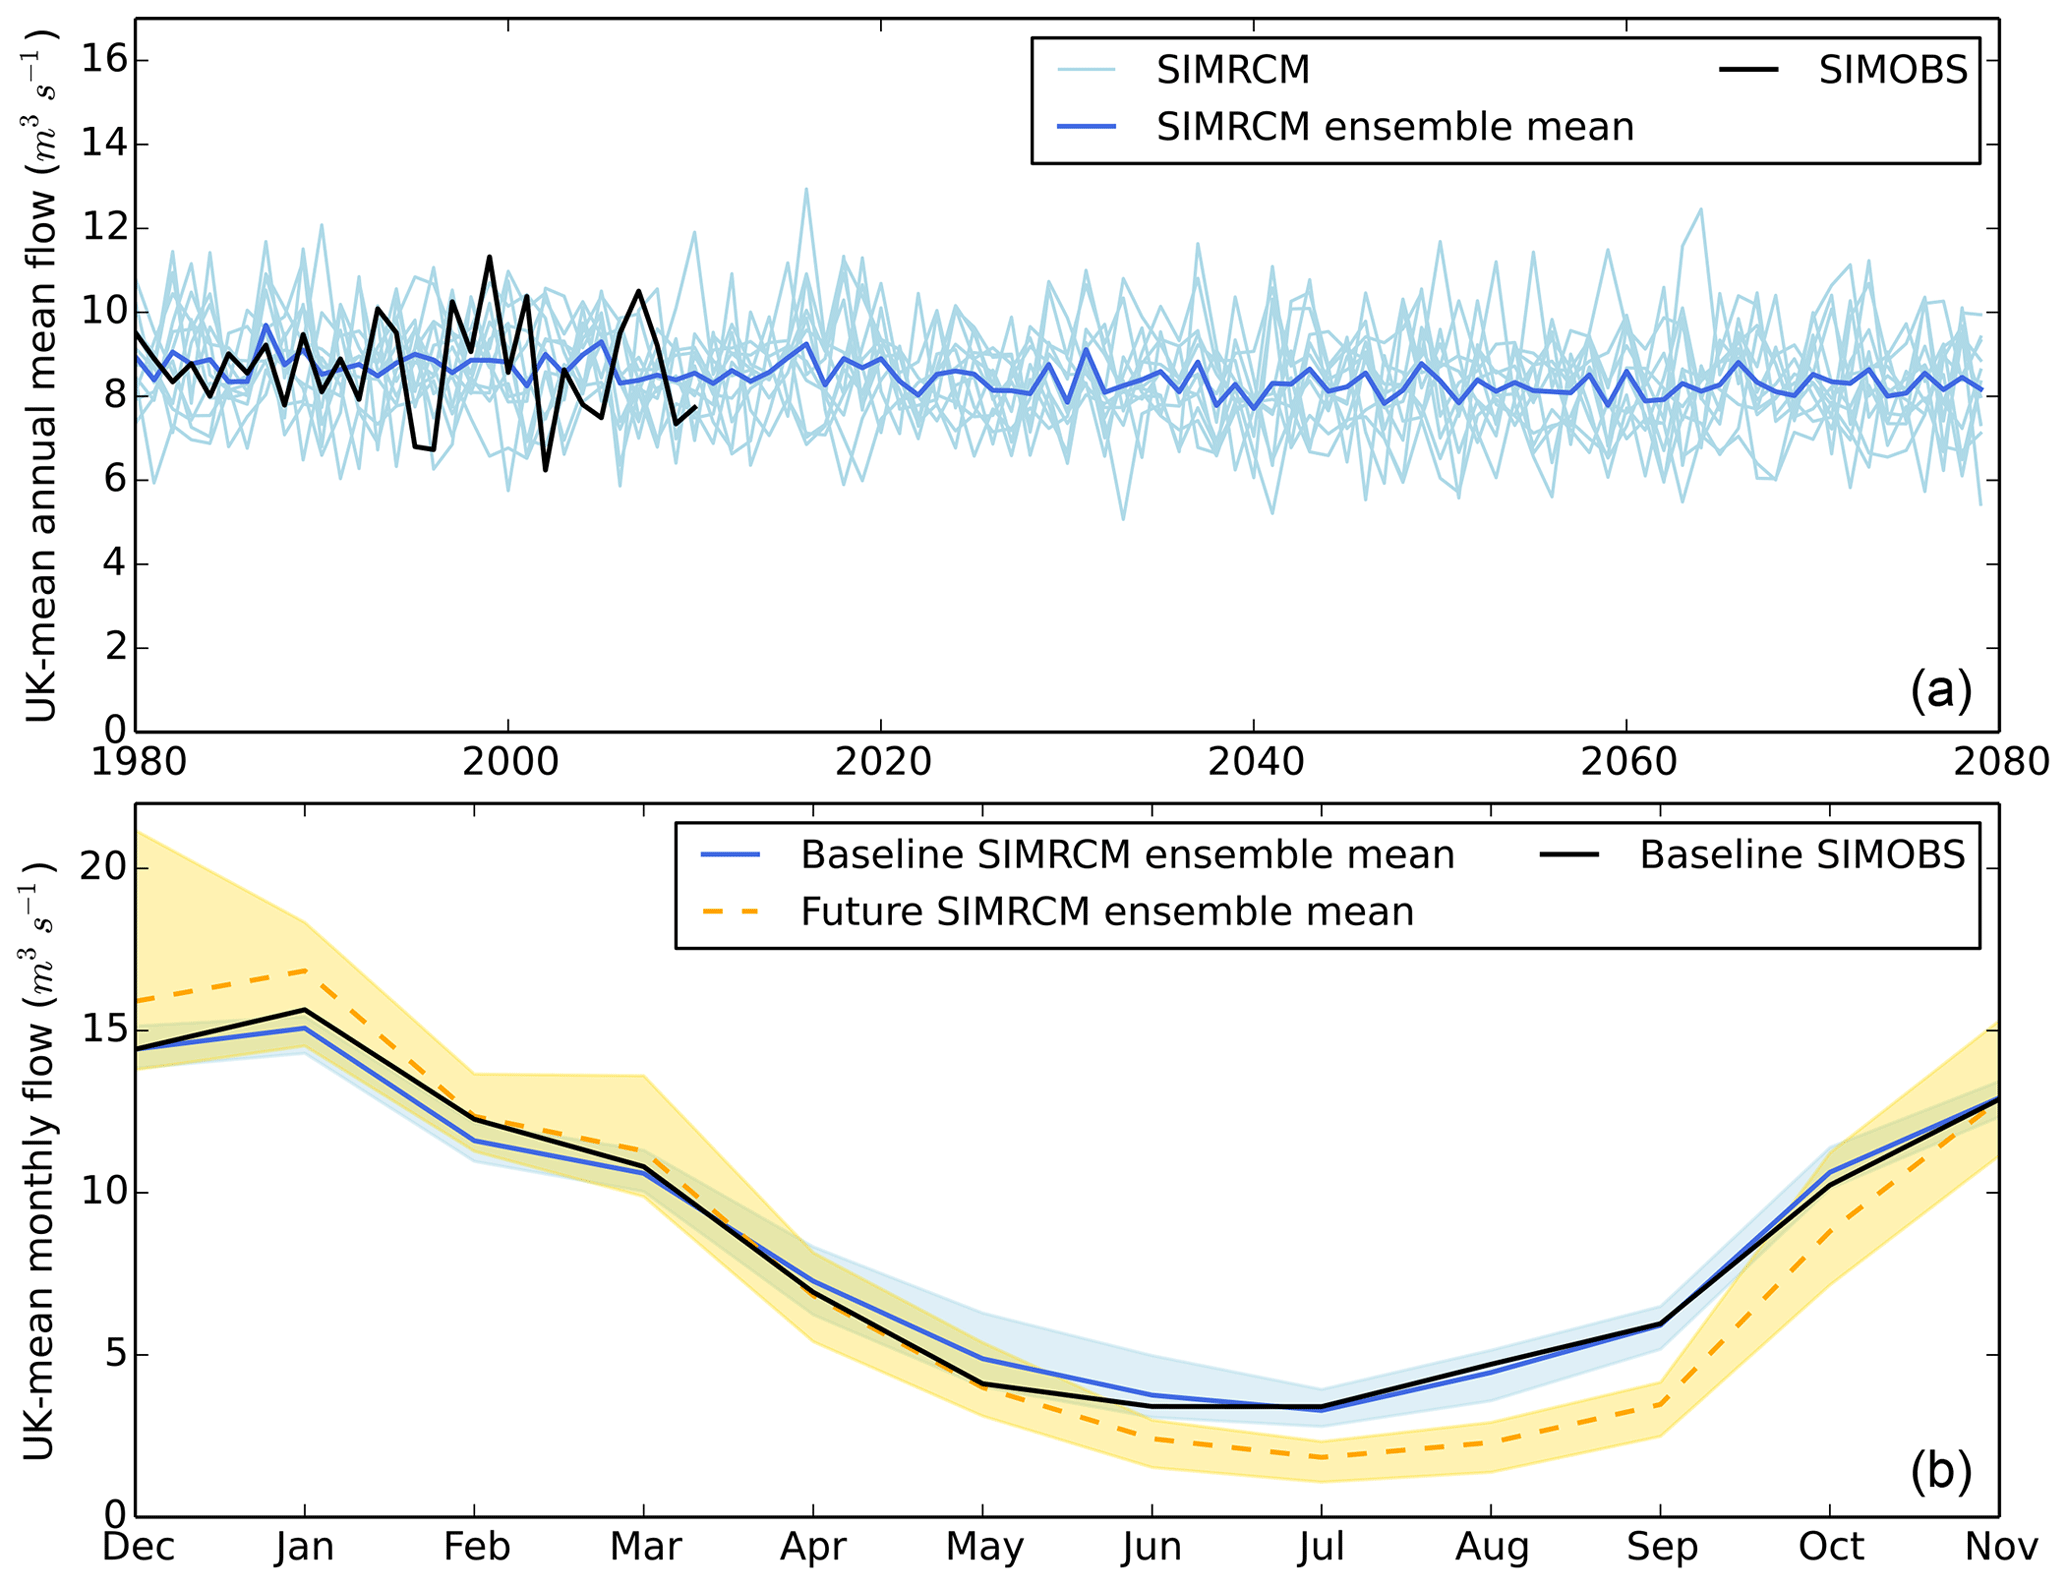
Figure 4Time series of UK-mean annual mean river flows (a) and the baseline (December 1980–November 2010) and future (December 2050–November 2080) monthly climatology of UK-mean river flows (b) for SIMOBS and the SIMRCM ensemble. The shading in the bottom plot shows the SIMRCM ensemble range for each period.
3.1 Monthly mean river flows
Maps of example monthly mean river flows across GB and NI from SIMOBS and two SIMRCM ensemble members (Fig. 3) illustrate the accumulation of water as it flows downstream, with typically higher flows for downstream locations with larger catchment areas. The example maps also show the generally lower flows in summer (July) compared to winter (January). Note that, although GB and NI are mapped together, the data for GB and NI are provided separately.
Time series plots of UK-mean annual mean river flows from SIMOBS and the SIMRCM ensemble show good correspondence (Fig. 4). There is a relatively small but highly statistically significant decrease in the SIMRCM ensemble mean flow over December 1980–November 2080 (−0.695 m3 s−1/100 years) (Fig. 4). Six of the 12 individual ensemble members show decreases significant at the 10 % level, while four show non-significant decreases and two show non-significant increases. Plots of the monthly climatology of UK-mean river flows for the first and last 30 years (December 1980–November 2010 and December 2050–November 2080) show a clear reduction in flows during summer and early autumn but a possible increase in winter (Fig. 4).
Kay (2021) used the GB SIMRCM monthly mean river flow data to investigate potential future changes in seasonal mean flows, for two future time slices (2020–2050 and 2050–2080). This suggested large decreases in summer mean flows everywhere but possible increases in winter mean flows, especially in the north and west. A similar analysis using the NI SIMRCM monthly mean river flow data (Kay et al., 2021a) suggested decreases in spring–autumn mean flows, especially in summer, but possible increases in winter mean flows.
3.2 Extreme river flows
Maps of example GB and NI AMAX of daily mean river flows and AMIN of 7 d mean river flows from SIMOBS and two SIMRCM ensemble members (Fig. 5) show less spatial variation than those of monthly mean river flows (when plotted on the same scale). Note that, although GB and NI are mapped together, the data for GB and NI are provided separately.
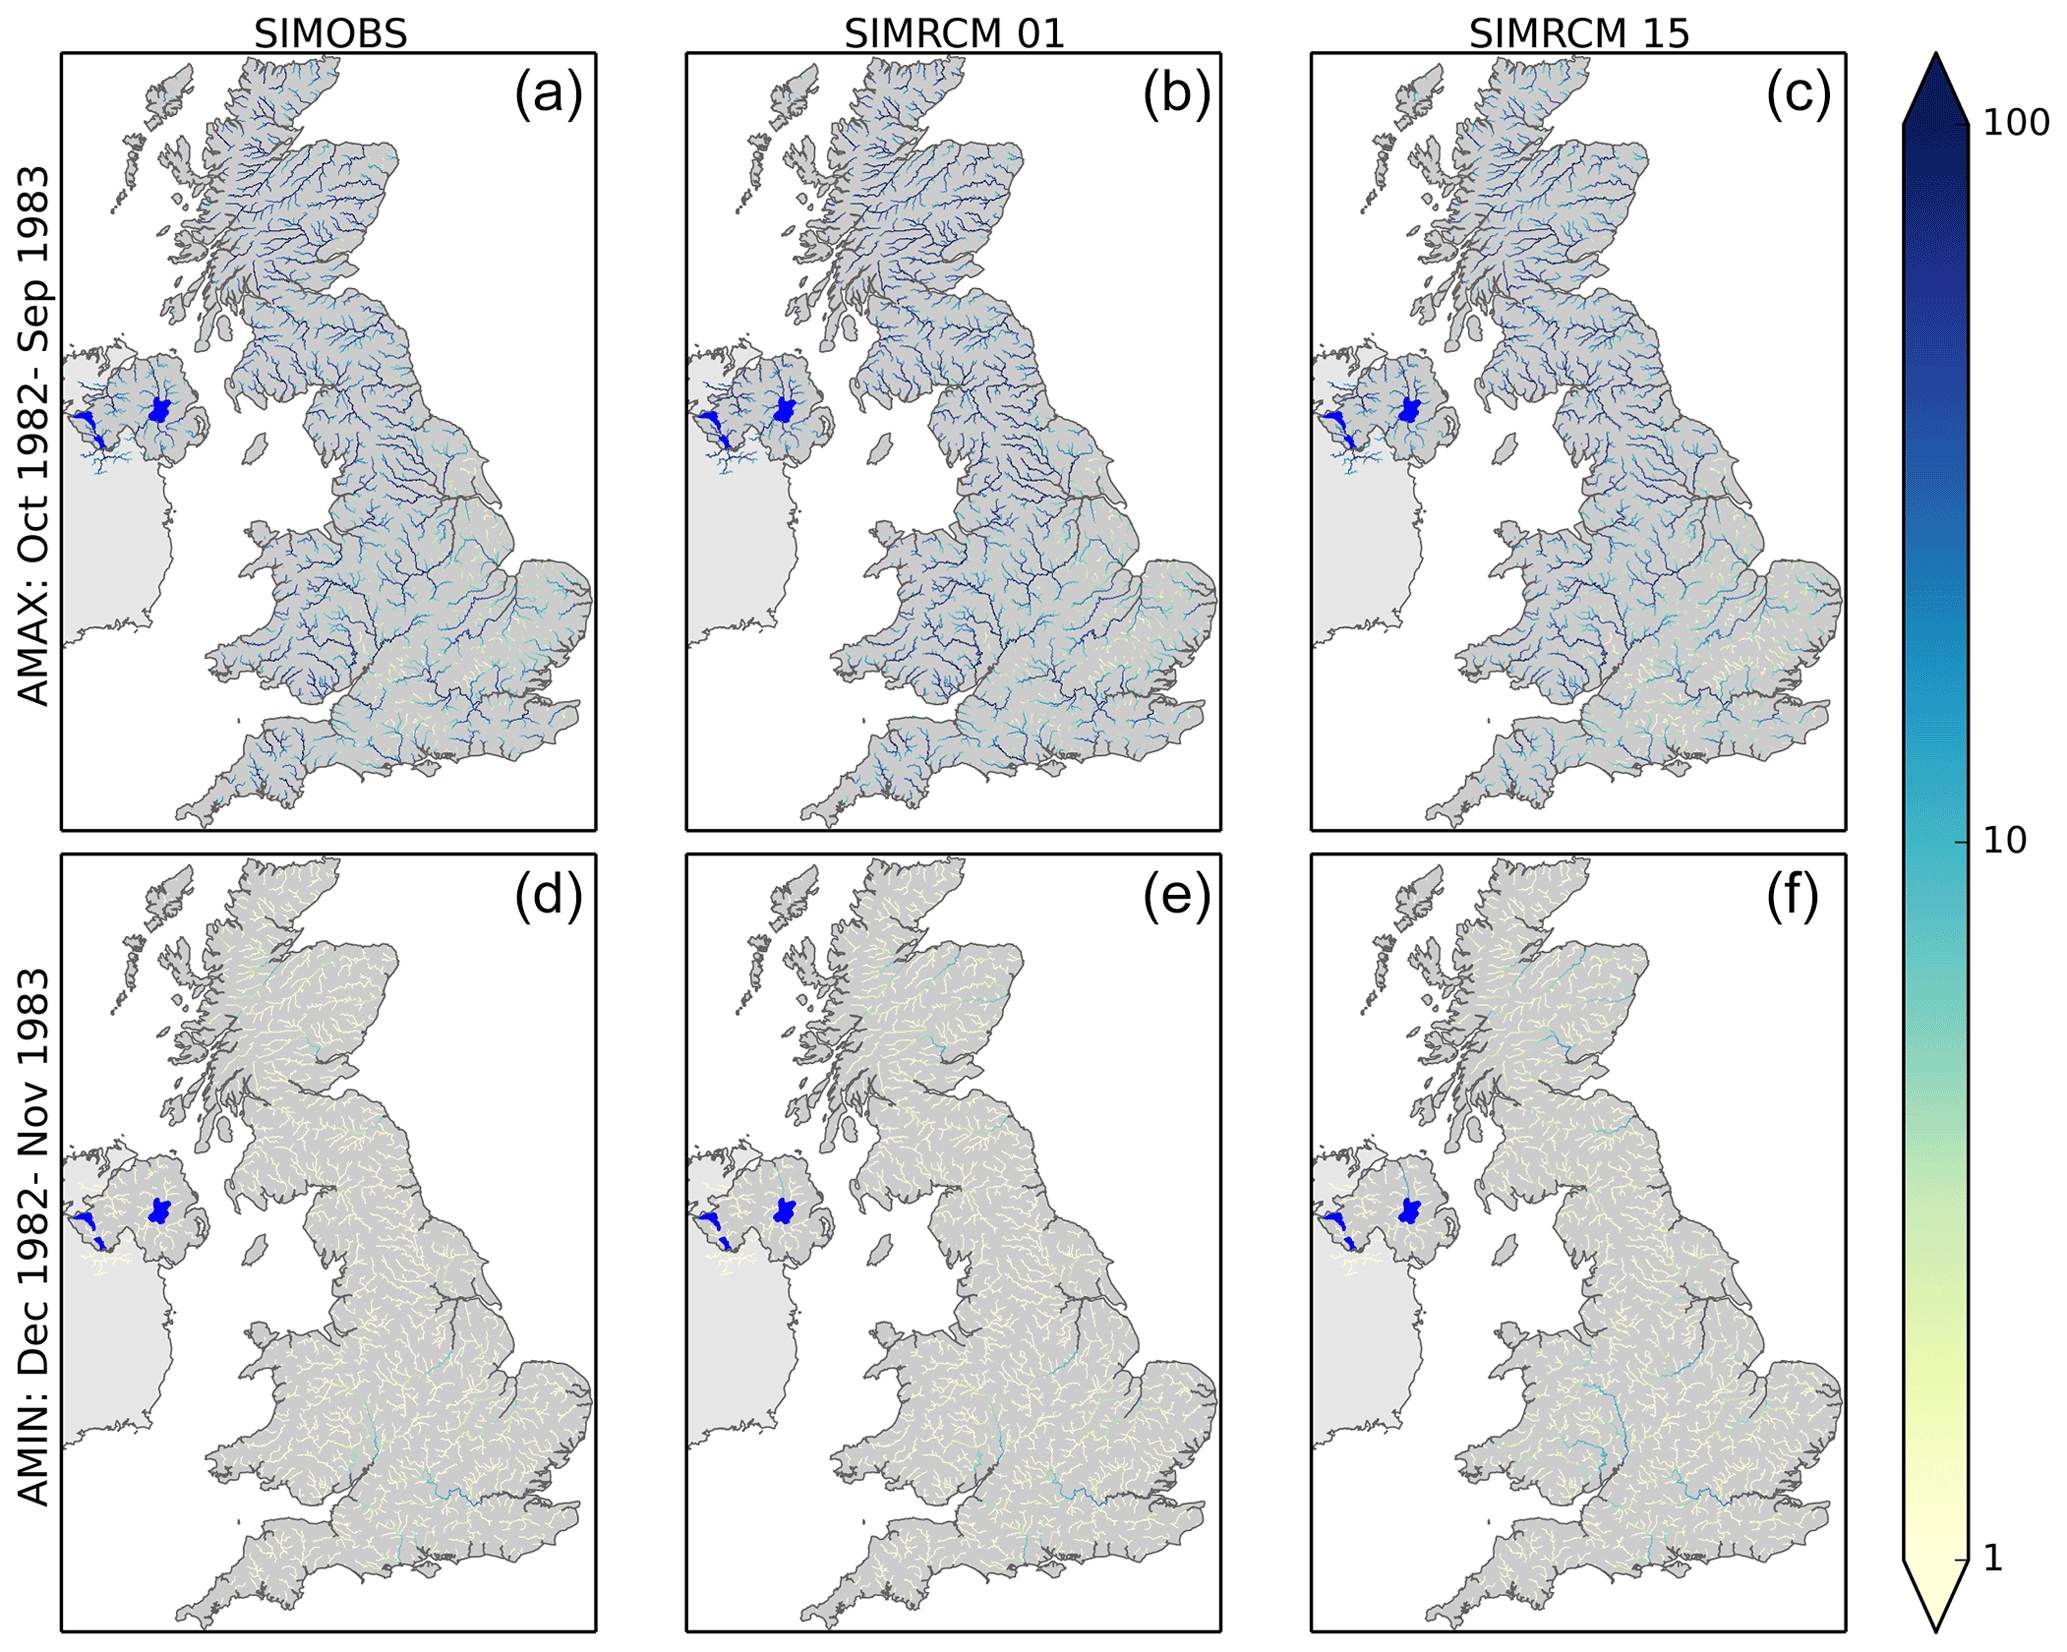
Figure 5Maps of AMAX of daily mean river flows for October 1982–September 1983 (m3 s−1; a–c) and AMIN of 7 d mean river flows for December 1982–November 1983 (m3 s−1; d–f), from SIMOBS (a, d) and two SIMRCM ensemble members (01 – b, e, and 15 – c, f). Also shown are Lough Neagh and Lough Erne in NI (bright blue shading).
Time series plots of UK-mean AMAX and AMIN river flows from SIMOBS and the SIMRCM ensemble show good correspondence (Fig. 6). The SIMRCM ensemble mean AMAX flows show a statistically significant increase over October 1981–September 2080 (8.51 m3 s−1/100 years) (Fig. 6). Nine of the 12 individual ensemble members show increases in AMAX flows significant at the 10 % level, while one shows non-significant increases and two show non-significant decreases. The SIMRCM ensemble mean AMIN flows show a highly statistically significant decrease over December 1980–November 2080 (−0.670 m3 s−1/100 years) (Fig. 6), and all 12 individual ensemble members show decreases significant at the 10 % level.
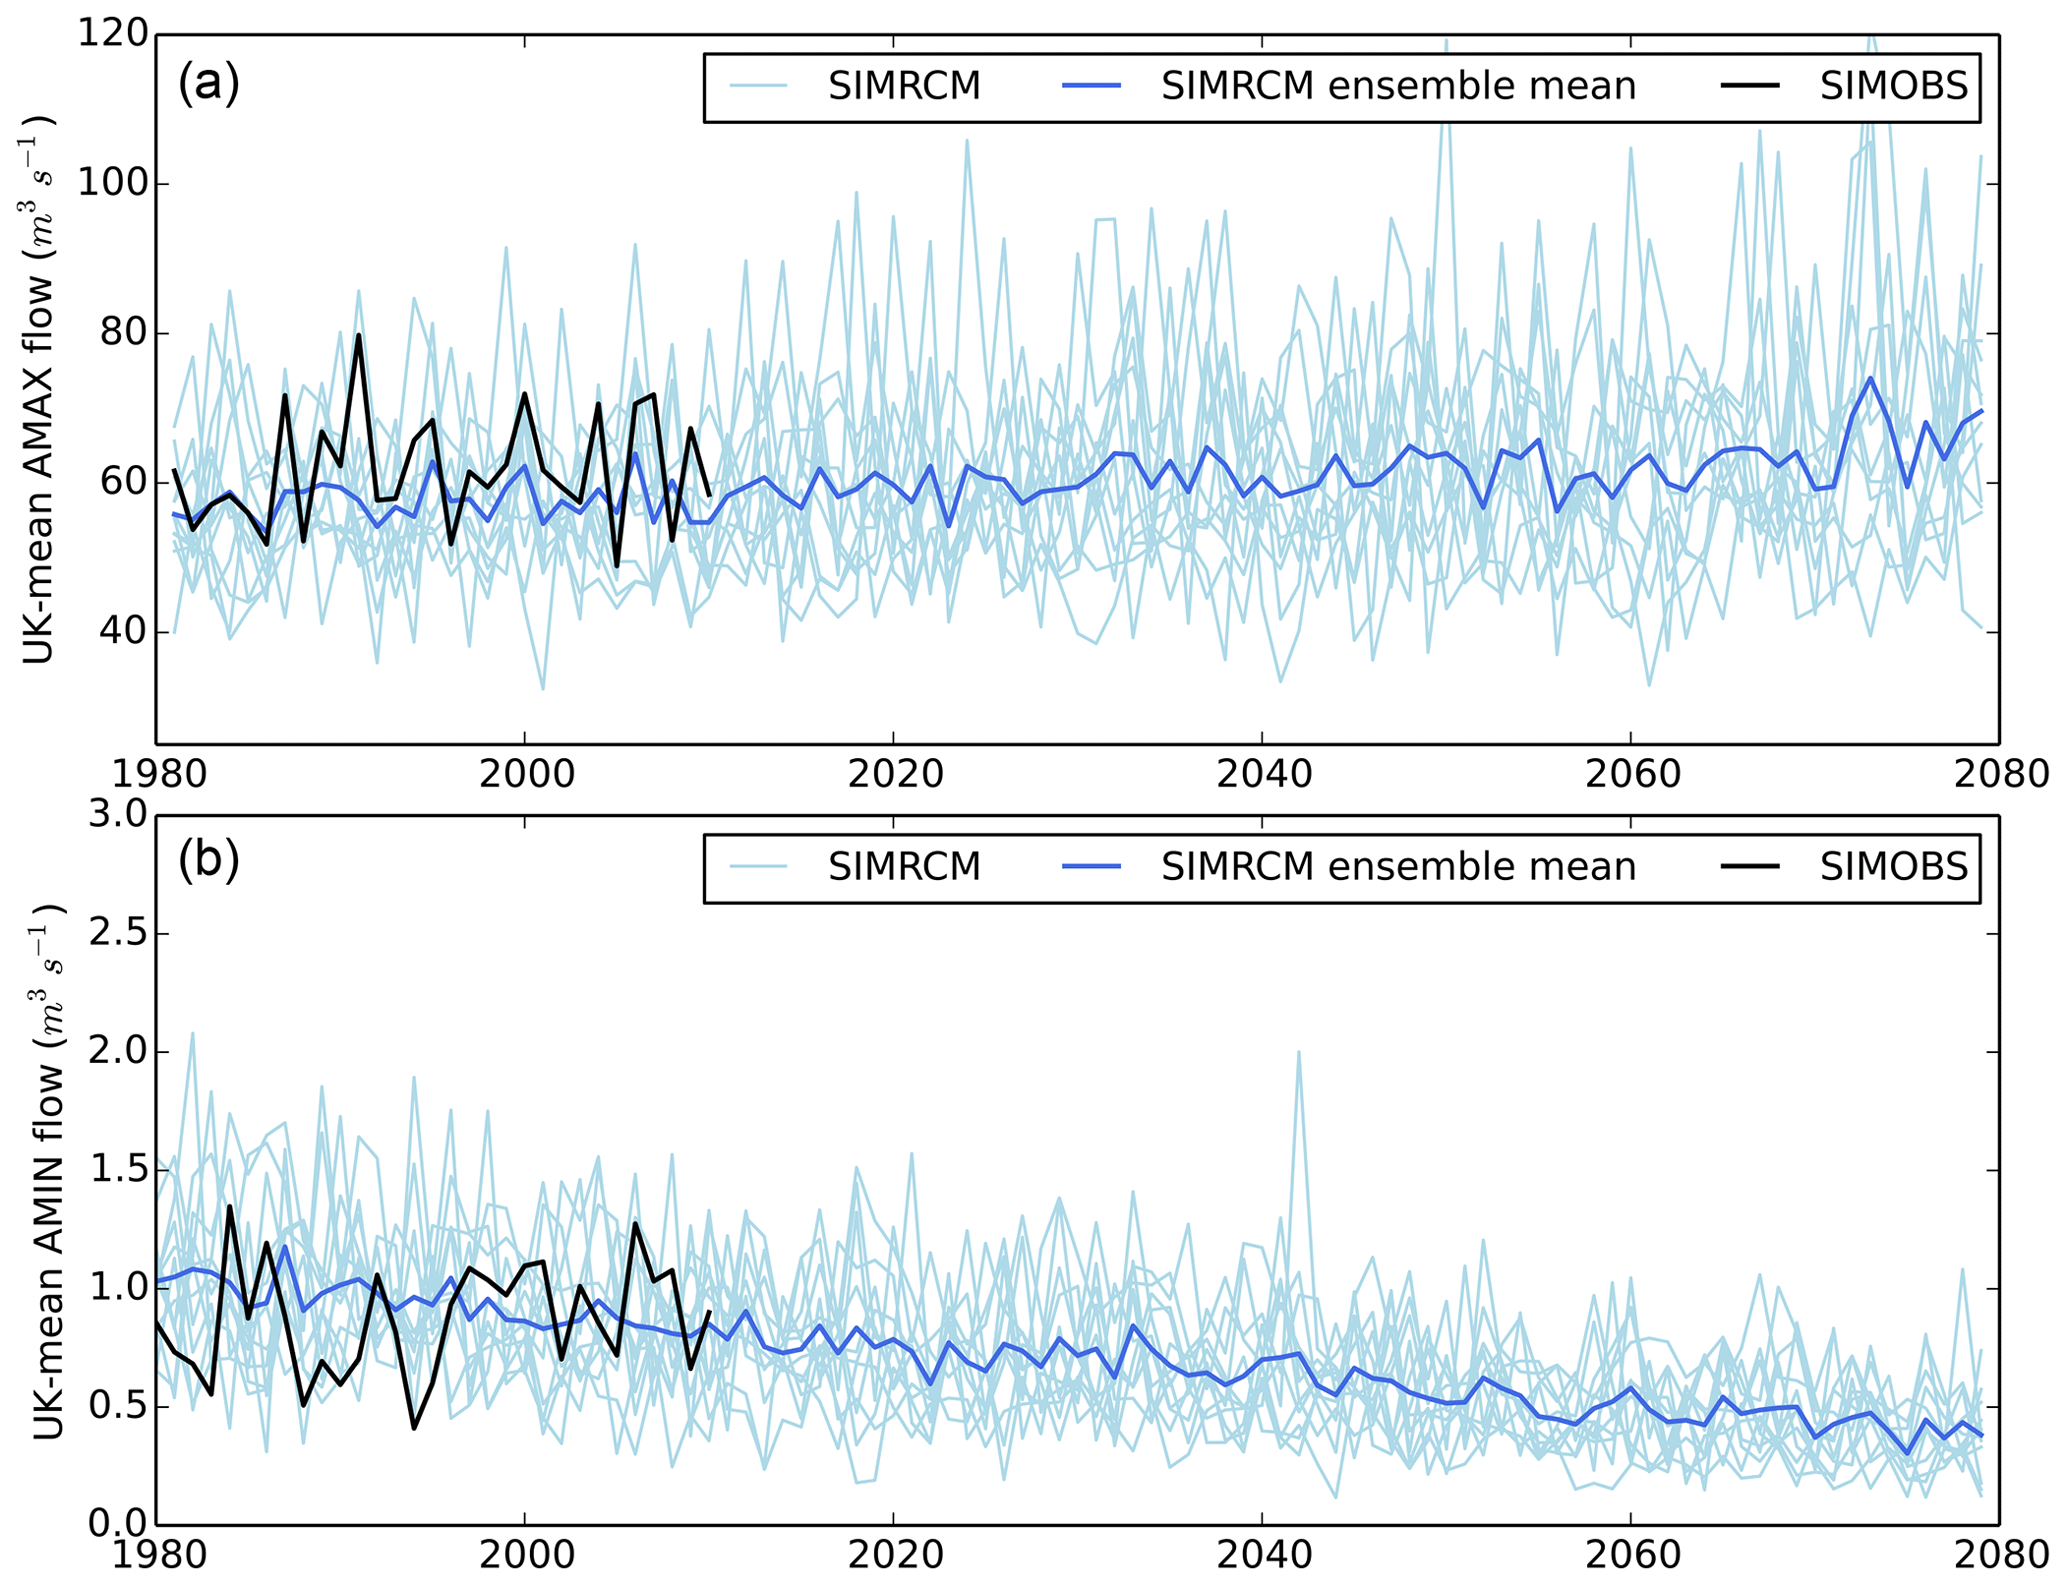
Figure 6Time series of UK-mean AMAX of daily mean river flows (a) and AMIN of 7 d mean river flows (b), for SIMOBS and the SIMRCM ensemble.
Lane and Kay (2021) used the GB SIMRCM AMAX and AMIN river flow data to investigate potential future changes in high/low flows by 2050–2080. All ensemble members showed large reductions in 10-year return period low flows. The direction of change for 10-year return period high flows was more uncertain, but increases of over 9 % were possible in most areas. Simultaneous worsening of both high- and low-flow extremes was projected in the west. A similar analysis using the NI SIMRCM AMAX and AMIN flow data (Kay et al., 2021a) suggested large reductions in 10-year return period low flows everywhere, and large increases in 10-year return period high flows for some locations and ensemble members. Analyses of the GB and NI dates of occurrence of SIMRCM AMAX and AMIN showed few significant changes in timing (Lane and Kay, 2021; Kay et al., 2021a).
3.3 Soil moisture
Maps of example GB and NI monthly mean soil moisture content from SIMOBS and two SIMRCM ensemble members (Fig. 7) show the spatial variation, which is generally related to the variation in soil types. The example maps also show the generally drier soils in summer (July) compared to winter (January) and show differences between the two selected SIMRCM ensemble members. Note that, although GB and NI are mapped together, the data for GB and NI are provided separately.
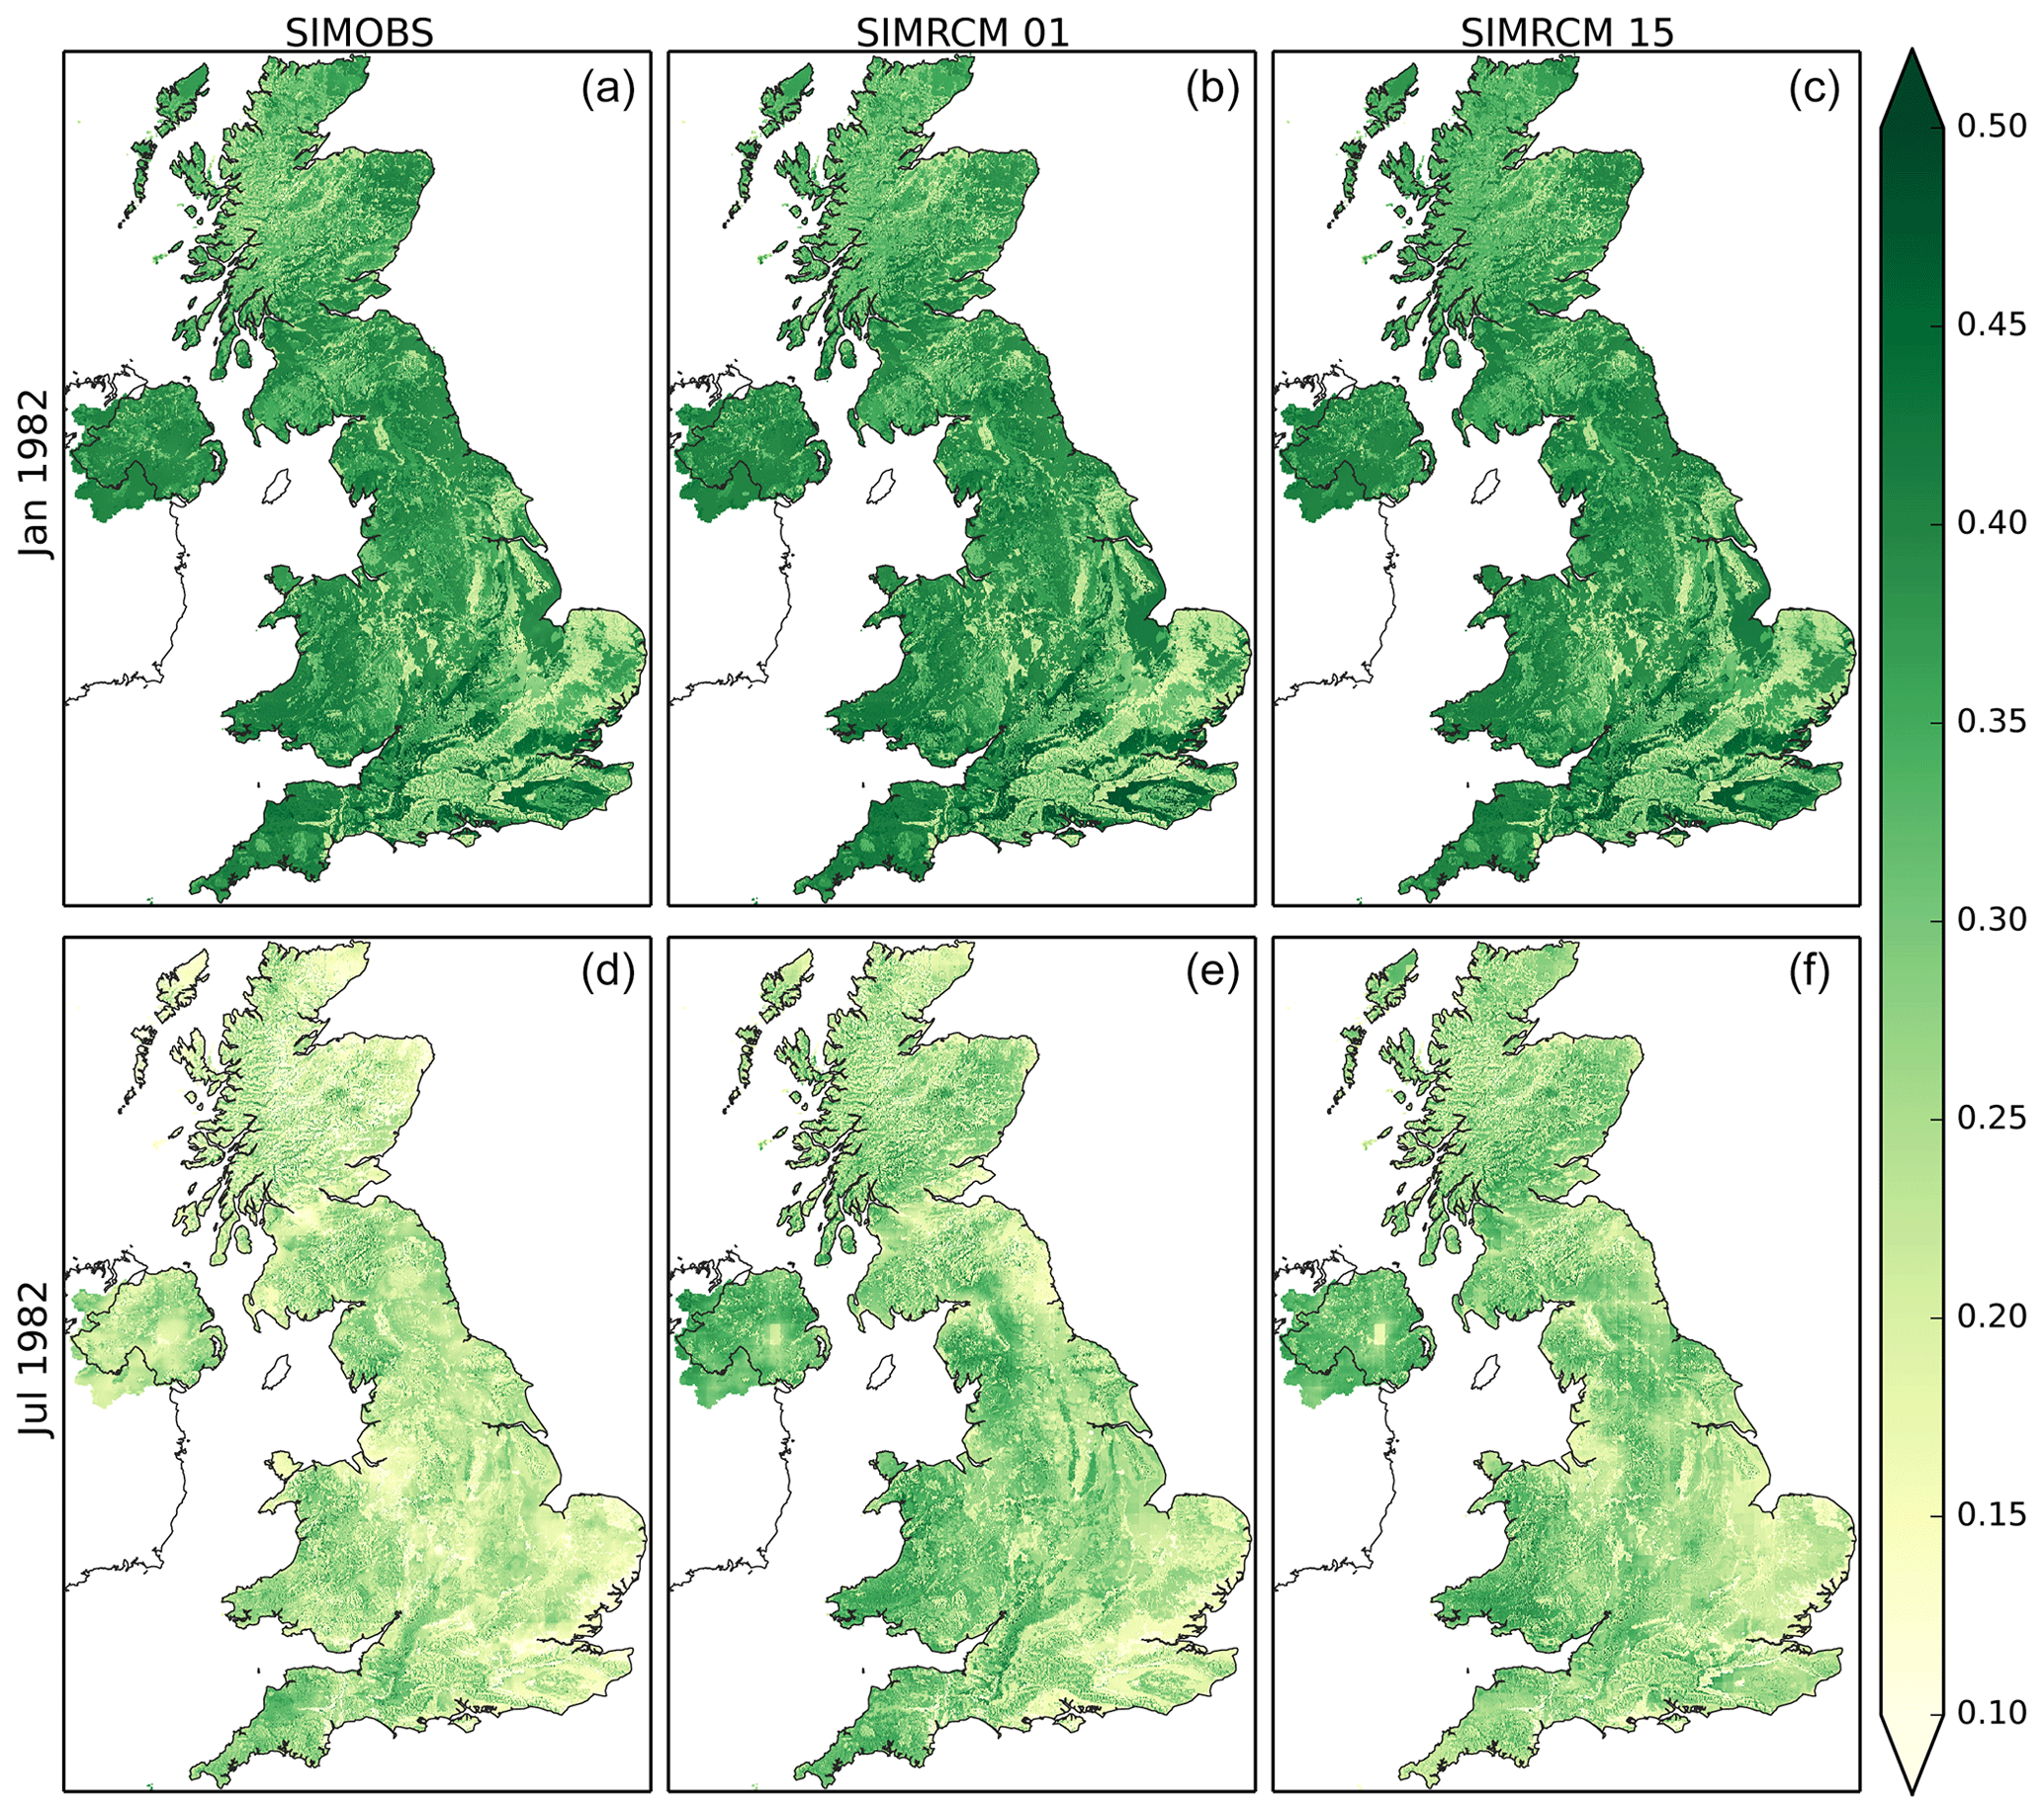
Figure 7Maps of monthly mean soil moisture content (m water m soil) for January and July 1982, from SIMOBS (a, d) and two SIMRCM ensemble members (01 – b, e, and 15 – c, f).
Time series plots of UK-mean annual mean soil moisture content from SIMOBS and the SIMRCM ensemble show good correspondence (Fig. 8). The SIMRCM ensemble mean soil moisture content shows a highly statistically significant decrease over December 1980–November 2080 (−0.035/100 years) (Fig. 8), and all 12 individual ensemble members show decreases significant at the 10 % level. Plots of the monthly climatology of UK-mean soil moisture content for the first and last 30 years (December 1980–November 2010 and December 2050–November 2080) show a clear reduction in summer and autumn (Fig. 8).
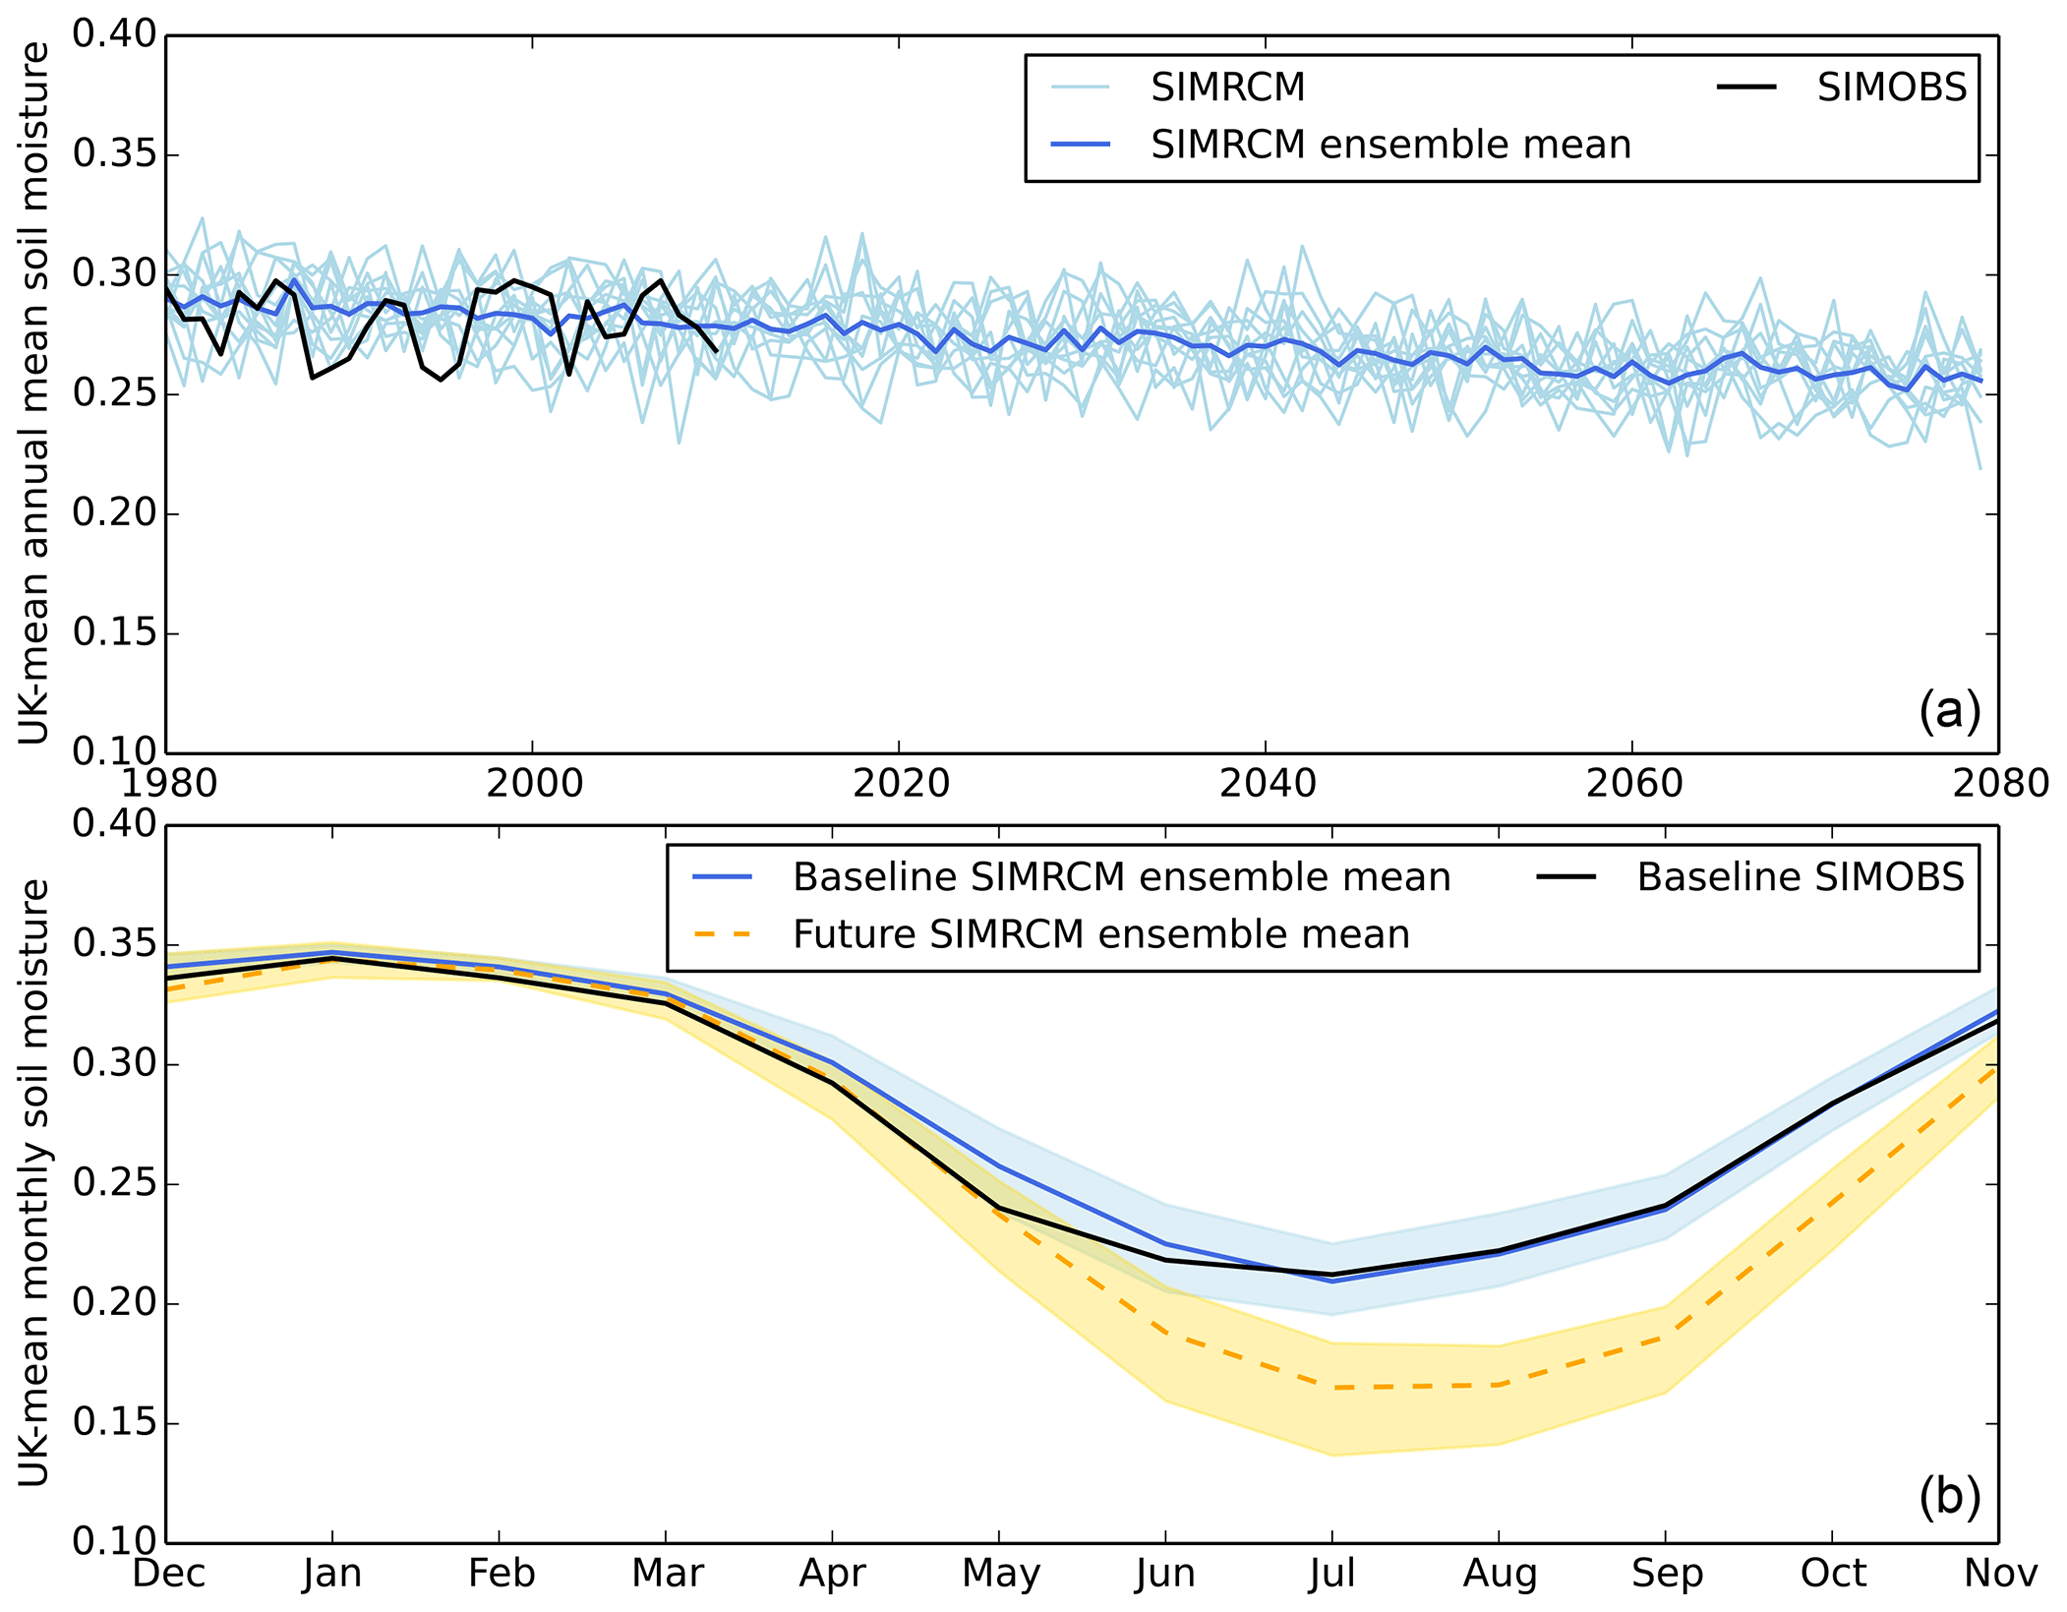
Figure 8Time series of UK-mean annual mean soil moisture content (m water m soil; a), and the baseline (December 1980–November 2010) and future (December 2050–November 2080) monthly climatology of UK-mean soil moisture content (m water ,m soil; b), for SIMOBS and the SIMRCM ensemble. The shading in the bottom plot shows the SIMRCM ensemble range for each period.
Kay et al. (2022a) used the GB and NI SIMRCM monthly mean soil moisture data to investigate potential future changes in occurrence of indicative soil moisture extremes and changes in typical wetting and drying dates of soils by 2050–2080 across the UK. This also suggested large increases in the spatial occurrence of low soil moisture levels, and later soil wetting dates. Changes to soil drying dates were less apparent.
Ensemble data from the historical period of the climate-projection-driven datasets show good correspondence with the observation-driven datasets, for both river flows (Figs. 4 and 6) and soil moisture (Fig. 8). More detailed performance analyses are provided elsewhere (Kay, 2021; Lane and Kay, 2021; Kay et al., 2021a, 2022a).
The climate-projection-driven river flow and soil moisture datasets suggest potential future decreases in summer flows, annual minimum 7 d flows, and summer/autumn soil moisture, along with possible future increases in winter flows and annual maximum flows. More detailed analyses, presented elsewhere, illustrate the variation in these general trends, both spatially and by ensemble member (Kay, 2021; Lane and Kay, 2021; Kay et al., 2021a, 2022a). These changes are consistent with the climate projections, which give wetter winters and drier and hotter summers (Murphy et al., 2018, their Fig. 5.2), as well as increased summer PE (Robinson et al., 2022).
A study of trends in historical gauged flows from the UK Benchmark Network (Harrigan et al., 2018) shows a tendency for an increase in winter mean flows and high-flow indices over the past 50 years, although with significant natural decadal variability (clear so-called flood-rich and flood-poor periods). The datasets here suggest that this overall trend could continue into the future, and they could potentially be used to further investigate natural variability. The analysis of Harrigan et al. (2018) shows less consistent changes in summer mean flows or low-flow indices, with catchments in the south/east often showing decreases but catchments in the north/west typically showing increases. The datasets here suggest that more consistent decreases could be seen everywhere in future.
However, the fact that the UKCP18 Regional climate projections applied here only use one GCM/RCM needs to be borne in mind. Other climate models tend to give smaller decreases (or increases) in summer precipitation than the UKCP18 Regional projections (Murphy et al., 2018, Fig. 5.2) so are likely to give lower reductions in summer flows and soil moisture. Similarly, other climate models give a wider range of changes in winter precipitation than the UKCP18 Regional projections (Murphy et al., 2018, Fig. 5.2) so could give larger or smaller increases in winter flows. The UKCP Local projections, produced by nesting a ∼2.2 km convection-permitting model in each RCM PPE member (Kendon et al., 2021), also give some differences in climatic changes compared to the RCM (Kendon et al., 2021) and consequently some differences in hydrological impacts (Kay, 2022). In addition, the use of a high-emissions scenario (RCP8.5) for the UKCP18 Regional projections is likely to lead to more extreme changes than would occur for lower emissions (e.g. Arnell et al., 2014), although RCP8.5 should not be considered implausible (Schwalm et al., 2020).
Further sources of uncertainty in the datasets include the observation-based PE and the calculation of RCM PE. MORECS 40 km monthly PE data are used for the observation-based hydrological model runs, with lower spatial and temporal resolution than the other driving data (Sect. 2.2). A dataset of 1 km daily PE has since been derived (Brown et al., 2022) using HadUK-Grid data (Met Office et al., 2019), although some the variables required had to be interpolated from monthly to daily. The RCM PE used here includes the effect of stomatal closure under higher CO2 concentrations but does not include a potential leaf area increase due to carbon fertilisation (Rudd and Kay, 2016; Robinson et al., 2022).
Potential future changes in land cover are also excluded, as are any artificial influences on river flows. Also, only one hydrological model has been applied; a catchment-based dataset of simulated river flows from the “Enhanced future Flows and Groundwater” (eFlaG) project (Hannaford et al., 2022a) uses similar driving data from the UKCP18 Regional projections for three hydrological models (including G2G), so it could be used to look at potential uncertainty from hydrological model structure (Hannaford et al., 2022b). Note that eFlaG used HadUK-Grid rainfall, both for observation-based runs and for bias correction of UKCP18 RCM data, whereas CEH-GEAR rainfall data were used here since they cover the parts of the Republic of Ireland draining into Northern Ireland, enabling gridded flow simulation across Northern Ireland. The ability to provide full and coherent coverage of gauged and ungauged locations is a particular strength of national-scale grid-based models like G2G in contrast to catchment-based models.
The six datasets described in this paper are available from the Environmental Information Data Centre (EIDC); see Table 1.
The datasets presented here provide consistent spatial simulations of river flows and soil moisture for the whole of the UK, driven by both observed data and by an ensemble of regional climate model data from the latest UK climate projections, UKCP18. These enable direct studies of historical and potential future river flows and soil moisture, but they can also be used to provide inputs for further studies, e.g. to simulate water quality (e.g. Hutchins et al., 2016), crop yields (e.g. Cai et al., 2009), irrigated agriculture economic risk (Salmoral et al., 2019), or ecological impacts (e.g. Bussi et al., 2016).
An online (anonymous) stakeholder survey was carried out for UK-SCAPE WP2.2 in late 2021 (Kay et al., 2022e). This asked a set of questions divided into three broad classes; “job role and level of experience”, “data of interest”, and “data format/access preferences”. The responses on “data of interest” showed that there is a lot of interest in water quantity, including both river flows and soil moisture, and a lot of interest in potential future changes in river flows, although slightly less so for changes in soil moisture. Furthermore, the responses on “data format/access preferences” showed that the greatest first preference was for grids covering sub-regions or the whole country, although perhaps unsurprising this varied by job role (academic, government/regulator, practitioner/consultant), which likely influences how data are used. A large proportion of respondents were also happy downloading the full dataset as NetCDF files from the EIDC. The datasets described here thus provide for a significant stakeholder demand, although there is always more that could be done. Further developments could include a web tool allowing interactive data exploration and plotting.
ALK prepared the manuscript, with contributions from all co-authors.
The contact author has declared that none of the authors has any competing interests.
Publisher's note: Copernicus Publications remains neutral with regard to jurisdictional claims in published maps and institutional affiliations.
Thanks to Emma Robinson (UKCEH) for work on the estimation of PE from climate model data.
This research has been supported by the Natural Environment Research Council (grant no. NE/R016429/1).
This paper was edited by Andrea Popp and reviewed by two anonymous referees.
Arnell, N. W., Charlton, M. B., and Lowe, J. A.: The effect of climate policy on the impacts of climate change on river flows in the UK, J. Hydrol., 510, 424–435, 2014.
Bell, V. A., Kay, A. L., Jones, R. G., and Moore, R. J.: Development of a high resolution grid-based river flow model for use with regional climate model output, Hydrol. Earth Syst. Sci., 11, 532–549, https://doi.org/10.5194/hess-11-532-2007, 2007.
Bell, V. A., Kay, A. L., Jones, R. G., Moore, R. J., and Reynard, N. S.: Use of soil data in a grid-based hydrological model to estimate spatial variation in changing flood risk across the UK, J. Hydrol., 377, 335–350, 2009.
Bell, V. A., Kay, A. L., Davies, H. N., and Jones, R. G.: An assessment of the possible impacts of climate change on snow and peak river flows across Britain, Clim. Change, 136, 539–553, 2016.
Bell, V. A., Rudd, A. C., Kay, A. L., and Davies, H. N.: Grid-to-Grid model estimates of monthly mean flow and soil moisture for Great Britain (1960 to 2015): observed driving data [MaRIUS-G2G-MORECS-monthly], NERC Environmental Information Data Centre [data set], https://doi.org/10.5285/e911196a-b371-47b1-968c-661eb600d83b, 2018a.
Bell, V. A., Rudd, A. C., Kay, A. L., and Davies, H. N.: Grid-to-Grid model estimates of monthly mean flow and soil moisture for Great Britain: weather@home2 (climate model) driving data [MaRIUS-G2G-WAH2-monthly], NERC Environmental Information Data Centre [data set], https://doi.org/10.5285/3b90962e-6fc8-4251-853e-b9683e37f790, 2018b.
Brown, M. J., Robinson, E. L., Kay, A. L., Chapman, R., Bell, V. A., and Blyth, E. M.: Potential evapotranspiration derived from HadUK-Grid 1km gridded climate observations 1969–2021 (Hydro-PE HadUK-Grid), NERC EDS Environmental Information Data Centre [data set], https://doi.org/10.5285/9275ab7e-6e93-42bc-8e72-59c98d409deb, 2022.
Bussi, G., Whitehead, P. G., Bowes, M. J., Read, D. S., Prudhomme, C., and Dadson, S. J.: Impacts of climate change, land-use change and phosphorus reduction on phytoplankton in the River Thames (UK), Sci. Total Environ., 572, 1507–1519, 2016.
Cai, X., Wang, D., and Laurent, R.: Impact of Climate Change on Crop Yield: A Case Study of Rainfed Corn in Central Illinois, J. Appl. Meteorol. Climatol., 4, 1868–1881, 2009.
Formetta, G., Prosdocimi, I., Stewart, E., and Bell, V.: Estimating the index flood with continuous hydrological models: an application in Great Britain, Hydrol. Res., 49, 123–133, 2018.
Guillod, B. P., Jones, R. G., Kay, A. L., Massey, N. R., Sparrow, S., Wallom, D. C. H., and Wilson, S. S.: Managing the Risks, Impacts and Uncertainties of drought and water Scarcity (MaRIUS) project: Large set of potential past and future climate time series for the UK from the weather@home2 model, Centre for Environmental Data Analysis [data set], https://doi.org/10.5285/0cea8d7aca57427fae92241348ae9b03, 2017.
Guillod, B. P., Jones, R. G., Dadson, S. J., Coxon, G., Bussi, G., Freer, J., Kay, A. L., Massey, N. R., Sparrow, S. N., Wallom, D. C. H., Allen, M. R., and Hall, J. W.: A large set of potential past, present and future hydro-meteorological time series for the UK, Hydrol. Earth Syst. Sci., 22, 611–634, https://doi.org/10.5194/hess-22-611-2018, 2018.
Hannaford, J., Mackay, J., Ascot, M., Bell, V, Chitson, T., Cole, S., Counsell, C., Durant, M., Facer-Childs, K., Jackson, C., Kay, A., Lane, R., Mansour, M., Moore, R. J., Parry, S., Rudd, A., Simpson, M., Turner, S., Wallbank, J., Wells, S., and Wilcox, A.: Hydrological projections for the UK, based on UK Climate Projections 2018 (UKCP18) data, from the Enhanced Future Flows and Groundwater (eFLaG) project, NERC EDS Environmental Information Data Centre [data set], https://doi.org/10.5285/1bb90673-ad37-4679-90b9-0126109639a9, 2022a.
Hannaford, J., Mackay, J., Ascott, M., Bell, V., Chitson, T., Cole, S., Counsell, C., Durant, M., Jackson, C. R., Kay, A., Lane, R., Mansour, M., Moore, R., Parry, S., Rudd, A., Simpson, M., Facer-Childs, K., Turner, S., Wallbank, J., Wells, S., and Wilcox, A.: eFLaG: enhanced future FLows and Groundwater. A national dataset of hydrological projections based on UKCP18, Earth Syst. Sci. Data Discuss. [preprint], https://doi.org/10.5194/essd-2022-40, in review, 2022b.
Harrigan, S., Hannaford, J., Muchan, K., and Marsh, T. J.: Designation and trend analysis of the updated UK Benchmark Network of river flow stations: the UKBN2 dataset, Hydrol. Res., 49, 552–567, 2018.
Hough, M. N. and Jones, R. J. A.: The United Kingdom Meteorological Office rainfall and evaporation calculation system: MORECS version 2.0-an overview, Hydrol. Earth Syst. Sci., 1, 227–239, https://doi.org/10.5194/hess-1-227-1997, 1997.
Hutchins, M. G., Williams, R. J., Prudhomme, C., Bowes, M. J., Brown, H. E., Waylett, A. J., and Loewenthal, M.: Projections of future deterioration in UK river quality are hampered by climatic uncertainty under extreme conditions, Hydrol. Sci. J., 61, 2818–2833, 2016.
Kay, A. L.: Simulation of river flow in Britain under climate change: baseline performance and future seasonal changes, Hydrol. Process., 35, e14137, https://doi.org/10.1002/hyp.14137, 2021.
Kay, A. L.: Differences in hydrological impacts using regional climate model and nested convection-permitting model data, Clim. Change, 173, 11, https://doi.org/10.1007/s10584-022-03405-z, 2022.
Kay, A. L. and Crooks, S. M.: An investigation of the effect of transient climate change on snowmelt, flood frequency and timing in northern Britain, Int. J. Climatol., 34, 3368–381, 2014.
Kay, A. L., Davies, H. N., Lane, R. A., Rudd, A. C., and Bell, V. A.: Grid-based simulation of river flows in Northern Ireland: model performance and future flow changes, J. Hydrol.-Regional Studies, 38, 100967, https://doi.org/10.1016/j.ejrh.2021.100967, 2021a.
Kay, A. L., Griffin, A., Rudd, A. C., Chapman, R. M., Bell, V. A., and Arnell, N. W.: Climate change effects on indicators of high and low river flow across Great Britain, Adv. Water Resour., 151, 103909, https://doi.org/10.1016/j.advwatres.2021.103909, 2021b.
Kay, A. L., Rudd, A. C., Davies, H. N., Lane, R. A., and Bell, V. A.: Grid-to-Grid model estimates of river flow for Great Britain driven by observed data (1980 to 2011). NERC Environmental Information Data Centre [data set], https://doi.org/10.5285/2f835517-253e-4697-b774-ab6ff2c0d3da, 2021c.
Kay, A. L., Rudd, A. C., Davies, H. N., Lane, R. A., and Bell, V. A.: Grid-to-Grid model estimates of river flow for Northern Ireland driven by observed data (1980 to 2011), NERC Environmental Information Data Centre [data set], https://doi.org/10.5285/f5fc1041-e284-4763-b8b7-8643c319b2d0, 2021d.
Kay, A. L., Rudd, A. C., Davies, H. N., Lane, R. A., and Bell, V. A.: Grid-to-Grid model estimates of soil moisture for Great Britain and Northern Ireland driven by observed data (1980 to 2011), NERC Environmental Information Data Centre [data set], https://doi.org/10.5285/c9a85f7c-45e2-4201-af82-4c833b3f2c5f, 2021e.
Kay, A. L., Lane, R. A., and Bell, V. A.: Grid-based simulation of soil moisture in the UK: future changes in extremes and wetting and drying dates, Environ. Res. Lett., 17, 074029, https://doi.org/10.1088/1748-9326/ac7a4e, 2022a.
Kay, A. L., Rudd, A. C., Davies, H. N., Lane, R. A., and Bell, V. A.: Grid-to-Grid model estimates of river flow for Great Britain driven by UK Climate Projections 2018 (UKCP18) Regional (12 km) data (1980 to 2080) v2, NERC Environmental Information Data Centre [data set], https://doi.org/10.5285/18be3704-0a6d-4917-aa2e-bf38927321c5, 2022b.
Kay, A. L., Rudd, A. C., Davies, H. N., Lane, R. A., and Bell, V. A.: Grid-to-Grid model estimates of river flow for Northern Ireland driven by UK Climate Projections 2018 (UKCP18) Regional (12 km) data (1980 to 2080) v2, NERC Environmental Information Data Centre [data set], https://doi.org/10.5285/76057b0a-b18f-496f-891c-d5b22bd0b291, 2022c.
Kay, A. L., Rudd, A. C., Davies, H. N., Lane, R. A., and Bell, V. A.: Grid-to-Grid model estimates of soil moisture for Great Britain and Northern Ireland driven by UK Climate Projections 2018 (UKCP18) Regional (12 km) data (1980 to 2080), NERC Environmental Information Data Centre [data set], https://doi.org/10.5285/f7142ced-f6ff-486b-af33-44fb8f763cde, 2022d.
Kay, A. L., Spencer, M., and Bell, V. A.: UK-SCAPE WP2.2: Water Futures. Stakeholder questionnaire results. Wallingford, UK Centre for Ecology & Hydrology, 14 pp., http://nora.nerc.ac.uk/id/eprint/531705/ (last access: 15 June 2023), 2022e.
Kay, A. L., Rudd, A. C., and Coulson, J.: Spatial downscaling of precipitation for hydrological modelling: assessing a simple method and its application under climate change in Britain, Hydrol. Process., 37, e14823, https://doi.org/10.1002/hyp.14823, 2023.
Kendon, E., Short, C., Pope, J., Chan, S., Wilkinson, J., Tucker, S., Bett, P., and Harris, G.: Update to UKCP Local (2.2 km) projections, Met Office Hadley Centre, Exeter, UK, https://www.metoffice.gov.uk/pub/data/weather/uk/ukcp18/science-reports/ukcp18_local_update_report_2021.pdf (last access: 15 June 2023), 2021.
Lane, R. A. and Kay, A. L.: Climate change impact on the magnitude and timing of hydrological extremes across Great Britain, Front. Water, 3, 684982, https://doi.org/10.3389/frwa.2021.684982, 2021.
Lowe, J. A., Bernie, D., Bett, P., et al.: UKCP18 Science Overview report, Exeter, UK: Met Office Hadley Centre, https://www.metoffice.gov.uk/pub/data/weather/uk/ukcp18/science-reports/UKCP18-Overview-report.pdf (last access: 15 June 2023), 2018.
Met Office Hadley Centre: UKCP18 Regional Projections on a 12 km grid over the UK for 1980–2080, CEDA, September 2019 [data set], http://catalogue.ceda.ac.uk/uuid/589211abeb844070a95d061c8cc7f604 (last access: 15 June 2023), 2018.
Met Office, Hollis, D., McCarthy, M., Kendon, M., Legg, T., Simpson, I.: HadUK-Grid Gridded Climate Observations on a 1km grid over the UK, v1.0.0.0 (1862–2017), 14 November 2019, Centre for Environmental Data Analysis [data set], https://doi.org/10.5285/2a62652a4fe6412693123dd6328f6dc8, 2019.
Morris, D. G. and Flavin, R. W.: A digital terrain model for hydrology, in: Proceedings of the 4th International Symposium on Spatial Data Handling, 23–27 July 1990, Zurich, Switzerland, 250–262, 1990.
Murphy, J. M., Harris, G. R., Sexton, D. M. H., Kendon, E. J., Bett, P. E., Clark, R. T., Eagle, K. E., Fosser, G., Fung, F., Lowe, J. A., McDonald, R. E., McInnes, R. N., McSweeney, C. F., Mitchell, J. F. B., Rostron, J. W., Thornton, H. E., Tucker, S., and Yamazaki, K.: UKCP18 Land Projections: Science Report. Met Office Hadley Centre, Exeter, UK, https://www.metoffice.gov.uk/pub/data/weather/uk/ukcp18/science-reports/UKCP18-Land-report.pdf (last access: 15 June 2023), 2018.
Rameshwaran, P., Bell, V. A., Brown, M. J., Davies, H. N., Kay, A. L., Rudd, A. C., and Sefton, C.: Use of abstraction and discharge data to improve the performance of a national-scale hydrological model, Water Resour. Res., 5, e2021WR029787, https://doi.org/10.1029/2021WR029787, 2022.
Riahi, K., Rao, S., Krey, V. Cho, C., Chirkov, V., Fischer, G., Kindermann, G., Nakicenovic. N., and Rafaj, P.: RCP 8.5 – A scenario of comparatively high greenhouse gas emissions, Clim. Change, 109, 33, https://doi.org/10.1007/s10584-011-0149-y, 2011.
Robinson, E. L., Kay, A. L., Brown, M., Chapman, R., Bell, V., and Blyth, E. M.: Potential evapotranspiration derived from the UK Climate Projections 2018 Regional Climate Model ensemble 1980–2080 (Hydro-PE UKCP18 RCM), NERC Environmental Information Data Centre [data set], https://doi.org/10.5285/eb5d9dc4-13bb-44c7-9bf8-c5980fcf52a4, 2021.
Robinson, E. L., Brown, M. J., Kay, A. L., Lane, R. A., Chapman, R., Bell, V. A., and Blyth, E. M.: Hydro-PE: gridded datasets of historical and future Penman-Monteith potential evaporation for the United Kingdom, Earth Syst. Sci. Data Discuss. [preprint], https://doi.org/10.5194/essd-2022-288, in review, 2022.
Rowland, C. S., Morton, R. D., Carrasco, L., McShane, G., O'Neil, A. W., and Wood, C. M.: Land Cover Map 2015 (25m raster, GB), NERC Environmental Information Data Centre [data set], https://doi.org/10.5285/bb15e200-9349-403c-bda9-b430093807c7, 2017a.
Rowland, C. S., Morton, R. D., Carrasco, L., McShane, G., O'Neil, A. W., and Wood, C. M.: Land Cover Map 2015 (25 m raster, N. Ireland), NERC EIDC [data set], https://doi.org/10.5285/47f053a0-e34f-4534-a843-76f0a0998a2f, 2017b.
Rudd, A. C. and Kay, A. L.: Use of very high resolution climate model data for hydrological modelling: estimation of potential evaporation, Hydrol. Res., 47, 660–670, https://doi.org/10.2166/nh.2015.028, 2016.
Rudd, A. C., Bell, V. A., and Kay, A. L.: National-scale analysis of simulated hydrological droughts (1891–2015), J. Hydrol., 550, 368–385, 2017.
Salmoral, G., Rey, D., Rudd, A., de Margon, P., and Holman, I.: A Probabilistic Risk Assessment of the National Economic Impacts of Regulatory Drought Management on Irrigated Agriculture, Earth's Future, 7, 178–196, 2019.
Schwalm, C. R., Glendon, S., and Duffy, P. B.: RCP8.5 tracks cumulative CO2 emissions, P. Natl. Acad. Sci. USA, 117, 19656–19657, 2020.
Tanguy, M., Dixon, H., Prosdocimi, I., Morris, D. G., and Keller, V. D. J.: Gridded estimates of daily and monthly areal rainfall for the United Kingdom (1890–2015) [CEH-GEAR], NERC EIDC [data set], https://doi.org/10.5285/33604ea0-c238-4488-813d-0ad9ab7c51ca, 2016.