the Creative Commons Attribution 4.0 License.
the Creative Commons Attribution 4.0 License.
 | 22 Mar 2023
Energy-related CO2 emission accounts and datasets for 40 emerging economies in 2010–2019
Shuping Li
Weichen Zhao
Binyuan Liu
Yuli Shan
Dabo Guan
Since 2000, CO2 emissions from emerging economies have outstripped those of developed economies. To limit global warming to under 1.5 ∘C by 2100, over 100 emerging economies have proposed net-zero carbon targets. Yet the supportive data are lacking – no inventory of CO2 emission outlines detailed sources by sector or distribution at the subnational level for these economies. Here, we redress the balance by establishing a dataset for an energy-related CO2 emission inventory that covers 47 sectors and eight energy types in 40 emerging economies (https://doi.org/10.5281/zenodo.7309360, Cui et al., 2021). Their emissions, growing rapidly by 3.0 % yr−1, reached 7.5 Gt in 2019 and were sourced primarily in coal and oil (34.6 % and 28.1 %, respectively) and consumed by the power and transportation sectors. Meanwhile, among African countries in this group, biomass combustion was responsible for 34.7 %–96.2 % of emissions. Our dataset fills a data gap by providing a detailed, robust emission accounting baseline for emerging economies – an advance that will support emission reduction policymaking at global, national, and subnational levels.
Please read the corrigendum first before continuing.
-
Notice on corrigendum
The requested paper has a corresponding corrigendum published. Please read the corrigendum first before downloading the article.
-
Article
(2721 KB)
- Corrigendum
-
Supplement
(1212 KB)
-
The requested paper has a corresponding corrigendum published. Please read the corrigendum first before downloading the article.
- Article
(2721 KB) - Full-text XML
- Corrigendum
-
Supplement
(1212 KB) - BibTeX
- EndNote


The twin needs for economic growth and emission reduction constitute a grand challenge for all countries, not least emerging economies – defined as less developed countries, covering 181 regions including those grouped by the United Nations (United Nations, 2020; Statistics Division of the United Nations Secretariat, 2022) as developing regions. Aside from the balancing act of meeting emission targets while maintaining socioeconomic development, these countries face other issues that are crucial in context: identifying which sectors are major emission sources, and pinpointing regions with significant levels of domestic emissions. To determine each, fundamental data on emissions are needed. That need is becoming urgent, as emerging economies are significant contributors to global emissions. Since 2000, CO2 emissions from emerging economies have outstripped those of developed economies. From 2010 to 2019, their share of emissions has increased from 16.9 Gt and 55.4 % to 21.2 Gt and 63.0 %: a total of 4.3 Gt, more than 3 times the reduction in emissions by developed economies (International Energy Agency, 2021). Although any single emerging economy (excluding China and India) contributed less than 2 % of annual global emissions during this period, their collective emissions (i.e., of 99 country's economies) grew faster than the global average of 2.3 % yr−1. Myanmar's fossil fuel emissions, for instance, increased by 18.0 % yr−1 (International Energy Agency, 2021) – over 7 times the average global rate. Sharing a fast-growing GDP of +3.4 % yr−1 on average, and high carbon intensity (World Bank, 2020), emerging economies could potentially become emission giants within the next decades. Since the world carbon budget tightens to limit global warming, emerging economies have to confront the climate change challenge, by either mitigation or adaptation.
Since the Paris Agreement was signed in 2015, more than 100 emerging economies have therefore proposed to reduce emissions or emissions per unit of GDP towards the aim of limiting global warming below 1.5 ∘C by 2100 (Allen et al., 2018). Of these, 37 countries have policy or legislation in place aimed at reducing emissions to net zero (Net Zero Tracker, 2021). Uruguay and Indonesia, for instance, plan to reach carbon neutrality in 2050 and 2060, respectively (UNFCCC, 2021; Net Zero Tracker, 2021), while the governments of most emerging economies in South Asia and Africa are currently contemplating a net-zero target.
The crux, as stated above, is that socioeconomic development is essential if emerging economies are to build capacity for better mitigation and adaptation to climate change, even as concomitant CO2 emissions are inevitable (Riti et al., 2017). However, given that each of these countries, barring China and India, currently emits small volumes of CO2, the emission inventory data for them have been scant in comparison to those for major, high-emitting economies – which are amply available from international institutes.
Three such institutes – the International Energy Agency (IEA) (International Energy Agency, 2021), the Emissions Database for Global Atmospheric Research (EDGAR) (Crippa et al., 2020), and the Global Carbon Budget (GCB) (Friedlingstein et al., 2020) – publish CO2 emission data for nearly 200 countries. Among them, energy-related CO2 emissions account for the largest proportion of total CO2 emissions, amounting to 33.6 Gt globally in 2019, which represents over 90 % of the total CO2 emissions (International Energy Agency, 2021), including emissions from energy combustion via industrial production, residential heating and cooking, transportation, etc. The datasets of CO2 emissions from energy consumption from the IEA, EDGAR, and GCB all provide long time series; however, their free-access versions provide sectoral classifications that lack specificity in economic activities (IEA, GCB, and EDGAR, especially for the manufacturing industry), or they offer no subnational divisions (IEA and GCB) and only broad energy types (EDGAR and GCB; see Table S2 in the Supplement).
Firstly, following the Intergovernmental Panel on Climate Change (IPCC) 2006 Guidelines, traditional datasets like those produced by IEA and GCB only cover fossil fuels (coal, oil and, natural gas; International Energy Agency, 2021) in energy-related emission data, excluding emissions from biomass – the primary rural energy source in less developed countries. Biomass is, for instance, the main energy source in residential use in Africa's emerging economies, accounting for over 10 % of the total energy supply, with emission factors comparable to those of coal and oil (IPCC, 2006). Yet it was excluded in energy-related CO2 emissions in the datasets from the three institutes and some national accounts for its “carbon neutrality”, which is not true for unsustainable use such as deforestation. Energy systems are complex, involving a number of sources: so to determine specific pathways in any energy transition, specific emission data on each energy type are needed. Biomass burning contributes significantly to CO2 emissions in Asian and South American countries (Shi et al., 2015), and in this dataset we accounted for the emissions from the combustion of unsustainable biomass, which is also energy-related, into the total emissions.
Secondly, although some countries have high-resolution inventories (Álamos et al., 2022; Puliafito et al., 2021), most of the data for emerging economies are not an adequate basis for sectoral and subnational research and policymaking aimed at reducing emissions in emerging economies. For example, the range of economic sectors within each country is diverse (e.g., five sectors for Madagascar, 14 sectors for India) as are national policies for guiding emission reduction in sectors (Lin and Xie, 2014, p. 2; Tan et al., 2019; Feng et al., 2015; Demailly and Quirion, 2006). Thus, it is key for policymakers in emerging economies to acquire supporting data on the specific sectors responsible for most emissions in their countries. Within a country, the subnational administrative regions (e.g., provinces, states, cities) play the actual role of implementing policies of emission abatement. Emerging economies possess fast-growing industries and infrastructure with large emission potential, meanwhile they confront both emission abatement and climate change adaptation issues. Subnational governments have better access to local infrastructure management and socioeconomic policies and thus are more predictive and influential in climate change mitigation and adaptation there (Somanathan et al., 2014). Therefore, although national accounting of CO2 emissions is important for global mitigation strategies, emission data at the subnational level are needed to support domestic tailor-made policies on emission reduction (Allen et al., 2018). While there are datasets providing sectoral gridded emissions, such as EDGAR, using spatial proxies such as point-sourced data, night light, and population distribution to disaggregate the national emissions, the emissions relied more on global-scale proxy data that can miss regional details, which are better covered in local statistics. There is a knowledge gap regarding the lack of detailed and informative data in the context of formulating effective policies and measures to help emerging economics meet their Nationally Determined Contributions (NDCs) while maintaining economic growth as well as to advocate cooperation among emerging economies in climate change mitigation. Therefore, a systematic, detailed, transparent dataset of CO2 emissions in emerging economies is necessary for policymaking in the context of sectors, subnational regions, and energy types.
Here, to fill this gap, we present the Carbon Emission Accounts and Datasets for emerging economies (CEADs; https://ceads.net, last access: 3 March 2023), which aims to provide transparent, verifiable, open-access data on the CO2 emissions of 40 emerging economies (accounting for 17.5 % of the emissions and 12.9 % of GDP of the world) for the period 2010–2019. Given the variety of statistical capacity among these countries, we standardized sectors using relevant data on energy and economic statistics, and we compiled emission inventories at the regional level using subnational statistics. Given its significance as an emission source in these economies, we included emissions from burning, unsustainable biomass in this energy-related emission dataset. The emission dataset covers 47 economic sectors and eight major energy categories in the 40 emergent economies, and in 28 of these we provided a subnational inventory. The 40 countries are selected based on economic development stages, geographic locations, and data availability (for details, see Table S3 in the Supplement). From 2010–2019, the collective emissions rose from 6.2 to 8.8 Gt, and we noted a continuous surge in emissions growth of 4.0 % on average annually. India emitted the most CO2 and Micronesia emitted the least over 2010–2019, and Uganda had the most rapid emission growth of 21.2 % yr−1, while Saudi Arabia had the least growth of −6.3 % yr−1. The sources are primarily fossil fuel combustion in three sectors: power, transportation, and residential. Biomass burning accounts for more than 20 % of total emissions in 22 of the economies, and for those in Africa, the figure is as high as 34.7 %–96.2 %. By revealing patterns in these economies, for instance in subnational emission distributions, the dataset can support both global and domestic policymaking on emission reduction. Researchers and policymakers can use the dataset to distinguish the emission reduction potential of detailed sources and explore the low-carbon pathway towards a net-zero target.
The CO2 emissions of the 40 emerging economies were determined using the Intergovernmental Panel on Climate Change (IPCC) guidelines (IPCC, 2006). For most countries that do not provide subnational energy statistics, we first compiled the national emission inventory using national energy balance and emission factors (see Resource description below for details), then we matched the sectors of each country to 47 sectors that agree with our previous datasets (Shan et al., 2017a, b), and we finally allocated national emissions at the subnational level, region by region. The data compilation methodology is shown as the left branches in Fig. 1. While for countries that have subnational energy statistics such as India, the compilation is different because the nation-to-region step is more supported by local data. Thus, these countries' regional emissions are accounted for first and then matched into sectoral categories, as shown in the right branches in Fig. 1.
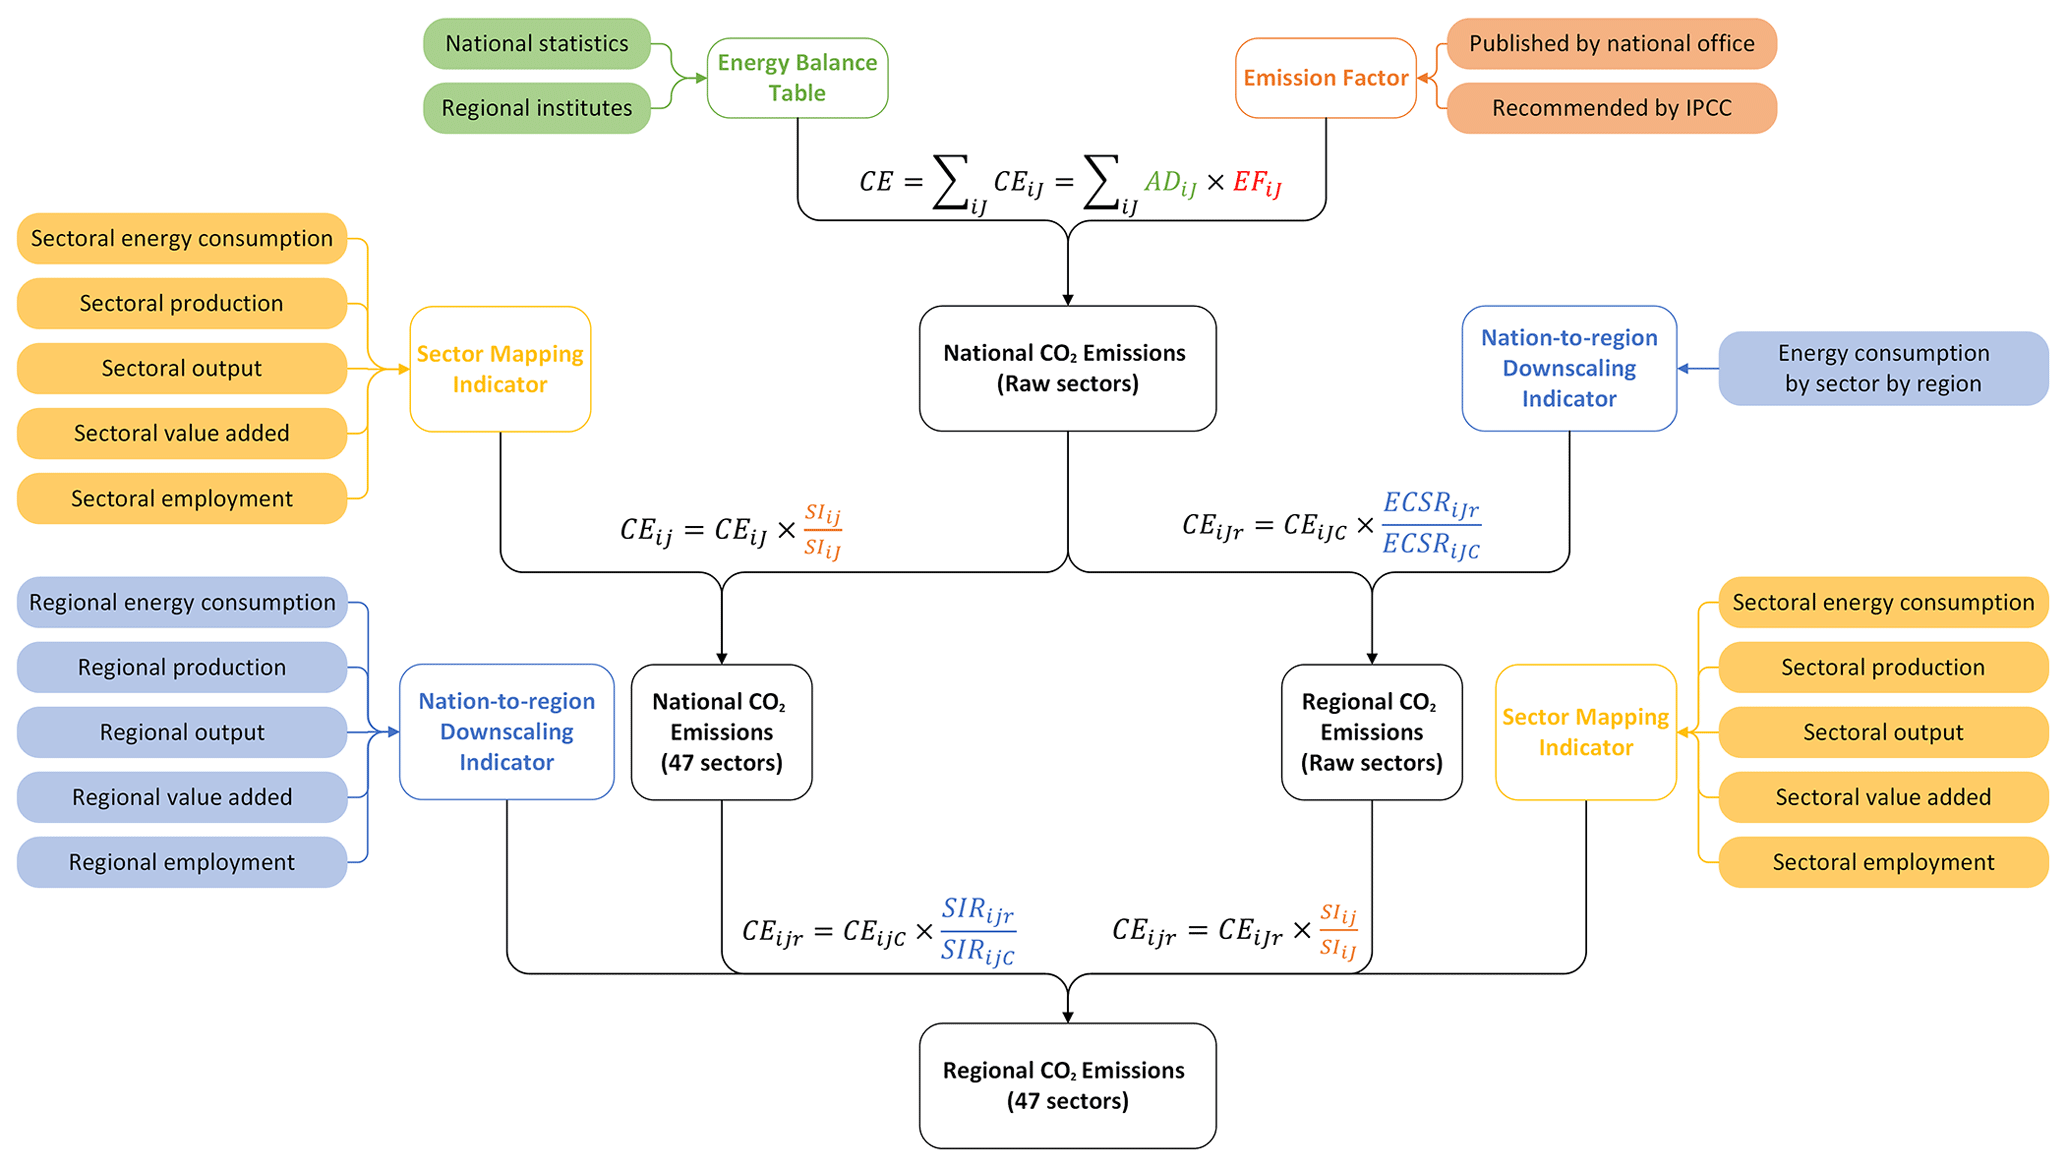
Figure 1Overview of CO2 emission data collection and compilation. The blocks in color show the data sources for each step in the process. Blocks outlined in black show the phases calculated using the adjacent equations. Explanations of Eqs. (1)–(5) are elaborated in detail in the Methods section.
2.1 Data sources
The lack of detail in published CO2 emission data for emerging economies is in part due to the lack of global attention paid to these data per se. Moreover, these economies themselves produce little relevant data.
Generally, energy-sourced CO2 emission data are compiled based on energy consumption data from energy balances and emission factor data from laboratory experiments (for further clarification, see sections below). Since emission factor data are accessible from national statistics organizations and the IPCC recommendation (IPCC, 2006, 2019), the availability of energy balances is key to the data preparation of emissions accounting.
However, unlike developed economies – which may belong to international bodies such as the Organization for Economic Co-operation and Development (OECD) and which may produce uniform, standardized data – the state of statistics in emerging economies varies hugely. Without such data and a perfect statistical system, detailed emission accounting is difficult, and the rough sectoral classifications in the energy statistics of emerging economies are insufficient for well-targeted policymaking.
To compile CO2 emission data for emerging economies, we drew from energy balances, emission factors, sector-mapping indicators, and regional downscaling indicators. Figure 1 also shows the raw data collection for each type.
2.1.1 Energy balances
Energy balance data depict the balance between the supply, transformation (i.e., conversion), and consumption of specific energy types and sectors. The CO2 emissions from fossil fuel combustion are calculated based on both energy combustion arising during the process of transformation (such as the production of electricity and heat) and final consumption (by industry or transportation, for instance). The energy balance data in this report are derived from national statistics and regional institutes (detailed data sources are listed by country in Table S1 in the Supplement).
2.1.2 Emission factors
Emission factors are defined as the emissions per unit (thermal or physical) of energy combustion. Our dataset adopts nationally published emission factors by energy type as a priority. For countries that do not publish these, the IPCC's recommended default emission factors by energy type are used for the calculation. Detailed data sources by country and energy-type aggregations are listed in Tables S1 and S5 in the Supplement, respectively.
2.1.3 Sector-mapping indicators
Since the energy consumption statistics from each of the 40 emerging economies vary in terms of sectors represented, we standardized the sectors into 47, based on the sector definitions of the countries. Using sector-mapping indicators, we then distributed emissions among the 47 sectors (see Table S4 in the Supplement). The indicators included sectoral data on energy consumption, production, outputs, and employment, among other categories, and they are comparable among similar sectors. When it comes to metal production, both ferrous and non-ferrous metals are classified under the same raw sector. Therefore, it is imperative to use a consistent mapping indicator to differentiate between the two sectors. One potential solution is to use the product of each metal production and its corresponding average energy intensity as the sector-mapping indicator to distinguish the ferrous and non-ferrous metal sectors. In case energy intensity data are not available, economic indicators such as value added can be utilized to aid the process.
However, for sectors that are not associated with a single raw sector, the sector-mapping indicators can differ. For instance, employment data could serve as the sector-mapping indicator for service sectors. On the other hand, when allocating emissions from the residential sector into urban and rural sectors, the sector-mapping indicator can be based on the urban and rural population rather than production or economic indicators as is the case with manufacturing sectors.
The priority order for sector-mapping indicators data is as follows: energy consumption data, energy intensity data, value-added data, output data, employment data, and population data. The indicators are collected from national statistical institutes, national economic reports, industrial reports, and continental and regional statistics. (Detailed data sources are listed by country in Table S1 in the Supplement.)
2.1.4 Nation-to-region downscaling indicators
Most countries publish national data on energy balances: fewer publish subnational statistics. We calculated emissions at the regional level priorly by using regional data on energy consumption. For countries lacking regional energy statistics, we used other indicators to downscale national emissions to the regional level. These included regional data on GDP by sector (to represent emissions from economic sectors), population (for residential sectors), and energy consumption by certain industries, among others.
The indicators are collected from national statistics and economic reports. (For detailed information on this, see data sources by country in Table S1 in Supplement.)
2.2 Methods
2.2.1 National emission accounts
Following IPCC guidelines (IPCC, 2006), national CO2 emissions can be calculated as follows:
where CEiJ is the CO2 emissions from the activity type i (such as the energy type for energy-related emissions accounting, industrial process type for process-related emissions accounting, etc.) from sector J, AD is the activity volume (such as energy consumption), and EF is the emission factor which measures the amount of CO2 emissions released by a unit of activity volume.
In cases where the underlying statistics are temporarily missing or when there is a significant anomaly in the statistics compared to preceding and subsequent years, without any plausible explanation, carbon emissions are estimated using the reference emissions and the historical annual growth rate of CO2 emissions (for details, see Table S6 in the Supplement).
In contrast to datasets that focus on fossil fuel CO2 emissions, this dataset also includes CO2 emissions from unsustainable biomass fuel combustion. The calculation is the same as for Eq. (1), and the emissions from biomass combustion are categorized as biomass.
2.2.2 Sectoral emission accounts
Sectoral emissions provide a more granular and accurate picture of emission patterns. Since statistical calibers of sectors vary by country, emissions are accounted and rearranged to a uniform sector classification. Here, we match the sectors to those in the CEADs datasets (Shan et al., 2017b, a), which include emission data by sector – 47 in all (for details, see Table S4 in the Supplement). Based on the national emission accounts above and the indicators for sectoral mapping, the CO2 emissions by matched sectors are as follows:
where SI stands for sector-mapping indicator, including sectoral energy consumption, sectoral energy intensity, sectoral value added, sectoral output, etc. J is the sector defined by national official statistics, and j is the matched sector in the list of 47 sectors.
2.2.3 Regional emission accounts
Some countries have regional energy statistics that facilitate energy-related CO2 emission accounting at the regional, provincial, or state level. The accounting methods are similar to national ones, as the relevant data are available from the regional statistics. However, most developing countries do not have complete regional statistics, and regional sectoral emission accounting for these countries requires other key indicators to enable national emissions to be downscaled. The downscaling can be described as
where CEijr is the CO2 emissions from activity j of energy i in region r, SIR represents the regional-and-sectoral mapping indicator, and means the proportion of region r's energy or economic indicators to that of the whole country (C). The indicators used for downscaling can be energy consumption, industrial production, or other figures that approximately reflect the proportion of a region's emissions to the national total.
Some countries have subnational energy statistics by energy type that can support regional-, provincial-, or state-level energy-related CO2 emissions. For these countries, the regional emissions can be accounted for as the national emissions, and then the energy consumption data are used as the national–regional downscaling indicator to ensure the consistency of the regional and the national emission inventory. After that, the regional emission inventory is matched into 47 sectors as follows:
where CEiJr refers to the CO2 emissions of energy i consumed by sector J in region r, CEiJC refers to the CO2 emissions of energy i consumed by sector J in country C, ECSR is the energy consumption by sector and region, and is the share of the consumption of energy i by sector J in region r in that country C. CEiJr is the CO2 emissions from activity J of sector i in region r, and is the share of the sector-mapping indicator of sector j in activity J.
2.2.4 Uncertainty analysis
Incomplete or inaccurate data collection can lead to uncertainty in both activity volume data and emission factor data, which in turn affects the accuracy of emission accounting. To address this issue, Monte Carlo simulation is utilized in this study to evaluate the uncertainty of emission accounting. The simulation process involves the following equation:
where CE is the total CO2 emissions including emissions from the energy types i used in the sector j. Following the equation, the process includes the following three steps:
- 1.
Determine the probability distributions of activity volume and emission factor data in developing countries. As statistical data and energy types vary among different countries in developing countries, this study determines the activity volume data distribution by 17 sectors and five energy types at a national level. The probability distribution of activity level data is set based on the quality of certain data sources and corresponding uncertainty ranges recommended in the IPCC National Greenhouse Gas Inventory Guidelines (IPCC, 2006). The probability distribution of emission factor data is obtained by simulating the distribution of emission factors for corresponding energy types and categories from each country. Detailed uncertainty information of activity volume and emission factor data are described in Tables S7–S9 and Fig. S1 in the Supplement.
- 2.
Randomly sample from the activity level and emission factor distributions obtained in step 1 and calculate the corresponding CO2 emissions for each category based on the formula.
- 3.
Repeat step 2 for 20 000 simulations to obtain the distribution of CO2 emissions for different categories and the total emissions and the corresponding uncertainty statistics.
3.1 Dataset overview
This dataset will be updated annually and will expand to cover more countries, time series, and sources of CO2 emissions. The dataset currently covers the period from 2010 to 2019 for 40 countries (Cui et al., 2021), of which 28 have a subnational inventory. As also indicated above, we compiled the emission inventory for 47 economic sectors and eight major categories (different energy subgroups which vary by country; see Table S5 in the Supplement for energy categories and subgroups). By pinning down the sectoral sources of emissions, we provide better data for use alongside socioeconomic data in potential macro and micro research along with the necessary basic data to support policymaking for meeting climate targets.
A map of the 2019 emissions of the 40 selected economies is shown in Fig. 2. This reveals a domestic regional heterogeneity in emissions and shows too that per capita emissions are relatively low for most of the countries (lower than the world average of 4.4 t per person; International Energy Agency, 2021; World Bank, 2020). Although India still remains the largest emitters among emerging economies, the emissions of countries in Southeast Asia and South America have recently surged.
Emissions of the 40 emerging economies we studied grew from 5.7 Gt CO2 in 2010 to 7.5 Gt CO2 in 2019, with an average annual growth rate of 3.0 %. India's emissions grew from 1.4 to 2.3 Gt (+6.0 % yr−1). Emissions of the other 39 countries rose from 4.3 to 5.2 Gt (average of +1.9 % yr−1) over the designated period, a trend related to the high-carbon energy systems and ongoing industrialization, which stimulated both economic growth and a rise in emissions. Of the countries, 12 show an annual growth rate in emissions higher than 5 %: Uganda, Laos, Niger, Jordan, Cambodia, Myanmar, Philippines, Madagascar, Kenya, Indonesia, Paraguay, and Mongolia.
Among the sectors accounted for, power is the largest contributor to emissions with 31.7 % of the total, followed by the transportation sector at 14.2 %. From the perspective of energy type, the combustion of coal and oil products contributed 34.6 % and 28.1 % to emissions, respectively. Unsustainable biomass combustion discharged 23.9 % of total emissions, but emissions from this source exceeded 30 % in 17 countries and 50 % in 12 countries including Ethiopia, Kenya, Uganda, Guatemala, Myanmar, and Paraguay.
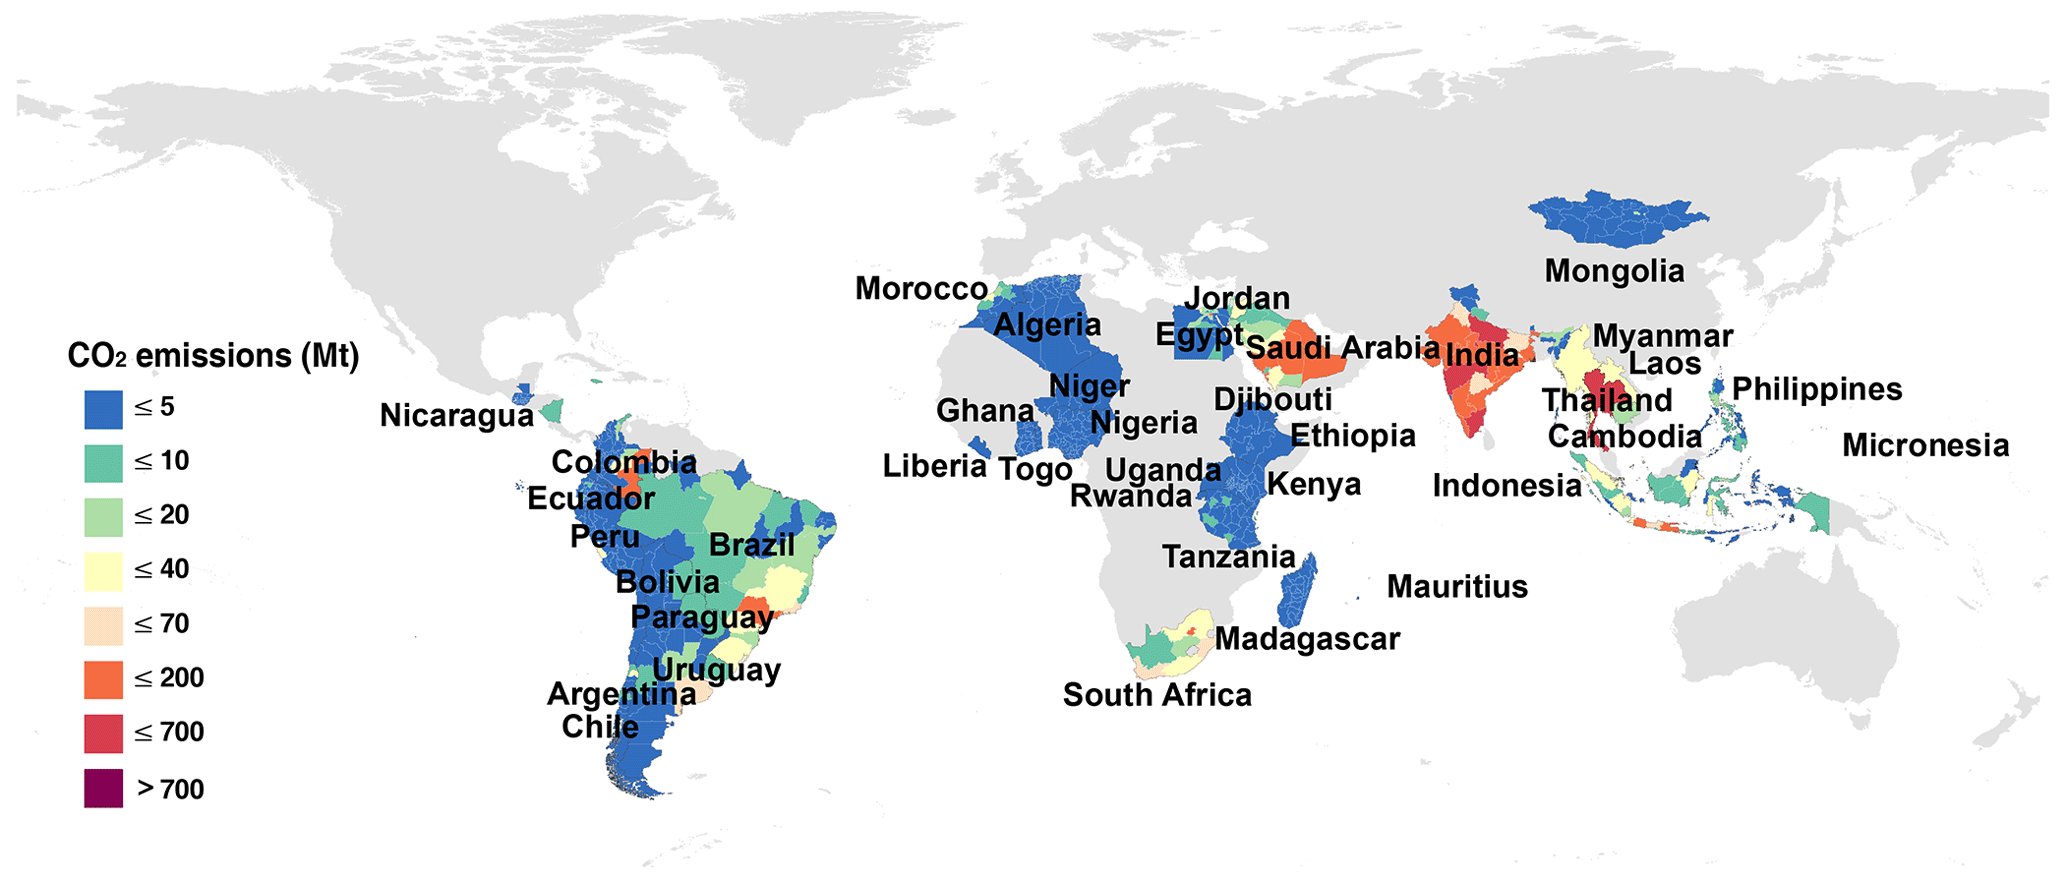
Figure 2CO2 emissions of the selected emerging economies in 2019 (in million tonnes). Darker blue indicates lower per capita emissions, and darker red indicates higher per capita emissions.
3.2 Case study: Myanmar
Myanmar, located in Southeast Asia, has experienced remarkable economic growth in recent years. However, this growth has led to a significant increase in greenhouse gas emissions, making it one of the fastest-growing emitters of CO2 in the world. Unsustainable biomass fuels, accounting for over 50 % of the country's energy needs, contribute to high emissions and deforestation. Myanmar's expanding industrial sector, including energy-intensive manufacturing, also adds to emissions. Balancing economic growth with environmental sustainability remains a challenge for emerging economies. Myanmar's CO2 emissions provide an insightful example for identifying solutions for emission reduction in emerging economies. Therefore, analyzing Myanmar's CO2 emissions from sectoral and energy sources provides an insightful example for identifying solutions and strategies to mitigate emissions in emerging economies (for the sake of convenience, the emissions of 17 merged sectors analyzed here): emission data from other institutes, including IEA, EDGAR, and GCB, are included for the purposes of comparison (for other emerging economies, see Table S10 and Fig. S2 in the Supplement).
With a land area of 676 500 km2, Myanmar is the largest country on the Southeast Asian Peninsula. The population numbers more than 54 million (World Bank, 2019) and has grown at an annual rate of 0.8 % over the past decade. By 2030, the population is predicted to reach 60 million (Department of Population, Ministry of Labour, Immigration and Population, 2018). Myanmar is in the early stage of urbanization, with less than a third of its population living in towns and cities but an additional 7 million people predicted to move from rural to urban areas by 2050 (World Bank, 2019). In recent years, the country's economy has developed rapidly under a series of government reforms. Its GDP, growing by over 7 % yr−1 over the past decade, reached USD 85 billion (at 2010 exchange rates) in 2019 (World Bank, 2019). Among its economic sectors, the service sector is the most economically significant, contributing 43.2 % to the national GDP. However, the country's industrial sector grew rapidly in the period from 2010 to 2019, at an annual rate of 9.6 %, making it the fastest-growing sector in the country (Myanmar Ministry of Electricity and Energy and ERIA, 2019). Unsustainable biomass has traditionally been the dominant energy source in Myanmar, although the demand for petroleum products has swiftly increased with industrialization. The rise in fossil fuel consumption has inevitably boosted CO2 emissions, which grew by 6.3 % yr−1 between 2010 and 2019.
Myanmar is one of the countries most vulnerable to climate change, since its infrastructure and agriculture are sensitive to extreme weather and sea level rise (Oo et al., 2018). To mitigate climate change, in 2017 and 2021 Myanmar's government submitted and updated the first Nationally Determined Contributions, respectively, to set a series of sectoral goals to deal with the challenge. These include increasing hydroelectricity's share in overall energy generation, ensuring that energy sources for achieving rural electrification are at least 30 % renewable, and expanding the country's forested area to 30 % by 2030 (The Republic of the Union of Myanmar, 2015, 2019). However, the country's total CO2 emissions, reflecting the rising trend, stood at 49.0 Mt in 2010 and at 85.3 Mt in 2019. Although Myanmar aims to develop in a sustainable way (The Republic of the Union of Myanmar, 2019), its economic growth – coupled to an ongoing rise in emissions – looks set to continue into the foreseeable future, as evidenced by historical data and related research (Aung et al., 2017; Vo et al., 2019). Given the limits on future emissions, it is necessary for Myanmar to identify its sectors and energy sources that are the heaviest contributors.
The biggest contributor to Myanmar's emissions is its residential sector, followed by other manufacturing (of agricultural goods, construction materials, and oil and natural gas), and wholesale and retail (see the area plot in Fig. 3). Emissions from the residential sector grew moderately from 14.7 Mt in 2010 to 21.8 Mt in 2019. Its share of emissions dropped to 29.8 % in 2019 – a decrease of 6.4 % compared with the peak year of 2013. The CO2 emissions from the other manufacturing sector are stable, with its share of emissions decreasing from 21.3 % in 2010 to 18.0 % in 2019. With the wholesale and retail sector, emissions fluctuated from 10.4 Mt in 2010 to 11.2 Mt in 2019, reducing its share of overall emissions from 21.3 % to 13.2 %. At the same time, the proportion of emissions from two other sectors has rapidly grown, with that of power and heat rising from 7.2 % to 13.1 % and transportation increasing from 8.7 % to 19.6 % over the period from 2010 to 2019. Given ongoing investment in the infrastructure of these two sectors, their share in emissions look likely to increase further (Takeyama, 2018).
In the country's energy mix, biomass is the biggest contributor to national CO2 emissions over the 2010–2019 period (see the pie charts in Fig. 3). It remains a major energy source in Myanmar's residential and service sectors, contributing around 50 % of total energy consumption (Tun and Juchelková, 2019). The country's biomass fuel is mainly derived from the overharvesting of forest timber (Tun and Juchelková, 2019), which has led to a reduction in forest cover as well as forest degradation. This biomass use is neither renewable nor sustainable over time due to the long cycle of forest restoration. The proportion of CO2 contributed by biomass stands at over half (55.3 %–76.8 %) across the designated period. As two sectors – power and heat, and transportation – are both oil-dominated and growing rapidly, CO2 emissions from oil products have increased significantly, from 7.1 Mt in 2010 to 25.1 Mt in 2019, a rise of 197.7 %. Emissions from natural gas increased from 4.1 to 10.3 Mt. Because coal is not Myanmar's primary fuel source, its volume of emissions is significantly lower than that of other types of energy.
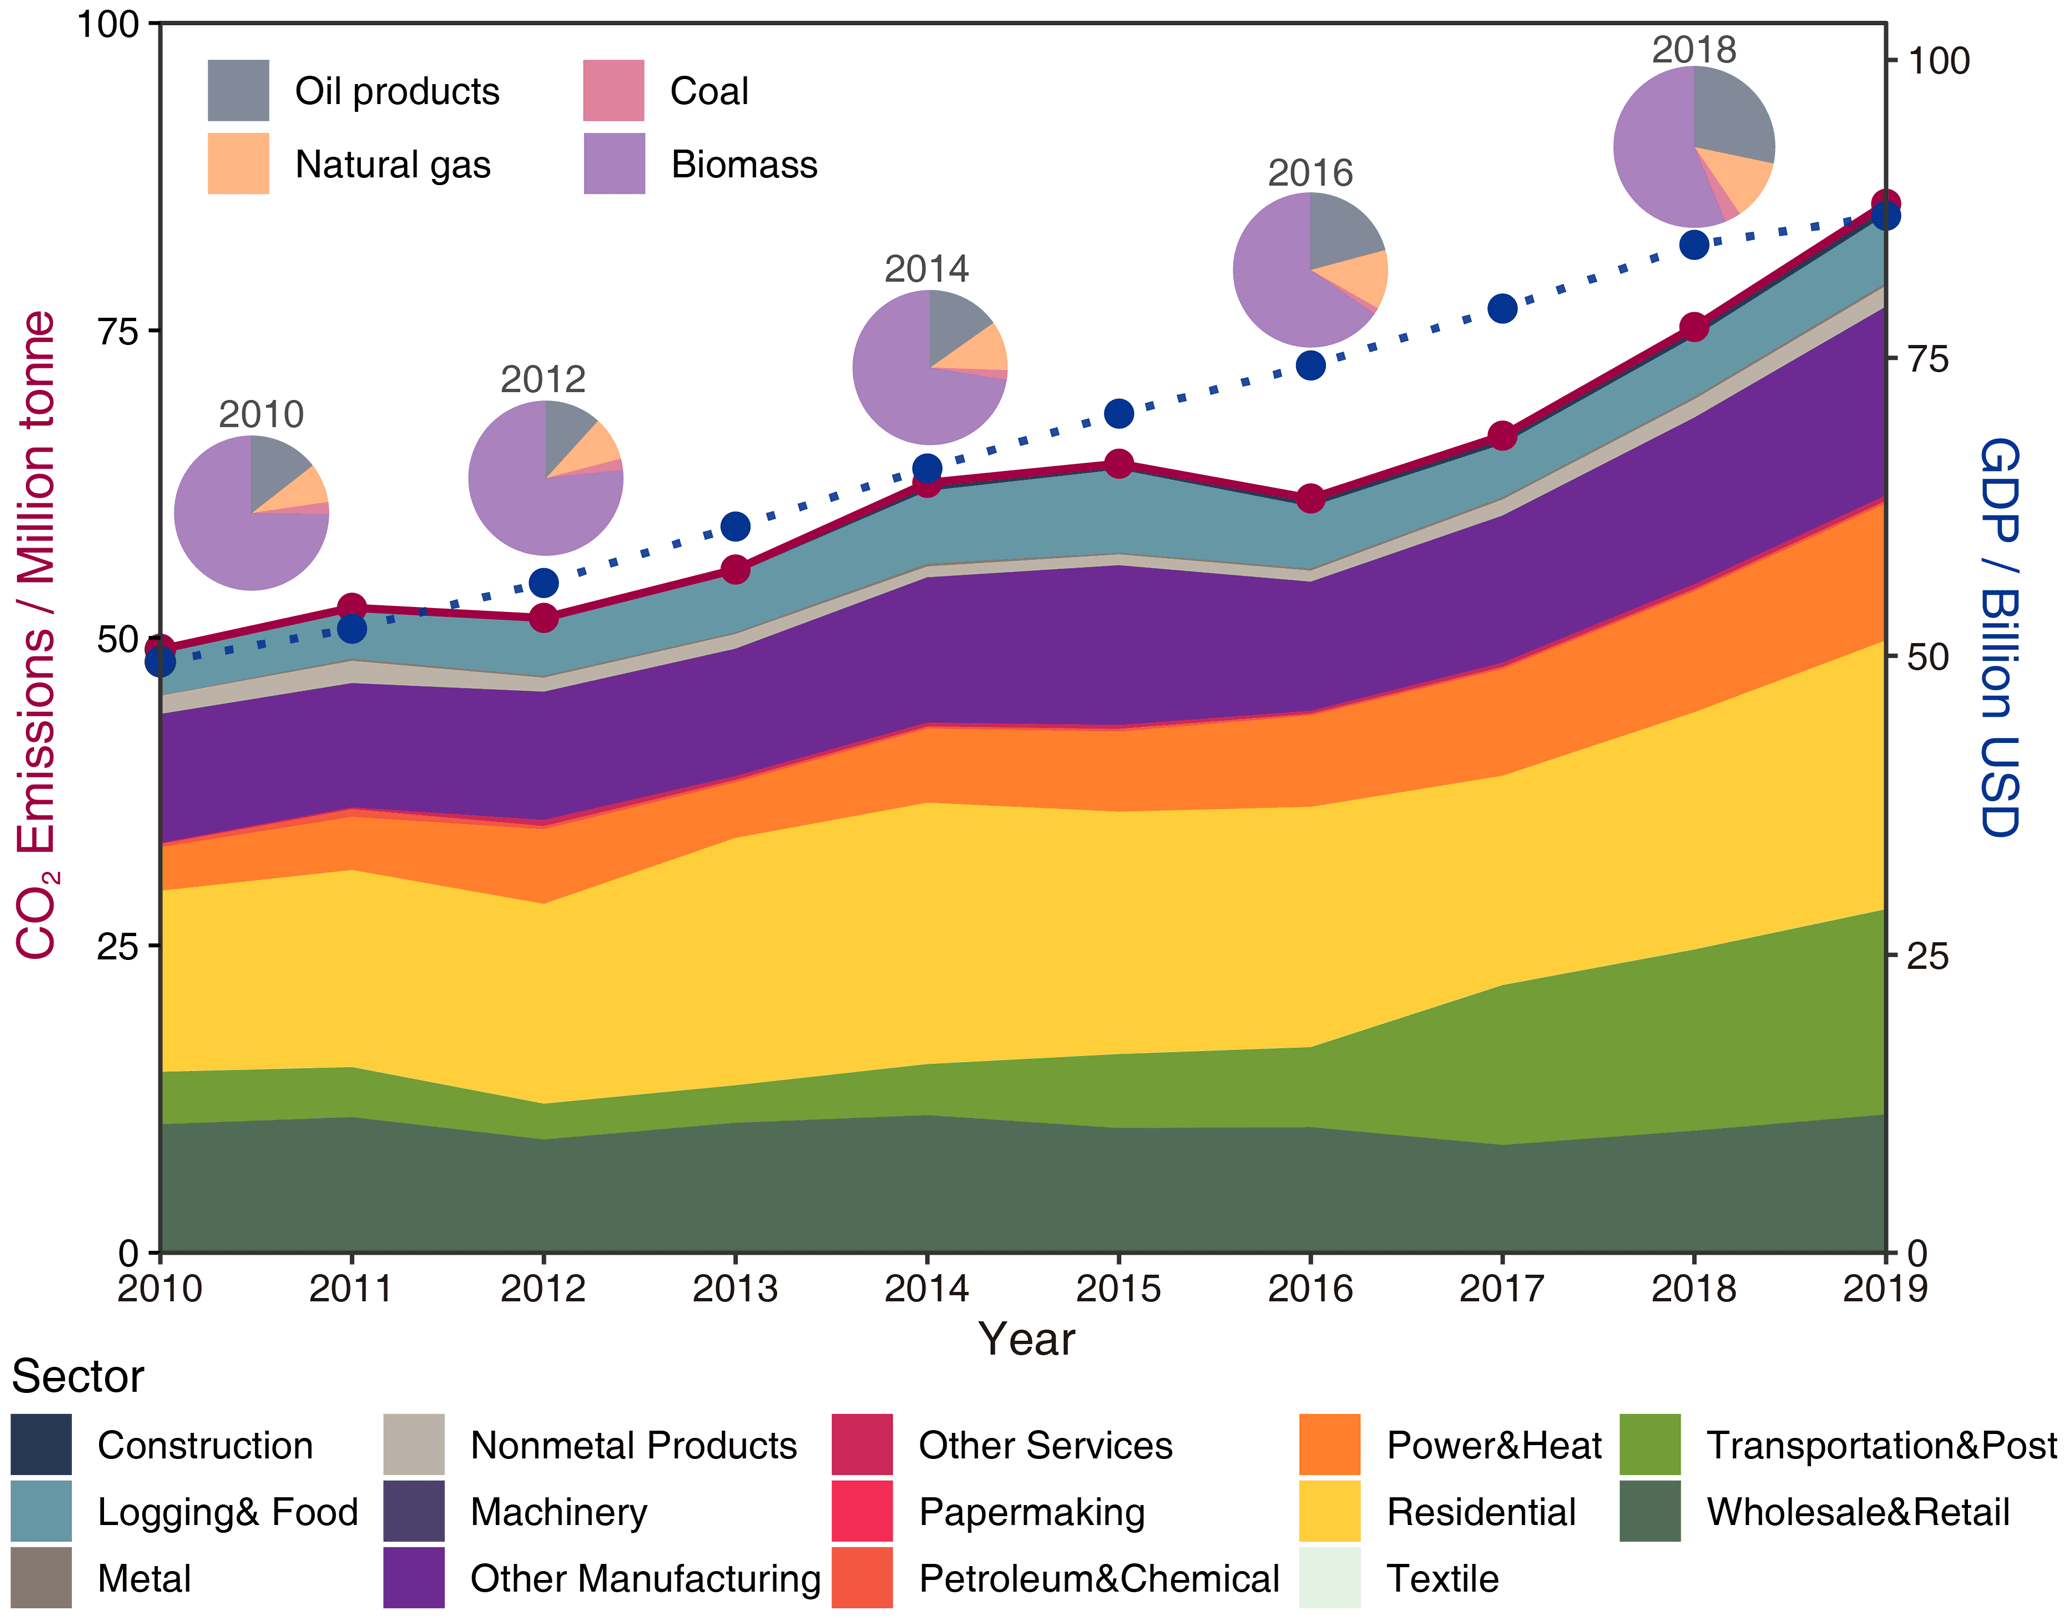
Figure 3CO2 emissions of Myanmar over 2010–2019. The red line shows the growth of CO2 emissions, and the dotted blue line charts the growth of GDP. The pie charts show CO2 emissions by energy source, the the area plot, and the area chart shows the CO2 emissions by sector (17 sector aggregates merged from 47 sectors: see Table S4 in the Supplement for details).
3.3 Technical validation
According to CEADs calculations, Myanmar's emissions (excluding those linked to biomass) reveal a trend consistent with the CO2 statistics from the other institutes. In 2010, the start of the designated period, the values of IEA statistics were lower than those from CEADs, but grew closer after 2013, and by 2019 nearly tallied. Once the CEADs biomass emissions are factored in however, its overall carbon emissions are far higher than those calculated by other institutes (Fig. 4) whose energy emission data do not cover biomass.
When sectoral emissions from CEADs and the other institutes are compared, additional disparities emerge. For instance, IEA's figure on 2017 transport emissions in Myanmar was 5.9 Mt, whereas CEADs' is 13.0 Mt. There are two reasons for the difference. From the perspective of statistical caliber, CEADs' energy classification is more detailed. For example, CEADs breaks down oil products into motor gasoline, diesel oil, fuel oil, and other forms, each with a corresponding emission factor. IEA does not select the same energy subcategories, and the emission factors used are different from CEADs, which results in different emission data. CEADs and IEA also use different sources of energy consumption data. CEADs uses data from the Economic Research Institute for ASEAN and East Asia (ERIA). IEA draws from multiple data sources including, for example, the Myanmar Central Statistical Organization, the International Renewable Energy Agency (IRENA), and the Asia Pacific Energy Research Centre (APERC). There is a clear gap between energy consumption statistics produced by CEADs and IEA. For example, in 2017, the base data of oil products used in Myanmar's transport sector adopted by IEA were 1875 ktoe, but the data CEADs used show that the oil products consumed in this sector were 4196 ktoe. As mentioned, CEADs prefers national and regional statistical institutes from transparent and accessible websites, while IEA collects national data from websites, publications, and “direct communications” – the latter being more flexible but less available for verification by data users.
GCB and EDGAR, meanwhile, depend on multiple data sources such as British Petroleum (BP), IEA, and the United Nations, which inherit the raw data differences between the sources and CEADs dataset. This dataset provides country-specific sources of the raw data used (Table S1 in the Supplement), and researchers can access the websites where the data were sourced to provide evidence for evaluating the reliability and robustness of the dataset.
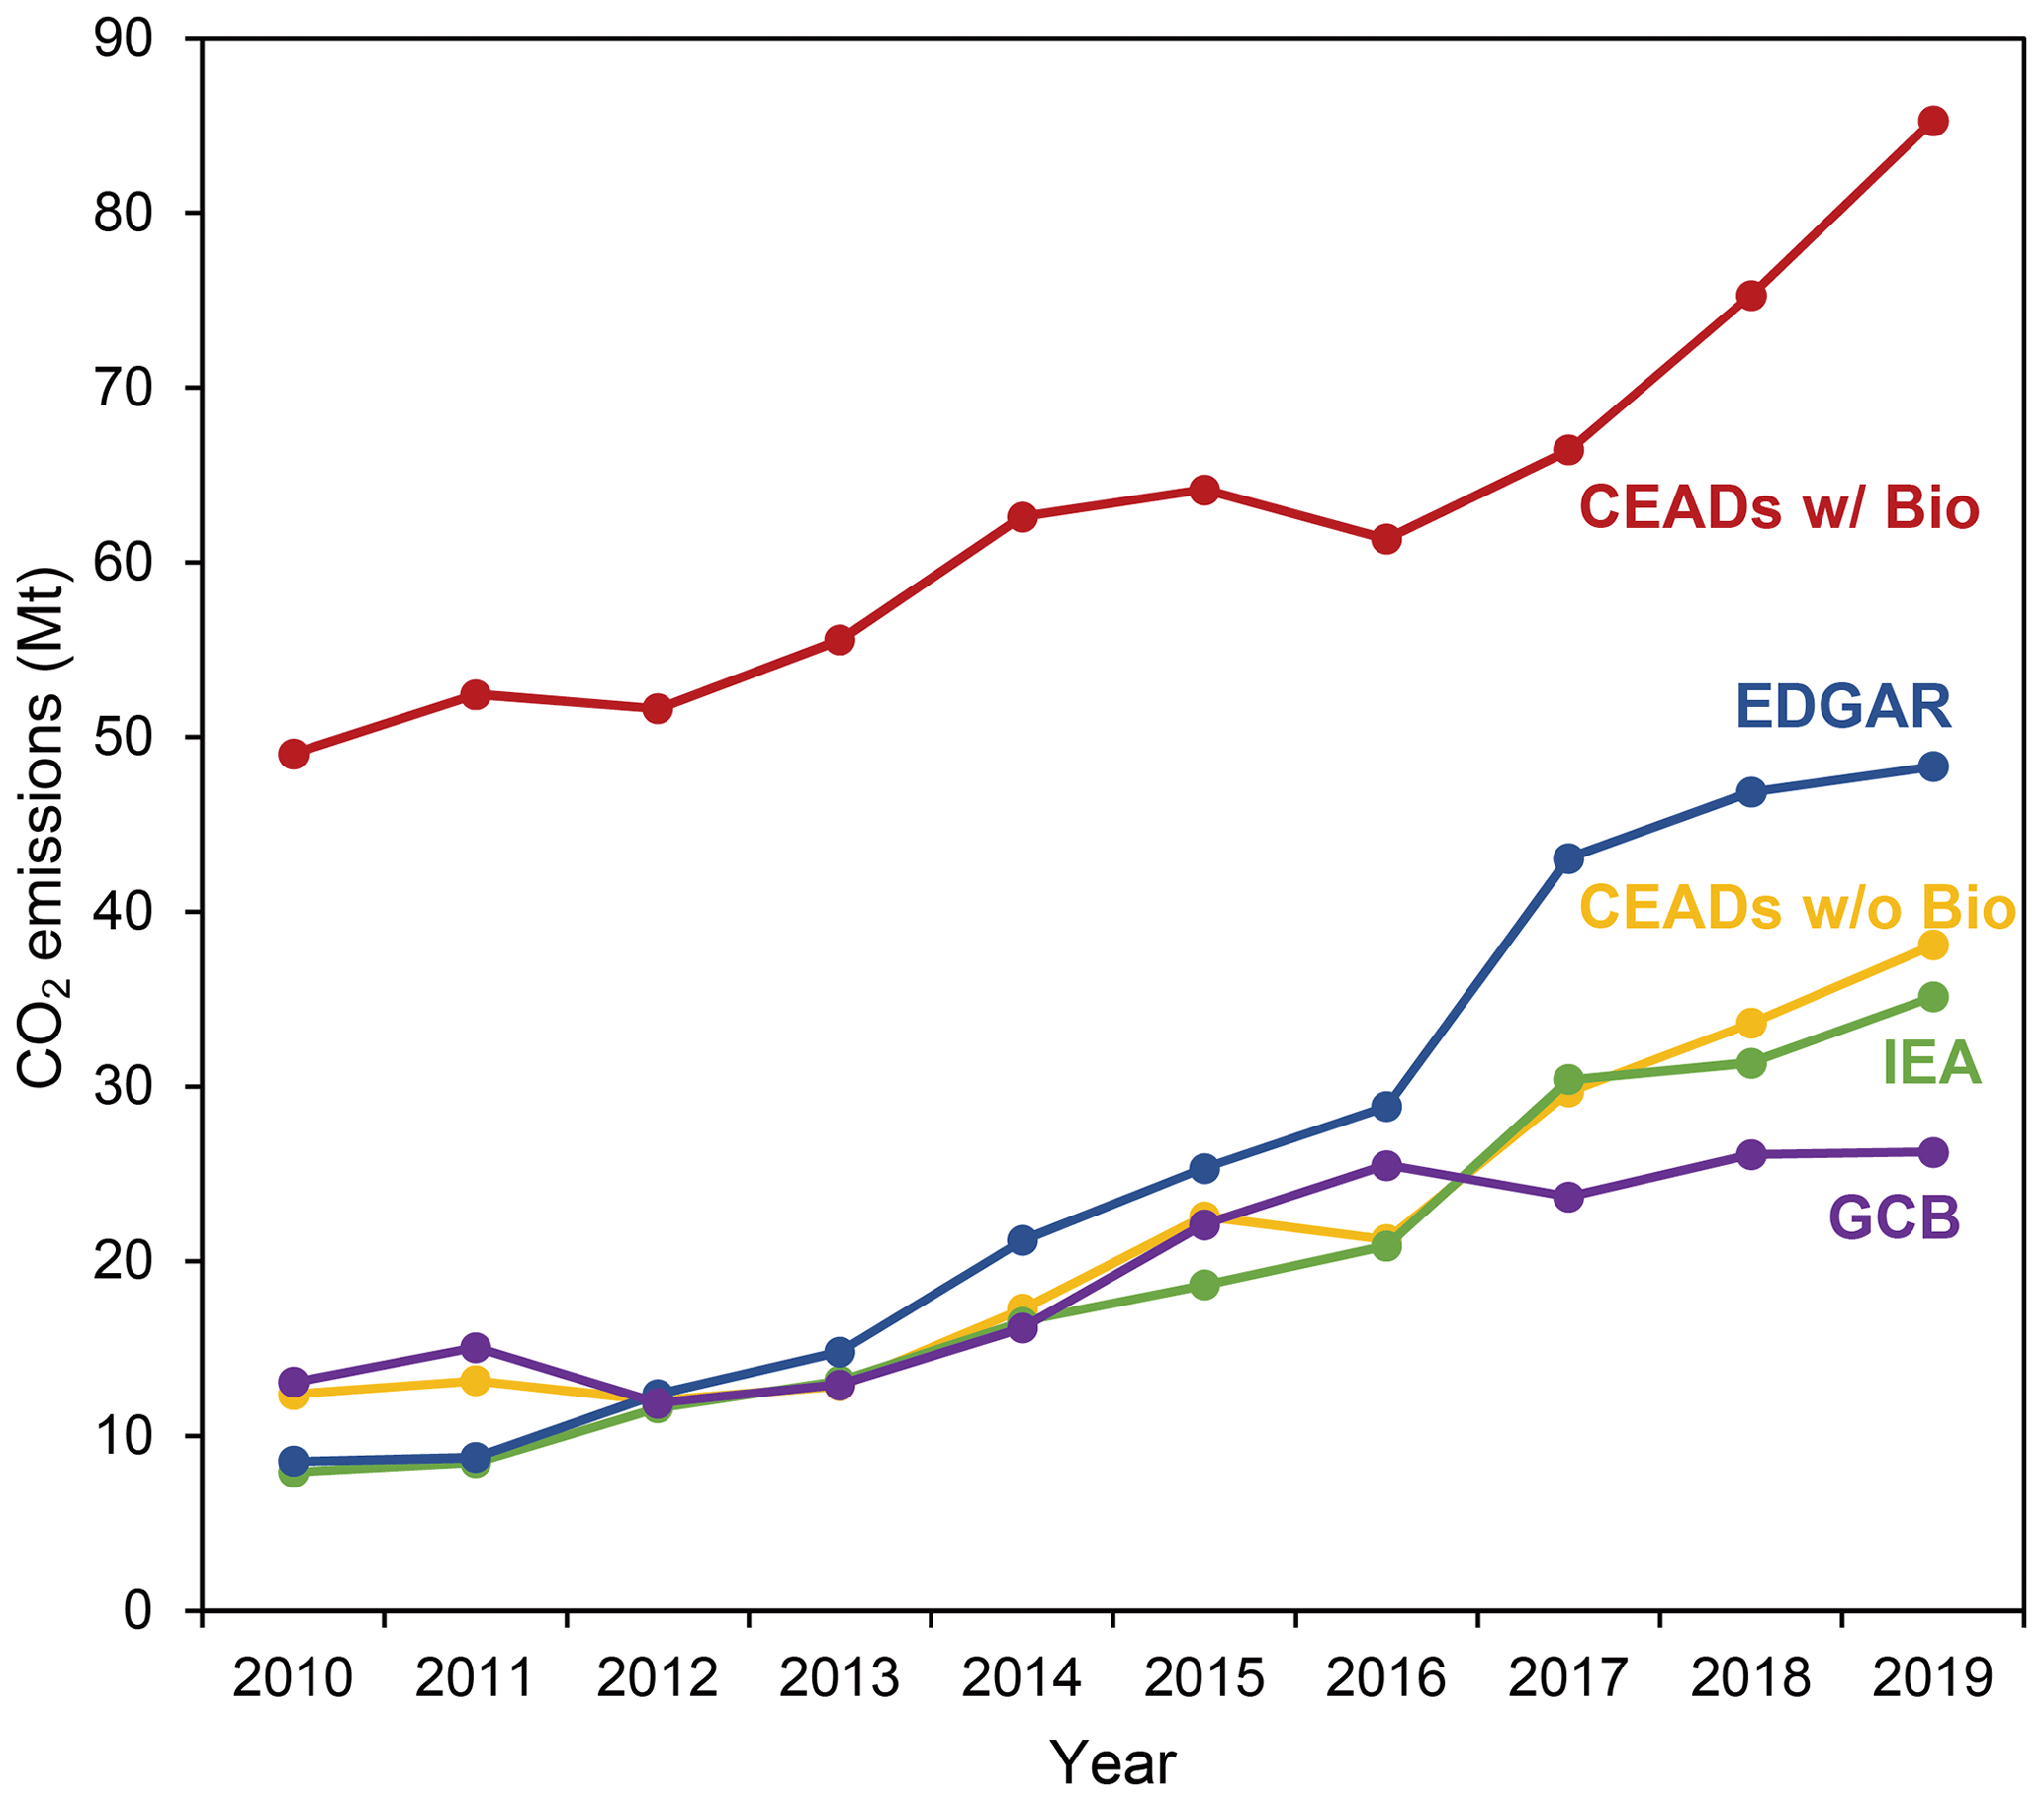
Figure 4CO2 emissions of Myanmar from different institutes for 2010–2019. Different colors represent the sourced datasets: red for CEADs with biomass emissions, blue for EDGAR, yellow for CEADs without biomass emissions, green for IEA. and purple for GCB.
3.4 Uncertainty and limitation
According to the emission accounting method mentioned above, the uncertainty of the CEADs dataset lies in the data on energy consumption and the emission factor. We estimated the uncertainty of emissions using a Monte Carlo simulation, finding that the emission factor contributes the most to total uncertainty (Fig. 5). The overall uncertainty of total CO2 emissions is 20.3 % (median of 2.8 %–76.2 % for 90 % CI), in which the emission-factor-related uncertainty is 14.8 % (median of 0 %–64.4 % for 90 % confidence Interval; CI) and the activity-data-related uncertainty is 4.3 % (median of 0.9 %–32.7 % for 90 % CI). From the perspective of energy types, biomass and oil products are the main sources of uncertainty (median uncertainties are 93.4 % and 17.4 %, respectively), while natural gas is the smallest source (median uncertainty of 4.0 %). Biomass emissions are the most uncertain source because its emission factors vary largely among species and derived locations, and the biomass-reliant sectors are thus usually difficult to count with high uncertainty, such as the residential sector. When excluding biomass, the uncertainty of emissions from fossil fuel combustion is 8.7 % (median of 2.3 %–51.1 % for 90 % CI): slightly higher than datasets covering developed countries with highly complete statistics. By-sector uncertainties are shown in Fig. S3 in the Supplement.
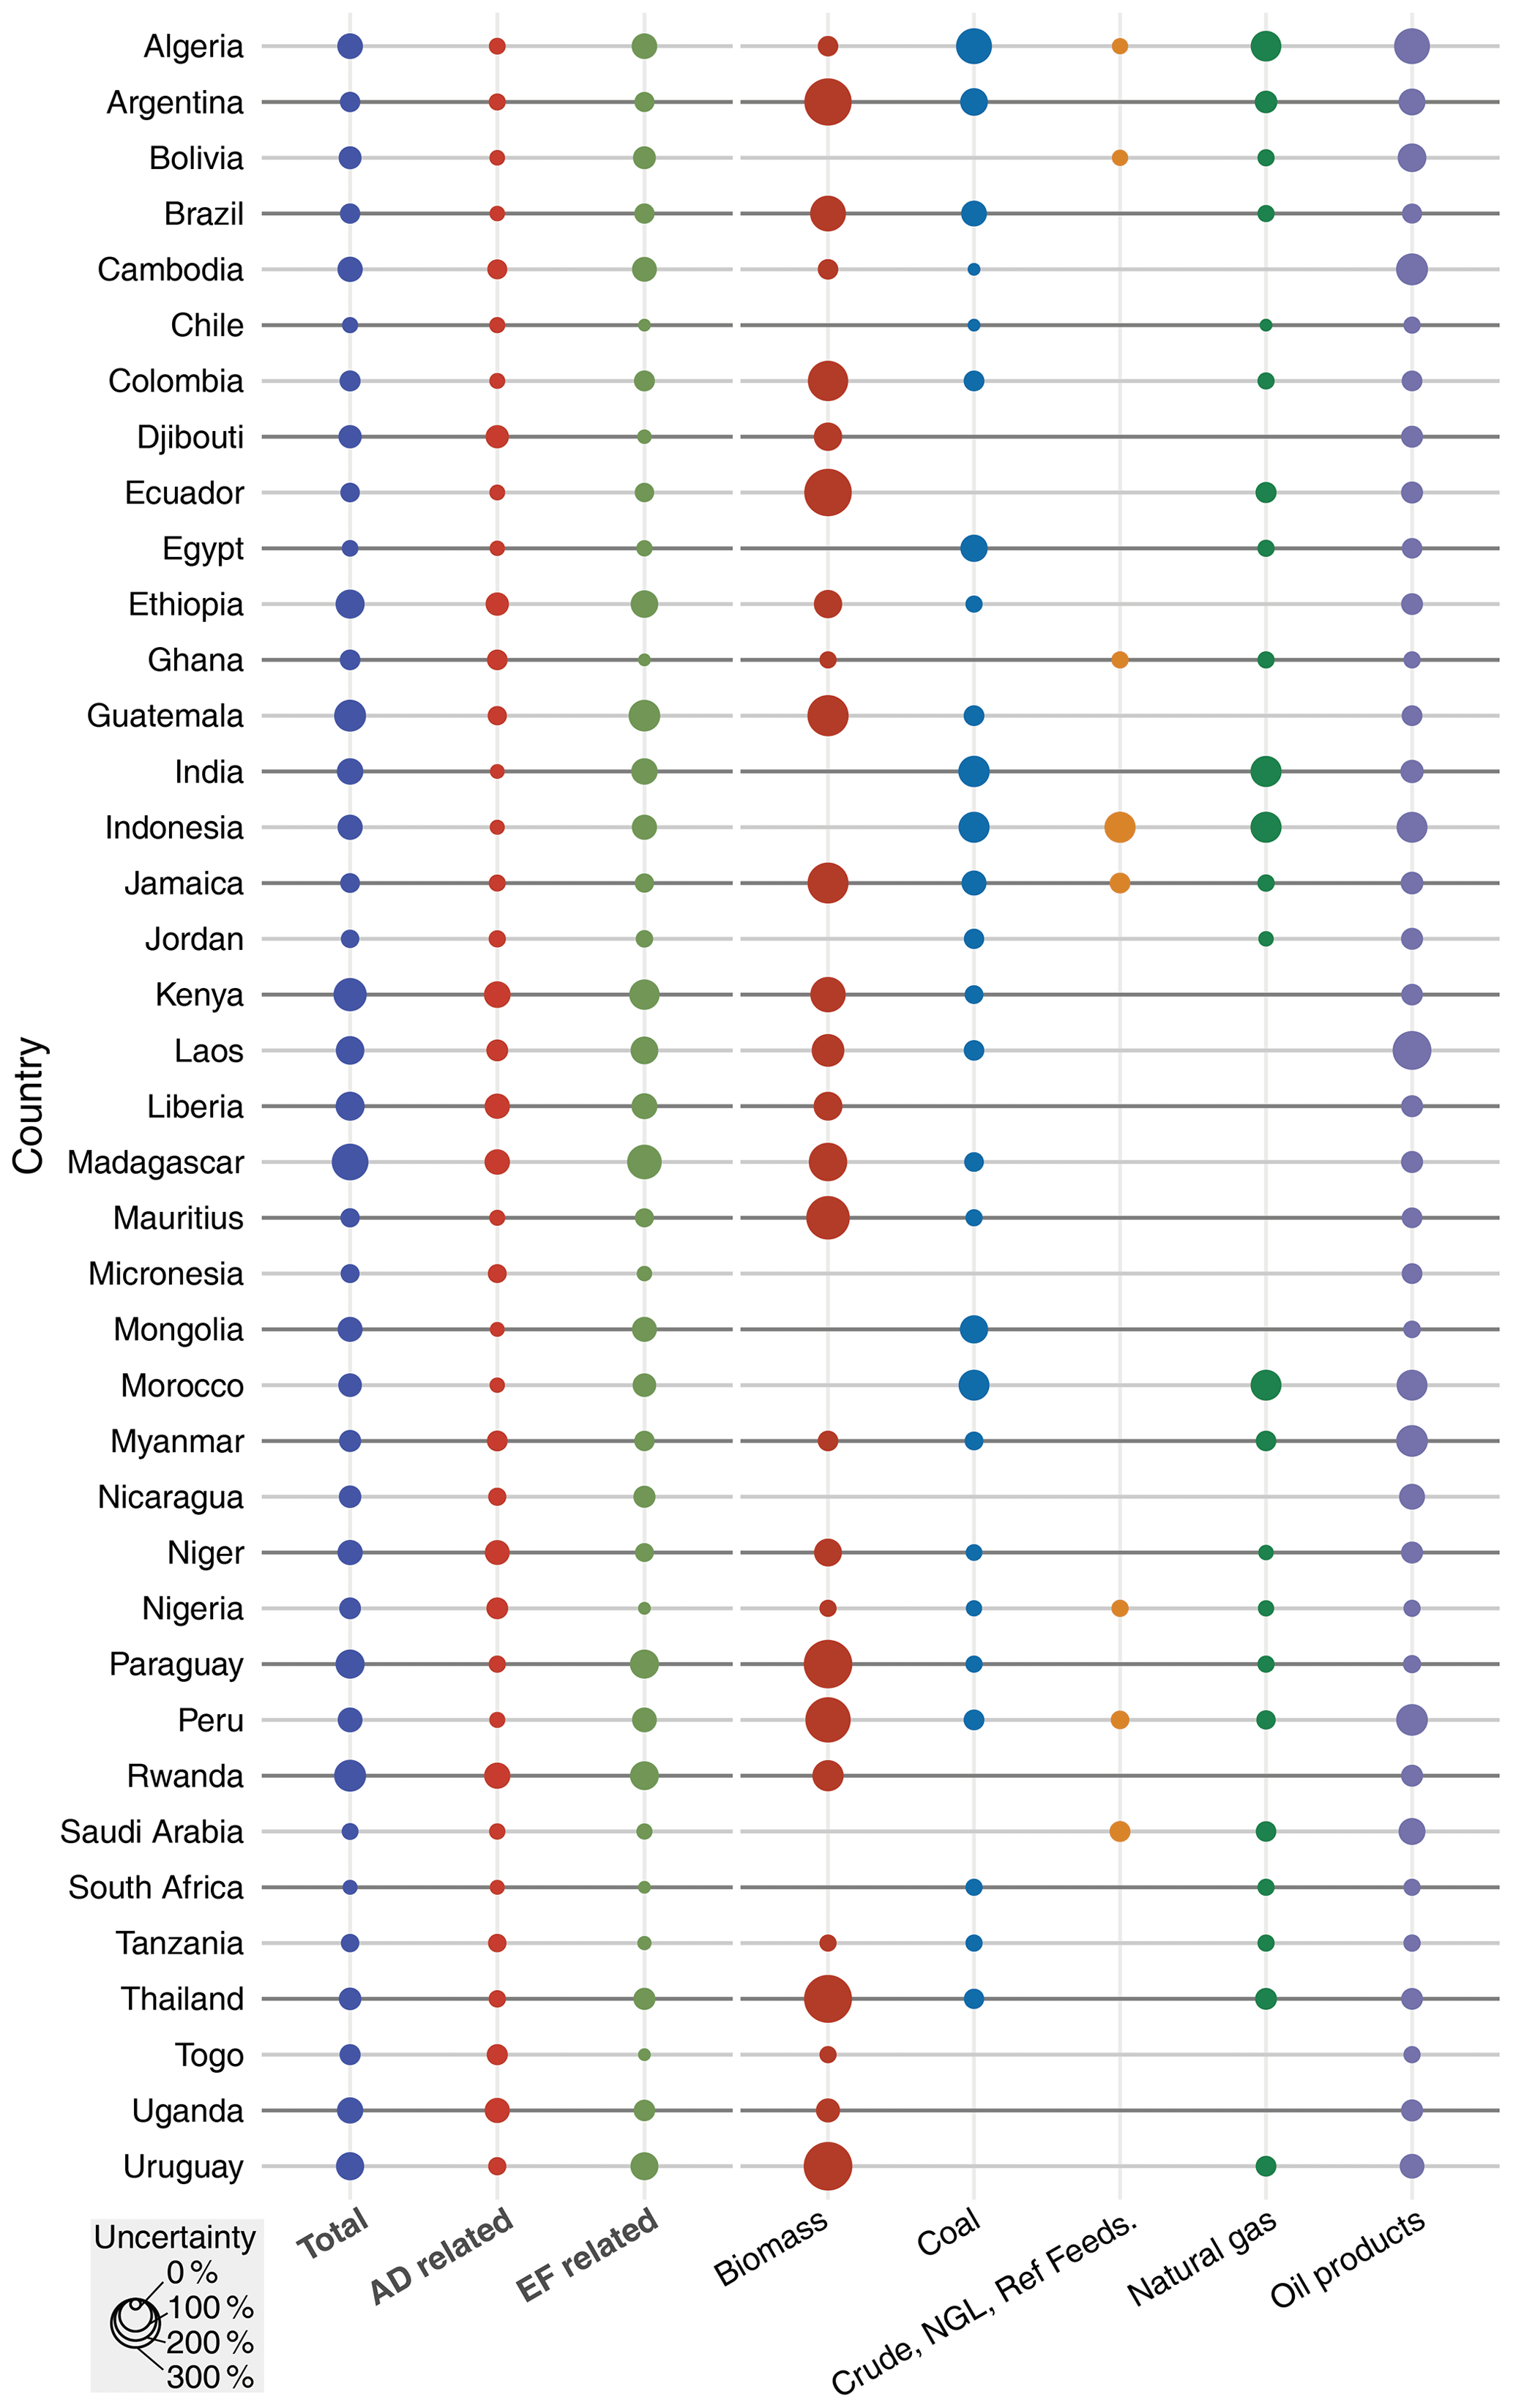
Figure 5Data uncertainty of total emissions from activity data, from emission factors, and by energy groups.
CEADs collects energy consumption data from the energy balances of national energy bureaus, statistical offices, and regional institutes. Although the energy data are derived from national official statistics, there is significant variation in basic data from the 40 emerging economies. Mongolia and Djibouti, for instance, do not provide energy data for detailed sectors; thus, their allocation of sectoral emissions will increase the uncertainty of results. A similar issue holds in downscaling national emissions to acquire regional data. Emission factors are collected from national publications and the IPCC's emission factor database (EFDB) and used based on energy types. Therefore, the sectoral difference in emission factors is not yet considered, which also led to uncertainty in emission accounting. It should be noted that this dataset only covers the energy-related CO2 emissions of 40 emerging economies and excludes emissions related to industrial processes and land use change other than biomass combustion.

Figure 6Disparities between the published data of three institutes (IEA, EDGAR, and GCB) and the CEADs inventory with (a) and without (b) biomass emissions. The boxplots show the minimum, the first quartile, the median, the third quartile, and the maximum of the differences across the nation–year emission data among the institutes. The percentages are the relative difference between the three institutes and CEADs. For instance, (a) shows that emission data from IEA, EDGAR, and GCB are generally lower than those in the CEADs inventory, while (b) shows that the data from these three institutes are close to the CEADs inventory when biomass emissions are excluded from it.
Note that the full raw data files for emission accounting were collected from countries' official statistics. The websites of the data sources are listed in Table S1 in the Supplement. Our dataset is available on Zenodo (Cui et al., 2021) at https://doi.org/10.5281/zenodo.7309360.
5.1 Comparison with existing resources
To verify the CEADs inventory, we compared it with published data from IEA (International Energy Agency, 2021), EDGAR (fast track) (Crippa et al., 2021), and GCB (Friedlingstein et al., 2020). Since this dataset, unlike those of other institutes, accounts for emissions from biomass combustion, we used both the whole-emission inventory and the inventory with biomass excluded for comparison (Fig. 6).
As we show, the total emission data from IEA, EDGAR, and GCB are lower than those in the CEADs inventory (Fig. 6a), while after excluding the emissions from biomass combustion however, CEADs data chime more closely with the emission data of these institutes (Fig. 6b). From this perspective, the CEADs inventory is relatively consistent with fossil-fuel-related emission data from IEA, EDGAR, and GCB (See Table S10 and Fig. S2 in the Supplement for a comparison of data from the institutes for the 40 emerging economies). Excluding the most uncertain biomass-related emissions, CEADs' fossil CO2 emission accounting for the 40 emerging economies shows a robust and rational performance, with the dataset differences (50 % CI, as shown in the boxes in Fig. 6b) from CEADs fossils lying in −7.7 %–11.4 %, 2.5 %–32.3 %, and −0.8 %–28.0 % for IEA, EDGAR, and GCB, respectively.
CEADs, IEA, EDGAR, and GCB all follow IPCC guidelines for accounting emissions, but as we have seen, using different sources for energy data and emission factor data can lead to disparities in accounting, as explained in the Myanmar case study. This dataset, by contrast, provides country-specific sources of the raw data used in emission accounting. Researchers can access the relevant websites and provide evidence for evaluating the reliability and robustness of the dataset.
5.2 Future applications
This dataset fills a gap by providing a more detailed and robust emission accounting baseline for 40 emerging economies. A complete, systematic dataset for emerging economies could benefit national and global targets for emission reduction.
To date, the low-carbon development research on emerging emitters is much less than that focusing on large emitters such as China and India. Thus, this dataset is a key tool for the academic community, providing the fundamental data and detailed information on emerging economies' emission patterns that is necessary for relevant studies and a better understanding of the relationship between CO2 emissions and socioeconomic development. The CO2 emission data can, for instance, be used in analyzing the driving forces of emission growth, in identifying major sectoral sources, and in pinpointing the pathway for low-carbon transitions in energy systems. It would be beneficial for researchers and policymakers to distinguish the emission reduction potential of detailed sources and explore the low-carbon pathway towards a net-zero target.
The subnational emission inventory for 28 of the 40 countries included in this dataset can be used in analysis of emerging economies and as a basis for tailor-made policies. Since 18 of the 40 emerging economies have also proposed reaching carbon neutrality in the next few decades, such subnational emission data could support their strategies for domestic emission reduction. For example, key sectors with dominant emissions for certain states or provinces can be identified, and policymaking could advocate differentiated emission reduction targets for different regions. These detailed emission data offer essential support for in-depth analyses of emerging economies' emission growth, providing sectoral characteristics of emission growth for low-carbon scenario simulations for research on climate targets such as net-zero ones. Those in turn will help to clarify the emission profiles of nations and subnational regions within them and guide policymaking around climate change mitigation in the developing world and across global society.
The supplement related to this article is available online at: https://doi.org/10.5194/essd-15-1317-2023-supplement.
CC and DG designed the research. CC, SL, WZ, and BL constructed the dataset. CC and SL analyzed the data. CC prepared the paper with contributions from DG, SL, WZ, BL, and YS.
The contact author has declared that none of the authors has any competing interests.
Publisher's note: Copernicus Publications remains neutral with regard to jurisdictional claims in published maps and institutional affiliations.
The authors thank the two anonymous reviewers.
This work was supported by the National Natural Science Foundation of China (7221101088, 7224100119, 41921005 and 72140001), the UK Natural Environment Research Council (NE/V002414/1), and the Royal Society (IEC\NSFC\191520).
This paper was edited by Guanyu Huang and reviewed by two anonymous referees.
Álamos, N., Huneeus, N., Opazo, M., Osses, M., Puja, S., Pantoja, N., Denier van der Gon, H., Schueftan, A., Reyes, R., and Calvo, R.: High-resolution inventory of atmospheric emissions from transport, industrial, energy, mining and residential activities in Chile, Earth Syst. Sci. Data, 14, 361–379, https://doi.org/10.5194/essd-14-361-2022, 2022.
Allen, M., Dube, O. P., Solecki, W., Aragón–Durand, F., Cramer, W., Humphrey, S., Kainuma, M., Kala, J., Mahowald, N., Mulugetta, Y., Perez, R., Wairiu, M., and Zickfeld, K.: Framing and Context, in: Global Warming of 1.5°C, An IPCC Special Report on the impacts of global warming of 1.5°C above pre-industrial levels and related global greenhouse gas emission pathways, in the context of strengthening the global response to the threat of climate change, sustainable development, and efforts to eradicate poverty, edited by: Masson-Delmotte, V., Zhai, P., Pörtner, H.-O., Roberts, D., Skea, J., Shukla, P. R., Pirani, A., Moufouma-Okia, W., Péan, C., Pidcock, R., Connors, S., Matthews, J. B. R., Chen, Y., Zhou, X., Gomis, M. I., Lonnoy, E., Maycock, T., Tignor, M., and Waterfield, T., Cambridge University Press, Cambridge, UK and New York, NY, USA, 49–92, https://doi.org/10.1017/9781009157940.003, 2018.
Aung, T. S., Saboori, B., and Rasoulinezhad, E.: Economic growth and environmental pollution in Myanmar: an analysis of environmental Kuznets curve, Environ. Sci. Pollut. Res., 24, 20487–20501, https://doi.org/10.1007/s11356-017-9567-3, 2017.
Crippa, M., Solazzo, E., Huang, G., Guizzardi, D., Koffi, E., Muntean, M., Schieberle, C., Friedrich, R., and Janssens-Maenhout, G.: High resolution temporal profiles in the Emissions Database for Global Atmospheric Research, Sci. Data, 7, 121, https://doi.org/10.1038/s41597-020-0462-2, 2020.
Crippa, M., Guizzardi, D., Muntean, M., Schaaf, E., Monforti-Ferrario, F., Banja, M., Oliver, J. G. J., Grassi, G., Rossi, S., and Vignati, E.: GHG emissions of all world countries – 2021 Report, Publications Office of the European Union, LU, https://doi.org/10.2760/173513, 2021.
Cui, C., Li, S., Zhao, W., Liu, B., Shan, Y., and Guan, D.: Energy-related CO2 Emission Accounts and Datasets for 40 Emerging Economies in 2010–2019, Zenodo [data set], https://doi.org/10.5281/zenodo.7309360, 2021.
Demailly, D. and Quirion, P.: CO2 abatement, competitiveness and leakage in the European cement industry under the EU ETS: grandfathering versus output-based allocation, Clim. Policy, 6, 93–113, https://doi.org/10.1080/14693062.2006.9685590, 2006.
Department of Population, Ministry of Labour, Immigration and Population: The 2014 Myanmar Population and Housing Census Policy Brief on Population Projections, The Republic of The Union of Myanmar Department of Population, https://myanmar.unfpa.org/en/publications/policy-brief-population-projections (last access: 15 March 2023), 2018.
Feng, K., Davis, S. J., Sun, L., and Hubacek, K.: Drivers of the US CO2 emissions 1997–2013, Nat. Commun., 6, 7714, https://doi.org/10.1038/ncomms8714, 2015.
Friedlingstein, P., O'Sullivan, M., Jones, M. W., Andrew, R. M., Hauck, J., Olsen, A., Peters, G. P., Peters, W., Pongratz, J., Sitch, S., Le Quéré, C., Canadell, J. G., Ciais, P., Jackson, R. B., Alin, S., Aragão, L. E. O. C., Arneth, A., Arora, V., Bates, N. R., Becker, M., Benoit-Cattin, A., Bittig, H. C., Bopp, L., Bultan, S., Chandra, N., Chevallier, F., Chini, L. P., Evans, W., Florentie, L., Forster, P. M., Gasser, T., Gehlen, M., Gilfillan, D., Gkritzalis, T., Gregor, L., Gruber, N., Harris, I., Hartung, K., Haverd, V., Houghton, R. A., Ilyina, T., Jain, A. K., Joetzjer, E., Kadono, K., Kato, E., Kitidis, V., Korsbakken, J. I., Landschützer, P., Lefèvre, N., Lenton, A., Lienert, S., Liu, Z., Lombardozzi, D., Marland, G., Metzl, N., Munro, D. R., Nabel, J. E. M. S., Nakaoka, S.-I., Niwa, Y., O'Brien, K., Ono, T., Palmer, P. I., Pierrot, D., Poulter, B., Resplandy, L., Robertson, E., Rödenbeck, C., Schwinger, J., Séférian, R., Skjelvan, I., Smith, A. J. P., Sutton, A. J., Tanhua, T., Tans, P. P., Tian, H., Tilbrook, B., van der Werf, G., Vuichard, N., Walker, A. P., Wanninkhof, R., Watson, A. J., Willis, D., Wiltshire, A. J., Yuan, W., Yue, X., and Zaehle, S.: Global Carbon Budget 2020, Earth Syst. Sci. Data, 12, 3269–3340, https://doi.org/10.5194/essd-12-3269-2020, 2020.
Intergovernmental Panel on Climate Change (IPCC): IPCC Guidelines for national greenhouse gas inventories, Institute for Global Environmental Strategies (IGES), Hayama, Japan, ISBN 4-88788-032-4, 2006.
Intergovernmental Panel on Climate Change (IPCC): 2019 Refinement to the 2006 IPCC Guidelines for National Greenhouse Gas Inventories, edited by: Calvo Buendia, E., Tanabe, K., Kranjc, A., Baasansuren, J., Fukuda, M., Ngarize, S., Osako, A., Pyrozhenko, Y., Shermanau, P., and Federici, S., IPCC, Switzerland, ISBN 978-4-88788-232-4, 2019.
International Energy Agency: CO2 emission from fuel combustion, Greenhouse Gas Emissions from Energy Data, International Energy Agency [data set], https://www.iea.org/data-and-statistics/data-tools/greenhouse-gas-emissions-from-energy-data-explorer (last access: 19 October 2022), 2021.
Lin, B. and Xie, C.: Reduction potential of CO2 emissions in China's transport industry, Renew. Sust. Energ. Rev., 33, 689–700, https://doi.org/10.1016/j.rser.2014.02.017, 2014.
Myanmar Ministry of Electricity and Energy and ERIA: Energy Demand and Supply of the Republic of the Union of Myanmar 2010–2017, Economic Research Institute for ASEAN and East Asia – ERIA, https://www.eria.org/uploads/media/Research-Project-Report/Energy-Demand-and-Supply-of-the-Republic-of-the-Union-of-Myanmar-2010-2017.pdf (last access: 22 June 2022), 2019.
Net Zero Tracker: https://www.eciu.net/netzerotracker, last access: 30 August 2021.
Oo, A. T., Huylenbroeck, G. V., and Speelman, S.: Assessment of climate change vulnerability of farm households in Pyapon District, a delta region in Myanmar, Int. J. Disast. Risk Re., 28, 10–21, https://doi.org/10.1016/j.ijdrr.2018.02.012, 2018.
Puliafito, S. E., Bolaño-Ortiz, T. R., Fernandez, R. P., Berná, L. L., Pascual-Flores, R. M., Urquiza, J., López-Noreña, A. I., and Tames, M. F.: High-resolution seasonal and decadal inventory of anthropogenic gas-phase and particle emissions for Argentina, Earth Syst. Sci. Data, 13, 5027–5069, https://doi.org/10.5194/essd-13-5027-2021, 2021.
Riti, J. S., Song, D., Shu, Y., and Kamah, M.: Decoupling CO2 emission and economic growth in China: Is there consistency in estimation results in analyzing environmental Kuznets curve?, J. Clean. Prod., 166, 1448–1461, https://doi.org/10.1016/j.jclepro.2017.08.117, 2017.
Shan, Y., Guan, D., Zheng, H., Ou, J., Li, Y., Meng, J., and Mi, Z.: Data Descriptor: China CO2 emission accounts 1997–2015, Sci. Data, 5, 1–14, https://doi.org/10.1038/sdata.2017.201, 2017a.
Shan, Y., Guan, D., Liu, J., Mi, Z., Liu, Z., Liu, J., Schroeder, H., Cai, B., Chen, Y., Shao, S., and Zhang, Q.: Methodology and applications of city level CO2 emission accounts in China, J. Clean. Prod., 161, 1215–1225, https://doi.org/10.1016/j.jclepro.2017.06.075, 2017b.
Shi, Y., Matsunaga, T., Saito, M., Yamaguchi, Y., and Chen, X.: Comparison of global inventories of CO2 emissions from biomass burning during 2002–2011 derived from multiple satellite products, Environ. Pollut., 206, 479–487, https://doi.org/10.1016/j.envpol.2015.08.009, 2015.
Somanathan, E., Sterner, T., Sugiyama, T., Chimanikire, D., Dubash, N. K., Essandoh-Yeddu, J. K., Fifita, S., Goulder, L., Jaffe, A., Managi, S., Mitchell, C., Montero, J. P., Teng, F., and Zylicz, T.: National and Sub-national Policies and Institutions, in: Climate Change 2014: Mitigation of Climate Change. Contribution of Working Group III to the Fifth Assessment Report of the Intergovernmental Panel on Climate Change, edited by: Edenhofer, O., Pichs-Madruga, R., Sokona, Y., Farahani, E., Kadner, S., Seyboth, K., Adler, A., Baum, I., Brunner, S., Eickemeier, P., Kriemann, B., Savolainen, J., Schlömer, S., von Stechow, C., Zwickel, T., and Minx, J. C., Cambridge University Press, Cambridge, United Kingdom and New York, NY, USA, ISBN 978-1-107-05821-7, 2014.
Statistics Division of the United Nations Secretariat: Historical and updated classification of developed and developing regions, Statistics Division United Nations, New York NY, USA, https://unstats.un.org/unsd/methodology/m49/historical-classification-of-developed-and-developing-regions.xlsx (last access: 15 March 2023), 2022.
Takeyama, Y.: Recent Development of the Myanmar Economy, Emerging Economy Research Department, Institute for International Monetary Affairs (IIMA), https://www.iima.or.jp/en/docs/newsletter/2018/NL2018No_6_e.pdf (last access: 22 June 2022), 2018.
Tan, X., Li, H., Guo, J., Gu, B., and Zeng, Y.: Energy-saving and emission-reduction technology selection and CO2 emission reduction potential of China's iron and steel industry under energy substitution policy, J. Clean. Prod., 222, 823–834, https://doi.org/10.1016/j.jclepro.2019.03.133, 2019.
The Republic of the Union of Myanmar: Myanmar's Intended Nationally Determined Contribution-INDC, INDCs as communicated by Parties, https://www4.unfccc.int/sites/submissions/INDC/Published Documents/Myanmar/1/Myanmar's INDC.pdf (last access: 22 June 2022), 2015.
The Republic of the Union of Myanmar: Myanmar Climate Change Strategy (2018–2030), United Nations Human Settlements Programme, https://myanmar.un.org/en/25466-myanmar-climate-change-master-plan-2018- %E2%80%93 -2030 (last access: 22 June 2022), 2019.
Tun, M. M. and Juchelková, D.: Biomass Sources and Energy Potential for Energy Sector in Myanmar: An Outlook, Resources, 8, 102, https://doi.org/10.3390/resources8020102, 2019.
UNFCCC: INDCs as communicated by Parties, INDCs as communicated by Parties, https://www4.unfccc.int/sites/submissions/indc/Submission Pages/submissions.aspx (last access: 22 June 2022), 2021.
United Nations: World Economic Situation and Prospects 2020, World Economic Situation and Prospects, 163–171, United Nations publication, New York NY, USA, ISBN 978-92-1-109181-6, 2020.
Vo, A. T., Vo, D. H., and Le, Q. T.-T.: CO2 Emissions, Energy Consumption, and Economic Growth: New Evidence in the ASEAN Countries, Journal of Risk and Financial Management, 12, 145, https://doi.org/10.3390/jrfm12030145, 2019.
World Bank: World Development Indicators, DataBank | World Development Indicators, World Bank [data set], Washington, DC, https://databank.worldbank.org/source/world-development-indicators (last access: 22 June 2022), 2019.
World Bank: World Bank Open Data, World Bank [data set], Washington, DC, https://data.worldbank.org/ (last access: 22 June 2022), 2020.
The requested paper has a corresponding corrigendum published. Please read the corrigendum first before downloading the article.
- Article
(2721 KB) - Full-text XML
- Corrigendum
-
Supplement
(1212 KB) - BibTeX
- EndNote