the Creative Commons Attribution 4.0 License.
the Creative Commons Attribution 4.0 License.
 | 22 Mar 2023
Classification and mapping of European fuels using a hierarchical, multipurpose fuel classification system
Mariano García
Michele Salis
Luís M. Ribeiro
Emilio Chuvieco
Accurate and spatially explicit information on forest fuels becomes essential to designing an integrated fire risk management strategy, as fuel characteristics are critical for fire danger estimation, fire propagation, and emissions modelling, among other aspects. This paper proposes a new European fuel classification system that can be used for different spatial scales and purposes (propagation, behaviour, and emissions). The proposed classification system is hierarchical and encompasses a total of 85 fuel types, grouped into six main fuel categories (forest, shrubland, grassland, cropland, wet and peat/semi-peat land, and urban), plus a nonfuel category. For the forest cover, fuel types include two vertical strata, overstorey and understorey, to account for both surface and canopy fuels. In addition, this paper presents the methods to map fuel types at the European scale, including the first-level of the classification system. Land cover, biogeographic datasets, and bioclimatic modelling were used. The final map, which is publicly available (https://doi.org/10.21950/YABYCN; Aragoneses et al., 2022a), included 20 fuel categories at 1 km spatial resolution. A first assessment of this map was performed using field information obtained from LUCAS (Land Use and Coverage Area frame Survey), complemented with high-resolution data. This validation exercise provided an overall accuracy of 88 % for the main fuel types and 81 % for all mapped fuel types. To facilitate the use of this fuel dataset in fire behaviour modelling, an assignment of fuel parameters to each fuel type was performed by developing a crosswalk to the standard fuel models defined by Scott and Burgan (2005; FBFMs – Fire Behavior Fuel Models), considering European climate diversity. This work has been developed within the framework of the FirEUrisk project, which aims to create a European-integrated strategy for fire danger assessment, reduction, and adaptation.
- Article
(11207 KB) - Full-text XML
- Comment
- BibTeX
- EndNote


Fire is a key disturbance factor for the dynamics (Thonicke et al., 2001; Pausas and Keeley, 2009) and distribution (Bond et al., 2005) of the vegetation ecosystems globally. Wildland fires affect forests' function (Bowman et al., 2009), structure (Koutsias and Karteris, 2003), and adaptation (Pausas and Keeley, 2009), while significantly contributing to emissions of greenhouse gases (van Der Werf et al., 2017; Zheng et al., 2021), soil erosion (Shakesby, 2011), water and air pollution (Smith et al., 2011; Duc et al., 2018), and land cover change (van Wees et al., 2021). Wildland fires also threaten human lives and properties and can cause important socioeconomic impacts (Bowman et al., 2017, 2020).
Estimations based on coarse-resolution satellite observations indicate that around 4 Mkm2 (million kilometres squared) are burnt globally every year (Giglio et al., 2018; Lizundia-Loiola et al., 2020), although this evaluation is very conservative, as they are based on coarse-resolution satellite data, which have shown to include significant omission errors (Boschetti et al., 2019; Franquesa et al., 2022). The European territory is highly affected by wildland fires, which cause environmental, societal, and economical losses (San-Miguel-Ayanz et al., 2020, 2021). In 2021, about 500 000 ha were burnt in the European Union, of which 20 % affected Natura 2000 and other protected sites, especially in southern Europe. August was the worst month, including very large fires. Around 28 % of the total burnt area affected forest, and 25 % belonged to agricultural land types (San-Miguel-Ayanz et al., 2022). In addition, global climate change will likely increase the wildland fire risk and impacts in most of the European territory (Jones et al., 2022; IPCC, 2022). This justifies the necessity of improving the current efforts to prevent and contain wildland fires in Europe (San-Miguel-Ayanz et al., 2021).
As it is well known, the fire environment concept defines the three key elements influencing fire initiation, propagation, and effects. These are weather, topography, and fuel (Countryman, 1972). Fire behaviour is highly dependent on fuel (vegetation) characteristics, which is the only variable that can be managed to reduce fire propagation. In addition, fuel properties play a critical role in fire ignition (Alvarado et al., 2020) and in the atmospheric emissions derived from fires, particularly in the smouldering–flaming ratio of fire behaviour (Zheng et al., 2021).
Vegetation types with similar fire behaviour are grouped into fuel types and models (Pyne, 1984). The former indicate categories of vegetation with similar characteristics from a fire behaviour perspective. The latter refer to the specific parameters required to model their fire behaviour (height, load, bulk density, and particle size, among others). Fuel types refer to the surface or canopy layers. Forest understorey and low vegetation formations are surface fuels, while forest crowns and tall shrubs represent canopy fuels. Fire usually starts in surface fuels but may transfer to canopy fuels, causing crown fires, which are more dangerous than surface fires as they release more energy and propagate in larger fronts, making them harder to control (Scott and Reinhardt, 2001).
Fuel type mapping is essential in fire risk prevention, planning, and real-time fire management across multiple spatial scales (Keane et al., 2001) because it allows us to spatially describe a key factor in fire management (Keane and Reeves, 2012), while fire scientists require accurate and updated fuel maps to support fire strategic planning within a comprehensive fire danger assessment system. However, fuel mapping is challenging due to the high temporal and spatial variability in fuels (Keane et al., 2001).
The starting point of fuel mapping is the definition of a consistent fuel classification system, which includes fuel types and models (parameters). Many fuel classification systems have been developed, although the most common refer just to surface fuels (Arroyo et al., 2008), thus limiting their capability to prevent and manage crown fires (the most severe).
This is the case of the Northern Forest Fire Laboratory (NFFL) system (Anderson, 1982) and the Fire Behavior Fuel Models (FBFMs; Scott and Burgan, 2005), which have been created for the United States. Other commonly used fuel classification systems are the Fuel Characteristic Classification System (FCCS; Ottmar et al., 2007), the Canadian Fire Behaviour Prediction System (Forestry Canada Fire Danger Group, 1992), and the Mediterranean–European Prometheus system (European Commission, 1999; Arroyo et al., 2008). Although they have been developed for specific regions and conditions, they have been widely used to map fuel types in other regions (García et al., 2011; Palaiologou et al., 2013; Marino et al., 2016; Aragoneses and Chuvieco, 2021).
Fuel types have been usually mapped through fieldwork, aerial photointerpretation, ecological modelling, and existing datasets and/or remote sensing (Arroyo et al., 2008). Remote sensing methods previously applied to fuel type mapping include a wide range of techniques and input data, from medium (Palaiologou et al., 2013; Alonso-Benito et al., 2013; Marino et al., 2016; Aragoneses and Chuvieco, 2021) to high spatial resolutions (Arroyo et al., 2006; Mallinis et al., 2008). Both passive (Alonso-Benito et al., 2013; Aragoneses and Chuvieco, 2021) and active sensors (Riaño et al., 2003; González-Olabarria et al., 2012) have been used, in addition to a combination of sensors (Mutlu et al., 2008; García et al., 2011; Palaiologou et al., 2013; Marino et al., 2016).
Fuel maps exist for continental scales, such as South America (Pettinari et al., 2014) and Africa (Pettinari and Chuvieco, 2015), and global scales but include categories that are too coarse to be operationally applicable to European conditions (Pettinari and Chuvieco, 2016). However, in Europe, fuel mapping has been mostly developed for local and regional scales (Roulet, 2000; García et al., 2011; Stefanidou et al., 2020). The only European-level fuel cartography is the 2000 EFFIS (2017) fuel map (European Forest Fire Information System), which is based on land cover and vegetation maps and using the NFFL system. Other works have mapped FBFM fuel models (Scott and Burgan, 2005) for the European subcontinental scale, such as the Iberian Peninsula (Aragoneses and Chuvieco, 2021).
The lack of an adapted-to-Europe fuel classification strategy is limiting, since fuel models are site specific and should be applied to the region for which they were developed to obtain the most realistic fuel mapping and modelling (Arroyo et al., 2008). In this context, the ArcFUEL project (Bonazountas et al., 2014) proposed a methodology to enable consistent fuel mapping production over Europe, based on a hierarchical vegetation fuel classification system adapted to European conditions (Toukiloglou et al., 2013). Nevertheless, a European fuel map was not generated; only southern European countries at national (Portugal and Greece) and regional (Spain and Italy) scales were mapped (Bonazountas et al., 2014).
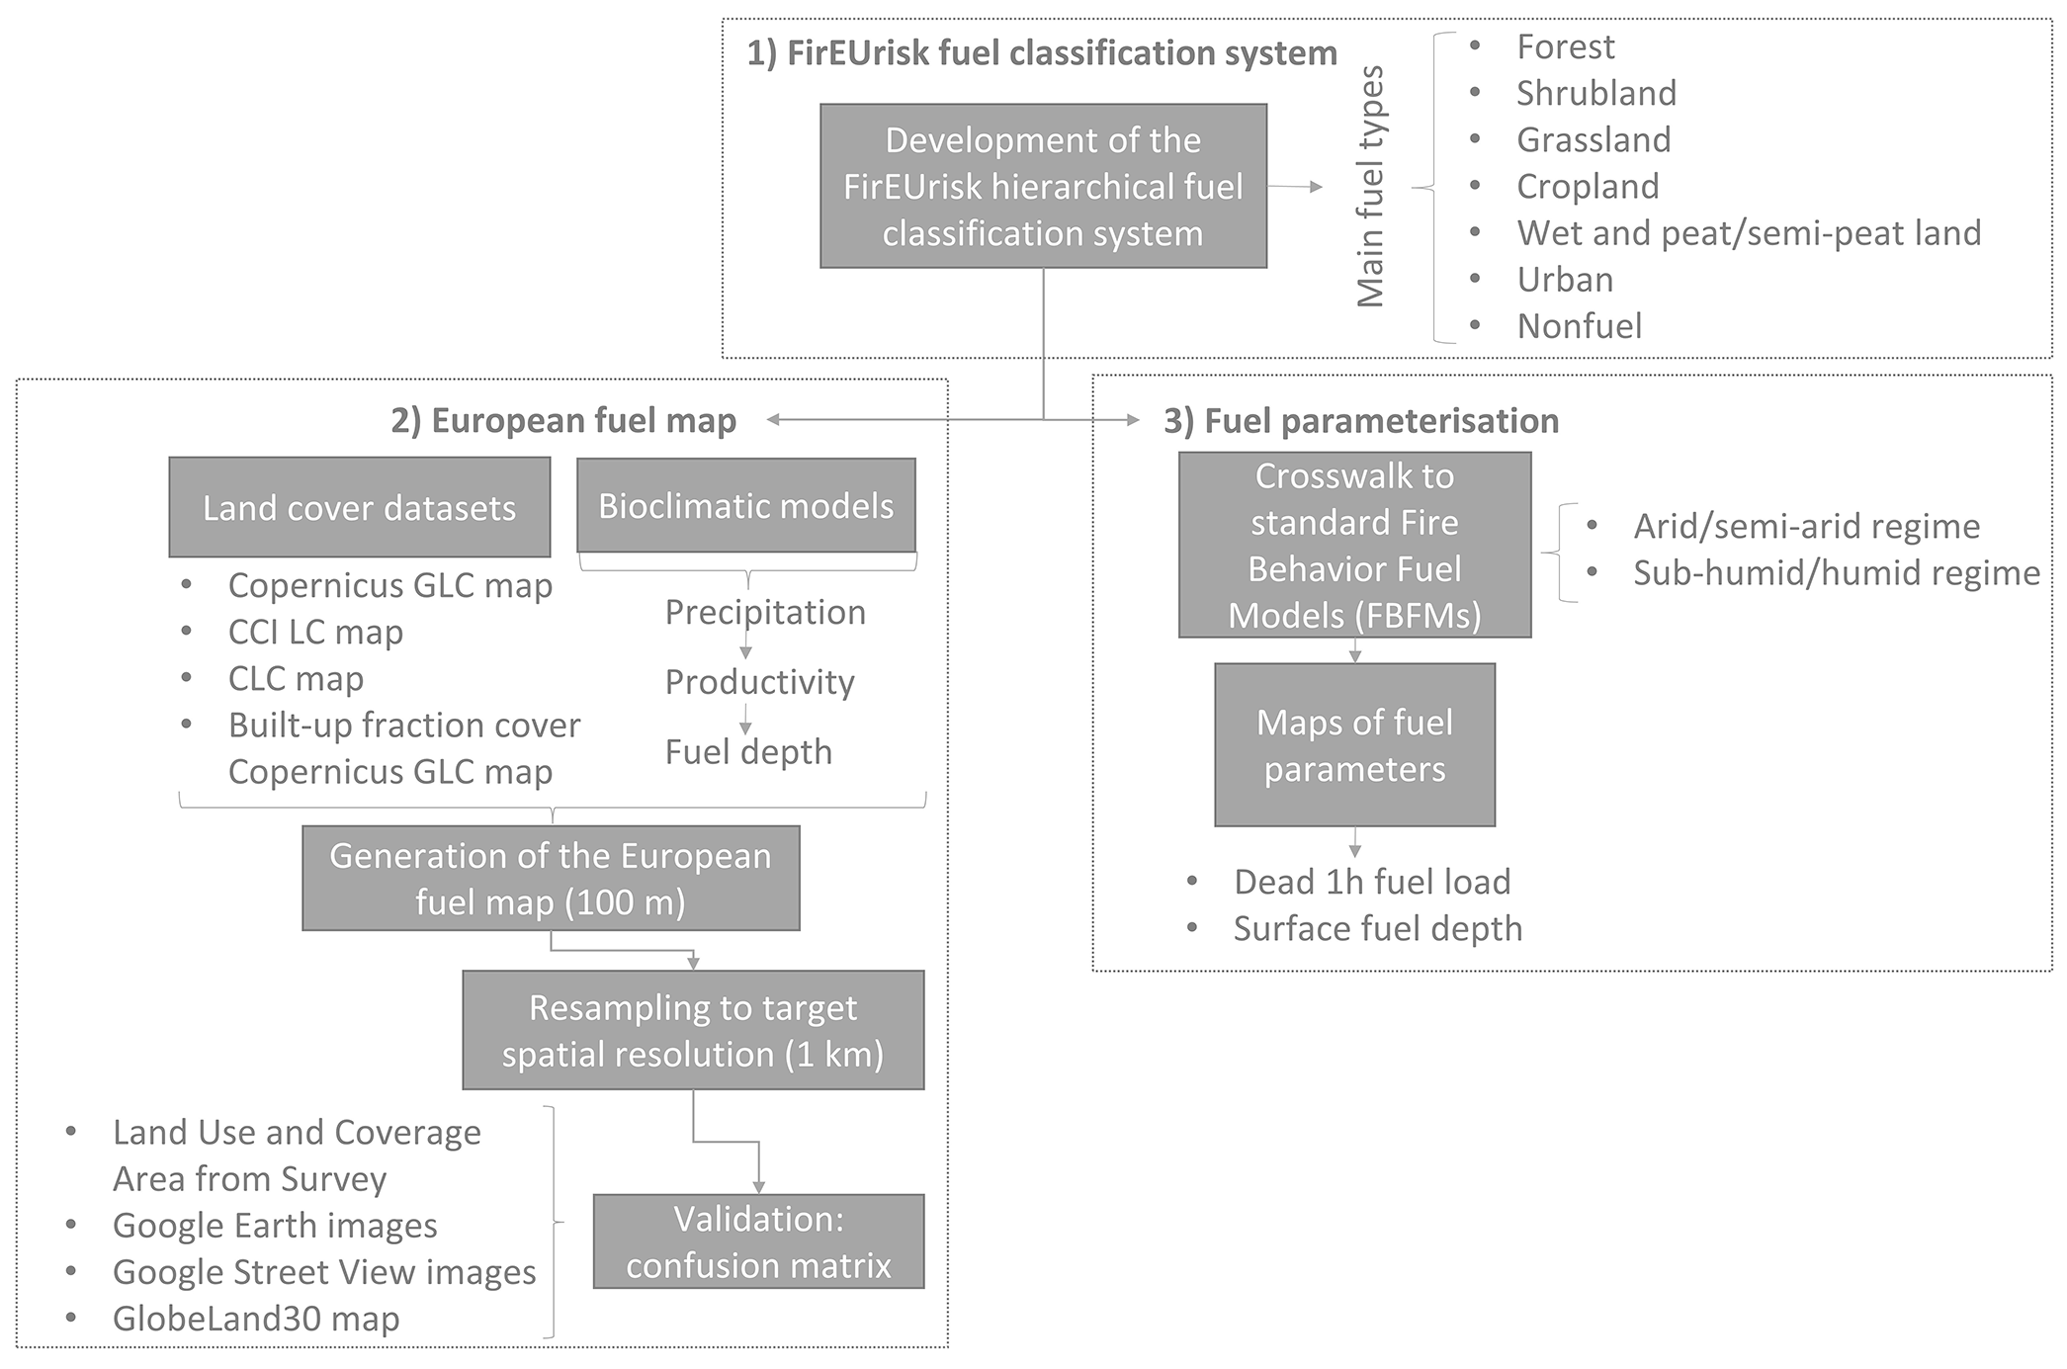
Considering the current limitations of European fuel mapping, this paper had three objectives. The first one was generating a fuel classification system to facilitate the integration of continental wildfire risk assessment, including both surface and canopy fuel types. The proposed classification system should be hierarchical to facilitate the integration of fuel maps at different spatial scales, include both surface and canopy fuel types, and be suitable for different purposes, from fire behaviour simulation to fire emissions or fire danger assessment. The second objective was to develop a European fuel map at 1 km spatial resolution, following the proposed fuel classification system. We aimed to develop a methodology that, by combining expert knowledge, a geographic information system (GIS), available datasets, and bioclimatic modelling, might be easily replicable and updated with low time and economic costs. Finally, the third objective was to assign surface fuel parameters to the derived fuel types, by relating them to existing fuel models. We chose the FBFM standard fuel models (Scott and Burgan, 2005), as this system is widely used and very flexible. These three objectives serve to organise the structure of this paper around three sections (Fig. 1). This work is expected to lay the framework for an integrated and homogeneous fire management strategy across European countries. The present study is part of the FirEUrisk project, which aims to create a European integrated strategy for fire danger assessment, reduction, and adaptation.
We developed the FirEUrisk hierarchical fuel classification system with the following three main requirements: it should be adapted to the great variety of European environmental conditions, include both surface and canopy fuel types, and be suitable to work at different spatial scales. The main driver of the classification system was fire behaviour modelling, but its use for fire risk assessment and fire emission estimations was also considered. To define each of the fuel types, the land cover and vegetation descriptions of the Copernicus Global Land Cover map categories (Tsendbazar et al., 2020), the UN LCCS (United Nations Land Cover Classification System) from the UNESCO (United Nations Educational, Scientific and Cultural Organization; UNESCO, 1973), the FAO (Food and Agriculture Organization, 2000), and the European Environmental Agency's CORINE Land Cover nomenclature (CLC; Kosztra et al., 2019) were used. For the wet and peat/semi-peat land fuel types, the definitions provided by the International Peatland Society (2021) were also taken into account.
The proposed hierarchical fuel classification system, FirEUrisk (Table A1 in Appendix A), encompassed a total of 85 fuel types for surface and canopy fuels, which were aggregated into six main fuel type categories, referred to the main fuel cover, which recall traditional land cover types, plus a nonfuel category. The FirEUrisk fuel classification system used several criteria to discriminate between fuel types. Subcategories were included to better estimate fuel models for each resulting fuel type category and would also lead to different fire behaviour. The first-level main categories were defined as follows:
-
Forest, which includes areas with tree canopy cover above 15 %, with a mean tree height ≥2 m, following the Copernicus Global Land Cover legend (Tsendbazar et al., 2020), which is based on the UN LCCS (United Nations Land Cover Classification System) from the UNESCO (United Nations Educational, Scientific and Cultural Organization; UNESCO, 1973) and the FAO (Food and Agriculture Organization, 2000). Understorey type refers to the fuel type with which the surface fire will spread in the forest.
-
Shrubland, which includes shrubs and scrub. It may have small trees ≤2 m and tree canopy cover <15 %.
-
Grassland, which includes herbaceous non-cultivated vegetation. It may have small trees ≤2 m and/or tree canopy cover <15 %.
-
Cropland, which includes cultivated vegetation (irrigated or not). Cropland types were discriminated (herbaceous or woody).
-
Wet and peat/semi-peat land, which includes (1) wetland, with a permanent mixture of vegetation and water (salt, brackish, or fresh), and marshes, (2) moorland or heathland, with low and closed vegetation cover dominated by bushes, shrubs, dwarf shrubs, and herbaceous plants, in a climax stage of development, and wet heath on humid or semi-peaty soils (peat depth <30 cm), herbaceous vegetation, shrubs, and trees of dwarf growth <3 m, (3) peat land and peat bog, with terrestrial wetlands in which flooded conditions prevent vegetation material from fully decomposing, which results in accumulation of decomposed vegetation matter and moss (peat), including valley, raised, blanket and quacking (floating) bogs with >30 cm of peat layer, and mosses and herbaceous or woody plants within natural or exploited peat bogs, and (4) moss and lichen. For wet and peat/semi-peat land fuel subcategories, tree, shrubland and grassland formations were distinguished.
-
Urban, which includes areas with ≥15 % built-up structures and/or buildings. The standard CLC division between continuous and discontinuous fabric was followed, related to the amount of vegetation belonging to the intermix and interface of the wildland–urban interface (WUI). This is part of the innovation of the proposed classification system, as it allows the assessment of residential and non-natural fuels, which can in turn help with identifying anthropic areas where fires can affect human settlements and lives.
-
Nonfuel, which includes permanent waterbodies, open sea, snow, ice, bare soil, and sparse vegetation (<10 %). It was not found relevant to further disaggregate non-fuels by mapping water, snow, ice, bare soil, and sparse vegetation, but it could be easily introduced if desired at high spatial resolutions.
Forest categories were divided into two vertical strata, for which the first level referred to the overstorey (canopy) characteristics and the second level to the understorey characteristics. Further subdivisions were included in the first level by considering the leaf type (broadleaf or needleleaf), the leaf deciduousness (evergreen or deciduous), and the fractional cover (open or closed). The lower stratum referred to the understorey characteristics by identifying the type of surface vegetation (grassland, shrubland, or timber litter) and its height. This allowed us to define the surface and canopy characteristics of the fuels in the forest, which can help to account for both surface and crown fires. For the rest of the main fuel types, only one vertical stratum (first level) was identified. For shrubland and grassland fuel types, subcategories were created based on fuel bed depth (height of the surface fuel layer).
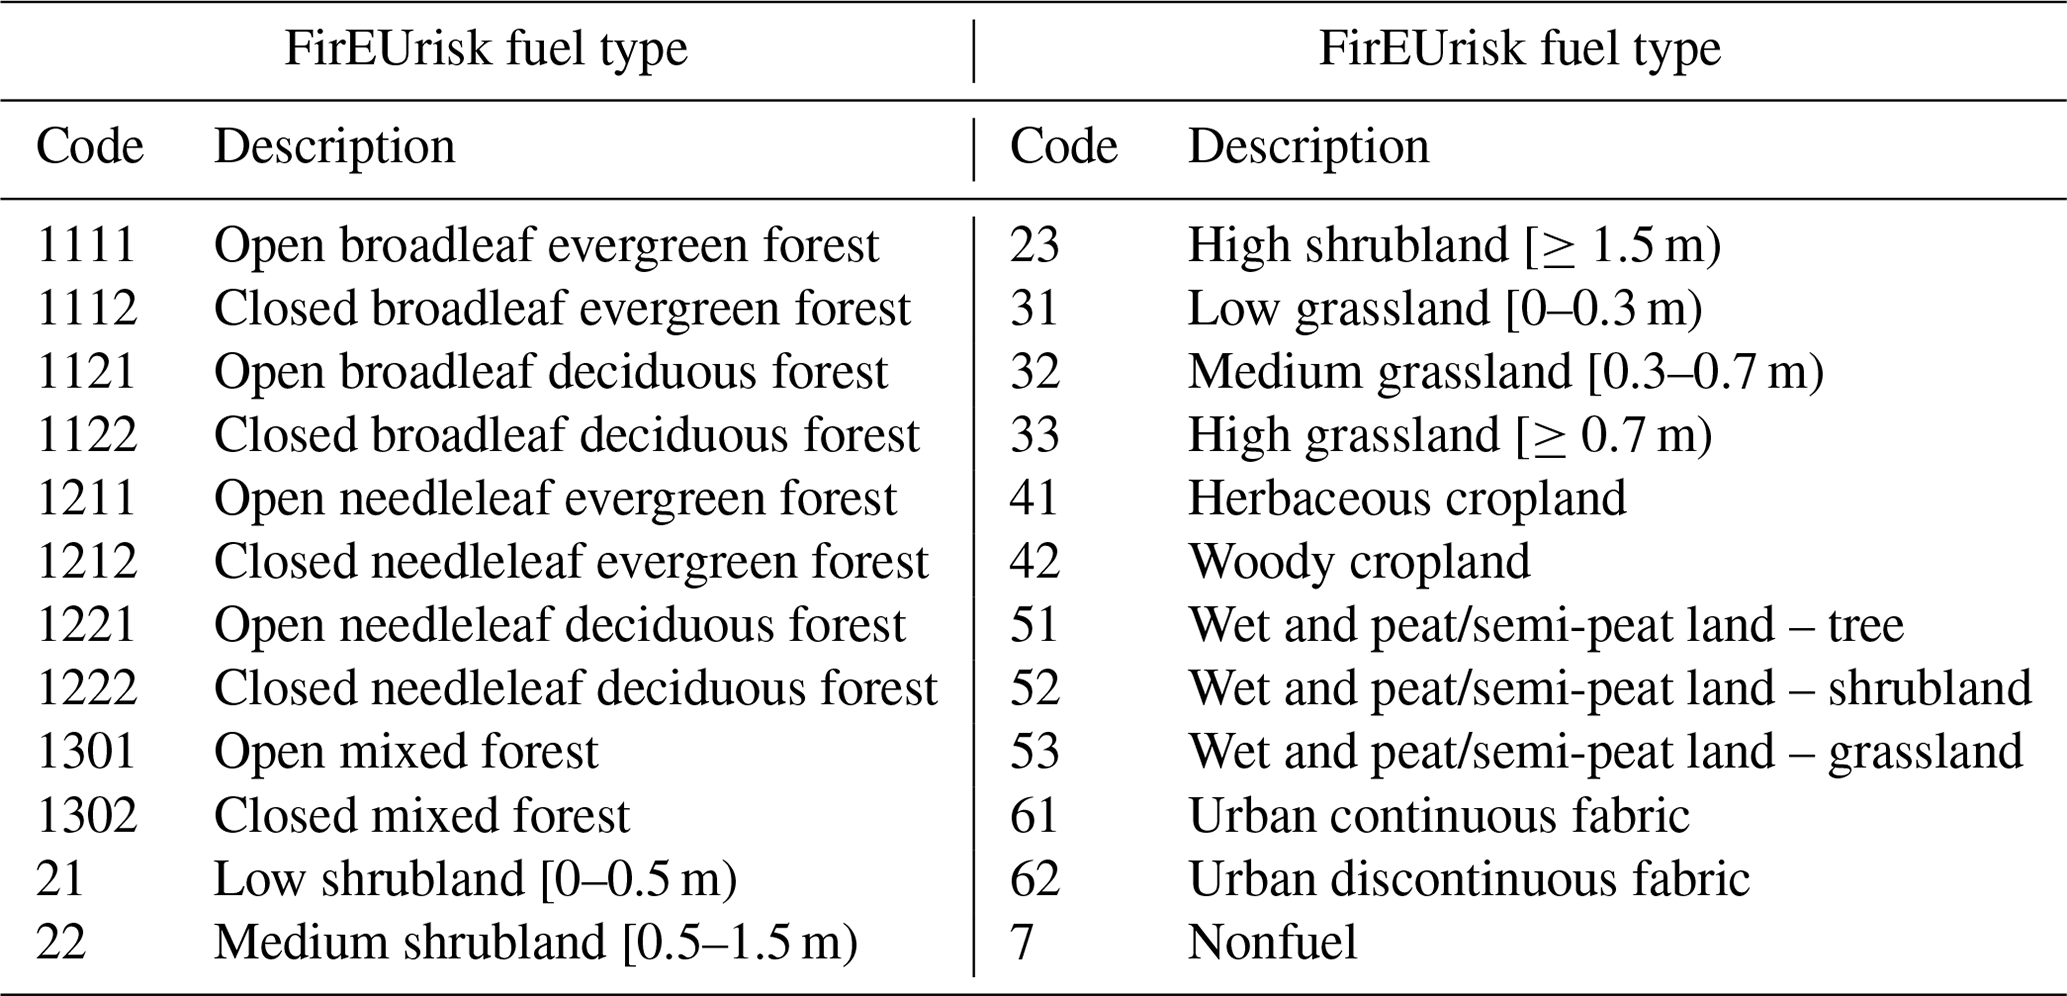
Discriminating all the proposed categories may be quite challenging and should be adapted to the working scale of the fuel type product and, accordingly, to the quality of the input data available to produce it. The fuel type categories of the first level (Table 1) should be more suitable for continental or global fuel products, while the second level should be better adapted to local or regional studies, where more detailed information can be available. In this paper, the European fuel map was generated for the first level of the proposed fuel classification system, covering all European continental countries at 1 km spatial resolution. This product was developed to help the strategic planning of fire management in Europe through generating a continental map with a homogeneous and integrated fuel classification system for all countries, which would allow us to carry out standardised fire risk analysis and inform fire managers and policy-makers from a risk-wise holistic perspective for Europe.
Table 1A total of 24 first-level FirEUrisk fuel types expected to be mapped at continental scale. See Table A1 in Appendix A for the complete FirEUrisk fuel classification system.
3.1 Study area
The study area is the European territory, as defined by the FirEUrisk project, with around 5 Mkm2 of land covering 33 countries (Fig. 2). The European countries historically most affected by wildland fires have been Portugal, Spain, Italy, Greece, and France. However, a recent increase in fire activity in higher latitudes has been observed, e.g. fires in Sweden in 2018 (San-Miguel-Ayanz et al., 2021) and the fire between the Czech Republic and Germany in 2022 (Global Disaster Alert and Coordination system, 2022). The most dangerous fire conditions in the European territory, and particularly in the most-affected southern European Union countries, are usually observed during the summer months, which represent the period in which fuel conditions are most favourable for fire ignition and spread. The peak of the fire season can be different in other European areas, as observed in winter (e.g. Alps and Pyrenees) or spring (central and northern Europe; San-Miguel-Ayanz et al., 2021).
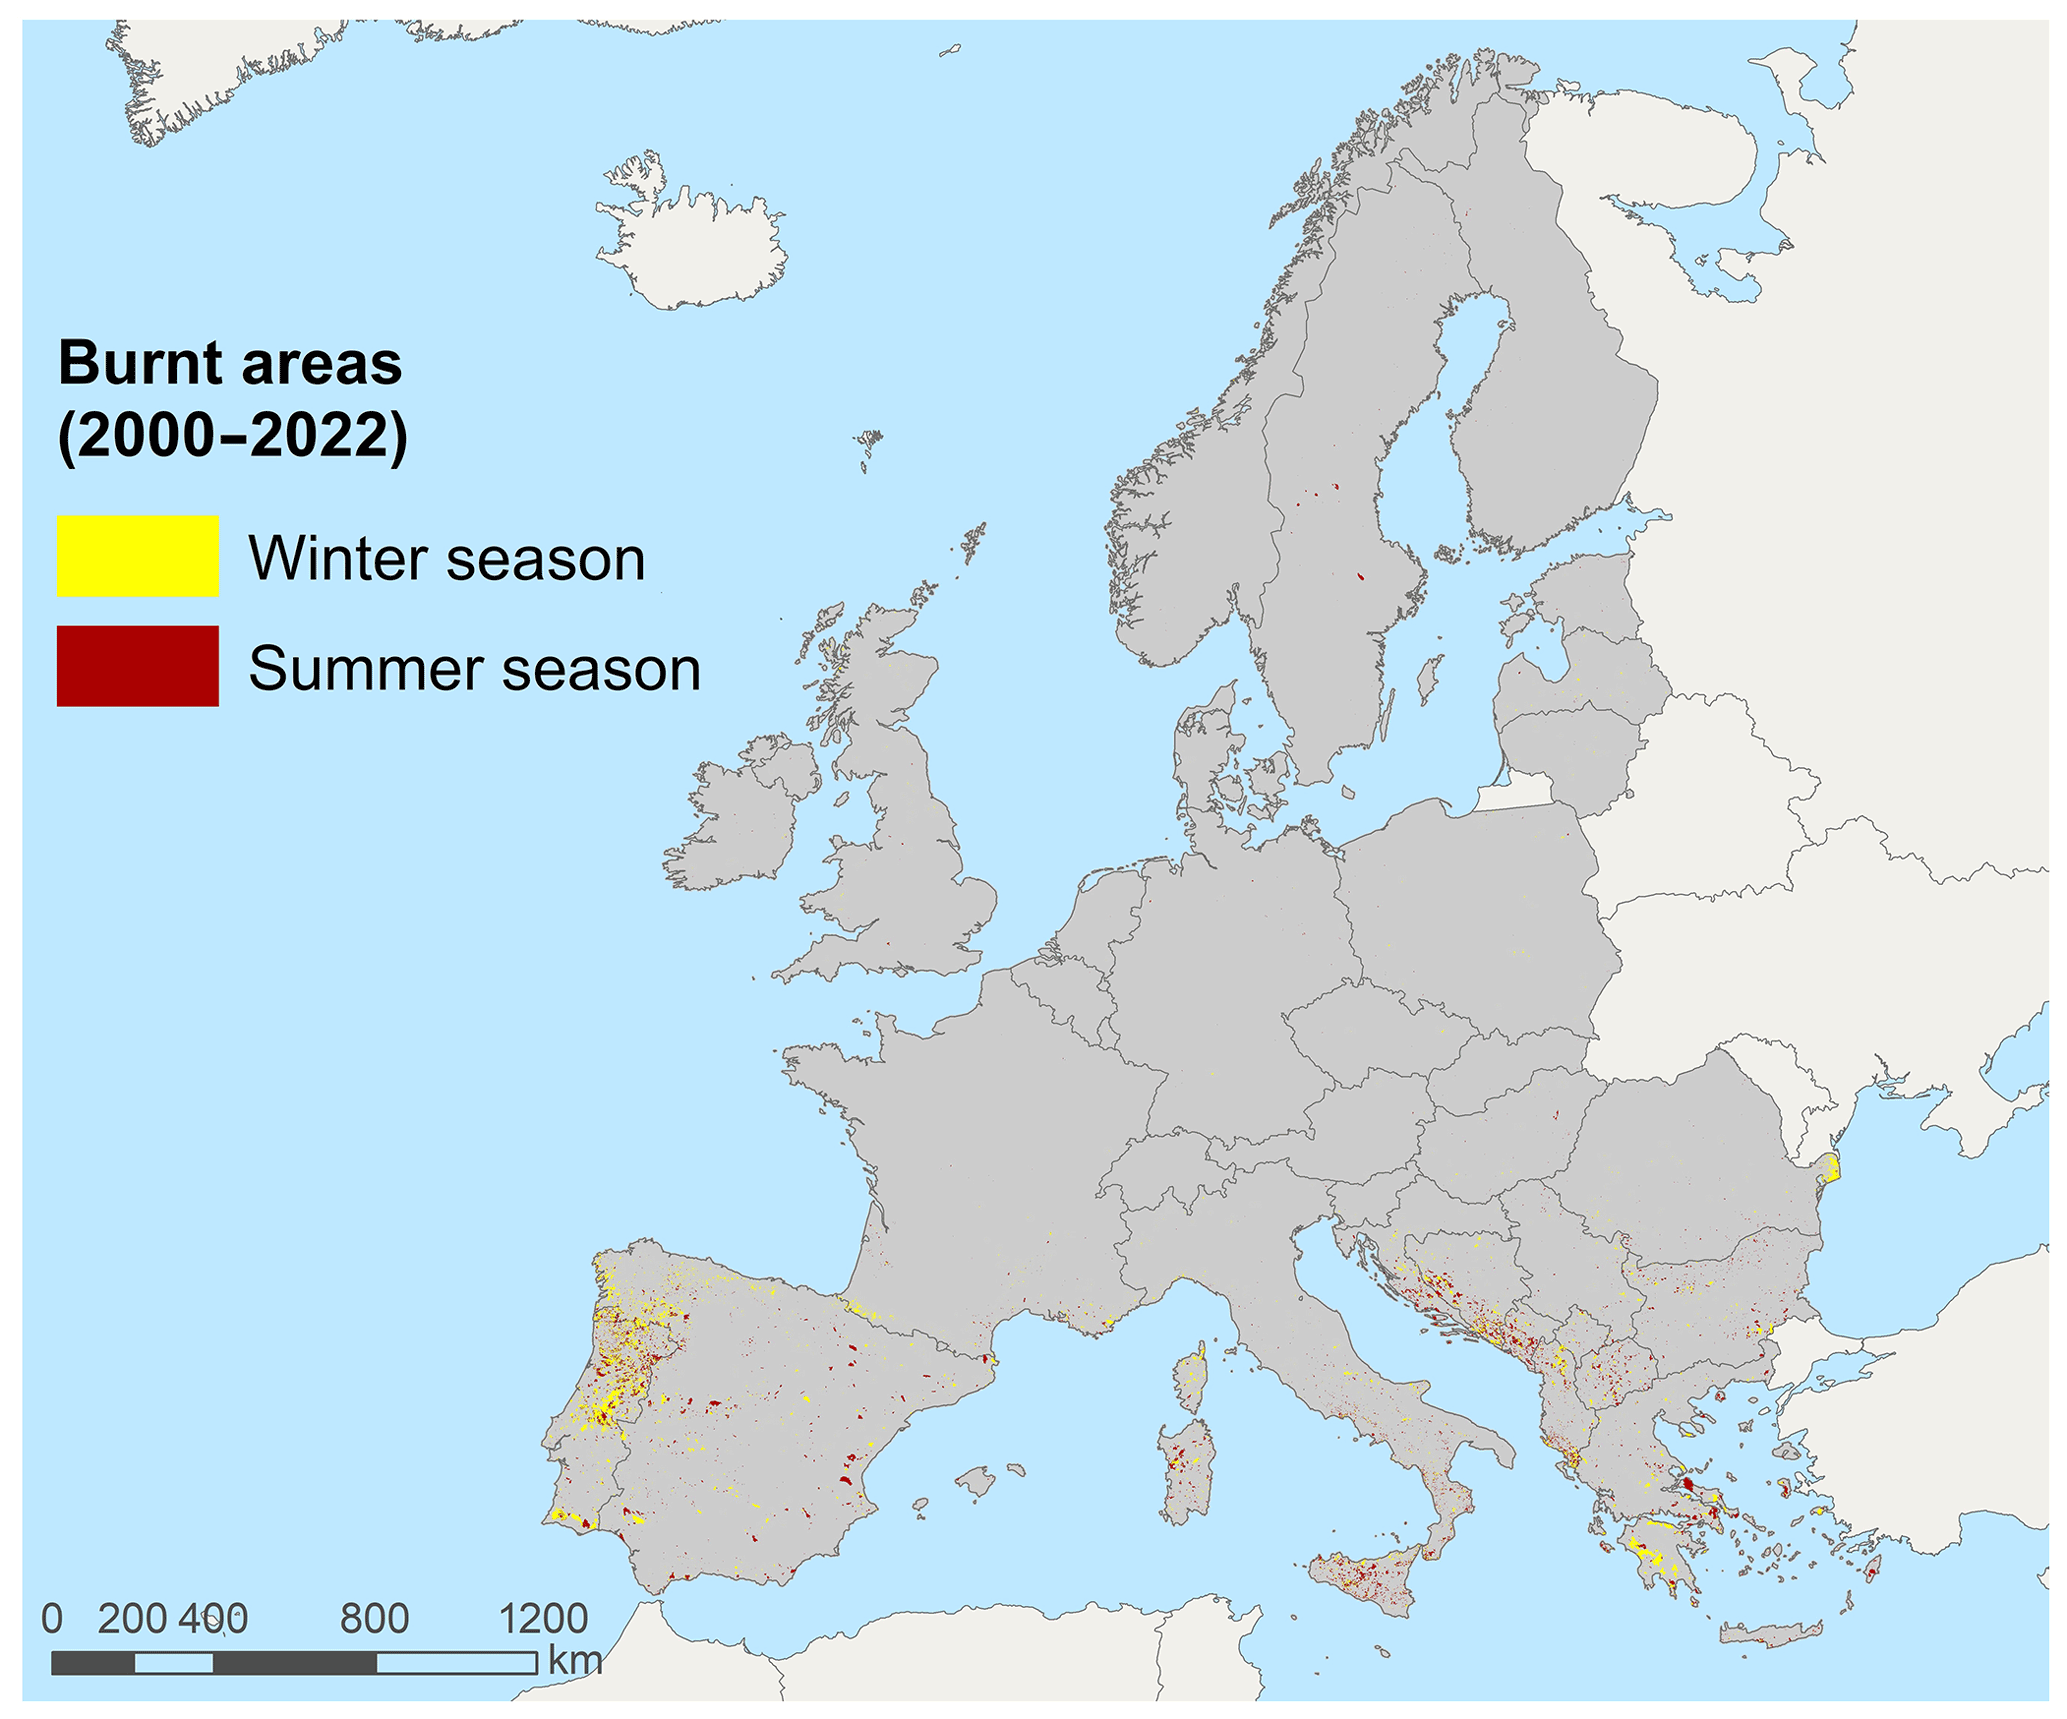
Figure 2Study area and burnt areas from 1 January 2000 up to 27 January 2022 in winter and summer seasons. Note: source data for the burnt area have been taken from EFFIS (2021).
3.2 Methods to obtain the European fuel map
3.2.1 Input data
The generation of the European fuel map with the targeted first-level fuel types (Table 1) was based on the combination of existing land cover and biogeographic regions datasets covering European territory and bioclimatic models.
Due to the similarity between the fuel types of the FirEUrisk fuel classification system and the 2019 discrete Copernicus Global Land Cover map (Copernicus GLC map) legend (Buchhorn et al., 2020), this land cover dataset was used as the main information source for the generation of the European fuel map. The Copernicus GLC map has 100 m resolution and is based on the PROBA-Vegetation (PROBA-V) sensor (Buchhorn et al., 2020), with an overall accuracy of 79.9 % for continental land cover categories and 72.8 % for regional land cover categories over Europe (Tsendbazar et al., 2020). We used the Copernicus GLC map to extract the information on fuel types, and whenever the land cover information of this source was insufficient to map a FirEUrisk fuel type, we used the three following input datasets to derive the required information.
-
The 2020 global Climate Change Initiative Land Cover map (CCI LC map) at 300 m resolution is based on the Medium Resolution Imaging Spectrometer (MERIS), PROBA-V, and Sentinel-3 Ocean and Land Colour Instrument (OLCI; Copernicus Climate Change Services, 2020), with an overall accuracy of 70.5 % (Defourny et al., 2021).
-
The 2018 pan-European CORINE Land Cover raster map (CLC map) at 100 m resolution is based on the Sentinel-2 MultiSpectral Instrument (MSI) and Landsat 8 Thematic Mapper (TM) images (European Union Copernicus Land Monitoring Service, 2018), with an overall accuracy of 92.67 % (European Union Copernicus Land Monitoring Service, 2021).
-
The 2019 fraction cover Copernicus Global Land Cover map at 100 m resolution for the built-up category (built-up fraction cover Copernicus GLC map; Buchhorn et al., 2020) is based on the World Settlement Footprint 2015 map (Marconcini et al., 2020) and yearly updated OpenStreetMap images, with a mean absolute error of 0.8 % (Tsendbazar et al., 2020).
The Copernicus GLC map (Buchhorn et al., 2020) and the built-up fraction cover Copernicus GLC map (Buchhorn et al., 2020) were downloaded in tiles for the study area and mosaicked. All input datasets were reprojected to ETRS89 Lambert azimuthal equal area, using the nearest-neighbour method, with the same spatial resolution as the Copernicus GLC map. The input datasets were also clipped to the study area.
Also, to account for fuel bed depth categories (low, medium, and high shrubland and grassland fuel types), we used bioclimatic models (Saglam et al., 2008; Smit et al., 2008; Fick and Hijmans, 2017; Bohlman et al., 2018; H. Zhang et al., 2018) to relate environmental conditions with fuel bed depth.
To account for bioclimatic variations across Europe, we used the 2016 dataset of Europe's biogeographic regions by the EEA (European Environment Agency, 2016). The study area had nine biogeographic regions, namely alpine, Arctic, Atlantic, Black Sea, boreal, continental, Mediterranean, Pannonian, and Steppic. For each biogeographic region, we analysed climate graphs from 1861 to 2019 of several representative cities using the ClimateCharts.net platform (Zepner et al., 2020). The biogeographic regions, whose climate graphs presented at least 1 dry summer month, were assigned to the arid/semi-arid regime. A dry summer month is interpreted as a month for which the sum of monthly precipitation (mm yr−1) is less than twice the mean month temperature (∘C; Zepner et al., 2020). The biogeographic regions not meeting this condition were assigned to the sub-humid/humid regime. The final general bioclimatic regimes were rasterised to 100 m and 1 km resolution using the maximum area method.
3.2.2 Generation of the European fuel map
Methods to generate the European fuel map are summarised in Fig. 3.
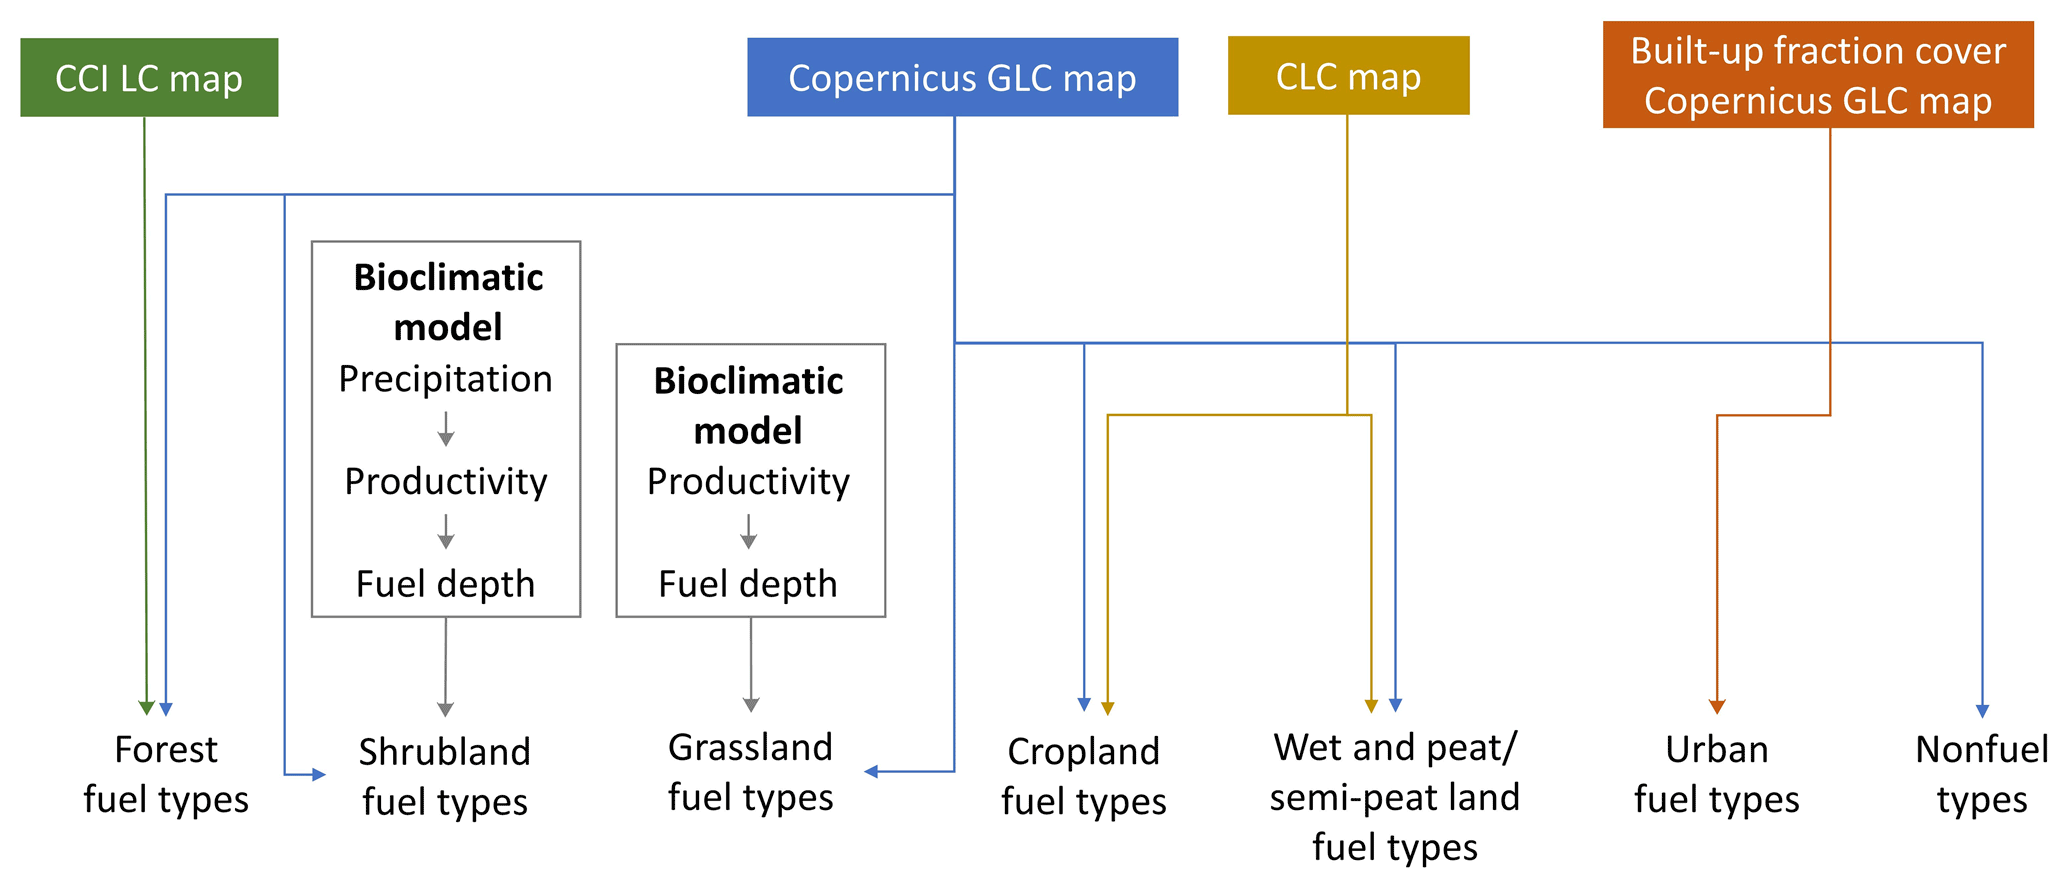
Figure 3Methodology used to generate the European fuel map. The input sources are in the text.
- a.
Forest fuel types. Information on the leaf type, leaf deciduousness, and fractional cover of forest fuels was obtained from the Copernicus GLC map (Buchhorn et al., 2020). This dataset defines all the first-level forest fuel types in the FirEUrisk fuel classification system, plus two more categories only referring to fractional cover, i.e. unknown open forest and unknown closed forest. Pixels falling in these two categories were overlapped with the CCI LC map (Copernicus Climate Change Services, 2020), previously resampled from 300 to 100 m using the nearest-neighbour method to match the resolution of the Copernicus GLC map. This allowed determining the leaf type (broadleaf or needleleaf) and leaf deciduousness (evergreen or deciduous) of the unknown forest from the CCI LC map for forest cover. The pixels identified as unknown forest in the Copernicus GLC map but not as forest in the CCI LC map were assigned the category of the CCI LC map.
- b.
Shrubland fuel types. The shrubland cover was extracted from the Copernicus GLC map (Buchhorn et al., 2020). To our knowledge, no global or European datasets on shrubland fuel bed depth, which is the height of the shrubland layer, are available. This variable is quite important, as shrubland depth is directly related to shrubland productivity (Radloff and Mucina, 2007; Saglam et al., 2008; Ali et al., 2015), which is mainly determined by the mean annual precipitation (MAP; Shoshany and Karnibad, 2015; Paradis et al., 2016; Bohlman et al., 2018; X. Zhang et al., 2018) through biomass accumulation (Keeley and Keeley, 1977; Schlesinger and Gill, 1980; Gray and Schlesinger, 1981; Bohlman et al., 2018). This is especially relevant in the arid/semi-arid regime like the Mediterranean (Shoshany and Karnibad, 2011). Therefore, shrubland fuel bed depth was obtained from a bioclimatic model adapted to arid/semi-arid conditions with three steps, which are, first, mapping the European MAP, second, estimating the shrubland productivity from MAP, and third, estimating the shrubland fuel bed depth from productivity. Bioclimatic models adapted to the whole of Europe's conditions do not exist, so we used the regional, already-calibrated models which best related to European shrubland conditions (mostly located in arid/semi-arid zones) as an approximation.
Global 1970–2000 MAP at 1 km resolution was obtained from the WorldClim version 2 dataset (Fick and Hijmans, 2017). The data were reprojected from the World Geodetic System 1984 (WGS84) geographic latitude/longitude to ETRS89 Lambert azimuthal equal area using the bilinear method and clipped using the European shrubland mask.
The estimation of shrubland productivity was based on a linear model (Eq. 1) that related shrubland productivity and MAP for California (Bohlman et al., 2018). This model was derived from a literature review, and Californian bioclimatic conditions are similar to those of European arid/semi-arid regions, as can be checked in the ClimateCharts.net platform (Zepner et al., 2020). Therefore, it was used to calculate the mean potential shrubland productivity for each pixel.
Finally, we used a linear empirical model (Eq. 2) that related the shrubland fuel bed depth and productivity for two study areas in Türkiye (Saglam et al., 2008), which are similar to European conditions, with 650 and 1200 mm yr−1 mean precipitation. We applied this model to the estimate shrubland fuel bed depth, constraining the outputs to the 0–6 m range. Last, each shrubland fuel bed depth pixel was assigned to its corresponding shrubland group of the FirEUrisk fuel classification system.
- c.
Grassland fuel types. The Copernicus GLC map (Buchhorn et al., 2020) was used to identify grassland areas. To our knowledge, no global or European datasets on grassland fuel bed depth, i.e. the height of the grassland layer, are available. Grassland depth is directly related to grassland productivity (H. Zhang et al., 2018; Crabbe et al., 2019; Michez et al., 2019; Batistoti et al., 2019), which correlates with environmental conditions (Smit et al., 2008) and mainly MAP because regions with more precipitation have higher grasslands with higher productivity (Smit et al., 2008; Nunez, 2019; Neal, 2021). The most productive grasslands are located in central Europe, while lower grasslands are located in the Mediterranean and Arctic regions (Smit et al., 2008). Information on the grassland fuel bed depth was obtained from a bioclimatic model with two steps, which first involves mapping grassland productivity and then estimating grassland fuel bed depth from productivity.
First, European grassland productivity was derived from the consistent inventory of regional statistics (Smit et al., 2008) for the European environmental zones (Metzger et al., 2005), which are similar to the European biogeographic regions. The mean grassland productivity values were assigned to each polygon of the biogeographic regions' map and were subsequently rasterised using the maximum area method to 100 m resolution, thereby representing the European mean grassland productivity by biogeographic region. The map was then clipped by the grassland mask to obtain this information for the grassland pixels.
Second, to estimate European grassland fuel bed depth, we used a linear empirical model (Eq. 3) that relates grassland depth and biomass for China (H. Zhang et al., 2018). We considered this model appropriate for Europe because Chinese grasslands are also generally temperate, and the model was developed considering three study areas that relate to European conditions, i.e. (1) 80–220, (2) 600, and (3) 850–1000 mm yr−1 mean precipitation. With this model, we estimated the grassland fuel bed depth for every pixel. Finally, each pixel was assigned to a FirEUrisk grassland group according to fuel bed depth. Outliers (pixels with <0 m) were reclassified to 0 m.
- d.
Cropland fuel types. The herbaceous cropland cover was extracted from the Copernicus GLC map (Buchhorn et al., 2020), as this dataset only has information on this type of cropland cover. The CLC map (European Union Copernicus Land Monitoring Service, 2018) was overlapped with the previous map to extract the location of the woody cropland pixels (CLC categories: 221, 222, 223).
- e.
Wet and peat/semi-peat land fuel types. The Copernicus GLC map (Buchhorn et al., 2020) was used to extract the location of the wetland herbaceous cover, as this dataset only has information on this type of wetland cover, and the moss and lichens cover. These categories were assigned to the wet and peat/semi-peat land – grassland fuel type. Then, the CLC map (European Union Copernicus Land Monitoring Service, 2018) was used to extract the pixels of the peat land and moorland or heathland categories (CLC categories 322 and 412). These pixels were overlapped with the Copernicus GLC map to classify them into tree, shrubland, or grassland wet and peat/semi-peat land fuel types, according to the cover type from the Copernicus GLC map they overlapped.
- f.
Urban fuel types and nonfuel types. The built-up fraction cover Copernicus GLC map (Buchhorn et al., 2020) was used to extract the location of the pixels with ≥15 % and ≥80 % of urban cover. Pixels with ≥80 % of urban cover were assigned to the urban continuous fabric, and the rest of the identified urban pixels were assigned to the urban discontinuous fabric.
The permanent waterbodies, open sea, snow and ice, and bare/sparse vegetation (<10 %) categories from the Copernicus GLC map (Buchhorn et al., 2020) were reclassified to the nonfuel category.
3.2.3 Resampling to the target spatial resolution
The input layers used for the generation of the European fuel map were previously resampled to 100 m to match the spatial resolution of the Copernicus GLC map, which was our main information source. However, the spatial characteristics of some of the input layers (such as the CCI LC map at 300 m and the bioclimatic models based on 1 km resolution weather data) were recommended to convert the final product to 1 km spatial resolution, which was also the project target resolution for the European scale. Therefore, after obtaining the first fuel type dataset at 100 m resolution, it was resampled to 1 km, carefully accounting for the heterogeneity of European fuel types. Before resampling, potential noise in the cross-tabulation process was minimised by using a majority filter. We performed filtering tests using 3 × 3, 5 × 5, and 7 × 7 moving windows and chose the most suitable according to a balance between information preservation and noise removal.
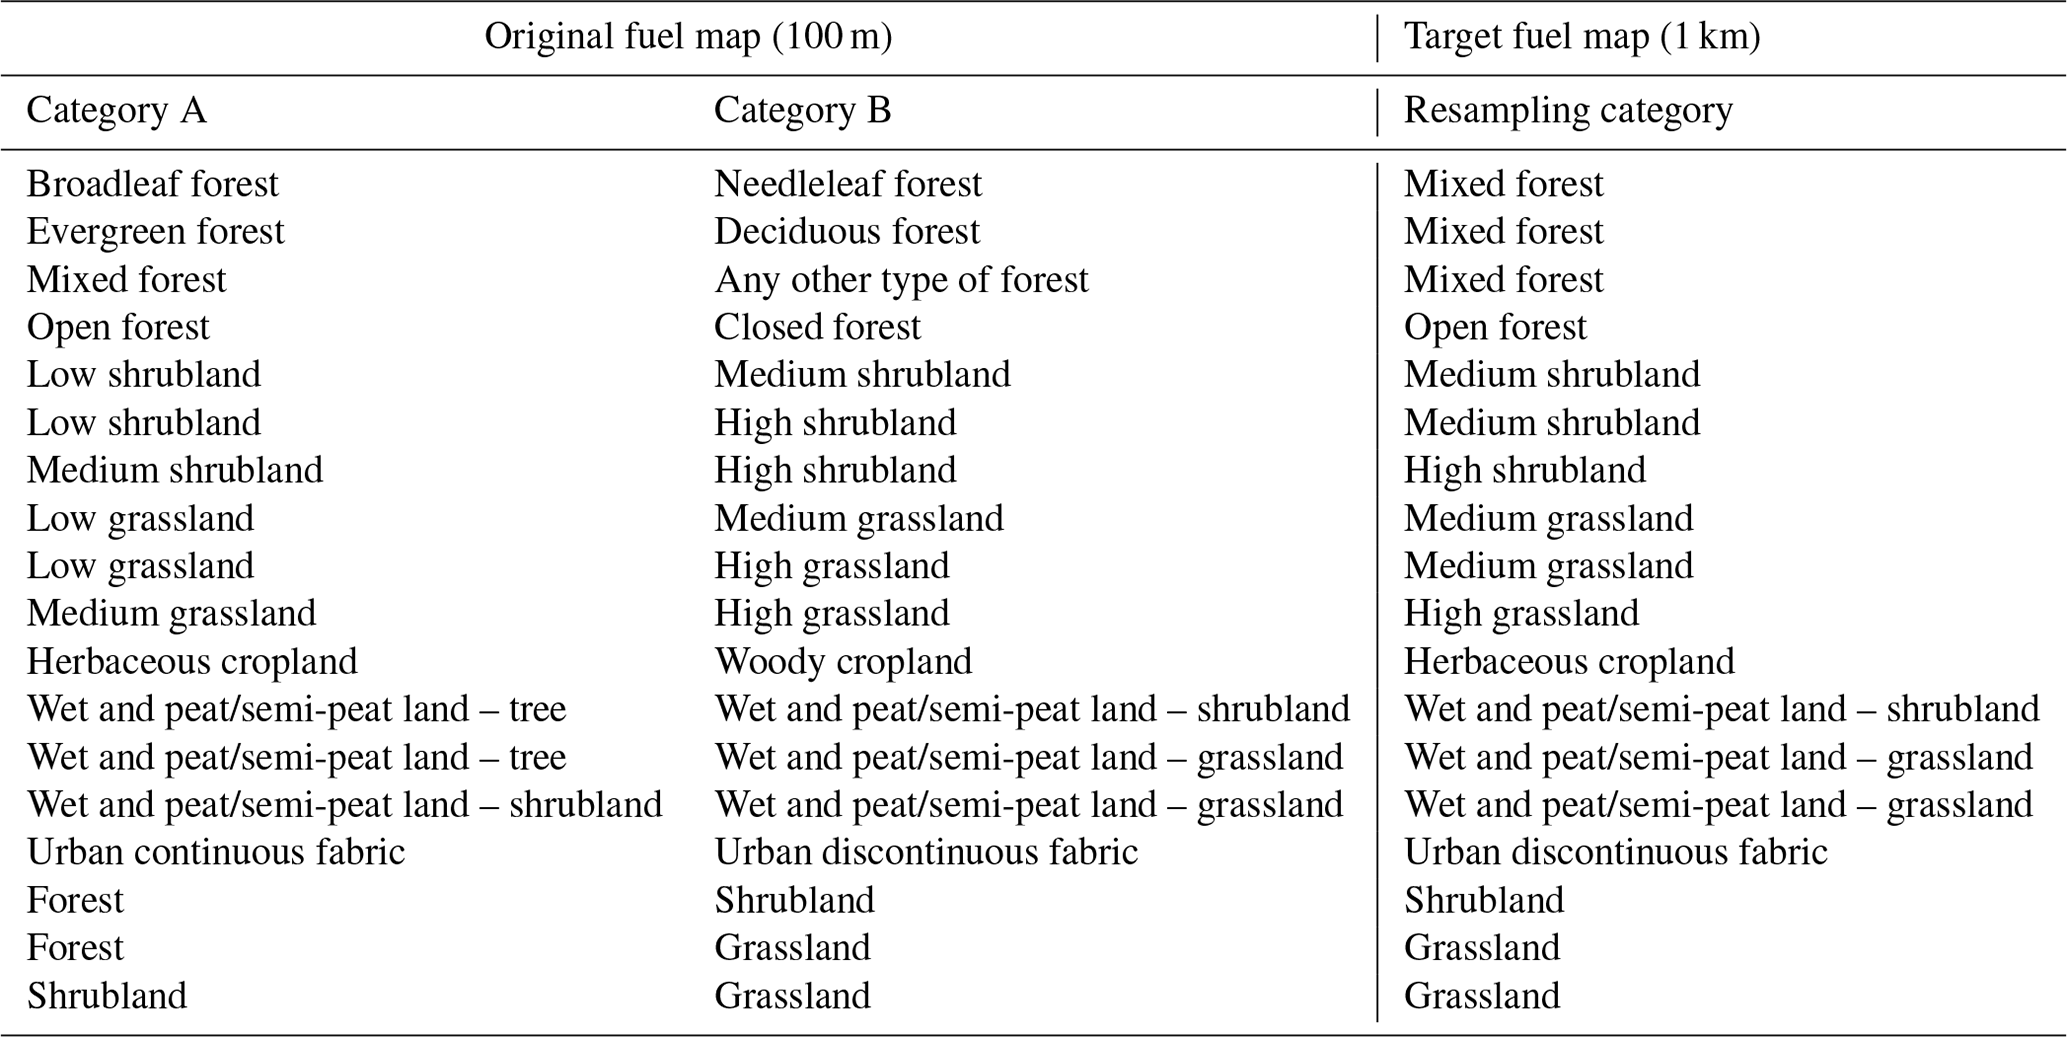
Then, the dominant categories within each 1 km2 pixel were estimated by computing the frequency of the fuel type categories within the pixels contained in each 1 km2. The main resampling criterion was to choose the dominant (first-mode) category within the target pixel. However, to tackle the impact of mixed fuel type covers (e.g. mixed forest), and to take into account the most dangerous type between two equally extended fuel types (discriminated using expert knowledge), the combination of categories in Table 2 was performed whenever there were two co-dominant categories. Co-dominant categories were defined as those that present the same frequency in a group of pixels or if the frequency of the second majority category is higher than half the frequency of the majority category. The combination of the co-dominant categories in Table 2 was carried out regardless of which category had a higher frequency. In the case of a combination of co-dominant categories not included in Table 2, the resampling was performed by randomly choosing one of the co-dominant categories. After resampling, the number of first-mode categories within the 1 km2 pixel groups was calculated to check the adequacy of the smoothing and resampling method to the data.
Table 2Combination of fuel types used to resample the 100 m resolution European fuel map to the target 1 km spatial resolution.
3.2.4 Validation methods
We followed a two-step validation approach for the final European fuel map at 1 km resolution. Considering the infeasibility of the ground validation of the final product, we first validated the six main fuel types (forest, shrubland, grassland, cropland, wet and peat/semi-peat land, and urban) of our classification, plus the nonfuel category, using LUCAS (Land Use and Coverage Area frame Survey) as reference data. LUCAS points are derived from a field systematic survey, performed every 3 years by Eurostat, to identify land cover and use changes (including photos) in the European Union (Eurostat, 2022a). The 2018 LUCAS microdata for Europe were downloaded (Eurostat, 2022b) and reprojected from WGS84 geographic latitude/longitude to ETRS89 Lambert azimuthal equal area.
The selection of suitable LUCAS points for the main fuel types validation was based on the following criteria: no GPS accuracy issues, a field survey with the point visible <100 m and an observation on the point, a parcel area of ≥10 ha, 100 % land cover coverage, not referring to small features (roads, railway, pipelines, telecommunications, etc.) because these elements occupy a small fraction of a 1 km2 pixel and are not identified in a fuel type product at this resolution, and a photo on the point. We selected only those LUCAS points with available photos, so our fuel types associated with fuel bed depth or multilayer structure could be estimated visually. Moreover, to avoid border effects and make LUCAS points more comparable to our target spatial resolution (1 km), they should be located within large homogeneous areas. So, LUCAS points were buffered by 200 m, and only those points whose buffers met these three conditions were kept, where (1) 88.5 % of the buffer was falling inside a polygon ≥4 km2 of the 100 m vectorised fuel map, (2) 100 % of the buffer was falling completely inside a polygon of the 1 km resolution vectorised fuel map for the main fuel types, and (3) 100 % of the buffer was falling completely inside the study area. Note that, as per point (1), we used 88.5 % instead of 100 % to have enough pixels to perform validation for all main fuel types. Finally, after applying the filters, we extracted 5016 suitable LUCAS validation points by stratified random sampling, which was considered to be a representative sampling according to the proportion of area covered by each fuel category. The land cover categories from the validation points were reclassified to the most similar FirEUrisk main fuel types and were used for the assessment of the European fuel map. A confusion matrix was computed for quantitative analysis.
After validating the main fuel types from this automatic procedure, we performed a second validation exercise, aiming to assess all mapped fuel types, which required us to obtain reference information on leaf type, leaf deciduousness, fractional cover, fuel bed depth, and type. Since this required a visual interpretation, a 20 % subset of the 5016 validation points was selected by stratified random sampling. Each point was assigned to a fuel category by visual interpretation of four information sources, namely (1) the 2018 LUCAS photos at a maximum distance of 200 m, (2) the latest Google Earth images to observe the 1 km2 pixel, (3) Google Street View images, and (4) the 2020 global land cover GlobeLand30 map (30 m resolution; Chen and Ban, 2014), with 85.72 % of overall accuracy, based on Landsat and Huanjing (HJ-1) images, to help to validate forest and urban covers. The GlobeLand30 tiles for the European territory were downloaded (http://www.globallandcover.com, last access: 11 February 2022), mosaicked, and reprojected from WGS84 geographic latitude and longitude to ETRS89 Lambert azimuthal equal area using the nearest-neighbour method. We generated binary layers for forest and urban covers and computed the percentage of each cover within each 1 km2 pixel of the final European fuel map. Some fuel types with low representation in Europe had an insufficient number of pixels with suitable LUCAS points. To analyse at least 10 pixels of each fuel type, we also used LUCAS points not matching all quality criteria for those fuel types. Quantitative analysis through a confusion matrix was performed.
Finally, in the discussion section, the two confusion matrices (one for the main fuel types and another for all mapped fuel types) were compared to the results obtained from the validation of the 2015 Copernicus GLC map over Europe (Tsendbazar et al., 2020). We used the 2015 map instead of the 2019 one because the confusion matrix of the 2019 map was not available. This was considered reasonable, as the categories' accuracies show consistency between the 2015 and 2019 Copernicus GLC maps and vary by less than 2 %, with a stability index of <15 % for most categories, except for herbaceous wetlands, whose producer accuracy increased and user accuracy decreased between 2015 and 2019 (Tsendbazar et al., 2021).
3.3 Results
The analysis of bioclimatic conditions led to the European Black Sea, Mediterranean, and Steppic biogeographic regions be assigned to the arid/semi-arid regime (19.83 % of the territory in southern Europe), and the European alpine, Arctic, Atlantic, boreal, continental, and Pannonian biogeographic regions be assigned to the sub-humid/humid regime (80.17 % of the territory in central and northern Europe; Fig. B1 in Appendix B).
The application of the bioclimatic models for estimating the shrubland and grassland fuel bed depth in the European fuel map at 100 m resolution yielded the distribution of the depth of these fuel types in Europe. Medium and high shrubland predominate in Europe, with 2.28 % of the shrubland fuel types being low, 51.80 % medium, and 45.92 % high. Although shrubland is generally considered up to 5 m, exceptions are allowed, subject to the plant's physiognomic aspect (Food and Agriculture Organization, 2000). Therefore, here we allowed for plants higher to 5 m to be classified as shrubland if they have a clear physiognomic aspect of shrub. The grassland fuel bed depth representation is similar for all groups; 35.81 % of the grassland fuel types are low, 31.94 % are medium, and 32.25 % are high, with the maximum grassland fuel bed depth being 1 m approximately (Fig. 4).
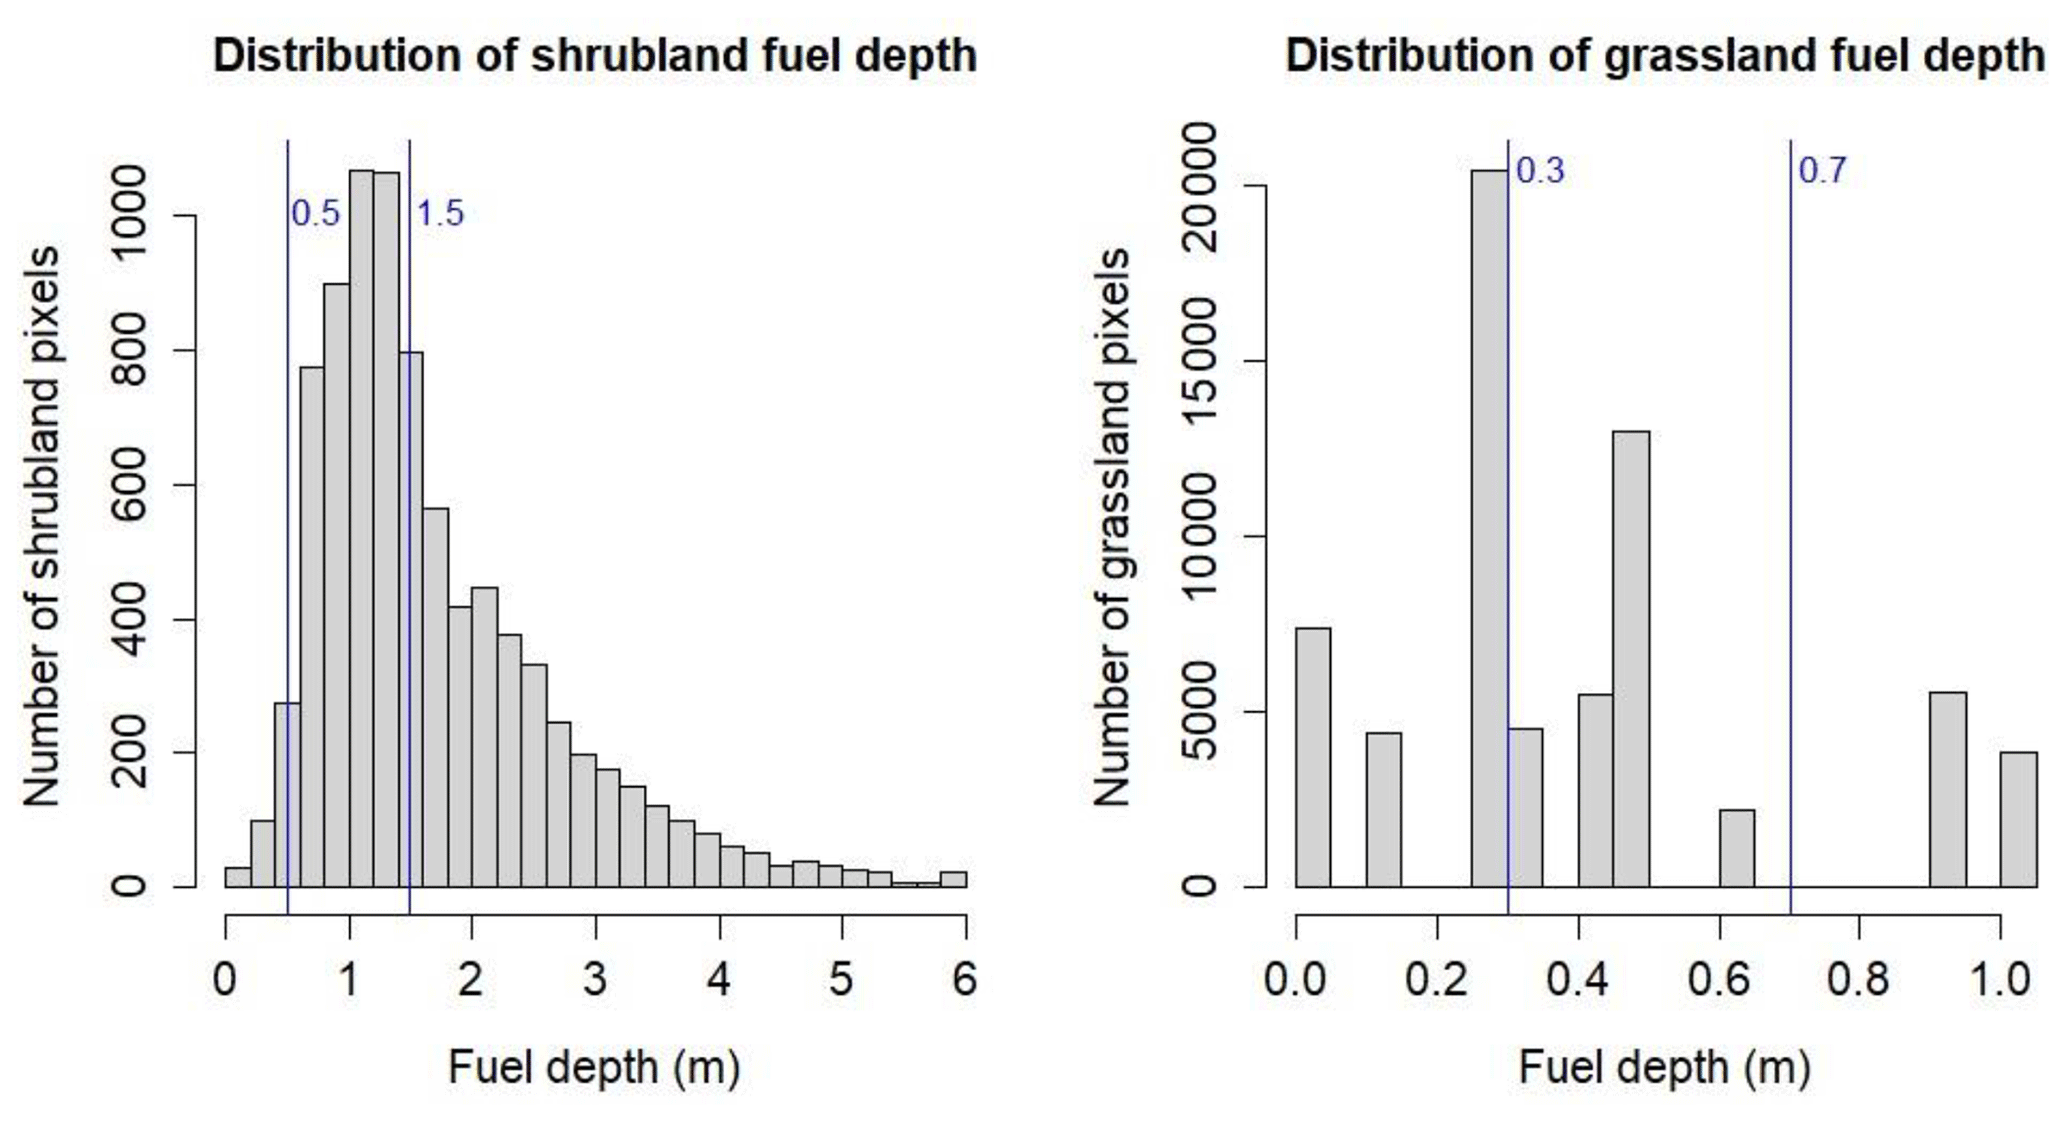
Figure 4Histograms for shrubland and grassland fuel bed depth (m) in Europe obtained from the application of the bioclimatic models. The blue lines represent the fuel bed depth threshold used to subdivide shrubland and grassland fuel types.
The application of the tested smoothing window sizes (3 × 3, 5 × 5, and 7 × 7) increased the percentage of 1 km2 groups of pixels with unimodal distributions after resampling, although, in all cases, the increase was marginal (Table B1 in Appendix B). For all window sizes, more than 99 % of the pixel groups presented a unimodal distribution, less than 1 % presented a bimodal distribution, and only a few pixel groups presented a multimodal distribution of co-dominant categories. These results recommended the use of the 5 × 5 window for the generation of the European fuel map at 1 km resolution, as it provided a good compromise between the generalisation and the level of detail preserved, thus maintaining important fuel types for fire behaviour typically made up of small clusters of pixels, such as urban discontinuous fabric.
The final European fuel map at 1 km resolution was generated and is publicly available at https://doi.org/10.21950/YABYCN (Aragoneses et al., 2022a), including 20 first-level fuel types (Fig. 5). The forest fuel types predominate in mountainous areas and the Scandinavian countries. The open and closed broadleaf deciduous forest, the open needleleaf evergreen forest, and the mixed forest are distributed over all Europe, while the closed needleleaf evergreen forest stands out in the Scandinavian region. The shrubland fuel types dominate in arid/semi-arid Europe. Most shrublands present a medium and high depth. The grassland fuel types appear in cold areas (the Alps, the Scandinavian mountains, the Pyrenees, etc.) and are also important in Great Britain and Ireland as rangelands. They are low in the arid/semi-arid region, medium in northern Europe, and high in central Europe. The herbaceous cropland fuel type is present all over Europe, while the woody cropland has lower importance, referring to fruit trees, vineyards, and olive trees in the Mediterranean area. The tree, shrubland and grassland, wet and peat/semi-peat land fuel types occupy the Scandinavian Peninsula and northern Great Britain. Finally, the urban continuous fuel type relates to cities, and the urban discontinuous fuel type is distributed over all of Europe, referring to the outskirts of cities and rural areas.
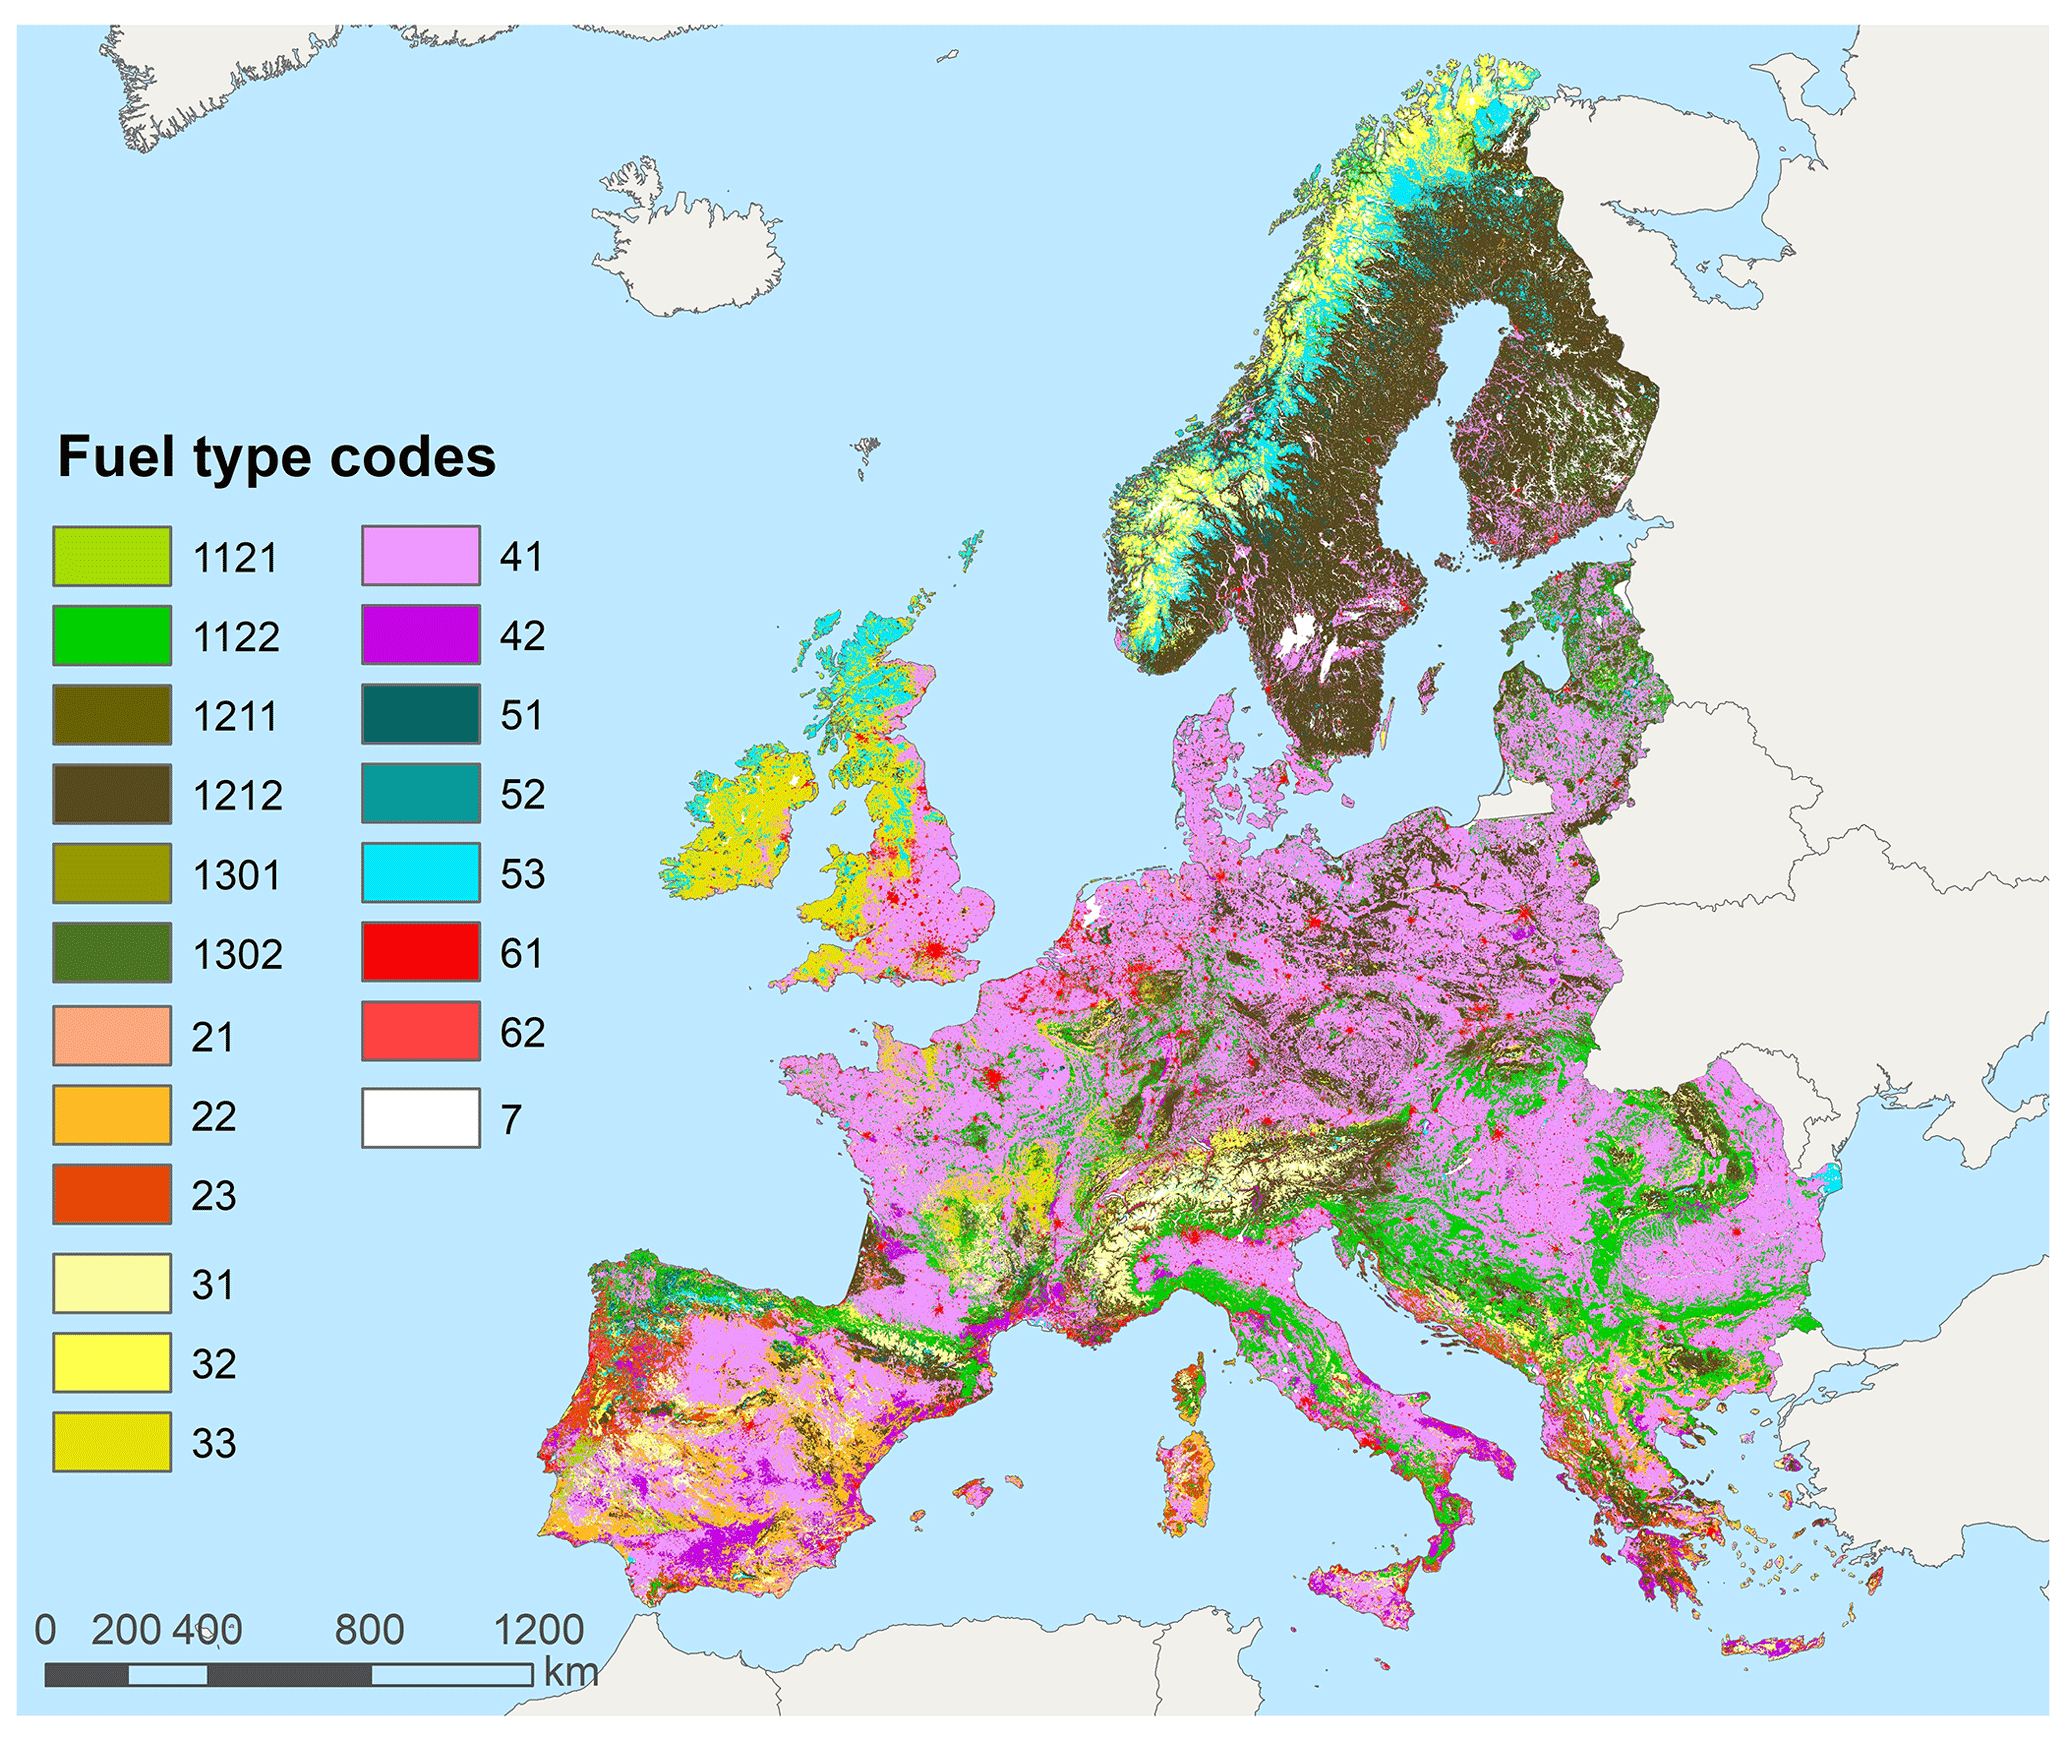
Figure 5FirEUrisk European fuel map at 1 km resolution. See Table 1 for the fuel type code identification.
In the final European fuel map at 1 km (Table B2 in Appendix B), the fuel type dominating over Europe is cropland (38.70 %), mostly herbaceous (36.33 %), followed by the forest fuel types (32.67 %), mostly represented by the closed needleleaf evergreen forest (17.59 %). The fuel types with lower representation in Europe are urban (3.70 %) and wet and peat/semi-peat land (4.94 %). The only fuel types predominating in the arid/semi-arid regime are shrubland (>83 %) and woody cropland (>82 %).
The validation of the European fuel map at 1 km resolution yielded a high overall agreement, 88.40 %, between the FirEUrisk European fuel map and the LUCAS points. The individual fuel type accuracy ranged from 30 % to 100 % (Table 3). As for the second validation exercise, including all mapped first-level FirEUrisk fuel types, a medium to high quantitative agreement was observed (overall accuracy of 81.22 %). The individual fuel type accuracy ranged from 20 % to 100 % (Tables 4, B3 in Appendix B).
Table 3Confusion matrix for the FirEUrisk main fuel types.
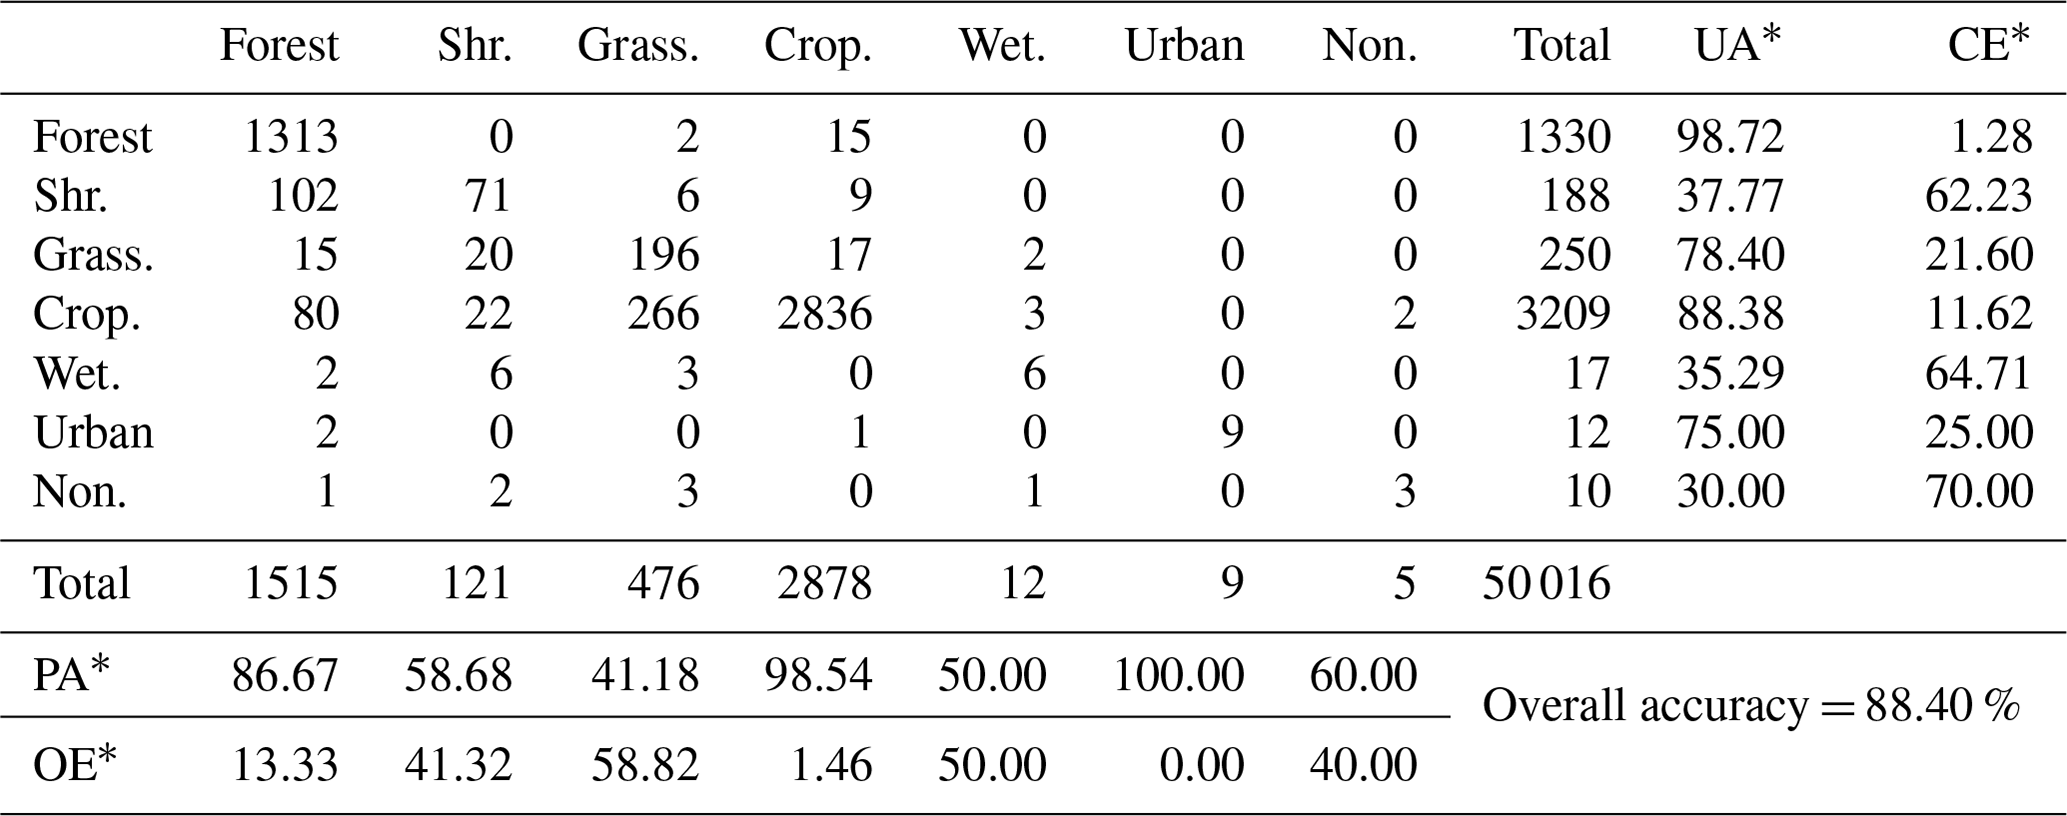
* UA is for user accuracy (%), PA is for producer accuracy (%), CE is for commission error (%), and OE is for omission error (%).
Table 4Accuracy summary for all mapped FirEUrisk fuel types. See Table 1 for the fuel type code identification.
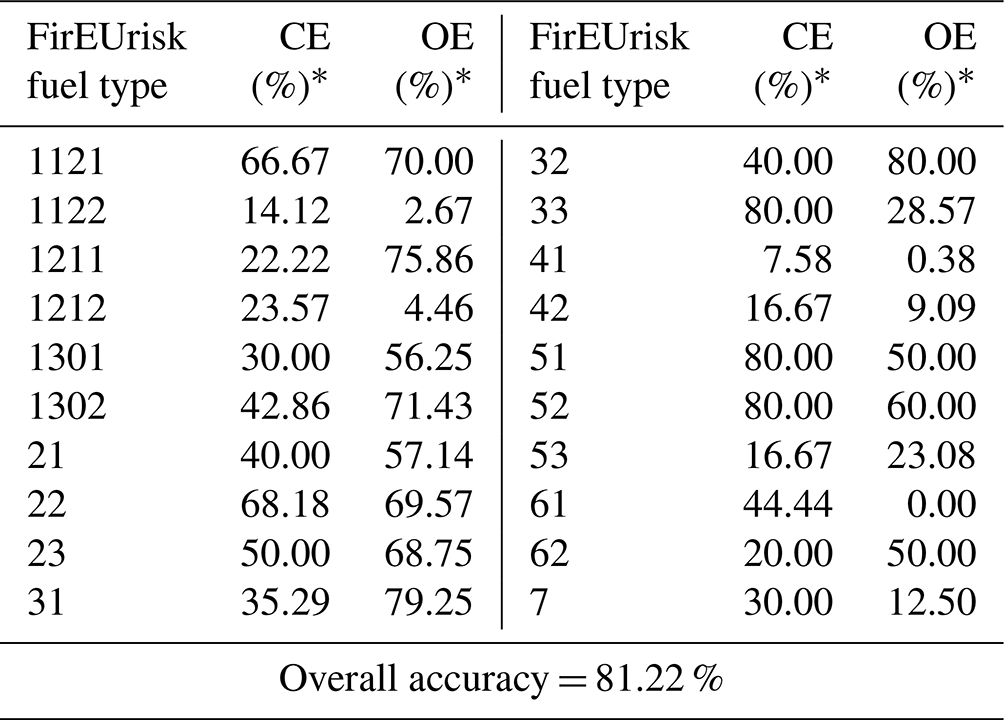
* CE is for commission error (%), and OE is for omission error (%).
4.1 Development of the crosswalk to standard fuel models
Once the fuel classification system was developed and used to map the European fuel types, we assigned each first-level FirEUrisk fuel type to a surface fuel model. This allowed us to define surface fuel parameters at the continental scale. These parameters could be the input to run fire behaviour simulations and for the estimation of fire risk conditions and fire effects. The main purpose of the crosswalk is to serve fire modelling activities (e.g. spread and behaviour, emissions, and post-fire activity) because it allows mapping fuel models and their associated parameters.
The fuel types defined in this paper were matched to the Scott and Burgan (2005) Fire Behavior Fuel Models (FBFMs), which is a widely used fuel model classification system in Europe (Palaiologou et al., 2013; Aragoneses and Chuvieco, 2021; Alcasena et al., 2021). The FBFMs were based on the NFFL system (Anderson, 1982) and created to address fire behaviour predictions based on Rothermel's (1972) surface fire spread model for the United States. They include 40 fuel models classified into seven different groups, according to the predominant fire-carrying surface fuel type, i.e. grass (GR), grass–shrub (GS), shrub (SH), timber understorey (TU), timber litter (TL), slash–blowdown (SB), and nonburnable (NB). Overall, the differences in fire behaviour among the surface fuel groups are mainly related to fuel load and its distribution among the particle size categories, surface area to volume ratio, and fuel bed depth. Compared to NFFL models, the FBFM allows having a number of fuel models not fully cured or applicable in high-humidity areas. Regarding this point, to further improve the matching possibility and account for variations in fuel types and moisture conditions across Europe, we distinguished arid/semi-arid and sub-humid/humid fuel types, as described in previous sections. Furthermore, FBFM data include more fuel models than the NFFL system for forest litter and litter with grass or a shrub understorey. Anyhow, a user can easily move from the proposed FBFMs to the NFFL system by using the crosswalk table between FBFM and NFFL fuel models (Scott and Burgan, 2005). In addition, our proposal of surface fuel mapping and characterisation for the European general conditions can be adjusted or adapted to specific study areas or sites where more detailed information and measurements on fuels or custom data are available (Mutlu et al., 2008; Salis et al., 2016).
For the purpose of this study, we assigned to each fuel type a given FBFM and the related fuel parameters that most fitted the average conditions in the field, according to expert knowledge. As a general rule, we assigned grass models to fuel types related to grasslands and croplands and selected different sets of FBFM models, depending on the fuel bed depth and cropland type and on bioclimatic conditions, such as arid/semi-arid versus sub-humid/humid regimes (Fig. B1 in Appendix B). Shrub models were indicated in shrubland areas, following the same considerations described for grass models. Moreover, we proposed the use of shrub models in conditions of open forests, where the fractional cover is low and the high availability of sunlight can stimulate the presence of a shrubby understorey. Timber understorey and timber litter FBFMs were associated with closed forests; overall, we assigned low fuel-load models to evergreen forests and higher load models to broadleaf forests. The FirEUrisk fuel types 51, 52, and 53 were associated with shrub or grass FBFM models, depending on the main surface fuels. Finally, we proposed nonburnable (NB) conditions for urban continuous areas and other nonburnable zones (e.g. water, snow, ice, bare soils, and sparse vegetation <10 %), while shrub models were indicated for urban discontinuous areas to account for the potential of a fire to spread in such environments.
4.2 The FirEUrisk fuel classification system crosswalk to standard fuel models
The FirEUrisk fuel types crosswalk to the FBFM system (Scott and Burgan, 2005) is presented in Table 5, and the related FBFM map over Europe is provided in Fig. 6 and complemented with Table C1 in Appendix C.
Table 5Suggested attribution of the first-level FirEUrisk fuel types to the FBFM standard fuel models in Europe.
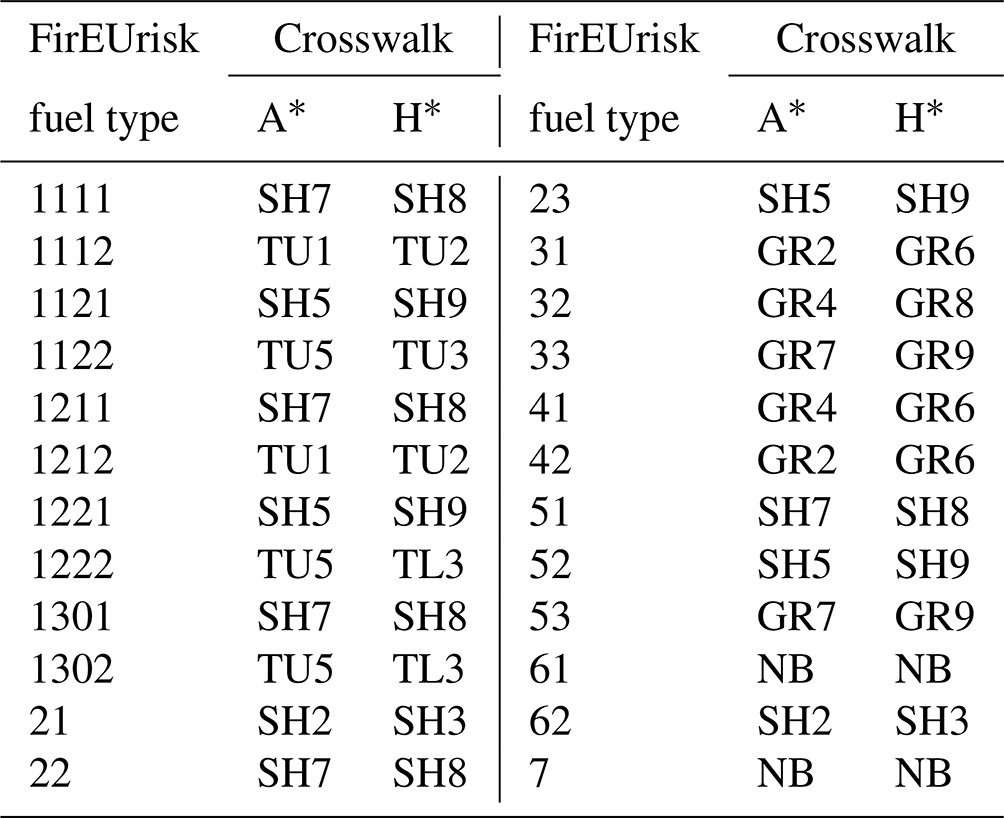
* A is the arid/semi-arid regime, and H is the sub-humid/humid regime. See Table 1 for the fuel type code identification and Table C2 in Appendix C for the FBFM descriptions and parameters.

Figure 6European fuel models based on the FBFM fuel models (Scott and Burgan, 2005) at 1 km resolution. See Table C2 in Appendix C for the fuel descriptions and parameters.
The most extended fuel model at the continental scale is GR6 (area covered about 1.6 Mkm2), which refers to medium–high and moderate live load grasslands of sub-humid/humid areas, and is characterised by high moisture values. This fuel model is largely related to herbaceous croplands that cover the most productive agricultural flat areas of central and northern Europe. About 0.8 Mkm2 of Europe is covered by TU2, which was associated with closed needleleaf evergreen forests located in the sub-humid/humid regime. TU2 is related to timber understorey characterised by moderate load shrubs. TU3, which concerns timber understorey with a combined presence of grasses and shrubs with a moderate fuel load, is the third more common fuel model in Europe, covering 7.77 % of the area. We proposed TU3 in closed broadleaf deciduous forests of sub-humid/humid areas. For arid/semi-arid areas, GR4 is the dominant fuel model and occupies about 0.34 Mkm2 (6.98 %) of land. This model represents moderate load grasses of dry climates. We associated GR4 with herbaceous croplands of southern Europe. Among the fuel models that cover more than 5 % of the study area, we should also mention the GR9, which refers to tall and high live load grasslands of sub-humid/humid areas and is characterised by high moisture values, and the nonburnable fuels, which refer to urban continuous areas and other nonburnable areas including bare soil, water, and glaciers. The other FBFMs used in this work characterise approximately the remaining 29 % of the European territory and range from 0.22 Mkm2 of TL3 to 7734 km2 of GR7.
A description of the parameters of the FBFM fuel models used for the crosswalk is presented in Table C2 in Appendix C. As an example, we mapped the 1 h dead fuel load and the surface fuel bed depth over Europe (Fig. 7).

Figure 7Surface dead 1 h fuel load and fuel bed depth over Europe obtained from the crosswalk from the FirEUrisk fuel types to the FBFM models. Note that surface fuel bed depth for the forest fuels refers to the understorey and not the crowns.
The proposed FirEUrisk hierarchical fuel classification system was designed to be adapted to a wide range of environmental conditions, including those found in the European territory, describing both surface and canopy fuels. In this paper, we present a first product based on this classification, covering the whole European territory for the first level of the classification. We did not consider the forest understorey, the second level of the classification, which is better suited to regional and local scales where more detailed information, particularly lidar data, can be available. In any case, the obtained results constitute an improvement in European fuel mapping compared to existing fuel maps covering the European territory. The map provides more detailed categories than those of existing global fuel maps (Pettinari and Chuvieco, 2016) or the 2000 EFFIS fuel map (European Forest Fire Information System, 2017), which only referred to surface fuels and did not consider forest canopy characteristics. In addition, the FirEUrisk fuel map includes new categories such as wet and peat/semi-peat land fuel types, which are key to understanding fire emissions, and urban fuel types, crucial to prevent fire affecting humans, which were not considered in previous continental and global fuel maps.
The hierarchical nature of the system aims to define a common fuel type classification for different scales and study areas. It also offers high versatility, as it enables mapping fuels with different disaggregation of categories, depending on the detail and quality of the input data, while allowing us to overlap fuel maps for the same area at different scales, which would help the integration and comparison of fuel maps because of the common legend. Thus, whereas the fuel map developed at the European scale was based on existing European and global datasets integrated into a GIS framework, the same classification scheme could be applied to provide a more comprehensive fuel classification using a multi-sensor approach in a machine learning framework (García et al., 2011; Marino et al., 2016; Domingo et al., 2020). Its structure has similarities (e.g. hierarchical scheme) with the ArcFUEL classification (Toukiloglou et al., 2013), although this was only prepared for southern European conditions. In addition, the involvement of expert knowledge in the development of the FirEUrisk hierarchical fuel classification system suggests high acceptance, and therefore usage, among the fire risk management community in the foreseeable future. It also allowed the development of a useful classification, intended to fill the actual gaps of the European fuel mapping, towards a homogeneous and integrated fire risk prevention strategy. Nevertheless, it must be considered that the grouping of vegetation types into fuel types is a balance between the generalisation of the landscape reality and loss of detailed information, which may not be the most suitable system for all study areas.
The predicted increase in fire intensity and the occurrence of the so-called mega-fires (San-Miguel-Ayanz et al., 2013), which usually evolve from surface to crown fires, makes it necessary to improve our information on canopy fuels. Assessing the potential transition from surface to crown fires is key to prevent crown fires. For this reason, our classification approach includes both surface and canopy fuel types for the forest fuel types. Crown fires are highly influenced by the characteristics of understorey and ladder fuels, and by wildfire intensity (e.g. flame length), which is information that is not available at the European scale. However, we encourage others to complement the proposed fuel types with additional data for the regions where data may be available. This would require determining the vertical continuity of fuels, in addition to identifying the existence (or not) of a gap between the understorey and the canopy fuels strata. This might be subject of future work. The rest of the fuel types are disaggregated based on their fuel bed depth, with the thresholds suggested by experts. However, fuel mapping is still a challenge because of the high spatiotemporal variability in fuels and the need to generalise the great variety of vegetation conditions related to fire behaviour.
Regarding European fuel mapping, the combination of existing land cover and biogeographic datasets and bioclimatic models facilitated the generation of the fuel type dataset, with some of these data being specifically developed for the European conditions (i.e. Europe's biogeographic regions map, the CLC map). Nevertheless, the input datasets are a generalisation of the complex reality, with their own uncertainties and errors, which are transferred to the final European fuel map. In fact, the errors in the final fuel type dataset are similar to or even lower than those found in the main input land cover map used to obtain the fuel categories.
Estimating shrubland and grassland fuel bed depth was challenging. To the best of our knowledge, there are no large-scale, reliable datasets in Europe on these variables, which is limiting to our purposes. However, despite the models chosen to estimate surface fuel bed depth not being specifically developed for European areas, the biogeographical similarity of the regions for which they were developed, compared to European conditions, make them acceptable for our purposes. Almost all of the shrubland fuels belong to the arid/semi-arid regime, which justifies the selection of a bioclimatic model developed for an arid/semi-arid area. To avoid unrealistic estimations, we constrained the outputs to the range 0–6 m for the shrublands and to >0 m for the grasslands, while no maximum cut-off threshold was applied to the grassland category, as the obtained maximum value (1 m) was considered reasonable. In addition, the distribution of shrubland and grassland pixels led to considering the bioclimatic models to be adequate. The histogram for shrubland fuel bed depth showed the continuity of the input variable (precipitation). The histogram for the grassland fuel bed depth had an aggregated structure due to the input productivity data by biogeographic region. Obviously, the direct measurement of the shrubland or grassland fuel bed depth would be more desirable. In this sense, airborne lidar should provide a better estimation, but it is not yet available for the whole European territory, and its temporal resolution may be insufficient to capture the dynamics of these covers.
Concerning the final European fuel map (1 km spatial resolution), only 20 out of the 24 possible first-level fuel types were mapped because the remainder did not cover a continuous large enough area to be represented at 1 km resolution. The herbaceous cropland and the closed needleleaf evergreen forests are the most extended fuel types in Europe, which is related to the land use activities of the European society and the natural distribution of vegetation species due to bioclimatic conditions (García-Martín et al., 2001). Also, the large extension of forest fuel types constitutes an increasing potential risk in light of the growing trends of land abandonment, particularly in remote areas; forests with a high surface fuel load can more easily turn into crown fires (Scott and Reinhardt, 2001; Weise and Wright, 2014), characterised by high intensity, and emit vast amounts of the stored carbon. Urban fuel types are the least represented in Europe, but they are the most dangerous from an economic, societal, and human health point of view (Bowman et al., 2011). Mapping urban fuel types represents an advance of the proposed classification system, as it allows the assessment of residential and non-natural fuels, which can, in turn, help in the identification of anthropic areas where fires can affect human settlements and lives.
Finally, the quantitative assessment of the European fuel map obtained a high overall accuracy of 88.40 %, with average commission errors of 37 % (highest for the nonfuel category and lowest for the forest fuel types) and average omission errors of 29 % (highest for the grassland and lowest for the urban fuel types). Although the obtained accuracy is higher than the one for our main information source, which was the Copernicus GLC map (Tsendbazar et al., 2020), and it surpassed the ideal 85 % minimum overall accuracy, not all fuel types presented the ideal ≥70 % accuracy (Thomlinson et al., 1999). The overall accuracy was higher than the one for the 2019 Copernicus GLC map over Europe (79.9 %), probably due to the validation approach. The confusion matrix is aligned with the confusion matrix of the 2015 global Copernicus GLC maps over Europe (Tsendbazar et al., 2020), when considering most similar categories. The errors in the Copernicus GLC map have been transferred to the European fuel map, as it was our main information source.
With similar accuracies to the 2015 Copernicus GLC map over Europe, forest fuel types present low omission and commission errors, although there is some confusion with shrubland, grassland, and cropland. The shrubland omission and commission errors (mostly confused by the Mediterranean sclerophyllous and xerophilic forest) are significant; however, our validation approach obtained 31 % and 2 % less, respectively, compared to the 2015 Copernicus GLC map. The grassland omission errors (mostly confused by herbaceous cropland) are 15 % higher than the ones for herbaceous vegetation in the 2015 Copernicus GLC map. In addition, grassland commission errors are 17 % lower than in the 2015 Copernicus GLC map. Croplands present higher (+7 % and 11 %) producer and user accuracies than the 2015 Copernicus GLC map, mostly confused with grassland, with the producer accuracy being higher than the user accuracy, as in the Copernicus GLC map. Wet and peat/semi-peat land omission errors are 3 % lower and commission errors are 11 % higher than in the 2015 Copernicus GLC map for herbaceous wetland, in agreement with the observed accuracy tendencies (Tsendbazar et al., 2021). Urban fuel types have the lowest omission error (0 %) and only 25 % commission errors. The nonfuel category errors are mostly referred to pixels over the coastline caused by the different spatial resolutions of the European fuel map and the LUCAS points. This also happens to the rest of the fuel types and is considered to be the main limitation of the validation method. Some validation errors are also caused by the different dates of the input sources and the validation data.
The quantitative assessment of all mapped FirEUrisk fuel types obtained a medium–high overall accuracy of 81.22 %, with average commission errors of 40 % (highest for the high grasslands and tree and shrubland wet and peat/semi-peat land fuel types and lowest for the herbaceous cropland fuel type) and average omission errors of 43 % (highest for the medium grassland fuel type and lowest for the urban continuous fabric fuel type). These results are higher than those of the Copernicus GLC map (Tsendbazar et al., 2020), but neither surpass the ideal 85 % minimum overall accuracy, nor do all fuel types have ≥70 % accuracy (Thomlinson et al., 1999). However, the visual assessment improved the validation method because it considered the entire 1 km2 pixels and not only the area of the LUCAS points. This method could only be applied to a subset of the validation points because of its temporal and human cost compared to the previous validation method. The results are similar to the confusion matrices of the FirEUrisk main fuel types and the Copernicus GLC map over Europe (Tsendbazar et al., 2020), although errors are higher and different due to the dissimilar validation methods and reference data, and confusion appears between fuel types belonging to the same main fuel type. Most errors are due to pixels with a mixed cover of fuel types and low quality of the reference data (unclear and blurred Google images and LUCAS photos and pixels not meeting all ideal conditions for validation – that was needed to have a representative sampling for every fuel type). Input and reference data temporal differences may also have affected the accuracy. The obtained errors present the typical pattern for land cover and vegetation classifications with remote sensing (used to develop the input data), dependent on the separability of the spectral signatures of the land types. This explains why errors are dominant for fuel types belonging to the same main fuel type instead of fuel types from different main fuel types.
Forest fuel types have acceptable accuracy, except for the closed mixed forest, which is highly confused with closed needleleaf evergreen forest. Many errors refer to the omission of open forest, assigned to the closed forest, as in the Copernicus GLC map over Europe (Tsendbazar et al., 2020). Shrubland and grassland fuel type errors are significant, mostly between fuel bed depth categories. Therefore, care must be taken with these results, as estimating fuel bed depth from photos is challenging, and fuel bed depth varies with time. These limitations especially affect grassland due to its low depth and rapid growth and the fact that high grassland is frequently cut. Thus, grassland fuel bed depth is very changeable, so we assume the European fuel map may only be accurate for some periods of the year. We validated the proposed fuel map considering the mean potential fuel bed depth. Moreover, short grassland is generally confused with the herbaceous cropland of fodder crops of agriculturally improved grasslands and temporary pasture such as legumes. Cropland fuel types are the most accurate, with no significant errors. Wet and peat/semi-peat land fuel types have moderate accuracy. The most important confusions are between the tree wet and peat/semi-peat land with other wet and peat/semi-peat land fuel types and between the shrubland wet and peat/semi-peat land with shrubland. The urban continuous fuel type has no omission errors, while some commission errors are in favour of the urban discontinuous fuel type in the outskirts of the residential areas of cities. The urban discontinuous fuel type presents a higher omission than commission errors, which is mostly omitted by cropland in agricultural rural areas. Similar to the confusion matrix for the main fuel types, both commission and omission errors for the nonfuel category are low and relate to mixed pixels.
The different levels of disaggregation of the proposed classification system, and the main fire behaviour characteristics of the diverse fuels, made the crosswalk challenging and did not allow us to assign a specific standard model to each FirEUrisk fuel type. Moreover, the FBFM standard fuel models (Scott and Burgan, 2005) were originally developed for the United States, so care must be taken when using the crosswalk in Europe (Santoni et al., 2011; Salis et al., 2016). From this point of view, our proposed approach can be improved in specific areas if customised information and data on given fuel types are available (Arca et al., 2007; Fernandes, 2009; Duguy Pedra et al., 2015; Kucuk et al., 2015; Ascoli et al., 2020). In other words, we propose a generic crosswalk scheme, but users are free to wisely choose or modify the best-fitting standard fuel models according to their study area and expertise or to use different parameters from the standard ones if they have better information for given study areas. Moreover, the main limitation of the crosswalk scheme relies on the reference to general bioclimatic regimes, which is not able to fully consider all inherent differences among European regions in terms of fuel characteristics, while moisture values can be spatially modified according to the specific status of each fuel type.
This work represents one of the first attempts to adopt a standardised fuel model mapping approach over Europe, similar to the National Fire Danger Rating fuel model products that have been available since the 1990s for the continental United States (see, for instance, https://www.wfas.net/index.php/nfdrs-fuel-model-static-maps-44, last access: 7 March 2023). Work is in progress to develop higher-resolution products over Europe that combine a set of remote sensing tools and data. This latter development at the European scale is highly complicated by the huge heterogeneity in the availability of high-quality and high-resolution ground and measured data, which vary a lot among and within the different regions.
The FirEUrisk fuel classification system can provide a number of insights and information for wildfire risk monitoring and assessment at the European scale, including fuel parameters, such as dead and live surface fuel load, the surface to area volume ratio, or surface fuel bed depth. This is mostly related to the identified fuel categories crosswalk to the FBFM system (Scott and Burgan, 2005), which is specifically designed for the above purpose. In fact, the parameters included in each FBFM model allow the characterisation of surface fuels and can serve as a baseline for surface wildfire spread and behaviour modelling. The full surface fuel set information needed to run fire propagation models can be extracted from the crosswalk to the FBFM and complemented with other canopy fuel parameters (such as crown base height or crown bulk density) and other necessary input data (e.g. weather conditions, topography, and ignitions) to run fire spread models (e.g. FlamMap, Finney, 2006; FARSITE, Finney, 2004), as embedded in FlamMap 6.2 (https://www.firelab.org/project/flammap, last access: 7 March 2023). This should be the subject of an extension of this paper and could be based on the calibration of models that estimate canopy fuel parameters using airborne and satellite lidar systems for which regional airborne lidar would be key to consider the heterogeneity of European fuels before using the global satellite lidar data for the continental scale.
The fuel map is also expected to provide estimations of fire-caused carbon emissions and pollution and estimations of biomass consumption. The Consume model (Prichard et al., 2006) could be used for this if a crosswalk to FCCS fuels is previously made, including the necessary fuel parameters such as the combustion percentage. In addition, the FirEUrisk fuel map would be useful for regions that do not have fuel cartography. The mapped fuel types and the fuel parameters obtained from the crosswalk to FBFM can serve as input for fire propagation models and help rate fire danger and risk conditions. It is also important to note that the maps of fuel parameters at the European scale are examples of what can be done, but the crosswalk is intended to be useful for areas where technologies and resources such as lidar data are not available.
Overall, we highlight that the main use of the map is providing a dataset able to rate fire danger and risk conditions across large geographic areas, while the application of wildfire spread models to very local scales or small areas may pose limitations in the quality of outputs due to the low resolution (1 km resolution) of the fuel input layer.
Finally, although it has been developed for European conditions, our methodology has the potential to be applied to other regions. The proposed fuel classification system could be used in several fire applications and adapted anywhere in the world to further extend the fuel subcategories wherever required. The classification of fuel types is dependent on existing land cover and biogeographic data, but it can also be directly estimated from satellite data, either at a coarse resolution for continental areas or at a higher resolution for smaller territories. The fuel parameterisation can also be based on other standard fuel models, such as the NFFL or the FCCS, but it can also rely on ground measurements or more detailed regional fuel characteristics. In any case, it is important to emphasise the need for estimating fuel parameters in order to use the fuel type products for quantitative estimations of fire risk, behaviour, and effects. This is a key aspect of the FirEUrisk project and a crucial point towards wildland fire prevention across the European Union.
The resulting European fuel map (circa 2019; 1 km spatial resolution) in one single-band categorical raster layer in a GeoTIFF format is publicly available at https://doi.org/10.21950/YABYCN (Aragoneses et al., 2022a), and a product user manual (PUM; Aragoneses et al., 2022b) is available from e-cienciaDatos (https://edatos.consorciomadrono.es/dataset.xhtml?persistentId=doi:10.21950/YABYCN, last access: 7 March 2023).
This paper, developed in the framework of the European FirEUrisk project, presents a new hierarchical fuel classification system for surface and canopy fuels adapted to the European conditions, in addition to methods to map those categories and assign them fuel parameters. The final European fuel map contains 20 fuel types, including both surface and canopy fuel types. The estimated overall accuracy was 88 % for the main fuel types and 81 % for all mapped fuel types. Finally, the paper shows an example of a crosswalk between the proposed fuel types and standard fuel models, in this case the Fire Behavior Fuel Models (FBFMs; Scott and Burgan, 2005), that provides a full set of surface fuel parameters useful for surface fire behaviour modelling. Our approach, based on expert knowledge, GIS, existing land cover datasets, biogeographic data, and bioclimatic modelling, could be readily applied to other regions.
The results of this study constitute the first step towards a risk-wise landscape and fuel mapping development across Europe, which will help in integrated, strategic, coherent, and comprehensive decision-making for fire risk prevention, assessment, and evaluation. The results have wide applicability because they meet the actual unfulfilled fuel mapping needs in Europe, including (1) the development of a fuel classification system specifically designed for European conditions, which allows us to not rely on external classifications that should be only applied to the regions for which they were developed, (2) enabling coordination, by integrating fuel mapping at different spatial scales and across European regions through a common fuel legend with hierarchical levels, (3) multipurpose use, such as prevention, propagation, behaviour, emissions, and suppression, (4) mapping fuel types not previously considered at European scale that are key for protecting people and the environment from the devastating effects of fires such as forest canopy fuels (key for crown and extreme fires), wet and peat/semi-peat land fuels (key for emissions), and urban fuels in the wildland–urban interface (key for human and socioeconomic safety), (5) the generation of an updated European-specific fuel map, compared to the EFFIS fuel map from year 2000 (European Forest Fire Information System, 2017), and (6) the preliminary surface fuel parameterisation for Europe that can be used for estimating fuel parameters whenever there is no suitable input data available. Overall, the existence of updated land cover datasets and bioclimatic models for the European territory is limiting, and work is still needed to parameterise canopy fuels. The results of this work are part of the new FirEUrisk integrated three-part perspective of fire risk, whose strategy is meant to shift the thinking of wildfire management by looking simultaneously at fire assessment, reduction, and adaptation from a common scheme.
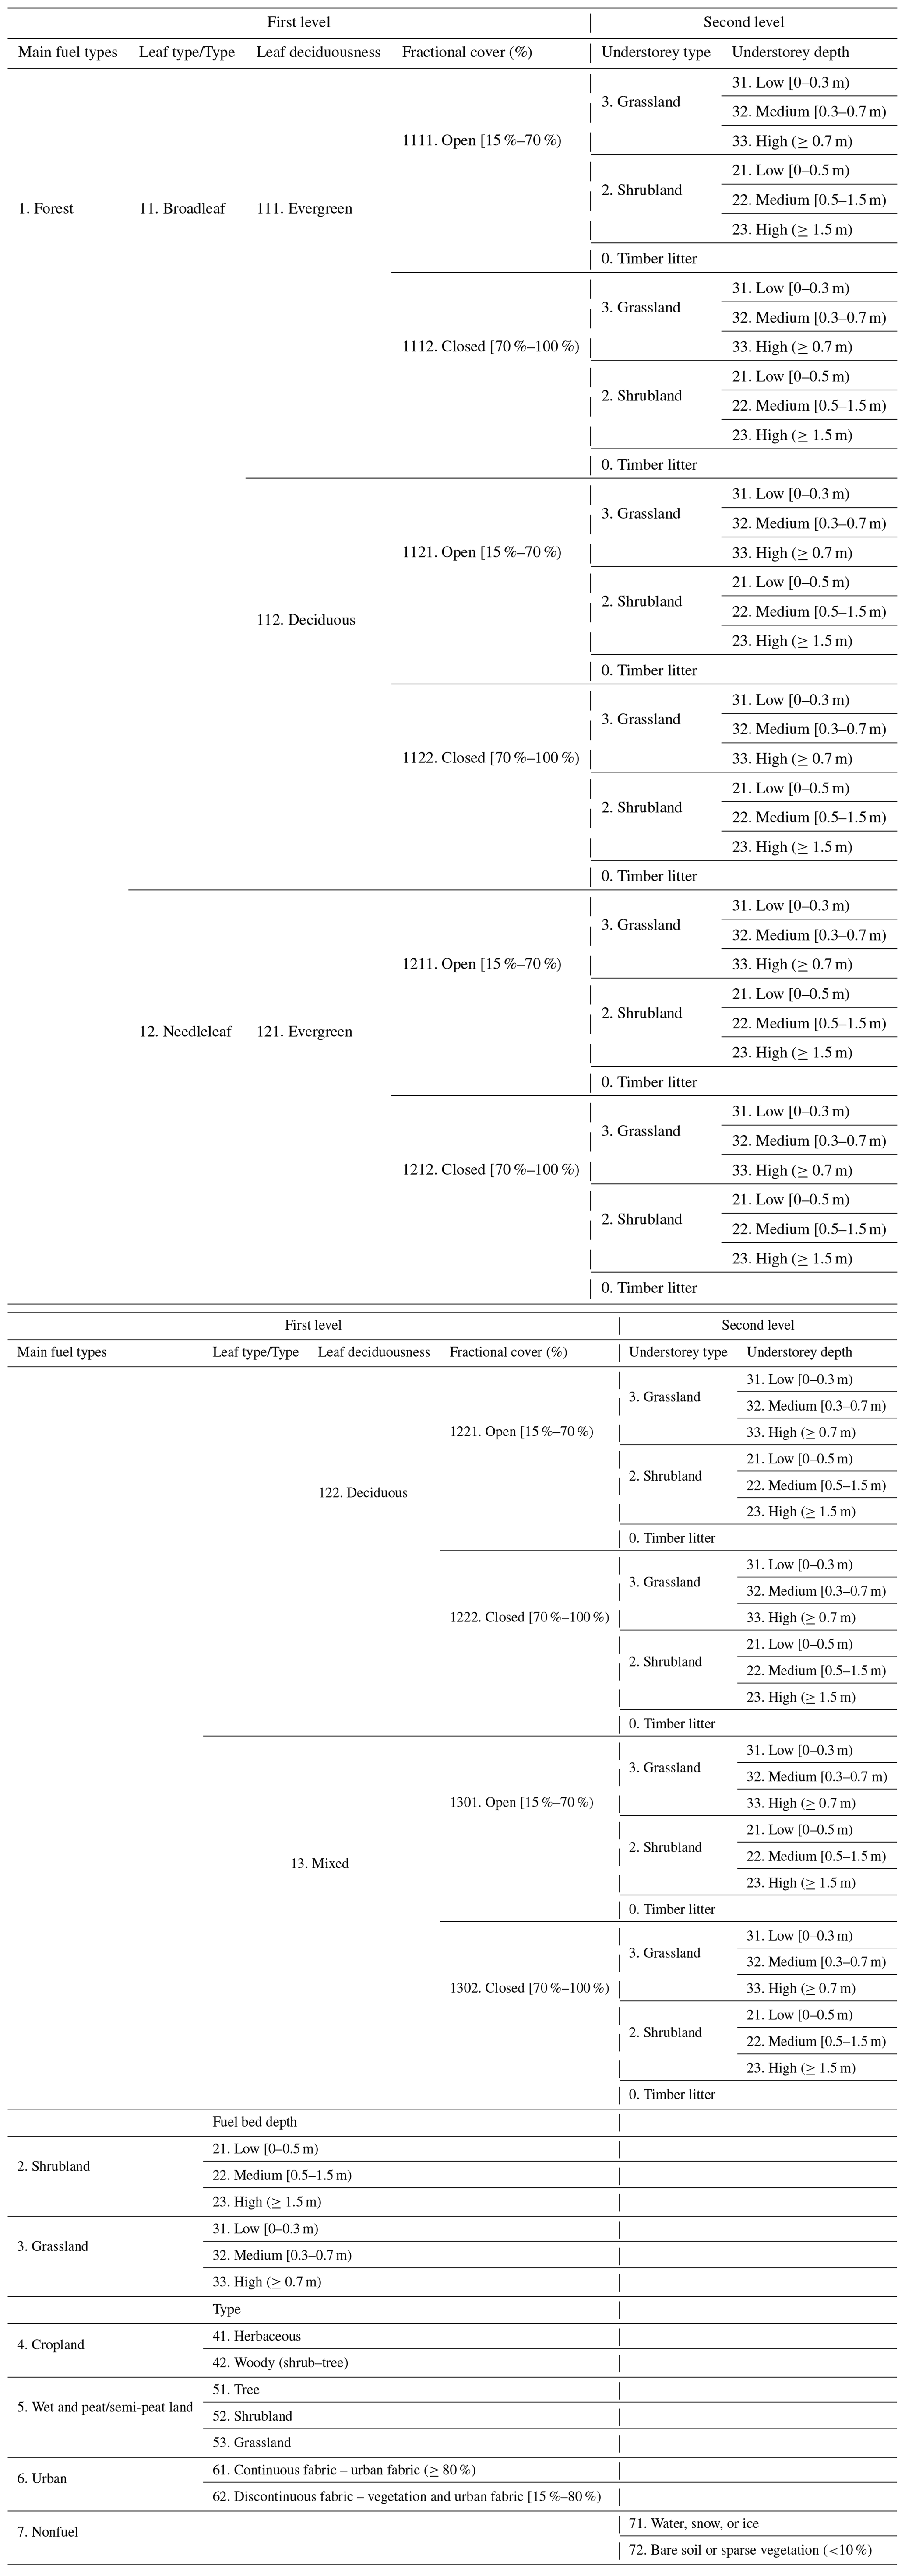
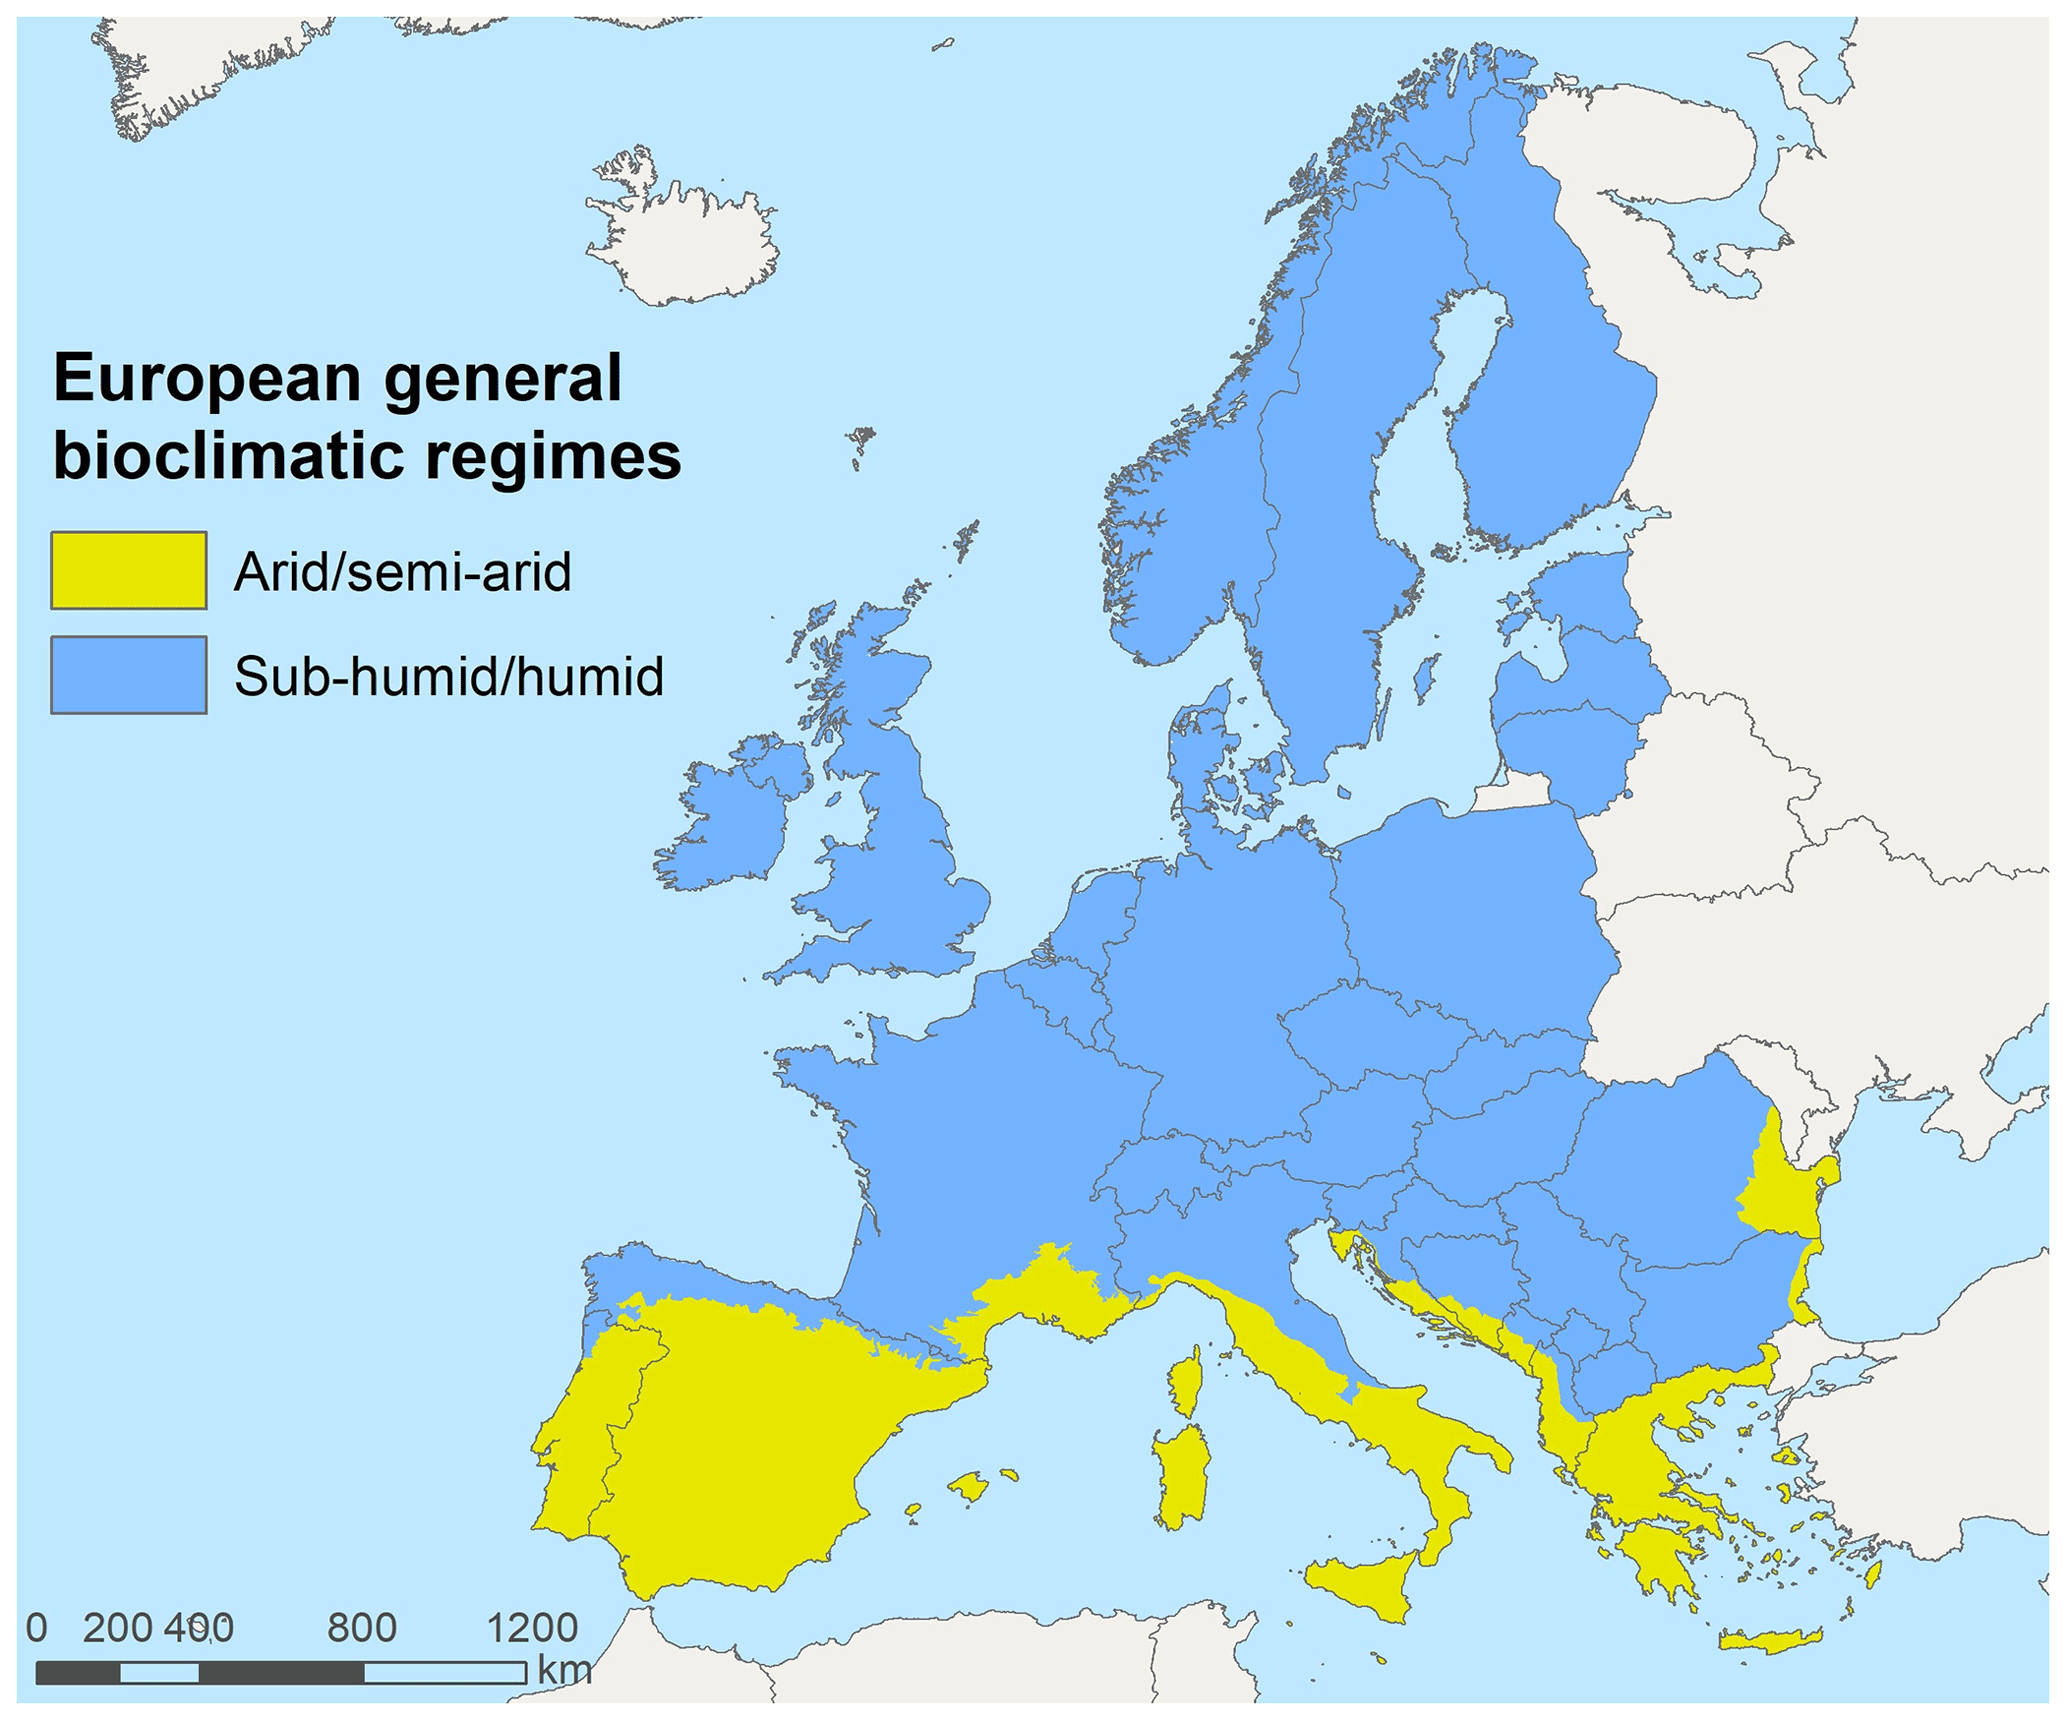
Figure B1Location of the arid/semi-arid and sub-humid/humid regimes over Europe.
Table B1Percentage of 1 km2 pixel groups with 1, 2, or >2 first-mode categories for the 3 × 3, 5 × 5, and 7 × 7 smoothing moving windows and without the window applied.
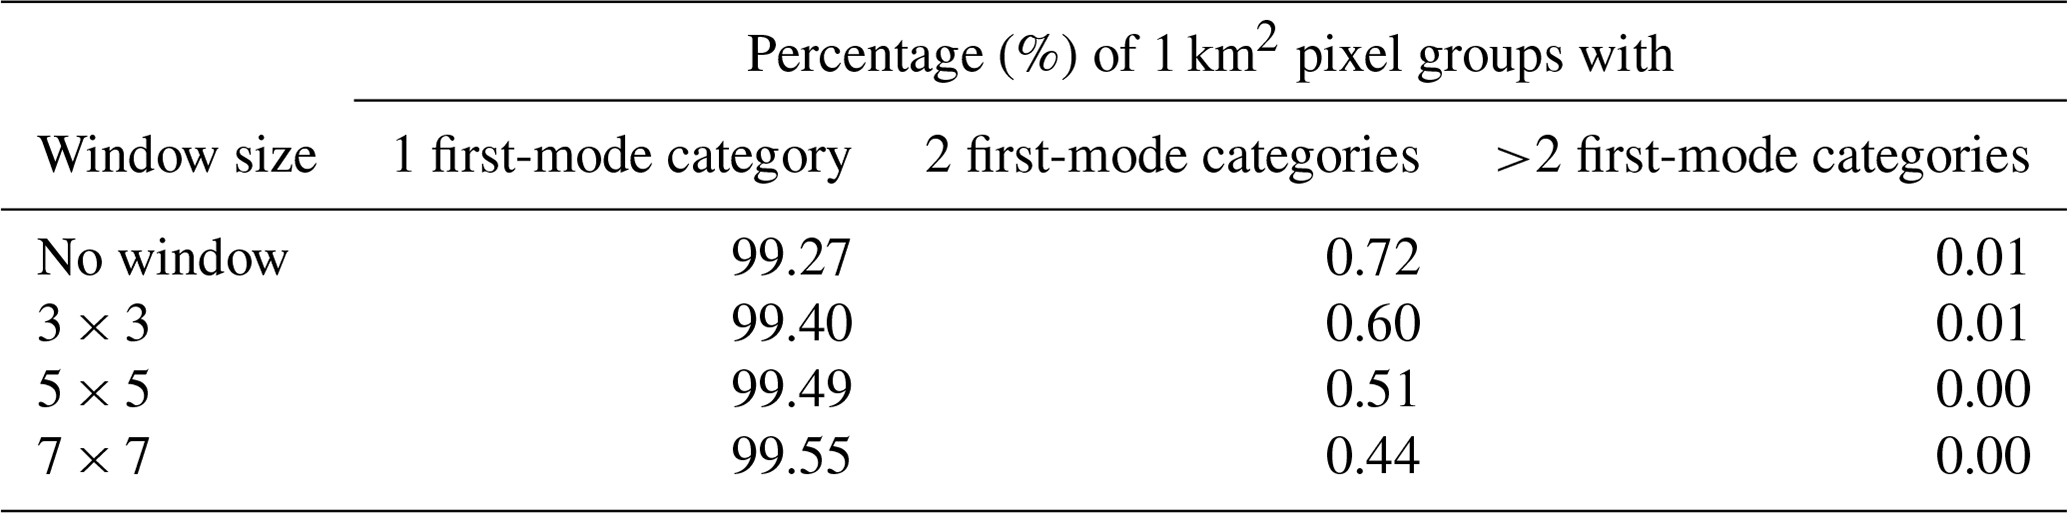
Table B2Area covered by every mapped FirEUrisk fuel type in Europe (1 km spatial resolution). See Table 1 for the fuel type code identification.
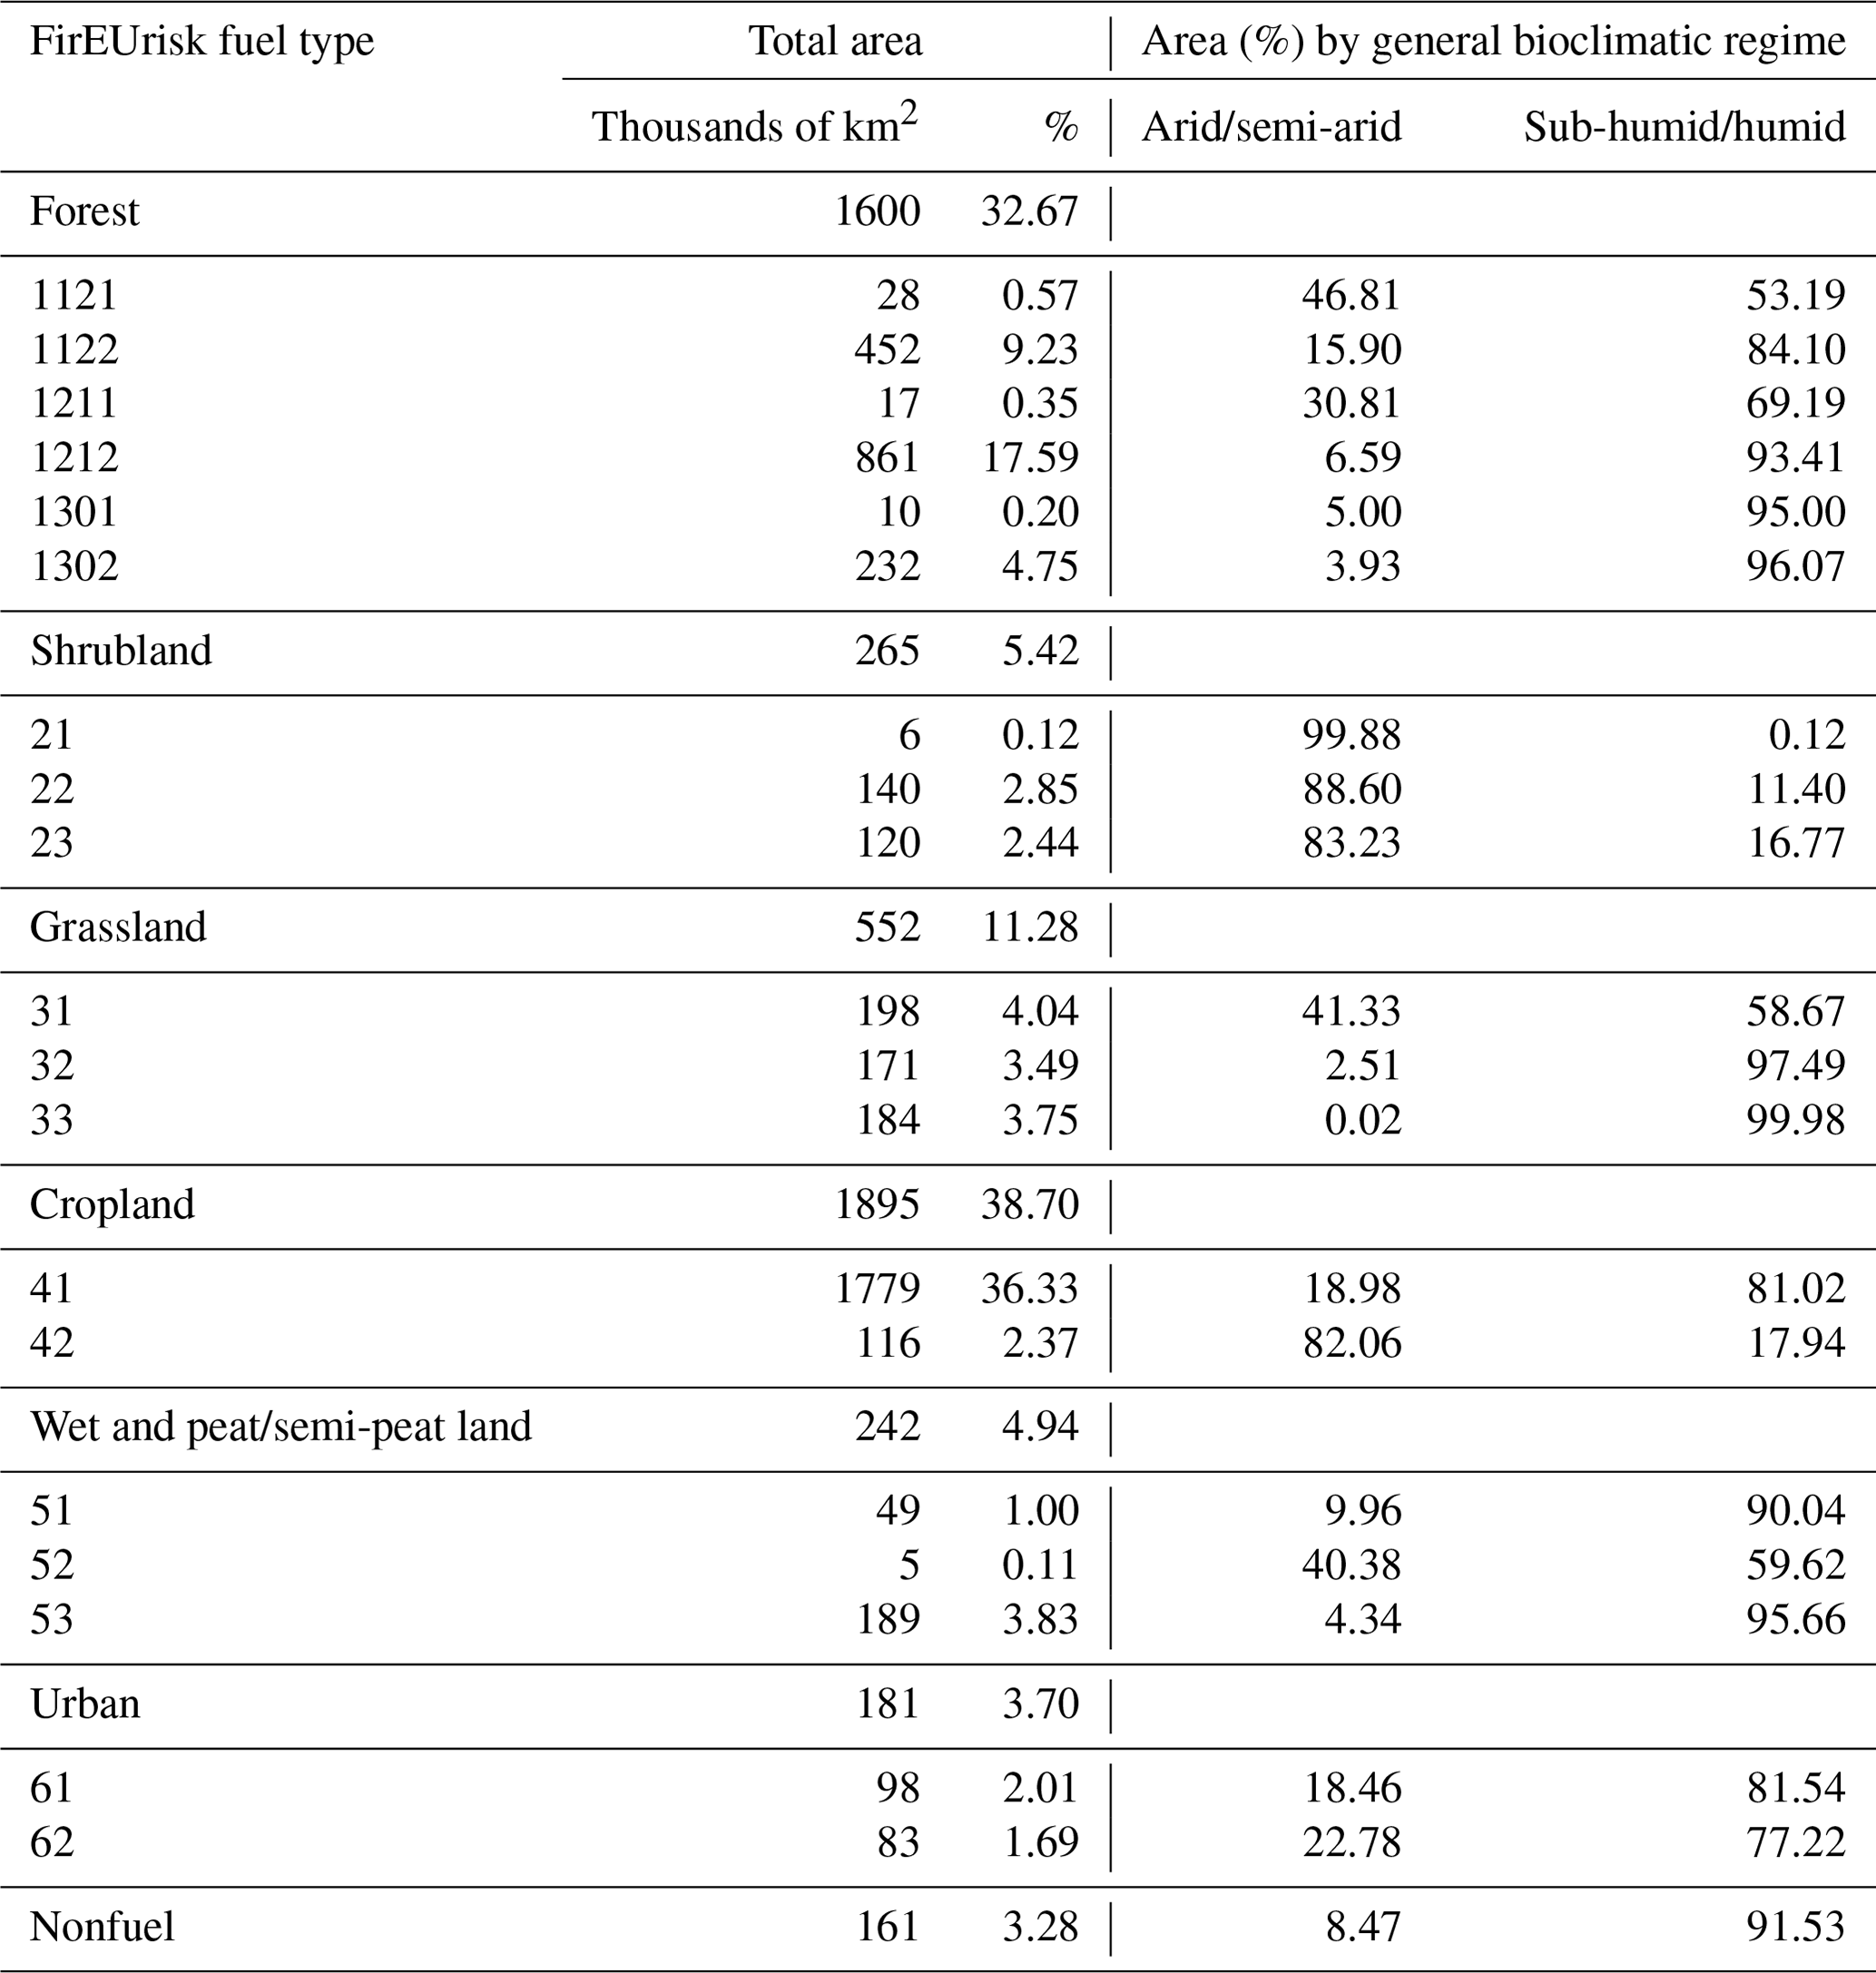
Table B3Confusion matrix for all mapped FirEUrisk fuel types. See Table 1 for the fuel type code identification.
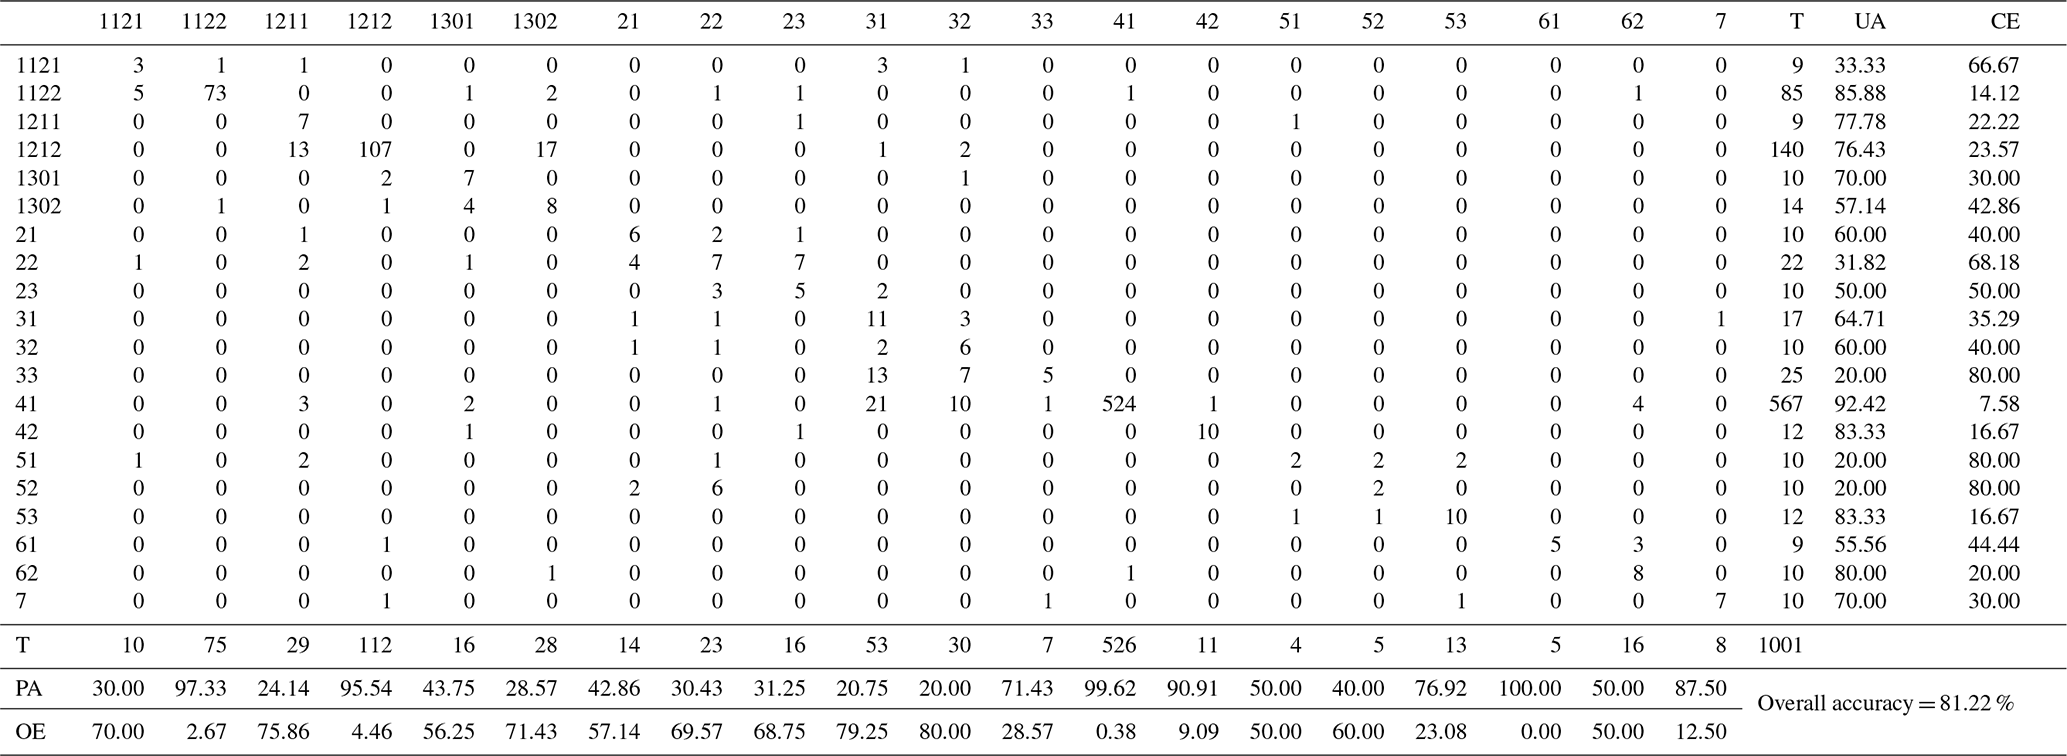
T is for the total, UA is for user accuracy (%), PA is for producer accuracy (%), CE is for commission error (%), and OE is for omission error (%).
Table C1Area covered by every FBFM fuel model in the European territory. See Table C2 in Appendix C for the fuel type descriptions and parameters.
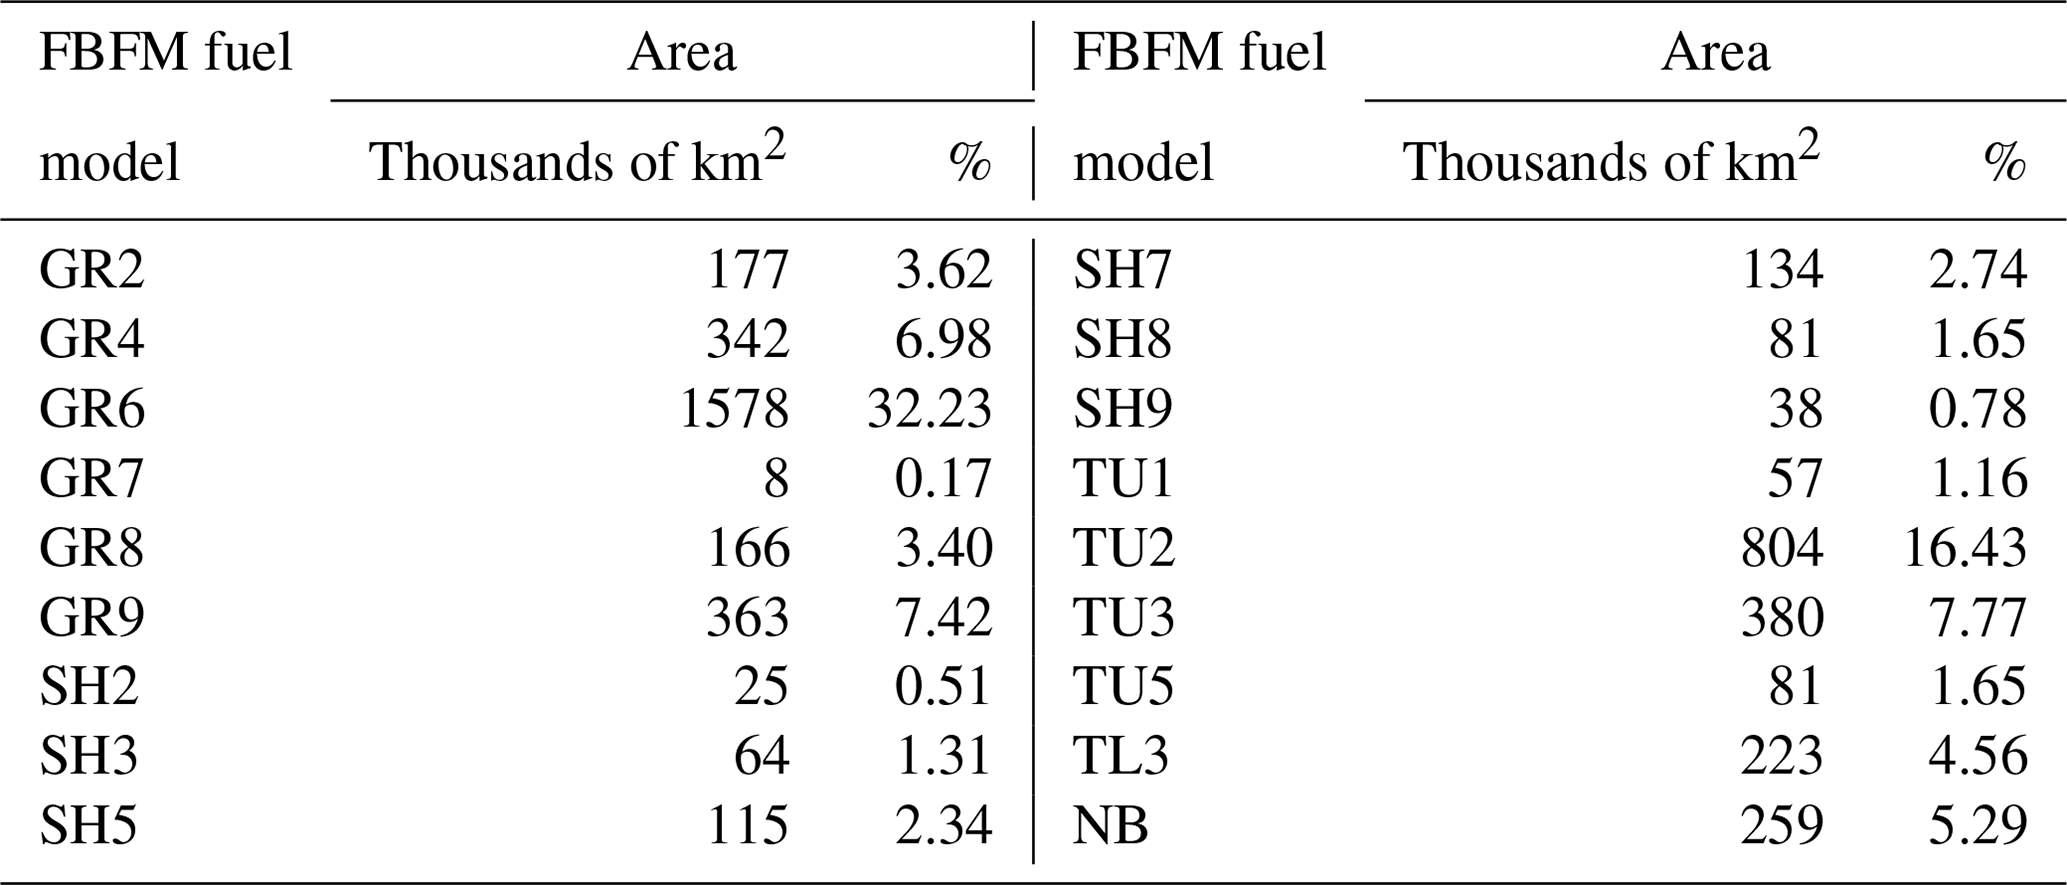
Table C2Parameters of the standard fuel models of FBFM (Scott and Burgan, 2005) used for the crosswalk to the first-level FirEUrisk fuel types.

EA, MG, MS, LMR, and EC conceptualised the paper and did the review and editing. EA, MG, and EC developed the methodology and gathered the resources. EA curated the data, conducted the formal analysis, conducted the investigation, used the software, validated and visualised the work, and wrote the draft. MG and EC supervised, while EC administered the project and acquired the funding. All authors have read and agreed to the published version of the paper.
The contact author has declared that none of the authors has any competing interests.
This research reflects only the authors' view, and the European
Commission is not responsible for any use that may be made of the
information it contains.
Publisher’s note: Copernicus Publications remains neutral with regard to jurisdictional claims in published maps and institutional affiliations.
We would like to thank the members of the FirEUrisk consortium for their comments on the FirEUrisk fuel classification system. We would also like to thank María Clara Ochoa and Suresh Babu Kukkala for their help with the product's validation. We are also grateful to the anonymous reviewers for their helpful comments.
Elena Aragoneses has been supported by the University of Alcalá, through a FPI doctoral fellowship, and by the Spanish Ministry of Universities, through a FPU doctoral fellowship (grant no. FPU21/01678). The FirEUrisk project 2021–2024 (https://fireurisk.eu/, last access: 7 March 2023) has been granted funding from the European Union's Horizon 2020 Research and Innovation programme (grant no. 101003890).
This paper was edited by Christopher Neigh and reviewed by three anonymous referees.
Alcasena, F., Ager, A., Page, Y. Le, Bessa, P., Loureiro, C., and Oliveira, T.: Assessing Wildfire Exposure to Communities and Protected Areas in Portugal, Fire, 4, 82, https://doi.org/10.3390/FIRE4040082, 2021.
Ali, A., Xu, M.-S., Zhao, Y.-T., Zhang, Q.-Q., Zhou, L.-L., Yang, X.-D., and Yan, E.-R.: Allometric biomass equations for shrub and small tree species in subtropical China, Silva Fenn., 49, 1275, https://doi.org/10.14214/sf.1275, 2015.
Alonso-Benito, A., Arroyo, L. A., Arbelo, M., Hernández-Leal, P., and González-Calvo, A.: Pixel and object-based classification approaches for mapping forest fuel types in Tenerife Island from ASTER data, Int. J. Wildl. Fire, 22, 306–317, https://doi.org/10.1071/WF11068, 2013.
Alvarado, S. T., Andela, N., Silva, T. S. F., and Archibald, S.: Thresholds of fire response to moisture and fuel load differ between tropical savannas and grasslands across continents, Glob. Ecol. Biogeogr., 29, 331–344, https://doi.org/10.1111/GEB.13034, 2020.
Anderson, H.: Aids to determining fuel models for estimating fire behavior, US Department of Agriculture, Forest Service, Intermountain Forest and Range Experiment Station, Washington, DC, USA, 26 pp., https://www.fs.usda.gov/rm/pubs_int/int_gtr122.pdf (last access: 10 March 2023), 1982.
Aragoneses, E. and Chuvieco, E.: Generation and Mapping of Fuel Types for Fire Risk Assessment, Fire, 4, 59, https://doi.org/10.3390/FIRE4030059, 2021.
Aragoneses, E., García, M., and Chuvieco, E.: FirEUrisk_Europe_fuel_map: European fuel map at 1 km resolution, e-cienciaDatos [data set], https://doi.org/10.21950/YABYCN, 2022a.
Aragoneses, E., Chuvieco, E., and García, M.: Product User Manual for the FirEurisk European fuel map, 1–9 pp., e-cienciaDatos, https://edatos.consorciomadrono.es/dataset.xhtml?persistentId=doi:10.21950/YABYCN (last access: 7 March 2023), 2022b.
Arca, B., Duce, P., Laconi, M., Pellizzaro, G., Salis, M., and Spano, D.: Evaluation of FARSITE simulator in Mediterranean maquis, Int. J. Wildl. Fire, 16, 563–572, https://doi.org/10.1071/WF06070, 2007.
Arroyo, L. A., Healey, S. P., Cohen, W. B., Cocero, D., and Manzanera, J. A.: Using object-oriented classification and high-resolution imagery to map fuel types in a Mediterranean region, J. Geophys. Res.-Biogeo., 111, G04S04, https://doi.org/10.1029/2005JG000120, 2006.
Arroyo, L. A., Pascual, C., and Manzanera, J. A.: Fire models and methods to map fuel types: The role of remote sensing, For. Ecol. Manage., 256, 1239–1252, https://doi.org/10.1016/j.foreco.2008.06.048, 2008.
Ascoli, D., Vacchiano, G., Scarpa, C., Arca, B., Barbati, A., Battipaglia, G., Elia, M., Esposito, A., Garfì, V., Lovreglio, R., Mairota, P., Marchetti, M., Marchi, E., Meytre, S., Ottaviano, M., Pellizzaro, G., Rizzolo, R., Sallustio, L., Salis, M., Sirca, C., Valese, E., Ventura, A., and Bacciu, V.: Harmonized dataset of surface fuels under Alpine, temperate and Mediterranean conditions in Italy. A synthesis supporting fire management, iForest, 13, 513–522, https://doi.org/10.3832/IFOR3587-013, 2020.
Batistoti, J., Marcato, J., Ítavo, L., Matsubara, E., Gomes, E., Oliveira, B., Souza, M., Siqueira, H., Filho, G. S., Akiyama, T., Gonçalves, W., Liesenberg, V., Li, J., and Dias, A.: Estimating Pasture Biomass and Canopy Height in Brazilian Savanna Using UAV Photogrammetry, Remote Sens., 11, 2447, https://doi.org/10.3390/RS11202447, 2019.
Bohlman, G. N., Underwood, E. C., and Safford, H. D.: Estimating Biomass in California's Chaparral and Coastal Sage Scrub Shrublands, Madroño, 65, 28–46, https://doi.org/10.3120/0024-9637-65.1.28, 2018.
Bonazountas, M., Astyakopoulos, A., Martirano, G., Sebastian, A., De la Fuente, D., Ribeiro, L. M., Viegas, D. X., Eftychidis, G., Gitas, I., and Toukiloglou, P.: LIFE ArcFUEL: Mediterranean fuel-type maps geodatabase for wildland & forest fire safety, in: Advances in forest fire research, edited by: Viegas, D. X., Imprensa da Universidade de Coimbra, Coimbra, Portugal, 1723–1735, https://doi.org/10.14195/978-989-26-0884-6_189, 2014.
Bond, W. J., Woodward, F. I., and Midgley, G. F.: The global distribution of ecosystems in a world without fire, New Phytol., 165, 525–538, https://doi.org/10.1111/j.1469-8137.2004.01252.x, 2005.
Boschetti, L., Roy, D. P., Giglio, L., Huang, H., Zubkova, M., and Humber, M. L.: Global validation of the collection 6 MODIS burned area product, Remote Sens. Environ., 235, 111490, https://doi.org/10.1016/J.RSE.2019.111490, 2019.
Bowman, D., Williamson, G., Yebra, M., Lizundia-Loiola, J., Pettinari, M. L., Shah, S., Bradstock, R., and Chuvieco, E.: Wildfires: Australia needs national monitoring agency, Nature, 584, 188–191, https://doi.org/10.1038/d41586-020-02306-4, 2020.
Bowman, D. M. J. S., Balch, J. K., Artaxo, P., Bond, W. J., Carlson, J. M., Cochrane, M. A., D'Antonio, C. M., DeFries, R. S., Doyle, J. C., Harrison, S. P., Johnston, F. H., Keeley, J. E., Krawchuk, M. A., Kull, C. A., Marston, J. B., Moritz, M. A., Prentice, I. C., Roos, C. I., Scott, A. C., Swetnam, T. W., Van Der Werf, G. R., and Pyne, S. J.: Fire in the earth system, Science, 324, 481–484, https://doi.org/10.1126/science.1163886, 2009.
Bowman, D. M. J. S., Balch, J., Artaxo, P., Bond, W. J., Cochrane, M. A., D'Antonio, C. M., DeFries, R., Johnston, F. H., Keeley, J. E., Krawchuk, M. A., Kull, C. A., Mack, M., Moritz, M. A., Pyne, S., Roos, C. I., Scott, A. C., Sodhi, N. S., and Swetnam, T. W.: The human dimension of fire regimes on Earth, J. Biogeogr., 38, 2223–2236, https://doi.org/10.1111/j.1365-2699.2011.02595.x, 2011.
Bowman, D. M. J. S., Williamson, G. J., Abatzoglou, J. T., Kolden, C. A., Cochrane, M. A., and Smith, A. M. S.: Human exposure and sensitivity to globally extreme wildfire events, Nat. Ecol. Evol., 1, 0058, https://doi.org/10.1038/s41559-016-0058, 2017.
Buchhorn, M., Smets, B., Bertels, L., De Roo, B., Lesiv, M., Tsendbazar, N.-E., Herold, M., and Fritz, S.: Copernicus Global Land Service: Land Cover 100m: collection 3: epoch 2019: Globe, Zenodo [data set], https://doi.org/10.5281/zenodo.3939050, 2020.
Chen, J. and Ban, S. L.: Open access to earth land-cover map, Nature, 514, 434–434, 2014.
Copernicus Climate Change Services: Land cover classification gridded maps from 1992 to present derived from satellite observations, European Comission [data set], https://doi.org/10.24381/cds.006f2c9a (last access: 17 January 2022), 2020.
Countryman, C. M.: The fire environment concept, USDA Forest Service, Pacific Southwest Range and Experiment Station, Berkeley, California, USA, 12 pp., 1972.
Crabbe, R. A., Lamb, D. W., Edwards, C., Andersson, K., and Schneider, D.: A preliminary investigation of the potential of Sentinel-1 radar to estimate pasture biomass in a grazed pasture landscape, Remote Sens., 11, 872, https://doi.org/10.3390/RS11070872, 2019.
Defourny, P., Lamarche, C., Marissiaux, Q., Carsten, B., Martin, B., and Grit, K.: Product User Guide and Specification, ICDR Land Cover 2016–2020, Copernicus Climate Change Service, 1–37, D5.3.1_PUGS_ICDR_LC_v2.1.x_PRODUCTS_v1.1, https://datastore.copernicus-climate.eu/documents/satellite-land-cover/D5.3.1_PUGS_ICDR_LC_v2.1.x_PRODUCTS_v1.1.pdf (last access: 10 March 2023), 2021.
Domingo, D., de la Riva, J., Lamelas, M. T., García-Martín, A., Ibarra, P., Echeverría, M., and Hoffrén, R.: Fuel Type Classification Using Airborne Laser Scanning and Sentinel 2 Data in Mediterranean Forest Affected by Wildfires, Remote Sens., 12, 3660, https://doi.org/10.3390/rs12213660, 2020.
Duc, H. N., Chang, L. T. C., Azzi, M., and Jiang, N.: Smoke aerosols dispersion and transport from the 2013 New South Wales (Australia) bushfires, Environ. Monit. Assess., 190, 428, https://doi.org/10.1007/S10661-018-6810-4, 2018.
Duguy Pedra, B., Godoy Puertas, J., and Fuentes Lopez, L.: Developing Allometric Volume-Biomass Equations to Support Fuel Characterization in North-Eastern Spain, Ecol. Mediterr., 41, 15–24, https://doi.org/10.3406/ECMED.2015.1239, 2015.
EFFIS: Real-time updated Burnt Areas database, EFFIS Data and services [data set], https://effis.jrc.ec.europa.eu/applications/data-and-services (last access: 27 January 2022), 2021.
European Commission: Prometheus, S.V. Project. Management Techniques for Optimisation of Suppression and Minimization of Wildfire Effect, European Commission Contract Number ENV4-CT98-0716, 1999.
European Environment Agency: Biogeographical regions, European Environment Agency [data set], https://www.eea.europa.eu/data-and-maps/data/biogeographical-regions-europe-3 (last access: 14 January 2022), 2016.
European Forest Fire Information System (EFFIS): European Fuel Map based on JRC Contract Number 384347 on the “Development of a European Fuel Map”, European Commission [data set], https://effis.jrc.ec.europa.eu/applications/data-and-services (last access: 21 May 2021), 2017.
European Union Copernicus Land Monitoring Service: Corine Land Cover (CLC) 2018, Version 2020_20u1, European Environment Agency (EEA) [data set], https://land.copernicus.eu/pan-european/corine-land-cover/clc2018 (last access: 17 January 2022), 2018.
European Union Copernicus Land Monitoring Service: Copernicus Land Monitoring Service, User Manual, European Environment Agency (EEA), Copenhagen K., Denmark, 1–129, https://land.copernicus.eu/user-corner/technical-library/clc-product-user-manual (last access: 10 March 2023), 2021.
Eurostat: Land cover/use statistics – Overview, Eurostat, https://ec.europa.eu/eurostat/web/lucas/overview, last access: 2 February 2022a.
Eurostat: LUCAS micro data 2018, Eurostat, [data set], https://ec.europa.eu/eurostat/web/lucas/data/primary-data/2018, last access: 2 February 2022b.
Fernandes, P. M.: Combining forest structure data and fuel modelling to classify fire hazard in Portugal, Ann. For. Sci., 66, 415, https://doi.org/10.1051/forest/2009013, 2009.
Fick, S. E. and Hijmans, R. J.: WorldClim 2: new 1 km spatial resolution climate surfaces for global land areas, Int. J. Climatol., 37, 4302–4315, https://doi.org/10.1002/joc.5086, 2017.
Finney, M. A.: FARSITE: Fire Area Simulator – Model development and evaluation, USDA Forest Service, Rocky Mountain Research Station, 52 pp., https://www.firelab.org/project/farsite (last access: 24 May 2022), 2004.
Finney, M. A.: An Overview of FlamMap Fire Modeling Capabilities, in: Fuels Management-How to Measure Success,, Conference Proceedings, Portland, OR, 28–30 March 2006, edited by: Andrews, P. L. and Butler, B. W., Proceedings RMRS-P-41, Fort Collins, CO, U.S. Department of Agriculture, Forest Service, Rocky Mountain Research Station, 213–220, 2006.
Food and Agriculture Organization: Land Cover Classification System, Appendix A. Glossary of classifiers, modifiers and attributes, FAO, 2000, https://www.fao.org/3/x0596e/X0596e01n.htm, last access: 19 January 2022.
Forestry Canada Fire Danger Group: Development and structure of the canadian fire behaviour prediction system, Forestry Canada, Inf. Repor, Ottawa, 63 pp., 1992.
Franquesa, M., Lizundia-Loiola, J., Stehman, S. V., and Chuvieco, E.: Using long temporal reference units to assess the spatial accuracy of global satellite-derived burned area products, Remote Sens. Environ., 269, 112823, https://doi.org/10.1016/J.RSE.2021.112823, 2022.
García, M., Riaño, D., Chuvieco, E., Salas, J., and Danson, F. M.: Multispectral and LiDAR data fusion for fuel type mapping using Support Vector Machine and decision rules, Remote Sens. Environ., 115, 1369–1379, https://doi.org/10.1016/j.rse.2011.01.017, 2011.
García-Martín, M., Quintas-Soriano, C., Torralba, M., Wolpert, F., and Plieninger, T.: Landscape Change in Europe, in: Sustainable Land Management in a European Context, edited by: Weith, T., Barkmann, T., Gaasch, N., Rogga, S., Strauß, C., and Zscheischle, J., Human-Environment Interactions, 8, Springer, Bloomington, IN, USA, 17–37, https://doi.org/10.1007/978-3-030-50841-8_2, 2001.
Giglio, L., Boschetti, L., Roy, D. P., Humber, M. L., and Justice, C. O.: The Collection 6 MODIS burned area mapping algorithm and product, Remote Sens. Environ., 217, 72–85, https://doi.org/10.1016/j.rse.2018.08.005, 2018.
Global Disaster Alert and Coordination system: Forest Fire (2287 ha) in Germany, Czech Republic, 24 July 2022, https://www.gdacs.org/report.aspx?eventtype=WF&eventid=1007792, last access: 18 November 2022.
González-Olabarria, J. R., Rodríguez, F., Fernández-Landa, A., and Mola-Yudego, B.: Mapping fire risk in the Model Forest of Urbión (Spain) based on airborne LiDAR measurements, For. Ecol. Manage., 282, 149–156, https://doi.org/10.1016/j.foreco.2012.06.056, 2012.
Gray, J. T. and Schlesinger, W. H.: Biomass, production, and litterfall in the coastal sage scrub of Southern California, Am. J. Bot., 68, 24–33, https://doi.org/10.1002/J.1537-2197.1981.TB06352.X, 1981.
International Peatland Society: What are peatlands?, International Peatland Society, https://peatlands.org/peatlands/what-are-peatlands/ (last access: 19 January 2022), 2021.
IPCC: Climate Change 2022: Impacts, Adaptation, and Vulnerability. Contribution of Working Group II to the Sixth Assessment Report of the Intergovernmental Panel on Climate Change, edited by: Pörtner, H.-O., Roberts, D. C., Tignor, M., Poloczanska, E. S., Mintenbeck, K., Alegría, A., Craig, M., Langsdorf, S., Löschke, S., Möller, V., Okem, A., and Rama, B., Cambridge University Press, 3676 pp., in press, https://doi.org/10.1017/9781009325844, 2022.
Jones, M. W., Abatzoglou, J. T., Veraverbeke, S., Andela, N., Lasslop, G., Forkel, M., Smith, A. J. P., Burton, C., Betts, R. A., van der Werf, G. R., Sitch, S., Canadell, J. G., Santín, C., Kolden, C., Doerr, S. H., and Le Quéré, C.: Global and regional trends and drivers of fire under climate change, Rev. Geophys., 60, e2020RG000726, https://doi.org/10.1029/2020RG000726, 2022.
Keane, R. E. and Reeves, M.: Use of Expert Knowledge to Develop Fuel Maps for Wildland Fire Management, in: Expert Knowledge and Its Application in Landscape Ecology, edited by: Perera, A., Ashton Drew, C., and Johnson, C., Springer Science+Business Media, New York Dordrecht Heidelberg London, 211–228, https://doi.org/10.1007/978-1-4614-1034-8_11, 2012.
Keane, R. E., Burgan, R., and van Wagtendonk, J.: Mapping wildland fuels for fire management across multiple scales: Integrating remote sensing, GIS, and biophysical modeling, Int. J. Wildl. Fire, 10, 301–319, https://doi.org/10.1071/WF01028, 2001.
Keeley, J. E. and Keeley, S. C.: Energy Allocation Patterns of a Sprouting and a Nonsprouting Species of Arctostaphylos in the California Chaparral, Am. Midl. Nat., 98, 1–10, https://doi.org/10.2307/2424710, 1977.
Kosztra, B., Büttner, G., Stephan, H., and Arnold, G.: Updated CLC illustrated nomenclature guidelines, European Topic Centre on Urban, land and soil systems: ETC/ULS, Wien, Austria, 1–126, https://land.copernicus.eu/user-corner/technical-library/corine-land-cover-nomenclature-guidelines/docs/pdf/CLC2018_Nomenclature_illustrated_guide_20190510.pdf (last access: 10 March 2023), 2019.
Koutsias, N. and Karteris, M.: Classification analyses of vegetation for delineating forest fire fuel complexes in a Mediterranean test site using satellite remote sensing and GIS, Int. J. Remote Sens., 24, 3093–3104, https://doi.org/10.1080/0143116021000021152, 2003.
Kucuk, O., Bilgili, E., and Fernandes, P. M.: Fuel modelling and potential fire behavior in Turkey, Šumarski List, 11–12, 553–560, https://hrcak.srce.hr/157019 (last access: 10 March 2023), 2015.
Lizundia-Loiola, J., Otón, G., Ramo, R., and Chuvieco, E.: A spatio-temporal active-fire clustering approach for global burned area mapping at 250 m from MODIS data, Remote Sens. Environ., 236, 111493, https://doi.org/10.1016/j.rse.2019.111493, 2020.
Mallinis, G., Mitsopoulos, I. D., Dimitrakopoulos, A. P., Gitas, I. Z., and Karteris, M.: Local-scale fuel-type mapping and fire behavior prediction by employing high-resolution satellite imagery, IEEE J. Sel. Top. Appl. Earth Obs. Remote Sens., 1, 230–239, https://doi.org/10.1109/JSTARS.2008.2011298, 2008.
Marconcini, M., Metz-Marconcini, A., Üreyen, S., Palacios-Lopez, D., Hanke, W., Bachofer, F., Zeidler, J., Esch, T., Gorelick, N., Kakarla, A., Paganini, M., and Strano, E.: Outlining where humans live, the World Settlement Footprint 2015, Sci. Data, 7, 242, https://doi.org/10.1038/s41597-020-00580-5, 2020.
Marino, E., Ranz, P., Tomé, J. L., Noriega, M. Á., Esteban, J., and Madrigal, J.: Generation of high-resolution fuel model maps from discrete airborne laser scanner and Landsat-8 OLI: A low-cost and highly updated methodology for large areas, Remote Sens. Environ., 187, 267–280, https://doi.org/10.1016/j.rse.2016.10.020, 2016.
Metzger, M. J., Bunce, R. G. H., Jongman, R. H. G., Mücher, C. A., and Watkins, J. W.: A climatic stratification of the environment of Europe, Glob. Ecol. Biogeogr., 14, 549–563, https://doi.org/10.1111/j.1466-822X.2005.00190.x, 2005.
Michez, A., Lejeune, P., Bauwens, S., Lalaina Herinaina, A. A., Blaise, Y., Muñoz, E. C., Lebeau, F., and Bindelle, J.: Mapping and monitoring of biomass and grazing in pasture with an unmanned aerial system, Remote Sens., 11, 476, https://doi.org/10.3390/RS11050473, 2019.
Mutlu, M., Popescu, S. C., Stripling, C., and Spencer, T.: Mapping surface fuel models using lidar and multispectral data fusion for fire behavior, Remote Sens. Environ., 112, 274–285, https://doi.org/10.1016/j.rse.2007.05.005, 2008.
Neal, E.: Climate in Temperate Grasslands, Sciencing, https://sciencing.com/climate-temperate-grasslands-8038155.html (last access: 18 January 2022), 2021.
Nunez, C.: Grasslands, explained, National Geographic Magazine, https://www.nationalgeographic.com/environment/article/grasslands (last access: 18 January 2022), 2019.
Ottmar, R. D., Sandberg, D. V., Riccardi, C. L., and Prichard, S. J.: An overview of the fuel characteristic classification system – quantifying, classifying, and creating fuelbeds for resource planning, Can. J. For. Res., 37, 2383–2393, 2007.
Palaiologou, P., Kalabokidis, K., and Kyriakidis, P.: Forest mapping by geoinformatics for landscape fire behaviour modelling in coastal forests, Greece, Int. J. Remote Sens., 34, 4466–4490, https://doi.org/10.1080/01431161.2013.779399, 2013.
Paradis, M., Lévesque, E., and Boudreau, S.: Greater effect of increasing shrub height on winter versus summer soil temperature, Environ. Res. Lett., 11, 085005, https://doi.org/10.1088/1748-9326/11/8/085005, 2016.
Pausas, J. G. and Keeley, J. E.: A burning story: The role of fire in the history of life, Bioscience, 59, 593–601, https://doi.org/10.1525/bio.2009.59.7.10, 2009.
Pettinari, M. L. and Chuvieco, E.: Cartografía de combustible y potenciales de incendio en el continente Africano utilizando FCCS, Rev. Teledetec., 2015, 1–10, https://doi.org/10.4995/raet.2015.2302, 2015.
Pettinari, M. L. and Chuvieco, E.: Generation of a global fuel data set using the Fuel Characteristic Classification System, Biogeosciences, 13, 2061–2076, https://doi.org/10.5194/bg-13-2061-2016, 2016.
Pettinari, M. L., Ottmar, R. D., Prichard, S. J., Andreu, A. G., and Chuvieco, E.: Development and mapping of fuel characteristics and associated fire potentials for South America, Int. J. Wildl. Fire, 23, 643–654, https://doi.org/10.1071/WF12137, 2014.
Prichard, S. J., Ottmar, R. D., and Anderson, G. K.: Consume 3.0 User's Guide, Pacific Wildland Fire Sciences Laboratory. USDA Forest Service. Pacific Northwest Research Station, Seattle, Washington, 236 pp., https://www.fs.usda.gov/pnw/fera/research/smoke/consume/consume30_users_guide.pdf (last access: 10 March 2023), 2006.
Pyne, S. J.: Introduction to wildland fire. Fire management in the United States, 6th edn., edited by: Pyne, S. J., John Wiley, ISBN 10 047109658X, ISBN 13 9780471096580, 1984.
Radloff, F. G. T. and Mucina, L.: A quick and robust method for biomass estimation in structurally diverse vegetation, J. Veg. Sci., 18, 719–724, https://doi.org/10.1111/J.1654-1103.2007.TB02586.X, 2007.
Riaño, D., Meier, E., Allgöwer, B., Chuvieco, E., and Ustin, S. L.: Modeling airborne laser scanning data for the spatial generation of critical forest parameters in fire behavior modeling, Remote Sens. Environ., 86, 177–186, https://doi.org/10.1016/S0034-4257(03)00098-1, 2003.
Rothermel, R. C.: A mathematical model for predicting fire spread in wildland fuels, INT-RP-115, Intermountain Forest and Range Experiment Station, Ogden, UT, USDA Forest Service, 73 pp., https://www.fs.usda.gov/rm/pubs_int/int_rp115.pdf (last access: 10 March 2023), 1972.
Roulet, N. T.: Peatlands, carbon storage, greenhouse gases, and the kyoto protocol: Prospects and significance for Canada, Wetlands, 20, 605–615, https://doi.org/10.1672/0277-5212(2000)020[0605:PCSGGA]2.0.CO;2, 2000.
Saglam, B., Küçük, Ö., Bilgili, E., and Durmaz, B. D.: Estimating Fuel Biomass of Some Shrub Species (Maquis) in Turkey, Turkish J. Agric. For., 32, 349–356, 2008.
Salis, M., Arca, B., Alcasena, F., Arianoutsou, M., Bacciu, V., Duce, P., Duguy, B., Koutsias, N., Mallinis, G., Mitsopoulos, I., Moreno, J. M., Pérez, J. R., Urbieta, I. R., Xystrakis, F., Zavala, G., and Spano, D.: Predicting wildfire spread and behaviour in Mediterranean landscapes, Int. J. Wildl. Fire, 25, 1015–1032, https://doi.org/10.1071/WF15081, 2016.
San-Miguel-Ayanz, J., Moreno, J. M., and Camia, A.: Analysis of large fires in European Mediterranean landscapes: Lessons learned and perspectives, For. Ecol. Manage., 294, 11–22, https://doi.org/10.1016/j.foreco.2012.10.050, 2013.
San-Miguel-Ayanz, J., Durrant, T., Boca, R., Maianti, P., Libertà, G., Artés Vivancos, T., Jacome Felix Oom, D., Branco, A., De Rigo, D., Ferrari, D., Pfeiffer, H., Grecchi, R., Nuijten, D., and Leray, T.: Forest Fires in Europe, Middle East and North Africa 2019, Publications Office of the European Union, Luxembourg, 1–162 pp., https://doi.org/10.2760/468688, 2020.
San-Miguel-Ayanz, J., Durrant, T., Boca, R., Maianti, P., Libertà, G., Artés-Vivancos, T., Oom, D., Branco, A., De Rigo, D., Ferrari, D., Pfeiffer, H., Grecchi, R., Nuijten, D., Onida, M., and Löffler, P.: Forest Fires in Europe, Middle East and North Africa 2020, Publications Office of the European Union, Luxembourg, 1–172, ISBN 978-92-76-42350-8, https://doi.org/10.2760/059331, 2021.
San-Miguel-Ayanz, J., Durrant, T., Boca, R., Maianti, P., Libertá, G., Artés-Vivancos, T., Oom, D., Branco, A., de Rigo, D., Ferrari, D., Pfeiffer, H., Grecchi, R., and Nuijten, D.: Advance Report on Forest Fires in Europe, Middle East and North Africa 2021, Publications Office of the European Union, Luxembourg, https://doi.org/10.2760/039729, 2022.
Santoni, P. A., Filippi, J. B., Balbi, J. H., and Bosseur, F.: Wildland fire behaviour case studies and fuel models for landscape-scale fire modeling, J. Combust., 2011, 613424, https://doi.org/10.1155/2011/613424, 2011.
Schlesinger, W. H. and Gill, D. S.: Biomass, Production, and Changes in the Availability of Light, Water, and Nutrients During the Development of Pure Stands of the Chaparral Shrub, Ceanothus Megacarpus, After Fire, Ecology, 61, 781–789, https://doi.org/10.2307/1936748, 1980.
Scott, J. and Burgan, R.: Standard fire behavior fuel models: a comprehensive set for use with Rothermel's surface fire spread model, US Department of Agriculture, Forest Service, Rocky Mountain Research Station, https://www.resolutionmineeis.us/sites/default/files/references/scott-burgan-2005.pdf (last access: 10 March 2023), 2005.
Scott, J. and Reinhardt, E.: Assessing crown fire potential by linking models of surface and crown fire behavior, Fort Collins, CO, US Department of Agriculture, Forest Service, Rocky Mountain Research Station, 59 pp., https://doi.org/10.2737/RMRS-RP-29, 2001.
Shakesby, R. A.: Post-wildfire soil erosion in the Mediterranean: Review and future research directions, Earth-Sci. Rev., 105, 71–100, https://doi.org/10.1016/J.EARSCIREV.2011.01.001, 2011.
Shoshany, M. and Karnibad, L.: Mapping shrubland biomass along Mediterranean climatic gradients: The synergy of rainfall-based and NDVI-based models, Int. J. Remote Sens., 32, 9497–9508, https://doi.org/10.1080/01431161.2011.562255, 2011.
Shoshany, M. and Karnibad, L.: Remote sensing of shrubland drying in the South-East Mediterranean, 1995–2010: Water-use-efficiency-based mapping of biomass change, Remote Sens., 7, 2283–2301, https://doi.org/10.3390/RS70302283, 2015.
Smit, H. J., Metzger, M. J., and Ewert, F.: Spatial distribution of grassland productivity and land use in Europe, Agric. Syst., 98, 208–219, https://doi.org/10.1016/j.agsy.2008.07.004, 2008.
Smith, H. G., Sheridan, G. J., Lane, P. N. J., Nyman, P., and Haydon, S.: Wildfire effects on water quality in forest catchments: A review with implications for water supply, J. Hydrol., 396, 170–192, https://doi.org/10.1016/J.JHYDROL.2010.10.043, 2011.
Stefanidou, A., Gitas, I. Z., and Katagis, T.: A national fuel type mapping method improvement using sentinel-2 satellite data, Geocarto Int., 1, 1022–1042, https://doi.org/10.1080/10106049.2020.1756460, 2020.
Thomlinson, J. R., Bolstad, P. V., and Cohen, W. B.: Coordinating methodologies for scaling landcover classifications from site-specific to global: Steps toward validating global map products, Remote Sens. Environ., 70, 16–28, https://doi.org/10.1016/S0034-4257(99)00055-3, 1999.
Thonicke, K., Venevsky, S., Sitch, S., and Cramer, W.: The role of fire disturbance for global vegetation dynamics: coupling fire into a Dynamic Global Vegetation Model, Glob. Ecol. Biogeogr., 10, 661–677, https://doi.org/10.1046/J.1466-822X.2001.00175.X, 2001.
Toukiloglou, P., Eftychidis, G., Gitas, I., and Tompoulidou, M.: ArcFuel methodology for mapping forest fuels in Europe, Proc. SPIE 8795, First International Conference on Remote Sensing and Geoinformation of the Environment (RSCy2013), 87951J (5 August 2013), https://doi.org/10.1117/12.2028213, 2013.
Tsendbazar, N.-E., Tarko, A., Li, L., Herold, M., Lesiv, M., Fritz, S., and Maus, V.: Copernicus Global Land Service: Land Cover 100m: version 3 Globe 2015–2019: Validation Report, Zenodo, Geneve, Switzerland, 1–84, https://doi.org/10.5281/zenodo.3606370, 2020.
Tsendbazar, N., Herold, M., Li, L., Tarko, A., de Bruin, S., Masiliunas, D., Lesiv, M., Fritz, S., Buchhorn, M., Smets, B., Van De Kerchove, R., and Duerauer, M.: Towards operational validation of annual global land cover maps, Remote Sens. Environ., 266, 112686, https://doi.org/10.1016/j.rse.2021.112686, 2021.
UNESCO: International classification and mapping of vegetation, the United Nations Educational, Scientific and Cultural Organization, Genève, Switzerland, 1–102, ISBN: 92-3-001046-4, 1973.
van Wees, D., van der Werf, G. R., Randerson, J. T., Andela, N., Chen, Y., and Morton, D. C.: The role of fire in global forest loss dynamics, Glob. Change Biol., 27, 2377–2391, https://doi.org/10.1111/GCB.15591, 2021.
Weise, D. R. and Wright, C. S.: Wildland fire emissions, carbon and climate: Characterizing wildland fuels, For. Ecol. Manag., 317, 26–40, https://doi.org/10.1016/J.FORECO.2013.02.037, 2014.
van der Werf, G. R., Randerson, J. T., Giglio, L., van Leeuwen, T. T., Chen, Y., Rogers, B. M., Mu, M., van Marle, M. J. E., Morton, D. C., Collatz, G. J., Yokelson, R. J., and Kasibhatla, P. S.: Global fire emissions estimates during 1997–2016, Earth Syst. Sci. Data, 9, 697–720, https://doi.org/10.5194/essd-9-697-2017, 2017.
Zepner, L., Karrasch, P., Wiemann, F., and Bernard, L.: ClimateCharts.net – an interactive climate analysis web platform, Int. J. Digit. Earth, 14, 338–356, https://doi.org/10.1080/17538947.2020.1829112, 2020.
Zhang, H., Sun, Y., Chang, L., Qin, Y., Chen, J., Qin, Y., Du, J., Yi, S., and Wang, Y.: Estimation of grassland canopy height and aboveground biomass at the quadrat scale using unmanned aerial vehicle, Remote Sens., 10, 851, https://doi.org/10.3390/rs10060851, 2018.
Zhang, X., Guan, T., Zhou, J., Cai, W., Gao, N., Du, H., Jiang, L., Lai, L., and Zheng, Y.: Community Characteristics and Leaf Stoichiometric Traits of Desert Ecosystems Regulated by Precipitation and Soil in an Arid Area of China, Int. J. Environ. Res. Public Health, 15, 109, https://doi.org/10.3390/IJERPH15010109, 2018.
Zheng, B., Ciais, P., Chevallier, F., Chuvieco, E., Chen, Y., and Yang, H.: Increasing forest fire emissions despite the decline in global burned area, Sci. Adv., 7, 39, https://doi.org/10.1126/sciadv.abh2646, 2021.
- Abstract
- Introduction
- Design of the FirEUrisk hierarchical fuel classification system
- The European fuel map
- Fuel parameterisation
- Discussion
- Data availability
- Conclusions
- Appendix A
- Appendix B
- Appendix C
- Author contributions
- Competing interests
- Disclaimer
- Acknowledgements
- Financial support
- Review statement
- References