the Creative Commons Attribution 4.0 License.
the Creative Commons Attribution 4.0 License.
 | 17 Mar 2023
Valgarður: a database of the petrophysical, mineralogical, and chemical properties of Icelandic rocks
Samuel W. Scott
Léa Lévy
Cari Covell
Hjalti Franzson
Benoit Gibert
Ágúst Valfells
Juliet Newson
Julia Frolova
Egill Júlíusson
María Sigríður Guðjónsdóttir
The Valgarður database is a compilation of data describing the physical and geochemical properties of Icelandic rocks. The dataset comprises 1166 samples obtained from fossil and active geothermal systems as well as from relatively fresh volcanic rocks erupted in subaerial or subaqueous environments. The database includes petrophysical properties (connected and total porosity, grain density, permeability, electrical resistivity, acoustic velocities, rock strength, and thermal conductivity) as well as mineralogical and geochemical data obtained by point counting, X-ray fluorescence (XRF), quantitative X-ray diffraction (XRD), and cation exchange capacity (CEC) analyses. The database may be accessed at https://doi.org/10.5281/zenodo.6980231 (Scott et al., 2022a). We present the database and use it to characterize the relationship between lithology, alteration, and petrophysical properties. The motivation behind this database is to (i) aid in the interpretation of geophysical data, including uncertainty estimations; (ii) facilitate the parameterization of numerical reservoir models; and (iii) improve the understanding of the relationship between rock type, hydrothermal alteration, and petrophysical properties.
- Article
(6896 KB) - Full-text XML
- BibTeX
- EndNote


The physical properties of igneous and volcanic rocks exert a first-order control on a wide range of geological processes. Rock properties such as porosity and permeability reflect magmatic degassing, eruptive conditions, and environmental conditions related to tectonics, alteration, exhumation, and weathering (Petford, 2003; Ceryan et al., 2008; Pola et al., 2012, 2014; Schön, 2015; Colombier et al., 2017; Villeneuve et al., 2019). Variability in the distribution of pore space, fractures, and minerals strongly influences the susceptibility of rock to hydrothermal alteration, which can produce strong changes in mechanical and physical properties (Browne, 1978; Thompson, 1997; Saripalli et al., 2001; Dobson et al., 2003; Cox, 2005; Franzson et al., 2008; Frolova et al., 2014; Siratovich et al., 2014; Wyering et al., 2014; Sanchez-Alfaro et al., 2016; Heap et al., 2017a; Mordensky et al., 2018; Cant et al., 2018; Navelot et al., 2018; Heap et al., 2020a, 2022a; Nicolas et al., 2020; Weydt et al., 2022). Due to the natural heterogeneity in rock properties, constraining the quantitative relationships between different petrophysical properties and inferring the underlying causes of variability may require extensive petrophysical and mineralogical databases amenable to statistical analysis (Aladejare and Wang, 2017; Asem and Gardoni, 2021). In recent years, a growing number of databases providing detailed petrophysical (Bär et al., 2020; Weinert et al., 2021; Weydt et al., 2021; Heap and Violay, 2021) and geochemical (Gard et al., 2019; Cole et al., 2022; Harðardóttir et al., 2022) data have been published. Such data can be used to build an understanding of volcanic eruption risks (Heap et al., 2015, 2021, 2022b), geothermal resources (Siratovich et al., 2014; Heap et al., 2017b, 2020a; Scott et al., 2022a), surface deformation (Heap et al., 2020b), silicate weathering (Cole et al., 2022), and seismicity (Heap et al., 2015, 2022b; Meller and Ledésert, 2017; Heap and Violay, 2021).
Basalt is the most common rock type exposed on the surface of the Earth if the area of the ocean floor is included. Owing to the high reactivity of basaltic rocks during surface weathering and water–rock interaction (Gíslason and Eugster, 1987; Stefánsson and Gíslason, 2001; Wolff-Boenisch et al., 2006), basalt plays a major role in the global carbon cycle (Dessert et al., 2003). Accordingly, basaltic rocks are the main target rocks for carbon sequestration efforts involving natural mineral carbonation (Snæbjörnsdóttir et al., 2020). However, compared with sedimentary rocks, which constitute the major source rocks for fossil fuels, and granitic rocks, which comprise much of the continental crust, the petrophysical properties of basaltic rocks are less well characterized (Heap and Violay, 2021).
Iceland, which is dominantly composed of basalt because of its location astride the Mid-Atlantic Ridge, hosts a large number (>30) of active volcanic systems and associated geothermal systems (Arnórsson, 1995). With continued spreading of the mid-ocean ridge, volcanic systems migrate out of the zone of active volcanism and undergo exhumation and erosion (Walker, 1963; Böðvarsson and Walker, 1964; Pálmason, 1980), exposing altered rocks and intrusive heat sources of so-called “fossil” geothermal systems at the surface (Friðleifsson, 1983b, 1984; Burchardt and Gudmundsson, 2009; Liotta et al., 2020). As a result of hydrothermal alteration at elevated temperatures, these rocks may show complete replacement of primary minerals by secondary alteration minerals (e.g., Franzson et al., 2008).
Iceland's geology has been intensively studied. However, publicly accessible datasets that provide petrophysical, geochemical, and petrographic data for a given sample set and additionally describe field relations are rare. Studies performed by Orkustofnun (the National Energy Authority) and Iceland GeoSurvey (ÍSOR) between 1970 and 2010 resulted in an extensive dataset consisting of approximately 500 samples analyzed for total and connected porosity, permeability, chemical composition, and petrographic characteristics, which was first released in the Valgarður1 database (Orkustofnun, 2018). This dataset has been useful in elucidating the interrelationship between porosity and permeability (Sigurdsson and Stefansson, 1994; Sigurdsson et al., 2000; Stefansson et al., 1997) as well as the relationship of these physical properties to the degree of hydrothermal alteration (Gudmundsson et al., 1995; Franzson et al., 2001, 2008). These data have also been used to constrain the prior rock property distributions assumed in Bayesian geophysical inversions (Scott et al., 2019) and numerical reservoir models (Scott et al., 2022b). Here, we introduce an updated and expanded version of the database. The goal of this contribution is to ensure that these data remain accessible to future generations of geoscientists and reservoir engineers. In addition to helping constrain numerical models and geophysical inversions, these data can be used to better understand the interrelationship between lithology, hydrothermal alteration, and petrophysics.
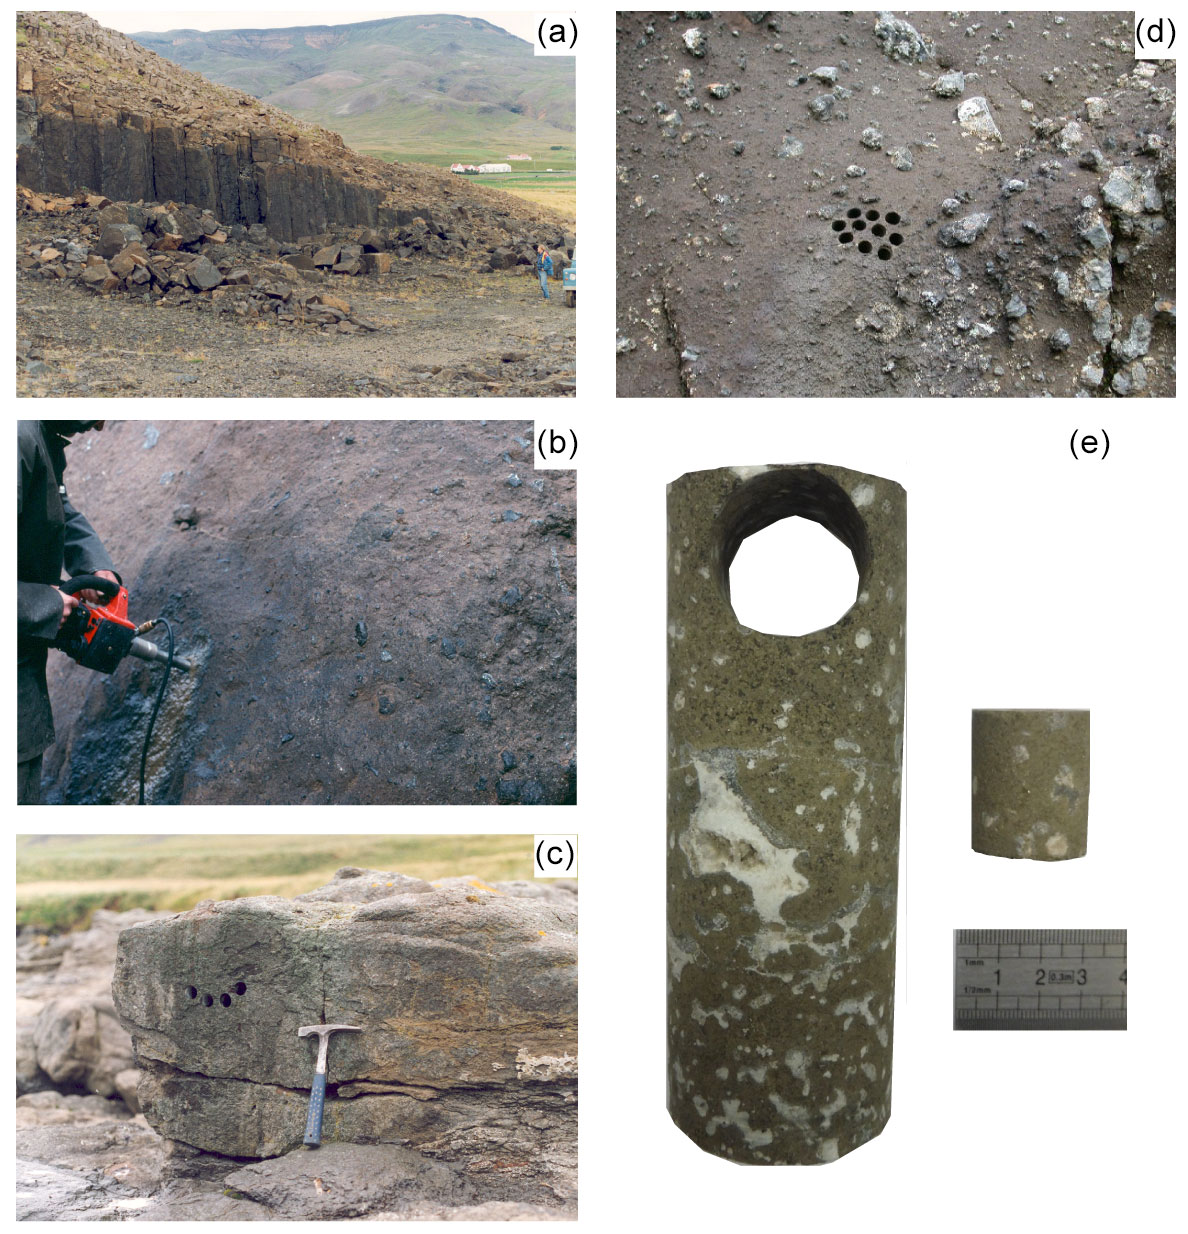
Figure 1Photographs of sample collection: (a) basaltic intrusion (dolerite) located on in a quarry on the coast of Hvalfjörður (samples H-90 and H-91); (b) hyaloclastite tuff located in Námagill (sample G-24); (c) basaltic lava flow located in Kúludalsá, to the south of Akrafjall (sample H-72); (d) hyaloclastite tuff breccia, showing embedded pillow basalt fragments (sample 170803-09). Panel (e) presents a spot core drilled into larger core obtained from 131 m depth in borehole KH-1 in Krafla (sample L22); the rock is a lava flow altered to smectite–zeolite facies, with vesicles filled mainly with quartz, zeolites, and calcite.
Valgarður is a publicly accessible database containing petrophysical as well as chemical and mineralogical analyses of Icelandic rocks. Although many studies have investigated the effect of elevated temperature and pressure on the petrophysical properties of Icelandic rocks (e.g., Vinciguerra et al., 2005; Jaya et al., 2010; Kristínsdóttir et al., 2010; Milsch et al., 2010; Adelinet et al., 2010, 2013; Grab et al., 2015; Eggertsson et al., 2020a, b; Nono et al., 2020; Kummerow et al., 2020; Weaver et al., 2020; Heap and Violay, 2021), we currently restrict the database to measurements under near-ambient conditions in order to facilitate comparison between the different studies and ensure consistency among the reported data.
Sample collection involves drilling a ∼2.5 cm diameter plug of variable length into a surface outcrop or section of core (Fig. 1). Variability in the sample collection process and analytical methods is to be expected given the long period over which the underlying data comprising the database were collected. During the assembly of the database, we sought to ensure that the results of the different studies were reported in a consistent manner. As different studies used different methods to analyze given petrophysical properties, each data point is accompanied by a description of the methodology or the origin of the data.
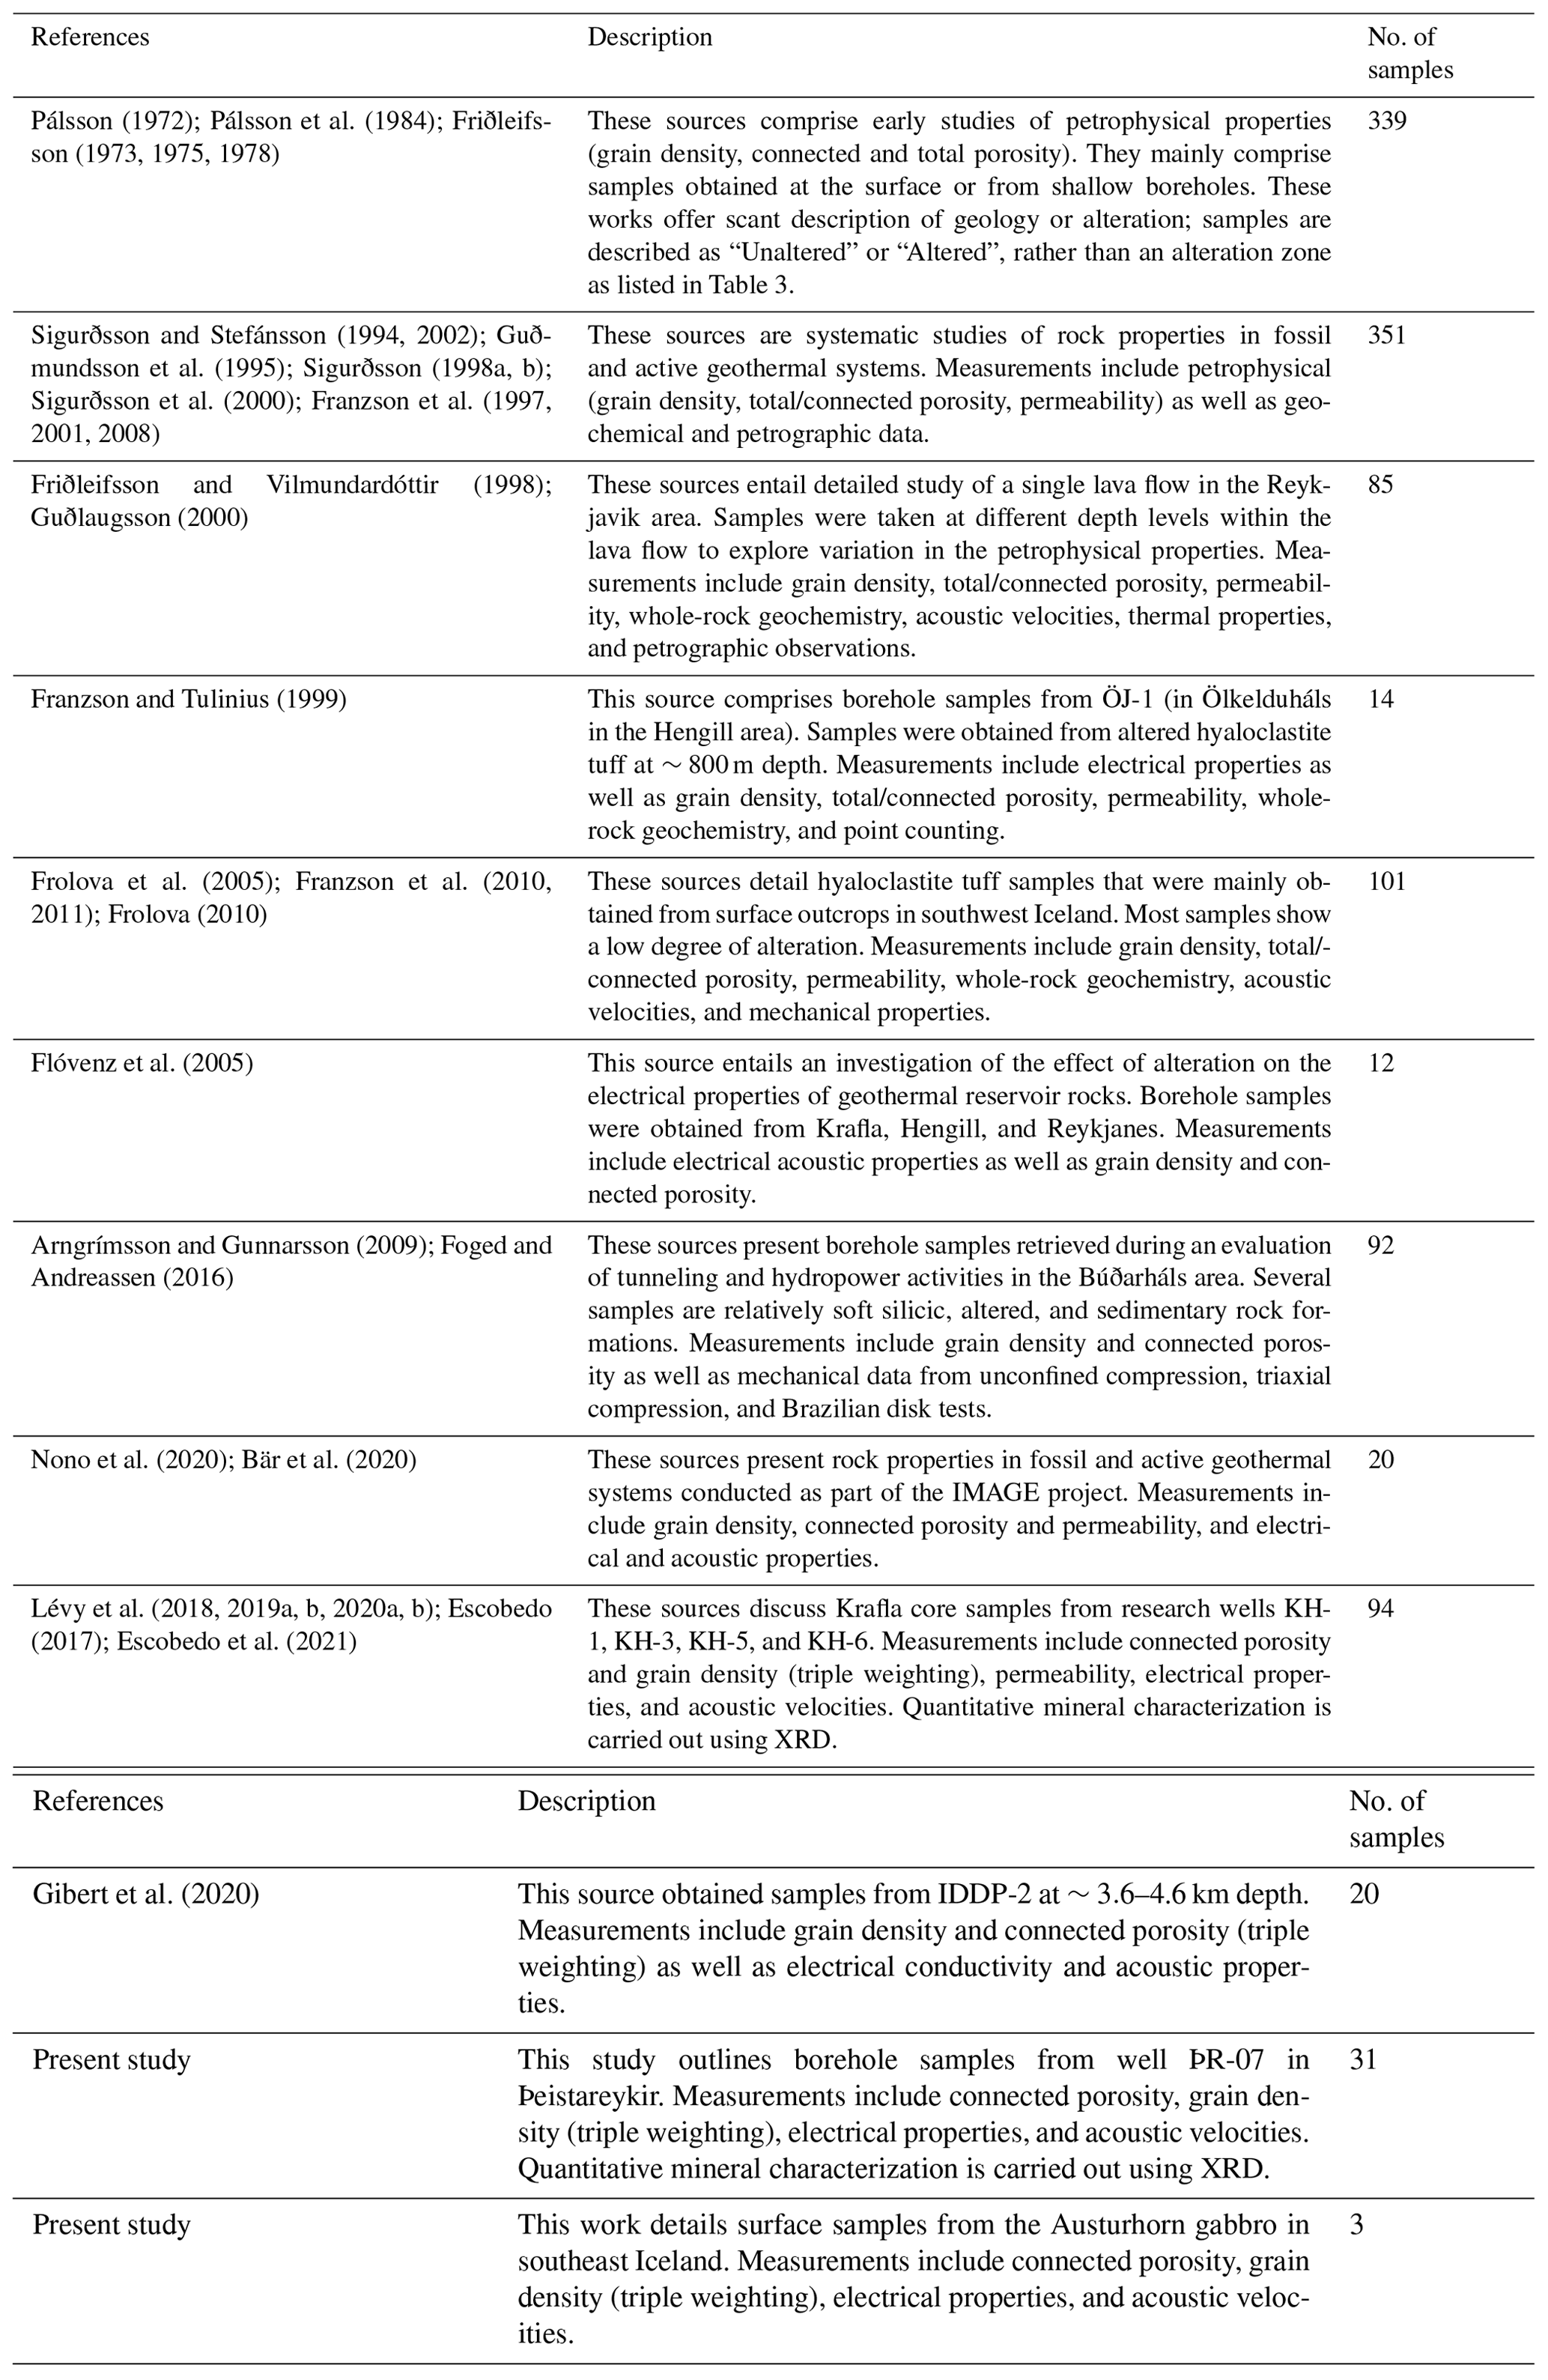
Table 1 shows a description of the sources of the data for the database. The original 529 samples collected by Orkustofnun and Iceland GeoSurvey (ÍSOR) between 1990 and 2010 that made up the first release of the Valgarður database mainly originate from hand-drilled cores taken at the surface within the neovolcanic zone or at erosional surfaces in the older strata at various paleo-depths and alteration stages (Sigurðsson and Stefánsson, 1994; Guðmundsson et al., 1995; Franzson et al., 2008; Friðleifsson and Vilmundardóttir, 1998; Franzson et al., 2011). In this release of the database, we added data from 302 samples collected by Orkustofnun between 1970 and 1980 (Pálsson, 1972; Pálsson et al., 1984), 161 samples from downhole cores obtained from active geothermal systems (Flóvenz et al., 2005; Franzson and Tulinius, 1999; Bär et al., 2020; Lévy et al., 2018, 2019a, 2019b, 2020a, 2020b; Gibert et al., 2020; Nono et al., 2020), 92 samples obtained from boreholes drilled during evaluation of a hydropower project in the Búðarháls area (Árngrímsson and Gunnarsson, 2009), 31 new analyses from borehole samples from the Þeistareykir geothermal area, and 3 surface samples from the Austurhorn gabbro.
To facilitate simple and user-friendly handling, the database is provided in “flat” format (one row per sample) rather than “stacked” format (one row per measurement). The main Excel file is divided into two worksheets:
-
petrophysical properties;
-
mineralogical and geochemical properties.
The first and primary table reports measurements of petrophysical properties, including porosity, grain density, permeability, electrical resistivity, acoustic velocities, rock strength, and thermal conductivity performed under near-ambient conditions. This table provides lithologic characterization, including detailed sample descriptions in both Icelandic and English, and description of the alteration zone. This table also reports detailed sample metadata, including the sample type (surface or borehole) and the date and location of sample collection. Following the example of Bär et al. (2020), we provide information about how each measurement was acquired in a “Remarks” column adjacent to the reported value and set the fill color of cells based on the type of data contained in the cell (e.g., cells listing the primary and secondary references are colored yellow, cells containing sample metadata are colored blue, and cells related to lithological characterization are colored orange).
The second table reports geochemical and mineralogical data. The data reported on this worksheet include petrographic observations (point counting on thin sections), bulk rock geochemical analyses derived from X-ray fluorescence (XRF) analyses, or quantitative mineralogical assessments using X-ray diffraction (XRD). Although many studies have investigated the geochemistry and petrology of Icelandic rocks (e.g., Sigmarsson and Steinthórsson, 2007; Sigmarsson et al., 2008) and much of the available data have been compiled into a publicly accessible database (Harðardóttir et al., 2022), we restrict the scope of the database and provide geochemical and mineralogical data for samples that also have petrophysical properties given in the first table.
In addition, we provide the following two additional files in the repository:
-
A ZIP file that contains photographs of many of the sampling sites. A file listing the names of files that correspond to the sample IDs is also provided in the repository. These photographs have been included with the database to facilitate future investigations in the study areas.
-
An extended references worksheet listing all of the references referred to as primary or secondary references in the database.
2.1 Sample ID and references
The order in which samples are presented in the database is approximately chronological, based on the date of the reference and the order of the sample numbers within the reference. The sample ID is equivalent to the reported sample ID in the primary reference. Primary references indicate where the data were first published and/or best documented; secondary references are also given if the data were reported or used in further studies or, in the case of borehole samples, describe core logs reported after the drilling of the well. References that are not cited in this text but are cited in one of these columns are described in the references worksheet provided in the Excel database.
2.2 Location coordinates and description
A description of the sampling location is available for all samples. The location description is provided in Icelandic or English and is reported according to a geographic feature (e.g., mountain, lake, or stream) or village/town. In the case of core samples, the name of the geothermal field and well from which the sample is obtained is given. Precise location coordinates describing the location of the samples are generally only available for samples collected after ca. 1995. For samples without location coordinates given in the primary reference (Pálsson, 1972, 1984), an approximate sampling location was estimated based on the sample location description. Therefore, there is significant uncertainty (up to 0.5 km or more) with respect to the location of samples collected before 1995. For many of the samples, photographs were taken that show the location and the geological features in some detail (Fig. 1). These photographs are provided in a supplement to the database.
The latitude and longitude of the sampling point at the surface in decimal degrees is reported according to the WGS84 reference system as well as in projected coordinates in ISNET93, with the latter being widely used in Iceland. The elevation is given in meters above sea level (m a.s.l.) and was obtained using the Google Maps Elevation Service when not provided in the primary reference. Borehole samples show the coordinates at the wellhead and an accompanying depth (in m). The uncertainty in the elevation and depth coordinates is estimated to be on the order of 1–10 m for most samples, although the uncertainty is significantly greater (0.1–0.5 km) for samples collected prior to 1990 (Pálsson, 1972, 1984).
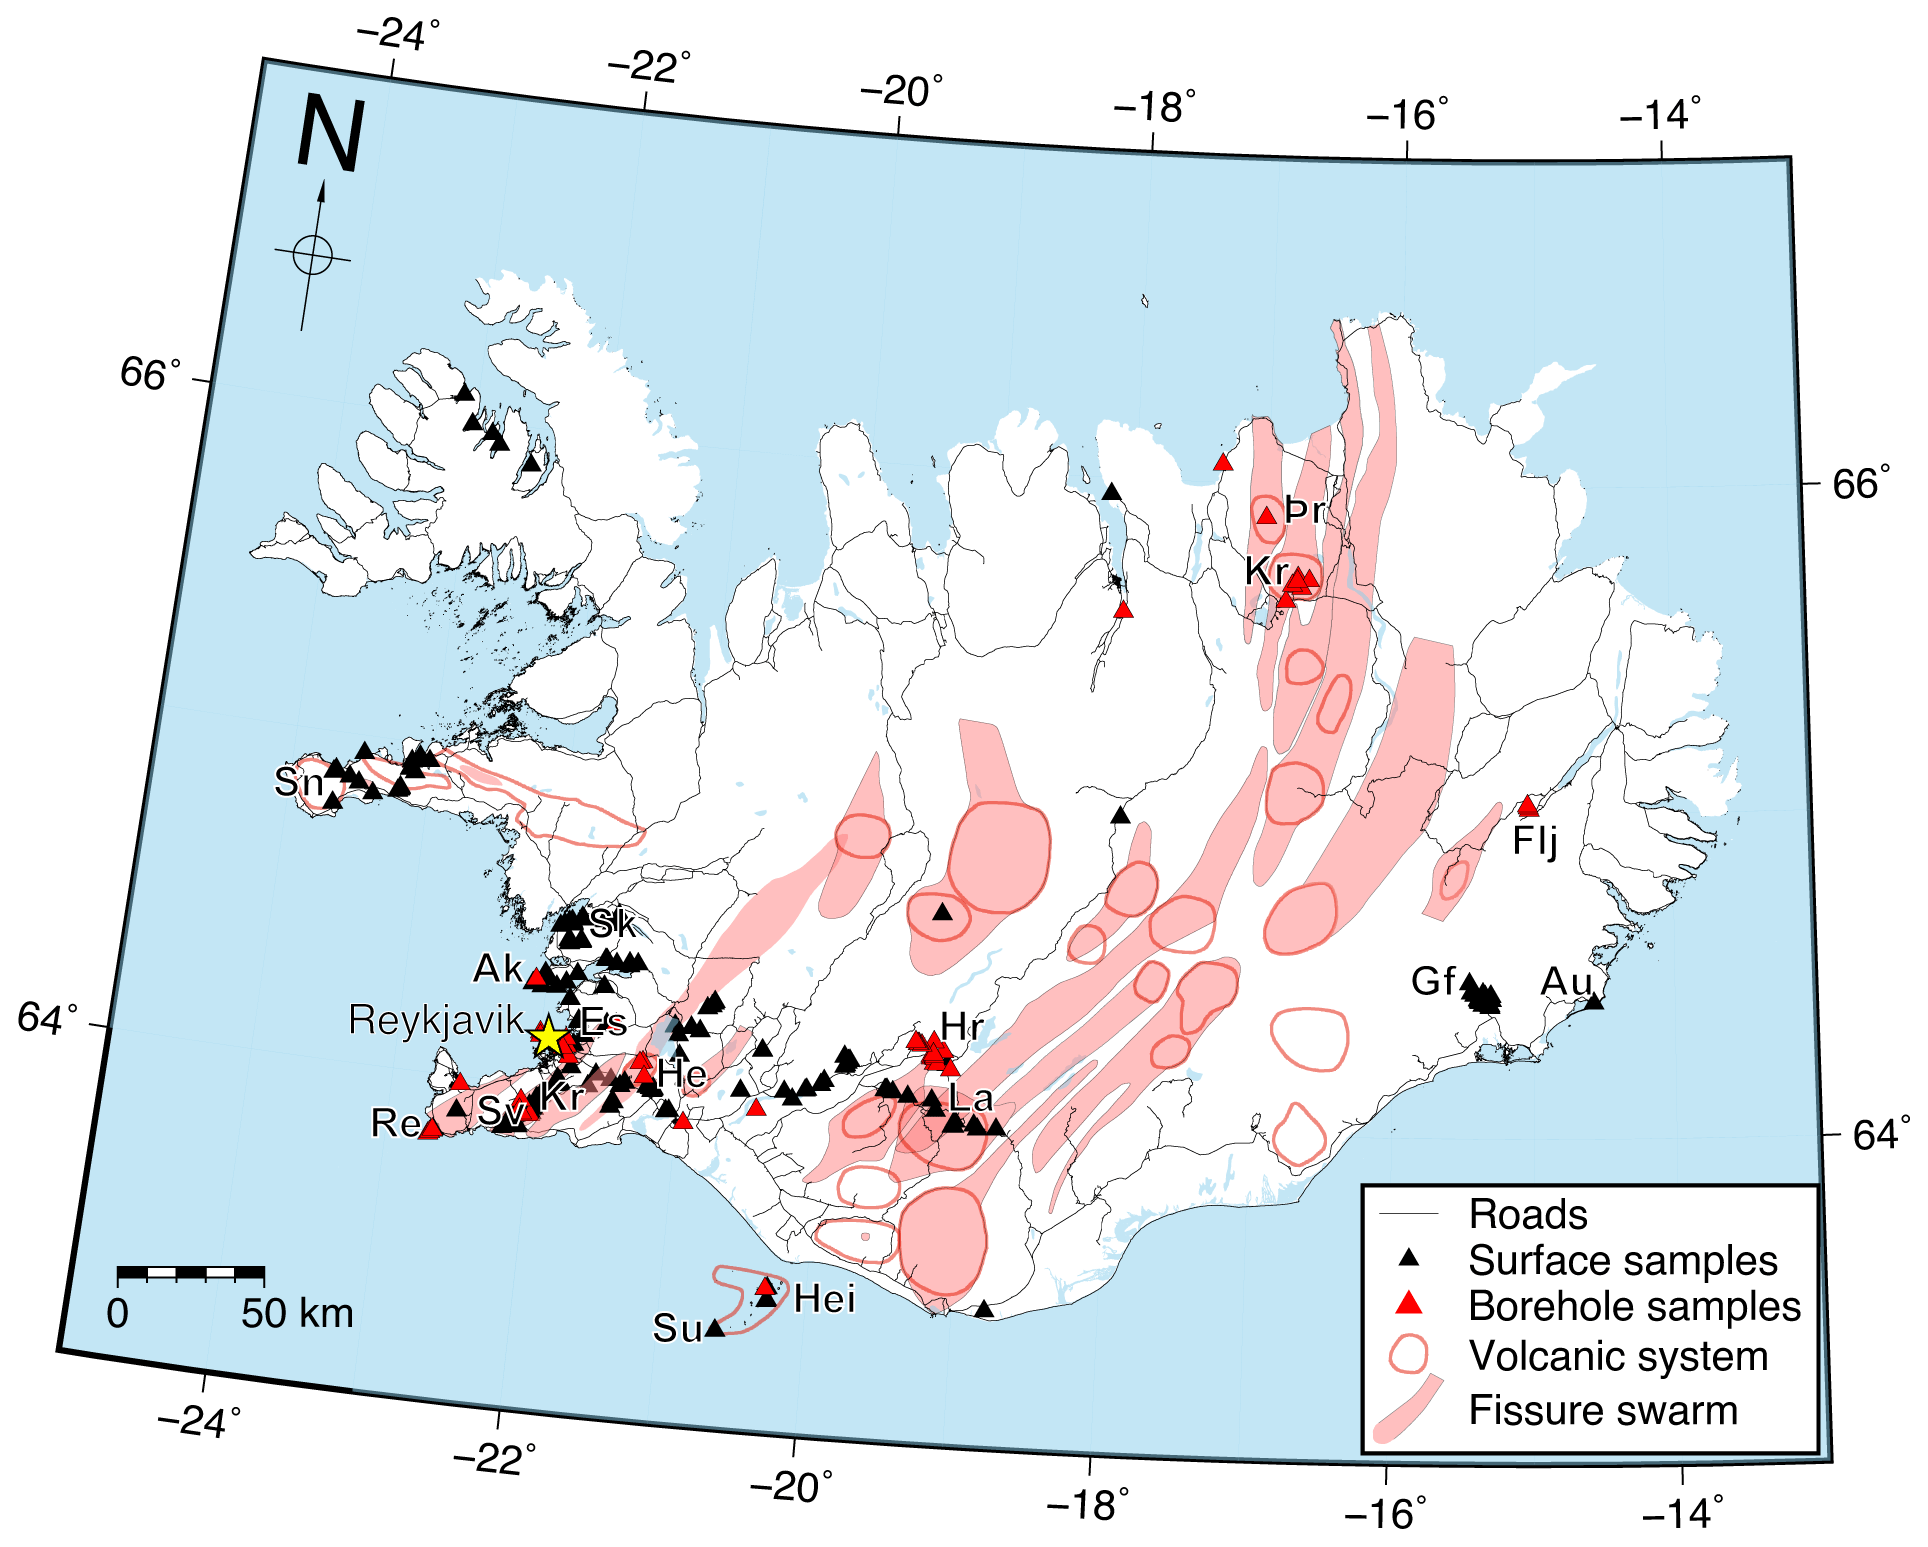
Figure 2Map of Iceland showing the locations of the surface (black triangles) and borehole (red triangles) samples comprising the database. Volcanic systems are outlined using thick red lines, the associated fissure swarms are highlighted in light red, and roads are shown as thin black lines. The locations mentioned in the text are as follows: Ak – Akranes, Au – Austurhorn, Es – Eja, Flj – Fljótsdalshreppur, Gf – Geitafell, He – Hengill, Hei – Heimaey, Hr – Hrauneyjar, Hv – Hvalfjörður, Kr – Krafla, Kv – Krýsuvík, La – Landmannalaugar, Re – Reykjanes, Sk – Skarðsheiði, Sn – Snæfellsness, Su – Surtsey, Sv – Svartsengi, and Þr – Þeistareykir. The figure incorporates data from the Icelandic Institute of Natural History (IINH, https://www.ni.is/en/research/geoinformation/metadata-and-downloads, last access: 14 March 2023).
Figure 2 shows the locations of all of the obtained surface and borehole samples. There is a greater abundance of samples from the southwest of Iceland, including the area around Reykjavik, Akranes, Borganes, and the Reykjanes Peninsula. Many of the samples were taken at deep erosional levels within fossil geothermal systems, including the Geitafell central volcano located in the Hornafjörður region in the southeast (Friðleifsson, 1983a, b, 1984), the Hafnarfjall–Skarðsheiði central volcano located in the west (Franzson, 1978), and the Esja volcanic region located close to Reykjavik (Friðleifsson, 1973). There are several surface samples of altered volcanic rocks collected from active geothermal areas, including the Reykjanes Peninsula (Svartsengi, Krýsuvík, and Reykjanes), the Hengill region, and Landmannalaugar. Borehole samples are available from the major active geothermal areas (Hengill, Reykjanes, Krafla, and Þeistareykir) as well as from several wells drilled outside of thermal areas during the evaluation of hydropower projects in Fljótsdalshreppur and Hrauneyjar (Pálsson, 1972, 1984; Arngrímsson and Gunnarsson, 2009).
2.3 Rock-type characterization
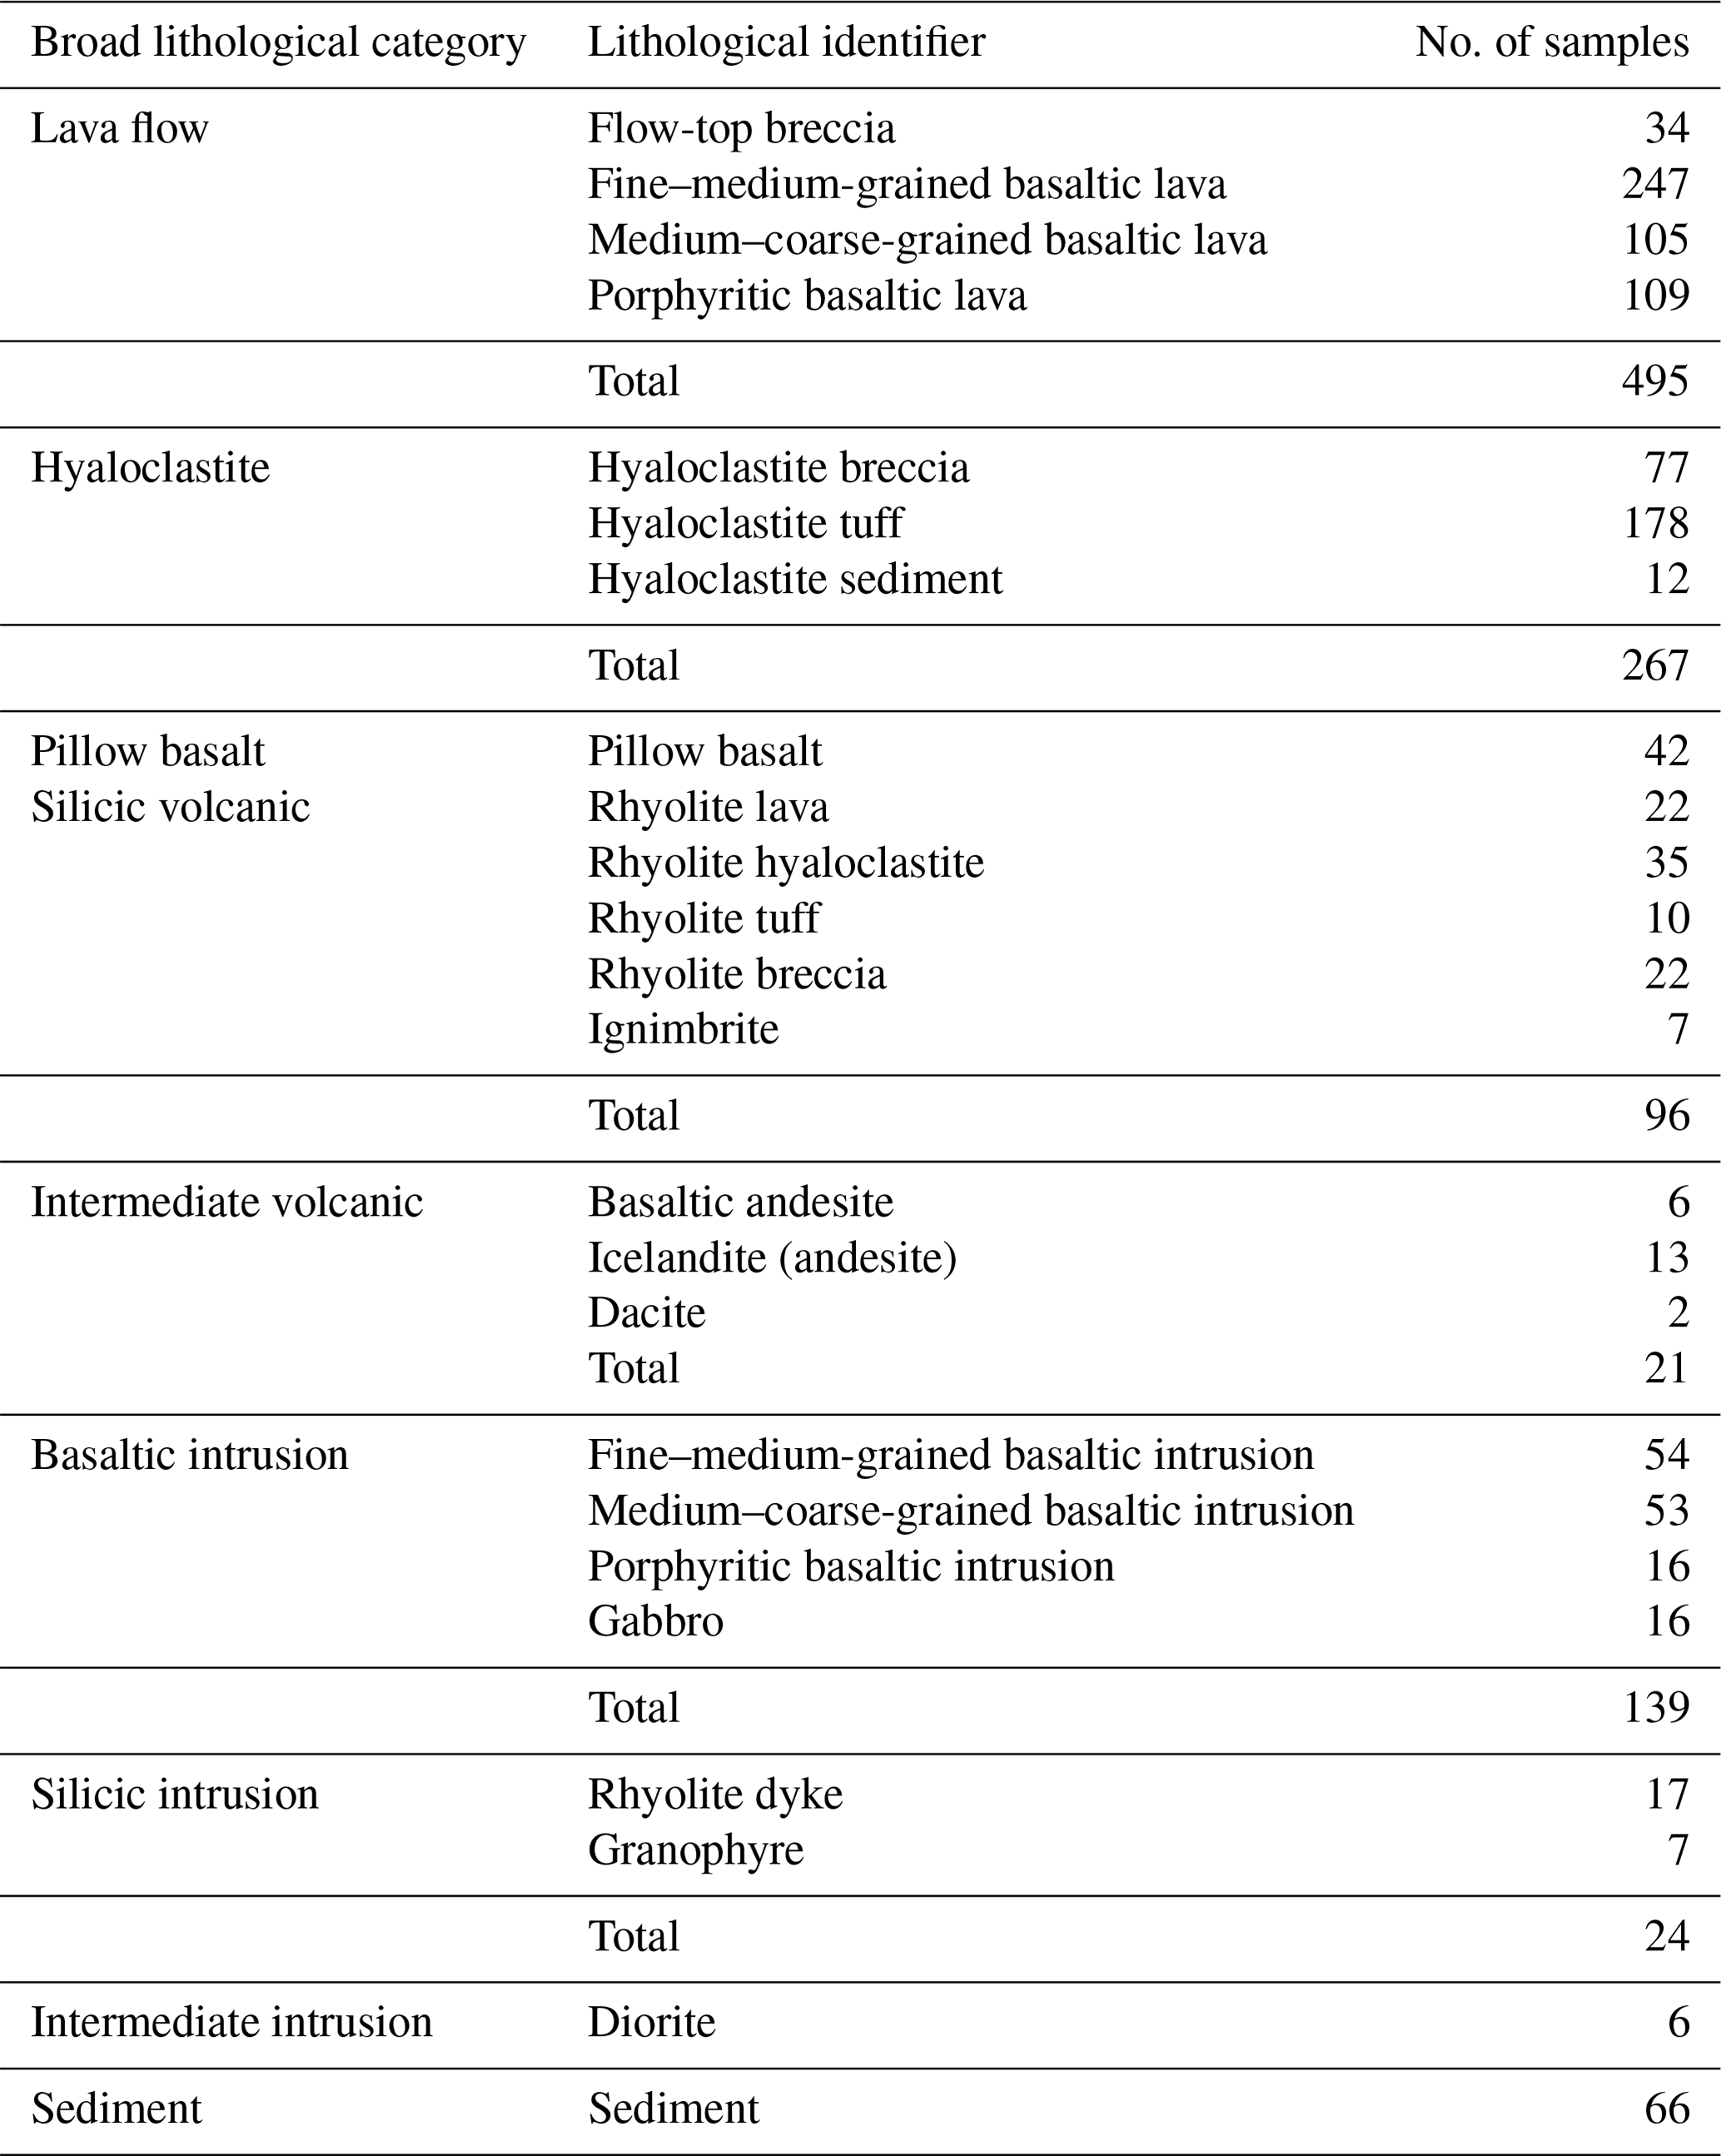
The sample description provides a summary of characteristics on the scale of the hand sample, including but not limited to grain size; color; vesicle size; the presence of layering, fractures, joints, and fissures; and relevance to other samples. Sample descriptions that were originally provided only in Icelandic were translated into English and are listed in separate columns. The level of sample description detail varies among the different studies. Each sample is assigned to 1 of 8 broad lithological categories and to 24 more detailed lithological identifiers, following the classification scheme of Guðmundsson et al. (1995) (Table 2). Lithological identifiers were determined based on the interpretation of the geological context and visual characteristics, rather than whole-rock chemical analyses. For borehole samples, the sample description is obtained from the description of the core log at the logged depth.
Table 2List of lithological identifiers, detailed description of rock types covered by that identifier, and the number of samples in the database corresponding to each lithology.
Among extrusive basaltic volcanic rocks, one key distinction is between lava flows, which are erupted subaerially, and hyaloclastites, which are often erupted subglacially (e.g., Schopka et al., 2006) but may crystallize under a mixture of subaqueous and partially subaerial conditions (Bergh and Sigvaldason, 1991; Banik et al., 2013). While fresh olivine basaltic lava flows are referred to as grágrýti in Icelandic, tholeiitic lava flows, which evolved from more mafic olivine basalt, are often referred to as blágrýti. The latter usually show flow-banding and are finer grained than the olivine basalts. It has been customary in Iceland to classify lava flows based on crystal size (e.g., Guðmundsson et al., 1995); in comparison to the classification scheme of Walker (1958), the lithological identifier “fine–medium-grained basaltic lava” generally corresponds to the “tholeiitic basalt” type, whereas “medium–coarse-grained basaltic lava” generally corresponds to the “olivine basalt” type. Porphyritic basalts show macroscopic (up to 2 cm in diameter) plagioclase phenocrysts, with less abundant pyroxene and olivine phenocrysts (Fig. 1c). Basaltic lava flows are often vesicular, especially towards the tops of the individual lava flow units, where they develop a thick surface rubble or a ropy texture. Such units are referred to as flow-top breccias (kargi) or entablature/cube-jointed basalt (kubbaberg), which often shows irregular columnar jointing.
Hyaloclastite formations often contain denser pillows or pillow fragments embedded in a tuff matrix (Fig. 1d). Hyaloclastite (móberg) contains a higher proportion of glassy material compared with lava flows. Hyaloclastite breccias and pillow basalts show significant heterogeneity on the scale of centimeters to meters. To maximize the homogeneity among the cores drilled for a given rock sample, hyaloclastite samples were obtained from the dominantly glass-rich tuff matrix (e.g., Fig. 1d). Due to the strong contrast in the physical properties of the pillow basalt fragments compared with the tuffaceous matrix, pillow basalts comprise a separate lithological category.
Silicic volcanic rocks are often found as 50–100 m thick flows in the vicinity of volcanic vents. Silicic volcanic products include vesicular glassy pyroclastics such as pumice, obsidian (which forms from rapid cooling at the margins of rhyolitic lava flows), perlite (a glassy variety of rhyolite with high water content), and ignimbrite (which forms during explosive eruptions when volcanic material cascades down slope as pyroclastic density currents). Intermediate volcanic rocks include basaltic andesite, icelandite (which is considered to be interchangeable with andesite), and dacite.
Among intrusive rock types, basaltic intrusions are distinguished from silicic or intermediate intrusions. Basaltic intrusions include both gabbro, which crystallizes in larger subsurface magma bodies, and dolerite (sometimes referred to as diabase), which is found in basaltic dykes, including cone sheets. Silicic intrusions include rhyolite dykes and granophyre, with the latter usually showing fine-scale intergrowth of quartz and feldspar, as well as microgranite, which lacks granophyric intergrowths. Intermediate intrusive rocks including diorite are relatively rare. Note that intrusions may be of very variable age in relation to the geothermal system they intrude.
While many volcaniclastic rocks (e.g., hyaloclastite) show sedimentary textures related to deposition in a subaqueous or subaerial environment (Bergh and Sigvaldason, 1991; Schopka et al., 2006; Banik et al., 2013; Greenfield et al., 2020), they are not referred to as sedimentary rocks in the database. Examples of sedimentary rocks found in Iceland include clay-rich lacustrine sediments, glacial tillite and conglomerates, sandstone, and interbasaltic beds (e.g., Bennet et al., 2000; Arnalds et al., 2001; Thorpe et al., 2019; Eiriksson and Simonarson, 2021). However, distinction between these rock types is not made in the database (Table 2) due to the emphasis on volcanic and igneous rocks. It should be noted, however, that sedimentary grains are almost exclusively of igneous origin.
In addition to the lithological classification, each sample is assigned to one of the main alteration zones identified in Icelandic rocks (Table 3). Most of alteration minerals in Iceland fall into the Ca2+ (stilbite–heulandite–laumontite–wairakite) and CaMgFe2+ (smectite–chlorite–epidote–actinolite) series of minerals (Walker, 1960, 1974; Kristmannsdóttir and Tómasson, 1978; Kristmannsdóttir, 1979; Lonker et al., 1993; Franzson and Gunnlaugsson, 2020; Escobedo et al., 2021). With increasing depth and temperature, the alteration zones are the smectite–zeolite zone, the mixed-layer clay zone, the chlorite–epidote zone, the epidote–actinolite zone, and the amphibole zone (Kristmannsdóttir, 1979; Sveinbjörnsdóttir, 1992). In some studies (e.g., Franzson et al., 2008), further distinction is made between a chlorite zone and the chlorite–epidote zone; for this study, we combine these two zones for simplicity and to facilitate comparison among the different studies. In addition, we combine the amphibole zone with the epidote–actinolite zone. Although rocks without obvious alteration mineralogy are described as unaltered, basaltic glass has undergone some extent of palagonitization. Palagonitization occurs as a posteruptive process entailing the hydration of basaltic glass and replacement by secondary minerals, including zeolites and smectites (Stroncik and Schminke, 2002). Although this is a type of alteration process, it does not correspond to a specific alteration zone as observed in active and fossil geothermal systems. Variable porosity and permeability have a pronounced effect on the alteration intensity of the rock.
Table 3Description of the alteration zones and the number of samples in the database corresponding to each alteration zone.

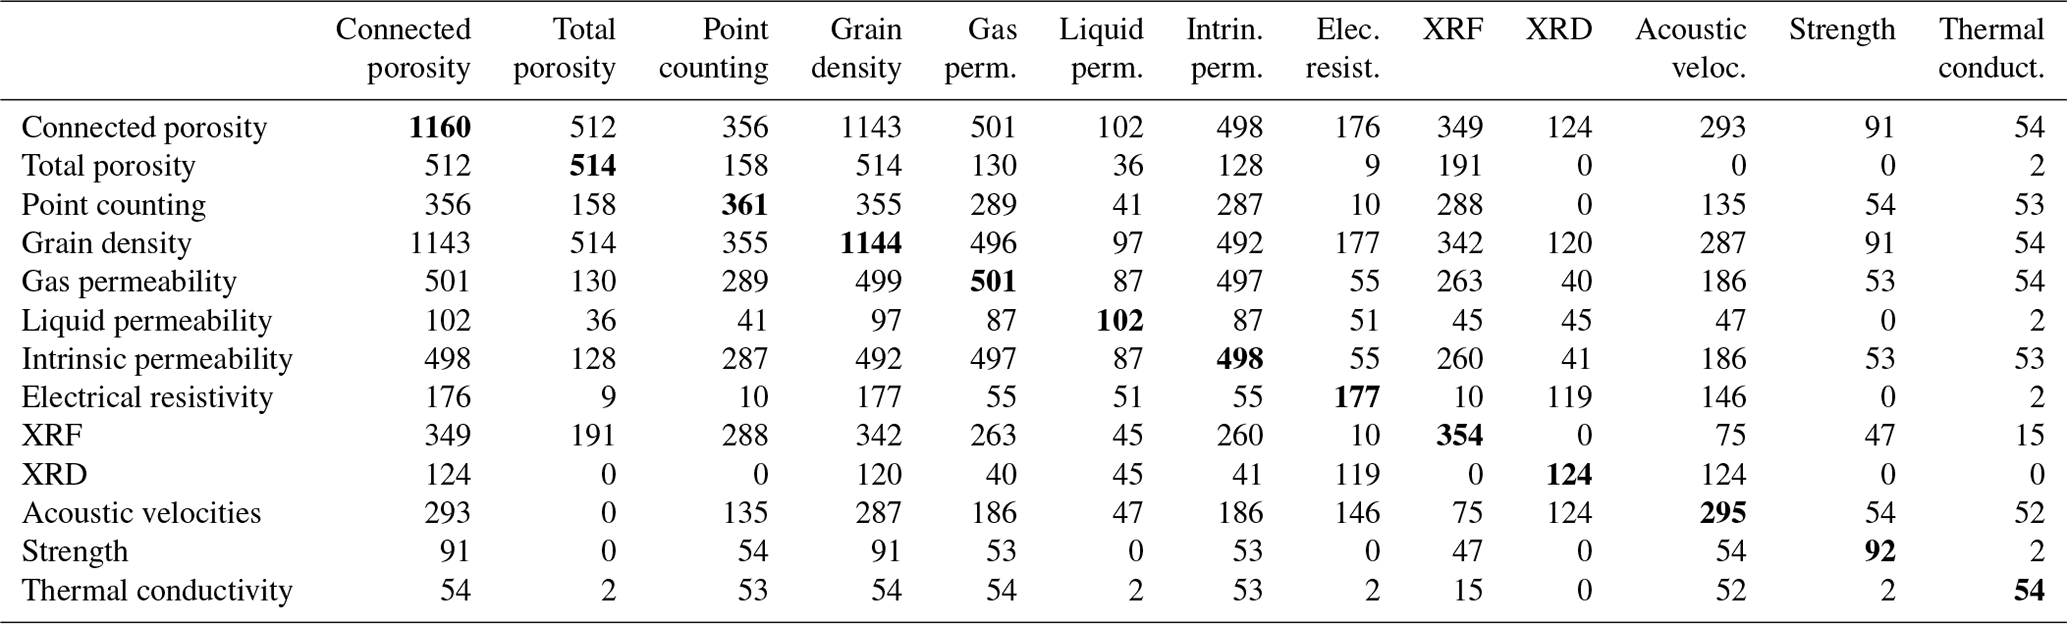
Measurements under ambient conditions (room temperature and atmospheric pressure) include grain density, porosity, electrical conductivity, and acoustic velocities. Permeability measurements were made under a variable but low confining pressure (<5 MPa). Table 4 shows the number of samples with data corresponding to the different petrophysical and mineralogical properties. Only a few samples were analyzed for mechanical properties. Depending on the source of the data, different analytical techniques were used to measure a given petrophysical property. This can make it challenging to report the measured quantities in a consistent manner.
Table 4Number of samples with both petrophysical and mineralogical data for different properties in the database. Bold text indicates the number of samples analyzed for a single property. XRF denotes X-ray fluorescence for bulk whole-rock geochemistry, and XRD denotes X-ray diffraction for quantitative mineralogical composition.
3.1 Porosity and grain density
With respect to porosity, one can differentiate between connected porosity (the fraction of bulk volume occupied by pore space connected to the outside surface of the sample; this is also referred to as “effective porosity”) and total porosity (the fraction of bulk volume occupied by pore space). In igneous and volcanic rocks, gas bubbles may form unconnected pores, particularly when the volatile content is low, and porosity may be largely unconnected when porosity is less than ∼0.1 (Colombier et al., 2017). Different analytical methods are available to quantify porosity; among the most widely used methods are gas expansion (He pycnometry) and saturation/imbibition methods (Anovitz and Cole, 2015). While the measurement of connected porosity using methods such as triple weighting is nondestructive, determination of total porosity requires crushing the sample to measure the density of the solid material via conventional methods such as Hg displacement.
Gas expansion methods are based on Boyle's law and the ideal gas law. A gas, usually He due to its ability to penetrate narrow pore throats (>1 nm; Anovitz and Cole, 2015), expands isothermally from a reference cell at a known pressure into the sample container. The resulting equilibrium pressure reflects the volume of the pores into which the He gas has penetrated (calculated using Boyle's law). As the bulk volume of the sample Vbulk is known based on the geometry of the sample, connected porosity can be calculated following Eq. (1):
where Vpore is the fraction of interconnected pore space.
Saturation/imbibition methods are based on weighing a dry sample prior to full saturation with a wetting fluid (Wdry), after immersing the fluid in a saturating fluid for an extended period (Wimmersed), and again after removing excess liquid from the surface of the sample (Wsat). The porosity is then given by Eq. (2):
where ρfluid is the density of the saturating fluid and Wcrad is the weight of the cradle used to immerse the sample.
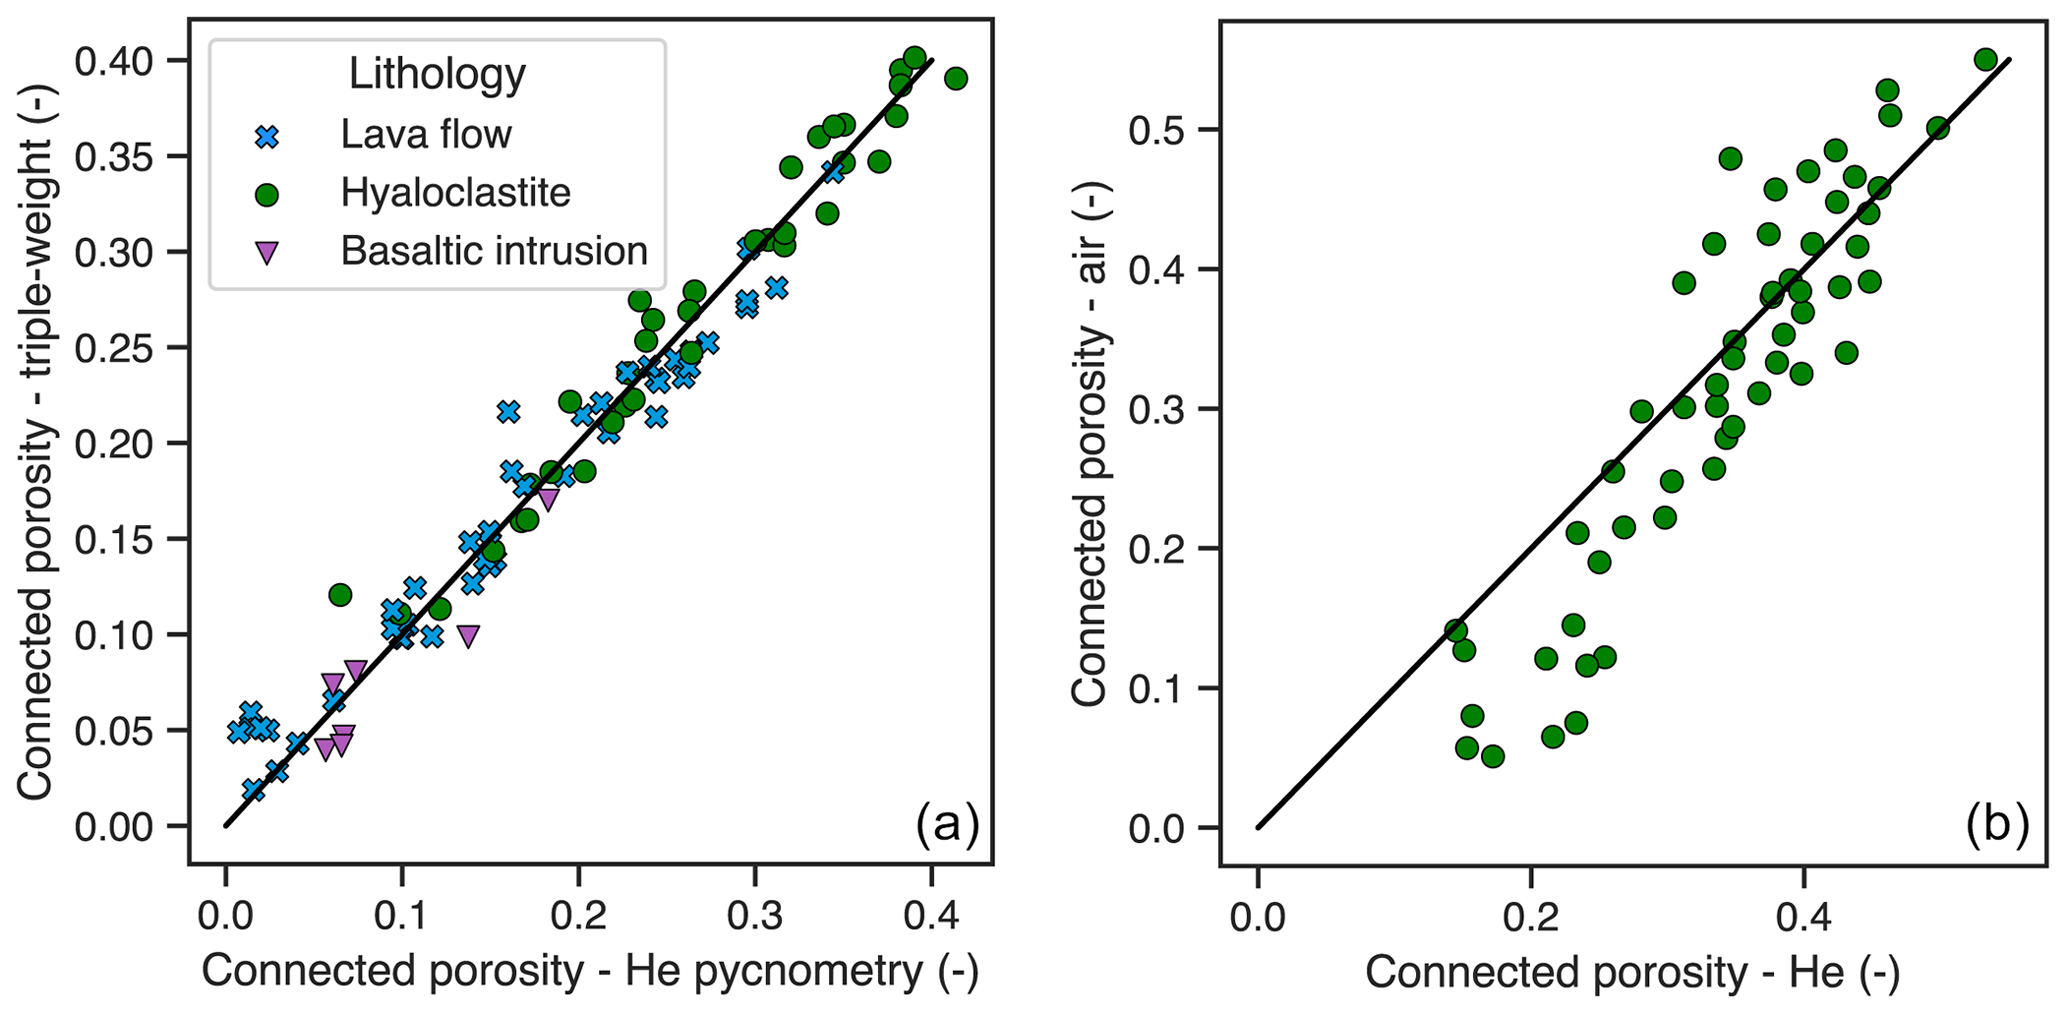
Figure 3Comparison of connected porosity measurements using different measurement techniques. Panel (a) displays the connected porosity obtained by helium expansion versus the connected porosity measured using triple weighting; the data were derived from a subset of core samples originating from Krafla (Lévy et al., 2018, 2020b). Panel (b) presents a comparison of the connected porosity measurements on hyaloclastite tuffs using He or air as the saturating gas; the data are from Franzson et al. (2011).
Connected porosities measured using gas expansion and triple-weighing methods yield similar results, at least within a margin of uncertainty of <2 %–5 %. This is demonstrated in Fig. 3a, which reports connected porosity data collected by both methods on core samples from Krafla (Lévy et al., 2018, 2020b). For gas expansion measurements, an additional source of uncertainty is related to the choice of the saturating gas. Figure 3b compares connected porosity measurements performed on a set of hyaloclastite samples using either He (Franzson et al., 2011) or air (Frolova et al., 2005) as the saturating gas and shows that the connected porosity of samples measured using air is lower at low porosities and higher at high porosities. While the former may be due to the lesser ability of air to penetrate the microporosity, the latter may result from the adsorption of water contained in the air in the clay-rich, altered rock. An additional source of error is that helium (or air) pycnometry requires the sample dimensions, whereas the triple-weighting method only uses measurements of weight. As laboratory measurements of weight are often more accurate than measurements of length, this is one advantage of the triple-weighting method over helium pycnometry. However, repeat measurements of connected porosity on different core plugs obtained from a given rock outcrop (e.g., Fig. 1d) reveal that natural uncertainty in the sampled rock can exceed 5 %–10 % (i.e., connected porosity can range from 5 %–15 %). Therefore, for volcanic rocks such as hyaloclastites or lava flows, which can show strong gradients in petrophysical properties over distances <1 m, the uncertainty resulting from different measurement devices and methods is likely less than (or comparable to) the natural variability present in the rock.
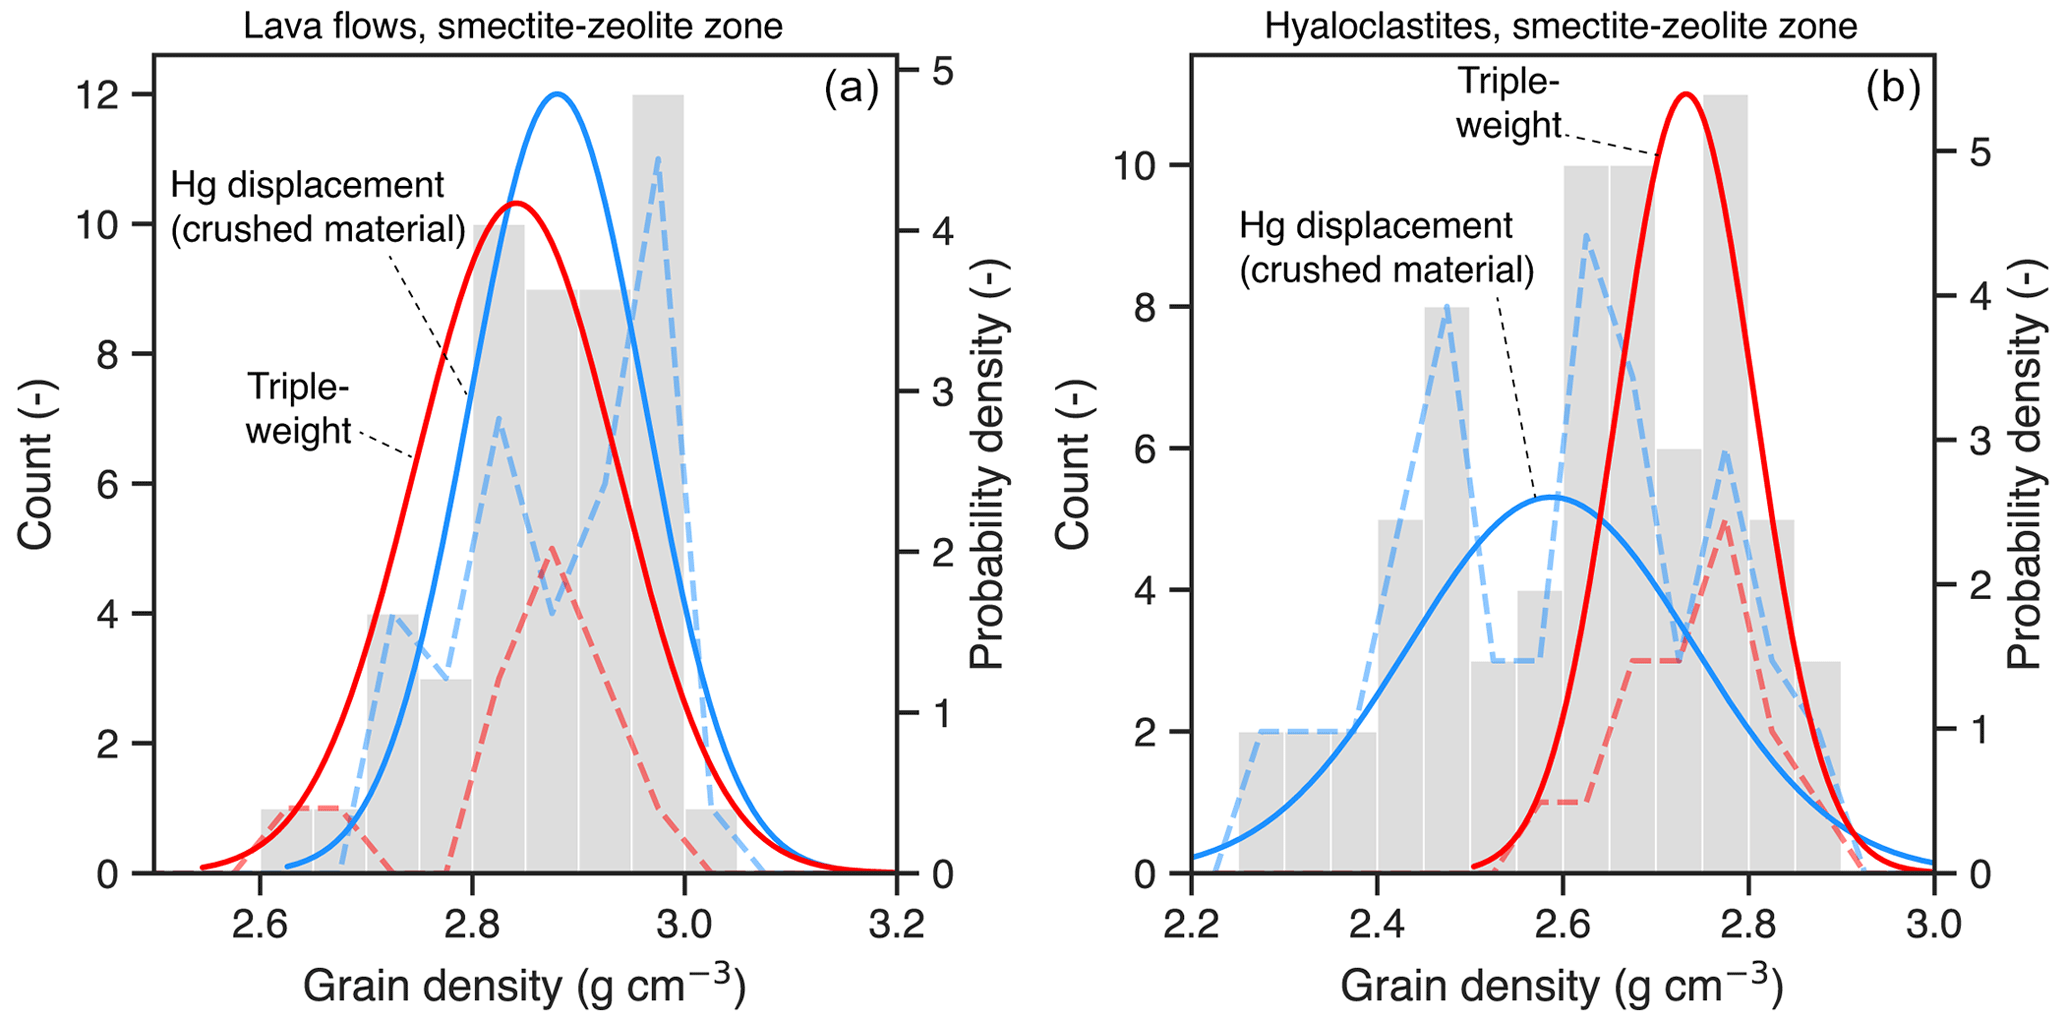
Figure 4Grain density obtained by mercury displacement (dashed blue lines) and triple weighting (dashed red lines) for (a) lava flows and (b) hyaloclastites. All data are shown in gray, and a normal distribution fit to the data for each respective measurement technique is shown using solid blue or solid red lines. Note that all of the samples for which grain density was measured by triple weighting were core samples, whereas most of the samples for which grain density was measured using Hg displacement were surface samples. This could affect the difference seen in panel (b).
All of the total porosity and most of the grain density data reported in this database were determined by pulverizing the sample and measuring the density of crushed materials using conventional techniques (e.g., Hg displacement). Total porosity can be calculated following Eq. (3):
As noted in Colombier et al. (2017), although accurate measurement of the density of the solid, pore-free phase(s) in the volcanic rock is required to calculate total porosity, heterogeneity in the phenocryst assemblage between clasts or variations in bulk composition may be common. Grain density can also be approximated based on connected porosity measurements from triple weighting following Eq. (4):
However, if there is a significant fraction of unconnected porosity, Eq. (4) will systematically overestimate grain density. Figure 4a shows that the distribution of the grain density of smectite–zeolite altered lava flows is similar regardless of whether it is measured using the Hg displacement (blue lines) or triple-weighting (red lines) techniques. On the other hand, for altered hyaloclastites (Fig. 4b), samples analyzed using triple weighting (∼2.75 g cm−3) show significantly larger average grain density than those analyzed using Hg displacement (∼2.6 g cm−3). However, other factors might also explain this discrepancy, most notably that many of the samples shown in Fig. 4b analyzed using Hg displacement were derived from surface outcrops, whereas those analyzed by triple weighting were obtained from borehole samples in active geothermal systems. Although these samples are in similar alteration zones, rocks at depth are more compacted and may contain a denser alteration mineral assemblage.
Porosity was also assessed in 352 samples by point counting. In point counting, a thin section (around 30 µm thick) of the sample was prepared, and a regular grid with a given number of points (usually 200 or 1000 points) was arrayed onto the thin section image. Identification of mineralogy or pore space at each point was performed, with the different studies applying different levels of classification between primary minerals, glass, pore space, and alteration minerals. The primary porosity formed during magma emplacement and cooling was estimated as the sum of remaining open-space porosity in the rock as well as that of secondary alteration minerals that have precipitated into vesicles (Petford, 2003). This technique does not measure the cross-sectional area of microcracks but rather only identifies macroscopic pores on the order of 1 mm or larger (Neuhoff et al., 1999; Manning and Bird, 1995; Chayes, 1956). Although the contribution of the latter to the porosity is often large, note that distinction between open-space porosity created by posteruptive processes (fracturing/veining) was not made by all studies. Therefore, we estimate that the uncertainty of porosity measurements by point counting is considerable (> 5 %–10 %). Figure 5 shows that the remaining open-space porosity measured by point counting is generally lower than that obtained by gas expansion, particularly for altered, high-porosity hyaloclastites, indicating the dominance of microporosity on the total porosity. However, a significant number of samples (∼ 50) had higher porosity recorded using petrographic analysis than by gas expansion. As porosity and permeability are scale dependent (Manning and Bird, 1995), such variability could also indicate natural heterogeneity in the rock and the preparation of the thin section from a particularly compact or porous part of the material.
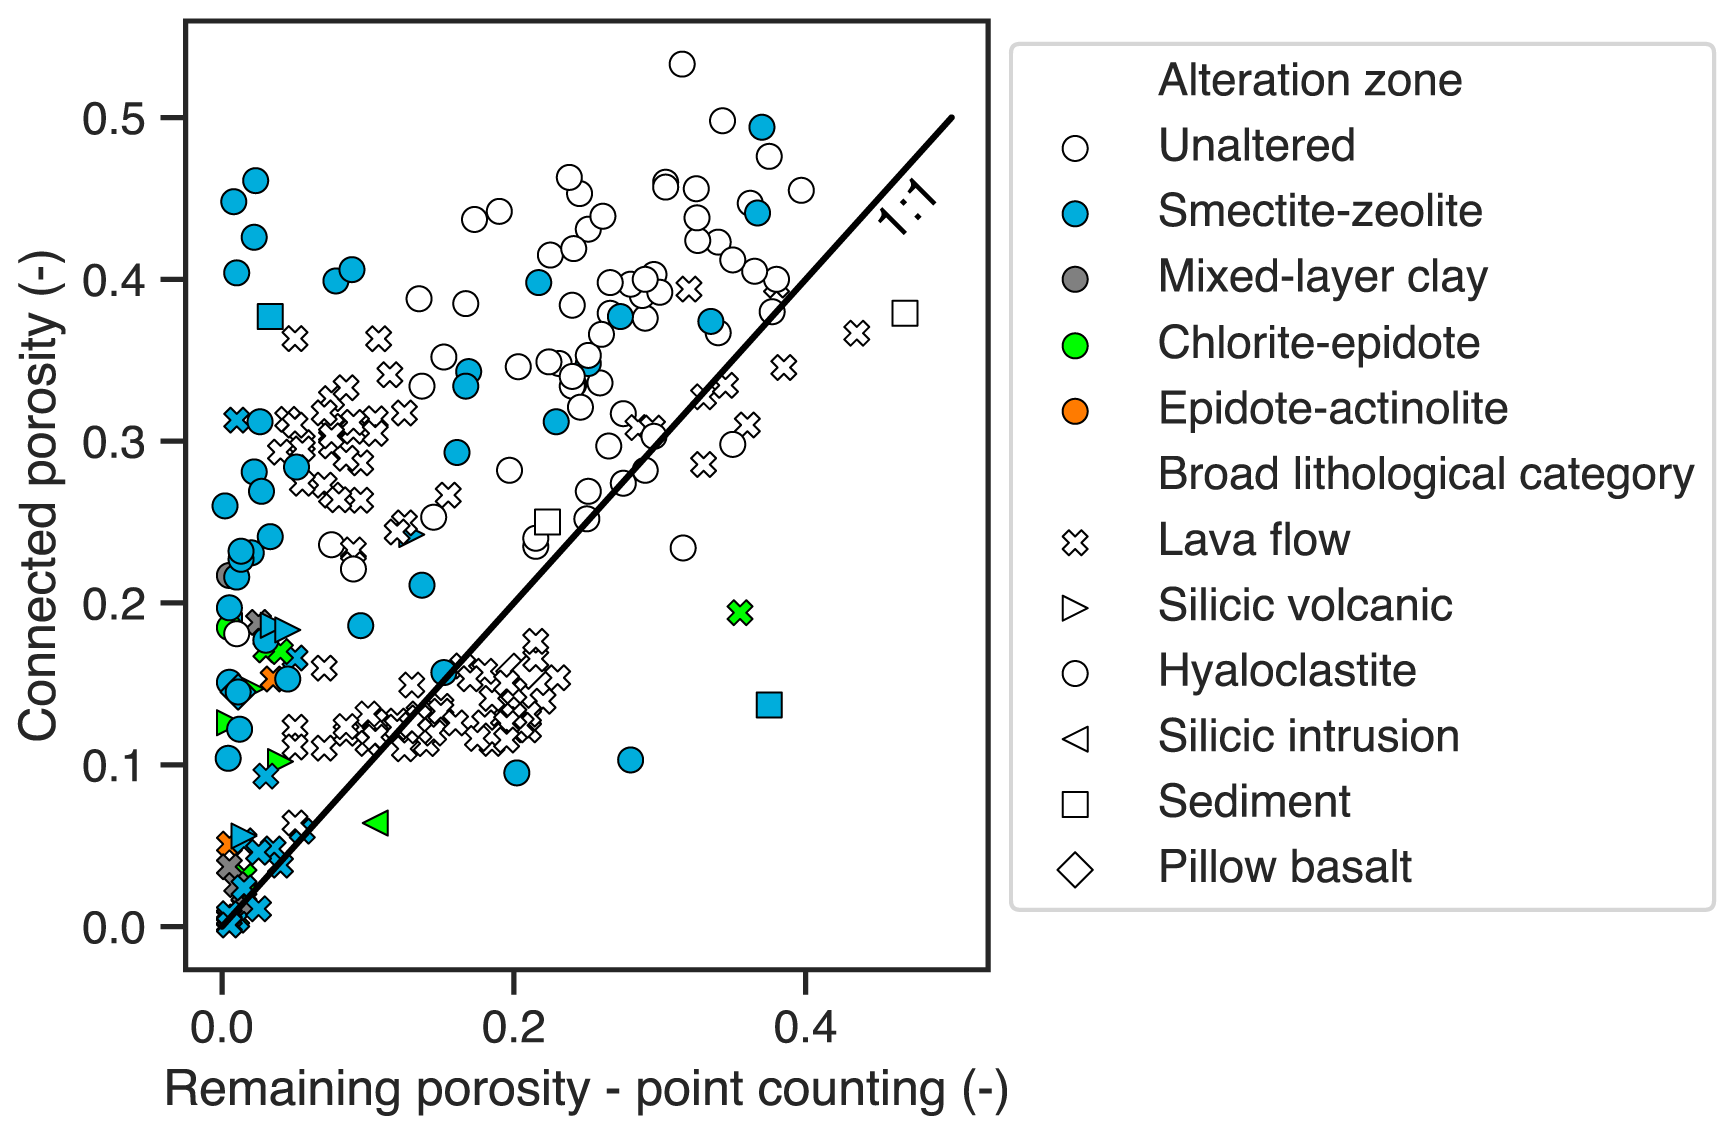
Figure 5Remaining porosity estimated by point counting compared with connected porosity measured using He pycnometry.
3.2 Permeability
Permeability is measured using a gas, usually helium or argon, or, more rarely, using water (Heap et al., 2018). Many of the samples in Guðmundsson et al. (1995) were measured at Core Laboratories (formerly Western Atlas Core Laboratories) using the CMS-300 device, which consists of a gas cylinder with a known volume, a pressure sensor, and a core holder that can be opened into a gas cylinder charged with helium gas, generally up to 1.5 MPa, and the atmosphere. While the permeability of the samples from Guðmundsson et al. (1995) was measured using a low (<4 MPa) confining pressure, measurements performed on a few samples under varying confining pressure levels showed little dependence of the permeability on confining pressure (Johnson and Boitnott, 1998). Samples from Lévy et al. (2020b) were measured at the University of Montpellier using a steady-state method on cylindrical samples confined at a pressure of 4 MPa. A constant argon pressure was imposed at the sample inlet, the pressure at the sample outlet was maintained at 0.1 MPa, and the argon flow rate was measured by a gas flowmeter. For each sample, the argon pressure at the inlet was systematically varied from about 0.5 to 4 MPa to evaluate the intrinsic permeability as described below. For the water permeability measurements, a servo-controlled pump maintained a constant pore pressure, and the flow rate was determined using the measured piston displacement. For samples with a permeability lower than 10−19 m2, a pulse decay method was used (e.g., Brace et al., 1968).
As pressure at the sample inlet and outlet of the core is known and the flow through the core is proportional to the pressure drop, Darcy's law is then used to calculate permeability from the above quantities:
where k is the rock permeability, q is the volumetric flow rate of the gas or liquid, μ is the viscosity of the fluid, A is the cross-sectional area, and quantifies the pressure drop along the core.
When using gas or liquid to measure permeability in rock samples, it is necessary to correct the measured permeability for systematic measurement error resulting from the sample geometry and the properties of the fluid (Heap et al., 2018). In low-permeability rocks, interactions between the fluid molecules/atoms and the pore walls reduce resistance to flow. Intrinsic permeability is calculated from measured gas permeability at a range of gas pressures using the Klinkenberg correction (Klinkenberg, 1941), which is based on the following equation:
where kg is the measured gas permeability calculated from Eq. (5), pm is the average gas pressure at which kg is measured, and b is the Klinkenberg coefficient, taken as a constant for a certain gas and a certain rock. The Klinkenberg coefficient and intrinsic permeability ki are obtained by plotting measured gas permeability at a range of pressures against , with the slope corresponding to ki and the y intercept b (when pm goes to infinity). The Klinkenberg coefficient depends on various properties of the rock, particularly the geometry of the pore space, and it is generally most significant in low-porosity, low-permeability rocks (Filomena et al., 2014). As a result, the relative measurement accuracy is greater (±5 %) for high-permeability rocks ( m2) and reaches up to ±400 % in low-permeability rocks ( m2). However, in high-permeability rocks, turbulent flow regimes may develop, and Darcy's law needs to be modified to consider additional flow resistance resulting from inertial forces, as given by the second term in the Forchheimer equation (Forchheimer, 1901; Zeng and Grigg, 2006):
For the samples analyzed by Guðmundsson et al. (1995), the inertial coefficient β was calculated for high-permeability ( m2) samples using repeat measurements at different flow rates. For the samples analyzed by Levy et al. (2018), the Forchheimer correction was not applied; therefore, the reported permeability may not be the actual rock permeability. However, as many of these samples are low permeability ( m2), turbulent conditions are unlikely to develop, and the Forchheimer correction is likely not significant (Heap et al., 2018).
Measured permeabilities listed in the database range over 9 orders of magnitude, from to m2. Figure 6a shows that apparent permeability measured using air generally exceeds that measured using water, often by several orders of magnitude. While this difference is often attributed to water adsorption on clays (see, e.g., Tanikawa and Shimamoto, 2009), even in clay-free volcanic rocks, liquid permeabilities can also be lower than gas permeabilities due to water adsorption on narrow, tortuous microstructural elements (Heap et al., 2018). Measurements of air permeability that are less than brine permeability are generally considered unreliable. Figure 6b compares the air apparent permeability and the intrinsic permeability, showing that the magnitude of the Klinkenberg correction increases with decreasing permeability, consistent with increased gas slippage during flow through microstructural elements in low-porosity, low-permeability rock (Heap et al., 2018).
3.3 Electrical conductivity
Electrical conductivity and its inverse, electrical resistivity, are intrinsic rock properties that measure the strength of the material's resistance to electrical current, as given by Ohm's law: , where R is resistance, U is voltage, and I is current. When an alternating current flows through a material, the electrical resistivity is characterized not only by the ratio of the magnitude of current and voltage but also by the difference in their phases, as expressed by the electrical impedance, a complex number written as a function of angular frequency ω and phase angle θ for sinusoidal current and voltage as follows:
where (Uo, θU) and (Io, θI) are the amplitudes and phases of the sinusoidal voltage and current, respectively; t is time; and is the frequency-dependent phase angle (generally negative, corresponding to a phase delay of voltage relative to current). For sample plugs with a given length L and cross-sectional area A, the electrical conductivity σ is related to Z as follows:
where |σ| and θ are the frequency-dependent modulus and phase angle of the complex conductivity, respectively, and σ′ and σ′′ are the in-phase (real) and quadrature (imaginary) parts of the complex conductivity, respectively.
The complex conductivity is obtained by measuring the impedance spectrum of the sample over a frequency range (generally 0.1 to 106 Hz). Flovenz et al. (2005) used a Zahner IM6 electrochemical workstation, whereas Lévy et al. (2018, 2019a, b, 2020b) used a Solartron 1260 impedance meter. Results show that there is a slight dependence of resistivity on measurement frequency, particularly above 10 Hz (Flovenz et al., 2005). Two types of sample-holders and configurations were used: (1) the two-electrode setup, where the sample is sandwiched between two metallic electrodes acting as current and voltage electrodes, and (2) a four-electrode setup (Vinegar and Waxman, 1984), where the voltage and current electrodes are separated. In the latter, metallic (Ni, Pt, Ag) electrodes are used to inject the current and nonpolarizable Ag/AgCl electrodes are used for voltage measurement. Although the four-electrode setup improves the quality of the conductivity spectra, especially below 10 kHz, the values obtained by both setups are comparable at 1 kHz, where effects of electrode polarization are negligible (Lévy et al., 2019b).
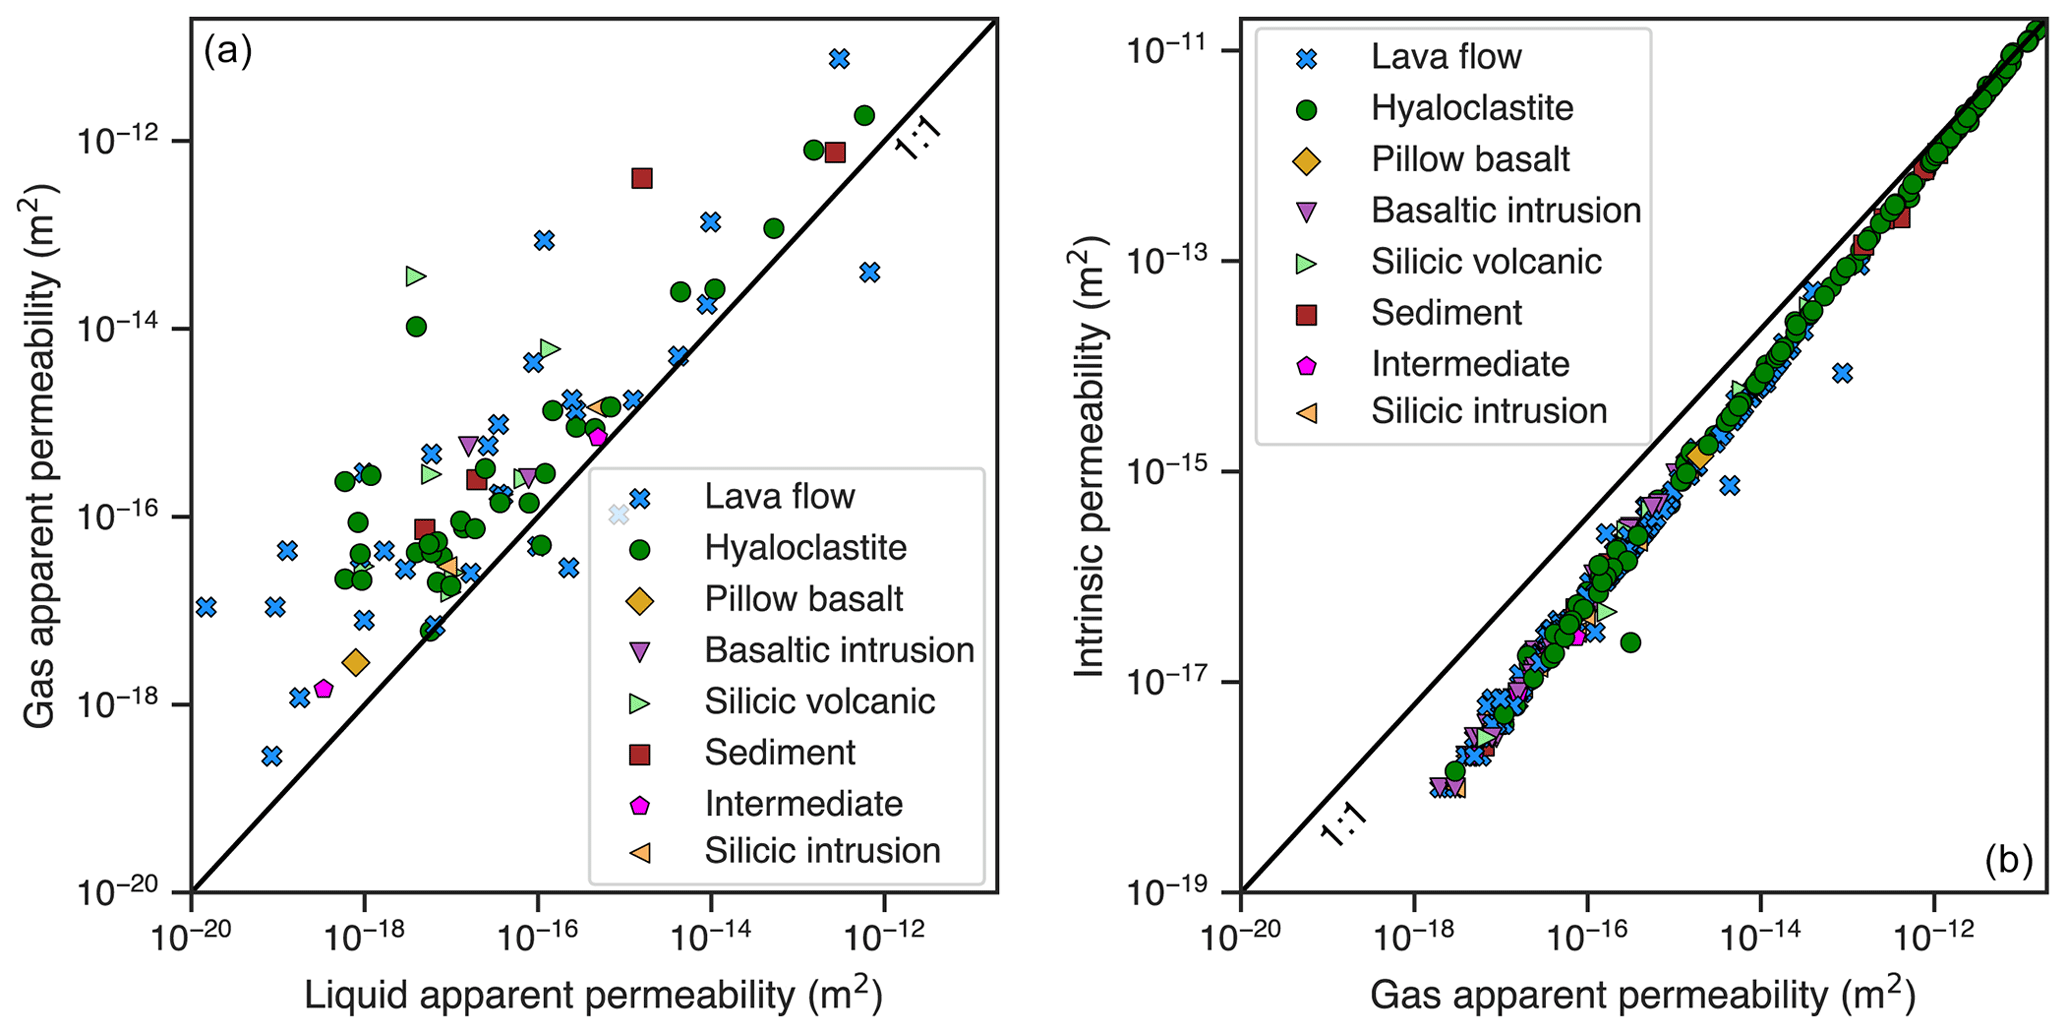
Figure 6Permeability data: (a) a comparison of the liquid apparent permeability and the gas apparent permeability and (b) a comparison of the gas apparent permeability and the intrinsic permeability; the difference between these two quantities mainly reflects the Klinkenberg correction (see text).

Figure 7Results from electrical measurements at 1 kHz versus fluid conductivity for two samples from Lévy et al. (2018) with different electrical properties. The formation factor (F) and cation exchange capacity (CEC) for the two samples are noted.
In rocks where free ions in pore water are the only charge carriers, the in-phase conductivity of a volume of rock σbulk is governed by Archie's law:
where σw is the conductivity of the pore fluid and F is the formation factor, representing the tortuosity of the current path. While F is related to the porosity, the relationship is more indeterminate in igneous rocks than in sedimentary rocks (see, e.g., Lévy et al., 2018). In rocks containing clay minerals, an additional term influences the rock conductivity, and the simplest way of writing this additional term is given by Rink and Schopper (1974):
where σs is the “surface” or “interface” conductivity, resulting from ion exchange with the solid matrix. More complex equations also describe the contribution from clay minerals (see, e.g., Waxman and Smits, 1968, and Lévy et al., 2018), but this linear equation is often preferred. The formation factor and surface conductivity are typically determined by a series of conductivity measurements on the same sample saturated at different pore fluid salinities (conductivities). Uncertainty estimations for the formation factor can be found in Lévy et al. (2019b), including corresponding equations for this uncertainty calculation.
Figure 7 shows an example of how measurements of electrical conductivity vary as a function of the salinity of the saturating fluid and the initial smectite content of the rock. In Fig. 7, sample L22 corresponds to a lava flow altered to smectite–zeolite facies alteration, whereas sample L48 corresponds to a lava flow altered to chlorite–epidote facies alteration. The higher smectite content in L22 results in a higher cation exchange capacity (CEC; see below) compared with L48. A higher CEC corresponds to an increasing role of surface conduction, resulting from ion exchange reactions with clays. The larger formation factor in L22 is explained by the presence of smectite alteration minerals, which partially clog the original pore network and prevent the diffusion of free ions in the pore space by the fluid but also allow the efficient conduction of electrical charge along the smectite clays.
For the samples analyzed by Franzson and Tulinius (1999), resistivity was measured at only a single fluid salinity, and an apparent formation factor Fapp was estimated by . The apparent formation factor is equal or close to the true formation factor if (i) there are no clay minerals or (ii) the pore space is saturated with high-salinity fluid (the contribution from free ions in the pore space largely dominates that of clay minerals). However, when resistivity measurements are carried out on samples that may contain clay minerals and have been saturated with only one fluid salinity, care should be taken when interpreting Fapp because the contribution of surface conduction to the bulk conductivity will be significant for altered rocks, and these data points are outliers compared with the samples analyzed by Flovenz et al. (2005) and Lévy et al. (2018, 2019a, b, 2020b) (Fig. 12b).
3.4 Petrographic and geochemical characterization
Four different methods are used to characterize the mineralogy and geochemistry of the samples: (1) point counting by petrographic observation, (2) XRF, (3) XRD, and (4) CEC. The former two methods were used exclusively on the samples analyzed by Orkustofnun and Iceland GeoSurvey (Sigurðsson and Stefánsson, 1994; Guðmundsson et al., 1995; Franzson et al., 2008, 20aa; Friðleifsson and Vilmundardóttir, 1998; Franzson and Tulinius, 1999); the latter two methods were used to assess the mineralogy in core samples from Lévy et al. (2018, 2019a, b and 2020b).
Point counting was used to quantify primary porosity, i.e., the original open space in rock prior to alteration (dominantly vesicles and minor fractures), and to assess how much of that porosity had been filled by the deposition of alteration minerals. Generally, 200 points were counted on each rock thin section and grouped into the following categories: primary mineral, altered primary mineral, precipitate in vesicles, precipitate in fractures, intercrystalline pores, and unfilled fractures. A more detailed classification scheme was used in Friðleifsson and Vilmundardóttir (1998), with primary minerals separated by plagioclase, pyroxene, olivine, and opaque minerals. For the hyaloclastite samples investigated in Franzson et al. (2011), 1000 points were counted and grouped as one of the following: porosity, unaltered glass, altered glass, unaltered primary mineral, altered primary mineral, zeolite, clay, calcite, or other.
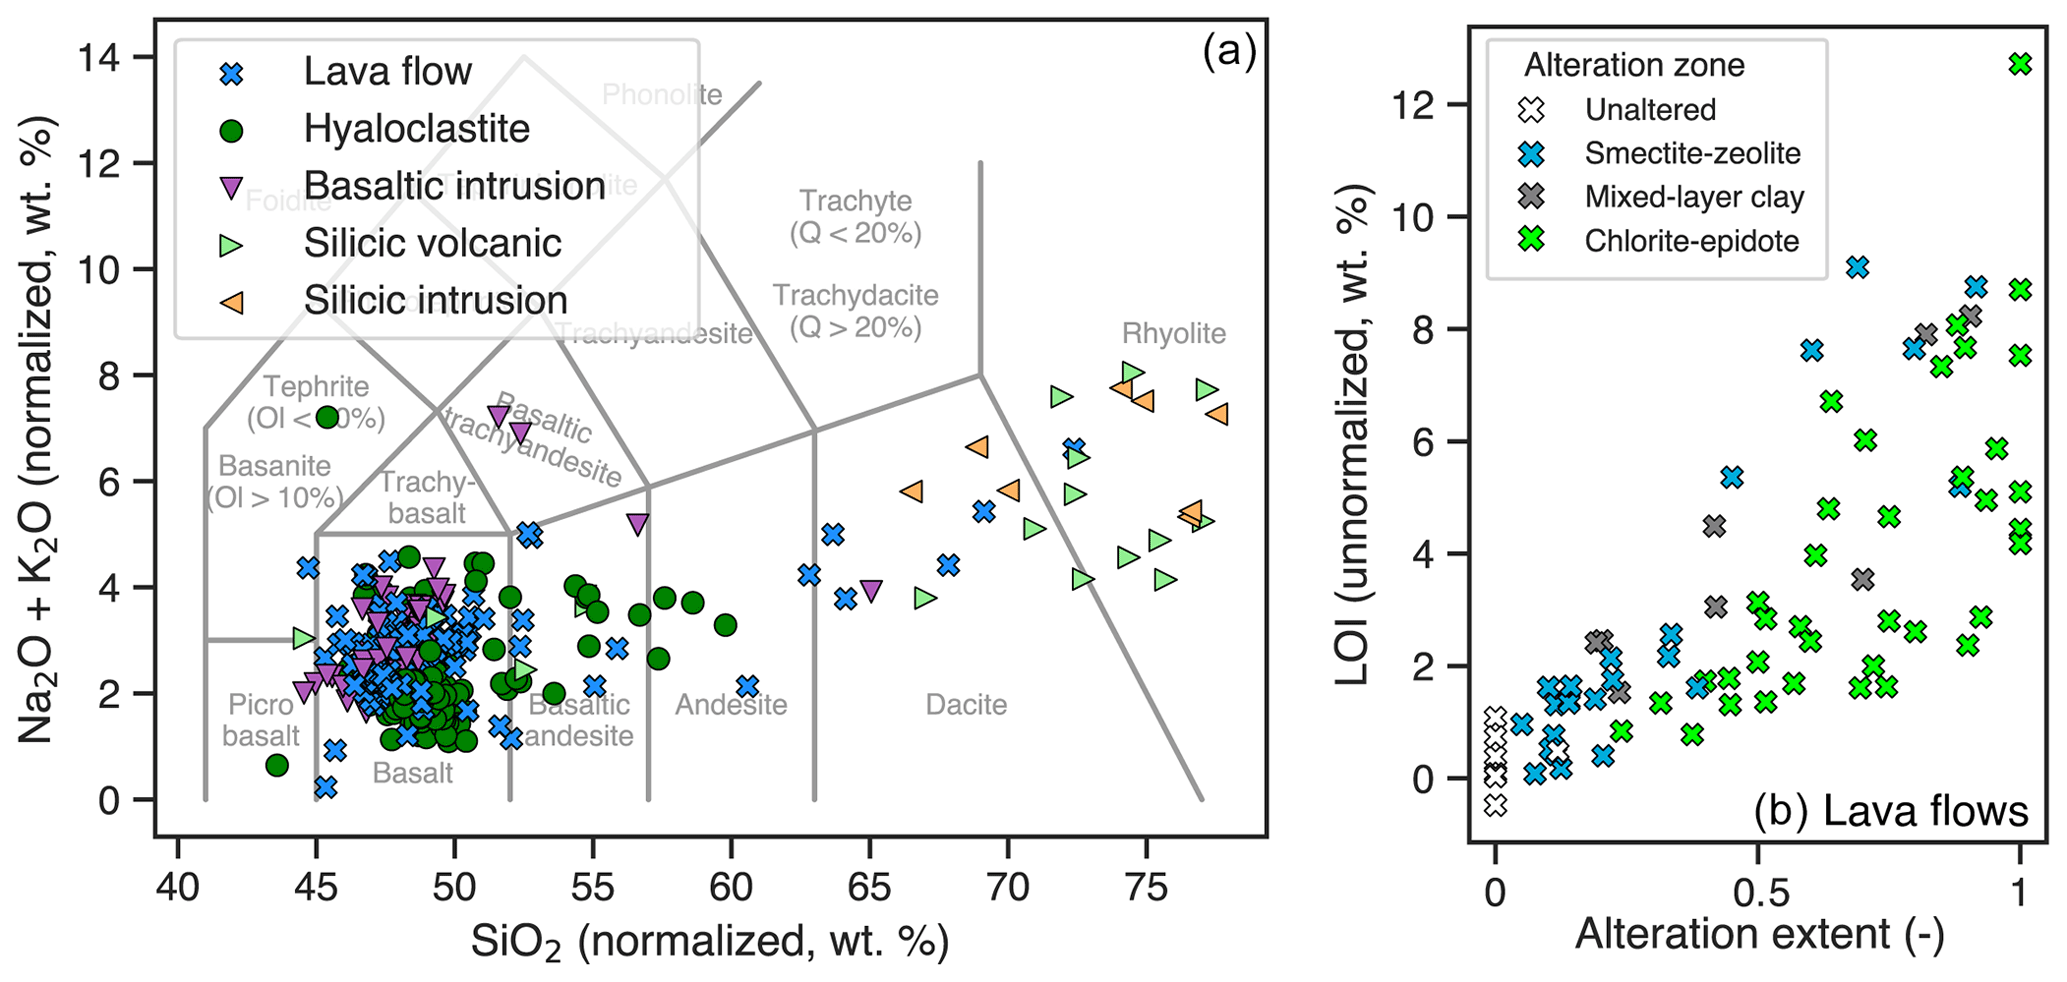
Figure 8Whole-rock geochemical data and petrographic observations of alteration. Panel (a) presents a total alkali–silica (TAS) diagram (Le Maitre et al., 2002), with samples colored by lithology; note that many of the rocks are very altered and that lithologic identifiers are assigned based on the interpretation of the geological context and visual characteristics, rather than the geochemical field into which the rock plots. Panel (b) shows the loss on ignition (LOI) versus the total extent of alteration quantified by point counting; only lava flows are shown, and symbols are colored by alteration zone.
Bulk rock chemical analyses were performed by two commercial chemical laboratories, the Caleb Brett Laboratory in England and McGill University in Canada, using standard XRF techniques (e.g., Potts and Webb, 1992; Rousseau et al., 1996). Both labs used the fused-bead technique for major elements and pressed-powder pellets for the determination of trace elements. Values for samples analyzed by both laboratories are generally within analytical error (Rousseau et al., 1996). The samples were analyzed for major, minor, and several trace elements (Zr, Y, Zn, Cu, Rb, Sr, Nb, Ga, Ce, V, Pb, U, Th, and As). Major element analyses in the database are presented both in unnormalized form and after removing LOI (loss on ignition; see below) and renormalizing the composition to 100 %. Figure 8a shows the samples categorized by lithology plotted on a total alkali–silica diagram (Le Maitre et al., 2002). Note that this diagram shows both altered and unaltered rocks. Most of the samples plot in the basalt field, as expected. Although it has been suggested that hydrothermal alteration in Icelandic rocks is close to an isochemical process (Franzson et al., 2008), many lava flows, hyaloclastites, and basaltic intrusions plot outside of the basalt field due to the effects of intensive quartz precipitation and silicification. In addition, many of the silicic volcanic rocks or silicic intrusions appear to be depleted in silica compared with what would be expected given the lithological identifier, which is based on geologic context and visual characteristics. One chemical metric quantifying the extent alteration is LOI, which was measured in many of the samples; while LOI is the sum of H2O and CO2, H2O+, CO2, and Stotal were additionally separately analyzed in a subset of samples. Figure 8b shows the clear relationship between LOI and the extent of alteration quantified by point counting in a subset of lava flows, with the LOI increasing up to a maximum of ∼12 wt % as the degree of alteration approaches 100 %.
The mineralogy of core samples from Lévy et al. (2018, 2019a, b and 2020b) were analyzed using XRD. Quantitative (crystalline) phase analysis was performed using Rietveld refinements of XRD patterns on randomly oriented mounts of whole-rock powder samples. The powders were front-loaded onto the sample holder, and a razor blade was used to smoothen the surface and avoid preferred orientations (Bish et al., 1989). When several clay minerals with overlapping peaks (e.g., smectite and mixed-layer smectite–chlorite) are present, Rietveld refinements pose a problem of ambiguity for the quantitative analyses. Therefore, smectite quantification was performed using CEC measurements, following Lévy et al. (2020a) who found a linear correlation between CEC and smectite content quantified using X-ray diffraction in samples where smectite is the only clay mineral.
The CEC represents the total capacity of a rock medium to hold exchangeable cations and is the sum of variable (pH-dependent) CEC and permanent CEC. While CEC in soil science is typically expressed in milliequivalents (meq) or in millimoles (mmol) of electrons per 100 g of rock, this is numerically equivalent to a given amount of charge per kilogram (1 meq 100 g C kg−1, where “C” denotes coulomb). To measure CEC on core samples from Krafla, Lévy et al. (2020a) modified a protocol originally designed to measure CEC on pure clay samples (Meier and Kahr, 1999) that uses copper-triethylenetetramine(II) “Cu-trien”. The smectite content was then determined using the following formula:
where ρdry and ρsmec are the dry density of the sample and the density of smectite (in g cm−3), respectively. The ratio is used as a measure of the smectite weight fraction, with CEC0=91 meq g−1 being the average CEC of pure smectite in these types of samples (Lévy et al., 2020a).
3.5 Acoustic velocities and mechanical properties
Acoustic velocities are available for 295 samples in the database (Franzson and Tulinius, 1999; Frolova et al., 2005; Reinsch et al., 2016; Lévy et al., 2020b). Acoustic velocities express the propagation rate of mechanical waves – compressional P waves and shear S waves – in a bulk environment, composed of solid minerals and fluid in pores and fractures, which can be either gas or liquid. For the samples analyzed by Frolova et al. (2005) and Franzson et al. (2011), sonic wave velocities were measured using the ultrasonic pulse transmission technique according to the Russian state standard (State Standard 21153.7-75, 1985). The travel times for P waves were calculated using the time cursor on the oscillogram. Velocities were then calculated from the core length and the travel time measurement. The frequency of the pulser was 1 MHz for dense samples and 250 kHz for more porous samples. The measurements were done in dry as well as in water-saturated states. The samples analyzed by Franzson and Tulinius (1999) were only measured in the saturated state by the Danish Geotechnical Institute, using a standard Hoek cell with lead foil between the specimen and end piston to ensure contact. The samples were loaded in a hydrostatic stress state to 1, 2.5, and 10 MPa, and P-wave velocities were measured at each stress level; as the measured values show little dependence on confining stress between 1 and 2.5 MPa, the values presented in the database are the averages of these two measurements. The samples of Flovenz et al. (2005) were analyzed in the saturated state by Jaya et al. (2010) at the German Research Center for Geosciences (GFZ). Briefly, ultrasonic measurements were performed with piezoelectric ceramics Stelco-type P850 and PPK62, for compressional waves and shear waves, respectively. The ultrasonic excitation signal was a rectangular voltage single burst at 1.0 V and 400 kHz. The signal was magnified by an Amplifier Research 50A220 before being used for excitation. Although an S-wave measurement was also performed, only the recorded P-wave data are provided because the S-wave arrivals were strongly attenuated. For the samples analyzed by Reinsch et al. (2016) and Lévy et al. (2020b), seismic wave velocities were measured under both dry and saturated conditions at the University of Montpellier using coupled piezoelectric transducers with a 500 kHz resonance frequency. A transmission wave technique with a transmitter and receiver was applied, wherein an electrical spike impulsion (amplitude of −400 V, width of 10 ns) is sent on the transmitter, and the acoustic wave transmitted through the rock is analyzed on an oscilloscope with 200 MHz of bandwidth and a sampling frequency of 2 GHz. A coupling gel was used for Vp, and honey was used for Vs. The relatively accuracy of the measurements is estimated to be ∼3 %. While the arrival time of P waves is relatively easy to observe, that of S waves is often more ambiguous, yielding higher uncertainties. Thus, there is a greater abundance of data for P-wave velocities compared with S-wave velocities as well as for dry compared with saturated conditions.
Mechanical parameters refer to the strength characteristics of rocks and their potential for deformation, and they include the Young's modulus (E), Poisson's ratio (ν), and the uniaxial compressive (σc) and tensile (σt) strength. The unconfined compressive strength is measured by loading the samples and recording the pressure at failure (Pfail):
where A is the sample cross-sectional area. The Young's modulus is obtained by the slope of the stress–strain curve, usually at a point of 50 % of σc, according to
Poisson's ratio is the ratio between the radial- and axial-strain, defined as
This was only measured for a few samples subject to triaxial tests. The tensile strength was only measured by Árngrimsson and Gunnarsson (2009) using the so-called Brazilian disk method, where a circular cylindrical sample is compressed along its diameter and strain is measured. The tensile strength (in MPa) was calculated using the following equation:
where D is the sample diameter (mm) and t is the thickness of the sample (mm).
For the hyaloclastite samples analyzed by Frolova et al. (2005) and Franzson et al. (2011), the uniaxial compressive strength test was performed using standard testing procedures in accordance with Russian state standard 21153.2–84 (1984) and ASTM International standard ASTM D7012 (2013). Uniaxial compressive strength was measured using a German hydraulic press CDM-10/91 and was determined for samples in dry and water-saturated states. The samples analyzed by Árngrimsson and Gunnarsson (1999) were analyzed at the Technical University of Denmark (DTU), which performed triaxial tests on five samples, and the Danish Geotechnical Institute (GEO), which performed Brazilian disk tests on 55 samples and unconfined compressive strength tests on 36 samples, using methods according to the International Society for Rock Mechanics (ISRM) standard (Ulusay and Hudson, 2007). The elastic constants given for the samples from Frolova et al. (2005), Franzson and Tulinius (1999), and Jaya et al. (2010) were calculated from the measured wave velocities and the bulk density (e.g., Mavko et al., 2009).
3.6 Thermal properties
Thermal conductivity measurements for two samples described in Franzson and Tulinius (1999) were carried out by the Department for Geophysics at the University of Aarhus. The thermal conductivity was measured under saturated conditions using the divided-bar technique, and the vertical stress level was 1 MPa. In addition, thermal conductivity measurements for the samples analyzed by Friðleifsson and Vilmundardóttir (1998) and Guðlaugsson (2000) were performed by New England Research (Johnson and Boitnott, 1998). For the latter study, 57 measurements of thermal conductivity under unsaturated conditions were performed on samples obtained from a single, unaltered lava flow in the Reykjavik area.
Although most of the roughly ∼21 000 data points contained in Valgarður have been presented in previous studies (Table 1), combining the data from different types of studies (e.g., petrophysical, geochemical, and petrographical) can elucidate the relationship between lithology, alteration, physical properties, and rock chemical and mineralogical composition. A full description of this relationship is beyond the scope of this article. Here, we provide summary statistics for porosity, grain density, and permeability; describe how lithology and interconnected porosity control the alteration process; and show how alteration controls physical properties such as porosity, permeability, grain density, resistivity, elastic wave velocities, and strength.
4.1 Summary statistics
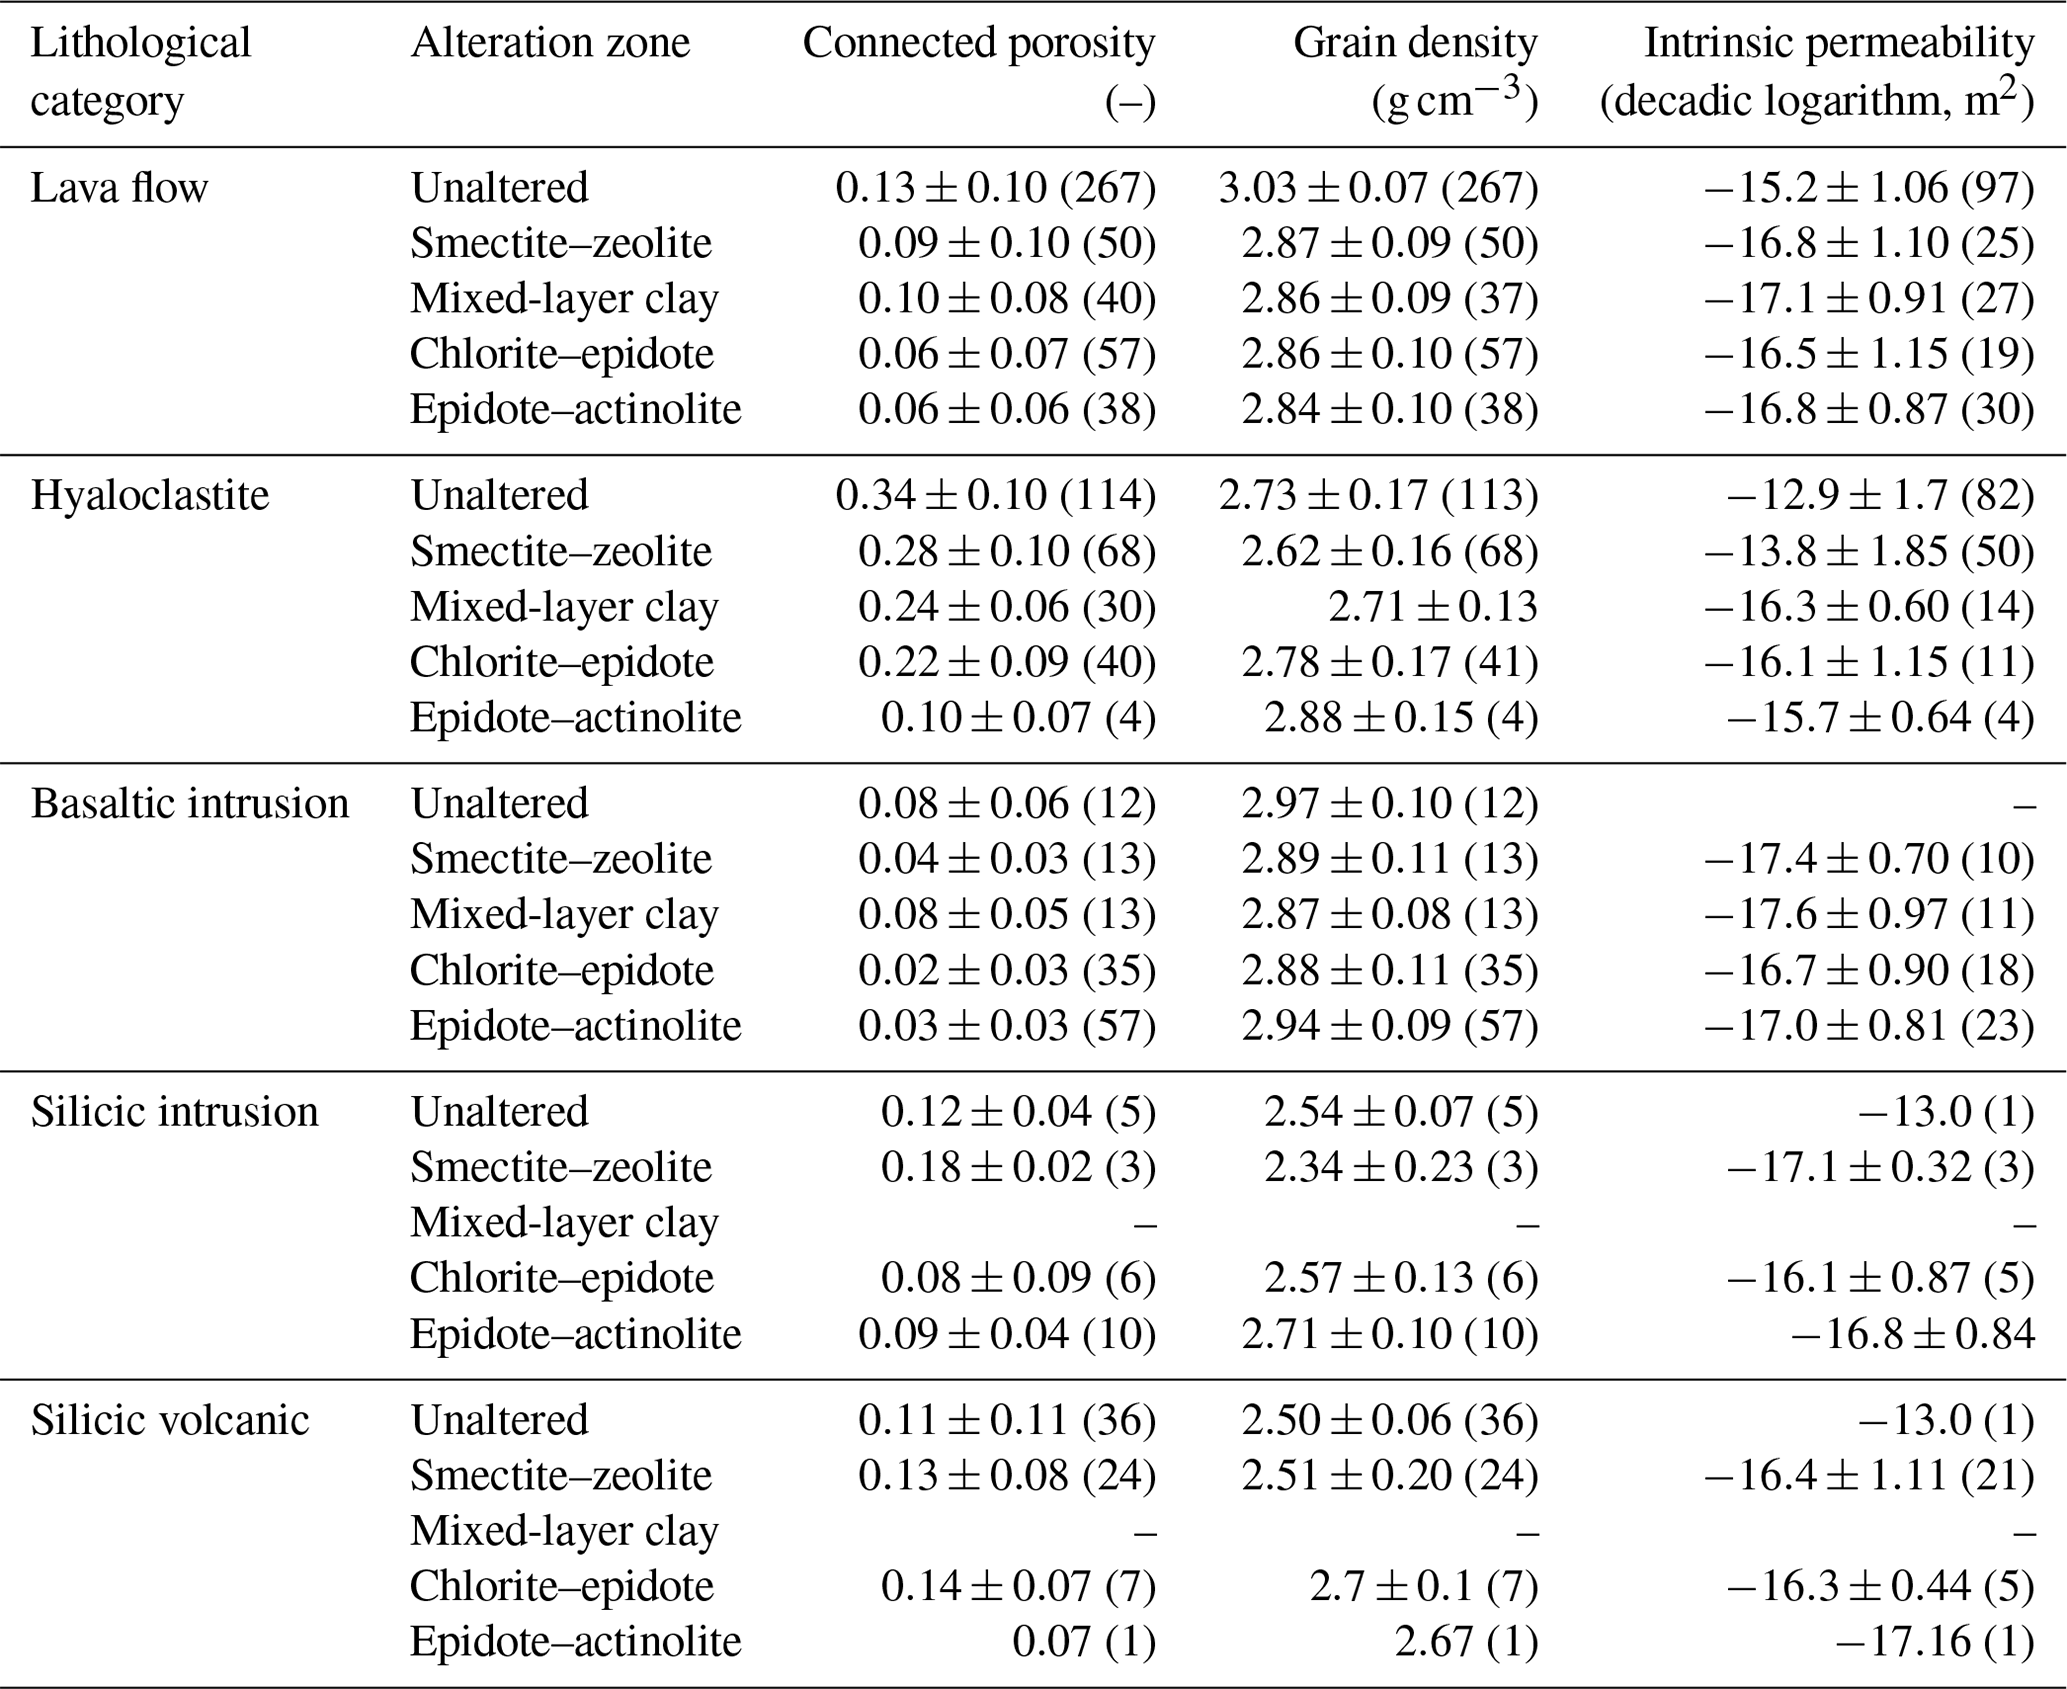
The roughly ∼21 000 data points comprising the database reveal complex relationships between lithology, alteration, physical parameters, and chemical and mineralogical composition. Table 5 provides summary statistics by rock type and alteration zone for some of the best-characterized parameters (connected porosity, grain density, and intrinsic permeability). These statistics highlight some expected trends – such as the higher porosity of hyaloclastites (0.2–0.5) compared with lava flows (0.01–0.35) and basaltic intrusions (0.01–0.15), the decrease in porosity that generally accompanies alteration, and the lower grain density of silicic rocks (∼2.5 g cm−3) compared with basaltic rocks (2.8–3 g cm−3 for basaltic lava flows and intrusions). Notably, Table 5 indicates that smectite–zeolite altered hyaloclastites tend to have high porosity (0.2–0.3), low grain density (∼2.7–2.8 g cm−3), and relatively high permeability ( m2). Hyaloclastites altered to mixed-layer clay, chlorite–epidote, or chlorite–epidote conditions, which tend to develop under hotter-temperature conditions (250 ∘C) in active geothermal systems, show lower permeability ( m2) but maintain relatively high porosity (0.2). Basaltic intrusions tend to show alteration under high-temperature conditions along with lower porosity (0.02–0.1), higher grain density (2.9–3 g cm−3), and lower permeability ( m2).
Table 5Summary statistics for connected porosity, grain density, and intrinsic permeability for samples categorized by broad lithological identifier and alteration zone. The number of samples used to calculate the mean and standard deviation is presented in parentheses. Data are only presented for lithology–alteration zone combinations with sufficient data to calculate summary statistics. Note that the values given for intrinsic permeability were calculated using the decadic logarithm of the data.
Note that the permeability values presented in Table 4 are representative of matrix permeability, and permeability measured in the field (e.g., using well testing) commonly exceeds the matrix permeability by an order of magnitude or more due to the control of fracture permeability on bulk permeability (e.g., Björnsson and Bödvarsson, 1990). Therefore, upscaling these data for reservoir modeling will require the consideration of the impact of fractures on the permeability. This can be treated in an idealized sense using dual-porosity/permeability models (Pruess and Narasimhan, 1985) or by explicitly representing the fractures in models using discrete fracture networks (Cacas et al., 1990). Moreover, geostatistical approaches to upscaling laboratory permeability to field-scale numerical grids require knowledge of the uncertainty of matrix permeability; Table 4 indicates that the standard deviation of permeability for a given lithology–alteration zone combination often exceeds 1 order of magnitude, and the range of measured permeability for a given rock type (e.g., unaltered lava flows and hyaloclastites) can exceed 6 orders of magnitude (10−17–10−11 m2). Table 4 additionally indicates that there is a paucity of data for certain rock types, such as unaltered basaltic intrusions and silicic intrusions.

Figure 9The relationship between pore connectivity and total porosity. Samples categorized by lithology. The gray fields corresponds to unphysical values of connectivity (C>1), which could result from variability in grain density (see text).
4.2 The lithologic control on pore connectivity and alteration
Whether alteration leads to porosity creation or destruction depends on both the type and extent of alteration as well as the primary connected porosity of the rock (e.g., Mordensky et al., 2018; Villeneuve et al., 2019). Different volcanic rocks' lithologies show variability in pore connectivity linked to the geometry of the pore network formed during magma crystallization, vesiculation, fragmentation, and densification (e.g., Blower, 2001; Bernard et al., 2007; Yokoyama and Takeuchi, 2009; Wright et al., 2009; Kennedy et al., 2010; Heap et al., 2014; Colombier et al., 2017). Figure 9 shows calculated pore connectivity (; Colombier et al., 2017) as a function of total porosity for the samples in the database. While hyaloclastites with a porosity greater than 0.1 generally show high connectivity (>0.9), many lava flows, pillow basalts, basaltic intrusions, and silicic volcanic rocks with porosity values of <0.1–0.3 have intermediate connectivity (0.3–0.8). Lava flows and basaltic intrusions with total porosity <0.05 show the lowest connectivity (<0.25). Note that a few samples have nonphysical values of pore connectivity >1, which are likely the result of employing an overly low measured grain density (Colombier et al., 2017) in the calculation of total porosity according to Eq. (3).
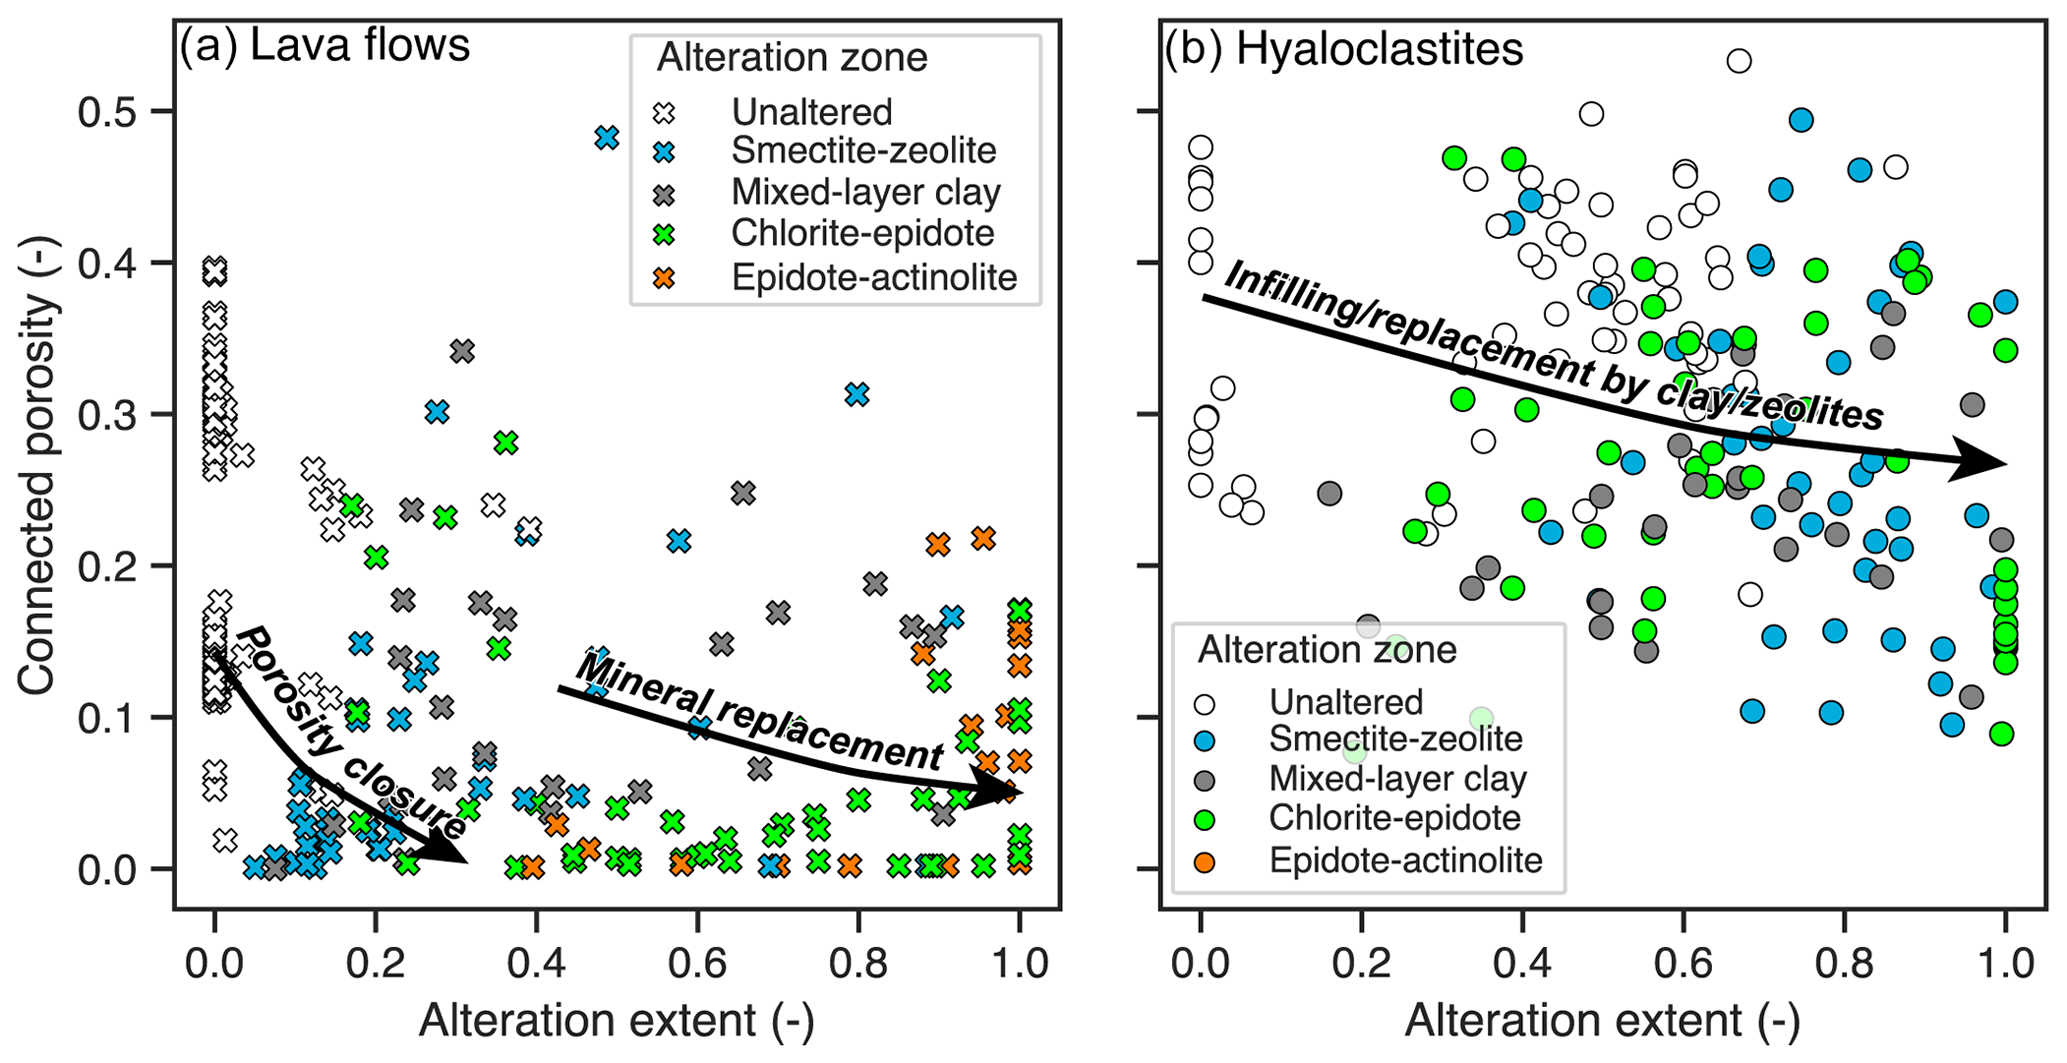
Figure 10The relationship between alteration extent, as determined by petrographic observations and XRD, and the connected porosity for (a) lava flows and (b) hyaloclastites. High-porosity rocks such as hyaloclastites undergo near-complete mineral replacement in the smectite–zeolite facies, whereas rocks with low porosity, such as lava flows, undergo porosity closure after a limited extent of alteration. Rocks altered to chlorite–epidote or epidote–actinolite facies show higher alteration extents because of replacement of primary minerals and secondary minerals.
Mineralogical observations derived from petrography and XRD suggest that rocks with greater connected porosity undergo a greater extent of hydrothermal alteration. Figure 10 shows this by plotting total alteration on the x axis against connected porosity. Lava flows (Fig. 10a), which may have very high connected porosity within the vesicular margins but more often have low connected porosity (<0.2), only undergo a relatively small extent of smectite–zeolite alteration before porosity closure limits further alteration. In contrast, hyaloclastites (Fig. 10b), which tend to have higher connected porosity (>0.2), undergo near-complete replacement of glass and primary minerals with respect to smectite–zeolite alteration. While alteration of hyaloclastites under smectite-zeolite conditions proceeds via palagonitization, replacement of basaltic glass by smectite clay, and infilling of clay and zeolites in vesicles, under higher-temperature chlorite–epidote (>240 ∘C) or epidote–actinolite (>280 ∘C) conditions, alteration proceeds to an increasing extent by replacement of smectite clays formed under lower-temperature conditions by chlorite as well as replacement of primary minerals to form secondary minerals such as epidote, wairakite, and actinolite (e.g., Franzson and Gunnlaugsson, 2021). As the result of enhanced replacement of primary minerals during higher-temperature alteration, lava flows with relatively low connected porosity altered to chlorite–epidote or epidote–actinolite conditions tend to show a higher extent of alteration (>0.5). These data are consistent with geochemical modeling which suggests that rocks with a relatively low interconnected primary porosity (<0.2), such as lava flows, will tend to undergo rapid porosity closure during the volumetric changes associated with hydrothermal alteration, whereas rocks with a significant fraction of interconnected primary porosity (>0.2), such as hyaloclastites, will undergo near-complete replacement of basaltic glass and primary minerals by secondary minerals (Thien et al., 2015).
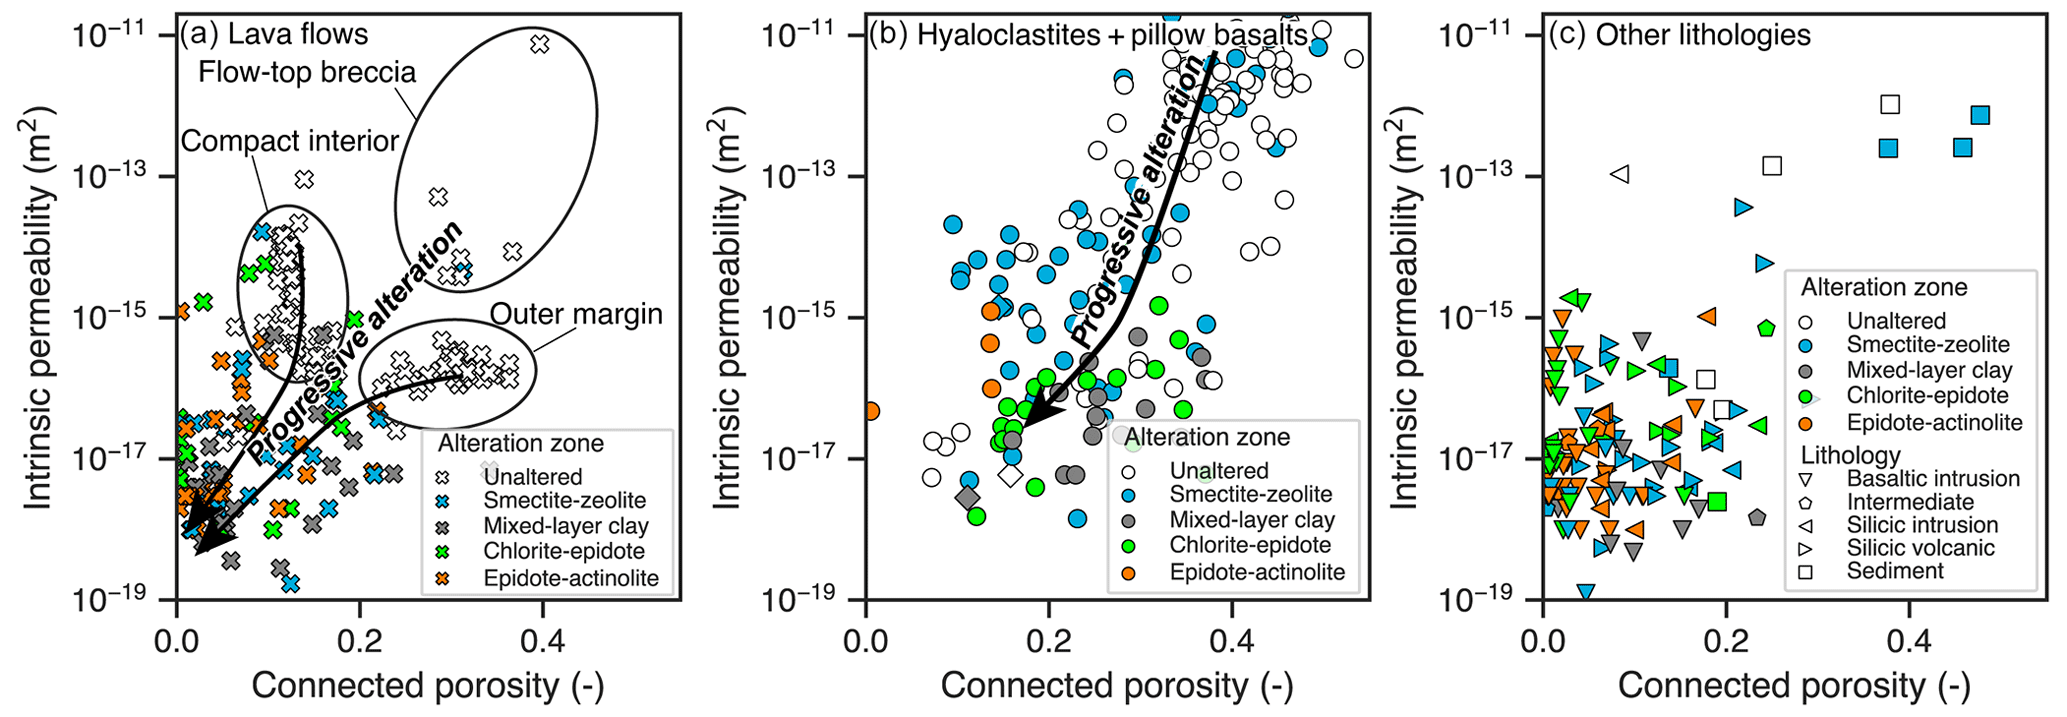
Figure 11The relationship between connected porosity and intrinsic permeability in (a) lava flows, (b) hyaloclastites and pillow basalts, and (c) other lithologies, including basaltic intrusions, silicic intrusions, silicic volcanics, intermediate rocks, and sediments. Samples are colored by alteration zone, with symbols corresponding to different lithologies.
4.3 Permeability–porosity relationships in altered basalts
While many previous studies have found that the permeability of volcanic rocks tends to increase with increasing porosity (e.g., Saar and Manga, 1999; Blower, 2001; Farquharson et al., 2015, 2017; Wadsworth et al., 2016; Colombier et al., 2017), studies have also shown that the permeability of unaltered and altered volcanic rocks can be quite variable (e.g., Heap et al., 2017a; Mordensky et al., 2018; Villeneuve et al., 2019). Figure 11 shows connected porosity and permeability in lava flows (Fig. 11a), hyaloclastites and pillow basalts (Fig. 11b), and other lithologies (Fig. 11c). While permeability generally increases with porosity, this relationship is not very strong, with variability ranging over more than 5 orders of magnitude at a given porosity. For example, unaltered lava flows show a large range of permeability (10−17–10−11 m2). The two dense clusters of data points in Fig. 11a originate from detailed investigations of a single, unaltered olivine tholeiite lava flow of Pleistocene age located on Öskuhlíð, in the Reykjavik area (Friðleifsson and Vilmundardóttir, 1998; Guðlaugsson, 2000; Franzson et al., 2001). One of these clusters consists of samples obtained from the coarser, inner part of the flow and shows high permeability at relatively low connected porosity; a second cluster consists of samples originating from the more glass-rich vesicular outer margin and shows lower permeability at higher connected porosity (0.2–0.4). This enigmatic permeability–porosity relationship has been interpreted to be the result of high pore interconnectivity in the compact flow interior due to grain boundary microcracks (the presence of which is inferred from the low P-wave velocities of these samples), whereas larger vesicles on the outer margin are largely isolated (Guðlaugsson, 2000; Franzson et al., 2001). The Öskuhlíð lava flow is relatively young (<2.5 Ma) and has not yet undergone burial. Unaltered lava flows collected from the brecciated margins of lava flows in other settings show high connected porosity as well permeabilities as high as 10−11 m2.
Alteration generally causes permeability to decrease. However, many hyaloclastite tuffs and some lava flows with high initial connected porosity (<0.3) maintain relatively high permeability (10−16 m2), even if altered under high-temperature chlorite–epidote or epidote–actinolite conditions. While the permeability of unaltered hyaloclastites and hyaloclastites altered under smectite–zeolite conditions can be as high as 10−11 m2, hyaloclastites altered under higher-temperature conditions show highly variable but lower permeability (10−17–10−14 m2) (Fig. 11b). In lava flows (Fig. 11a), progressive alteration tends to reduce the connected porosity and permeability to <0.2 and 10−18–10−16 m2, respectively, and some lava flows altered to chlorite–epidote or epidote–actinolite conditions have moderate permeability ( m2), even though connected porosity is <0.1. Due to the relatively low connected porosity of basaltic intrusions, most of which are altered to chlorite–epidote or epidote–actinolite conditions, permeability tends to be low (10−18–10−16 m2) (Fig. 11c). Although the data are limited, they suggest that the permeability of silicic intrusions is slightly higher (10−17–10−15 m2) compared with basaltic intrusions and that the permeability of silicic volcanics can be variable (10−18–10−15 m2).
Putting these data in the context of the petrographic observations described above (Fig. 10), high-porosity, glass-rich hyaloclastites maintain high permeability during the alteration process because of their high primary porosity, thereby allowing greater fluid through-flux and facilitating progressive alteration (basaltic glass dissolution and secondary mineral precipitation). More rapid porosity closure in response to low-grade alteration in lava flows results in a more rapid permeability decrease, which limits the alteration extent. Although the time–temperature–fluid flux conditions experienced by different rocks are highly variable, the data suggest that the matrix permeability of high-temperature chlorite–epidote or epidote–actinolite conditions can be as high as m2. The ability of rocks to maintain high permeability throughout the alteration process is of crucial importance for successful carbon mineralization in basaltic rocks. These data suggest that the precipitation of volumetrically significant quantities of carbonates and other alteration minerals (e.g., amorphous silica, clays, and zeolites; Gysi, 2017) in the subsurface during the interaction of carbonated water with basaltic rock need not result in porosity closure, as long as the porosity of the target reservoir is 0.25.
4.4 Relationships between grain density and electrical properties in altered volcanic rocks
The database highlights physical relationships between parameters such as grain density and electrical properties and the overall control exercised by lithology and alteration. Electromagnetic methods are commonly used for geophysical exploration, as smectite-rich rocks constituting the low-permeability cap rock in geothermal systems (Cumming, 2016) are known to have a lower resistivity (<10 Ωm) than rocks hosting the underlying high-temperature geothermal reservoir, which often shows resistivities >100 Ωm (e.g., Árnason et al., 2010; Muñoz, 2014). Figure 12a compares grain density and bulk resistivity and shows that there is generally a positive correlation between the two parameters, albeit with significant scatter. The measured data reproduce these expected trends, with the samples altered to smectite–zeolite conditions showing lower resistivity than samples altered to chlorite–epidote or epidote–actinolite conditions. Although the measurements shown in Fig. 12a were performed at room temperature and using a saturating fluid of low salinity/conductivity, the effect of higher saturating fluid salinity/conductivity could be factored in through consideration of the formation factor according to Eq. (11). Figure 12b shows that the calculated formation resistivity factor presents a clear log-linear relationship to connected porosity, with smectite-rich rocks having a higher formation factor at a given porosity. Note that the outlier data points with a low formation resistivity factor (<10) in Fig. 12b all originate from Franzson and Tulinius (1999), who calculated the apparent formation resistivity factor (i.e., conductivity measurements were not performed with saturating fluid of variable salinity/conductivity).
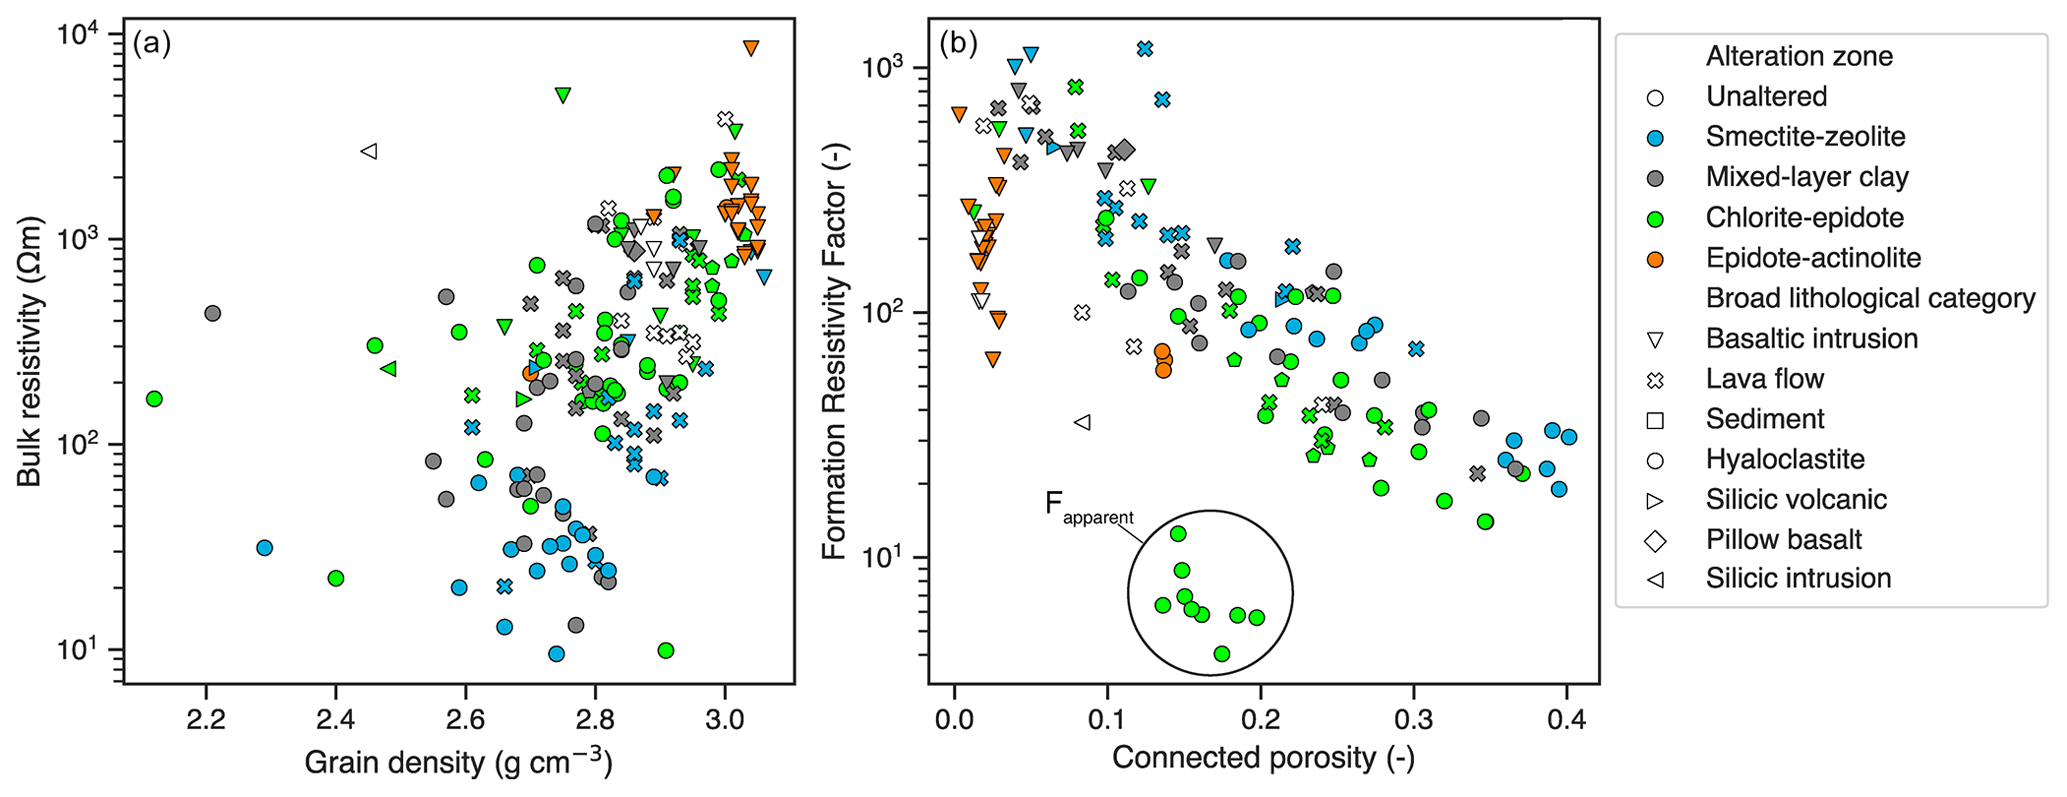
Figure 12(a) The relationship between the grain density and bulk resistivity; measurements were performed using saturating fluid with a low salinity and conductivity (see text). (b) The relationship between the formation resistivity factor and connected porosity; note that the outliers used the apparent formation resistivity factor (see text).
The lower resistivity of smectite-rich rocks has long been known based on both the field measurements described above and experimental studies (e.g., Flovenz et al., 1985). However, Fig. 12a points to a physical relationship between grain density and resistivity in geothermal reservoir rocks. Although the grain density of smectite can range from 2 to 2.6 g cm−3 depending on its hydration status, this is appreciably lower than that of chlorite (2.6–3.3 g cm−3; Deer et al., 2013). While the relationship between low grain density and high conductivity has been seen in other experimental studies (e.g., Nelson and Anderson, 1992), this is perhaps underappreciated in the context of geophysical imaging in geothermal systems. These data suggest that joint inversions of gravimetric and electromagnetic measurements, particularly when combined with porosity constraints based on core measurements and geologic modeling (e.g., Soyer et al., 2018), may facilitate better delineation of the geometry of the cap rock, precise knowledge of which is essential to target the underlying higher-temperature resistive core.
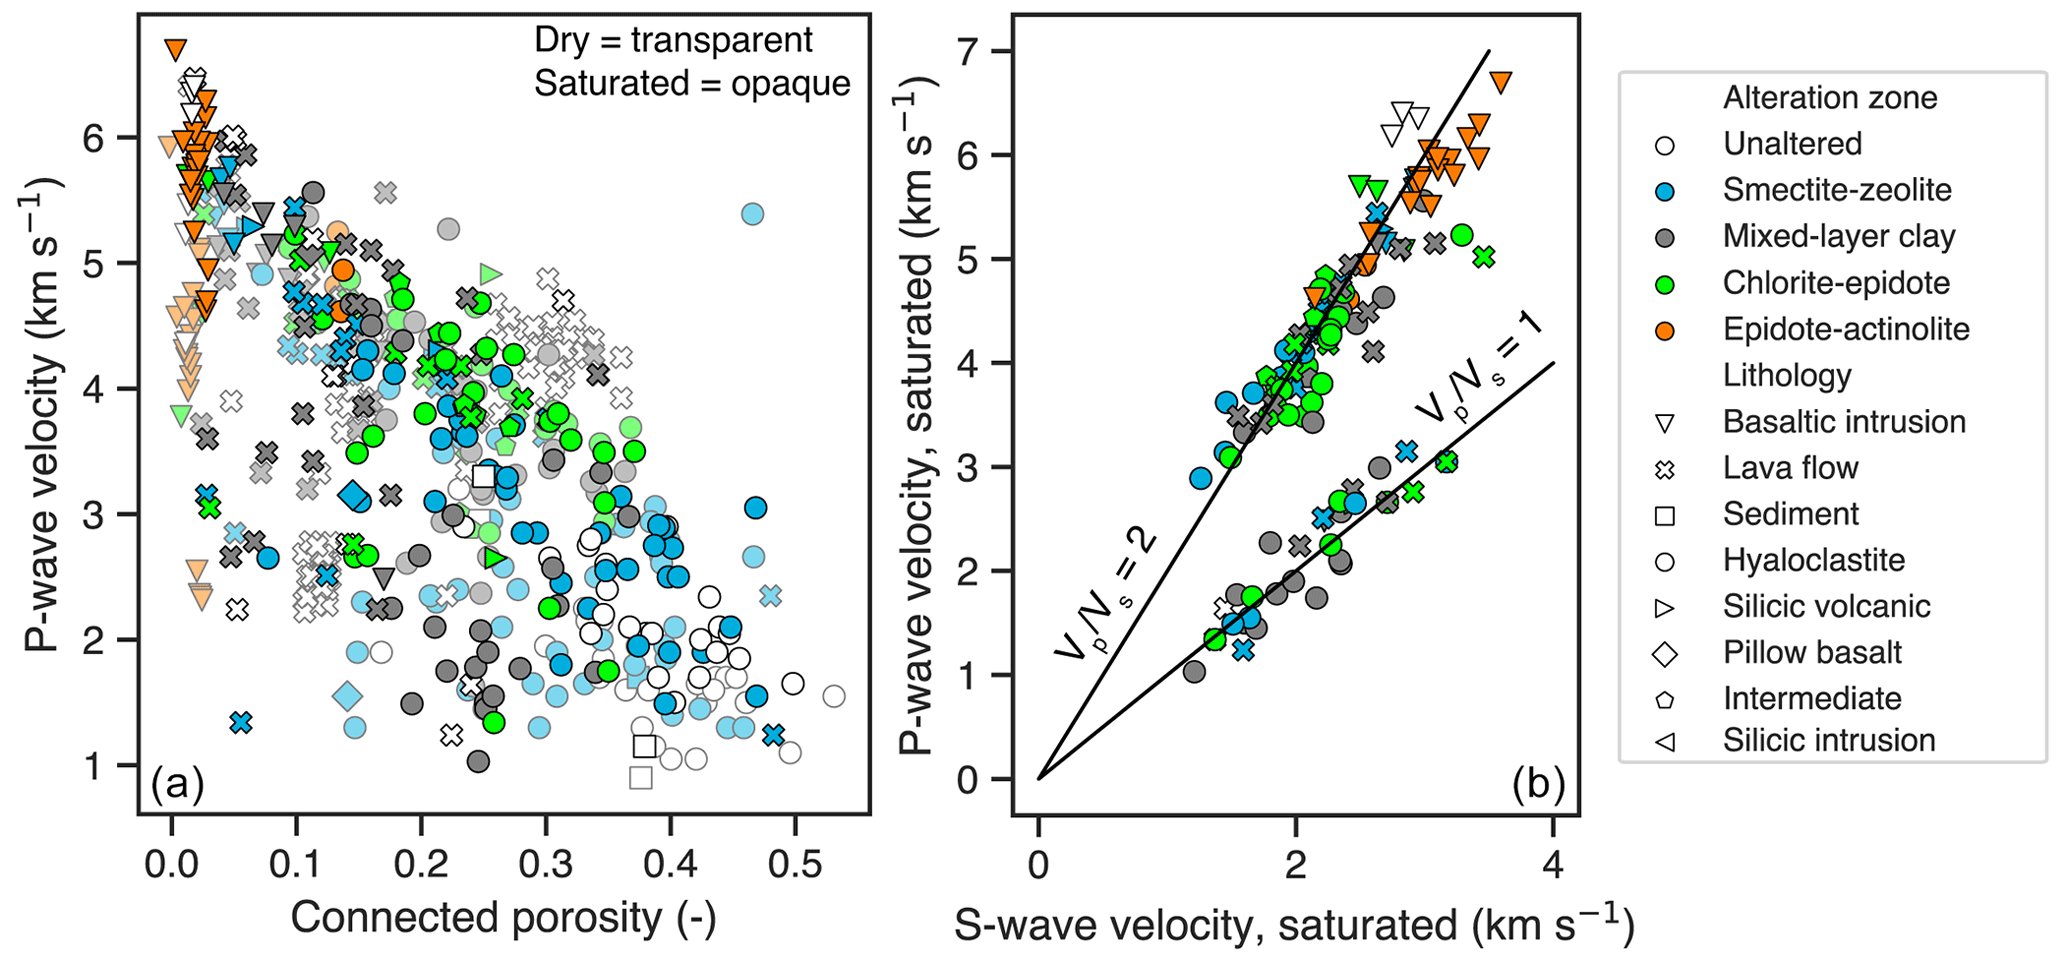
Figure 13(a) Compressional (P-wave) velocities under dry (transparent symbols) and saturated (opaque symbols) conditions versus connected porosity. (b) S-wave velocities versus P-wave velocities under saturated conditions.
4.5 Elastic wave velocities and mechanical properties
Figure 13a shows that compressional (P-wave) velocities are inversely correlated with porosity: basaltic intrusions show the highest velocities and the lowest porosities, whereas hyaloclastites have the lowest velocities and higher porosities. This relationship has been seen in several previous studies of volcanic rocks (e.g., Pola et al., 2014; Frolova et al., 2014, 2021; Wyering et al., 2014; Heap et al., 2015; Durán et al., 2019). However, the data show considerable scatter, and the relationship between acoustics velocities measured under dry conditions (shown using transparent markers) and saturated conditions (shown using opaque markers) is complex (e.g., Nur and Simmons, 1969; Kahraman, 2007; Kahraman et al., 2017). Most of the samples show P waves that tend to travel faster in a water-saturated than dry environment, but several hyaloclastites and lava flows show dry velocities that are systematically ∼1–2 km s−1 greater than the saturated velocities. Figure 13b compares the P-wave velocity with the S-wave velocity under saturated conditions. Most of the samples with saturated P-wave velocities greater than ∼2 km s−1 show a close to ∼2. However, many of the samples with low P-wave velocities (<3 km s−1) have a close to ∼1. The latter samples have variable connected porosity but tend to be brecciated hyaloclastites or flow-top breccias. As P-wave and S-wave velocities are strongly dependent on crack density and geometry, highly cracked rocks may display very low velocities at room conditions in some cases (e.g., Nur and Simmons, 1969; Vinciguerra et al., 2005; Nara et al., 2011). This could explain the low P-wave velocities seen in lava flows and hyaloclastites in Fig. 13.
Alteration impacts rock strength and thus exerts an influence on rock mechanical behavior and failure mode (e.g., Pola et al., 2014; Heap and Violay, 2021). Depending on the porosity changes during hydrothermal alteration and the abundance and type of clay minerals, alteration can increase or decrease rock strength (e.g., Wyering et al., 2014; Frolova et al., 2014, 2021; Pola et al., 2014; Mordensky et al., 2018; Farquharson et al., 2019; Heap et al., 2020a). Figure 14 shows that the uniaxial compressive strength (UCS) (Fig. 14a) and Young's modulus (Fig. 14b) decrease with increasing porosity, as has been observed in several previous studies of volcanic rocks (e.g., Al-Harthi et al., 1999; Pola et al., 2014; Wyering et al., 2014; Heap et al., 2014; Schaefer et al., 2015; Mordensky et al., 2018; Coats et al., 2018; Harnett et al., 2019). However, also consistent with these studies, the data reveal significant scatter; for example, at a porosity of 0.2, UCS can range from ∼10 to ∼100 MPa. Heap and Violay (2021) describe how such variability in rock strength can result from variable hydrothermal alteration, the partitioning of porosity between pores and microcracks, and the rock's geometrical properties.
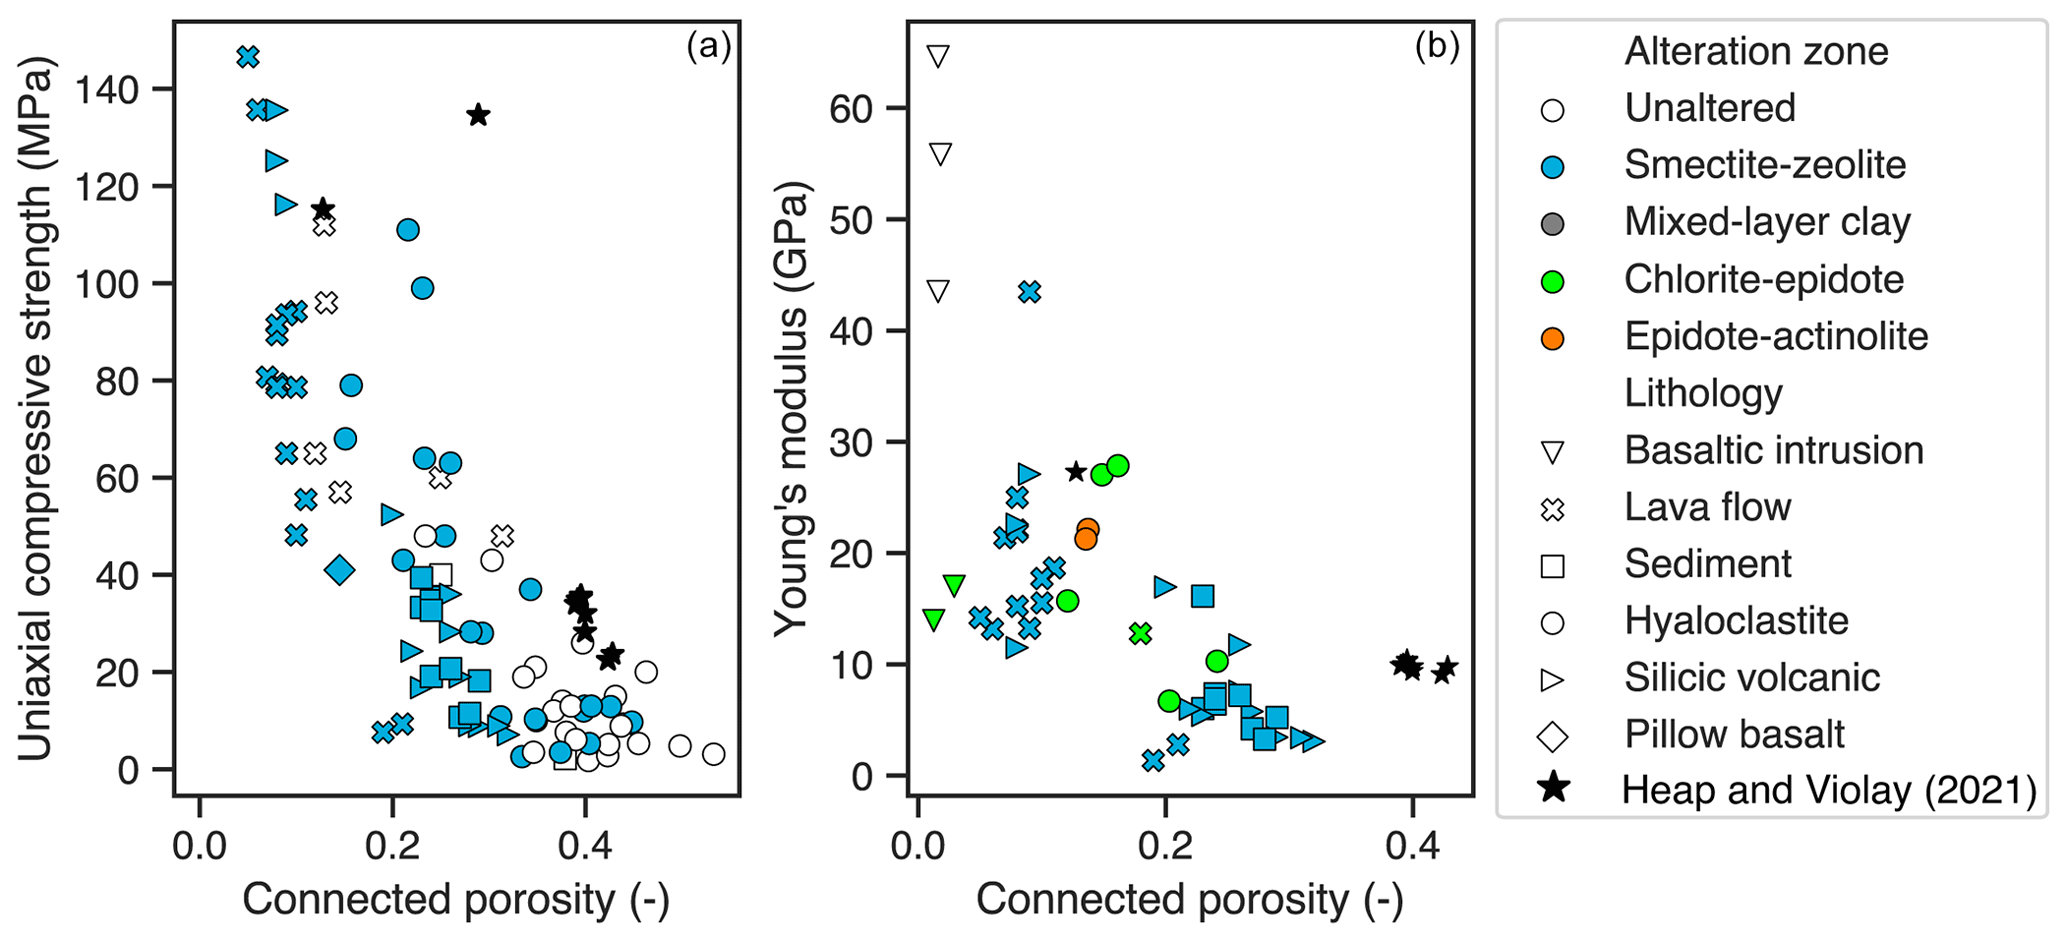
Figure 14(a) Uniaxial compressive strength (UCS) and (b) Young's modulus as a function of connected porosity. Data for Icelandic rocks are from Heap and Violay (2021) and are shown using black stars.
Although altered rocks can show wide variability with respect to strength and permeability, the inverse relationship between rock strength and permeability, as shown in Fig. 15, results from the greater presence of interconnected porosity and microcracks in relatively weak rocks. At the field scale, the low permeability of the smectite-rich cap rock is a result of reduced fracture cohesion and decreased strength, which limit shear and inhibit dilatation of fractures (Dobson et al., 2003; Neuzil, 1994; Davatzes and Hickman, 2010; Wyering et al., 2014; Meller and Kohl, 2014; Sanchez-Alfaro et al., 2016) as well as promoting ductility (Mordensky et al., 2019). In contrast, rocks that have been altered to propylitic conditions and contain a greater abundance of secondary minerals such as chlorite, quartz, and epidote retain rock strength in response to alteration and, consequently, show brittle dilatant behavior during slip (Davatzes and Hickman, 2010; Meller and Kohl, 2014; Sanchez-Alfaro et al., 2016). As field-scale permeability in geothermal systems is commonly fracture controlled (e.g., Lamur et al., 2017; Heap and Kennedy, 2015; Farquharson and Wadsworth, 2018; Jolie et al., 2021), increased rock strength may facilitate the development of the fracture permeability needed to result in productive geothermal wells (e.g., Villeneuve et al., 2019). However, Figs. 14 and 15 show that limited data are currently available for Icelandic rocks altered to chlorite–epidote and epidote–actinolite conditions.
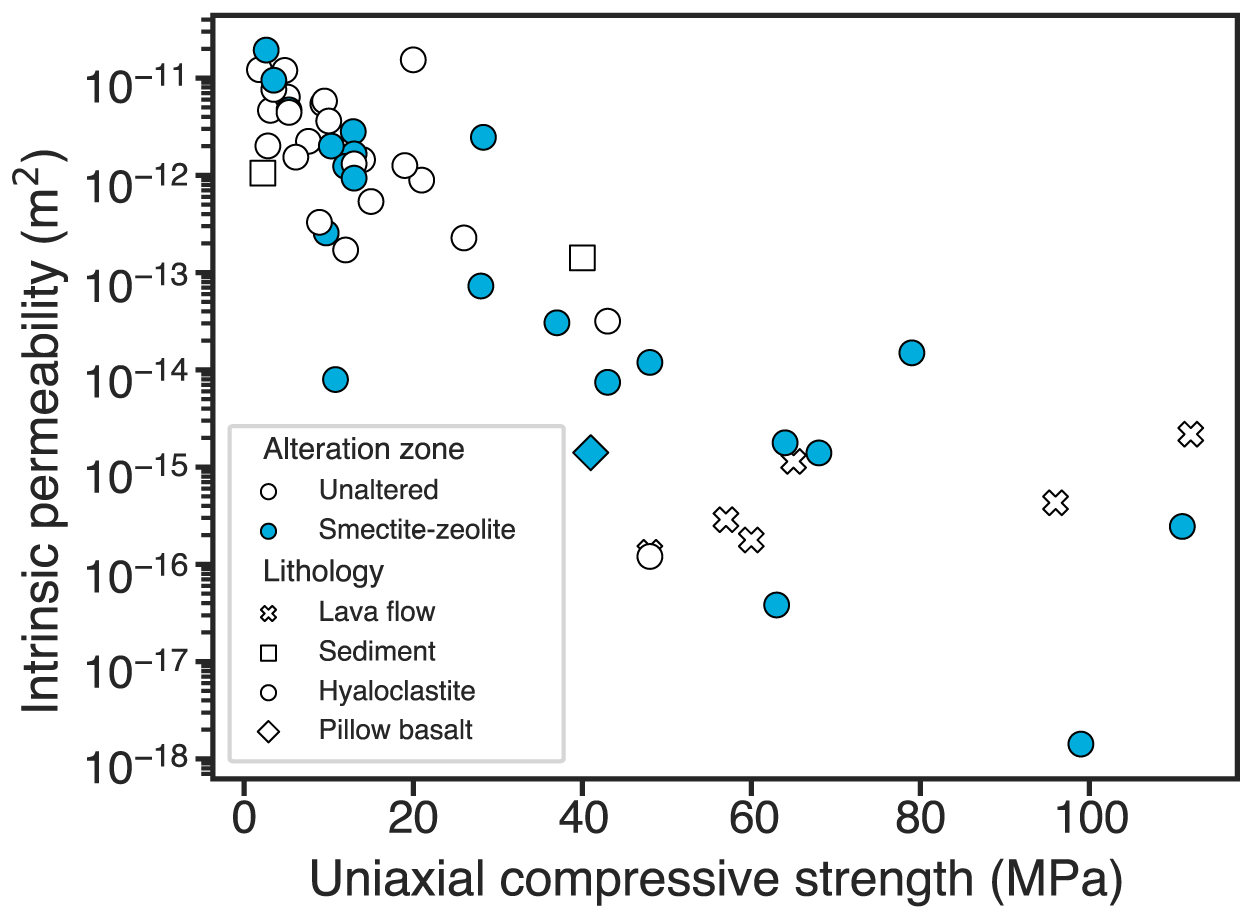
Figure 15Permeability as a function of uniaxial compressive strength. Note that data are only available for unaltered rocks or samples that have been altered to smectite–zeolite conditions.
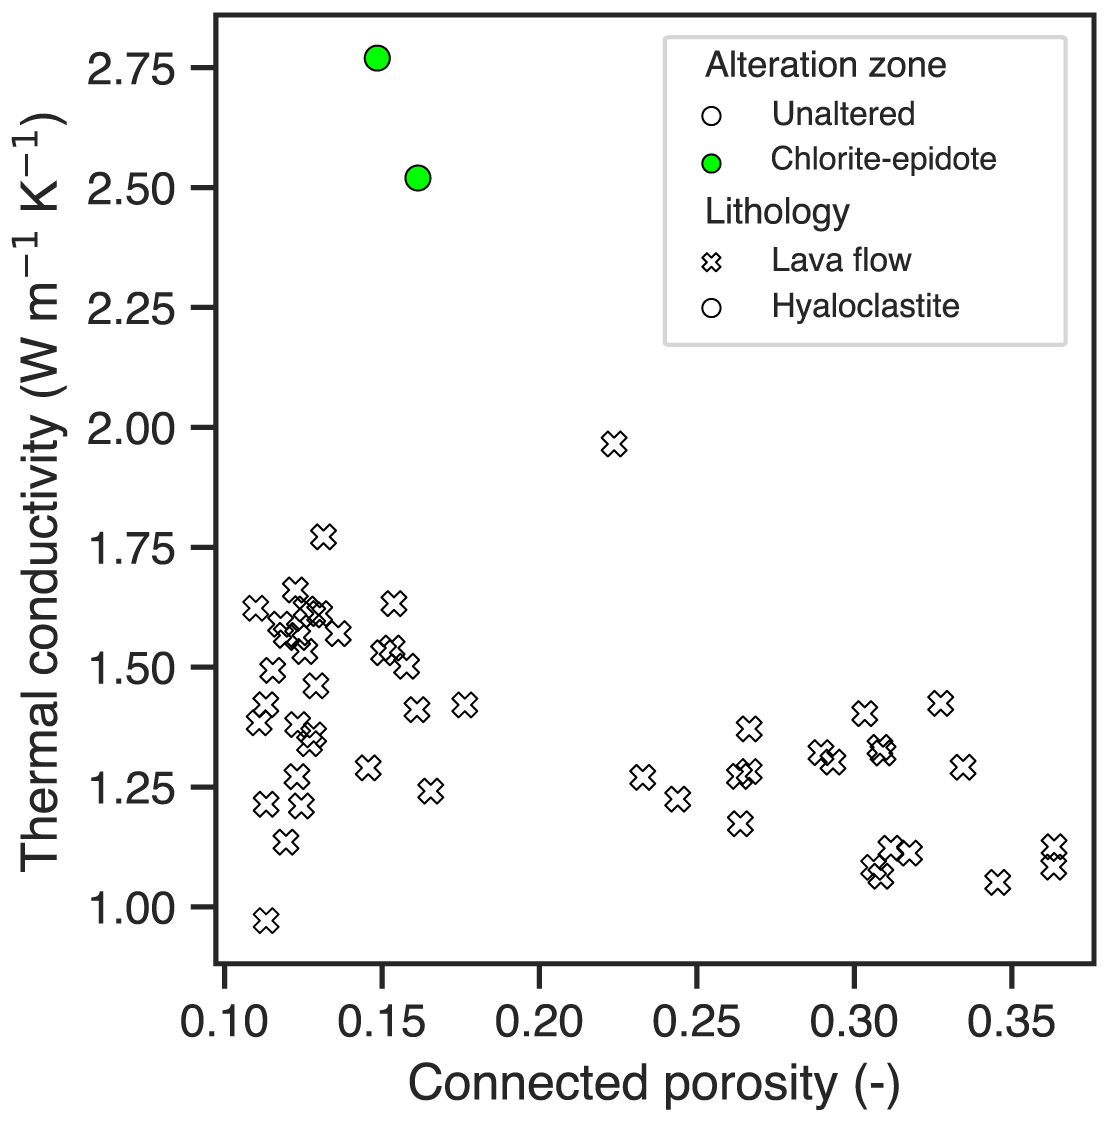
Figure 16Thermal conductivity as a function of connected porosity. Note that most of the available data are derived from a single, unaltered lava flow (Guðlaugsson, 2000). Measurements on the lava flows were performed under unsaturated conditions, whereas measurements on the hyaloclastite samples were performed under water-saturated conditions.
4.6 Thermal conductivity
Previous studies of Hawaiian basalts have shown that thermal conductivity decreases with increasing porosity and increases if the samples are saturated with water (Robertson and Peck, 1974). Although the thermal conductivity data in this study are mainly limited to samples derived from a single, unaltered lava flow in the Reykjavik area (Guðlaugsson, 2000), they suggest a similar relationship (Fig. 16). Thermal conductivity measured under unsaturated conditions ranges from ∼1 to 2 W m−1 K−1, with a general trend suggesting increasing thermal conductivity at lower connected porosity. In contrast, thermal conductivity measured under saturated conditions on two hyaloclastite samples obtained from the ÖJ-1 borehole is significantly higher, ranging from 2.5 to 2.75 W m−1 K−1. Although insufficient data currently exist to characterize the effect of lithology and alteration zone on thermal conductivity, Fig. 16 indicates that significant variability in thermal conductivity within a single lithological unit results from the heterogenous distribution of pore space.
The database is archived on Zenodo at https://doi.org/10.5281/zenodo.6980231 (Scott et al., 2022a) and is available under the Creative Commons Attribution 4.0 International license. This repository includes the main Excel file containing the two main worksheets: one listing sample metadata and petrophysical properties and the other listing geochemical and petrographic data. In addition, we provide a ZIP file containing photographs of the sample sites and an Excel file listing the file names of photographs corresponding to the sample IDs All worksheets are additionally included in the repository as CSV files with the separator “|”. The photographs are also included in the Zenodo repository as a separate directory.
The efforts of geologists in Iceland over the past 50 or more years have resulted in a tremendous amount of data spanning petrophysical, geochemical, and petrographic analyses of a wide range of basaltic rocks and associated silicic and intermediate rocks. However, it has historically been common that, following the publication of a paper or report, the only remaining manifestations of the data are the figures contained in the publication, and much (or all) of the raw underlying data become inaccessible. This practice is only starting to change in response to increasing emphasis on data availability. The motivation of the Valgarður database is to ensure that the data resulting from decades of intensive study of Icelandic geothermal reservoir rocks remain accessible to future generations of geoscientists.
In this paper, we have described the methods used to acquire the data in some detail and have also briefly characterized some aspects of the relationship between lithology, alteration, and petrophysical properties. The different lithologies show systematic differences in interconnected porosity, with lava flows and basaltic intrusions showing lower interconnected porosity (<0.2) than hyaloclastites (>0.3). We propose that, as a result of their higher interconnected porosity, hyaloclastites can undergo near-complete replacement of glass and primary minerals during smectite–zeolite alteration and maintain relatively high interconnected porosity (>0.2), whereas smectite–zeolite alteration in lava flows and intrusions is limited by porosity closure. By reducing interconnected porosity, alteration exerts a first-order control on petrophysical properties such as porosity, permeability, grain density, resistivity, acoustic velocities, and strength. Generally, altered rocks are characterized by lower porosity, lower permeability, lower grain density, lower resistivity, and increased strength. However, there is significant variability depending on lithology and the type/extent of hydrothermal alteration. Although a full description of the relationship between lithology, hydrothermal alteration, and rock chemical composition is beyond the scope of this article, we believe that the database would be well suited for such a study, as many of the samples are highly altered and the database contains whole-rock geochemical data for ∼350 samples.
In the database, basaltic rocks are better characterized than silicic rocks, and there is a relative paucity of mechanical and thermal data, particularly for rocks altered under high-temperature (>240 ∘C) chlorite–epidote or epidote–actinolite conditions. Although we currently restrict the database to measurements under near-ambient conditions, the electrical, mechanical, and transport properties of Icelandic rocks have also been measured under experimental conditions aimed at reproducing in situ conditions in the subsurface (e.g., Vinciguerra et al., 2005; Jaya et al., 2010; Kristínsdóttir et al., 2010; Milsch et al., 2010; Adelinet et al., 2010, 2013; Grab et al., 2015; Eggertsson et al., 2020a, b; Nono et al., 2020; Kummerow et al., 2020; Weaver et al., 2020). In the future, it would be sensible to include measurements performed at variable pressure, temperature, and saturating fluid salinity in the database. However, as most of the measurements included in this database (Table 1) were only performed under near-ambient conditions, we felt that the inclusion of this additional data measured under variable conditions would overly complicate the structure of the database and thereby ultimately limit its usability.
Although the database is restricted to Iceland, we believe that the data contained in this database provide useful constraints on the petrophysical properties of basaltic rocks outside of Iceland. Similar relationships between alteration type/extent and petrophysical properties have been observed in previous studies performed using altered volcanic rocks obtained from geothermal systems in New Zealand (Heap et al., 2017a; Mordensky et al., 2018; Villeneuve et al., 2019) and Mexico (Weydt et al., 2022). However, the limitations of the database should also be acknowledged. For example, thermal conductivity measurements are only available for a relatively small number of samples, most of which were derived from a single lava flow in the Reykjavik area (Guðlaugsson, 2000). Other studies have measured the thermal properties of Icelandic rocks (Ruether, 2011), and thermal conductivity and thermal diffusivity were measured on a large number of samples obtained from a nearly 2 km long core in the Reyðarfjörður region (Oxburgh and Agrell, 1982; Drury, 1985; Flóvenz and Saemundsson, 1993). To the authors best knowledge, the data obtained in these studies do not exist in a tabulated form that is accessible via the internet. This highlights the challenges of ensuring the accessibility of such “legacy” data. As future studies address these gaps in the database, we anticipate future releases of the database using the versioning system available on Zenodo, and these updates will be made available at the same repository address given in this publication (Scott et al., 2022a). Despite the gaps in the data, we believe that the present release of the Valgarður database will enhance the accessibility of the existing data and constitutes a valuable resource for future studies investigating the interplay between the physical and chemical evolution of rocks.
The detailed sample descriptions combined with the photographs of many of the sample sites included as a supplement to the dataset should facilitate future research visits to the investigated areas. Moreover, the remaining cores from the Orkustofnun samples are now kept at Náttúrufræðistofnun (the Icelandic Institute of Natural History) in order for interested parties to continue research.
SWS, HF, LL, BG, JN, AV, and MSG: conceptualization; SWS, CC, LL, EJ, and JF: data curation; SWS, HF, LL, and BG: formal analysis; MSG and SWS: funding acquisition; SWS, HF, LL, and CC: methodology; EJ, BG, HF, MSG, JN, and AV: resource acquisition; SWS, LL, BG, and HF: writing – original draft preparation; SS, LL, BG, HF, JF, and MSG: writing – reviewing and editing.
The contact author has declared that none of the authors has any competing interests.
Publisher's note: Copernicus Publications remains neutral with regard to jurisdictional claims in published maps and institutional affiliations.
Samuel W. Scott and Cari Covell received funding from the Technical Development Fund of the Icelandic Centre for Research (rannís; grant no. 175 193-0612; Data Fusion for Geothermal Reservoir Characterization). This project additionally received funding from the Landsvirkjun Energy Research Fund (grant no. NÝR-23-2019). We acknowledge Kristian Bär for sharing an early version of the PetroPhysical Property Database (P3; Bär et al., 2020). The database represents the collective efforts of many scientists over many decades, and we would like to gratefully acknowledge the contribution of everyone who helped with sample collection, measurement, and data management. This paper was improved by comments from the two anonymous reviewers.
This research has been supported by the Icelandic Centre for Research (grant no. 175 193-0612) and Landsvirkjun (grant no. NÝR-23-2019).
This paper was edited by Kirsten Elger and reviewed by two anonymous referees.
Adelinet M., Fortin, J., Guégin, Y., Schubnel, A., and Geoffroy, L.: Frequency and fluid effects on elastic properties of basalt: Experimental investigations, Geophys. Res. Lett., 37, L02303, https://doi.org/10.1029/2009GL041660, 2010.
Adelinet M., Fortin, J., Schubnel, A., and Guéguen, Y.: Deformation modes in an Icelandic basalt: From brittle failure to localized deformation bands, J. Volcanol. Geoth. Res., 255, 15–25, https://doi.org/10.1016/j.jvolgeores.2013.01.011, 2013.
Aladejare, A. E. and Wang, Y.: Evaluation of rock property variability, Georisk Assess. Manag. Risk Eng. Syst. Geohazards, 11, 22–41, https://doi.org/10.1080/17499518.2016.1207784, 2017.
Al-Harthi, A. A., Al-Amri, R. M., and Shehata, W. M.: The porosity and engineering properties of vesicular basalt in Saudi Arabia, Eng. Geol., 54, 313–320, https://doi.org/10.1016/S0013-7952(99)00050-2, 1999.
American Society for Testing Materials: ASTM D7012-13. Standard test methods for compressive strength and elastic moduli of intact rock core specimens under varying states of stress and temperatures, American Society for Testing Materials, Pennsylvania, USA, https://doi.org/10.1520/D7012-13, 2013.
Anovitz, L. M. and Cole, D. R.: Characterization and analysis of porosity and pore structures, Rev. Mineral. Geochem., 80, 61–164, https://doi.org/10.2138/rmg.2015.80.04, 2015.
Arnalds, O., Gisladottir, F. O., and Sigurjonsson, H.: Sandy deserts of Iceland: an overview, J. Arid Environ., 47, 359–371, https://doi.org/10.1006/jare.2000.0680, 2001.
Árnason, K., Eysteinsson, H., and Hersir, G. P.: Joint 1D inversion of TEM and MT data and 3D inversion of MT data in the Hengill area, SW Iceland, 39, 13–34, https://doi.org/10.1016/j.geothermics.2010.01.002, 2010.
Arnórsson, S.: Geothermal systems in Iceland: Structure and conceptual models–I. High-temperature areas, Geothermics, 24, 561–602, https://doi.org/10.1016/0375-6505(95)00025-9, 1995.
Arngrímsson, H. Ö. and Gunnarsson, Þ. B.: Tunneling in Acidic, Atered and Sedimentary Rock in Iceland – Búðarhálsvirkjun, Master's thesis, Technical University of Denmark, 162 pp., 2009.
Asem, P. and Gardoni, P.: A generalized Bayesian approach for prediction of strength and elastic properties of rock, Eng. Geol., 289, 106187, https://doi.org/10.1016/j.enggeo.2021.106187, 2021.
Banik, T. J., Wallace, P. J., Höskuldsson, Á., Miller, C. F., Bacon, C. R., and Furbish, D. J.: Magma–ice–sediment interactions and the origin of lava/hyaloclastite sequences in the Síða formation, South Iceland, B. Volcanol., 76, 785, https://doi.org/10.1007/s00445-013-0785-3, 2013.
Bär, K., Reinsch, T., and Bott, J.: The PetroPhysical Property Database (P3) – a global compilation of lab-measured rock properties, Earth Syst. Sci. Data, 12, 2485–2515, https://doi.org/10.5194/essd-12-2485-2020, 2020.
Bergh, S. G. and Sigvaldason, G. E.: Pleistocene mass-flow deposits of basaltic hyaloclastite on a shallow submarine shelf, South Iceland, B. Volcanol., 53, 597–611, https://doi.org/10.1007/BF00493688, 1991.
Bennett, M. R., Huddart, D., and McCormick, T.: An integrated approach to the study of glaciolacustrine landforms and sediments: a case study from Hagavatn, Iceland, Quaternary Sci. Rev., 19, 633–665, https://doi.org/10.1016/S0277-3791(99)00013-X, 2000.
Bernard, M.-L., Zamora, M., Géraud, Y., and Boudon, G.: Transport properties of pyroclastic rocks from Montagne Pelée volcano (Martinique, Lesser Antilles), J. Geophys. Res.-Sol. Ea., 112, B05205, https://doi.org/10.1029/2006JB004385, 2007.
Bish, D. L., Reynolds, R. C., and Post, J. E.: Sample preparation for X-ray diffraction, in: Modern Powder Diffraction, edited by: Bish, D. L. and Post, J. E., Rev. Mineral. Geochem., 20, 73-99, 1989.
Björnsson, G. and Bödvarsson, G.: A Survey of Geothermal Reservoir Properties, Geothermics, 19, 17–27, 1990.
Böðvarsson, G. and Walker, G.: Crustal Drift in Iceland, Geophys. J. Roy. Astr. S., 8, 285–300, 1964.
Blower, J.: Factors controlling permeability–porosity relationships in magma, B. Volcanol., 63, 497–504, https://doi.org/10.1007/s004450100172, 2001.
Brace, W. F., Walsh, J. B., and Frangos, W. T.: Permeability of granite under high pressure, J. Geophys. Res., 73, 2225–2236, https://doi.org/10.1029/JB073i006p02225, 1968.
Browne, P. R.: Hydrothermal Alteration in Active Geothermal Fields, Annu. Rev. Earth Planet. Sci., 6, 229–250, 1978.
Burchardt, S. and Gudmundsson, A.: The infrastructure of Geitafell volcano, southeast Iceland, Stud. Volcanol. Leg. Georg. Walker, Spec. Publ. IAVCEI, 2, 349–370, https://doi.org/10.1144/IAVCEl002.18, 2009.
Cacas, M. C., Ledoux, E., de Marsily, G., Tillie, B., Barbreau, A., Durand, E., Feuga, B., and Peaudecerf, P.: Modeling fracture flow with a stochastic discrete fracture network: calibration and validation: 1. The flow model, Water Resour. Res., 26, 479–489, https://doi.org/10.1029/WR026i003p00479, 1990.
Cant, J. L., Siratovich, P. A., Cole, J. W., Villeneuve, M. C., and Kennedy, B. M.: Matrix permeability of reservoir rocks, Ngatamariki geothermal field, Taupo Volcanic Zone, New Zealand, Geothermal Energy, 6, 2, https://doi.org/10.1186/s40517-017-0088-6, 2018.
Ceryan, S., Tudes, S., and Ceryan, N.: A new quantitative weathering classification for igneous rocks, Environ. Geol., 55, 1319–1336, https://doi.org/10.1007/s00254-007-1080-4, 2008.
Chayes, F.: Petrographic model analysis: an elementary statistical appraisal, John Wiley and Sons, New York, New York, United States of America, 1956.
Coats, R., Kendrick, J. E., Wallace, P. A., Miwa, T., Hornby, A. J., Ashworth, J. D., Matsushima, T., and Lavallée, Y.: Failure criteria for porous dome rocks and lavas: a study of Mt. Unzen, Japan, Solid Earth, 9, 1299–1328, https://doi.org/10.5194/se-9-1299-2018, 2018.
Cole, T. L., Torres, M. A., and Kemeny, P. C.: The Hydrochemical Signature of Incongruent Weathering in Iceland, J. Geophys. Res.-Earth, 127, e2021JF006450, https://doi.org/10.1029/2021JF006450, 2022.
Colombier, M., Wadsworth, F. B., Gurioli, L., Scheu, B., Kueppers, U., Di Muro, A., and Dingwell, D. B.: The evolution of pore connectivity in volcanic rocks, Earth Planet. Sc. Lett., 462, 99–109, https://doi.org/10.1016/j.epsl.2017.01.011, 2017.
Cox, S. F.: Coupling between Deformation, Fluid Pressures, and Fluid Flow in Ore-Producing Hydrothermal Systems at Depth in the Crust, in: SEG One Hundredth Anniversary Volume, edited by: Hedenquist, J. W., Thompson, J. F. H., Goldfarb, R. J., and Richards J. P., Society of Economic Geologists, Littleton, Colorado, United States of America, https://doi.org/10.5382/AV100.04, 2005.
Cumming, W.: Geophysics and resource conceptual models in geothermal exploration and development, in: Geothermal Power Generation: Developments and Innovation, edited by: R. DiPippo, Woodhead Publishing, New York, United States of America, 33–75, https://doi.org/10.1016/B978-0-08-100337-4.00003-6, 2016.
Davatzes, N. C. and Hickman, S. H.: The Feedback Between Stress, Faulting, and Fluid Flow: Lessons from the Coso Geothermal Field, CA, USA, in: Proc. World Geotherm. Congress 2010, Bali, Indonesia, http://www.geothermal-energy.org/pdf/IGAstandard/WGC/2010/1267.pdf (last access: 14 March 2023), 25–29 April 2010.
Deer, W. A., Howie, R. A., and Zussman, J.: An Introduction to the Rock-Forming Minerals, Mineralogical Society of Great Britain and Ireland, https://doi.org/10.1180/DHZ, 2013.
Dessert, C., Dupré, B., Gaillardet, J., François, L. M., Allègre, C. J.: Basalt weathering laws and the impact of basalt weathering on the global carbon cycle, Chem. Geol., 202, 257–273, https://doi.org/10.1016/j.chemgeo.2002.10.001, 2003.
Dobson, P. F., Kneafsey, T. J., Hulen, J., and Simmons, A.: Porosity, permeability, and fluid flow in the Yellowstone geothermal system, Wyoming, J. Volcanol. Geoth. Res., 123, 313–324, 2003.
Drury, M. J.: The Iceland research drilling project crustal section: physical properties of some basalts from the Reydarfjordur borehole, Iceland, Can. J. Earth Sci., 22, 1588–1593, https://doi.org/10.1139/e85-167, 1985.
Durán, E. L., Adam, L., Wallis, I. C., and Barnhoorn, A.: Mineral Alteration and Fracture Influence on the Elastic Properties of Volcaniclastic Rocks, J. Geophys. Res.-Sol. Ea., 124, 4576–4600, https://doi.org/10.1029/2018JB016617, 2019.
Eggertsson, G. H., Kendrick, J., Weaver, J., Wallace, P., Utley, J., Bedford, J., Allen, M., Markússon, S., Worden, R., Faulkner, D., and Lavallée, Y.: Compaction of hyaloclastite from the active geothermal system at Krafla volcano, Iceland, Geofluids, 2020, 3878503, https://doi.org/10.1155/2020/3878503, 2020a.
Eggertsson, G. H., Lavallée, Y., Kendrick, J. E., and Markússon, S. H.: Improving fluid flow in geothermal reservoirs by thermal and mechanical stimulation: The case of Krafla volcano, Iceland, J. Volcanol. Geoth. Res., 391, 106351, https://doi.org/10.1016/j.jvolgeores.2018.04.008, 2020b.
Escobedo, D.: Study of hydrothermal alteration and petrophysical properties of well KH6, Krafla geothermal field, NE Iceland, Master's thesis, University of Montpellier, 2017.
Escobedo, D., Patrier, P., Beaufort, D., Gibert, B., Levy, L., Findling, N., and Mortensen, A.: Contribution of the Paragenetic Sequence of Clay Minerals to Re-Examination of the Alteration Zoning in the Krafla Geothermal System, Minerals, 11, 935, https://doi.org/10.3390/min11090935, 2021.
Eiríksson, J. and Símonarson, L. A.: A Review of the Research History of the Tjörnes Sequence, North Iceland BT – Pacific – Atlantic Mollusc Migration: Pliocene Inter-Ocean Gateway Archives on Tjörnes, North Iceland, edited by: Eiríksson, J. and Símonarson, L. A., Springer International Publishing, Cham, 57–91, https://doi.org/10.1007/978-3-030-59663-7_4, 2021.
Escobedo, D., Patrier, P., Beaufort, D., Gibert, B., Levy, L., Findling, N., and Mortensen, A.: Contribution of the paragenetic sequence of clay minerals to re-examination of the alteration zoning in the Krafla geothermal system, Minerals, 11, 935, https://doi.org/10.3390/min11090935, 2021.
Farquharson, J. I. and Wadsworth, F. B.: Upscaling permeability in anisotropic volcanic systems, J. Volcanol. Geoth. Res., 364, 35–47, https://doi.org/10.1016/j.jvolgeores.2018.09.002, 2018.
Farquharson, J., Heap, M. J., Varley, N. R., Baud, P., and Reuschlé, T.: Permeability and porosity relationships of edifice-forming andesites: A combined field and laboratory study, J. Volcanol. Geoth. Res., 297, 52–68, https://doi.org/10.1016/j.jvolgeores.2015.03.016, 2015.
Farquharson, J. I., Baud, P., and Heap, M. J.: Inelastic compaction and permeability evolution in volcanic rock, Solid Earth, 8, 561–581, https://doi.org/10.5194/se-8-561-2017, 2017.
Farquharson, J. I., Wild, B., Kushnir, A. R. L., Heap, M. J., Baud, P., and Kennedy, B.: Acid-Induced Dissolution of Andesite: Evolution of Permeability and Strength, J. Geophys. Res.-Sol. Ea., 124, 257–273, https://doi.org/10.1029/2018JB016130, 2019.
Filomena, C. M., Hornung, J., and Stollhofen, H.: Assessing accuracy of gas-driven permeability measurements: a comparative study of diverse Hassler-cell and probe permeameter devices, Solid Earth, 5, 1–11, https://doi.org/10.5194/se-5-1-2014, 2014.
Flóvenz, Ó. G. and Saemundsson, K.: Heat flow and geothermal processes in Iceland, Tectonophysics, 225, 123–138, https://doi.org/10.1016/0040-1951(93)90253-G, 1993.
Flóvenz, Ó. G., Georgsson, L. S., and Árnason, K.: Resistivity structure of the upper crust in Iceland, J. Geophys. Res.-Sol. Ea., 90, 10136–10150, https://doi.org/10.1029/JB090iB12p10136, 1985.
Flóvenz, Ó. G., Spangenberg, E., Kulenkampff, J., Árnason, K., Karlsdóttir, R. and Huenges, E.: The Role of Electrical Interface Conduction in Geothermal Exploration, in: Proceedings World Geothermal Congress, Antalya, Turkey, http://www.geothermal-energy.org/pdf/IGAstandard/WGC/2005/0742.pdf (last access: 14 March 2023), 24–29 April 2005.
Foged, N. N. and Andreassen, K. A.: Strength and deformation properties of volcanic rocks in Iceland, in: Proc. 17th Nord. Geotech. Meet., Reykjavik, Iceland, https://www.ngm2016.com/uploads/2/1/7/9/21790806/039-137-ngm_2016_-_strength_and_deformation_properties_of_volcanic_rocks_in_iceland_foged.pdf (last access: 14 March 2023), 25–28 May 2016.
Forchheimer, P.: Wasserbewegung durch boden, Z. Ver. Deutsch, Ing., 45, 1782–1788, 1901.
Franzson, H.: Structure and petrochemistry of the Hafnarfjall-Skarðsheiði central volcano and the surrounding basalt succession, W-Iceland, PhD thesis, University of Edinburgh, 264 pp., http://hdl.handle.net/1842/9679, 1978.
Franzson, H. and Gunnlaugsson, E.: Formation of clays and chlorites in the upper Icelandic crust, in: Proceedings World Geothermal Congress 2020+1, Reykjavik, Iceland, April–October 2021, http://www.geothermal-energy.org/pdf/IGAstandard/WGC/2020/12007.pdf (last access: 14 March 2023), 2020.
Franzson, H. and Tulinius, H.: Rannsóknir á kjarna úr holu ÖJ-1, Ölkelduhálsi (Research on core from hole ÖJ-1, Ölkelduháls), Orkustofnun (OS-99024), Reykjavik, Iceland, https://orkustofnun.is/gogn/Skyrslur/OS-1999/OS-99024.pdf (last access: 14 March 2023), 1999.
Franzson, H., Friðleifsson, G. O., Guðmundsson, A., and Vilmundardóttir, E. G.: Forðafræðistuðlar, Staðabergfræðirannsókna í lok 1997, (Reservoir Parameters, Status of petrological studies by the end of 1997), Orkustofnun, OS-97077, Reykjavik, Iceland, https://orkustofnun.is/gogn/Skyrslur/OS-1997/OS-97077.pdf (last access: 14 March 2023), 1997.
Franzson, H., Guðlaugsson, S. Þ., and Friðleifsson, G. Ó.: Petrophysical properties of Icelandic rocks, in: Proceedings of the 6th Nordic Symposium on Petrophysics, Trondheim, Norway, http://www.ipt.ntnu.no/nordic/Papers/6th_Nordic_Franzson.pdf (last access: 14 March 2023), 15–16 May 2001.
Franzson, H., Zierenberg, R., and Schiffman, P.: Chemical transport in geothermal systems in Iceland, J. Volcanol. Geoth. Res., 173, 217–229, https://doi.org/10.1016/j.jvolgeores.2008.01.027, 2008.
Franzson, H., Guðfinnsson, G., and Helgadóttir, H.: Porosity, density and chemical composition relationships in altered Icelandic hyaloclastites, Water-Rock Interaction, edited by: Birkle, B. and Torres-Alvarado, I. S., Taylor & Francis Group, London, 199–202, https://doi.org/10.1201/b10556, 2010.
Franzson, H., Guðfinnsson, G. H., Frolova, J., Helgadóttir, H. M., Mortensen, A. K., and Jakobsson, S. P. Icelandic Hyaloclastite Tuffs, Iceland Geosurvey, ÍSOR-2011/064, https://orkustofnun.is/gogn/Skyrslur/ISOR-2011/ISOR-2011-064.pdf (last access: 14 March 2023), 2011.
Friðleifsson, G. Ó.: Geology and alteration history of the Geitafell central volcano, Southeast Iceland, PhD thesis, University of Edinburgh, 385 pp., http://hdl.handle.net/1842/13860, 1983a.
Friðleifsson, G. Ó.: Mineralogical evolution of a hydrothermal system, in: Geothermal Resources Council Transactions, 7, 147–152, 1983b.
Friðleifsson, G. Ó.: Mineralogical evolution of a hydrothermal system. II, Heat sources-fluid interactions, in: Geothermal Resources Council Transactions, 8, 119-123, 1984.
Friðleifsson, I. B.: Petrology and structure of the Esja quaternary volcanic region, southwest Iceland, PhD thesis, University of Oxford, https://ora.ox.ac.uk/objects/uuid:862173b9-7600-43b7-970f-09eb7da90dbe (last access: 14 March 2023), 1973.
Friðleifsson, I. B.: Lithology and structure of geothermal reservoir rocks in Iceland, Orkustofnun, OS-JHD-7531, Reykjavik, Iceland, https://orkustofnun.is/gogn/Skyrslur/1975/OS-JHD-7531.pdf (last access: 14 March 2023), 1975.
Friðleifsson, I. B.: Applied volcanology in geothermal exploration in Iceland, Pure Appl. Geophys., 117, 242–252, 1978.
Friðleifsson, G. Ó., and Vilmundardóttir, E. G.: Reservoir parameters TCP-project: A thin-section study of the Öskuhlíð samples, Orkustofnun, Reykjavik, Iceland, OS-98041, https://doi.org/10.1007/BF00879750, 1998.
Frolova, J., Ladygin, V., Rychagov, S., and Zukhubaya, D.: Effects of hydrothermal alterations on physical and mechanical properties of rocks in the Kuril-Kamchatka island arc, Eng. Geol., 183, 80–95, https://doi.org/10.1016/j.enggeo.2014.10.011, 2014.
Frolova, Y. V.: Patterns of transformations in the compositions and properties of Icelandic hyaloclastites during lithogenesis, Moscow Univ. Geol. Bull., 65, 104–114, https://doi.org/10.3103/s0145875210020067, 2010.
Frolova, J. V., Ladygin, V. M., Franzson, H., Sigurðsson, O., Stefánsson, V., and Shustrov, V.: Petrophysical properties of fresh to mildly altered hyaloclastite tuffs, in: Proceedings World Geothermal Congress, Antalya, Turkey, https://orkustofnun.is/gogn/Skyrslur/OS-1998/OS-98041.pdf (last access: 14 March 2023), 24–29 April 2005.
Frolova, J. V, Chernov, M. S., Rychagov, S. N., Ladygin, V. M., Sokolov, V. N., and Kuznetsov, R. A.: The influence of hydrothermal argillization on the physical and mechanical properties of tuffaceous rocks: a case study from the Upper Pauzhetsky thermal field, Kamchatka, B. Eng. Geol. Environ., 80, 1635–1651, https://doi.org/10.1007/s10064-020-02007-2, 2021.
Gard, M., Hasterok, D., and Halpin, J. A.: Global whole-rock geochemical database compilation, Earth Syst. Sci. Data, 11, 1553–1566, https://doi.org/10.5194/essd-11-1553-2019, 2019.
Gibert, B., Loggia, D., Parat, F., Escobedo, D., Lévy, L., Friðleifsson, G. O., Pezard, P. A., Marino, N., and Zierenberg, R. A.: Petrophysical Properties of IDDP-2 Core Samples from Depths of 3650 to 4650m, in: Proceedings World Geothermal Congress 2020+1, Reykjavik, Iceland, http://www.geothermal-energy.org/pdf/IGAstandard/WGC/2005/0624.pdf (last access: 14 March 2023), April–October 2021, 2020.
Gislason, S. R. and Eugster, H.: Meteoric water-basalt interactions. I: A laboratory study, Geochim. Cosmochim. Ac., 51, 2827–2840, https://doi.org/10.1016/0016-7037(87)90161-X, 1987.
Grab, M., Zürcher, B., Maurer, H., and Greenhalgh, S. Seismic velocity structure of a fossilized Icelandic geothermal system: A combined laboratory and field study, Geothermics, 57, 84–94, https://doi.org/10.1016/j.geothermics.2015.06.004, 2015.
Greenfield, L., Millett, J. M., Howell, J., Jerram, D. A., Watton, T., Healy, D., Hole, M. J., and Planke, S.: The 3D facies architecture and petrophysical properties of hyaloclastite delta deposits: An integrated photogrammetry and petrophysical study from southern Iceland, Basin Res., 32, 1091–1114, https://doi.org/10.1111/bre.12415, 2020.
Guðlaugsson, S. Þ.: An usual permeability anomaly in a Pleistocene shield-lava in Öskuhlið, Iceland – A study based on empirical relationships between petrophysical parameters, mineralogy and chemical composition, Orkustofnun, Reykjavik, Iceland, SÞG 01/00, http://hdl.handle.net/10802/27758, 2000.
Guðmundsson, A., Franzson, H., and Friðleifsson, G. Ó. Forðafræðistuðlar. Söfnun sýna. (Reservoir parameters. Sample collection), Orkustofnun, Reykjavik, Iceland, OS-95017/JHD-11 B, https://orkustofnun.is/gogn/Skyrslur/OS-1995/OS-95017.pdf (last access: 14 March 2023), 1995.
Gysi, A. P.: Numerical simulations of CO2 sequestration in basaltic rock formations: Challenges for optimizing mineral-fluid reactions, Pure Appl. Chem., 89, 581–596, https://doi.org/10.1515/pac-2016-1016, 2017.
Harðardóttir, S., Matthews, S., Halldórsson, S. A., and Jackson, M. G.: Spatial distribution and geochemical characterization of Icelandic mantle end-members: Implications for plume geometry and melting processes, Chem. Geol., 604, 120930, https://doi.org/10.1016/j.chemgeo.2022.120930, 2022.
Harnett, C. E., Kendrick, J. E., Lamur, A., Thomas, M. E., Stinton, A., Wallace, P. A., Utley, J. E. P., Murphy, W., Neuberg, J., and Lavallée, Y.: Evolution of Mechanical Properties of Lava Dome Rocks Across the 1995–2010 Eruption of Soufrière Hills Volcano, Montserrat, Front. Earth Sci., 7, 7, https://doi.org/10.3389/feart.2019.00007, 2019.
Heap, M. J. and Kennedy, B. M.: Exploring the scale-dependent permeability of fractured andesite, Earth Planet. Sc. Lett., 447, 139–150, https://doi.org/10.1016/j.epsl.2016.05.004, 2015.
Heap, M. J. and Violay, M. E. S.: The mechanical behaviour and failure modes of volcanic rocks: a review, B. Volcanol., 83, 33, https://doi.org/10.1007/s00445-021-01447-2, 2021.
Heap, M. J., Xu, T., and Chen, C.: The influence of porosity and vesicle size on the brittle strength of volcanic rocks and magma, B. Volcanol., 76, 856, https://doi.org/10.1007/s00445-014-0856-0, 2014.
Heap, M. J., Kennedy, B. M., Pernin, N., Jacquemard, L., Baud, P., Farquharson, J. I., Scheu, B., Lavallée, Y., Gilg, H. A., Letham-Brake, M., Mayer, K., Jolly, A. D., Reuschlé, T., and Dingwell, D. B.: Mechanical behaviour and failure modes in the Whakaari (White Island volcano) hydrothermal system, New Zealand, J. Volcanol. Geoth. Res., 295, 26–42, https://doi.org/10.1016/j.jvolgeores.2015.02.012, 2015.
Heap, M. J., Kennedy, B. M., Farquharson, J. I., Ashworth, J., Mayer, K., Letham-Brake, M., Reuschlé, T., Gilg, H. A., Scheu, B., Lavallée, Y., Siratovich, P., Cole, J., Jolly, A. D., Baud, P., and Dingwell, D. B.: A multidisciplinary approach to quantify the permeability of the Whakaari/White Island volcanic hydrothermal system (Taupo Volcanic Zone, New Zealand), J. Volcanol. Geoth. Res., 332, 88–108, https://doi.org/10.1016/j.jvolgeores.2016.12.004, 2017a.
Heap, M. J., Kushnir, A. R. L., Gilg, H. A., Wadsworth, F. B., Reuschlé, T., and Baud, P.: Microstructural and petrophysical properties of the Permo-Triassic sandstones (Buntsandstein) from the Soultz-sous-Forêts geothermal site (France), Geotherm. Energy, 5, 26, https://doi.org/10.1186/s40517-017-0085-9, 2017b.
Heap, M. J., Reuschlé, T., Farquharson, J. I., and Baud, P.: Permeability of volcanic rocks to gas and water, J. Volcanol. Geoth. Res., 354, 29–38, https://doi.org/10.1016/j.jvolgeores.2018.02.002, 2018.
Heap, M. J., Gravley, D. M., Kennedy, B. M., Gilg, H. A., Bertolett, E., and Barker, S. L. L.: Quantifying the role of hydrothermal alteration in creating geothermal and epithermal mineral resources: The Ohakuri ignimbrite (Taupō Volcanic Zone, New Zealand), J. Volcanol. Geoth. Res., 390, 106703, https://doi.org/10.1016/j.jvolgeores.2019.106703, 2020a.
Heap, M. J., Villeneuve, M., Albino, F., Farquharson, J. I., Brothelande, E., Amelung, F., Got, J.-L., and Baud, P.: Towards more realistic values of elastic moduli for volcano modelling, J. Volcanol. Geoth. Res., 390, 106684, https://doi.org/10.1016/j.jvolgeores.2019.106684, 2020b.
Heap, M. J., Baumann, T., Gilg, H. A., Kolzenburg, S., Ryan, A. G., Villeneuve, M., Russell, J. K., Kennedy, L. A., Rosas-Carbajal, M., and Clynne, M. A.: Hydrothermal alteration can result in pore pressurization and volcano instability, Geology, 49, 1348–1352, https://doi.org/10.1130/G49063.1, 2021.
Heap, M. J., Harnett, C. E., Wadsworth, F. B., Gilg, H. A., Carbillet, L., Rosas-Carbajal, M., Komorowski, J. C., Baud, P., Troll, V. R., Deegan, F. M., Holohan, E. P., and Moretti, R.: The tensile strength of hydrothermally altered volcanic rocks, J. Volcanol. Geoth. Res., 428, 107576, https://doi.org/10.1016/j.jvolgeores.2022.107576, 2022a.
Heap, M. J., Jessop, D. E., Wadsworth, F. B., Rosas-Carbajal, M., Komorowski, J.-C., Gilg, H. A., Aron, N., Buscetti, M., Gential, L., Goupil, M., Masson, M., Hervieu, L., Kushnir, A. R. L., Baud, P., Carbillet, L., Ryan, A. G., and Moretti, R.: The thermal properties of hydrothermally altered andesites from La Soufrière de Guadeloupe (Eastern Caribbean), J. Volcanol. Geoth. Res., 421, 107444, https://doi.org/10.1016/j.jvolgeores.2021.107444, 2022b.
Jaya, M. S., Shapiro, S. A., Kristinsdóttir, L. H., Bruhn, D., Milsch, H., and Spangenberg, E.: Temperature dependence of seismic properties in geothermal rocks at reservoir conditions, Geothermics, 39, 115–123, https://doi.org/10.1016/j.geothermics.2009.12.002, 2010.
Johnson, J. and Boitnott, G. N.: Velocity, Permeability, Resistivity and Pore Structure Models of Selected Basalts from Iceland, New England Research, Vermont, USA, 1998.
Jolie, E., Scott, S., Faulds, J. E., Chambefort, I., Axelsson, G., Gutiérrez-negrín, L. C., Regenspurg, S., Ziegler, M., and Ayling, B.: Geological controls on geothermal resources for power generation, Nat. Rev. Earth Environ., 2, 324–339, https://doi.org/10.1038/s43017-021-00154-y, 2021.
Kahraman, S.: The correlations between the saturated and dry P-wave velocity of rocks, Ultrasonics, 46, 341–348, https://doi.org/10.1016/j.ultras.2007.05.003, 2007.
Kahraman, S., Fener, M., and Kilic, C. O.: Estimating the Wet-Rock P-Wave Velocity from the Dry-Rock P-Wave Velocity for Pyroclastic Rocks, Pure Appl. Geophys., 174, 2621–2629, https://doi.org/10.1007/s00024-017-1561-7, 2017.
Kennedy, B. M., Jellinek, A. M., Russell, J. K., Nichols, A. R. L., and Vigouroux, N.: Time-and temperature-dependent conduit wall porosity: A key control on degassing and explosivity at Tarawera volcano, New Zealand, Earth Planet. Sc. Lett., 299, 126–137, https://doi.org/10.1016/j.epsl.2010.08.028, 2010.
Klinkenberg, L. J.: The permeability of porous media to liquids and gases, in: Drilling and production practice, American Petroleum Institute, 200–213, 1941.
Kristinsdóttir, L. H., Flóvenz, Ó. G., Árnason, K., Bruhn, D., Milsch, H., Spangenberg, E., and Kulenkampff, J.: Electrical conductivity and P-wave velocity in rock samples from high-temperature Icelandic geothermal fields, Geothermics, 39, 94–105, https://doi.org/10.1016/j.geothermics.2009.12.001, 2010.
Kristmannsdóttir, H.: Alteration of basaltic rocks by hydrothermal activity at 100-300C, Dev. Sedimentol., 27, 359–367, 1979.
Kristmannsdottir, H. and Tomasson, J.: Zeolite zones in geothermal areas in Iceland, Orkustofnun, Reykjavik, Iceland, OS-JHD-7649, https://orkustofnun.is/gogn/Skyrslur/1976/OS-JHD-7649.pdf (last access: 14 March 2023), 1978.
Kummerow, J., Raab, S., Schuessler, J. A., and Meyer, R.: Non-reactive and reactive experiments to determine the electrical conductivities of aqueous geothermal solutions up to supercritical conditions, J. Volcanol. Geoth. Res., 391, 106388, doi.org/10.1016/j.jvolgeores.2018.05.014, 2020.
Lamur, A., Kendrick, J. E., Eggertsson, G. H., Wall, R. J., Ashworth, J. D., and Lavallée, Y.: The permeability of fractured rocks in pressurised volcanic and geothermal systems, Sci. Rep., 7, 6173, https://doi.org/10.1038/s41598-017-05460-4, 2017.
Le Maitre, R., Streckeisen, A., Zanettin, B., Le Bas, M., Bonin, B., and Bateman, P.: Igneous Rocks: A classification and glossary of terms: Recommendations of the international union of geological sciences subcommission on the systematics of igneous rocks (2nd Edn.), Cambridge, Cambridge University Press, https://doi.org/10.1017/CBO9780511535581, 2002.
Lévy, L., Gibert, B., Sigmundsson, F., Flóvenz, O. G., Hersir, G. P., Briole, P., and Pezard, P. A.: The role of smectites in the electrical conductivity of active hydrothermal systems: Electrical properties of core samples from Krafla volcano, Iceland, Geophys. J. Int., 215, 1558–1582, https://doi.org/10.1093/gji/ggy342, 2018.
Lévy, L., Gibert, B., Sigmundsson, F., Deldicque, D., Parat, F., and Hersir, G. P.: Tracking Magmatic Hydrogen Sulfur Circulations Using Electrical Impedance: Complex Electrical Properties of Core Samples at the Krafla Volcano, Iceland, J. Geophys. Res.-Sol. Ea., 124, 2492–2509, https://doi.org/10.1029/2018JB016814, 2019a.
Lévy, L., Weller, A., and Gibert, B.: Influence of smectite and salinity on the imaginary and surface conductivity of volcanic rocks, Near Surf. Geophys., 17, 653–673, https://doi.org/10.1002/nsg.12069, 2019b.
Lévy, L., Friðriksson, T., Findling, N., Lanson, B., Fraisse, B., Marino, N., and Gibert, B.: Smectite quantification in hydrothermally altered volcanic rocks, 85, 101748, https://doi.org/10.1016/j.geothermics.2019.101748, 2020a.
Lévy, L. E., Gibert, B., Escobedo, D., Patrier, P., Lanson, B., Beaufort, D., Loggia, D., Pezard, P. A., and Marino, N.: Relationships between lithology, permeability, clay mineralogy and electrical conductivity in Icelandic altered volcanic rocks, in: Proceedings World Geothermal Congress 2020+1, Reykjavik, Iceland, http://www.geothermal-energy.org/pdf/IGAstandard/WGC/2020/11093.pdf (last access: 14 March 2023), April–October 2020b.
Liotta, D., Brogi, A., Ruggieri, G., Rimondi, V., Zucchi, M., Helgadóttir, H. M., Montegrossi, G., and Friðleifsson, G. Ó.: Fracture analysis, hydrothermal mineralization and fluid pathways in the Neogene Geitafell central volcano: insights for the Krafla active geothermal system, Iceland, J. Volcanol. Geoth. Res., 391, 106502, https://doi.org/10.1016/j.jvolgeores.2018.11.023, 2020.
Lonker, S. W., Franzson, H., and Kristmannsdöttir, H.: Mineral-fluid interactions in the Reykjanes and Svartsengi geothermal systems, Iceland, Am. J. Sci., 293, 605–670, 1993.
Manning, C. E. and Bird, D. K.: Porosity, permeability and basalt metamorphism, 123–140, in: Low-Grade Metamorphism of Mafic Rocks, edited by: Schiffman, P. and Day, H. W., Geological Society of America Special Paper 296, https://doi.org/10.1130/SPE296-p123, 1995.
Mavko, G., Mukerji, T., and Dvorkin, J.: The Rock Physics Handbook: Tools for Seismic Analysis of Porous Media, 2nd Edn., Cambridge University Press, Cambridge, https://doi.org/10.1017/CBO9780511626753, 2009.
Meier, L. P. and Kahr, G.: Determination of the Cation Exchange Capacity (CEC) of Clay Minerals Using the Complexes of Copper(II) Ion with Triethylenetetramine and Tetraethylenepentamine, Clays Clay Miner., 47, 386–388, https://doi.org/10.1346/ccmn.1999.0470315, 1999.
Meller, C. and Kohl, T.: The significance of hydrothermal alteration zones for the mechanical behavior of a geothermal reservoir, Geotherm. Energy, 2, 12, https://doi.org/10.1186/s40517-014-0012-2, 2014.
Meller, C. and Ledésert, B.: Is There a Link Between Mineralogy, Petrophysics, and the Hydraulic and Seismic Behaviors of the Soultz-sous-Forêts Granite During Stimulation? A Review and Reinterpretation of Petro-Hydromechanical Data Toward a Better Understanding of Induced Seismicity, J. Geophys. Res.-Sol. Ea., 122, 9755–9774, https://doi.org/10.1002/2017JB014648, 2017.
Milsch, H., Kristinsdóttir, L. H., Spangenberg, E., Bruhn, D., and Flóvenz, Ó. G.: Effect of the water-steam phase transition of the electrical conductivity of porous rocks, Geothermics, 39, 106–114, https://doi.org/10.1016/j.geothermics.2009.09.001, 2010.
Mordensky, S. P., Villeneuve, M. C., Kennedy, B. M., Heap, M. J., Gravley, D. M., Farquharson, J. I., and Reuschlé, T.: Physical and mechanical property relationships of a shallow intrusion and volcanic host rock, Pinnacle Ridge, Mt. Ruapehu, New Zealand, J. Volcanol. Geoth. Res., 359, 1–20, https://doi.org/10.1016/j.jvolgeores.2018.05.020, 2018.
Mordensky, S. P., Heap, M. J., Kennedy, B. M., Gilg, H. A., Villeneuve, M. C., Farquharson, J. I., and Gravley, D. M.: Influence of alteration on the mechanical behaviour and failure mode of andesite: implications for shallow seismicity and volcano monitoring, B. Volcanol., 81, 44, https://doi.org/10.1007/s00445-019-1306-9, 2019.
Muñoz, G.: Exploring for Geothermal Resources with Electromagnetic Methods, Surv. Geophys., 35, 101–122, https://doi.org/10.1007/s10712-013-9236-0, 2014.
Nara, Y., Meredith, P. G., Yoneda, T., and Kaneko, K.: Influence of macro-fractures and micro-fractures on permeability and elastic wave velocities in basalt at elevated pressure, Tectonophysics, 503, 52–59, https://doi.org/10.1016/j.tecto.2010.09.027, 2011.
Navelot, V., Géraud, Y., Favier, A., Diraison, M., Corsini, M., Lardeaux, J. M., Verati, C., Mercier de Lépinay, J., Legendre, L., and Beauchamps, G.: Petrophysical properties of volcanic rocks and impacts of hydrothermal alteration in the Guadeloupe Archipelago (West Indies), J. Volcanol. Geoth. Res., 360, 1–21, https://doi.org/10.1016/j.jvolgeores.2018.07.004, 2018.
Nelson, P. H. and Anderson, L. A.: Physical properties of ash flow tuff from Yucca Mountain, Nevada, J. Geophys. Res., 97, 6823–6841, https://doi.org/10.1029/92JB00350, 1992.
Neuhoff, P., Fridriksson, T., Arnórsson, S., and Bird, D. K.: Porosity evolution and mineral paragenesis during low-grade metamorphism of basaltic lavas at Teigarhorn, eastern Iceland, Am. J. Sci., 299, 467–501, 1999.
Neuzil, C. E.: How permeable are clays and shales?, Water Resour. Res., 30, 145–150, https://doi.org/10.1029/93WR02930, 1994.
Nicolas, A., Lévy, L., Sissmann, O., Li, Z., Fortin, J., Gibert, B., and Sigmundsson, F.: Influence of hydrothermal alteration on the elastic behaviour and failure of heat-treated andesite from Guadeloupe, Geophys. J. Int., 223, 2038–2053, https://doi.org/10.1093/gji/ggaa437, 2020.
Nono, F., Gibert, B., Parat, F., Loggia, D., Cichy, S. B., and Violay, M.: Electrical conductivity of Icelandic deep geothermal reservoirs up to supercritical conditions: Insight from laboratory experiments, J. Volcanol. Geoth. Res., 391, 106364, https://doi.org/10.1016/j.jvolgeores.2018.04.021, 2020.
Nur, A. and Simmons, G.: The effect of saturation on velocity in low porosity rocks, Earth Planet. Sc. Lett., 7, 183–193, https://doi.org/10.1016/0012-821X(69)90035-1, 1969.
Orkustofnun: Valgarður – Gagnagrunnur forðafræðistuðla gerður aðgengilegur (Valgarður – Database of Reservoir Properties Made Available), https://orkustofnun.is/orkustofnun/frettir/valgardur-gagnagrunnur-fordafraedistudla-gerdur-adgengilegur, (last access: 5 October 2022), 2018.
Oxburgh, E. R. and Agrell, S. O.: Thermal conductivity and temperature structure of the Reydardjordur borehole (Iceland), J. Geophys. Res., 87, 6423–6428, https://doi.org/10.1029/JB087iB08p06423, 1982.
Pálmason, G.: A continuum model of crustal generation in Iceland-kinematic aspects, J. Geophys., 47, 7–18, 1980.
Pálsson, S.: Mælingar á eðlisþyngd og poruhluta bergs (Measurements of the density and porosity of rock), Orkustofnun, Reykjavik, Iceland, https://orkustofnun.is/gogn/Skyrslur/1972/OS-1972-Maelingar-a-edlisthyngd-og-poruhluta-bergs.pdf (last access: 14 March 2023), 1972.
Pálsson, S., Haraldsson, G. I., and Vigfússon, G. H.: Eðlismassi og poruhluti bergs (Density and Porosity of Rock), Orkustofnun, Reykjavik, Iceland, 35 pp., OS-84048, https://orkustofnun.is/gogn/Skyrslur/OS-1984/OS-84048.pdf (last access: 14 March 2023), 1984.
Petford, N.: Controls on primary porosity and permeability development in igneous rocks, Geol. Soc. London, Spec. Publ., 214, 93–107, https://doi.org/10.1144/GSL.SP.2003.214.01.06, 2003.
Pola, A., Crosta, G., Fusi, N., Barberini, V., and Norini, G.: Influence of alteration on physical properties of volcanic rocks, Tectonophysics, 566–567, 67–86, https://doi.org/10.1016/j.tecto.2012.07.017, 2012.
Pola, A., Crosta, G. B., Fusi, N., and Castellanza, R.: General characterization of the mechanical behaviour of different volcanic rocks with respect to alteration, Eng. Geol., 169, 1–13, https://doi.org/10.1016/j.enggeo.2013.11.011, 2014.
Potts, P. J. and Webb, P. C.: X-ray fluorescence spectrometry, J. Geochem. Explor., 44, 251–296, https://doi.org/10.1016/0375-6742(92)90052-A, 1992.
Pruess, K. and Narasimhan, T. N.: A Practical Method for Modeling Fluid and Heat Flow in Fractured Porous Media, Soc. Pet. Eng. J., 25, 14–26, https://doi.org/10.2118/10509-PA, 1985.
Rink, M. and Schopper, J. R.: Interface conductivity and its implications to electric logging, in: SPWLA 15th Annual Logging Symposium, McAllen, Texas, June 1974, SPWLA-1974-J, https://onepetro.org/SPWLAALS/proceedings-abstract/SPWLA-1974/All-SPWLA-1974/SPWLA-1974-J/19759 (last access: 14 March 2023), 1974.
Robertson, E. C. and Peck, D. L.: Thermal conductivity of vesicular basalt from Hawaii, J. Geophys. Res., 79, 4875–4888, https://doi.org/10.1029/jb079i032p04875, 1974.
Rousseau, R. M., Willis, J. P., and Duncan, A. R.: Practical XRF Calibration Procedures for Major and Trace Elements, X-Ray Spectrometry, 25, 179–189, https://doi.org/10.1002/(SICI)1097-4539(199607)25:4<179::AID-XRS162>3.0.CO;2-Y, 1996.
Ruether, J.: The Validation of the LMC device: Analysis of Icelandic basaltic rocks, Master's thesis, The School for Renewable Energy Science, http://hdl.handle.net/1946/7744, 2011.
Sanchez-Alfaro, P., Reich, M., Arancibia, G., Pérez-Flores, P., Cembrano, J., Driesner, T., Lizama, M., Rowland, J., Morata, D., Heinrich, C. A., Tardani, D., and Campos, E.: Physical, chemical and mineralogical evolution of the Tolhuaca geothermal system, southern Andes, Chile: Insights into the interplay between hydrothermal alteration and brittle deformation, J. Volcanol. Geoth. Res., 324, 88–104, https://doi.org/10.1016/j.jvolgeores.2016.05.009, 2016.
Saar, M. O. and Manga, M.: Permeability-porosity relationships in vesicular basalts, Geophys. Res. Lett., 26, 111–114, https://doi.org/10.1029/1998GL900256, 1999.
Saripalli, K. P., Meyer, P. D., Bacon, D. H., and Freedman, V. L.: Changes in Hydrologic Properties of Aquifer Media Due to Chemical Reactions: A Review, Crit. Rev. Environ. Sci. Technol., 31, 311–349, https://doi.org/10.1080/20016491089244, 2001.
Schaefer, L. N., Kendrick, J. E., Oommen, T., Lavallée, Y., and Chigna, G.: Geomechanical rock properties of a basaltic volcano, Front. Earth Sci., 3, 29, https://doi.org/10.3389/feart.2015.00029, 2015.
Schopka, H. H., Gudmundsson, M. T., and Tuffen, H.: The formation of Helgafell, southwest Iceland, a monogenetic subglacial hyaloclastite ridge: Sedimentology, hydrology and volcano–ice interaction, J. Volcanol. Geoth. Res., 152, 359–377, https://doi.org/10.1016/j.jvolgeores.2005.11.010, 2006.
Scott, S. W., Covell, C., Júlíusson, E., Valfells, Á., Newson, J., Hrafnkelsson, B., and Gudjónsdóttir, M. S.: A probabilistic geologic model of the Krafla geothermal system constrained by gravimetric data, Geotherm. Energy, 7, 29, https://doi.org/10.1186/s40517-019-0143-6, 2019.
Scott, S. W., Lévy, L., Covell, C., Franzson, H., Gibert, B., Valfells, Á., Newson, J., Frolova, J., and Guðjónsdóttir, M. S.: Valgarður: A Database of the Petrophysical, Mineralogical, and Chemical Properties of Icelandic Rocks (1.1), Zenodo [data set], https://doi.org/10.5281/zenodo.6980231, 2022a.
Scott, S. W., O'Sullivan, J. P., Maclaren, O. J., Nicholson, R., Covell, C., Newson, J., Guðjónsdóttir, M. S.: Bayesian Calibration of a Natural State Geothermal Reservoir Model, Krafla, North Iceland, Water Resour. Res., 58, e2021WR031254, https://doi.org/10.1029/2021wr031254, 2022b.
Schön, J. H.: Physical Properties of Rocks, 65, Elsevier, https://doi.org/10.1016/B978-0-08-100404-3.09990-X, 2015.
Sigmarsson, O. and Steinthórsson, S.: Origin of Icelandic basalts: A review of their petrology and geochemistry, J. Geodyn., 43, 87–100, https://doi.org/10.1016/j.jog.2006.09.016, 2007.
Sigmarsson, O., Maclennan, J., and Carpentier, M.: Geochemistry of igneous rocks in Iceland: a review, Jökull, 58, 139–160, 2008.
Sigurðsson, Ó.: Forðafræðistuðlar, Reynslusamband til að breyta mældri gaslekt í vatnslekt, Reservoir parameters, An empirical relationship to change measured gas permeability to water permeability, Orkustofnun, Reykjavik, Iceland, OS-98065, https://orkustofnun.is/gogn/Skyrslur/OS-1998/OS-98065.pdf (last access: 14 March 2023), 1998a.
Sigurðsson Ó.: Forðafræðistuðlar, Lekt og hárpípulíkan (Reservoir parameters, Permeability and capillary tube model), Orkustofnun, Reykjavik, Iceland, OMAR-1998/01, https://orkustofnun.is/gogn/Greinargerdir/Grg-OS-1998/Omar-98-01.pdf (last access: 14 March 2023), 1998b.
Sigurðsson, Ó. and Stefánsson, V.: Forðafræðistuðlar, Mælingar á bergsýnum, (Reservoir parameters, Measurements on rock samples), Orkustofnun, Reykjavik, Iceland, OS-94049/JHD-28B, https://orkustofnun.is/gogn/Skyrslur/OS-1994/OS-94049.pdf (last access: 14 March 2023), 1994.
Sigurðsson, Ó. and Stefánsson, V.: Porosity structure of Icelandic basalt, Proc. Est. Acad. Sci. Geol., 51, 33–46, https://doi.org/10.3176/geol.2002.1.03, 2002.
Sigurðsson, Ó., Guðmundsson, Á., Friðleifsson, G. Ó., Franzson, H., Guðlaugsson, S. Þ., and Stefánsson, V.: Database on igneous rock properties in Icelandic geothermal systems. Status and unexpected results, in: Proceedings World Geothermal Congress 2000, Kyushu – Tohoku, Japan, 28 May–10 June 2000, 2881–2886, http://www.geothermal-energy.org/pdf/IGAstandard/WGC/2000/R0212.PDF (last access: 14 March 2023), 2000.
Siratovich, P. A., Heap, M. J., Villenueve, M. C., Cole, J. W., and Reuschlé, T.: Physical property relationships of the Rotokawa Andesite, a significant geothermal reservoir rock in the Taupo Volcanic Zone, New Zealand, Geotherm. Energy, 2, 10, https://doi.org/10.1186/s40517-014-0010-4, 2014.
Soyer, W., Mackie, R., Hallinan, S., Pavesi, A., Nordquist, G., Suminar, A., Intani, R., and Nelson, C.: Geologically consistent multiphysics imaging of the Darajat geothermal steam field, First Break, 36, 77–83, https://doi.org/10.3997/1365-2397.n0102, 2018.
Snæbjörnsdóttir, S., Sigfússon, B., Marieni, C., Goldberg, D., Gislason, S. R., and Oelkers, E. H.: Carbon dioxide storage through mineral carbonation, Nat. Rev. Earth Environ., 1, 90–102, https://doi.org/10.1038/s43017-019-0011-8, 2020.
State Standard 21153.2-84: Rocks. Methods for determination of uniaxial compressive strength, Publisher of Standards, Moscow, Russia, https://www.russiangost.com/p-54364-gost-211532-84.aspx (last access: 14 March 2023), 1984.
State Standard 21153.7-75: Rocks. Methods for Determination of Compressional and Shear Wave Velocities, Publisher of Standards, Moscow, 29–35, https://www.russiangost.com/p-53651-gost-211537-75.aspx (last access: 14 March 2023), 1984.
Stefansson, A. and Gislason, S. R.: Chemical weathering of basalts, southwest Iceland: Effect of rock crystallinity and secondary minerals on chemical fluxes to the ocean, Am. J. Sci., 301, 513–556, https://doi.org/10.1126/science.3.53.32, 2001.
Stefánsson, V., Sigurðsson, O., Guðmundsson, Á., Franzson, H., Friðleifsson, G. Ó., and Tulinius, H.: Core Measurements and Geothermal Modelling, in: Second Nordic Symposium on Petrophysics: Fractured reservoirs, edited by: Middleton, M. F., 198–220, 1997.
Stroncik, N. A. and Schmincke, H. U.: Palagonite – A review, Int. J. Earth Sci., 91, 680–697, https://doi.org/10.1007/s00531-001-0238-7, 2002.
Sveinbjörnsdóttir, Á.: Composition of geothermal minerals from saline and dilute fluids–Krafla and Reykjanes, Iceland, Lithos, 27, 301–315, https://doi.org/10.1016/0024-4937(91)90005-6, 1992.
Tanikawa, W. and Shimamoto, T.: Comparison of Klinkenberg-corrected gas permeability and water permeability in sedimentary rocks, Int. J. Rock Mech. Min. Sci., 46, 229–238, https://doi.org/10.1016/j.ijrmms.2008.03.004, 2009.
Thien, B. M. J., Kosakowski, G., and Kulik, D. A.: Differential alteration of basaltic lava flows and hyaloclastites in Icelandic hydrothermal systems, Geotherm. Energy, 3, 11, https://doi.org/10.1186/s40517-015-0031-7, 2015.
Thompson, A. B.: Flow and focusing of metamorphic fluids, in: Fluid Flow and Transport in Rocks, edited by: Jamtveit, B. and Yardley, B. W. D., Springer Dordrecht, 297–314, https://doi.org/10.1007/978-94-009-1533-6_17, 1997.
Thorpe, M. T., Hurowitz, J. A., and Dehouck, E.: Sediment geochemistry and mineralogy from a glacial terrain river system in southwest Iceland, Geochim. Cosmochim. Ac., 263, 140–166, https://doi.org/10.1016/j.gca.2019.08.003, 2019.
Ulusay, R. and Hudson, J. A. (Eds.): The complete ISRM suggested methods for rock characterization, testing and monitoring: 1974–2006, International Society for Rock Mechanics Turkish National Group, International Society for Rock Mechanics, https://doi.org/10.1007/978-3-319-07713-0, 2007.
Villeneuve, M. Kennedy, B., Gravley, D., Mordensky, S., Heap, M. J., Siratovich, P., Wyering, L., and Cant, J.: Characteristics of altered volcanic rocks in geothermal reservoirs, in: Rock Mechanics for Natural Resources and Infrastructure Development, edited by: da Fontoura, S. A. B., Rocca, R. J., and Mendoza, J. F. P., CRC Press, https://doi.org/10.1201/9780367823177, 2019.
Vinciguerra, S., Trovato, C., Meredith, P. G., and Benson, P. M.: Relating seismic velocities, thermal cracking and permeability in Mt. Etna and Iceland basalts, Int. J. Rock Mech. Min. Sci., 42, 900–910, https://doi.org/10.1016/j.ijrmms.2005.05.022, 2005.
Vinegar, H. J. and Waxman, M. H.: Induced polarization of shaly sands, Geophysics, 49, 1267–1287, https://doi.org/10.1190/1.1441755, 1984.
Wadsworth, F. B., Vasseur, J., Scheu, B., Kendrick, J. E., Lavallée, Y., and Dingwell, D. B.: Universal scaling of fluid permeability during volcanic welding and sediment diagenesis, Geology, 44, 219–222, https://doi.org/10.1130/G37559.1, 2016.
Walker, G. P. L.: Geology of the Reydarfjördur area, Eastern Iceland, Quarterly Journal of the Geological Society of London, 114, 367–391, https://doi.org/10.1144/gsjgs.114.1.0367, 1958.
Walker, G. P. L.: Zeolite zones and dike distribution in relation to the structure of the basalts of eastern Iceland, J. Geol., 68, 515–528, 1960.
Walker, G. P. L.: The Breiddalur central volcano, eastern Iceland, Q. J. Geol. Soc., 119, 29–63, https://doi.org/10.1144/gsjgs.119.1.0029, 1963.
Walker, G. P. L.: Eruptive Mechanisms in Iceland. Geodynamics of Iceland and the North Atlantic Area, edited by: Kristjansson, L., Springer Netherlands, Dordrecht, 189–201, https://doi.org/10.1007/978-94-010-2271-2_13, 1974.
Waxman, M. H. and Smits, L. J. M: Electrical conductivities in oil-bearing shaly sands, Soc. Petrol. Eng. J., 8, 107–122, 1968.
Weaver, J., Eggertsson, G. H., Utley, J. E. P., Wallace, P. A., Lamur, A., Kendrick, J. E., Tuffen, H., Markússon, S. H., and Lavallée, Y.: Thermal liability of hyaloclastite in the Krafla geothermal reservoir, Iceland: The impact of phyllosilicates on permeability and rock strength, Geofluids, 2020, 9057193, https://doi.org/10.1155/2020/9057193, 2020.
Weinert, S., Bär, K., and Sass, I.: Database of petrophysical properties of the Mid-German Crystalline Rise, Earth Syst. Sci. Data, 13, 1441–1459, https://doi.org/10.5194/essd-13-1441-2021, 2021.
Weydt, L. M., Ramírez-Guzmán, Á. A., Pola, A., Lepillier, B., Kummerow, J., Mandrone, G., Comina, C., Deb, P., Norini, G., Gonzalez-Partida, E., Avellán, D. R., Macías, J. L., Bär, K., and Sass, I.: Petrophysical and mechanical rock property database of the Los Humeros and Acoculco geothermal fields (Mexico), Earth Syst. Sci. Data, 13, 571–598, https://doi.org/10.5194/essd-13-571-2021, 2021.
Weydt, L. M., Bär, K., and Sass, I.: Petrophysical characterization of the Los Humeros geothermal field (Mexico): from outcrop to parametrization of a 3D geological model, Geotherm. Energy, 10, 5, https://doi.org/10.1186/s40517-022-00212-8, 2022.
Wolff-Boenisch, D., Gislason, S. R., and Oelkers, E. H.: The effect of crystallinity on dissolution rates and CO2 consumption capacity of silicates, Geochim. Cosmochim. Ac. 70, 858–870, https://doi.org/10.1016/j.gca.2005.10.016, 2006.
Wright, H. M. N., Cashman, K. V, Gottesfeld, E. H., and Roberts, J. J.: Pore structure of volcanic clasts: Measurements of permeability and electrical conductivity, Earth Planet. Sc. Lett., 280, 93–104, https://doi.org/10.1016/j.epsl.2009.01.023, 2009.
Wyering, L. D., Villeneuve, M. C., Wallis, I. C., Siratovich, P. A., Kennedy, B. M., Gravley, D. M., and Cant, J. L.: Mechanical and physical properties of hydrothermally altered rocks, Taupo Volcanic Zone, New Zealand, J. Volcanol. Geoth. Res., 288, 76–93, https://doi.org/10.1016/j.jvolgeores.2014.10.008, 2014.
Yokoyama, T. and Takeuchi, S.: Porosimetry of vesicular volcanic products by a water-expulsion method and the relationship of pore characteristics to permeability, J. Geophys. Res.-Sol. Ea., 114, B02201, https://doi.org/10.1029/2008JB005758, 2009.
Zeng, Z. and Grigg, R.: A Criterion for Non-Darcy Flow in Porous Media, Transp. Porous Media, 63, 57–69, https://doi.org/10.1007/s11242-005-2720-3, 2006.
The database is named after Valgarður Stefánsson (1939–2006), a reservoir physicist who was at the forefront of geothermal exploration in Iceland throughout his career at Orkustofnun. His main geothermal research objective was to define geothermal systems in terms of reservoir characteristics. Recognizing that a relative lack of petrophysical data hampered reliable reservoir modeling, he instigated and headed a comprehensive petrophysical research project to further reservoir modeling by combining petrophysics, geology, alteration, and geochemistry. The rock samples used for this research were largely taken at various erosional levels of the Icelandic crust. Just over half of this database is derived from this work.
- Abstract
- Introduction
- The structure and content of the database
- Data sources
- Results and discussion
- Data availability
- Concluding remarks, limitations, and future status of the database
- Sample availability
- Author contributions
- Competing interests
- Disclaimer
- Acknowledgements
- Financial support
- Review statement
- References