the Creative Commons Attribution 4.0 License.
the Creative Commons Attribution 4.0 License.
 | 09 Dec 2022
A database of radiogenic Sr–Nd isotopes at the “three poles”
Zhiheng Du
Jiao Yang
Ninglian Wang
Anders Svensson
Zhen Zhang
Xiangyu Ma
Yaping Liu
Shimeng Wang
Jianzhong Xu
Cunde Xiao
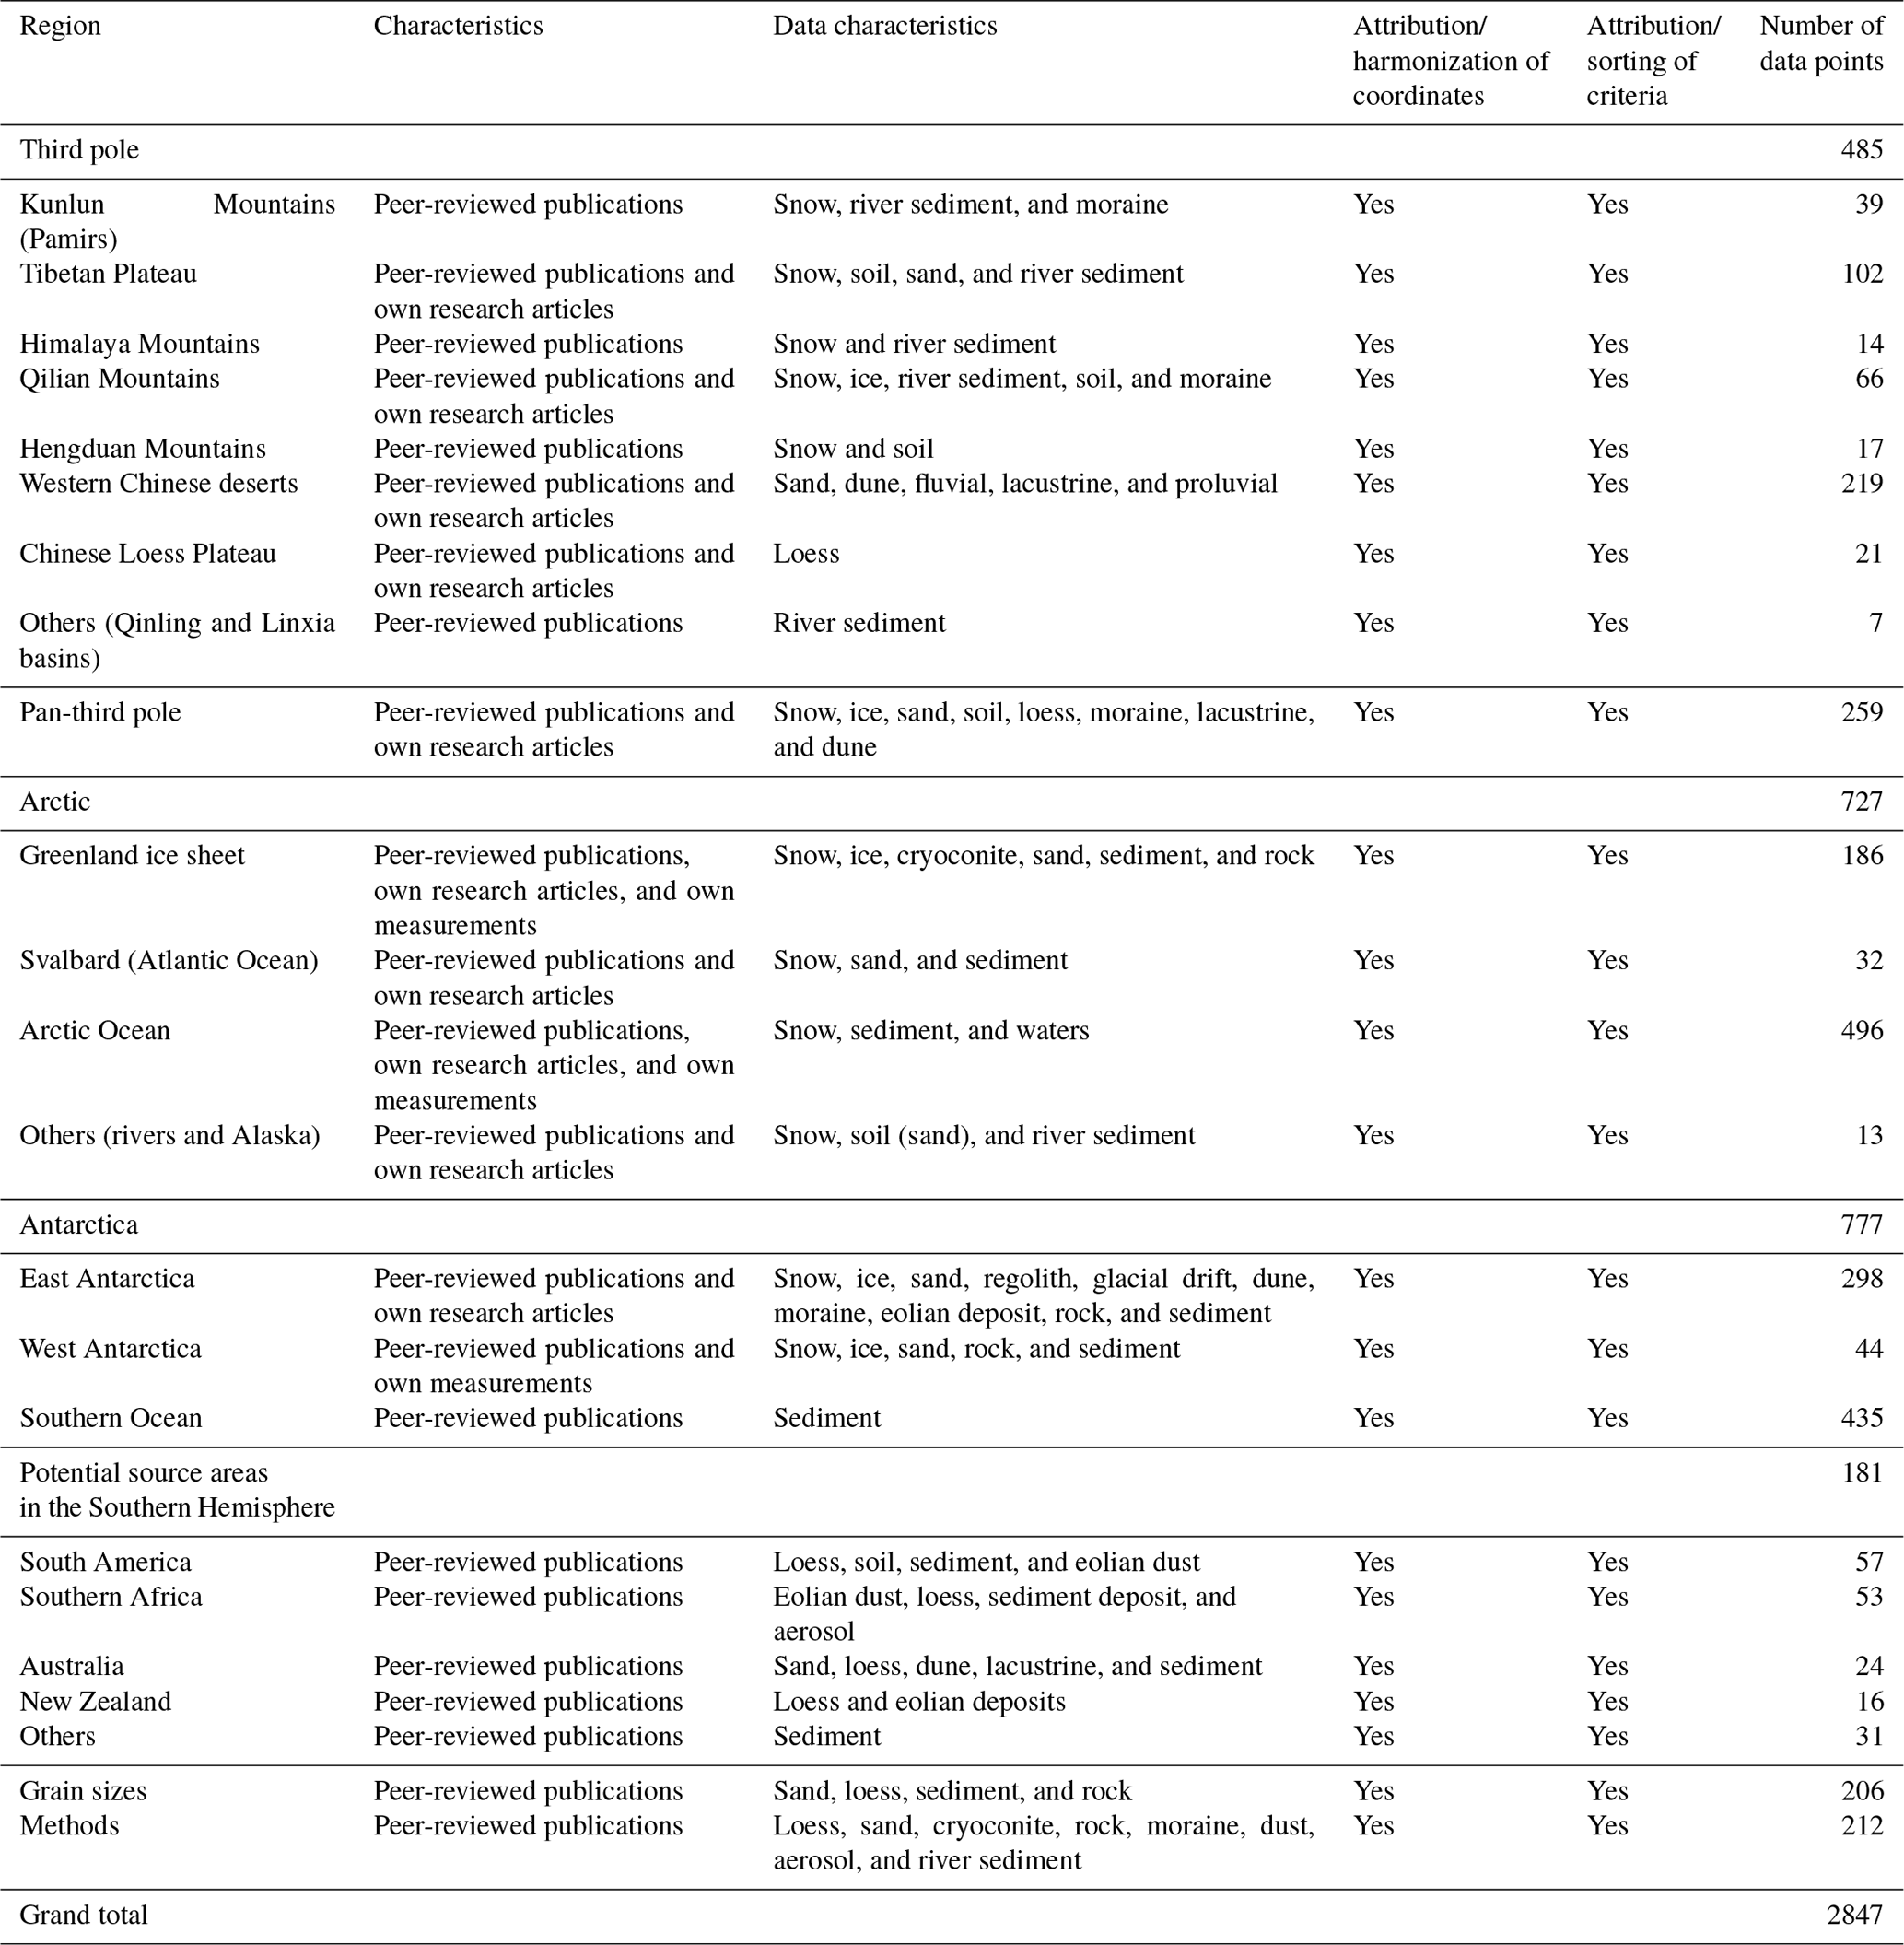
The radiogenic isotope compositions of strontium (Sr) and neodymium (Nd) on the surface of the Earth are powerful tools for tracing dust sources and sinks on the Earth's surface. To differentiate between the spatial variabilities in eolian dust sources in key cryospheric regions at the three poles (the Arctic; Antarctica; and the “third pole”, covering the high mountainous area in Asia), a dataset of Sr–Nd isotopic compositions from extremely cold or arid terrestrial environments was compiled, similar to the method of Blanchet (2019). The database includes Holocene and Quaternary snow, ice, sand, soil (loess), sediment, and rock samples from the three poles based on 90 different references and our own measurement data, with a total of 1989 data points, comprising 206 data points with different grain sizes and 212 data points with fraction measurements. There are 485 data points from the third pole, 727 data points from the Arctic, and 777 data points from Antarctica. The sampling and measurement methods of these data are introduced. For each pole, geographical coordinates and other information are provided. The main scientific purpose of this dataset is to provide a Sr–Nd dataset based on collective documentation and our own measurements, which will be useful for determining the sources and transport pathways of dust in snow, ice, rivers, and oceans at or near the three poles as well as to investigate whether multiple dust sources are present at each of the poles. This dataset provides exhaustive detailed documentation of the isotopic signatures at the three poles during specific time intervals in the Quaternary period, which are useful for understanding the sources or sinks of eolian dust and sediments at the three poles. The dataset is available from the National Tibetan Plateau Data Center (https://doi.org/10.11888/Cryos.tpdc.272100, Du, 2022).
- Article
(8989 KB) - Full-text XML
- BibTeX
- EndNote


The role of mineral dust in the Earth system extends well beyond its impact on the energy balance and involves interactions with the carbon cycle and glacier melting on global scales (Skiles et al., 2018; Shao et al., 2011). The transport of dust from the low midlatitudes, which contain major deserts that are dust sources, to the Arctic region or Antarctic ice sheet (AIS) is sensitive to amplified high-latitude climatic variability (Bory et al., 2003a, b; Lupker et al., 2010; Lambert et al., 2013; Struve et al., 2020). The isotopic compositions of the radiogenic elements strontium (Sr) and neodymium (Nd) are powerful tools for tracing dust sources and sinks because their characteristics vary significantly on the surface of the Earth (including snow, sand, sediment, loess, and eolian deposits) (Grousset et al., 1992; Chen et al., 2007; Xu et al., 2012; Robinson et al., 2021). Therefore, the combination of different isotopic signatures, specifically and (expressed as εNd(0)), has proven to be useful in discriminating among different dust source areas in Earth science.
The transport of eolian dust from natural desert regions has also been identified in modern snow and ice records at the so-called “third pole” based on Sr–Nd data (Wu et al., 2010; Xu et al., 2012; Du et al., 2015; Dong et al., 2018). Many studies have focused on dust transport from the western Chinese deserts to the Chinese Loess Plateau (CLP), Pacific Ocean, and even the Greenland ice sheet (GrIS) (Biscaye et al., 1997; Chen et al., 2007; Wei et al., 2021). However, it is still a controversial issue; for example, recent results have emphasized that eolian dust from local sources contributes significantly to high-mountain glaciers (Du et al., 2019a; Wei et al., 2021). Additionally, eolian dust from various source regions, including the Saharan Desert in North Africa and the Gobi and Taklimakan deserts in Asia, can be transported to the GrIS, and great uncertainties still exist (Han et al., 2018).
The Sr–Nd data from snow layers in the Berkner Island ice sheet in western Antarctica, for most of the year, support scenarios that involve contributions from proximal sources (Bory et al., 2010). The Sr–Nd data from insoluble dust in snow samples from East Antarctica indicate that long-distance natural dust primarily originates from Australia and that local dust originates from ice-free areas (Du et al., 2018). The Sr–Nd data from the Taylor Glacier zero-age ice samples and snow samples from Roosevelt Island could be explained by a mixture of at least two local sources (Winton et al., 2016; Aarons et al., 2017). The Sr–Nd data from Holocene ice cores from East Antarctica indicate a well-mixed atmospheric background involving a mixture of two or more sources in the Southern Hemisphere (SH) (Aarons et al., 2016, 2017; Delmonte et al., 2019). The amount of isotopic information is currently adequate for Patagonian and non-Patagonian mineral dust exported from southern South America (SSA) and the East Antarctic ice sheet (EAIS) (Grousset et al., 1992; Gaiero et al., 2007; Delmonte et al., 2010a, b, 2019; Delmonte et al., 2013; Blakowski et al., 2016; Aarons et al., 2017). Major efforts have attempted to solve the “puzzle” of the origin of the potential source areas that contribute dust to the Southern Ocean (SO) and the whole AIS (Gili et al., 2022). However, Sr–Nd data are unevenly distributed across the entire AIS. Measuring the Sr–Nd isotopic compositions in ice cores from Antarctica is a major challenge.
Although considerable Sr–Nd data have been measured, the variations in the characteristics and measurement methods of these data make it necessary to reassess these data on the dust sources in these remote regions. Therefore, the Sr–Nd data obtained from snow, soil, sediment, sand, and other samples should be integrated into a dataset to better serve the environmental and climatic sciences studying the three polar regions in the future. The answers to various questions have been hindered by a paucity of Sr–Nd data, which provide information on potential local and distal dust sources. For these reasons, we measured Sr–Nd data in some samples and collected Sr–Nd data from the literature for the three poles (Fig. 1, Table 1). The objective of this work was to produce a compilation of published and unpublished data from the three poles, and the specific time intervals of Sr–Nd data were limited to the Quaternary period. Furthermore, modern dust (Holocene) in snow or ice and sediment samples from the three poles is further discussed, and the potential dust transport paths in the GrIS and AIS are traced. Similar to the method of Blanchet (2019), here, we compile published and unpublished Sr–Nd data with an integrated filtering system from three remote poles, in which these data were collected in extremely cold and arid environments, and most of the data have not been included in previously published datasets. The dataset will help trace modern natural dust, reconstruct past environments, and extend the database of terrestrial and marine radiogenic Sr and Nd isotope data in the Earth and environmental sciences.
Table 1Data distribution locations and sample types for and εNd(0) from 90 references.
2.1 Sample collection and measurement
Sr–Nd data from snow, sand, soil, cryoconite, loess, and sediment samples from the three poles (namely the high mountainous regions in Asia, the Arctic, and Antarctica) were collected from our own research and existing literature (Fig. 1). Sr–Nd data from the third pole cover the area from 40 to 23∘ N and from 106 to 61∘ E and include data from arid deserts and mountains in northern China (Fig. 2). Sr–Nd data from the Arctic include data from the high Arctic to sub-Arctic areas, and Sr–Nd data from Antarctica refer to data from the area including the entire Antarctic continent, the AIS, and the Antarctic Peninsula (>60∘ S). Sr–Nd data were also collected from Australia, SSA, southern Africa (SA), and New Zealand (Fig. 1). Cryoconite refers to mixtures and/or aggregates of biotic and abiotic impurities on glacial ice, and the cryoconite samples were collected from positions at different elevations on glaciers (Table 2). Note that the ages of the snow, ice core, surface eolian dust, and deposit samples are almost all less than 1 Myr. Therefore, the ages of the Sr–Nd data in this dataset are limited to the Quaternary period.
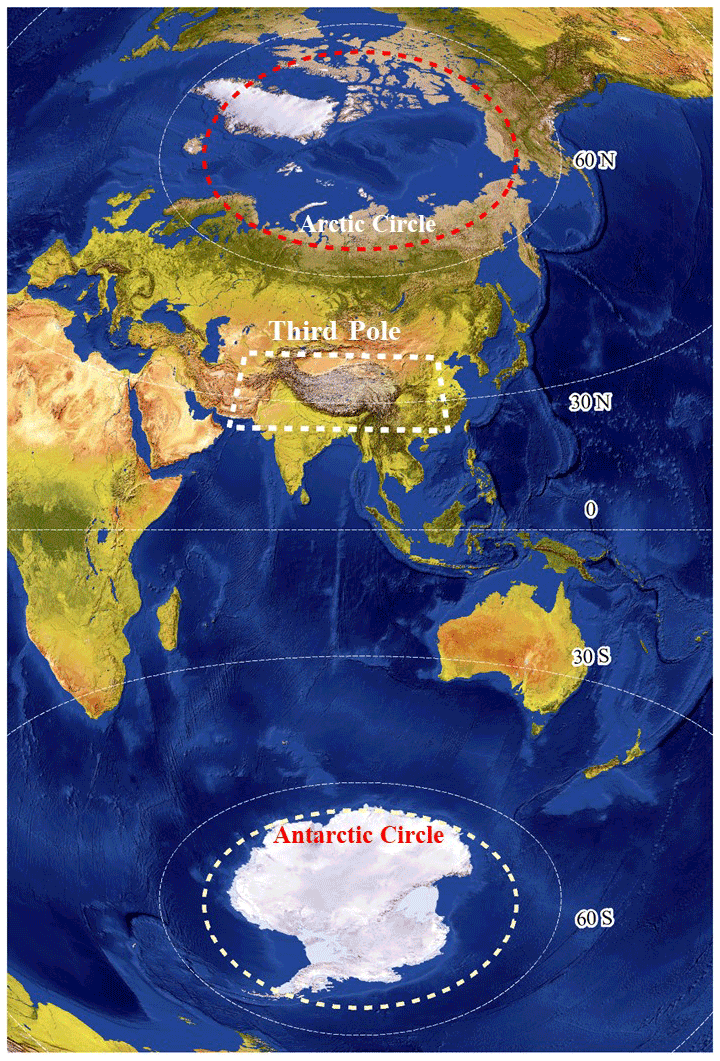
Figure 1Map of the sampling regions in the three poles. The third pole covers the high mountainous areas in Asia, and data were collected in the area from 40 to 23∘ N and from 106 to 61∘ E (Li et al., 2020). The Arctic covers the areas from the high Arctic to the sub-Arctic, and data were collected from >60∘ N. Data for Antarctica were collected from >60∘ S. The latter two regions are indicated using different colored circles. (The background of this figure is from ArcGIS.)
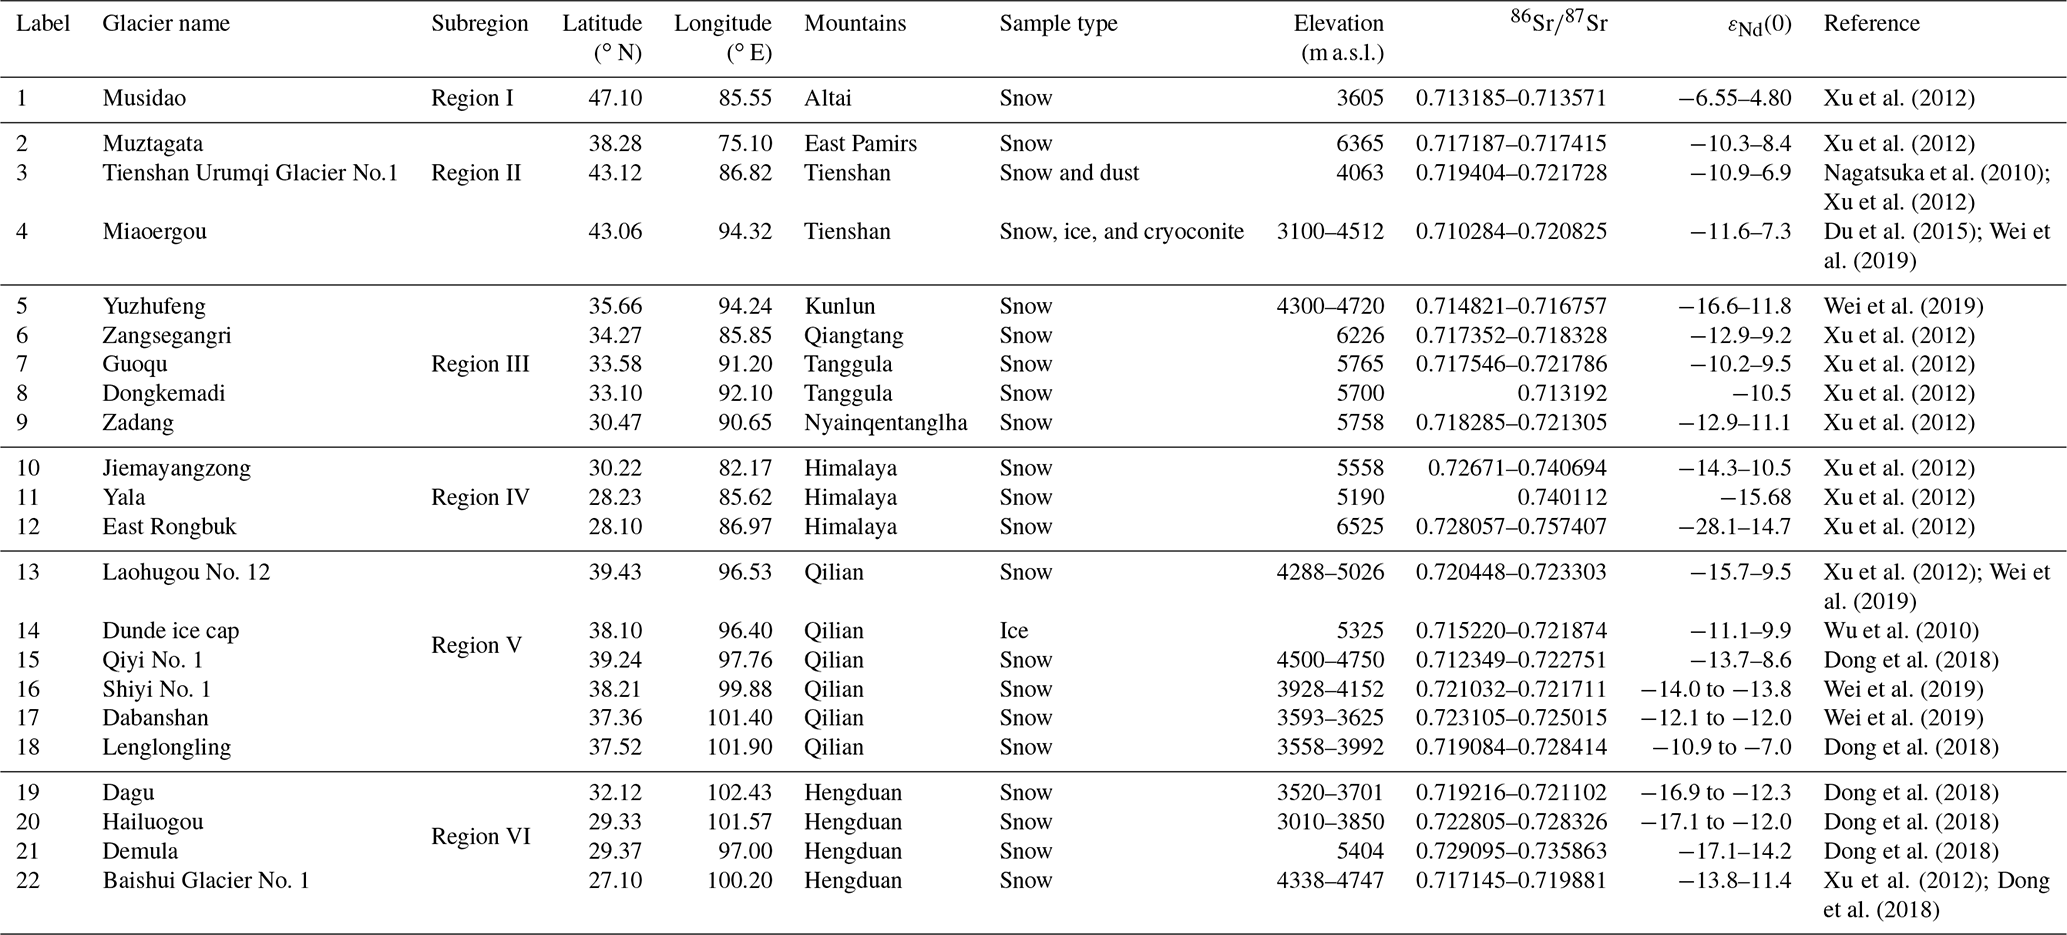
Table 2Snow, sand, and soil samples associated with third pole glaciers and potential source areas of dust generation. The headers from left to right represent the following: “Label” – the number assigned to each glacier; “Subregion” – the isotopic subregion of the third pole; “Glacier name” – the name of the glacier; “Site name” – the name of the sampling site where the samples were taken; “Longitude” and “Latitude” – the sampling location; “Mountains” – the mountain/mountain range studied; “Sample type” – snow, sand, or soil; “Elevation” – the elevation in meters above sea level (m a.s.l.); “” and “εNd(0)” – the respective isotopic ratios of Sr and εNd(0); and “Reference” – reference publications.
In this study, 2 sand samples from Kangerlussuaq in West Greenland, 4 sand samples from on King George Island, and 11 sand samples from Inexpressible Island in the Ross Sea in West Antarctica were collected and measured. In general, the upper 2 or 5 cm of surface topsoil (sand) was collected with a trowel and stored in precleaned plastic bags or bottles. The sediment samples from shelves and ridges in the Arctic Ocean (AO), which were mostly retrieved from core archives, were collected through subsampling the upper surface of the core tops (with rare exceptions) (Maccali et al., 2018). Different grain sizes (<5, <10, 30, <63, <75, <100 µm, and bulk fractions) of surface soil or sand were extracted by the sieving method (Chen et al., 2007; Maccali et al., 2018; Du et al., 2018, 2019a, b; Wei et al., 2021).
Snow samples were collected from a snow pit at a vertical resolution of 5–20 cm, following the clean-hands protocol, with sampling personnel wearing integral Tyvek® bodysuits, non-powdered gloves, and masks to avoid possible contamination (Xu et al., 2012). In this study, one 1.0 m snow pit with a resolution of 10 cm was dug in the GrIS, and four fresh snow samples (M1, M2, M3, and M4) were sampled on sea ice in the AO during the Multidisciplinary Drifting Observatory for the Study of Arctic Climate (MOSAIC) mission in October 2020. Surface (2–10 cm) fresh-snow samples at different resolutions (with different thicknesses, widths, and lengths) from the Greenland and Antarctica ice sheets were excavated and placed in 5 L Whirl-Pak bags (Du et al., 2018, 2019a, b). Three horizontal snow layers were collected in Greenland and Antarctica snow pits (Bory et al., 2003b, 2010). The dust in the ice cores was extracted using the same method as that for the snow samples. Snow or ice core samples represent either bulk samples or have different grain sizes (>0.2, >0.45, >0.45, and <30 µm) (Du et al., 2015, 2019b; Bory et al., 2003a, b, 2010; Lupker et al., 2010; Wu et al., 2010).
2.2 Data processing
Sr–Nd isotope datasets from snow, ice cores, sand, sediment, soil, and loess samples from the third pole, the Arctic, and Antarctica were compiled. Data were collected from 90 different references with 2847 data points. In total, 485 data points were collected from the third pole, 727 data points were collected from the Arctic, and 777 data points were collected from Antarctica. In addition, 259 data points were collected from the pan-third pole (including the Tibetan Plateau, the Pamirs, Hindu Kush, Tienshan, the Iranian Plateau, Caucasus, the Carpathians, and the surrounding deserts), and 181 data points were included from potential source areas (PSAs) in the SH. Details on the geographical coordinates and original information can be found in this dataset, and the locations of these samples are shown on maps (Figs. 2, 4, 5, and 7). To keep the naming scheme uniform, the dataset assembled the names of each sample based on the work by Blanchet (2019). This dataset was built by incorporating data from the literature and our own database; in particular, units, source or sink, and geographical coordinates are marked in the dataset. Note that whether the Sr–Nd data represent source or sink information needs to be further determined by the detailed depositional environment or sampling locations. For example, the loess samples from the CLP represent a sink, but they also represent a dust source for the Pacific Ocean. Therefore, these samples were marked as a mixture. The sediment samples from the coasts of the SO or AO (rivers and dune sand) were also marked as a mixture. An overview of the input data is shown in Table 1. This study focuses on large amounts of different data, including data on snow, ice, sand, soil, loess, and sediment. These data are based on our own measurements, author contributions (data published), and literature searches.
All procedures were performed in clean lab facilities. The sand, loess, sediment, cryoconite, and dust samples extracted from snow and ice cores were generally digested with ultrapure acid (HNO3, HF, and HClO4, or HNO3, HF, and HCl), and and ratios were determined using different types of thermal ionization mass spectrometry or multiple-collector inductively coupled plasma mass spectrometry. Sr–Nd values, with uncertainties expressed as (2 standard errors of the mean), can also be found in the original references. The isotopic composition is expressed as follows:
where ()CHUR=0.512638. Here, CHUR stands for the chondritic uniform reservoir and represents a present-day average Earth value ()CHUR=0.512638 (Jacobsen and Wasserburg 1980).
3.1 Reliability assessment for the differences in Sr–Nd based on grain sizes as well as on lithogenic and measuring methods
The grain-size effect in different samples resulted in variations in the ratios and εNd(0) values. In the surface eolian sand and marine sediment samples, the variations in size-separated values are affected by grain size (Chen et al., 2007; Tütken et al., 2002). The Sr isotope ratios in loess from the CLP tended to be higher in the fine fraction and were much higher in the <2 µm fraction than in the coarser fractions (Rao et al., 2006). However, the variations in the isotopic ratios in alpine soils on the Tibetan Plateau (TP) are not clearly related to the grain-size effect (Lin and Feng, 2015). The εNd(0) values clearly exhibit less grain-size-dependent variability, as εNd(0) values seem not to be fractionated among mineralogically different grain-size fractions during the sedimentary cycle (Tütken et al., 2002). A substantial proportion of Sr–Nd isotope values showed enrichment in the coarse-grained fraction, which can be attributed to the source-rock types (Xie et al., 2020). Within the isotopically diverse Indus Delta sediment, the bulk isotopic compositions are estimated to deviate on average by no more than ±1.04εNd units and ±0.0099 for values in any sediment sample as a result of mineralogy, grain-size distribution, and analytical error (Jonell et al., 2018).
The εNd(0) signatures of the lithic fraction of sediments are taken as robust proxies of circulation and hydrologic processes because of their different origins across various timescales (Revel et al., 1996; Abbott et al., 2022). However, Sr–Nd isotope ratios in the lithogenic sediment fraction represent a complex mixture (Meinhardt et al., 2016; Bayon et al., 2021). The widespread influence of lithogenic neodymium on authigenic εNd(0) has been demonstrated. For example, there is a strong linear relationship between detrital εNd(0) and authigenic εNd(0) (r=0.86, n=871) (Abbott et al., 2022). Therefore, the sediment characteristics and detrital isotope records should be considered when using εNd(0) data. Different acid-leaching methods also have an effect on the Sr–Nd isotopic compositions of the silt and clay fractions in marine sediments (Walter et al., 2000). Acid-treated loess samples from the CLP and cryoconites (including surface dust) from high-mountain glaciers exhibit obviously higher ratios than samples without acid treatment and bulk samples (Rao et al., 2006; Nagatsuka et al., 2010, 2016).
Therefore, the provenance, grain size, lithogenic nature, and measurement methods of the Sr–Nd data from different media in this dataset must be considered when interpreting Sr–Nd isotope compositions in order to obtain good results.
3.2 The Sr–Nd data characteristics of glaciers at the third pole
Table 2 and Fig. 2 provide an overview of the information on samples from the third pole (the serial number of glaciers, subregions, glacier name, name of the sampling site where the samples were taken, sample type, sample age, sample elevation, and sampling longitude and latitude). The dust in snow and ice in the third pole originates from PSAs; therefore, the Sr–Nd data from these samples represent the characteristics of sinks. The Sr–Nd data from local or arid desert sand and soil represent the characteristics of PSAs. As an example, the isotopic signatures of the insoluble dust in snow and ice (sinks) at the third pole can be used to identify PSAs based on the data and geographic characteristics of sand and soil samples from the local exposed bedrock and distal arid deserts, from which dust is transported over long distances. Standard Sr–Nd measurement methods were applied to the snow samples (Xu et al., 2012; Du et al., 2015, 2019a; Dong et al., 2018; Wei et al., 2019, 2021), and standard measurement methods were applied to the sand or surface dust samples (Chen et al., 2007; Nagatsuka et al., 2010). The data results seem to remain fully consistent with these references.
On the basis of sorting criteria for determining PSAs based on the distributions of mountains and glaciers, geographic features, and isotopic values (snow or ice from the third pole glaciers, sand and soil from local and distal arid deserts), the third pole was divided into the following six isotopic subregions (Fig. 2):
Region I comprises samples from glaciers located in the Altai Mountains, including snow samples from Musidao Glacier and Altay as well as sand samples from the Gurbantünggüt Desert, with εNd(0) values from −6.6 to −1.2 and values ranging from 0.705483 to 0.71480. The highest εNd(0) values were observed in this region (Chen et al., 2007; Xu et al., 2012; Du et al., 2019a).
Region II comprises samples from the glaciers on the northern margin of the TP, including snow samples from the Tienshan Mountains (Tienshan No. 1 Glacier and Miaoergou ice cap) and Kunlun Mountains (Muztagata) as well as sand samples from the Taklimakan Desert, with εNd(0) values from −11.8 to −6.9 and values from 0.70842 to 0.728641 (Chen et al., 2007; Nagatsuka et al., 2010; Du et al., 2015; Xu et al., 2012; Wei et al., 2019).
Region III comprises samples from the interior of the TP. The Sr–Nd isotopic characteristics of the glaciers and sand/soil of this region include εNd(0) values ranging from −10.5 to −8.6 and values from 0.713192 to 0.721786 (Xu et al., 2012; Du et al., 2019a; Wei et al., 2021). Region IV comprises Sr–Nd isotope data from snow and sand/soil samples from glaciers in the Himalayan Mountains (East Rongbuk, Jiemayangzong, and Yala), with εNd(0) values ranging from −28.1 to −10.5 and values ranging from 0.724542 to 0.757407 (Xu et al., 2012; Wei et al., 2021).
Region V comprises samples from glaciers in the Qilian Mountains, including snow samples from the Qilian Mountains and sand (soil and loess) samples from the Hexi Corridor, with εNd(0) values from −15.7 to −7.0 and values from 0.712349 to 0.73211 (Wei et al., 2017; Dong et al., 2018). The εNd(0) values have an increasing trend along the Hexi Corridor from west to east. These trends are −15.7 to −12.9 for Laohugou No. 12 Glacier (local soil: −13.6), −13.7 to −8.58 for Qiyi, −13.8 to −13.6 for Shiyi Glacier (local soil: −13.8 to −13.6), −12.1 to −12.0 for the Dabanshan snowpack, and −10.9 to −7.0 for Lenglongling Glacier (Dong et al., 2018). It is very clear that, based on these local data, regional dust makes a significant contribution to these glaciers.
Region VI comprises samples from the glaciers in the eastern TP, including snow and soil samples from the Hengduan Mountains, with εNd(0) values from −17.1 to −10.1 and values from 0.717145 to 0.735863 (Xu et al., 2012; Dong et al., 2018).
There is an increasing trend from north (Region I) to south (Region V), and there is a decreasing εNd(0) trend from north (Region I) to south (Region V). The maximum ratios and minimum εNd(0) values were observed in Region V (Fig. 3). The Sr–Nd data in the third pole have relatively narrow ranges with distinct features, while the largest uncertainty was observed in Region IV (Fig. 3).
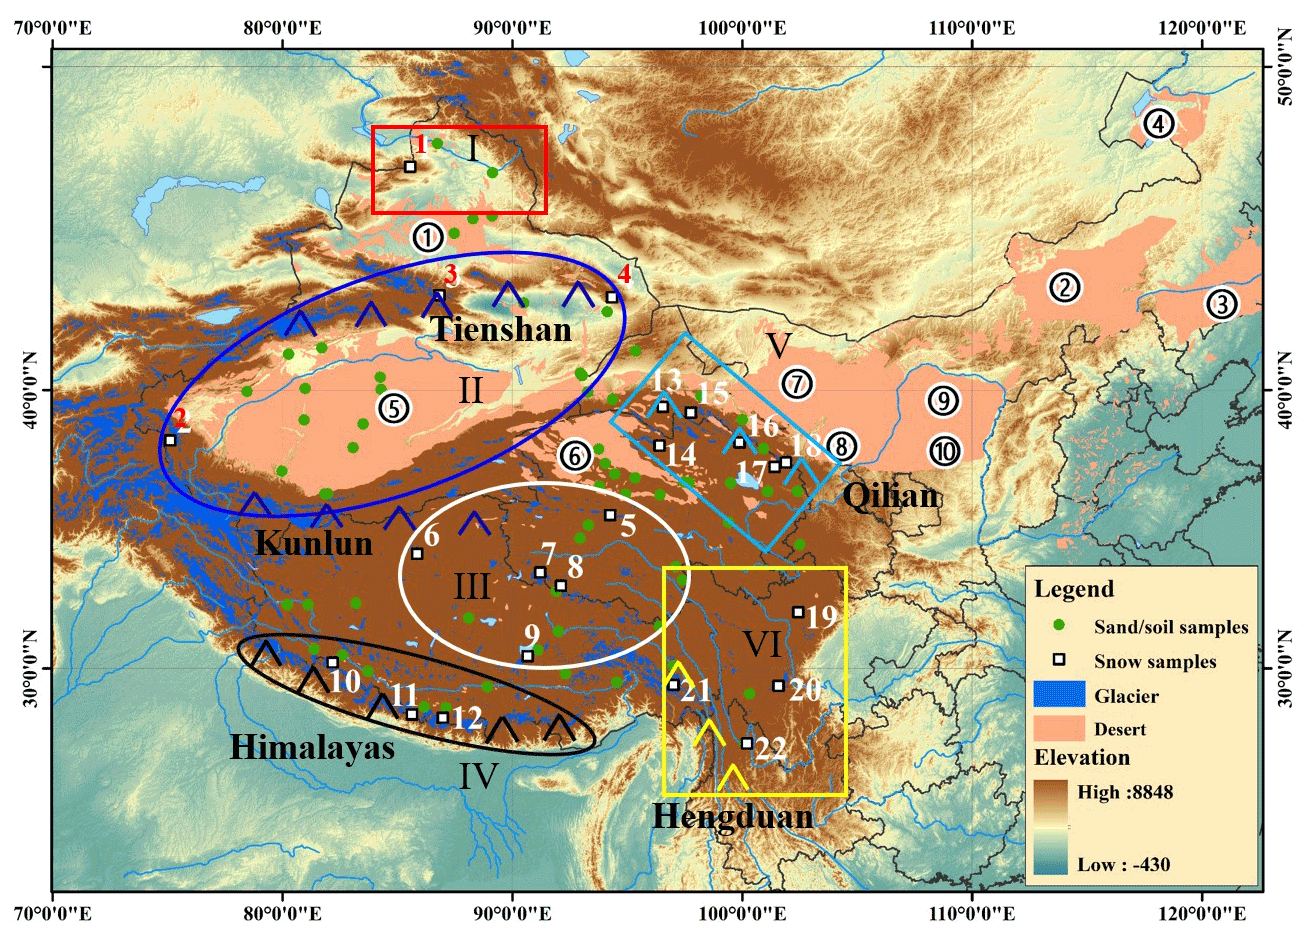
Figure 2The glacier and desert distributions in western China. The different colored oval and rectangular shapes represent the six subregions in the third pole: PSAs and glaciers, the Tienshan Mountains, the Kunlun Mountains, the Qilian Mountains, the Himalaya Mountains, and the Hengduan Mountains. Numbers and white squares represent 22 glaciers (snow samples were collected from these glaciers), the names of which are shown in Table 2. The numbered circles represent the 10 desert or sandy areas in China: 1. Gurbantünggüt Desert, 2. Onqin Daga sandy land, 3. Horqin sandy land, 4. Hunlun Buir sandy land, 5. Taklimakan Desert, 6. Qaidam Desert, 7. Badain Jaran Desert, 8. Tengger Desert, 9. Hobq Desert, and 10. Mu Us Desert. The green solid circles represent sand and soil samples. (This figure was created with ArcGIS.)
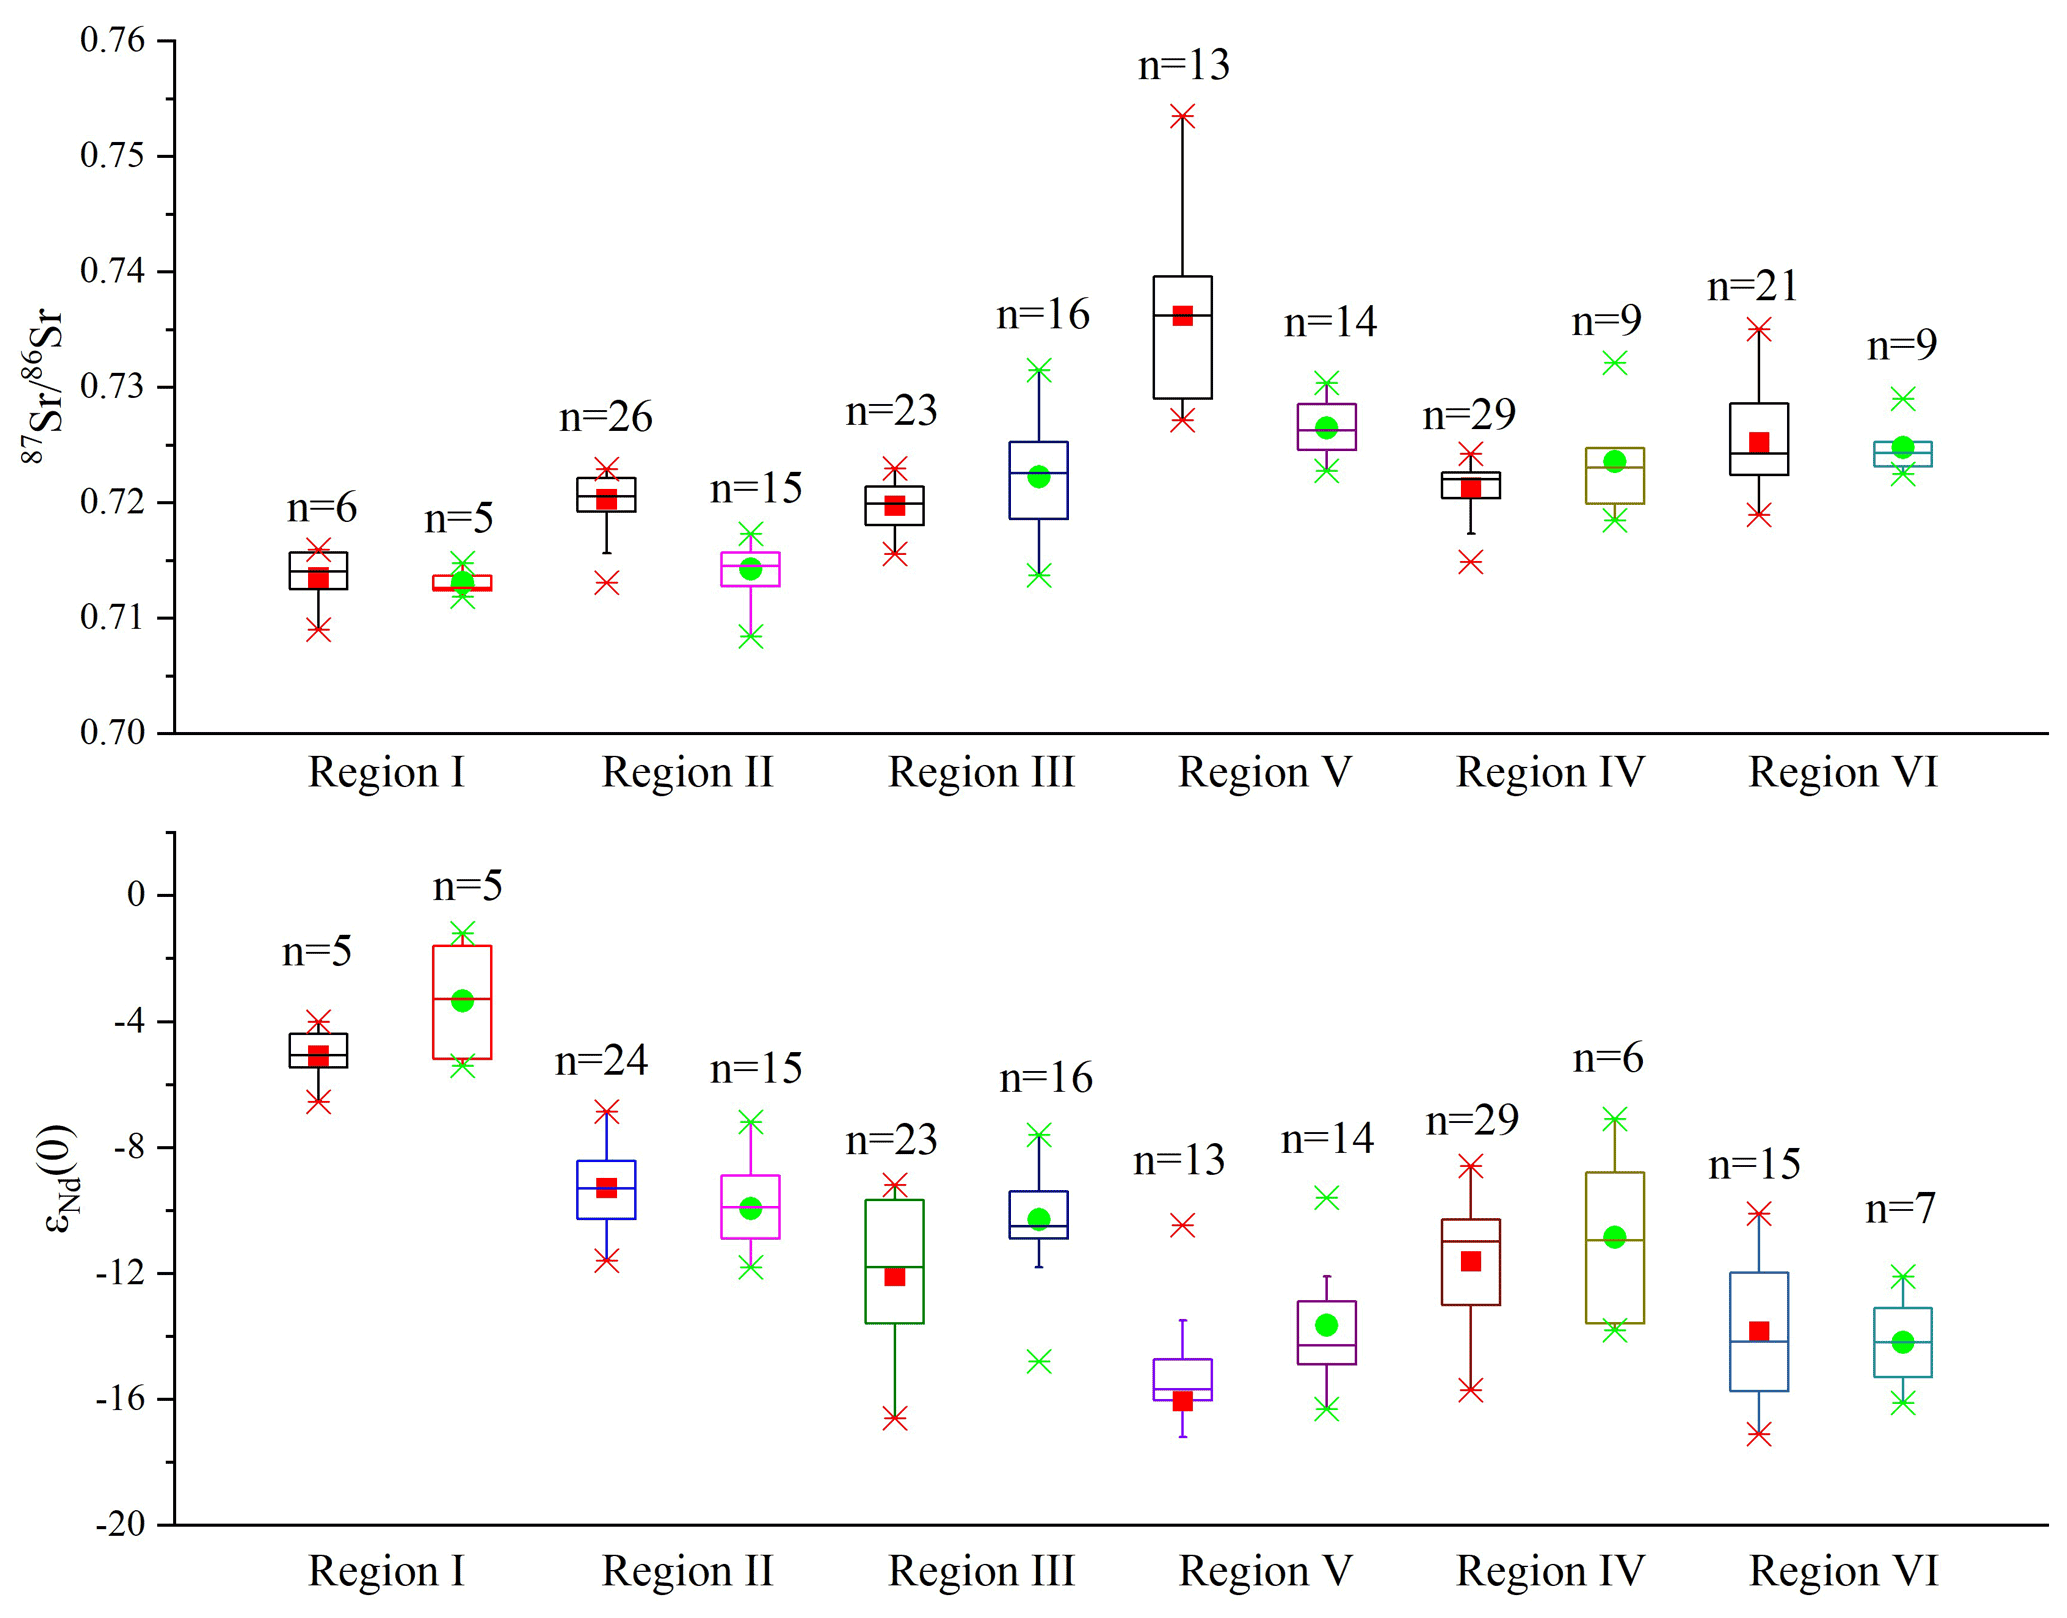
Figure 3Box plot of the Sr–Nd isotope signatures of third pole PSAs and snow samples. Samples are located in each PSA based on the data from Table 2 (the number of samples for each subregion are presented, n>5). The horizontal line within the box is the median, and the squares are the mean Sr–Nd values (red rectangles for sand or soil samples and green solid circles for snow samples). The interquartile range is represented by the lower and upper boundaries of the boxes, and whiskers indicate confidence intervals of 1.5 times the interquartile range.
3.3 Sr–Nd data from the Arctic
Considerable Sr–Nd data have been obtained from modern snow and ice samples from the Arctic and surface (including sea-ice-transported sediments) sediment in the AO. These data cover the entire Arctic and represent the characteristics of a sink (Fig. 4). The data points are presented in Table 3. Sr–Nd data from arid deserts (East Asian and Saharan deserts) have been compiled in previous datasets (Blanchet, 2019; Robinson et al., 2021), and these data are useful for tracing terrigenous material transport in the Arctic. For user-friendly selection of the Sr–Nd data according to the modern environmental characteristics and the geographical location, Sr–Nd data from deep ice cores are not included in Fig. 5. We compared the Sr–Nd data from the surface snow (sink) and marine sediment (sink or source) samples in the Arctic (Figs. 5, 6). Based on the isotopic signals of these samples, geologic units, adjacent seas, and drainage basins of the main river systems in the Arctic, the Sr–Nd patterns can be divided into 12 subregions according to Maccali et al. (2018).
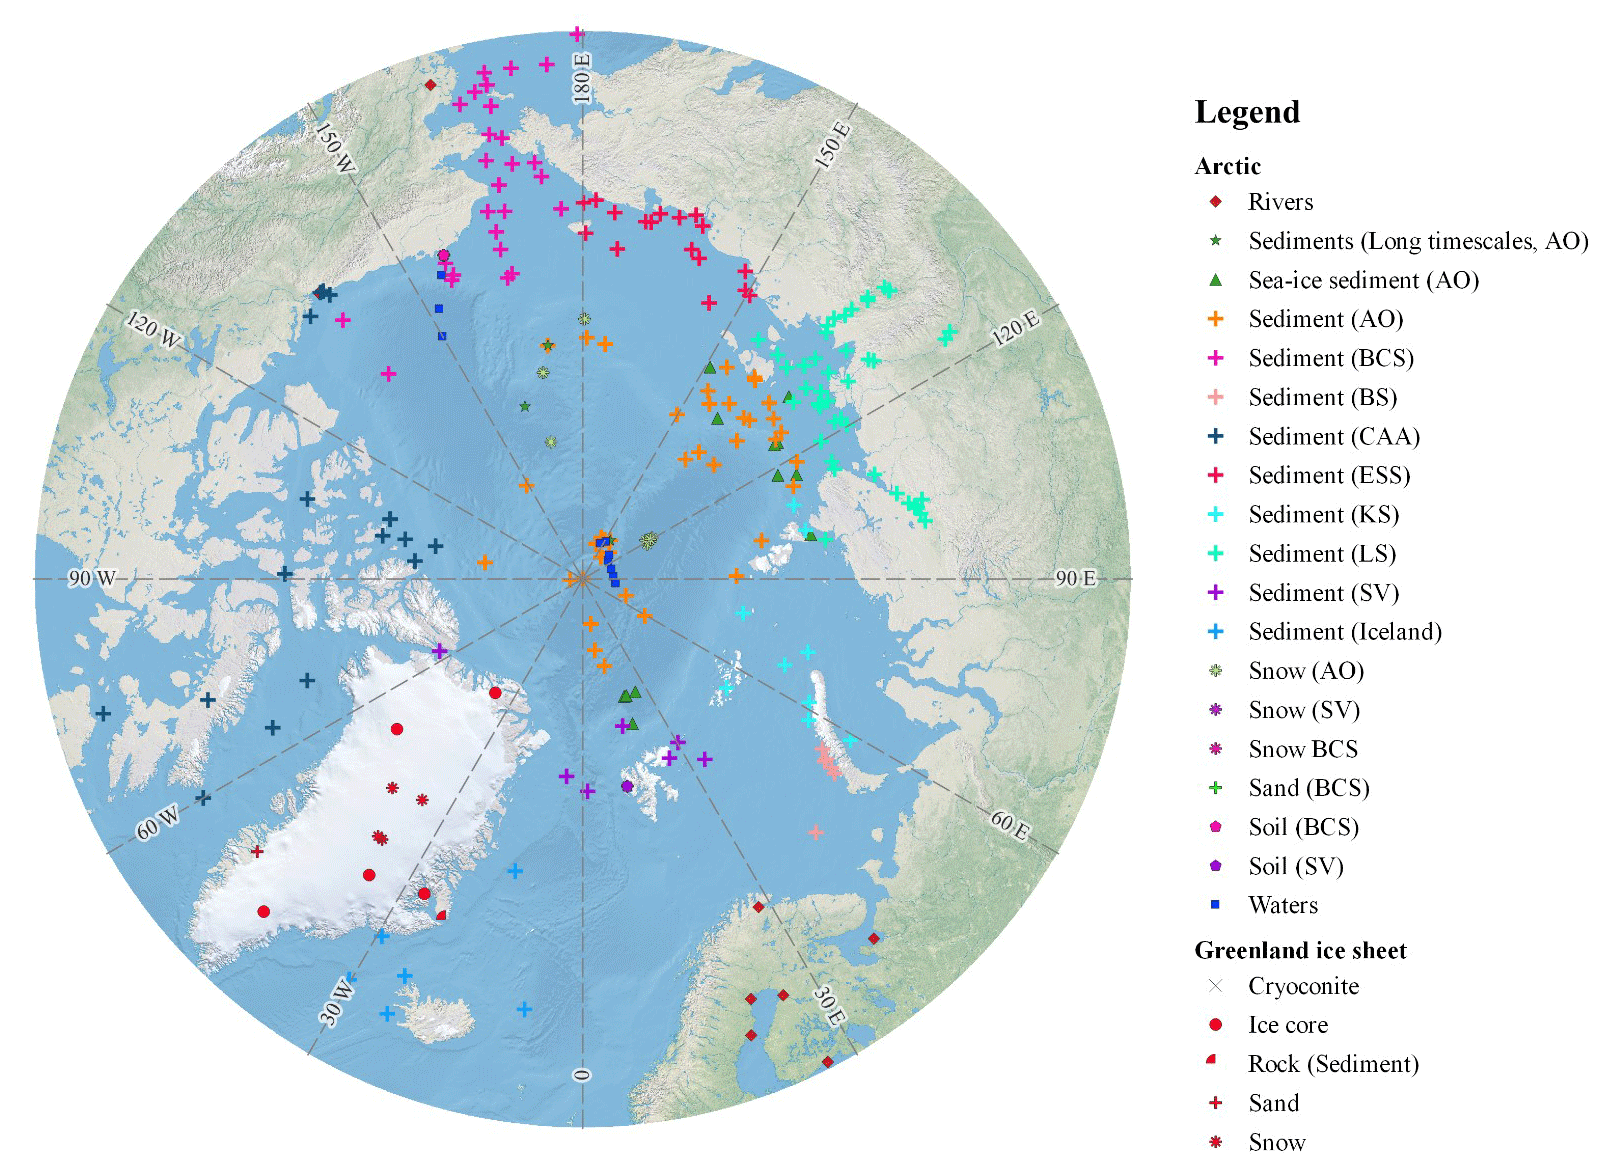
Figure 4Distribution of sampling sites in the Arctic. The types of samples are denoted using different shapes and colors (see legend; Table 3). The abbreviations used in the figure are as follows: AO – Arctic Ocean, BCS – Bering–Chukchi Sea, BS – Barents Sea, CAA – Canadian Arctic Archipelago, ESS – East Siberian Sea, KS – Kara Sea, LS – Laptev Sea, and SV – Svalbard. (This figure was created with ArcGIS.)
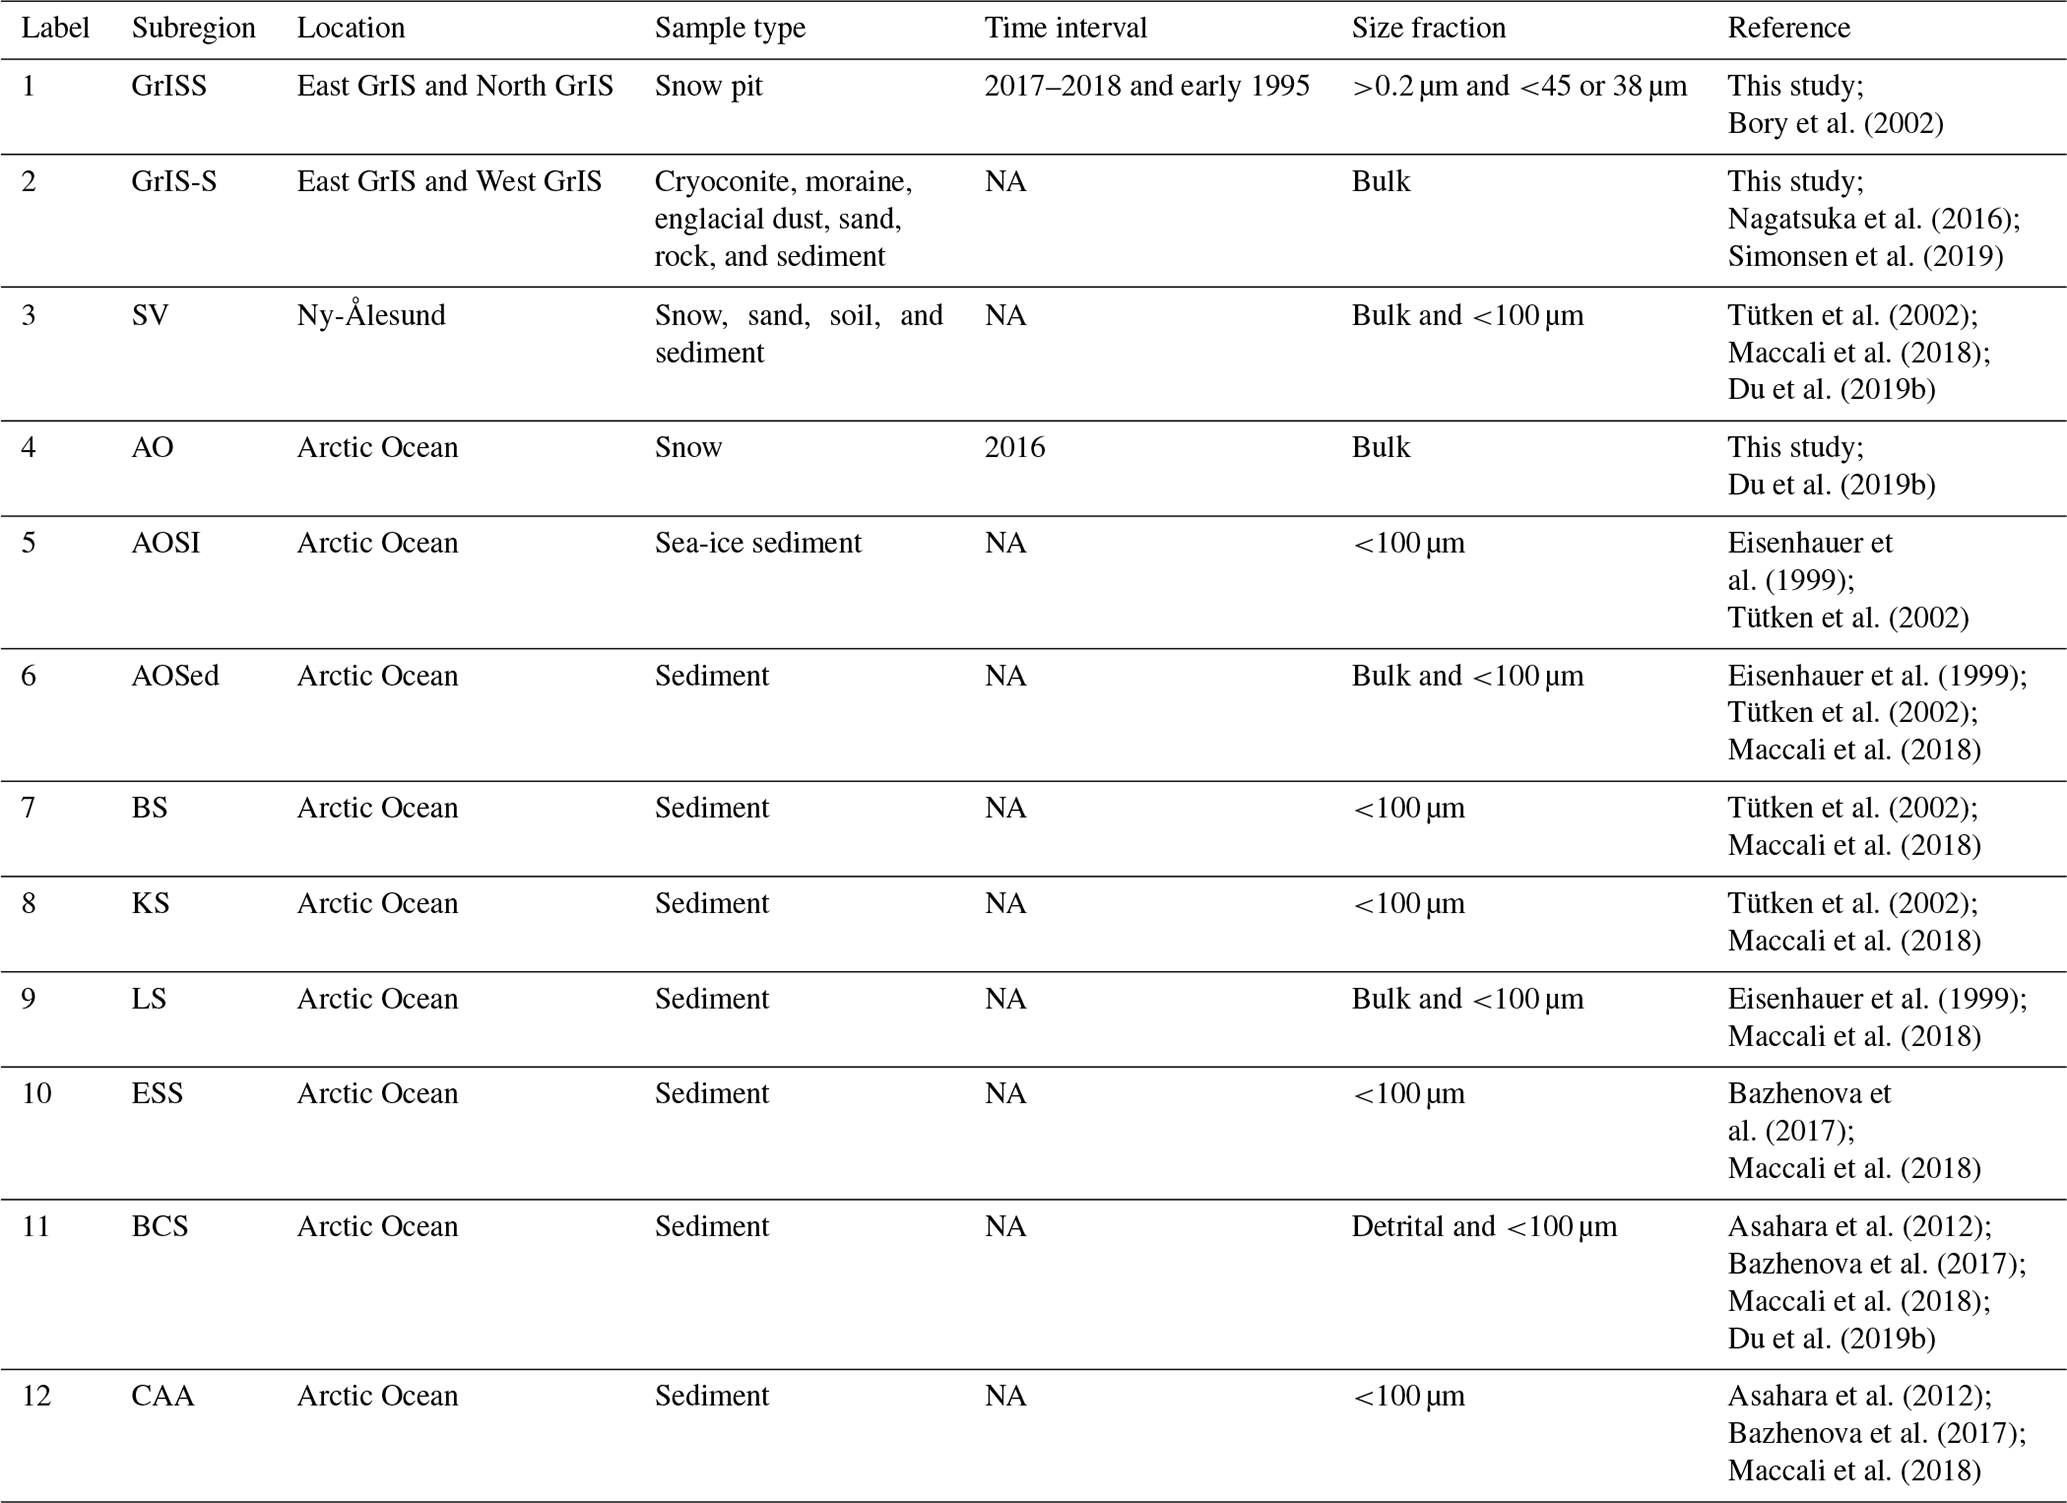
Table 3Snow, cryoconite, sand, soil, and sediment samples located in the Arctic. The headers from left to right represent the following: “Label” – the number assigned to each sample; “Subregion” – the name of a mountain range, ocean or ice sheet; “Location” – the name of the sampling site where the samples were taken; “Sample type” – snow, cryoconite, sand, or soil; Reference – reference publications. The reader is referred to the caption of Fig. 6 for subregion definitions. NA stands for not available.
3.3.1 Sr–Nd data from snow/ice and sand samples from the Greenland ice sheet
Sr–Nd data from the East Greenland Ice Core Project (EGRIP) and the North GRIP (NGRIP) were obtained from snow pits. Sr–Nd data were also measured in the Greenland Ice Core Project (GRIP), the Greenland Ice Sheet Project 2 (GISP2), and the North Greenland Eemian Ice Drilling (NEEM) ice cores, and in the Renland, Site A, Hans Tausen, and Dye 3 shallow ice cores. The Sr–Nd data exhibit large differences in these samples (Fig. 5). The Sr–Nd data from NGRIP snow indicated that the dust sources were variable and showed complicated dust sources at the same location (Bory et al., 2002, 2003b). Much more Sr–Nd data have been recently measured from sand, soil, cryoconite, moraine, and englacial dust samples on the periphery of the GrIS (Nagatsuka et al., 2016). In these samples, the values are high, and the εNd(0) values are the least radiogenic (Table 3). Based on a comparison of the Sr data from the NGRIP and EGRIP snow pits (Bory et al., 2002, 2003b), much larger variations in were observed in the EGRIP snow pit, and lower values were observed in the NGRIP snow pit. The εNd(0) values in the interior of the GrIS were found to be relatively consistent, whereas large differences were observed at the periphery of this region. Therefore, although the Sr–Nd isotope ratios indicated that Asian deserts might be the main dust source for the GrIS, the ice-free region around the GrIS might be another source for the interior GrIS. In sediment samples collected from the Scoresby Sound region by Simonsen et al. (2019), the ratios range from 0.709689 to 0.736137, and the εNd(0) values range from −15.7 to −10.1. Based on a combination of the Sr–Nd values in snow (Renland, Site A, Hans Tausen, and Dye 3) and Dye 3 shallow ice core samples, as proposed by Lupker et al. (2010), the local dust sources may contribute some of the dust to the inland regions, and the Sahara is also the most likely additional PSA. The local dust from the ice-free areas of the GrIS may have been neglected in previous studies.
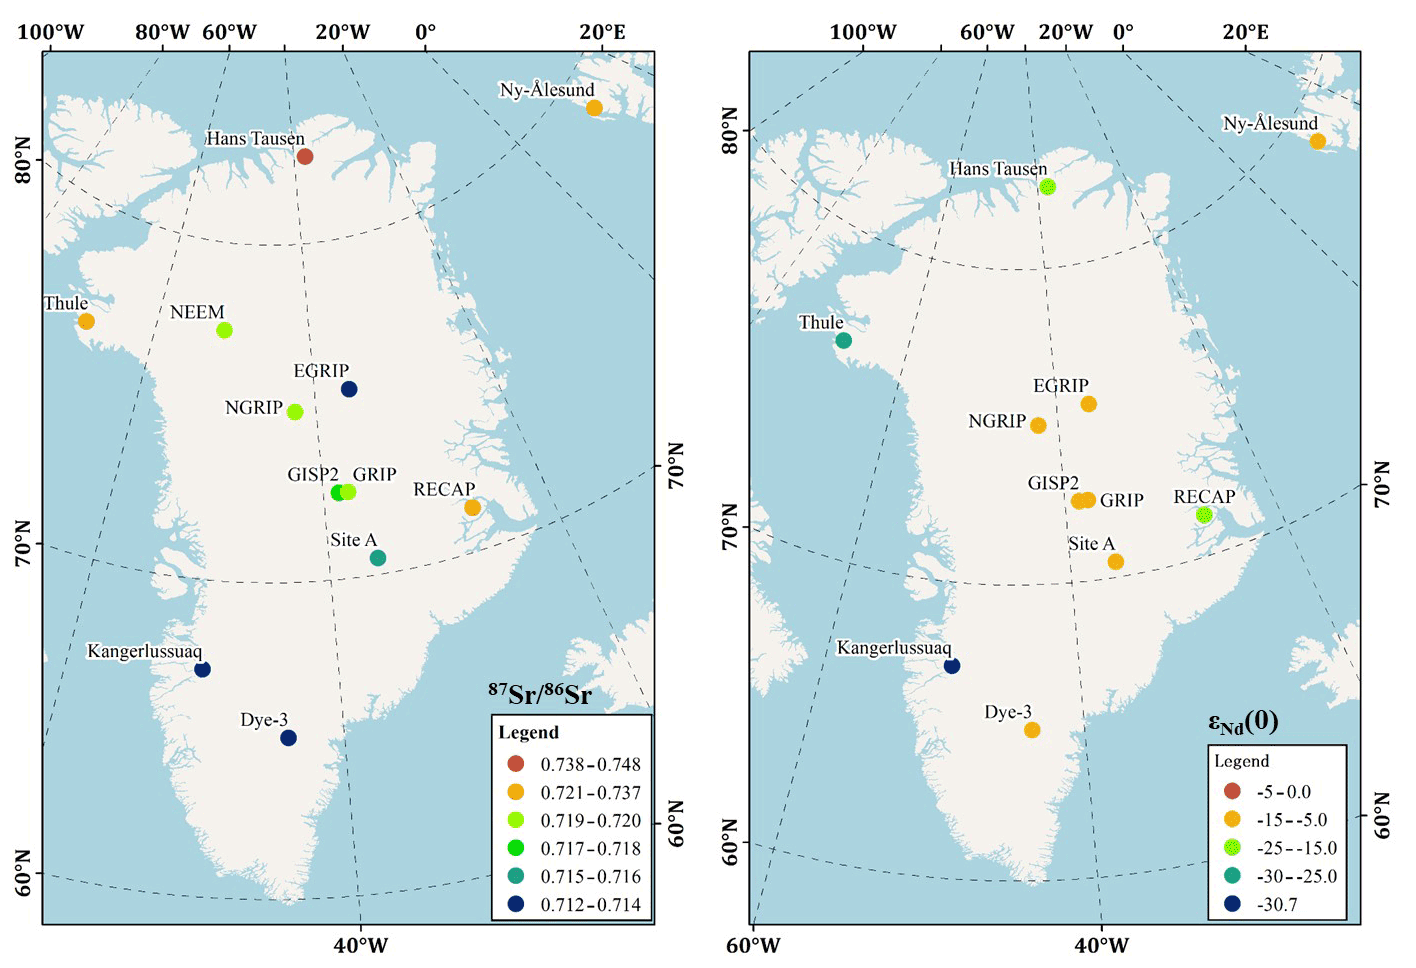
Figure 5 and εNd(0) data in snow or ice cores and sand/soil samples from Ny-Ålesund, Svalbard, and GrIS. (This figure was created with ArcGIS.)
The mainstream view of the provenance of dust in inland Greenland deep ice cores (GISP2 and GRIP) is that the dust is from the eastern Asian deserts (the Gobi and Taklimakan deserts) based on the best Sr–Nd data matches during the last glacial period (Biscaye et al., 1997; Svensson et al., 2000; Újvári et al., 2015). High-resolution Sr isotope data from the Greenland NEEM ice core suggest that there was a significant Saharan dust influence in Greenland during the last glacial period (Han et al., 2018). The Sr–Nd data (>5 µm) in Holocene Renland ice cap project (RECAP) ice core samples are attributed to proximal dust sources; however, the resolution of the data is approximately 1000 years (Simonsen et al., 2019). Nevertheless, the Sr–Nd data in Greenland deep ice core samples (Biscaye et al., 1997; Svensson et al., 2000), which have low resolutions and represent multiyear averages with no seasonal or interannual variations (60 to 200 cm or 30–150 years), need to be considered when using some data.
3.3.2 Sr–Nd data from snow and sediment samples in the Arctic Ocean
Surface eolian dust from mid- or high-latitude continental weathering and arid deserts may be the most important dust contributor to snow and ice cores. The values are higher and εNd(0) values are lower in snow and sand samples from Ny-Ålesund, Svalbard (SV) (not including data from Iceland in Fig. 6). The Sr–Nd data in snow samples from sea ice were measured in bulk, and four of these samples were collected near the North Pole in the western AO by MOSAIC (October 2020) in this study (Figs. 4, 6). The εNd(0) data have highly negative εNd(0) values (−20.8 to −19.6), which cannot be explained by low-latitude potential dust sources. As shown in Fig. 6, the lowest εNd values were observed along the ice-free periphery of the GrIS and SV; therefore, these ice-free regions are potential sources of natural dust in the AO.
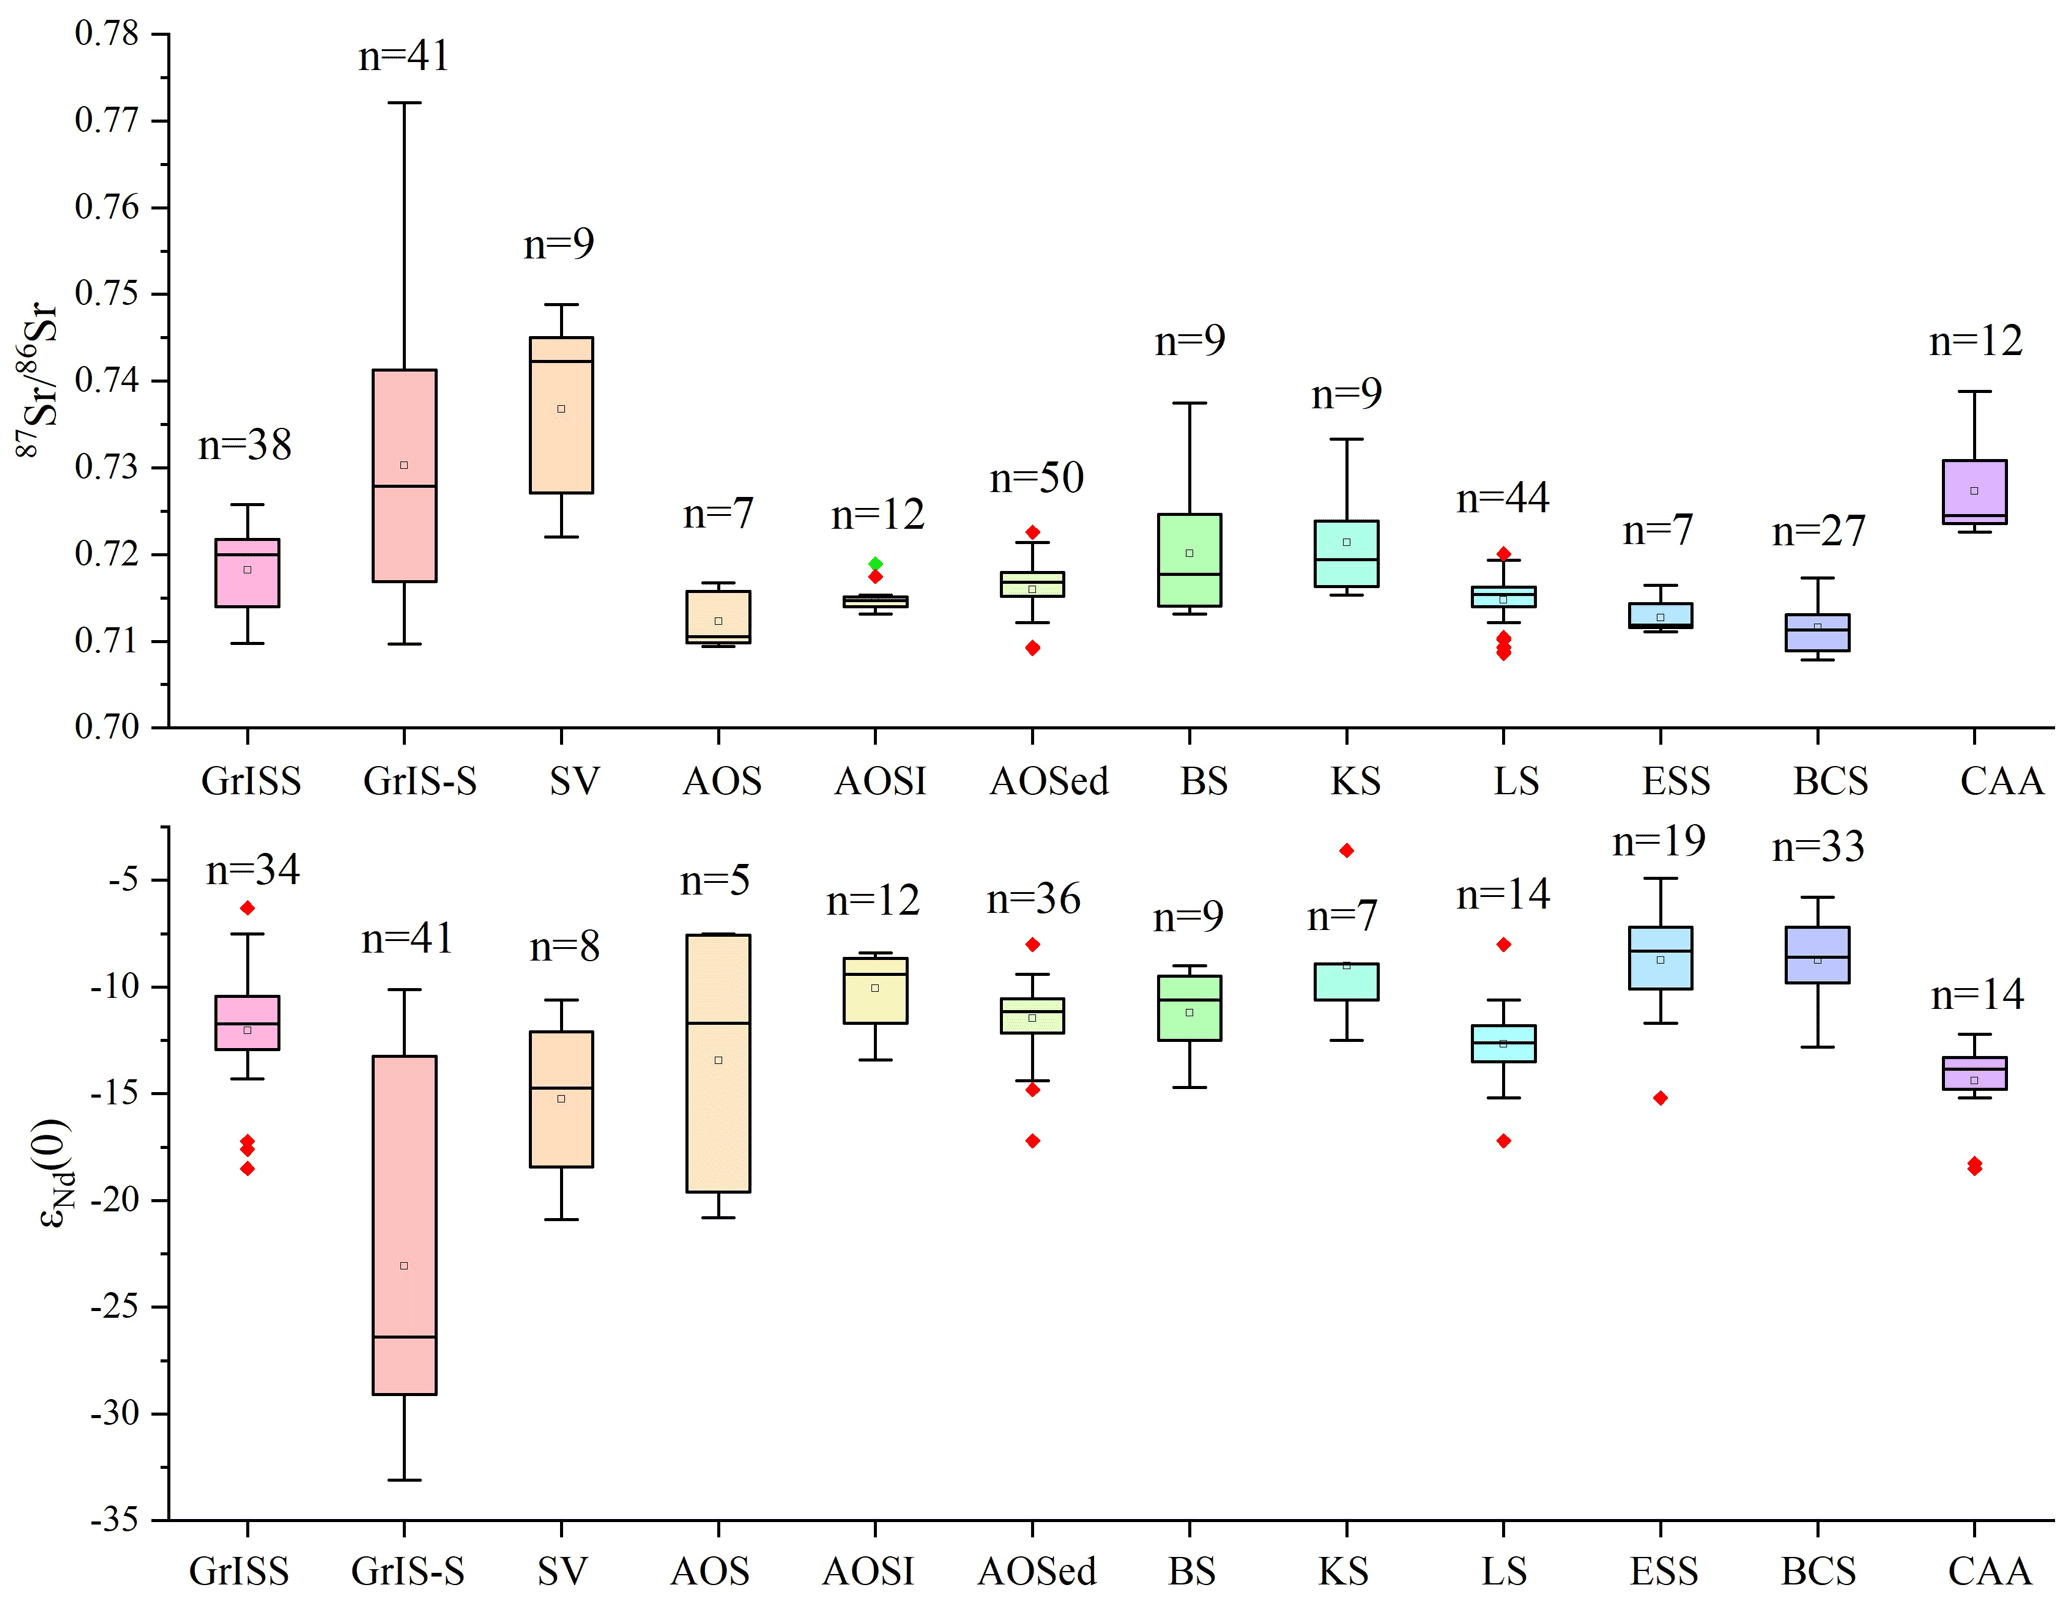
Figure 6Box plot for the Sr–Nd isotopic signatures of the Arctic, including the 12 subregion samples of snow, sand, soil, and sediment from sea-ice and sediment cores in the dataset (the number of samples for each subregion is presented, n>5). The abbreviations used in the figure are as follows: GrISS – Greenland ice sheet (snow samples), GrIS-S – Greenland ice sheet (sand), SV – Svalbard (snow and sand), AOS – Arctic Ocean (sediment), and AOSI – Arctic Ocean (sea-ice sediment).
Terrigenous material from the Arctic marginal seas, including the Bering–Chukchi Sea (BCS), the Barents Sea (BS), the Canadian Arctic Archipelago (CAA), the East Siberian Sea (ESS), the Kara Sea (KS), and the Laptev Sea (LS), is transported to and deposited in the AO and may be the primary material source for marine sediment. The Sr–Nd data from Arctic surface sediments were based on the literature (Fig. 6), and most samples were sieved at <45 or 63 µm for bulk sediment samples. These samples were taken from the surface or from 0–10 cm from the surface in order to best represent the characteristics of coastal terrestrial sources, as presented by Maccali et al. (2018). The Sr–Nd values from the sediment samples (including sea-ice sediment) are almost the same as those of snow samples from the AO, indicating that the same PSAs exist in the central AO. The Sr–Nd signals in the sediment from the AO seem to be close to those from the BS, KS, and LS, which may indicate contributions from the Transpolar Drift originating over the Siberian shelves and crossing the AO towards the Fram Strait. The sample spatial coverage in each subregion is variable, and Fig. 6 shows the distinguishing characteristics of each region, but the Sr–Nd isotopic values overlap among close geographical regions to a great extent. Therefore, these data from different regions should be used carefully.
3.4 Information on Sr–Nd data from the SH and Antarctic ice sheet
By integrating the literature and adding data with new evidence, the dust provenances of low-elevation areas on the periphery of the AIS in the Holocene (including modern) are discussed. The dataset provides a comprehensive overview of the state of knowledge of dust sources and sinks in different sectors of the AIS and PSAs in the SH. The location of Sr–Nd datasets from different sectors of Antarctica and the AIS are presented in Fig. 7. The Sr–Nd data from Antarctica are not evenly distributed, and more data have been measured in western Antarctica and the Ross Sea. The Sr–Nd data from PSAs in the SH (Australia, SSA, and SA) clearly reflect the characteristics of these regions and provide insight for tracing dust source–sink paths. For example, the ratios in Australian dust samples range from 0.709 to 0.732, and the εNd(0) values are between −15 and −3 (Revel-Rolland et al., 2006). The Nd values from Patagonia (39–52∘ S) in SSA are more radiogenic (−1 to 1 for εNd(0)) (Gaiero et al., 2007). The eolian dust from Argentina and Chile is confined to the ranges of and −5<εNd(0)<3 (Delmonte, 2003). The ratios in the sand samples from SA vary between 0.712348 and 0.74716, and the εNd(0) ratios vary between −24.5 and −8.4 (Delmonte, 2003; Gili et al., 2022). These Sr–Nd data can very clearly distinguish geographic subgroups of PSAs in the SH.
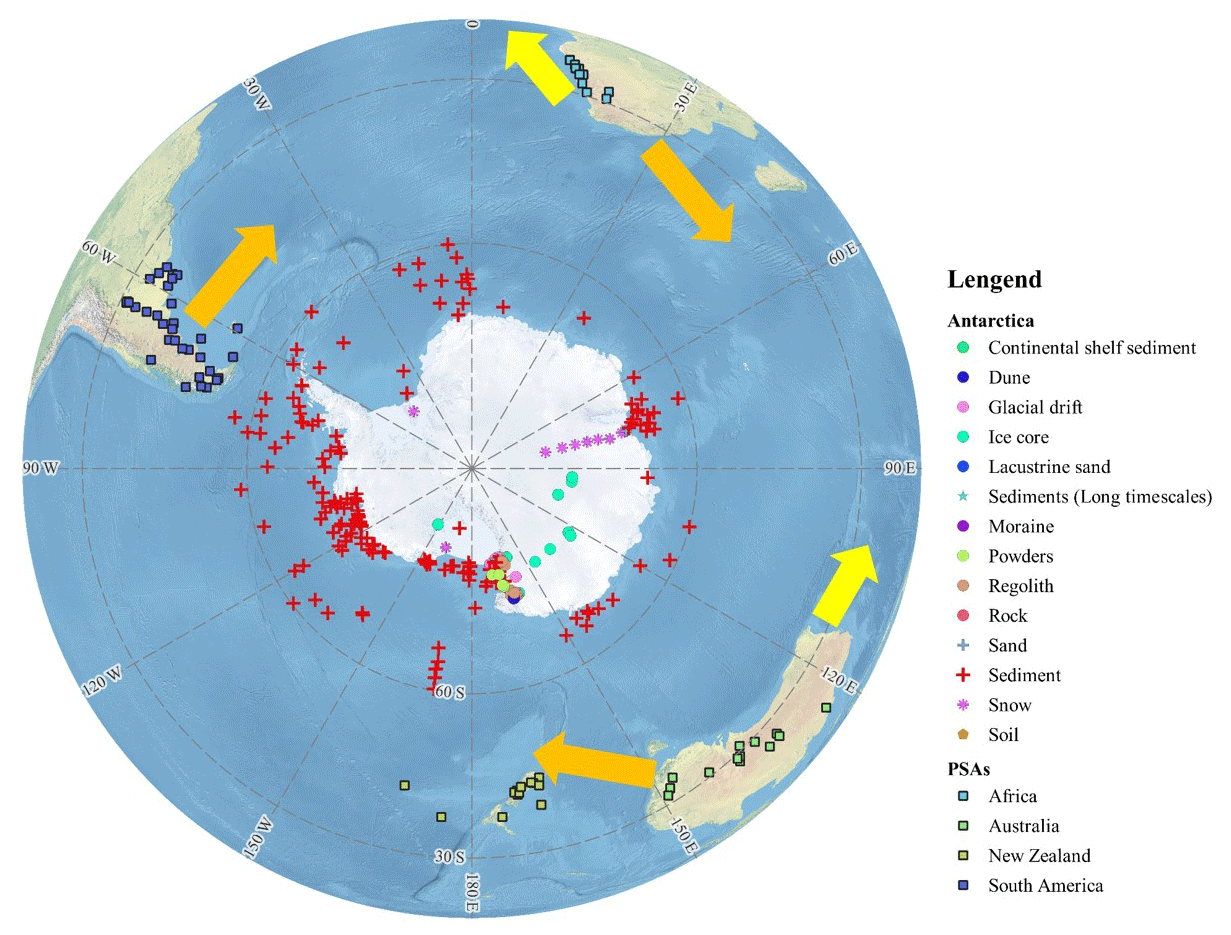
Figure 7The locations of the samples for Sr–Nd isotope ratios from Antarctica and PSAs in this database. The dust transport paths are marked with yellow arrows, based on previous studies (Gaiero et al., 2007; Shao et al., 2011; Gili et al., 2022). (This figure was created with ArcGIS.)
3.4.1 Sr–Nd data from sediment from Antarctica
The Sr–Nd data from the marine sediment (near-core-top samples) from the circum-Antarctica region and terrigenous materials (eolian dust, glacial drift, and dust in ice core) from the AIS are presented in Fig. 8. The ages of these samples were limited to the Holocene. We compared these data with PSA samples from the SH. At some sites, with >2 samples, we plot the average Sr–Nd values on the map. For example, the values range from 0.705281 to 0.725643 in the Pacific sector (146.78∘ E–67.27∘ W), 0.710616 to 0.738862 in the Indian Ocean sector (20.00–146.78∘ E), and 0.715989 to 0.741609 in the Atlantic sector (67.27∘ W–20.00∘ E) (Hemming et al., 2007). In Fig. 8, the Sr and Nd isotopic contours were determined by inverse distance-weighted interpolation, and the number of data points were >2 at some sites. At such sites, the average of the surface samples was obtained. The patterns of the two isotopic compositions are consistent across the AIS. Although the values differ between sediments from the circum-Antarctic region and sand from PSAs (Australia, SSA, and SA), the and εNd(0) patterns from the Pacific sector and the Indian Ocean sector are relatively consistent with those from SSA and SA, which can be partly explained by the contribution of eolian dust to the entire SO. It seems that the Sr–Nd values found in the Ross Sea and Amundsen Sea are anomalous, which may be attributed to the much greater number of samples collected in the two regions.
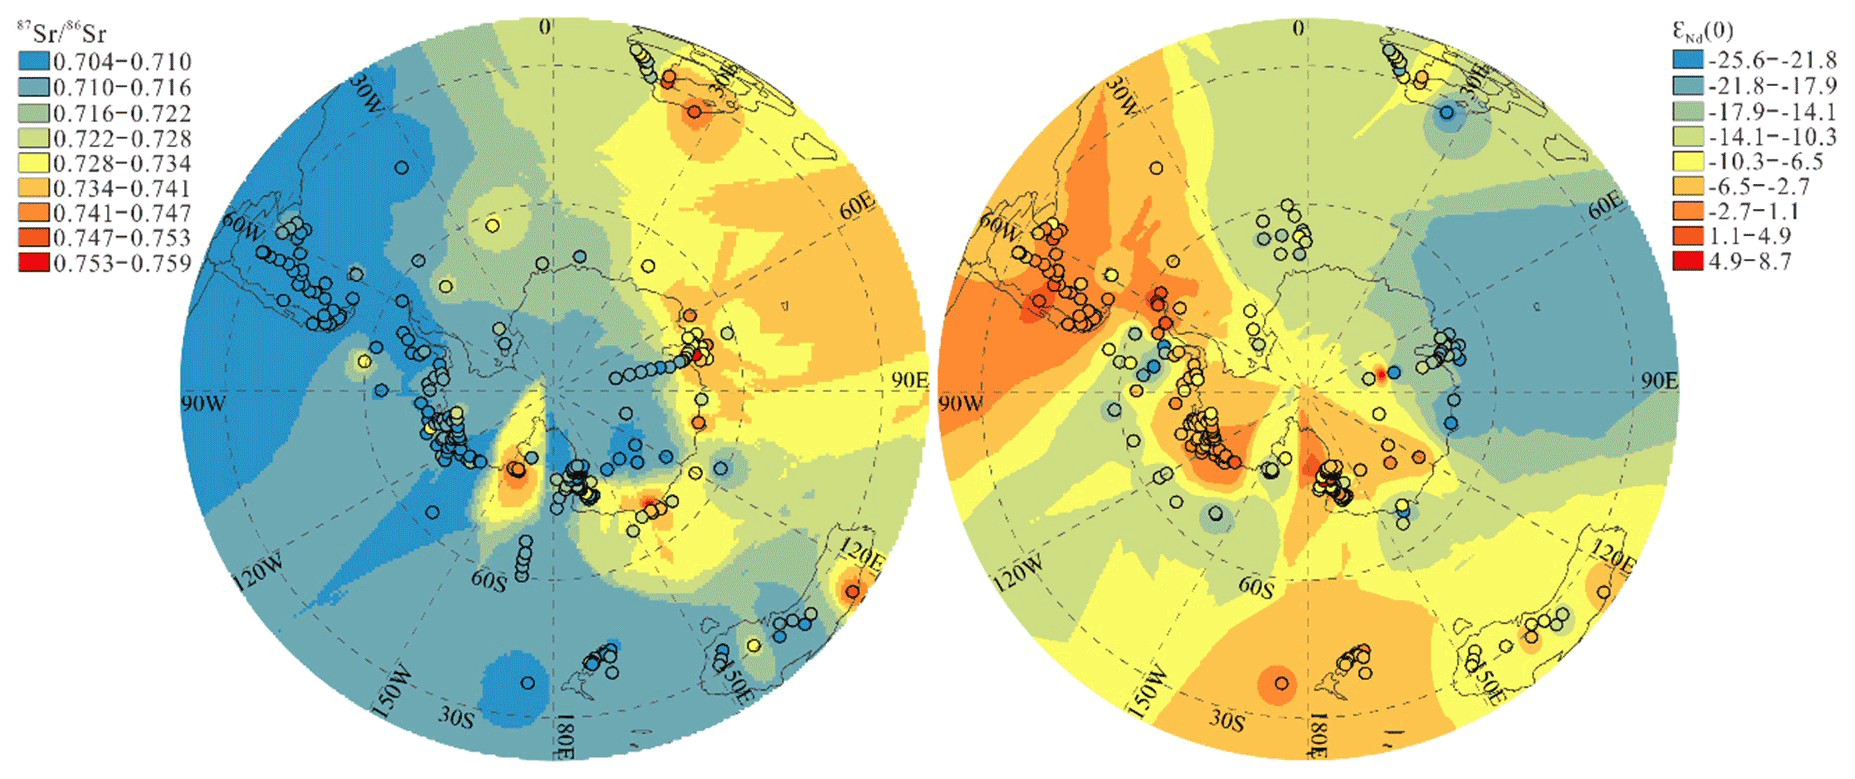
Figure 8Sr and Nd isotopic compositions of Holocene samples (black circles) from the AIS and ice-free areas on its periphery as well as eolian dust samples (surface samples with no accurate ages) from PSAs in Australia, southern Africa, and South America. The colors were determined by inverse distance-weighted interpolation using ArcGIS.
3.4.2 Sr–Nd data on the periphery and interior of the Antarctic ice sheet
New Sr–Nd data from coastal and low-elevation sites were measured in ice-free areas near the Filchner–Ronne Ice Shelf, Ross Ice Shelf, and Amery Ice Shelf (Fig. 7). The Sr–Nd isotope compositions of four sand samples from southern King George Island (South Shetland Islands) in West Antarctica were characterized by less-radiogenic values ranging from ∼ 0.703907 to ∼ 0.704157 and relatively high εNd(0) values ranging from 4.6 to 6.4. The ratios ranged from 0.71135 to 0.72377, and the εNd(0) composition ranged from −13.3 to −9.6 in ice-free areas of Inexpressible Island in the Ross Sea, West Antarctica. Based on our own Sr–Nd data and the literature (Table 3), we observe the highest εNd(0) value of >−5.0 in McMurdo and King George Island. There are large variations in values and moderate εNd(0) values in Victoria Land and the Ross Sea (including Inexpressible Island). The Amery Ice Shelf features high ratios as well as the lowest εNd(0) values of <−15. These subregions are very close to the εNd(0) data from the different sectors of circumpolar sediments (Roy et al., 2007). Therefore, the dataset will be useful for tracing the dust sources and sinks in the SO and AIS.
However, because the Sr–Nd data differ significantly among some of the regions and are similar among others, care must be taken when directly comparing these data to precisely explain the observed isotopic compositions in ice core records. For example, there is overlap in the Sr and Nd isotopic compositions of King George Island, SSA (Patagonia), and the McMurdo dry valleys. The Sr–Nd data from Inexpressible Island also overlap with the other end-members (SA, New South Wales, and Prydz Bay). Therefore, dust from low-latitude regions (New South Wales and SA) cannot be excluded from East Antarctica (Du et al., 2018; Gili et al., 2022). Another example is the characteristics of snow layers of the Berkner Island ice sheet in western Antarctica. These data can be partly explained by the surface sediment samples from the Weddell Sea sector, with εNd(0) values ranging from −10 to −8 (Hemming et al., 2007). Therefore, the dataset from the SH and AIS demonstrates that multiple mixed sources can be inferred from Antarctic surface snow samples. However, among the data from the entire AIS, the Sr–Nd isotopic components were measured in only 29 snow samples, and there is an urgent need to collect more data in the future.
Information on Sr–Nd data in Antarctic ice cores during the Holocene and glacial–interglacial times is presented by integrating the literature (Du, 2022). To obtain enough dust particles, samples with different age intervals were merged. For example, each sample represents approximately 40–160 years for the Vostok ice core, which may cover about a few thousand years to obtain a single large-volume sample (Delmonte et al., 2008). Alternatively, several ice core sections from different depths were integrated to obtain a few large samples for the Sr and Nd isotope analyses of the Talos Dome ice core (Delmonte et al., 2010b). A relatively high resolution (spanning between ∼ 3 and ∼ 30 years) was used in the Taylor Dome ice core (Aarons et al., 2016). Sr–Nd data in the Antarctica deep ice core mainly focus on the coastal and inland areas of the EAIS. As previously mentioned, the dust source is similar to that of the modern samples in the Dome C and Vostok ice cores during the Holocene and interglacial periods, which can be explained by an SSA provenance; an additional hypothesis explains the isotopic signature of Holocene dust in central East Antarctica (Delmonte et al., 2008, 2019). Sr–Nd data from the Talos Dome, Taylor Dome, and Taylor Glacier ice cores during the Holocene point towards a local dust provenance (Delmonte et al., 2019; Aarons et al., 2016, 2017). Therefore, the Sr and Nd data from East Antarctica ice cores during the Holocene and interglacial periods indicate a well-mixed atmospheric background involving a mixture of two or more sources in the SH (Fig. 8). The study demonstrated that SA emerges as the second most important dust source for East Antarctica during interglacial periods (Gili et al., 2022).
However, samples from glacial stages (stage 4 at ∼ 60 ka and stage 6 at ∼ 160 ka) in the Vostok ice core span a very narrow range of Sr compositions () and Nd compositions (1.1<εNd(0)<5.0), which can also be explained by the Sr–Nd data in sand samples from southern King George Island ( values ranging from ∼ 0.703907 to ∼ 0.704157 and εNd(0) values ranging from 4.6 to 6.4). The and εNd(0) isotopic compositions of dust in the Taylor Glacier ice core samples during the last glacial period indicated that dust may have originated from SSA and from potential local source areas in the Ross Sea sector (Delmonte et al., 2010b; Aarons et al., 2016, 2017). Therefore, these data suggest that the glacial-period dust in East Antarctic ice cores also features local contributions. However, almost no Sr–Nd data were obtained from West Antarctic deep ice cores, which limits our understanding of the spatiotemporal characteristics of dust transport across the entire AIS. More importantly, the ages of the Sr–Nd data from surface eolian dust from the AIS and PSAs in the SH are unknown, which hinders accurate dust source or sink tracing.
All datasets and the associated metadata table presented in this study are available from the Big Earth Data Platform for Three Poles. The dataset can be downloaded from https://doi.org/10.11888/Cryos.tpdc.272100 (Du, 2022). In this repository, all datasets are provided in Excel spreadsheet format along with metadata files.
An integrated Sr–Nd dataset for the remote three poles is presented, and these data were not easily collected because of the extremely cold and high-elevation environments. The dataset is complicated and includes snow, sand, soil, loess, deposits, sediment, and other sample types. We present case studies of snow, ice cores, and sediment samples to demonstrate the Sr–Nd characteristics of the third pole glaciers and Arctic and Antarctic ice sheets. These integrated data can provide a new perspective on present and paleodust sources and sinks at the three poles and, more importantly, clearly emphasize the following points for potential users of the datasets provided with this paper:
-
This Sr–Nd dataset enables us to map sampling locations in the remote three poles, while the use of sorting criteria related to the sampling location, type, or resolution permits us to trace the dust sources or sinks based on isotopic signatures.
-
For the third pole, the Sr–Nd isotopic data were divided into subregions, and the integration of these data from sand/soil and snow samples in six subregions allowed us to clearly understand the Sr–Nd data characteristics of the third pole. These data will be useful for users seeking to trace the local or long-distance-transported dust from the source to the sink.
-
The Sr–Nd characteristics in snow/ice and sediment samples show that there are significant differences among the different subregions in the Arctic, which will be useful for tracing dust sources and sinks
-
The new data from Arctic and Antarctic samples emphasize that the ice-free regions on the periphery of the ice sheets may be important local dust sources. However, there is Sr–Nd data overlap in the low-latitude regions in Antarctica, and the paucity of data in Antarctica is severe; thus, future studies should concentrate on this aspect.
CX, ZD, and AS designed the study. ZD, JY, CX, and AS wrote the manuscript. ZD, LW, NW, SW, and YL collected the samples in the field and produced the data. ZD, NW, LW, SW, YL, ZZ, JX, and XM performed the analysis. All authors contributed to the final form of the paper.
The contact author has declared that none of the authors has any competing interests.
Publisher's note: Copernicus Publications remains neutral with regard to jurisdictional claims in published maps and institutional affiliations.
This article is part of the special issue “Extreme environment datasets for the three poles”. It is not associated with a conference.
We thank everyone involved in the snow sample collection from the central Arctic Ocean, within the framework of the RV Polarstern expedition, for their great logistical support during MOSAiC in 2019–2020. We also thank the Chinese Arctic and Antarctic Administration for their contribution to MOSAiC.
This research has been supported by the Strategic Priority Research Program of the Chinese Academy of Sciences (grant no. XAD19070103), the National Natural Science Foundation of China (grant nos. 42071086 and 41971088), the State Key Laboratory of Cryospheric Science (grant no. SKLCS-ZZ-2022), and the Youth Innovation Promotion Association of the Chinese Academy of Sciences (grant no. 2020419).
This paper was edited by Xin Li and reviewed by Cecile Blanchet and two anonymous referees.
Aarons, S., Aciego, S., Gabrielli, P., Delmonte, B., Koornneef, J., Wegner, A., and Blakowski, M.: The impact of glacier retreat from the Ross Sea on local climate: Characterization of mineral dust in the Taylor Dome ice core, East Antarctica, Earth Planet. Sc. Lett, 444, 34–44, https://doi.org/10.1016/j.epsl.2016.03.035, 2016.
Aarons, S. M., Aciego, S. M., Arendt, C. A., Blakowski, M. A., Steigmeyer, A., Gabrielli, P., SierraHernández, M. R., Beaudon, E., Delmonte, B., Baccolo, G., May, N. W., and Pratt, K. A.: Dust composition changes from Taylor Glacier (East Antarctica) during the last glacial-interglacial transition: A multi-proxy approach, Quaternary Sci. Rev, 162, 60–71, https://doi.org/10.1016/j.quascirev.2017.03.011, 2017.
Abbott, A. N., Löhr, S. C., Payne, A., Kumar, H., and Du, J.: Widespread lithogenic control of marine authigenic neodymium isotope records? Implications for paleoceanographic reconstructions, Geochim. Cosmochim. Ac., 319, 318–336, https://doi.org/10.1016/j.gca.2021.11.021, 2022.
Asahara, Y., Takeuchi, F., Nagashima, K., Harada, N., Yamamoto, K., Oguri, K., and Tadai, O.: Provenance of terrigenous detritus of the surface sediments in the Bering and Chukchi Seas as derived from Sr and Nd isotopes: implications for recent climate change in the Arctic regions, Deep-Sea Res. Pt. II, 61–64, 155–171, https://doi.org/10.1016/j.dsr2.2011.12.004, 2012.
Bayon, G., Freslon, N., Germain, Y., Bindeman, I. N., Trinquier, A., and Barrat, J. A.: A global survey of radiogenic strontium isotopes in river sediments, Chem. Geol., 559, 119958, https://doi.org/10.1016/j.epsl.2022.117490, 2021.
Bazhenova, E., Fagel, N., and Stein, R.: North American origin of “pink–white” layers at the Mendeleev Ridge (Arctic Ocean): New insights from lead and neodymium isotope composition of detrital sediment component, Marine Geol., 386, 44–55, 2017.
Biscaye, P. E., Grousset, F. E., Revel, M., Van der Gaast, S., Zielinski, G. A., Vaars, A., and Kukla, G.: Asian provenance of glacial dust (stage 2) in the Greenland Ice Sheet Project 2 ice core, Summit, Greenland, J. Geophys. Res.-Oceans, 102, 26765–26781, https://doi.org/10.1029/97JC01249, 1997.
Blakowski, M. A., Aciego, S. M., Delmonte, B., Baroni, C., Salvatore, M. C., and Sims, K. W. W.: A Sr–Nd–Hf isotope characterization of dust source areas in Victoria Land and the McMurdo Sound sector of Antarctica, Quaternary Sci. Rev., 141, 26–37, https://doi.org/10.1016/j.quascirev.2016.03.023, 2016.
Blanchet, C. L.: A database of marine and terrestrial radiogenic Nd and Sr isotopes for tracing earth-surface processes, Earth Syst. Sci. Data, 11, 741–759, https://doi.org/10.5194/essd-11-741-2019, 2019.
Bory, A. J.-M., Biscaye, P. E., Svensson, A., and Grousset, F. E.: Seasonal variability in the origin of recent atmospheric mineral dust at NorthGRIP, Greenland, Earth Planet. Sc. Lett., 196, 123–134, https://doi.org/10.1016/S0012-821X(01)00609-4, 2002.
Bory, A. J.-M., Biscaye, P. E., Piotrowski, A. M., and Steffensen, J. P.: Regional variability of ice core dust composition and provenance in Greenland, Geochem. Geophy. Geosy, 4, 1107, https://doi.org/10.1029/2003GC000627, 2003a.
Bory, A. J.-M., Biscaye, P. E., and Grousset, F. E.: Two distinct seasonal Asian source regions for mineral dust deposited in Greenland (NorthGRIP), Earth Sci. Rev, 30, 1167, https://doi.org/10.1029/2002GL016446, 2003b.
Bory, A., Wolff, E., Mulvaney, R., Jagoutz, E., Wegner, A., Ruth, U., and Elderfield, H.: Multiple sources supply eolian mineral dust to the atlantic sector of coastal antarctica: evidence from recent snow layers at the top of Berkner island ice sheet, Earth Planet. Sc. Lett., 291, 138–148, https://https://doi.org/10.1016/j.epsl.2010.01.006, 2010.
Chen, J., Li, G., Yang, J., Rao, W., Lu, H., Balsam, W., Sun, Y., and Ji, J.: Nd and Sr isotopic characteristics of Chinese deserts: implications for the provenances of Asian dust, Geochim. Cosmochim. Ac., 71, 3904–3914, https://doi.org/10.1016/j.gca.2007.04.033, 2007.
Delmonte, B.: Quaternary variations and origin of continental dust in East Antarctica, PhD Thesis, Università degli Studi di Siena/Université Joseph Fourier – Grenoble 1, 2003.
Delmonte, B., Andersson, P. S., Hansson, M., Schoberg, H., Petit, J. R., Basile-Doelsch, I., and Maggi, V.: Aeolian dust in East Antarctica (EPICA-Dome C and Vostok): provenance during glacial ages over the last 800 kyr, Geophys. Res. Lett., 35, L07703, https://doi.org/10.1029/2008GL033382, 2008.
Delmonte, B., Andersson, P. S., Schoberg, H., Hansson, M., Petit, J. R., Delmas, R., Gaiero, D. M., Maggi, V., and Frezzotti, M.: Geographic provenance of Aeolian dust in East Antarctica during Pleistocene glaciations: preliminary results from Talos Dome and comparison with East Antarctic and new Andean ice core data, Quaternary Sci. Rev., 29, 256–264, https://doi.org/10.1016/j.quascirev.2009.05.010, 2010a.
Delmonte, B., Baroni, C., Andersson, P. S., Schöberg, H., Hansson, M., Aciego, S., Petit, J.-R., Albani, S., Mazzola, C., Maggi, V., and Frezzotti, M.: Aeolian dust in the Talos Dome ice core (East Antarctica, Pacific/Ross Sea sector): Victoria Land versus remote sources over the last two climate cycles, J. Quat. Sci., 25, 1327–1337, https://doi.org/10.1002/jqs.1418, 2010b.
Delmonte, B., Baroni, C., Andersson, P. S., Narcisi, B., Salvatore, M. C., Petit, J. R., Scarchilli, C., Frezzotti, M., Albani, S., and Maggi, V.: Modern and Holocene aeolian dust variability from Talos Dome (Northern Victoria Land) to the interior of the Antarctic ice sheet, Quaternary Sci. Rev., 64, 76–89, https://doi.org/10.1016/j.quascirev.2012.11.033, 2013.
Delmonte, B., Winton, H., Baroni, M., Baccolo, G., Hansson, M., Andersson, P., Baroni, C., Salvatore, M., Lanci, L., and Maggi, V.: Holocene dust in East Antarctica: provenance and variability in time and space, Holocene, 30, 546–558, https://doi.org/10.1177/0959683619875188, 2019.
Dong, Z., Shao, Y., Qin, D., Kang, S., Wei, W., Wang, X., and Wang, S.: Hf-Nd-Sr isotopic composition as fingerprint for long-range transported eolian dust deposition in glacier snowpack of eastern Tibetan Plateau, J. Geophys. Res, 123, 7013–7023, https://doi.org/10.1029/2018JD028581, 2018.
Du, Z.: A database of radiogenic Sr–Nd isotopes at the “three poles”, National Tibetan Plateau Data Center [data set], https://doi.org/10.11888/Cryos.tpdc.272100, 2022.
Du, Z., Xiao, C., Liu, Y., and Wu, G.: Geochemical characteristics of insoluble dust as a tracer in an ice core from Miaoergou Glacier, east Tien Shan, Glob. Planet. Change, 127, 12–21, https://doi.org/10.1016/j.gloplacha.2015.01.011, 2015.
Du, Z., Xiao, C., Ding, M., and Li, C.: Identification of multiple natural and anthropogenic sources of dust in snow from Zhongshan Station to Dome A, East Antarctica, J. Glaciol., 64, 855–865, https://doi.org/10.1017/jog.2018.72, 2018.
Du, Z., Xiao, C., Wang, Y., Liu, S., and Li, S.: Dust provenance in Pan-third pole modern glacierized regions: What is the regional source?, Environ. Pollut., 250, 762–772, https://doi.org/10.1016/j.envpol.2019.04.068, 2019a.
Du, Z., Xiao, C., Dou, T., Li, S., An, H., Liu, S., and Liu K.: Comparison of Sr–Nd–Pb isotopes in insoluble dust between northwestern China and high-latitude regions in the Northern Hemisphere, Atmos. Environ., 214, 116837, https://doi.org/10.1016/j.atmosenv.2019.116837, 2019b.
Eisenhauer, A., Meyer, H., Rachold, V., Tütken, T., Wiegand, B., Hansen, B. T., Spielhagen, R. F., Lindemann, F., and Kassens, H.: Grain size separation and sediment mixing in Arctic Ocean sediments: evidence from the strontium isotope systematic, Chem. Geol., 158, 173–188, https://doi.org/10.1016/S0009-2541(99)00026-1, 1999.
Gaiero, D. M., Brunet, F., Probst, J. L., and Depetris, P. J.: A uniform isotopic and chemical signature of dust exported from Patagonia: rock sources and occurrence in southern environments, Chem. Geol., 238, 107–120, https://doi.org/10.1016/j.chemgeo.2006.11.003, 2007.
Gili, S., Vanderstraeten, A., Chaput, A., King, J., Gaiero, D., Delmonte, B., Vallelonga, P., Formenti, P., Di Biagio, C., Cazanau, M., Pangui, E., Doussin J., and Mattielli, N.: South African dust contribution to the high southern latitudes and East Antarctica during interglacial stages, Communications Earth & Environment, 3, 129, https://doi.org/10.1038/s43247-022-00464-z, 2022.
Grousset, F. E., Biscaye, P. E., Revel, M., Petit, J., Pye, K., Joussaume, S., and Jouzel, J.: Antarctic (Dome C) ice-core dust at 18 k.y. B.P.: isotopic constraints on origins, Earth Planet. Sc. Lett., 111, 175–182, https://doi.org/10.1016/0012-821X(92)90177-W, 1992.
Han, C., Hur, S. D., Han, Y., Lee, K., Hong, S., Erhardt, T., Fischer, H., Svensson, A., Steffensen, J. P., and Vallelonga, P.: High-resolution isotopic evidence for a potential Saharan provenance of Greenland glacial dust, Sci. Rep., 8, 15582, https://doi.org/10.1038/s41598-018-33859-0, 2018.
Hemming, S. R., van de Flierdt, T., Goldstein, S. L., Franzese, A. M., Roy, M., Gastineau, G., and Landrot, G.: Strontium isotope tracing of terrigenous sediment dispersal in the Antarctic Circumpolar Current: implications for constraining frontal positions, Geochem. Geophys. Geosy., 8, Q06N13, https://https://doi.org/10.1029/2006GC001441, 2007.
Jacobsen, S. B. and Wasserburg, G. J.: Sm-Nd evolution of chondrites, Earth Planet. Sc. Lett., 50, 139–155, 1980.
Jonell, T. N., Li, Y., Blusztajn, J., Giosan, L., and Clift, P. D.: Signal or noise? Isolating grain size effects on Nd and Sr isotope variability in Indus delta sediment provenance, Chem. Geol., 485, 56e73, https://doi.org/10.1016/j.chemgeo.2018.03.036, 2018.
Lambert, F., Kug, J. S., Park, R. J., Mahowald, N., Winckler, G., Abe-Ouchi, A., and Lee, J. H.: The role of mineral-dust aerosols in polar temperature amplification, Nat. Clim. Change, 3, 487–491, https://doi.org/10.1038/nclimate1785, 2013.
Li, X., Che, T., Li, X., Wang, L., Duan, A., Shangguan, D., Pan, X., Fang, M., and Bao, Q.: CASEarth Poles: Big data for the Three Poles, B. Am. Meteorol. Soc., 101, E1475–E1491, 2020.
Lin, Y. C. and Feng, J. L.: Aeolian dust contribution to the formation of alpine soils at Amdo (Northern Tibetan Plateau), Geoderma, 259, 104e115, https://doi.org/10.1016/j.geoderma.2015.05.012, 2015.
Lupker, M., Aciego, S. M., Bourdon, B., Schwander, J., and Stocker, T. F.: Isotopictracing (Sr, Nd, U and Hf) of continental and marine aerosols in an 18th century section of the Dye-3 ice core (Greenland), Earth Planet. Sc. Lett., 295, 277–286, https://doi.org/10.1016/j.epsl.2010.04.010, 2010.
Maccali, J., Hillaire-Marcel, C., and Not, C.: Radiogenic isotope (Nd, Pb, Sr) signatures of surface and sea ice-transported sediments from the Arctic Ocean under the present interglacial conditions, Polar Res., 37, 1442982, https://doi.org/10.1080/17518369.2018.1442982, 2018.
Meinhardt, A. K., Pahnke, K., Böning, P., Schnetger, B., and Brumsack, H. J.: Climate change and response in bottom water circulation and sediment provenance in the central Arctic Ocean since the last glacial, Chem. Geol., 427, 98–108, https://doi.org/10.1016/j.chemgeo.2016.02.019, 2016.
Nagatsuka, N., Takeuchi, N., Nakano, T., Kokado, E., and Li, Z.: Sr, Nd, and Pb stable isotopes of surface dust on Urumqi glacier No.1 in western China, Ann. Glaciol., 51, 95–105, https://doi.org/10.3189/172756411795931895, 2010.
Nagatsuka, N., Takeuchi, N., Uetake, J., Shimada, R., Onuma, Y., Tanaka, S., and Nakano, T.: Variations in Sr and Nd isotopic ratios of mineral particles in cryoconite in Western Greenland, Front. Earth Sci., 4, 00093, https://doi.org/10.3389/feart.2016.00093, 2016.
Rao, W. B., Yang, J. D., Chen, J., and Li, G. L.: Sr–Nd isotope geochemistry of eolian dust of the arid-semiarid areas in China: implications for loess provenance and monsoon evolution, Chin. Sci. Bull., 51, 1401–1412, https://doi.org/10.1007/s11434-006-2008-1, 2006.
Revel, M., Sinko, J. A., Grousset, F. E., and Biscaye, P. E.: Sr and Nd isotopes as tracers of North Atlantic lithic particles: Paleoclimatic implications, Paleoceanography, 11, 95–113, https://doi.org/10.1029/95PA03199, 1996.
Revel-Rolland, M., De Deckker, P., Delmonte, B., Hesse, P. P., Magee, J. W., Basile-Doelsch, I., Grousset, F., and Bosch, D.: Eastern Australia: A possible source of dust in East Antarctica interglacial ice, Earth Planet. Sc. Lett., 249, 1–13, https://doi.org/10.1016/j.epsl.2006.06.028, 2006.
Robinson, S., Ivanovic, R., van de Flierdt, T., Blanchet, L., Tachikawa, K., Martin, E. E., Falco, C. P. C., Williams, T., Gregoire, L., Plancherel, Y., Jeandel, C., and Arsouze, T.: Global continental and marine detrital εNd: an updated compilation for use in understanding marine Nd cycling, Chem. Geol., 567, 120119, https://doi.org/10.1016/j.chemgeo.2021.120119, 2021.
Roy, M., van de Flierdt, T., Hemming, S. R., and Goldstein, S. L.: ages of hornblende grains and bulk isotopes of circum-Antarctic glacio-marine sediments: Implications for sediment provenance in the southern ocean, Chem. Geol., 244, 507–519, https://doi.org/10.1016/j.chemgeo.2007.07.017, 2007.
Shao, Y., Wyrwoll, K. H., Chappell, A., Huang, J., Lin, Z., McTainsh, G. H., and Yoon, S.: Dust cycle: an emerging core theme in Earth system science, Aeolian Res., 2, 181–204, https://doi.org/10.1016/j.aeolia.2011.02.001, 2011.
Simonsen, M. F., Baccolo, G., Blunier, T., Borunda, A., Delmonte, B., Frei, R., Goldstein, S., Grinsted, A., Kjær, A. A., Sowers, T., Svensson, A., Vinther, B., Vladimirova, D., Winckler, G., Winstrup, M., and Vallelonga, P.: East Greenland ice core dust record reveals timing of Greenland ice sheet advance and retreat, Nat. Commun., 10, 4494, https://doi.org/10.1038/s41467-019-12546-2, 2019.
Skiles, S. M., Flanner, M., Cook, J. M. Dumont, M., and Painter, T. H.: Radiative forcing by light-absorbing particles in snow, Nat. Clim. Change, 8, 964–971, https://doi.org/10.1038/s41558-018-0296-5, 2018.
Struve, T., Pahnke, K., Lamy, F., Wengler, M., Böning, P., and Winckler, G.: A circumpolar dust conveyor in the glacial Southern Ocean, Nat. Commun., 11, 5655, https://doi.org/10.1038/s41467-020-18858-y, 2020.
Svensson, A., Biscaye, P. E., and Grousset, F. E.: Characterization of late glacial continental dust in the Greenland Ice Core Project ice core, J. Geophys. Res.-Atmos., 105, 4637–4656, https://doi.org/10.1029/1999JD901093, 2000.
Tütken, T., Eisenhauer, A., Wiegand, B., and Hansen, B. T.: Glacial–interglacial cycles in Sr and Nd isotopic composition of Arctic marine sediments triggered by Svalbard/Barents Sea ice sheet, Mar. Geol., 182, 351–372, https://doi.org/10.1016/S0025-3227(01)00248-1, 2002.
Újvári, G., Stevens, T., Svensson, A., Klötzli, U. S., Manning, C., Németh, T., Kovács, J., Sweeney, M. R., Gocke, M., Wiesenberg, G. L. B., Markovic, S. B., and Zech, M.: Two possible source regions for central Greenland last glacial dust, Geophys. Res. Lett., 42, 10399–10408, https://doi.org/10.1002/2015GL066153, 2015.
Walter, H. J., Hegner, E., Diekmann, B., Kuhn, G., and van der Loeff, M. M. R.: Provenance and transport of terrigenous sediment in the South Atlantic Ocean and their relations to glacial and interglacial cycles: Nd and Sr isotopic evidence, Geochim. Cosmochim. Ac., 64, 3813–3827, https://doi.org/10.1016/S0016-7037(00)00476-2, 2000.
Wei, T., Dong, Z., Kang, S., Qin, X., and Guo, Z.: Geochemical evidence for sources of surface dust deposited on the Laohugou glacier, Qilian Mountains, Appl. Geochem., 79, 1–8, https://doi.org/10.1016/j.apgeochem.2017.01.024, 2017.
Wei, T., Dong, Z., Kang, S., Rostami, M., Ulbrich, S., and Shao, Y.: Hf-Nd-Sr isotopic fingerprinting for aeolian dust deposited on glaciers in the northeastern Tibetan Plateau region, Glob. Planet. Change, 177, 69–80, https://doi.org/10.1016/j.gloplacha.2019.03.015, 2019.
Wei, T., Brahney, J., Dong, Z., Kang, S., Zong, C., Guo, J., Yang, Lin., and Qin, X.: Hf-Nd-Sr Isotopic Composition of the Tibetan Plateau Dust as a Fingerprint for Regional to Hemispherical Transport, Environ. Sci. Technol., 55, https://doi.org/10.1021/acs.est.0c04929, 2021.
Wu, G., Zhang, C., Zhang, X., Tian, L., and Yao, T.: Sr and Nd isotopic composition of dust in Dunde ice core, Northern China: implications for source tracing and use as an analogue of long-range transported Asian dust, Earth Planet. Sc. Lett., 299, 409–416, https://doi.org/10.1016/j.epsl.2010.09.021, 2010.
Xie, Y., Liu, L., Kang, C., and Chi, Y.: Sr-Nd isotopic characteristics of the Northeast Sandy Land, China and their implications for tracing sources of regional dust, Catena, 184, 104303, https://doi.org/10.1016/j.catena.2019.104303, 2020.
Xu, J., Yu, G., Kang, S., Hou, S., Zhang, Q., Ren, J., and Qin, D.: Sr-Nd isotope evidence for modern aeolian dust sources in mountain glaciers of western China, J. Glaciol., 58, 859–865, https://doi.org/10.3189/2012JoG12J006, 2012.
Winton, V. H. L., Edwards, R., Delmonte, B., Ellis, A., Andersson, P. S., Bowie, A., Bertler, N. A. N., Neff, P., and Tuohy, A.: Multiple sources of soluble atmospheric iron to Antarctic waters, Global Biogeochem. Cy., 30, 421–437, https://doi.org/10.1002/2015GB005265, 2016.