the Creative Commons Attribution 4.0 License.
the Creative Commons Attribution 4.0 License.
 | 30 Nov 2022
Full-coverage 250 m monthly aerosol optical depth dataset (2000–2019) amended with environmental covariates by an ensemble machine learning model over arid and semi-arid areas, NW China
Xiangyue Chen
Hongchao Zuo
Zipeng Zhang
Xiaoyi Cao
Jikai Duan
Chuanmei Zhu
Zhe Zhang
Jingzhe Wang
Aerosols are complex compounds that greatly affect the global radiation balance and climate system and even human health; in addition, aerosols are currently a large source of uncertainty in the numerical simulation process. The arid and semi-arid areas have fragile ecosystems with abundant dust but lack related high-accuracy aerosol data. To solve these problems, we use the bagging trees ensemble model, based on 1 km aerosol optical depth (AOD) data and multiple environmental covariates, to produce a monthly advanced-performance, full-coverage, and high-resolution (250 m) AOD product (named FEC AOD, fusing environmental covariates AOD) covering the arid and semi-arid areas. Then, based on the FEC AOD products, we analyzed the spatiotemporal AOD pattern and further discussed the interpretation of environmental covariates to AOD. The results show that the bagging trees ensemble model has a good performance, with its verification R2 values always remaining at 0.90 and the R2 being 0.79 for FEC AOD compared with AERONET AOD product. The high-AOD areas are located in the Taklimakan Desert and on the Loess Plateau, and the low-AOD areas are concentrated in southern Qinghai province. The higher the AOD, the stronger the interannual variability. Interestingly, the AOD reflected a dramatic decrease on the Loess Plateau and an evident increase in the south-eastern Taklimakan Desert, while the southern Qinghai province AODs showed almost no significant change between 2000 and 2019. The annual variation characteristics show that the AOD was largest in spring (0.267±0.200) and smallest in autumn (0.147±0.089); the annual AOD variation pattern showed different features, with two peaks in March and August over Gansu province but only one peak in April in other provinces/autonomous regions. Farmlands and construction lands have high AOD levels compared to other land cover types. Meteorological factors demonstrate the maximum interpretation ability of the AODs on all set temporal scales, followed by the terrain factors, while surface properties have the smallest explanatory abilities; the corresponding average contributions are 77.1 %, 59.1 %, and 50.4 %, respectively. The capability of the environmental covariates to explain the AOD varies seasonally in the following sequence: winter (86.6 %) > autumn (80.8 %) > spring (79.9 %) > summer (72.5 %). In this research, we provide a pathbreaking high spatial resolution (250 m) and long time series (2000–2019) FEC AOD dataset covering arid and semi-arid regions to support atmospheric and related studies in northwest China; the full dataset is available at https://doi.org/10.5281/zenodo.5727119 (Chen et al., 2021b).
- Article
(12947 KB) - Full-text XML
-
Supplement
(3367 KB) - BibTeX
- EndNote


Aerosols are a type of complex substance dispersed in the atmosphere that can be from natural or anthropogenic sources (Kaufman et al., 2002). Aerosols can affect the global radiation balance and climate system directly, indirectly, or semi-indirectly by absorbing or scattering solar radiation (Myhre et al., 2013). Concurrently, aerosols seriously endanger human health by mixing, reacting, and dispersing dangerous compounds (Chen et al., 2020; Lelieveld et al., 2019). As one of the most significant optical characteristics of aerosols, the aerosol optical depth (AOD) is the integral of the aerosol extinction coefficient in the vertical direction and indicates the attenuation impact of aerosols on solar energy (Chen et al., 2021a). The AOD is frequently adopted to depict air pollution and indirectly calculate various atmospheric parameters, such as particulate matter 2.5/10; in addition, the AOD is extensively applied in atmospheric environment-related research (Goldberg et al., 2019; He et al., 2020).
Generally, the primary AOD acquisition method is in situ observations, which have high precision. However, in situ observations are restricted by the distribution of observation stations, so the resulting data lack spatial continuity, making it difficult to use these data to meet the objectives of growing regional atmospheric environmental studies (Zhang et al., 2019). Remote sensing (RS) is an effective tool for collecting AOD information over a wide range of spatial scales, significantly offsetting the deficiencies of in situ observations. RS can tackle difficulties connected to insufficient data and uneven geographical distributions to a certain extent (Chen et al., 2020). Nonetheless, RS is not always a silver bullet for acquiring AOD, as RS methods have some problems, such as low spatial resolutions and missing data in some situations (Li et al., 2020). The commonly utilized AOD satellite products derived from various sensors have different emphases in their uses (Table S1). However, the common point is that the spatial resolution of these data is coarse, and the products even contain large numbers of no-data values (Chen et al., 2022; Sun et al., 2021; Chen et al., 2021a; Wei et al., 2021). All these issues restrict the application of satellite AOD products on regional scales and especially on the local scale. Furthermore, the AOD spatial resolution scale often inevitably affects subsequent atmospheric pollutant predictions (Yang and Hu, 2018). These issues not only affect AOD analyses but also mislead numerous pertinent uses of AOD data.
Although methods for resolving AOD RS data deficiencies have been studied, previous research has not addressed this problem completely (Li et al., 2020; Zhao et al., 2019). Considerable related work has concentrated on multisource AOD dataset fusion or AOD gap-filling methods using different models. The initial and most extensively applied method is interpolation, but the AODs obtained in this way show high spatiotemporal variability; thus, this method is not suitable for application to anticipate missing AOD data (Singh et al., 2017). Another widely used method involves merging multiple AOD products; this method can improve the data quality but often fails to completely eliminate missing pixel values, even bringing about offsetting consequences (Bilal et al., 2017; Ali and Assiri, 2019; Wei et al., 2021). Some statistical models, such as linear regression and additive models, have also been employed to fill missing pixel values and improve the spatial resolutions of AOD products. However, the performances of these models are often dubious due to their simple structures (Xiao et al., 2017). Most current methods for obtaining high-resolution AOD forecasts are focused on individual model techniques and rely on a set of assumptions that are frequently not met, leading to inaccurate predictions (Li et al., 2017; Zhang et al., 2018). As computing technology advances, involving the training of multiple models by resampling the training data with the corresponding environmental covariates from their original distribution, ensemble machine learning methods provide new considerations and methods that are less constrained by the hypotheses of single models, with less overfitting and fewer outliers (Li et al., 2018). The strong data-mining ability of ensemble machine learning methods is also good for fitting multisource data, and these methods can achieve higher-precision results at the same time (Zhao et al., 2019). As a result, the present research attempts to adopt ensemble machine learning methods to explore the production of an advanced-performance, high-resolution, full-coverage AOD dataset covering arid and semi-arid areas.
Currently, many previous studies have focused on AOD research in various regions and on various scales, but these studies were concentrated on the eastern coastal areas and lacked related exploration in arid and semi-arid areas. Arid and semi-arid areas, as important components of the Earth's geographic units, have extremely fragile biosystems and are extremely sensitive to climate change and human activities (Huang et al., 2017). Due to the complex surface situation in arid and semi-arid areas, especially those with large desert areas, many AOD retrieval algorithms are not suitable for use in such regions. Although a minority of algorithms can acquire AODs in arid and semi-arid areas, such as the deep blue (DB) algorithm and multiangle implementation of atmospheric correction (MAIAC) algorithm, these algorithms are still limited by their coarse resolution, high uncertainty, or extensive missing-data phenomenon, so the resulting AOD products have difficulty meeting the needs of arid and semi-arid atmospheric environmental research (Wei et al., 2021). However, arid and semi-arid areas are crucial dust sources, with strong variability in the aspects of aerosol loading and optical characteristics. As typical dust sources and AOD data-scarce areas, the AOD variety in arid and semi-arid areas significantly influences global climate change and model simulations. Therefore, manufacturing an AOD dataset covering arid and semi-arid areas with increased quality is necessary for performing local and even global atmospheric environment research.
To better solve the issue associated with the lack of AOD data in arid and semi-arid areas, this research aims to acquire an advanced-performance, high-resolution, full-coverage AOD dataset that can serve as the foundation for future studies. To achieve this goal, the main work of this study includes the following steps: (1) based on the MAIAC AOD product combined with multiple environmental covariates and utilizing a machine learning method, the FEC AODs (fusing environmental covariates AODs) are obtained for the 2000–2019 period; (2) Aerosol Robotic Network (AERONET) ground observation data and the MCD19A2 and MxD04L2 AOD satellite products are collected to verify the applicability of the FEC AOD product; (3) the FEC AOD spatiotemporal patterns are analyzed; and (4) the dominant environmental covariates of the FEC AOD dataset are explored.
2.1 Study area
Figure 1 shows the arid and semi-arid areas in northwest China (73∘25′–110∘55′ E, 31∘35′–49∘15′ N), a typical arid and semi-arid region on the globe, in terms of their spatial locations, surface covers, and environmental problems (Ge et al., 2016). As dust sources and fragile-ecosystem areas, the regional climate differences in this region are significant, with perennial drought and low-precipitation (<400 mm) conditions (Ding and Xingming, 2021). Furthermore, the area is extremely sensitive to climate change and human activities and has a large AOD variability, which makes global climate simulations and radiation balance quantifications difficult. With the development of society and technology, the forces by which people change nature are increasing. Increasingly unreasonable human activities (such as deforestation and soil salinization) and poor land management policies (such as reclamation and water resource utilization) bring about regional vegetation degradation, desertification, rapid glacier melting, and frequent dust weather, which eventually lead to rapid deterioration of the ecological environments in all arid and semi-arid areas.
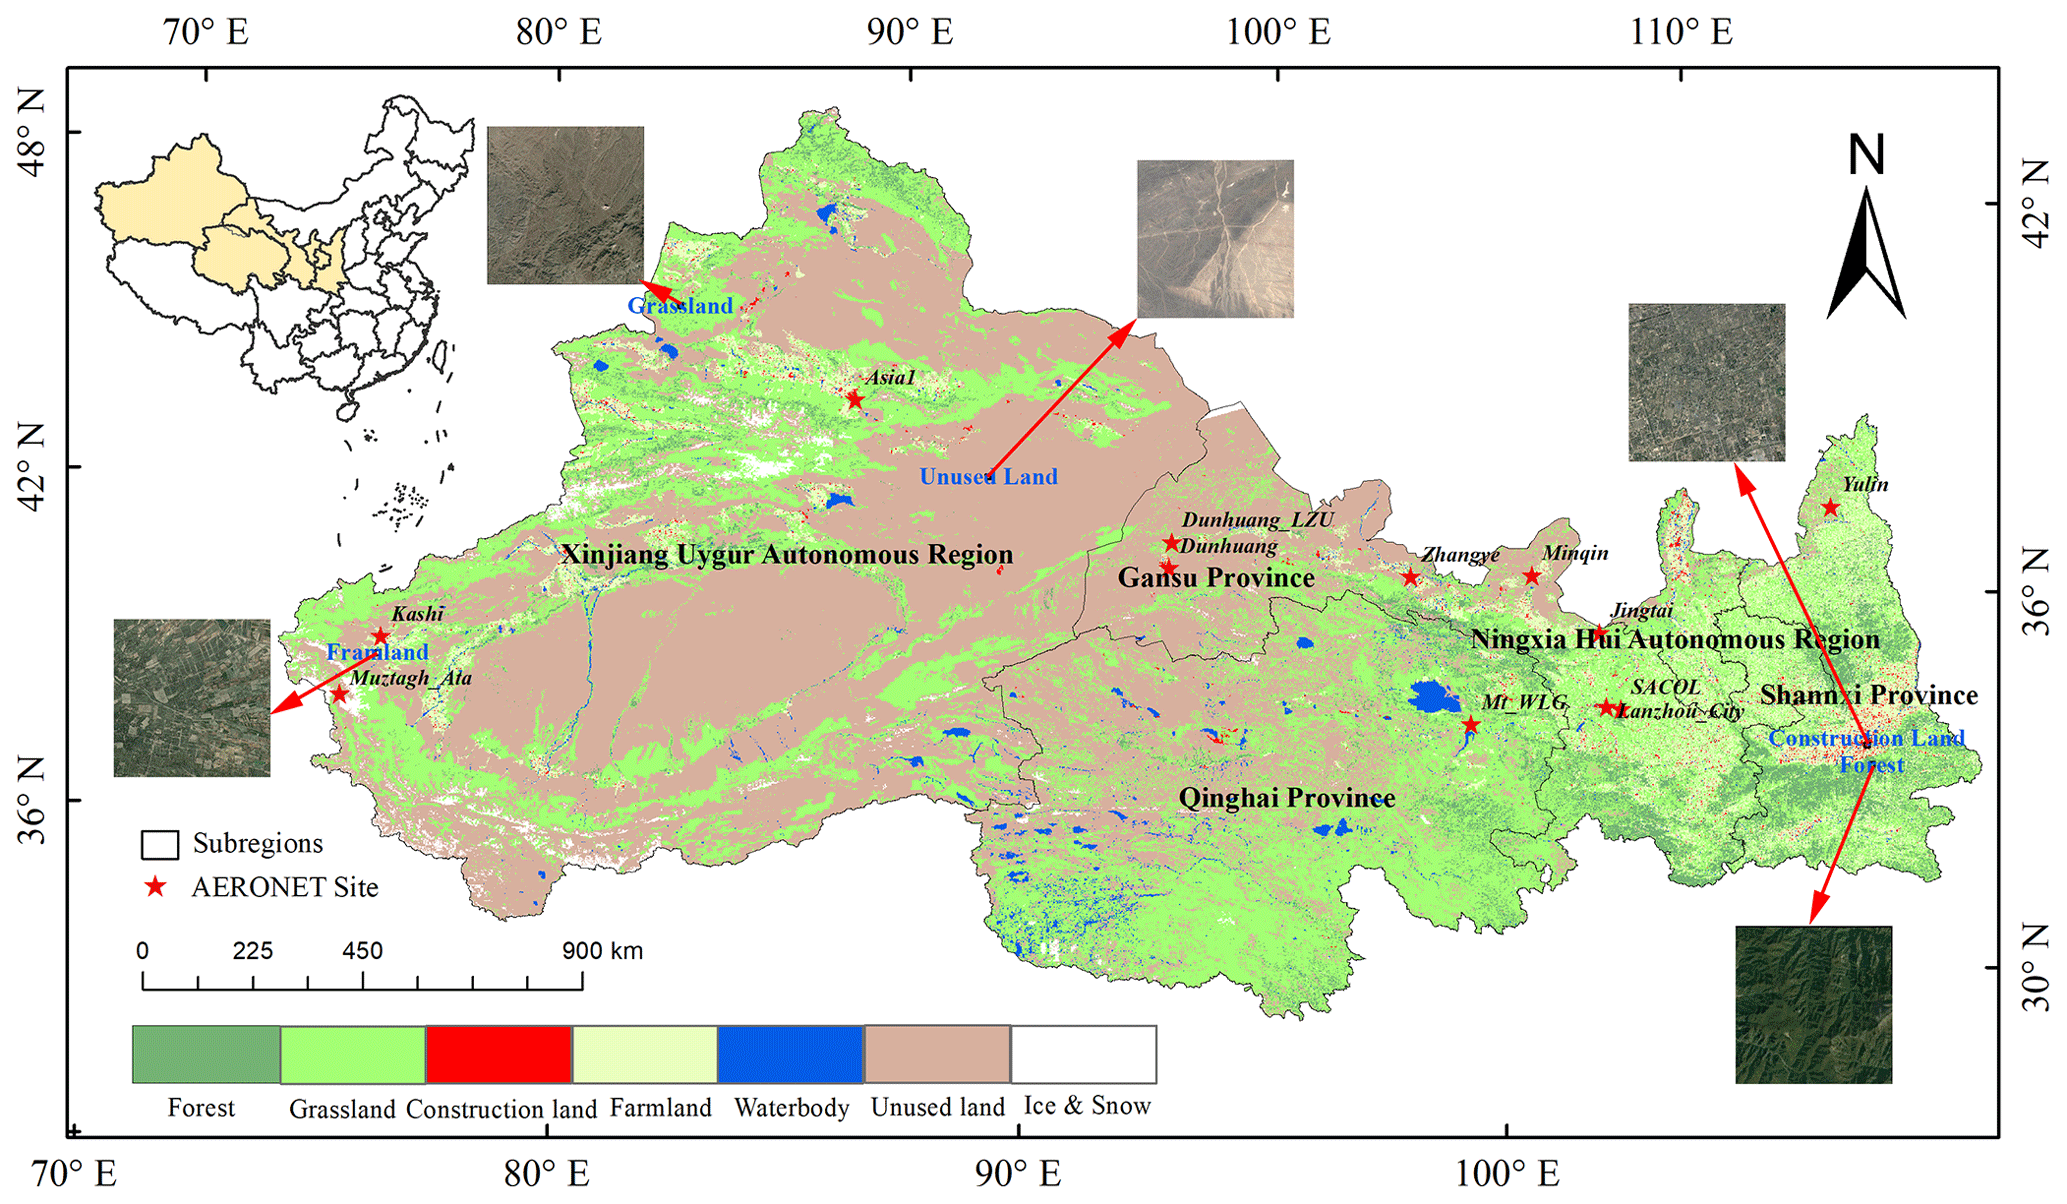
Figure 1Study area. The figure shows the typical arid and semi-arid areas and AERONET site distributions; five provinces/autonomous regions in northwest China. The five ecological zones were derived from © Google Earth (https://earth.google.com/, last access: 28 September 2022).
2.2 MODIS MAIAC data
The MAIAC AOD product, which is named MCD19A2, is based on the MODIS instrument onboard Terra and Aqua in combination with the MAIAC algorithm. The MAIAC algorithm is an advanced AOD retrieval method that uses time-series analyses and image-based spatial processing to acquire AOD data from densely vegetated areas and bright desert regions (Lyapustin et al., 2018, 2011). The MAIAC AOD product's temporal and spatial resolutions are 1 d and 1 km × 1 km, respectively; this is the highest spatial resolution among existing AOD products. The MAIAC AOD product also offers a long time-series AOD collection, which is intended for air quality research on regional and even global scales. Compared with former AOD products, the performance of the MAIAC AOD data product on bright surfaces and heavy AOD loading areas is generally considered to reflect significant improvements (Li et al., 2018; Chen et al., 2021a). In this paper, we acquired the MAIAC AOD product for the entire study region from the NASA website (https://search.earthdata.nasa.gov/, last access: 28 June 2021) over 20 years, from March 2000 to February 2020. Using the Python tool, we pre-processed these data and computed the daily average AOD by combining the 550 nm AOD data from Terra and Aqua.
2.3 MODIS MxD04L2 data
MYD04L2 and MOD04L2 are the level-2 atmospheric aerosol products from Aqua and Terra, respectively, and the spatial and temporal resolutions of these products are 10 km × 10 km and 1 d, respectively (Zhao et al., 2021). The MxD04L2 AOD product is constructed using two main algorithms, the Dark Target (DT) and Deep Blue (DB) algorithms, to retrieve the global AOD distribution. Based on MODIS Collection 6.1 data, we chose the 550 nm combined DT and DB AOD to validate the FEC AOD. Notably, the Aqua and Terra launch times are different, so we acquired MOD04L2 data from March 2000 to February 2020, but for MYD04L2, we acquired data only from July 2002 to February 2020. All processes were realized after downloading data from the NOAA website (https://ladsweb.modaps.eosdis.nasa.gov/, last access: 19 June 2022); the calculation and analysis steps were performed on local computers, and the main works, including the geometric correction, projection conversion, image mosaicking, clipping, daily and monthly AOD means computing, and numerical extraction steps, were performed in the MODIS Reprojection Tool (MRT), ENVI, and ArcGis software.
2.4 AERONET data
AERONET (Aerosol Robotic Network) is a network that monitors aerosols on the ground, providing 0.340–1.060 m aerosol optical characteristics at a high temporal resolution (15 min) (Holben et al., 1998). AERONET currently includes more than 500 sites and covers the major regions of the world with a long time series. The AERONET AOD data have a low uncertainty (0.01–0.02) and are considered the highest accuracy AOD data available; these data are widely used as a reference in RS AOD product validations (Almazroui, 2019). In this study, data from a total of 12 AERONET sites in northwest China were selected, most of which were from the third version of the level 2.0 AERONET AOD, except for the Mt_WLG station data (Level 1.5) (Yan et al., 2022; Giles et al., 2019). Related information about these AERONET sites is available in Table S2 and Fig. 1. Satellite products provide mainly 550 nm wavelength AODs, so the AERONET AOD at 550 nm was computed via the Ångström exponent algorithm to better match the AODs observed by the satellites (Ångström, 1964). In the temporal dimension, we computed the average AERONET AODs over the Aqua and Terra overpass periods. In the spatial dimension, we matched the satellite and in situ observed AODs over a 3×3 pixel spatial window (Tao et al., 2017). The AERONET data and related information can be found at https://aeronet.gsfc.nasa.gov (last access: 31 May 2021).
2.5 Environmental covariates
The environmental covariates selected in this study comprised 12 covariates in three categories (meteorological parameters, surface properties, and terrain factors). The covariates were selected based on two criteria: first, each variable had to be considered important to the AOD and to have a vital influence on the AOD formation, accumulation, and migration processes, referring to existing research and expert experience (Zhao et al., 2019; Chen et al., 2020; Yan et al., 2022); and second, the data must be freely released to the public, meaning the datasets must be freely available on the national or global scale (Li et al., 2020). Detailed information on these covariates is listed in Table 1. In this study, we computed environmental variable datasets at two spatial resolutions (1 km and 250 m). The 1 km spatial resolution data were obtained with the aim of modeling with the MAIAC 1 km AOD, and the 250 m spatial resolution data were the target resolution of the FEC AODs. To normalize the covariables on this basis, we interpolated the geo-datasets to 1 km and 250 m spatial resolutions in ArcGIS (the bilinear method was used for the continuous covariates and the nearest neighbor method was used for classified covariates) and reprojected the results to the 1984 World Geodetic System (WGS) coordinates. The environmental covariates were divided into static and dynamic variables. Static variables were defined as those that did not change essentially with time, i.e., slowly changing factors. For dynamic covariates, the averaging method was adopted to obtain monthly average data. The static variables, similar to the baseline conditions, played an initial constraint role in the downscaling of the monthly AODs, while the dynamic variables played a more dynamic evolution role (Yan et al., 2022). Notably, the relevant operations are not limited to ArcGIS, and relevant open-source software such as QGIS could also be implemented.
2.5.1 Meteorological parameters
The meteorological parameters included temperature, precipitation, evapotranspiration, and wind speed. The temperature and precipitation data were obtained from National Tibetan Plateau/Third Pole Environment Data Center (TPDC) at temporal and spatial resolutions of 1 month and 1 km × 1 km, respectively. The evapotranspiration (ET) data were obtained from the TPDC's terrestrial evapotranspiration dataset across China at temporal and spatial resolutions of 1 month and 0.1∘ × 0.1∘, respectively (Szilagyi et al., 2019). For the ET data, we used a downscaling algorithm proposed by Ma et al. (2017) to transform the values into a 1 km resolution. The wind speed data were obtained from National Earth System Science Data Center at temporal and spatial resolutions of 1 month and 1 km × 1 km, respectively (Sun et al., 2015). For the four meteorological parameters, we calculated the monthly average value each year for the subsequent research.
2.5.2 Surface properties
To describe the surface properties, we employed the land use and land cover (LUCC), normalized difference vegetation index (NDVI), and temperature vegetation dryness index (TVDI). From the LUCC dataset, we selected the median year of the whole study period, 2010, from Resource and Environment Science and Data Center. The LUCC dataset was obtained by manual visual interpretations of the Landsat series data as the data source. This dataset included six categories (farmland, forest, grassland, water body, construction land, and unused land) and 25 subcategories at a spatial resolution of 30 m. LUCC data are often likely to indicate the intensity of human activity and are closely related to aerosol emissions, transport, and dustfall (Fan et al., 2020; Li et al., 2022). The NDVI data were obtained from the NASA Global Inventory, Monitoring, and Modelling Studies (GIMMS) NDVI3g v1 product at temporal and spatial resolutions of 15 d and 0.083∘ × 0.083∘, respectively. The NDVI data were downscaled to 1 km, similar to the ET data. The TVDI data were obtained through a soil moisture inversion method based on the NDVI and surface temperature. This index can optimally monitor drought conditions and is used to study the spatial variation characteristics of the drought degree. The temporal and spatial resolutions of the TVDI data are 1 month and 1 km × 1 km, respectively.
2.5.3 Terrain factors
The elevation data were collected from the Shuttle Radar Topography Mission (SRTM) 90 m digital elevation model (DEM). DEM is highly correlated with surface pressure and always used to represent the dispersion condition of aerosols (Xue et al., 2021; Fan et al., 2020). Based on elevation, geomorphology is realized under Geographic Resource Analysis Support System extension named r.geomorphon modular (Jasiewicz and Stepinski, 2013). Using the System for Automated Geoscientific Analyses software (https://sourceforge.net/projects/saga-gis/, last access: 23 April 2021), the plan curvature, slope length and slope steepness, and topographic wetness index were computed.

2.6 Bagging tree ensemble
Ensemble machine learning methods can be divided into two main categories according to whether dependency relations exist between learners: boosting and bagging (Fig. S1) (González et al., 2020). If there is a strong dependency between individual weak learners, and a series of individual weak learners needs to be generated serially (this means that the following weak learner is affected by the former weak learner), this is boosting. In contrast, if there is no dependency between individual weak learners, a series of individual learners can be generated in parallel (there is no constraint relationship between each learner), this is bagging. The typical representative and extensively used boosting and bagging algorithms are gradient boosting decision tree (GBDT) and random forest (RF), respectively (Zounemat-Kermani et al., 2021). Compared to boosting, bagging reduces the training difficulty and has a strong generalization ability.
Bagging (namely, bootstrap aggregating), as a simple but powerful ensemble algorithm to obtain an aggregated predictor, is more accurate than any single model (Breiman, 1996). Bagging uses multiple base learners or individual learners (such as decision trees, neural networks, and other basic learning algorithms) to construct a robust learner under certain combined strategies (Li et al., 2018). Generally, bagging algorithms include bootstrap resampling, decision tree growing, and out-of-bag error estimation steps. The main steps of bagging are as follows: (1) bootstrap resampling of a random sample (return sampling) under abundant individual weak learners; (2) model training based on the origin samples to train for abundant individual weak learners in accordance with the self-serving sample set; and (3) outputting the results based on the decision tree and calculating the average of all the regression results to obtain the final regression results. Therefore, bagging reduces the overfitting problem and prediction errors in decision trees and the variance, thereby significantly improving the accuracy of the results. Simultaneously, the influence of noise on the bagging algorithm is comparatively lower than those of other available machine learning algorithms for obtaining AODs (Liang et al., 2021).
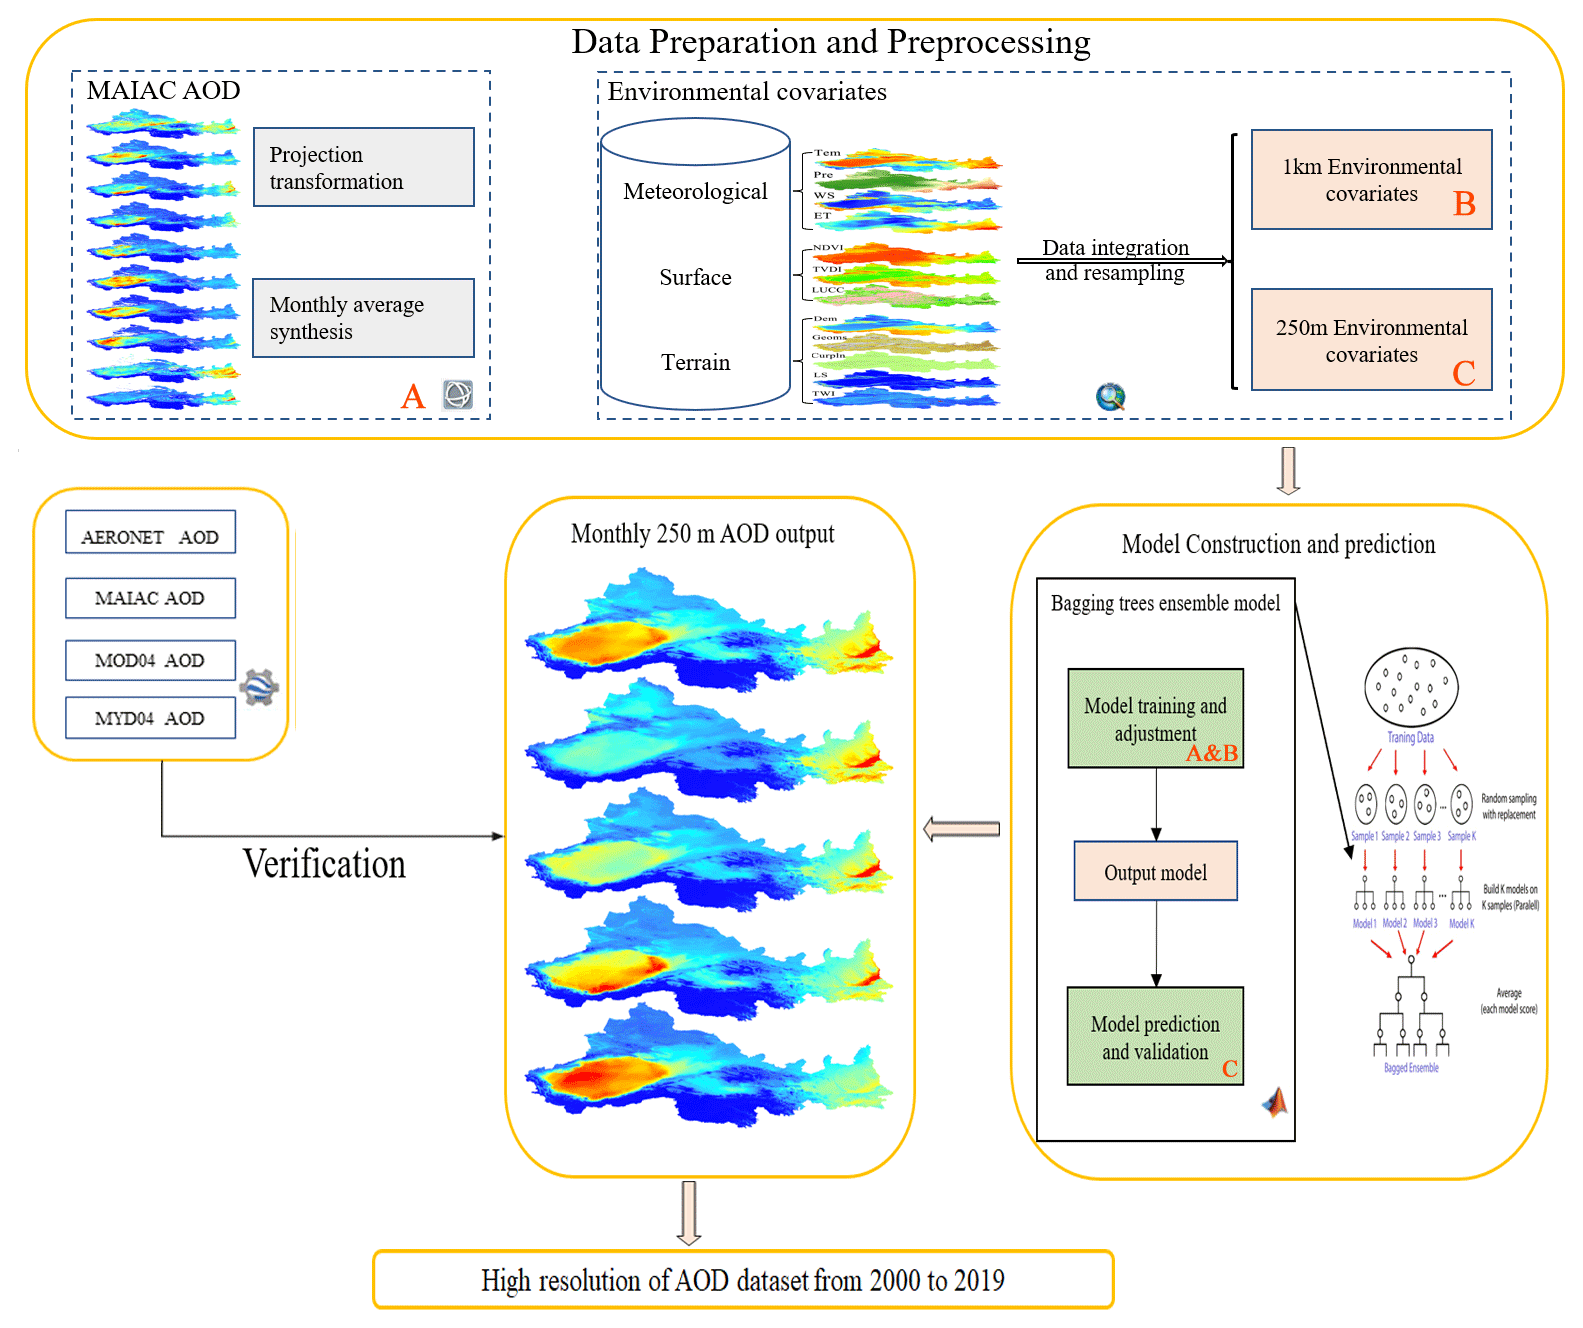
In this study, we used 12 environmental covariates (1 km) as the downscaling method (bagging tree ensemble algorithms) inputs to acquire an AOD-environmental covariate (AODe) model at a 1 km resolution and utilized the AODe model and 250 m environmental covariates to acquire the FEC AOD product. Specifically, the basic idea for downscaling AODs with bagging trees ensemble machine learning (ML) models is to train the relationships between the MAIAC AODs and the auxiliary environmental variables at a coarse resolution (1 km) using ML algorithms. We then applied the trained relationships to generate a high-resolution FEC AOD product at a fine resolution (250 m) (Duveiller et al., 2020; Yang et al., 2020; Ma et al., 2017). In the case of lacking environmental covariates in some periods, we used the multiyear monthly average to replace the missing values. The reason why the 250 m target resolution was selected was that existing studies have shown that the 250–500 m spatial-resolution scales are appropriate for aerosol RS research and can optimally capture aerosol features (Wang et al., 2021; Chen et al., 2020). Second, most high-resolution global product data have a 250 m resolution, especially soil data, as this resolution is most convenient for peer comparison and further research and application (De Poggio et al., 2021; Hengl et al., 2017). The model was built monthly from March 2000 to February 2020 to assure the model's accuracy in the inference process, and the specific parameter set included 10 cross-validation folds, the number of learners (N=30), and the minimum leaf size (Lmin=8). Each base learner was developed using a bootstrap sample generated individually from the input data. All steps were implemented in MATLAB R2021a (Fig. 2). All modeling and application processes could also be implemented in R or Python.
3.1 Performance evaluation based on in situ observations
To verify the performance of the FEC AOD product over arid and semi-arid areas, based on the AERONET AOD data as a reference, some generalized parameters were chosen to assess the performance of the FEC AOD product, such as the decision coefficient (R2), root mean square error (RMSE), and expected error (EE). (Levy et al., 2010; Ali et al., 2019; Feng and Wang, 2021). When R2 is higher and RMSE is lower, the performance of the FEC AOD is better. The EE can evaluate the degree of overestimation or underestimation of the FEC AOD product via three situations (within EE, above EE, and below EE). To examine the high-resolution and full-coverage FEC AOD performance, we computed the monthly average AOD at each AERONET site in the whole study region. Specifically, we checked the data time range and data usability at every site, and for the daily scale we computed the average AOD only from 09:00–14:00 LT to obtain the daily mean (if the valid data number in a day was less than 18, the daily mean was considered to be missing). For the monthly scale, if the number of effective daily data was less than 20 d, the monthly mean was considered missing, so 180 effective matching samples were obtained. As shown in Fig. 3a, the FEC AODs were highly correlated with the AERONET AODs (R2=0.787), with an MAE of 0.049 and RMSE of 0.061. Approximately 83.9 % of the monthly collections fell within the EE, with an RMB of 1.018 and a bias of 0.005, meaning that the FEC AOD product almost overcame some of the overestimation and underestimation problems. Concurrently, we also conducted comparisons between the MAIAC AOD (Fig. 3b), MOD04 L2 (Fig. 3c), and MYD04 L2 (Fig. 3d) products with the AERONET AODs for the same period. The MAIAC AOD product was superior to the MxD04L2 AOD product, and the FEC AODs exhibited obvious improvements compared to the MAIAC AODs, within EE values ranging from 65.0 % to 83.9 %. It is clear that the performance of the FEC AOD product obviously outperformed the other AOD products in terms of the number of valid data, consistency, and deviation. In addition, compared to previous studies, the FEC AODs also have an improved applicability advantage (Chen et al., 2021a; Wei et al., 2019).
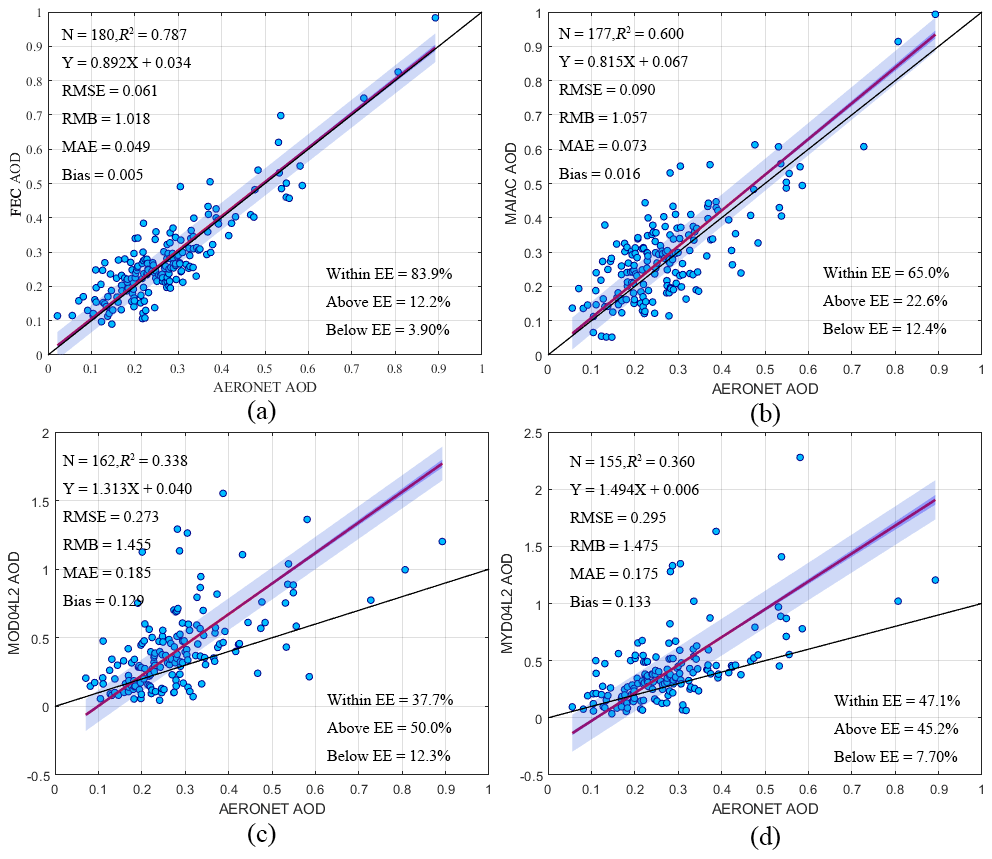
Figure 3Comparisons of various products with the AERONET AODs: (a) FEC AODs, (b) MAIAC AODs, (c) MOD04L2 AODs, and (d) MYD04L2 AODs. The red line denotes the regression line, the black line shows the 1:1 line, and the blue area indicates the 95 % prediction interval.
3.2 Comparisons with satellite AOD products
The multiyear average spatial distributions of the FEC AODs, MAIAC AODs, MOD04L2 AODs, and MYD04L2 AODs were calculated (Fig. 4). The AOD spatial patterns exhibited high consistency among these products: high AODs were located in the Taklimakan Desert and on the Loess Plateau, and low AODs were distributed in high-elevation areas (such as mountainous zones and Qinghai province). To further validate the FEC AOD performance, we calculated the monthly, seasonal, and yearly average AODs from 2000 to 2019 (Figs. S2–S5). In terms of the monthly scale (Fig. S2), we found that many high AOD values appeared in March, April, and May, concentrated in and downwind of the Taklimakan Desert. Generally, the FEC AODs, MAIAC AODs, MOD04L2 AODs, and MYD04L2 AODs had similar monthly spatial distributions, especially the FEC AODs and MAIAC AODs. The monthly correlations between the FEC and MAIAC AODs were all above 0.78 in the study area, most of which were higher than 0.9 (Rmean=0.928, N=240, P<0.001) (Fig. S3). A similar spatial pattern also appeared in the multiyear seasonal average AODs (Fig. S4). Spring had the broadest high-AOD-value distribution, followed by summer, while autumn and winter had high AOD values concentrated on the Loess Plateau. At the same time, the multiyear annual average AOD also exhibits strong similarity in its spatial patterns among products (Fig. S5). Therefore, we can robustly conclude that the FEC AOD product has a strong consistency with the MAIAC AOD, MOD04L2 AOD, and MYD04L2 AOD products with regards to the monthly, seasonal, and yearly average AOD spatial patterns.
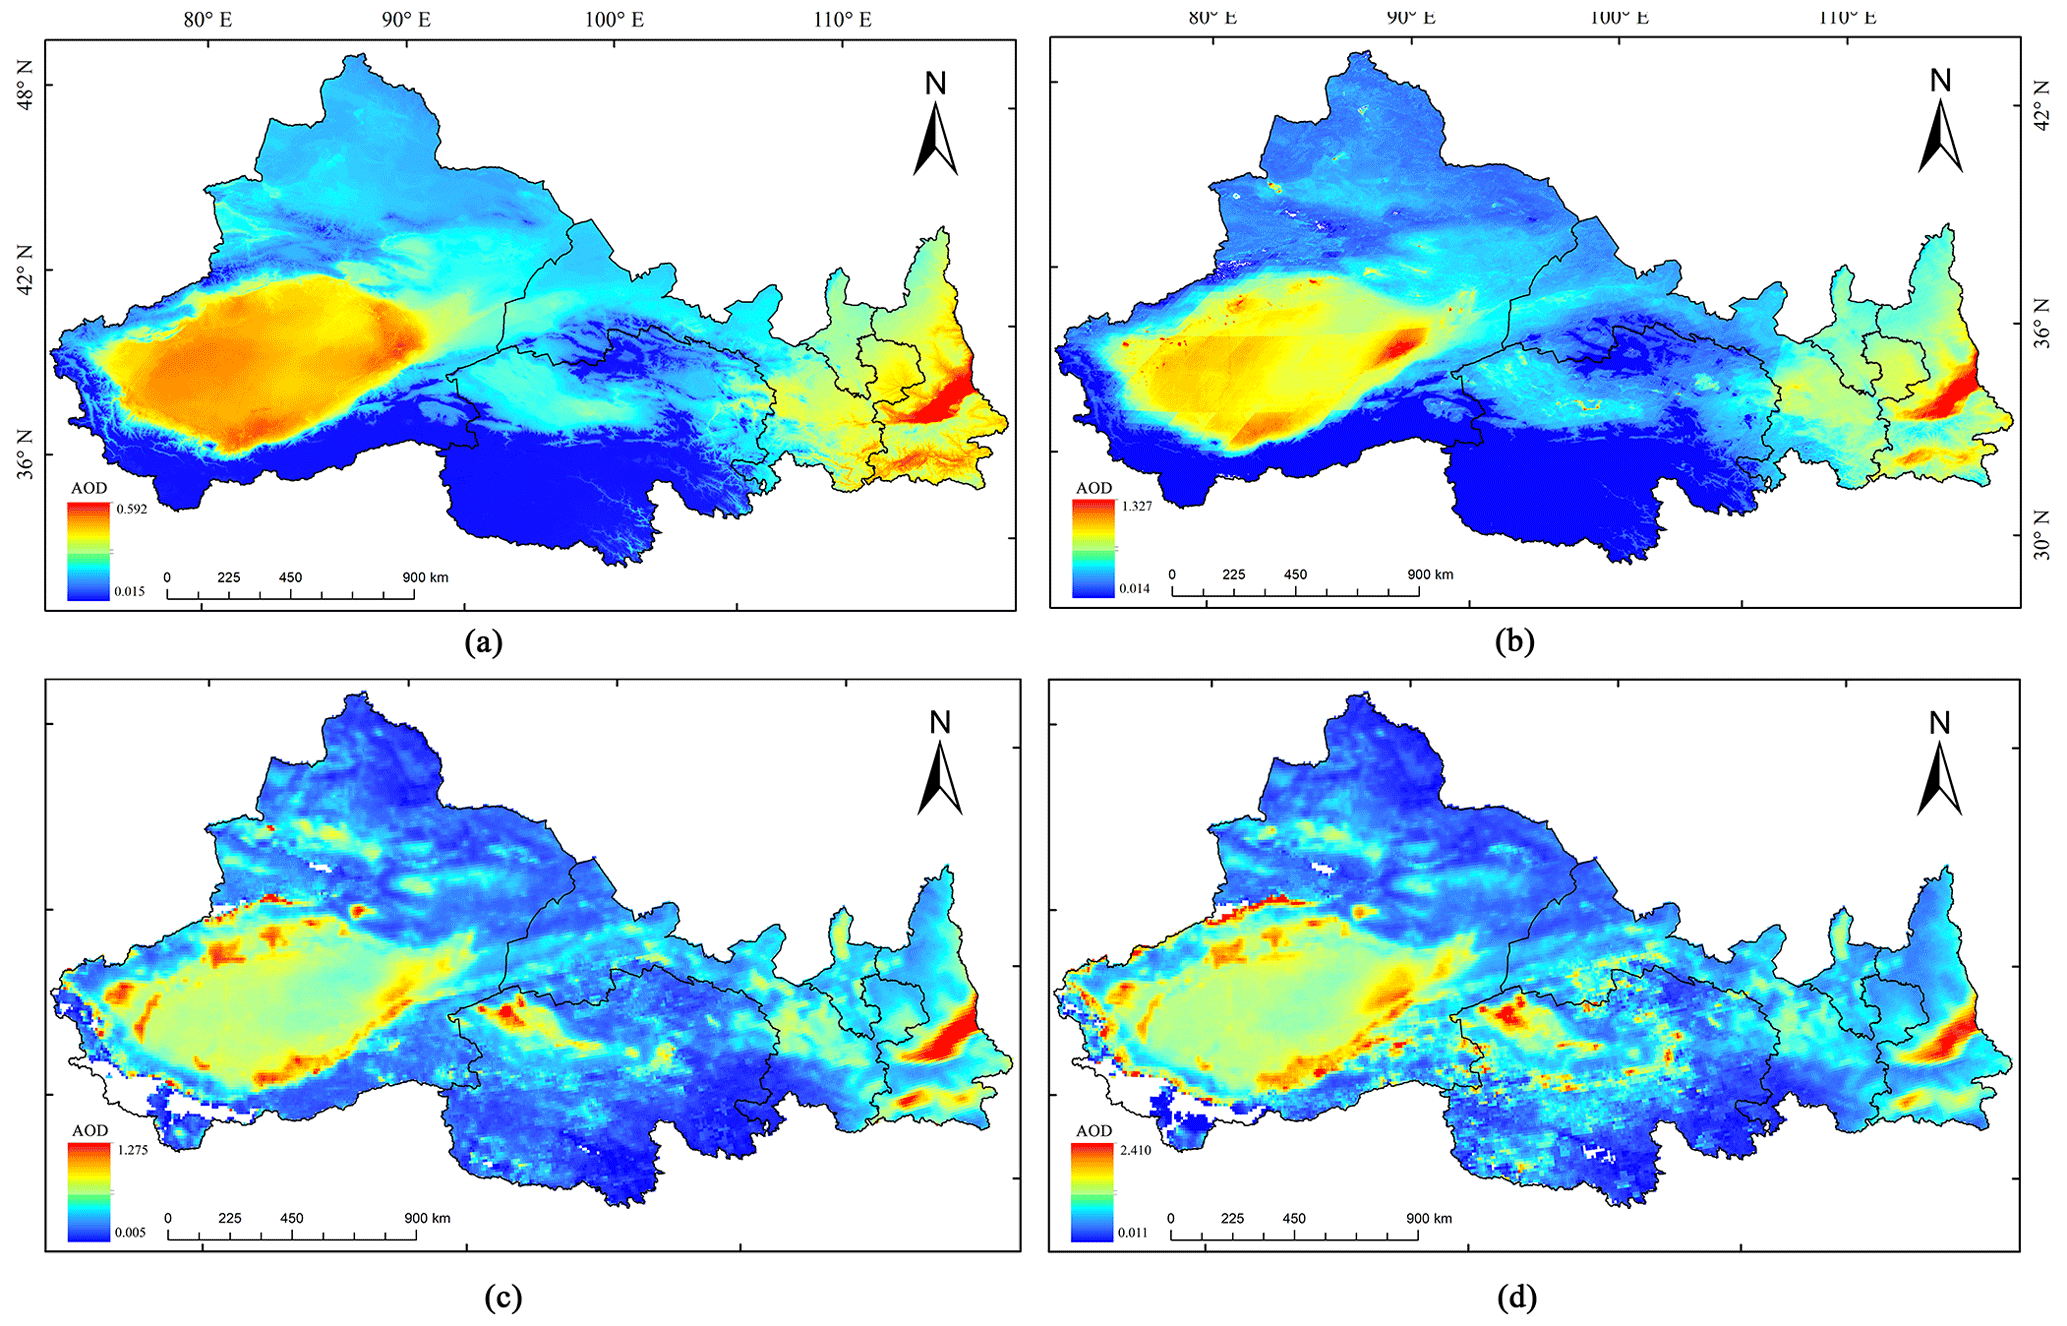
Figure 4The multiyear spatial average AODs from 2000 to 2019: (a) FEC AODs, (b) MAIAC AODs, (c) MOD04L2 AODs, and (d) MYD04L2 AODs.
Considering that the ability to capture long-term trends is an important element for a dataset, we compared the FEC AOD, MAIAC AOD, MOD04L2 AOD, and MYD04L2 AOD products to further validate the FEC AODs. From January to December, the multiyear monthly averages of these four AOD products showed similar change trends, increasing and decreasing alternately, and reaching their lowest values in November (Fig. S6). Of course, we observed some differences in the AOD magnitude and fluctuation range; these differences were due mainly to the difference in AOD retrieval algorithms. To further analyze the consistency and differences among the products, we also compared the four products on monthly scale by removing the seasonal cycles (Fig. 5). First, the four AOD data products changed in a highly similar manner, and the MxD04L2 AOD fluctuation range was significantly higher than those of the FEC AOD and MAIAC AOD products. Notably, the FEC AOD and MAIAC AOD products were substantially consistent, with an R2 value of 0.953. In addition, we also computed the monthly and seasonal change trends by removing the seasonal cycles on the pixel scale. Because MxD04L2 contains a large amount of missing data and the detrend results show no data, we mainly discuss the spatial change trends of the FEC AOD and MAIAC AOD products on the monthly and seasonal scales in the following text. From Figs. S7 and S8, we find that the monthly and seasonal change trends reveal good consistency between the FEC AOD and MAIAC AOD products. The long-term trends based on the monthly AOD data between 2000 and 2019 show a similar spatial pattern in the effective pixels of the FEC AOD and MAIAC AOD products (Fig. 6), with a significant decrease on the Loess Plateau and a significant increase in the south-eastern Taklimakan Desert. Moreover, the long-term FEC AOD trends are significant (P<0.05) in most areas.
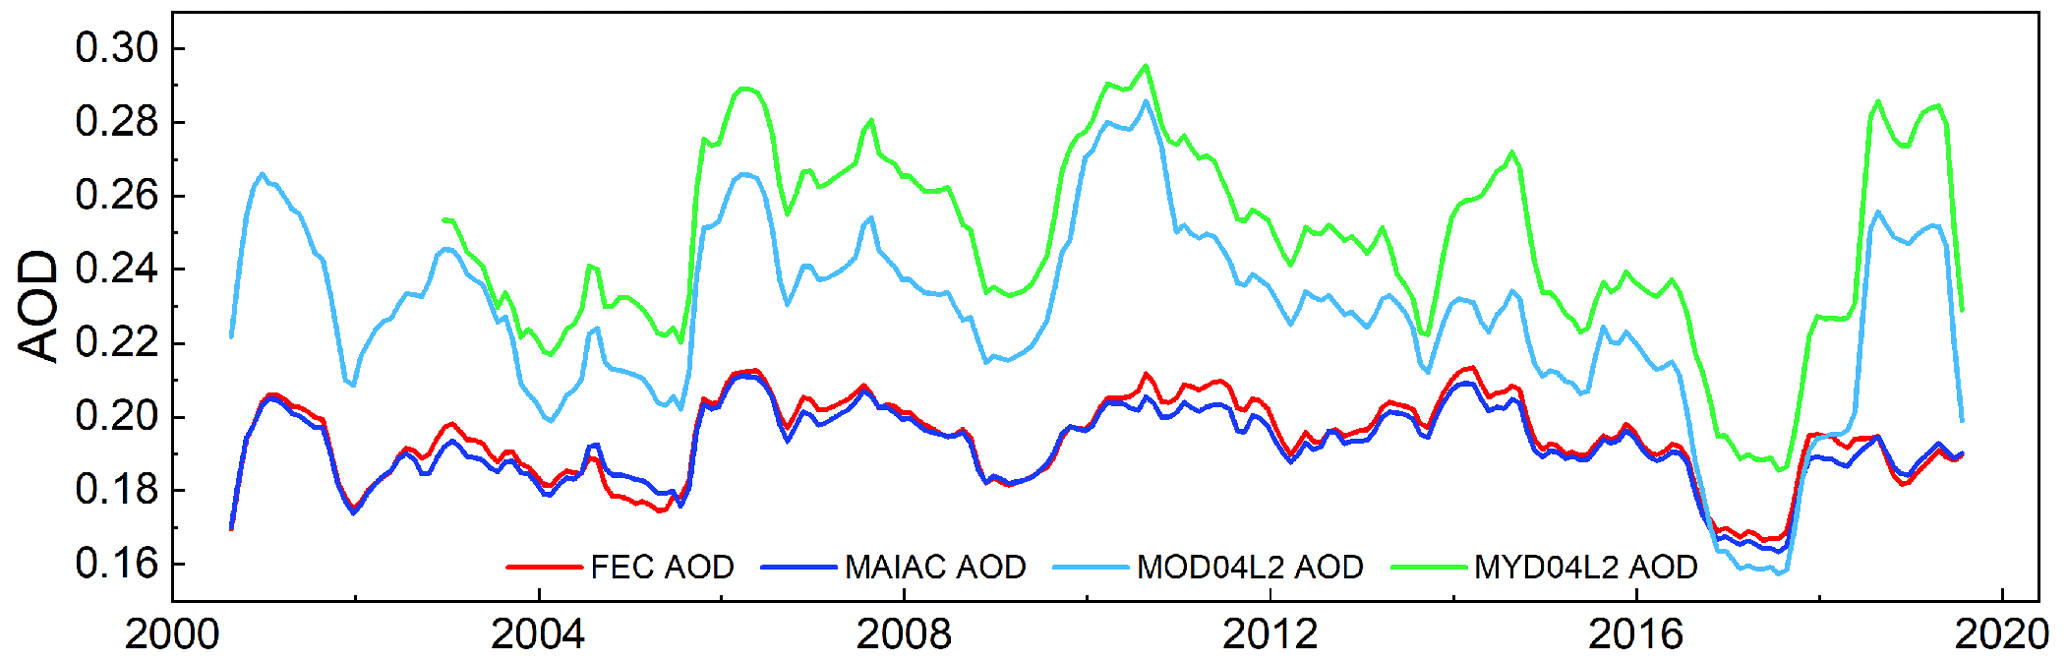
Figure 5The long-term change trends of four AOD products obtained by removing seasonal cycles.
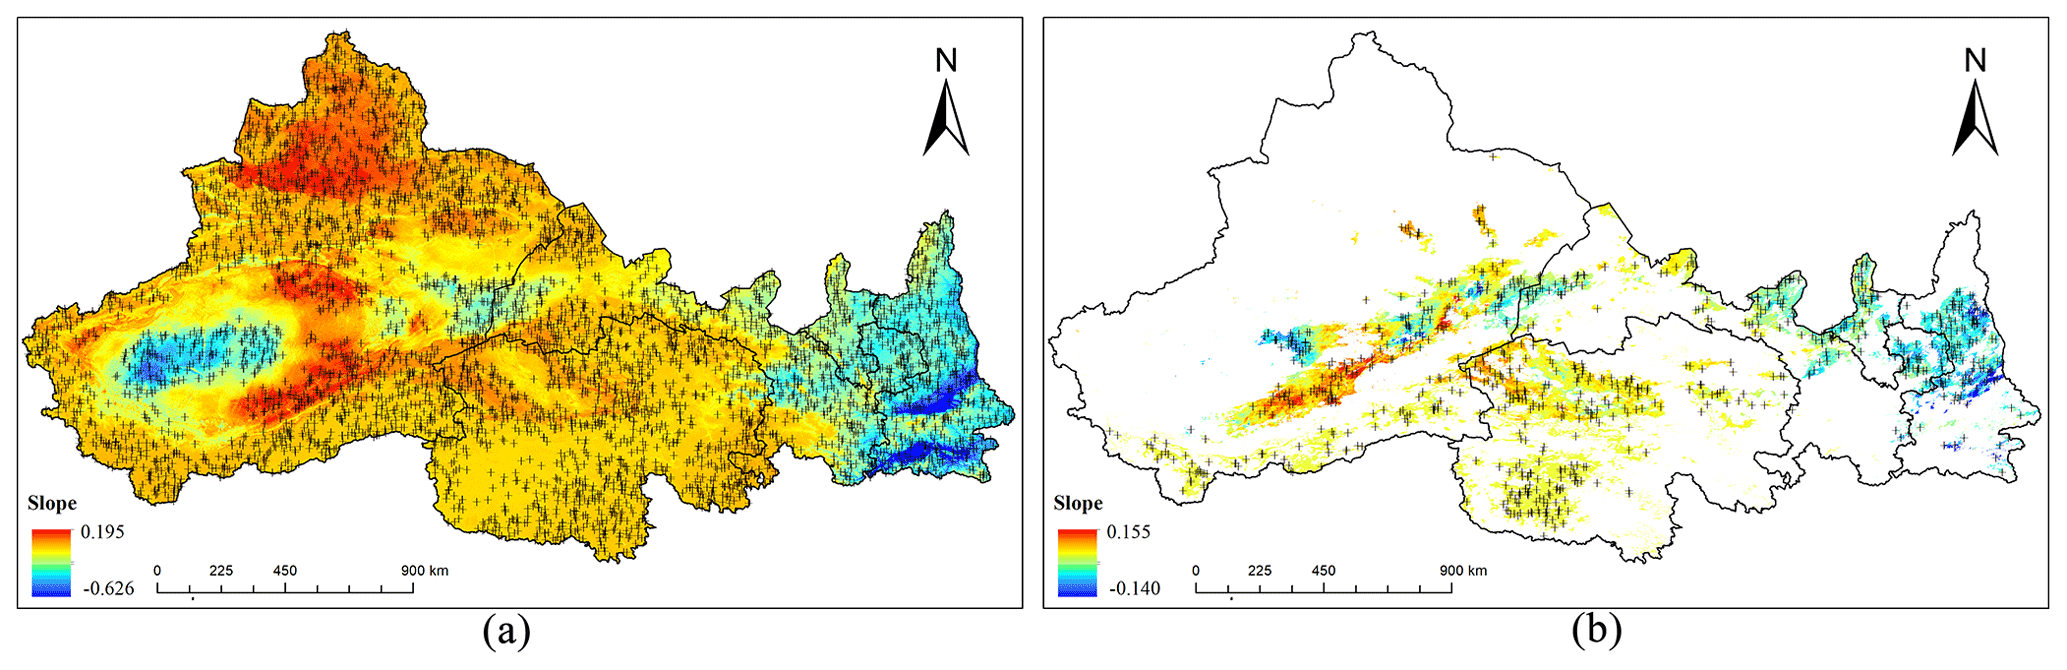
Figure 6Spatial patterns of AOD trends obtained by removing seasonal cycles between 2000 and 2019: (a) FEC AODs (10−3) and (b) MAIAC AODs (10−2). The label “+” indicates a statistically significant trend (p<0.05).
As is well established, the effect of scale is a scientific problem in remote sensing, so we further discussed the ability of the FEC AOD product to describe relatively fine-spatial-resolution features. First, we created a 10 km × 10 km fishnet; then, we chose a single LUCC as a corresponding ecosystem; and finally, we selected five different ecological zones (forest, grassland, farmland, construction land, and unused land) to further quantify the local performance of the FEC AOD product (Fig. 1). We found that the FEC AOD and MAIAC AOD products revealed good consistency in their long-term trends, while the MxD04L2 AODs showed a larger deviation (Fig. 7). The FEC AODs and MAIAC AODs had close relationships in unused lands (R=0.959) and farmland, followed by in construction land and forest, while these products had the lowest relationship in grassland (R=0.675). Therefore, the above evidence indicates that the FEC AOD product is also reliable with regards to the fine-spatial-resolution long-term trends captured over single surface coverage types.
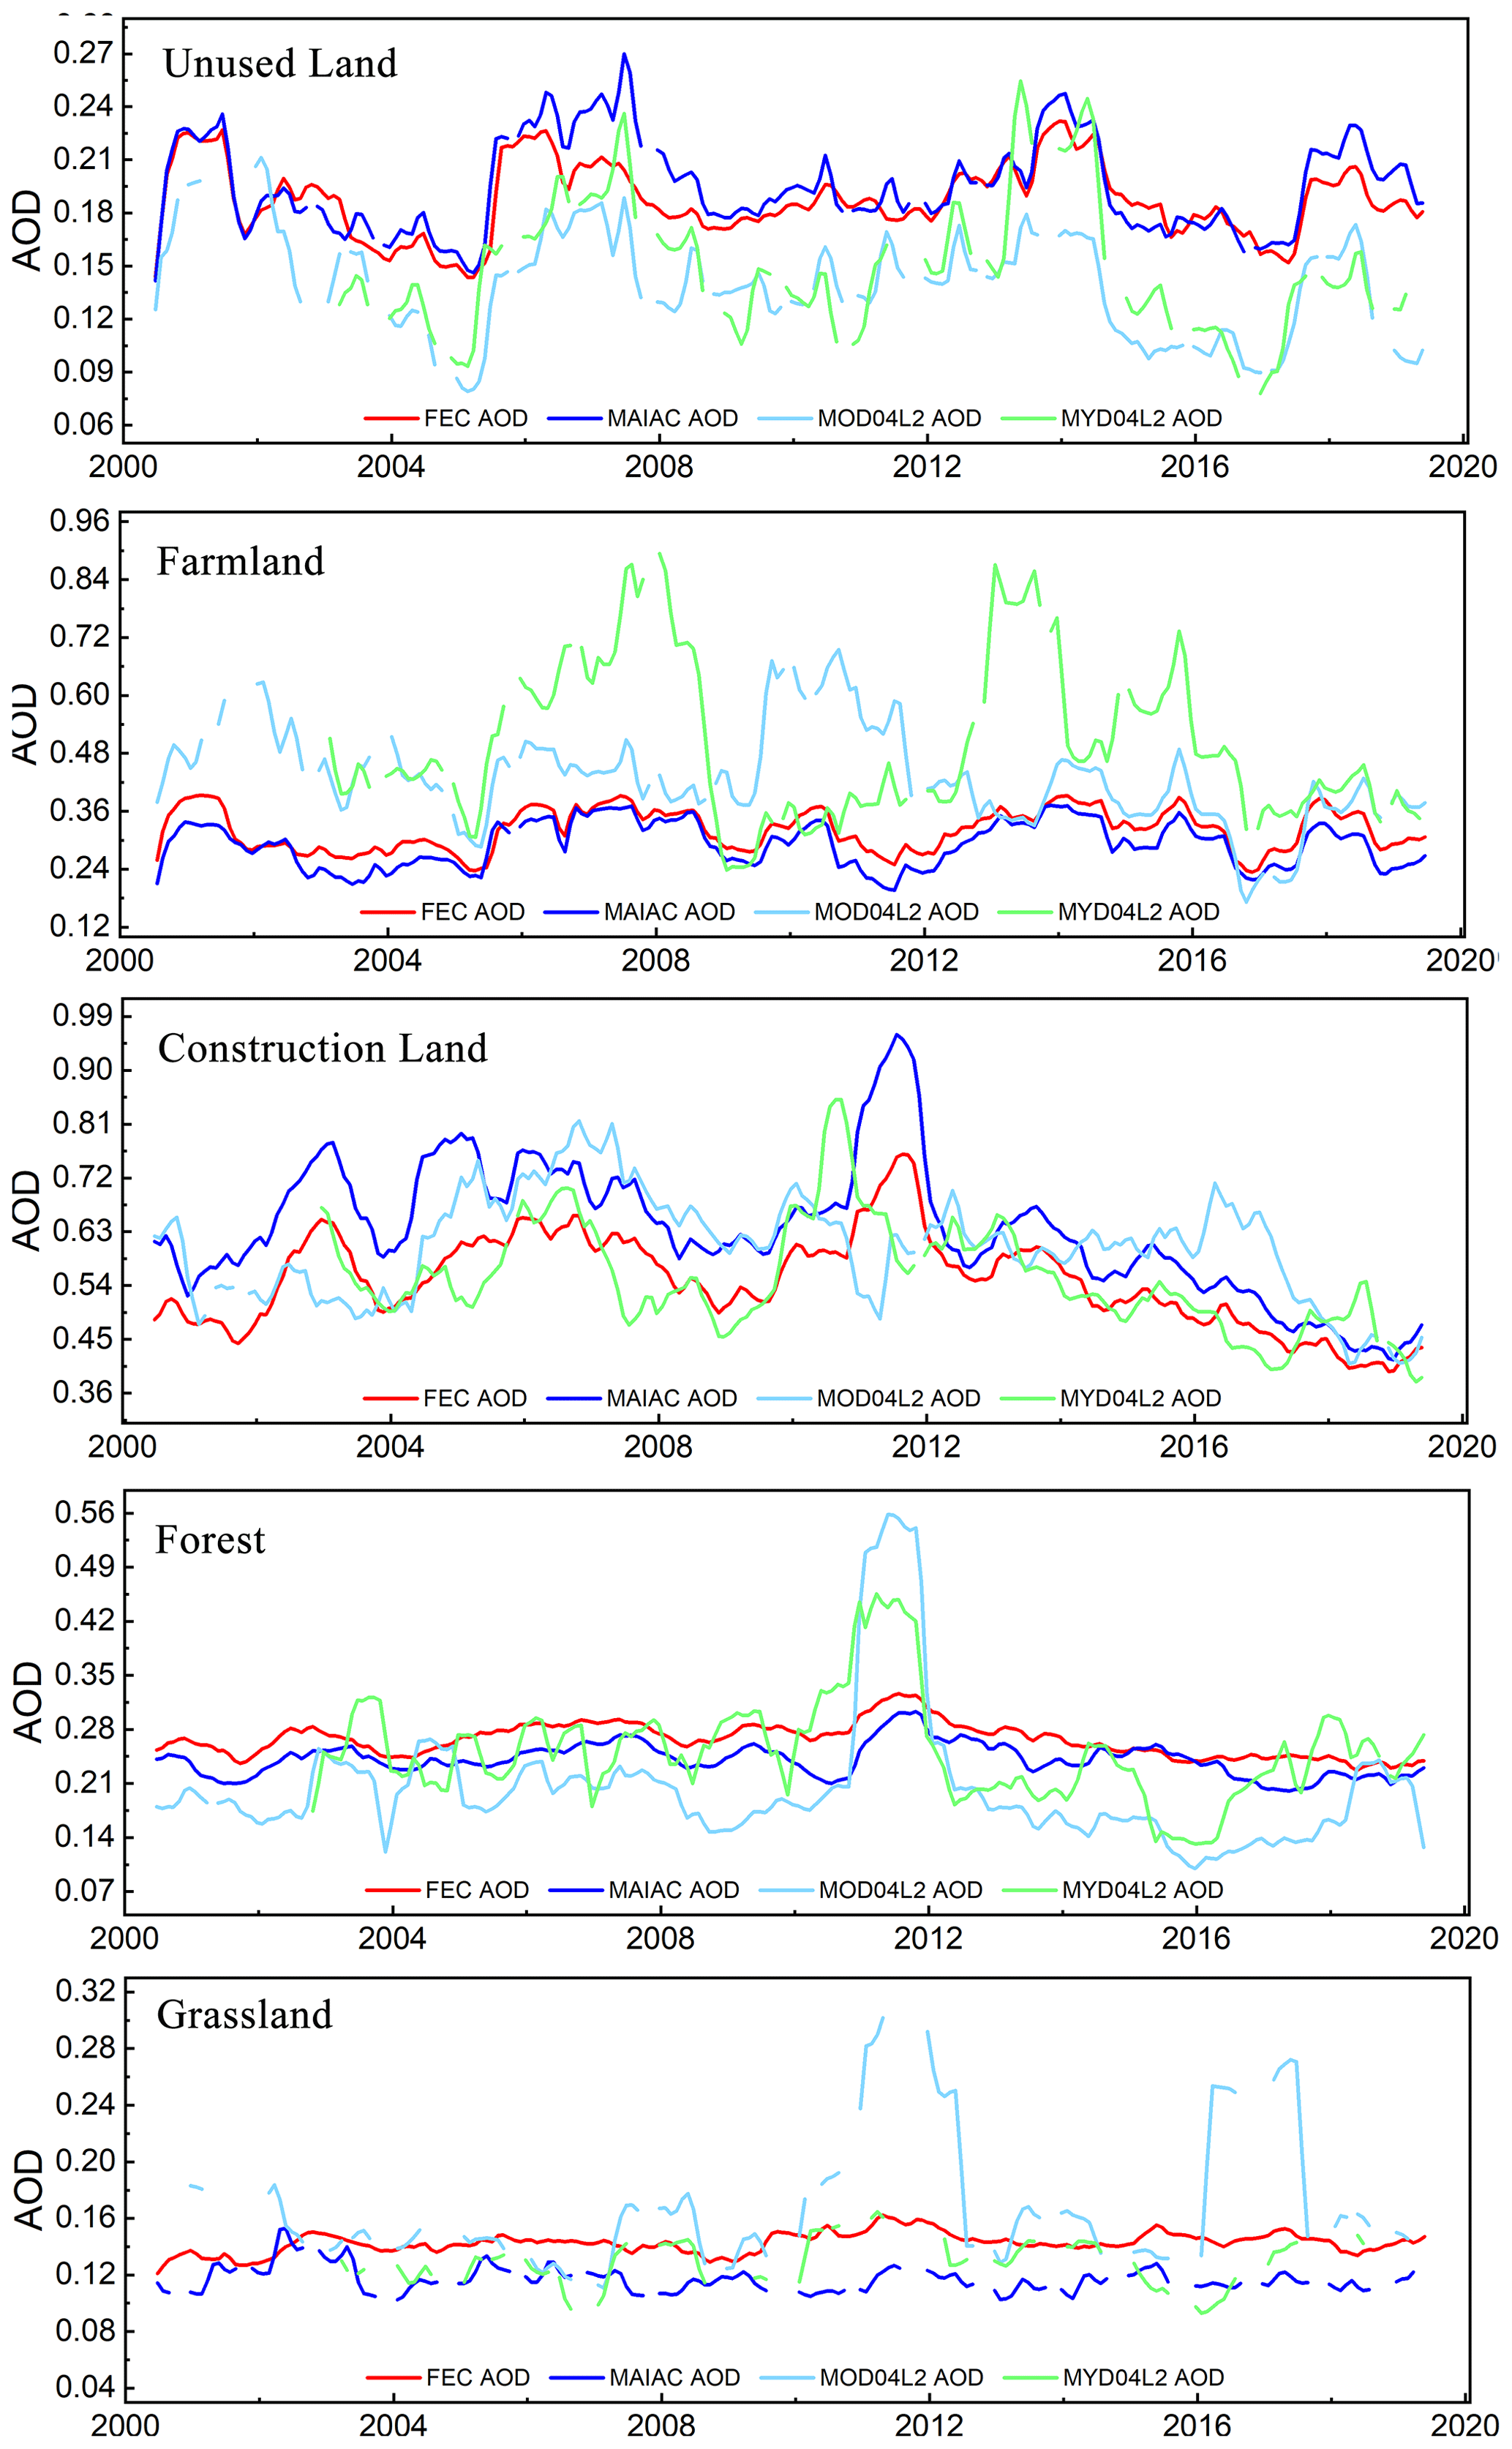
Figure 7The long-term change trends of four AOD products over five ecological zones obtained by removing seasonal cycles.
3.3 Spatiotemporal patterns of the FEC AOD product from 2000 to 2019
Generally, the spatial patterns of the FEC AOD product were consistent among different years (Fig. S5); the highest AODs were found in the southern area of Xinjiang Uyghur Autonomous Region of China (hereafter referred to as Xinjiang) and the center of Shaanxi province, mainly due to the special meteorological conditions, unique topography, and surface coverage of these regions. The AODs were low in other areas, especially in southern Qinghai province. The multiyear mean AOD was 0.193±0.124 for the whole study area. The spatial AOD patterns differed greatly at the seasonal level (Fig. S4). In autumn, the AODs were relatively small, with an average AOD value of 0.147±0.089 and most AOD values <0.2. In contrast, the AODs were most severe in spring, with most AOD values >0.2 (average ). The summer and winter seasons had similar spatial patterns, and the former had higher AODs than the latter, with AOD values of 0.198±0.134 and 0.159±0.103, respectively. To further investigate the spatiotemporal variations in the AOD, concepts of information entropy were introduced: temporal information entropy (TIE) and time-series information entropy (TSIE) (Ebrahimi et al., 2010). TIE and TSIE are time-series indicators that can depict the changing intensity and trend information of AODs. Generally, the higher (lower) the TIE is, the stronger (weaker) the change intensity of the AOD is in the temporal dimension. Regarding TSIE, if TSIE >0, then the AOD is increasing in the considered period, whereas TSIE <0 denotes a downward trend. Furthermore, the larger the absolute TSIE value is, the more significant the increasing (decreasing) trend is. Figure 8 depicts the TIE and TISE of the AOD from 2000 to 2019 over the whole study area. We find that the overall AOD change intensity over the past 20 years is large, especially in southern Xinjiang (Taklimakan Desert) and Shannxi province (Loess Plateau). The areas with low variation intensities are distributed mainly at high elevations (in mountainous and grassland areas). The change intensity characteristics are similar to the AOD changes, meaning that the higher the AOD is, the larger the multiyear change is. The AODs in Xinjiang were increasing throughout the study period, with the most obvious increases occurring around the Taklimakan Desert and northern Xinjiang, whereas the eastern AODs were decreasing, with decreases concentrated mainly in Shannxi province and south-eastern Gansu province. Considering TIE and TSIE together, we find that the AODs increased strongly in the south-eastern Taklimakan Desert but increased slightly in northern Xinjiang and north-western Qinghai province. The AODs in southern Qinghai province showed almost no change. A dramatic decrease was observed found in the eastern area, mainly distributed in Shannxi province, Ningxia Hui Autonomous Region, and south-eastern Gansu province. A possible reason for this finding is that the Loess Plateau is experiencing greening, and the vegetation cover in this region continues to increase under artificial intervention. All these various characteristics are in good agreement with the detrended long-term variation results (Fig. 6).
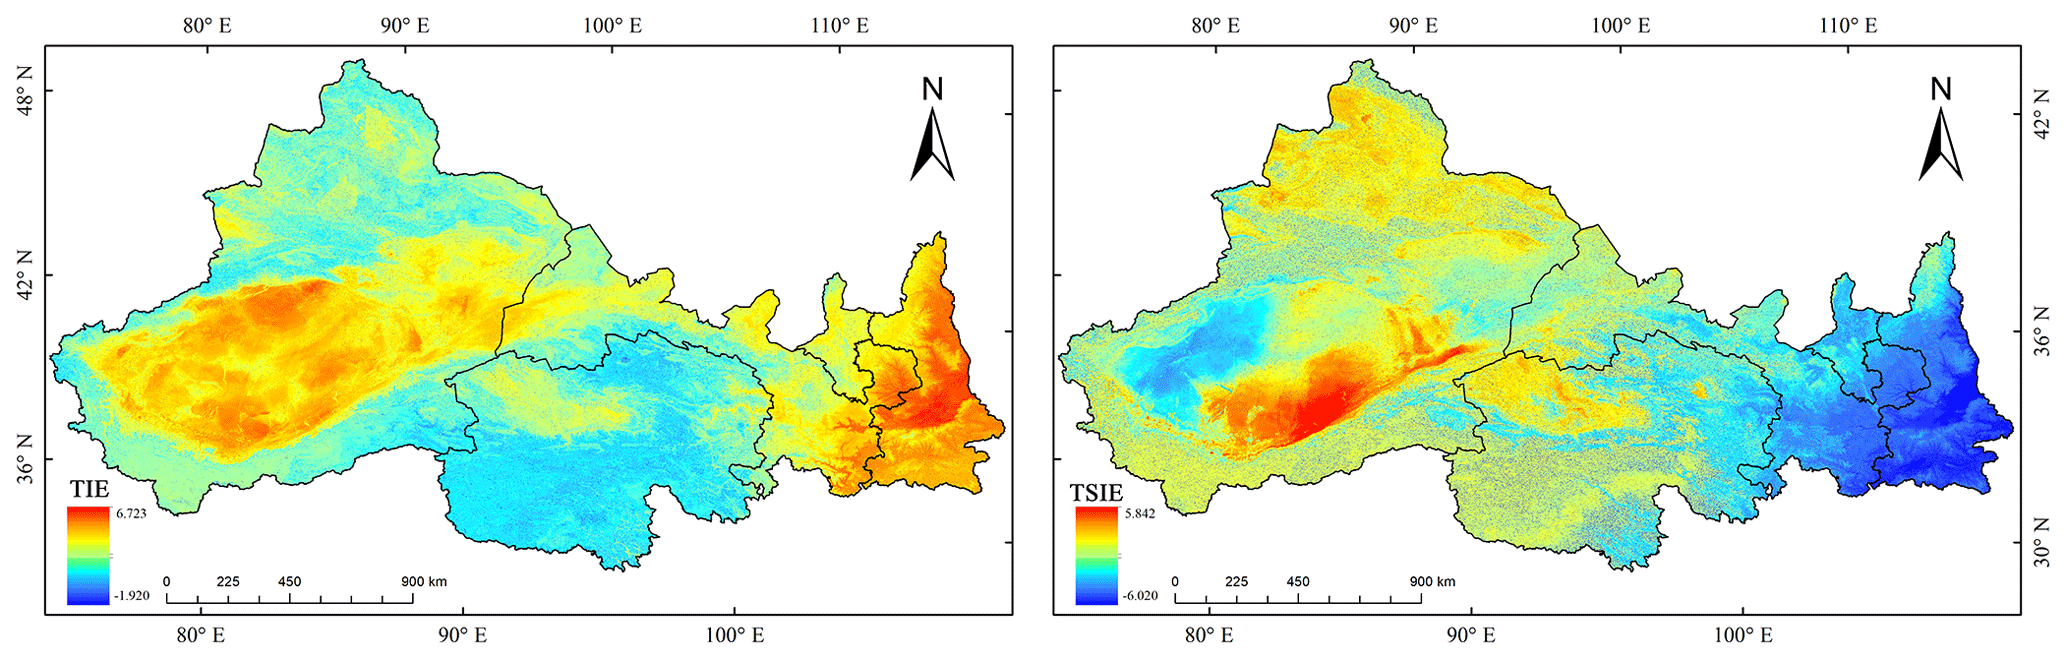
Figure 8Temporal information entropy (TIE) and time-series information entropy (TSIE) of the AOD distribution.
The FEC AOD product, with its high spatial resolution and full coverage over arid and semi-arid areas, provides new possible data sources for further fine-scale research on air pollution in areas with scarce data. Based on the FEC AOD product, we explored the regional distribution characteristics of AODs under different areas and surface coverage types. Figure 9 shows that the AODs in Gansu province were highest in all months, while the AODs in Qinghai province were lowest. From January to December, almost all AODs showed a trend of first increasing and then decreasing, peaking in March and April. Except for Gansu province, where the AODs were bimodal, the other provinces/autonomous regions exhibit unimodal AODs. Figure 10 describes the seasonal AOD distribution under seven different land cover types (forest, grassland, water body, ice and snow, construction land, unused land, and farmland). The AODs over ice and snow were the smallest and continuously decreased from spring to winter. The AODs were at high levels over farmland and construction land, mainly due to human activities. Regardless of the land cover type, the springtime AODs were always highest. Except for ice and snow and unused land, the seasonal AOD distributions were similar among land cover types, first decreasing and then increasing, and autumn had the lowest AOD values.

Figure 9The monthly AOD distribution characteristics in different provinces/autonomous regions. The error bars represent the standard errors.
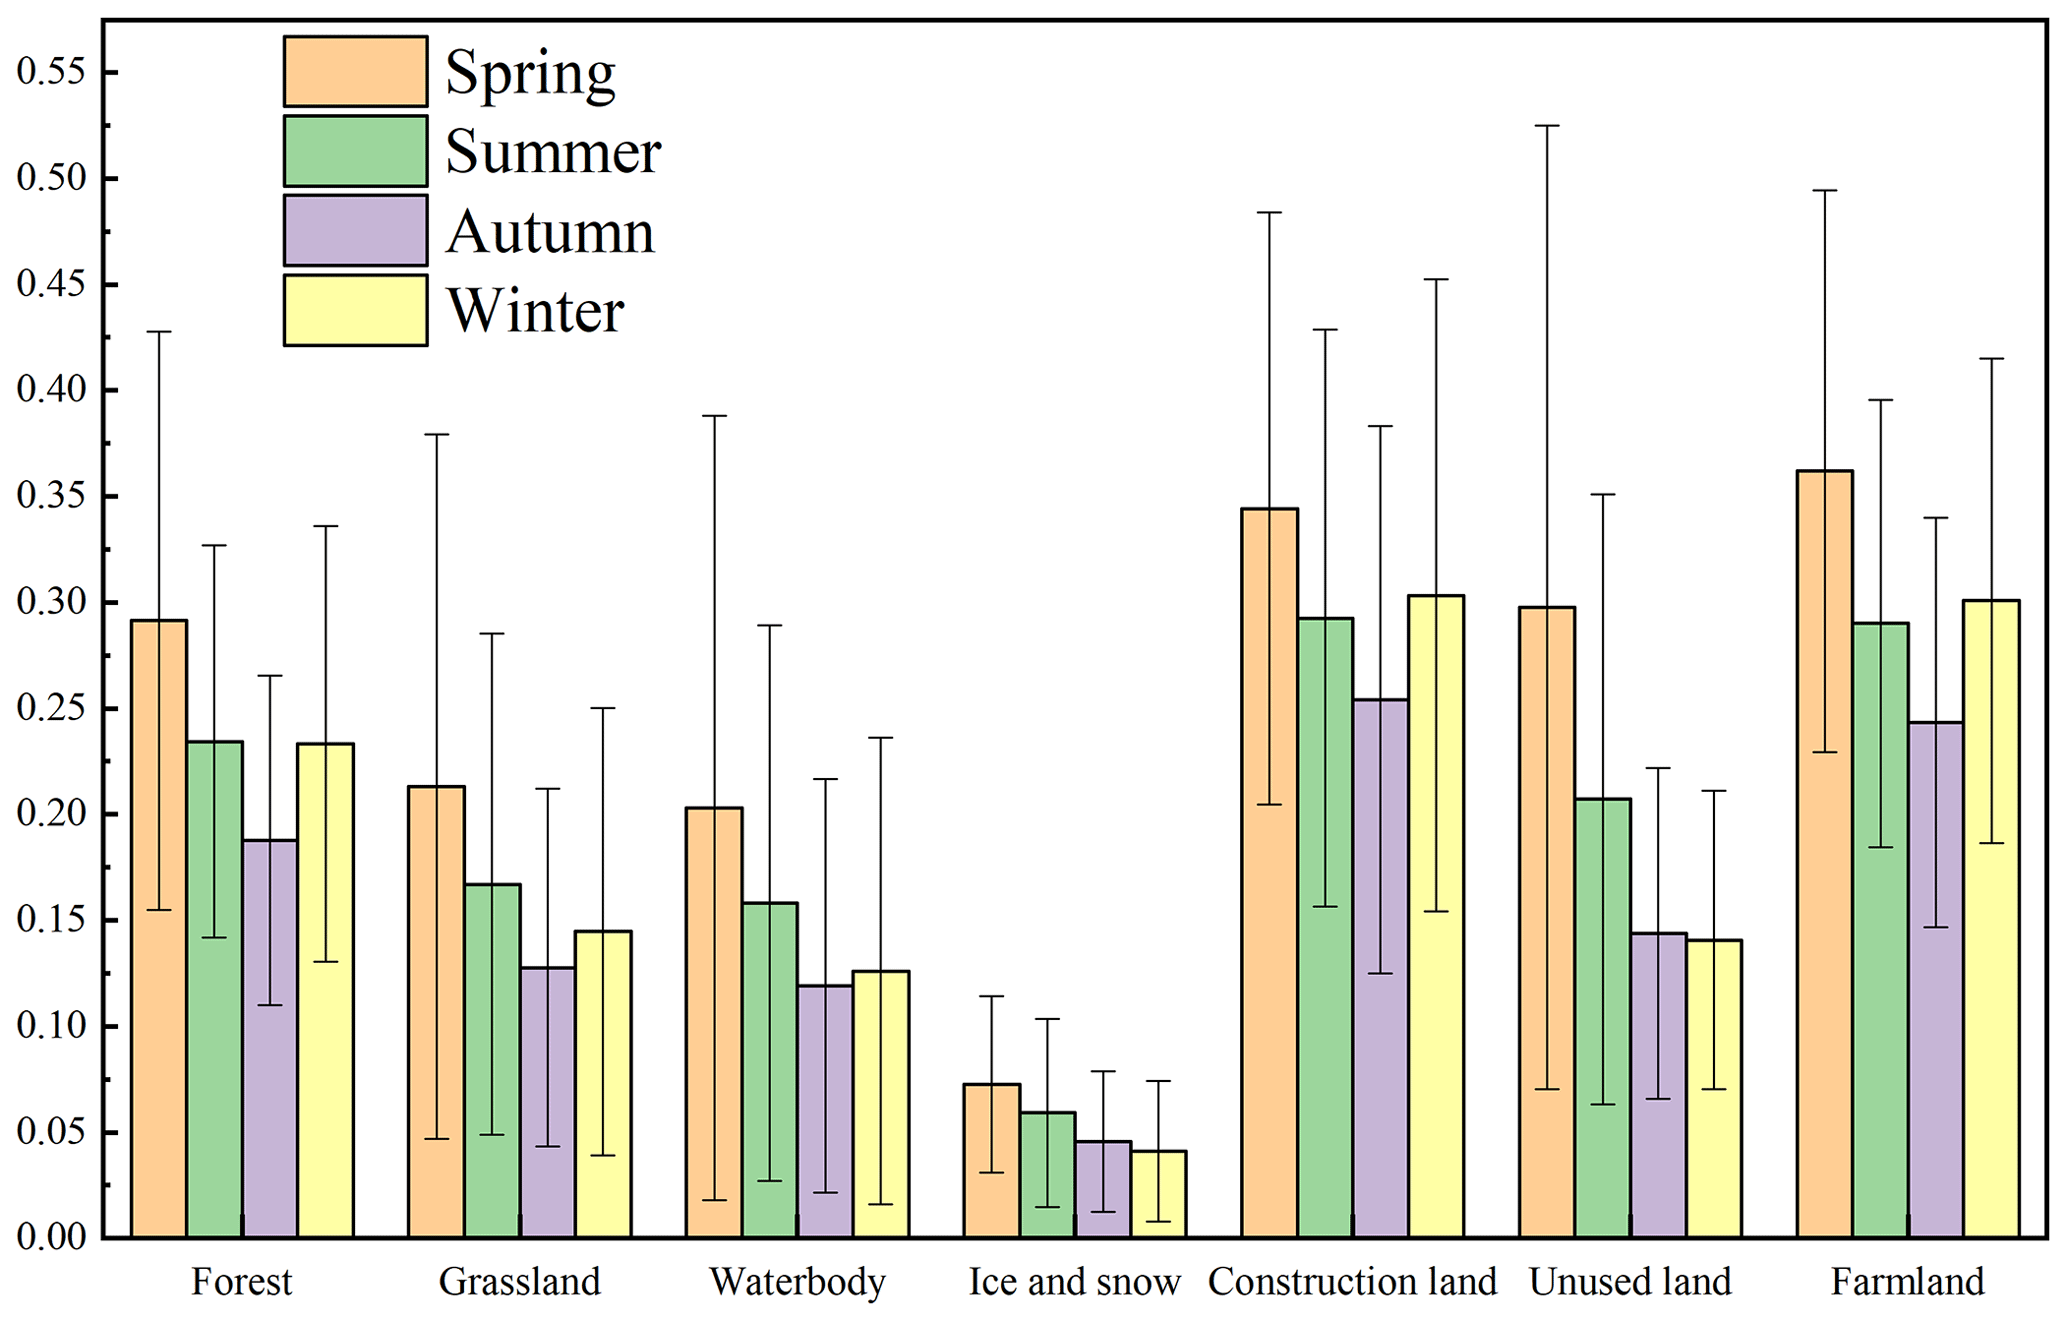
Figure 10The seasonal AOD distributions over different land cover types. The error bars represent the standard errors.
3.4 Variation partitioning of FEC AOD
To examine the contributions of environmental covariates to the FEC AOD dynamics, redundancy analysis (RDA) was used to explore the association between different seasons in the FEC AOD product and environmental covariates. The 12 environmental covariates were divided into three groups: meteorological parameters, surface properties, and terrain factors. The variance proportions driving the FEC AOD variations on different temporal scales were tested from the environmental covariate groups. The variation in the FEC AODs can be interpreted by every group of environmental covariates individually or using the combined variation owing to a set of two or more covariates, and the residual represents the unexplained proportion. The variance partitioning results can be described as Venn diagrams constructing in the R language (Waits et al., 2018). From Table 2 and Fig. 11, the variation partitioning analysis reveals that the meteorological factors still explain a maximal proportion of FEC AOD variance on different temporal scales, followed by the terrain factors, and the surface properties explain the smallest variation; the average contributions of these categories were 77.1 %, 59.1 %, and 50.4 %, respectively. In different seasons, the environmental covariates have different abilities to explain the FEC AODs, and the following order was obtained: winter (86.6 %) > autumn (80.8 %) > spring (79.9 %) > summer (72.5 %). Except in winter, the largest variance was explained by the three groups' environmental covariates, with values of 40.7 %, 38.9 %, and 45.4 % in spring, summer, and autumn, respectively. In winter, the largest variance was explained by meteorological and terrain factors (39.1 %). From spring to winter, the explanatory ability of the three groups of covariates was always highest in autumn, and meteorological parameters, surface properties, and terrain factors reached their lowest values in summer, winter, and spring, respectively.
Table 2Three groups of environmental covariates for AOD variation partitioning.
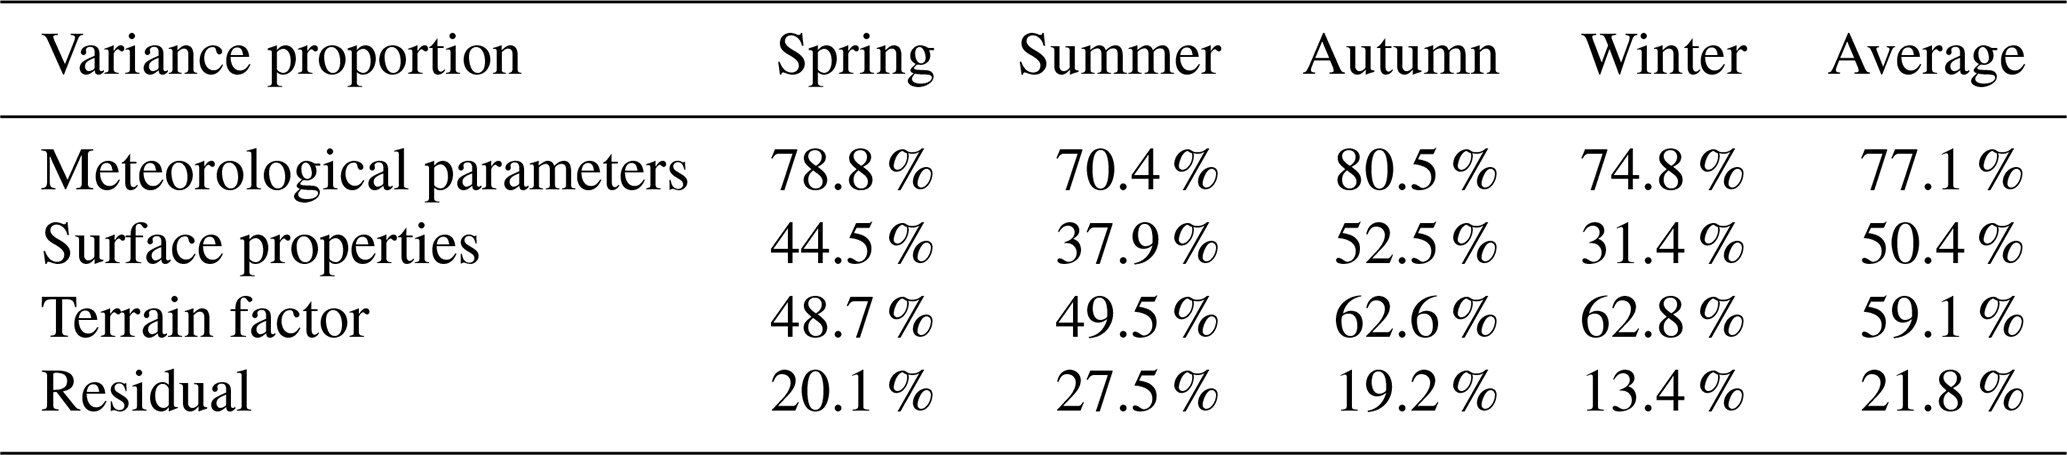
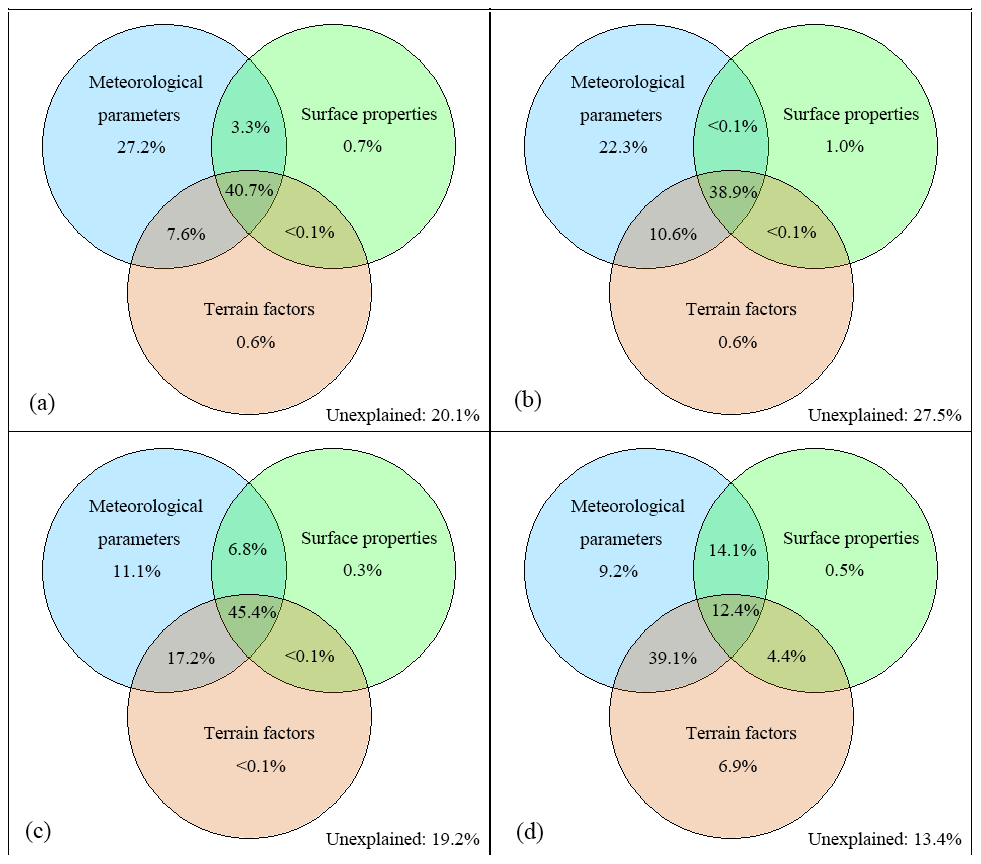
Figure 11Seasonal variation partitioning and average AODs explained in the following seasons: (a) spring; (b) summer; (c) autumn; and (d) winter.
4.1 Model uncertainty
This study, based on the MAIAC AOD product and 12 environmental covariates data, adopts the bagging tree ensemble approach to produce a monthly advanced-performance, full-coverage, and high-resolution FEC AOD product in northwest China. The bagging tree ensemble approach has a strong advantage in feature modeling and prediction, but some problems also exist; for example, most base learners are black boxes, meaning that their explanation capacities are limited (Zounemat-Kermani et al., 2021). Concurrently, the model uncertainty is also an issue to be considered, possibly arising from the setting of hyperparameters and base learners and the sample number selection (Khaledian and Miller, 2020). Therefore, the model robustness is critical for modeling and predicting. Simultaneously, providing mapping uncertainty information helps users better understand the quality of the FEC AOD product in different regions, thus further promoting users' reasonable use of the AOD product. To check the reliability and stability of the simulated AOD model and consider the computing efficiency simultaneously, data representing 1 month were randomly selected (August 2010), and we conducted a 100-iteration, 10-fold cross-validation; that is, we obtained 100 predictions for each pixel and averaged these 100 predictions to obtain the final prediction result (Rodriguez et al., 2010; Wei et al., 2021; Zhang et al., 2021; Ma et al., 2022). Then, we calculated the model uncertainty, specifically by using the standard deviation and upper and lower limits of the 95 % confidence interval (Sect. S1). Following the 100 experiments, the validated R2 value still remained at 0.90, and the RMSE and MAE values ranged from 0.058–0.057 and 0.0319–0.0317, respectively. Concurrently, the case average and uncertainty results are shown in Fig. 12. The FEC AODs were concentrated mainly in the 0–0.6 range, accounting for 96.2 % of all AODs, and the maximum distribution was 0.1–0.2 (36.8 %). The uncertainty was concentrated mainly within the 0.2–0.6 range, accounting for 80.0 %, and the maximum distribution was 0.4–0.5 (38.1 %). We also calculated the average uncertainties corresponding to different FEC AOD levels (Fig. 13). Uncertainties below 0.5 accounted for 77.3 % of the region, and the lowest uncertainty (0.3) corresponded to the largest proportion of the FEC AODs (0.1–0.2). With increasing AODs, the uncertainty also continued to rise; in other words, the high-AOD areas often featured high uncertainty.
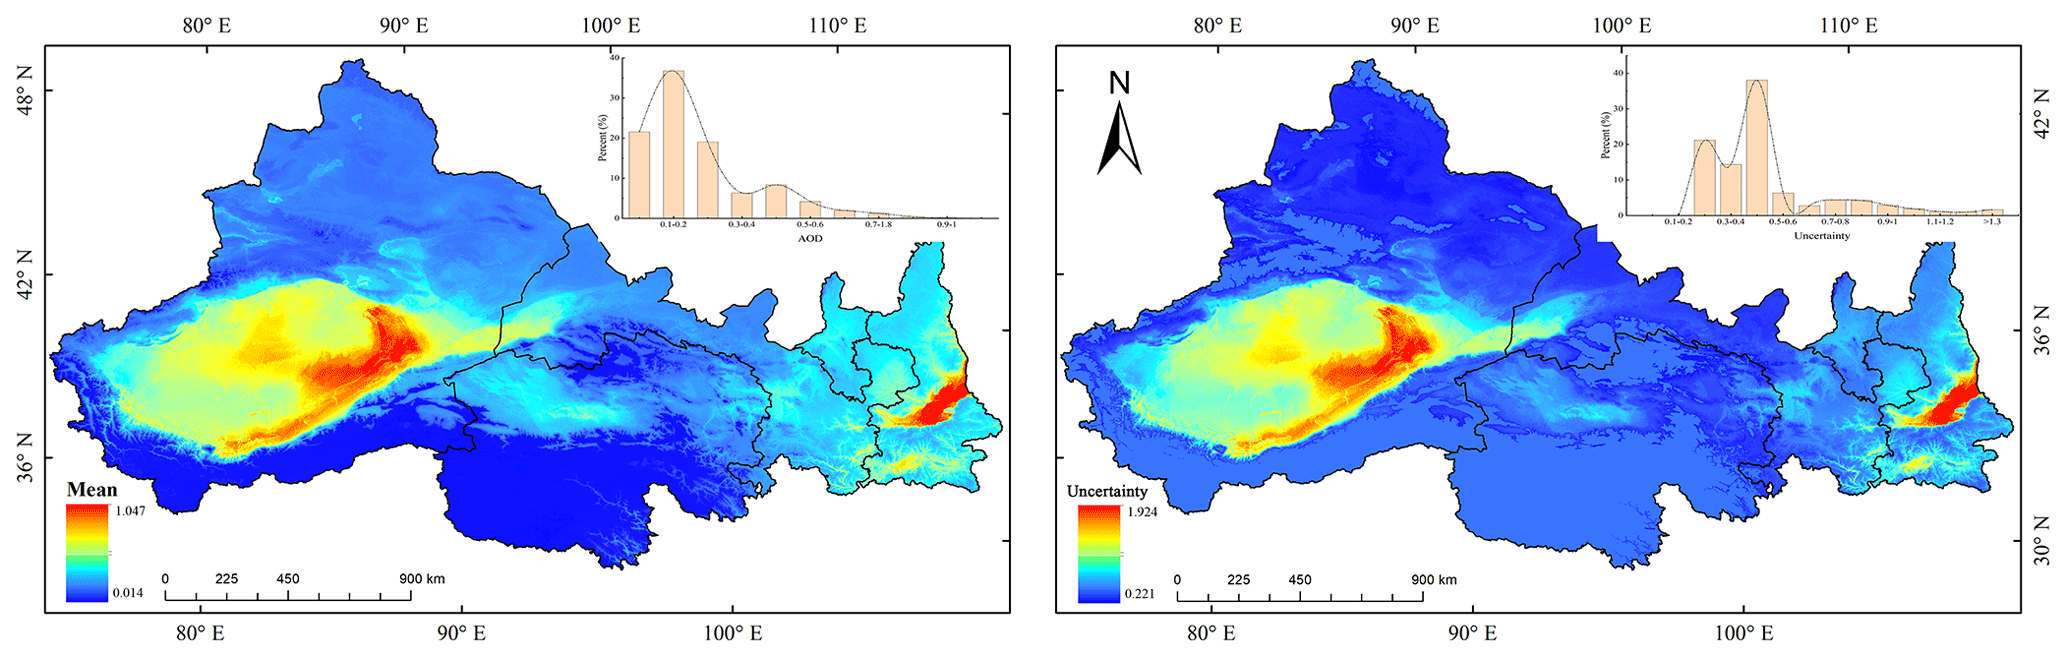
Figure 12Distributions of the mean values and uncertainties in the AOD prediction model.
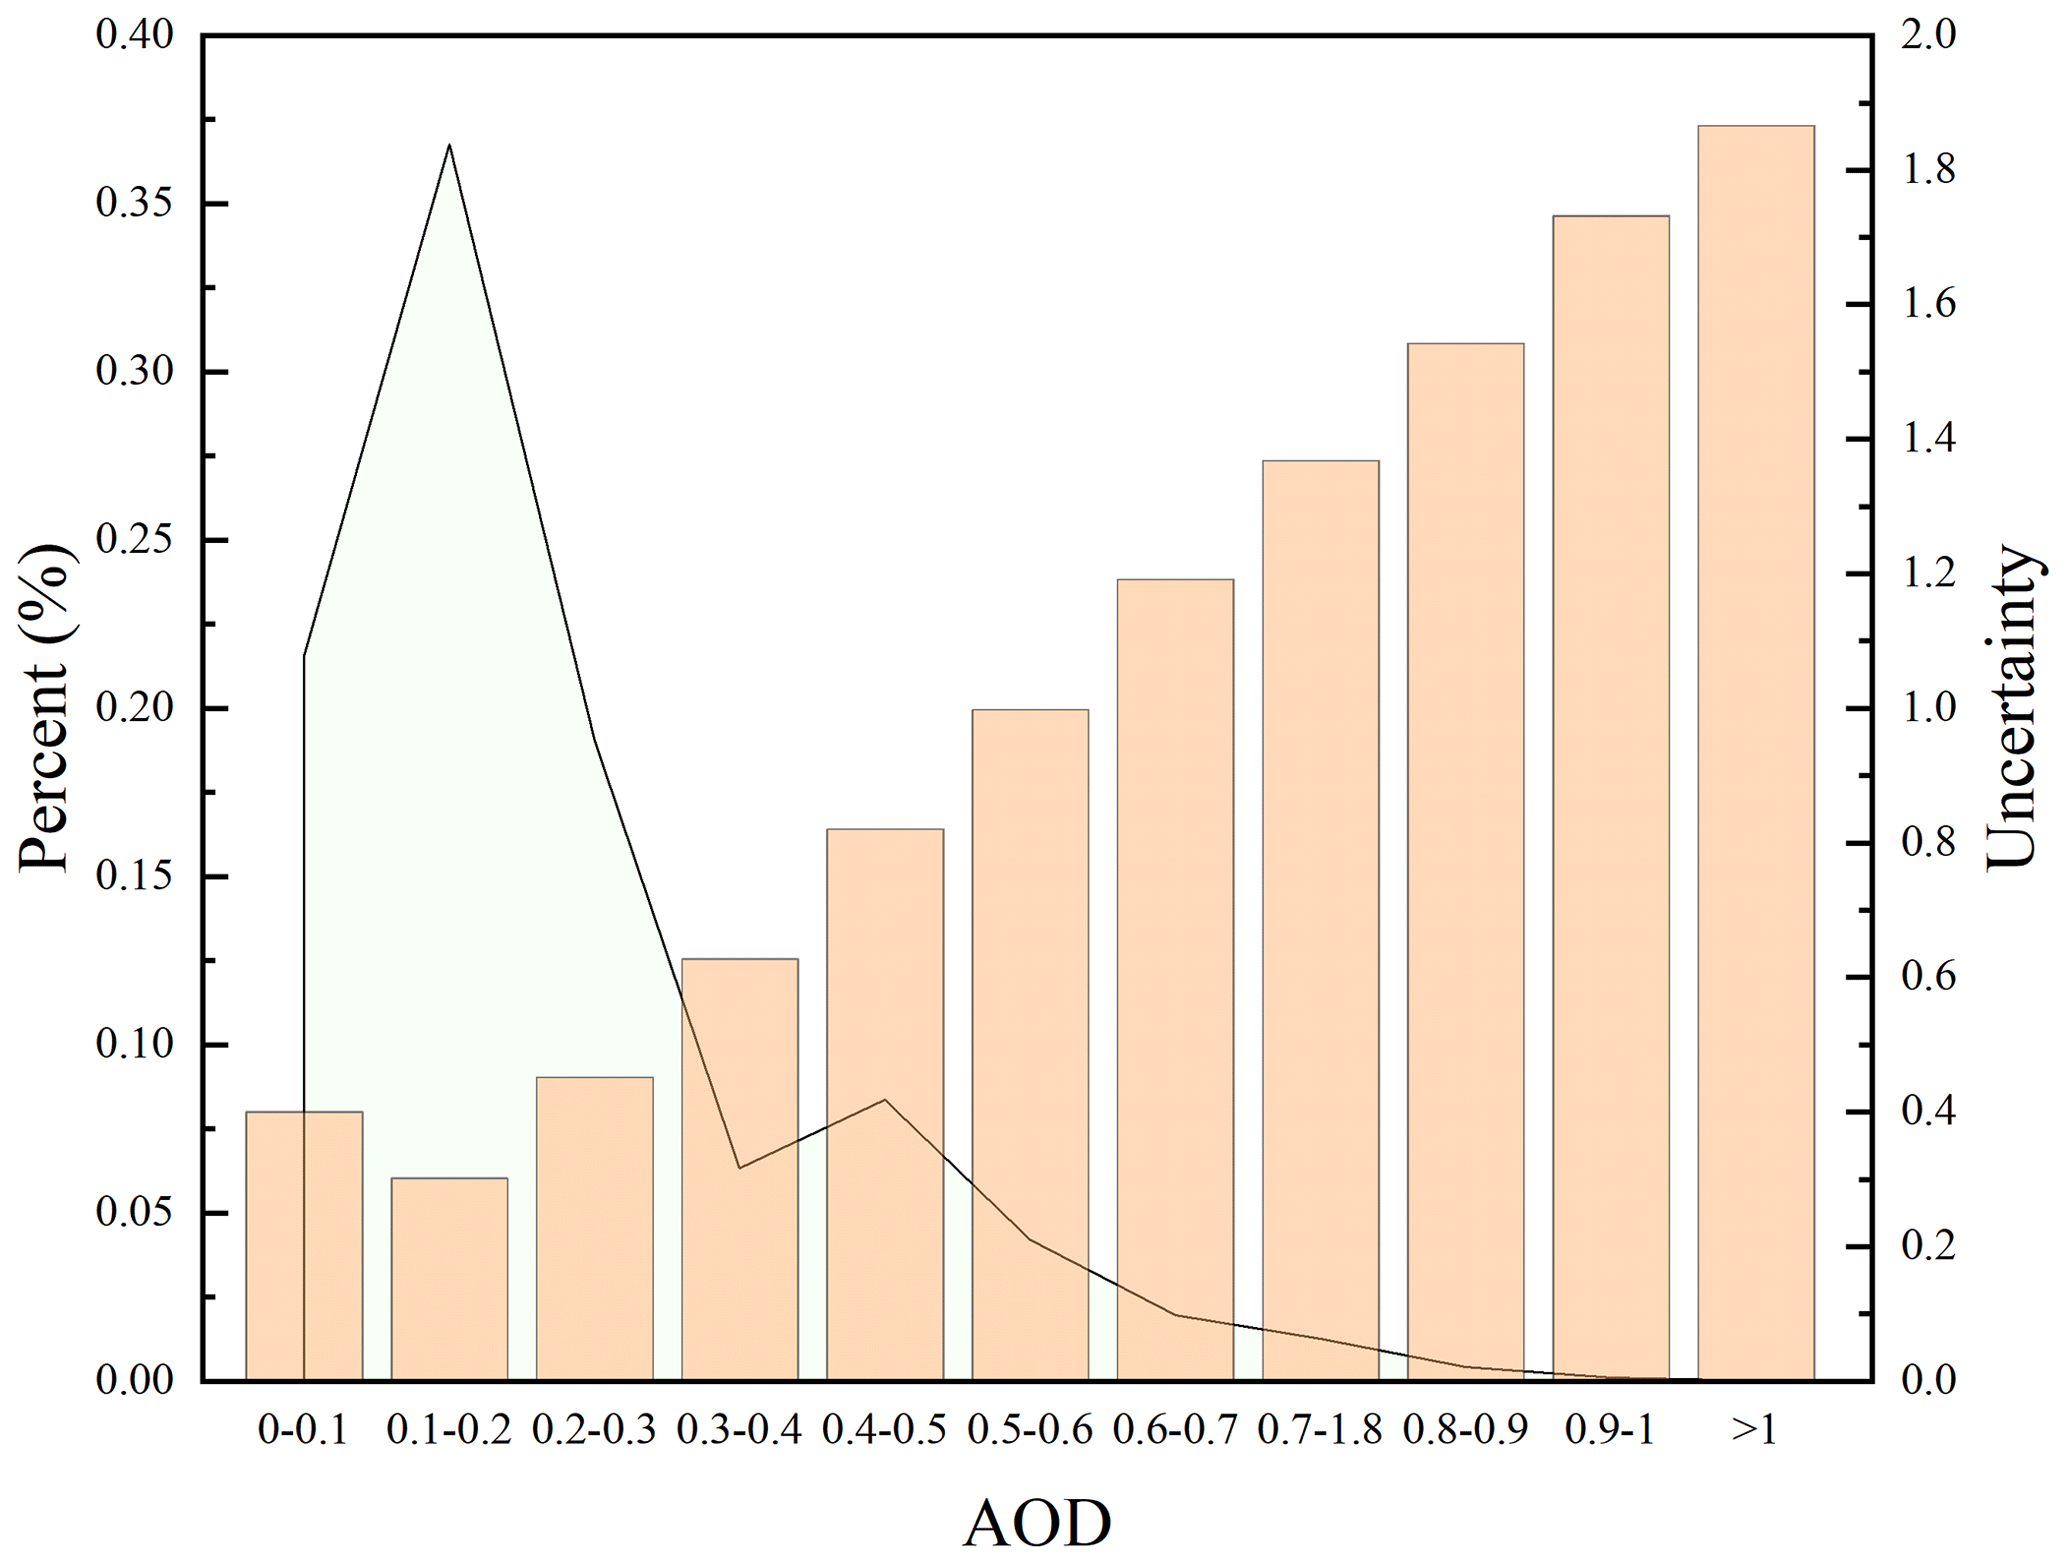
Figure 13The average uncertainties corresponding to different AOD levels. The light-colored area surrounded by the black line denotes the AOD percentage and the histogram bars reflect the uncertainty.
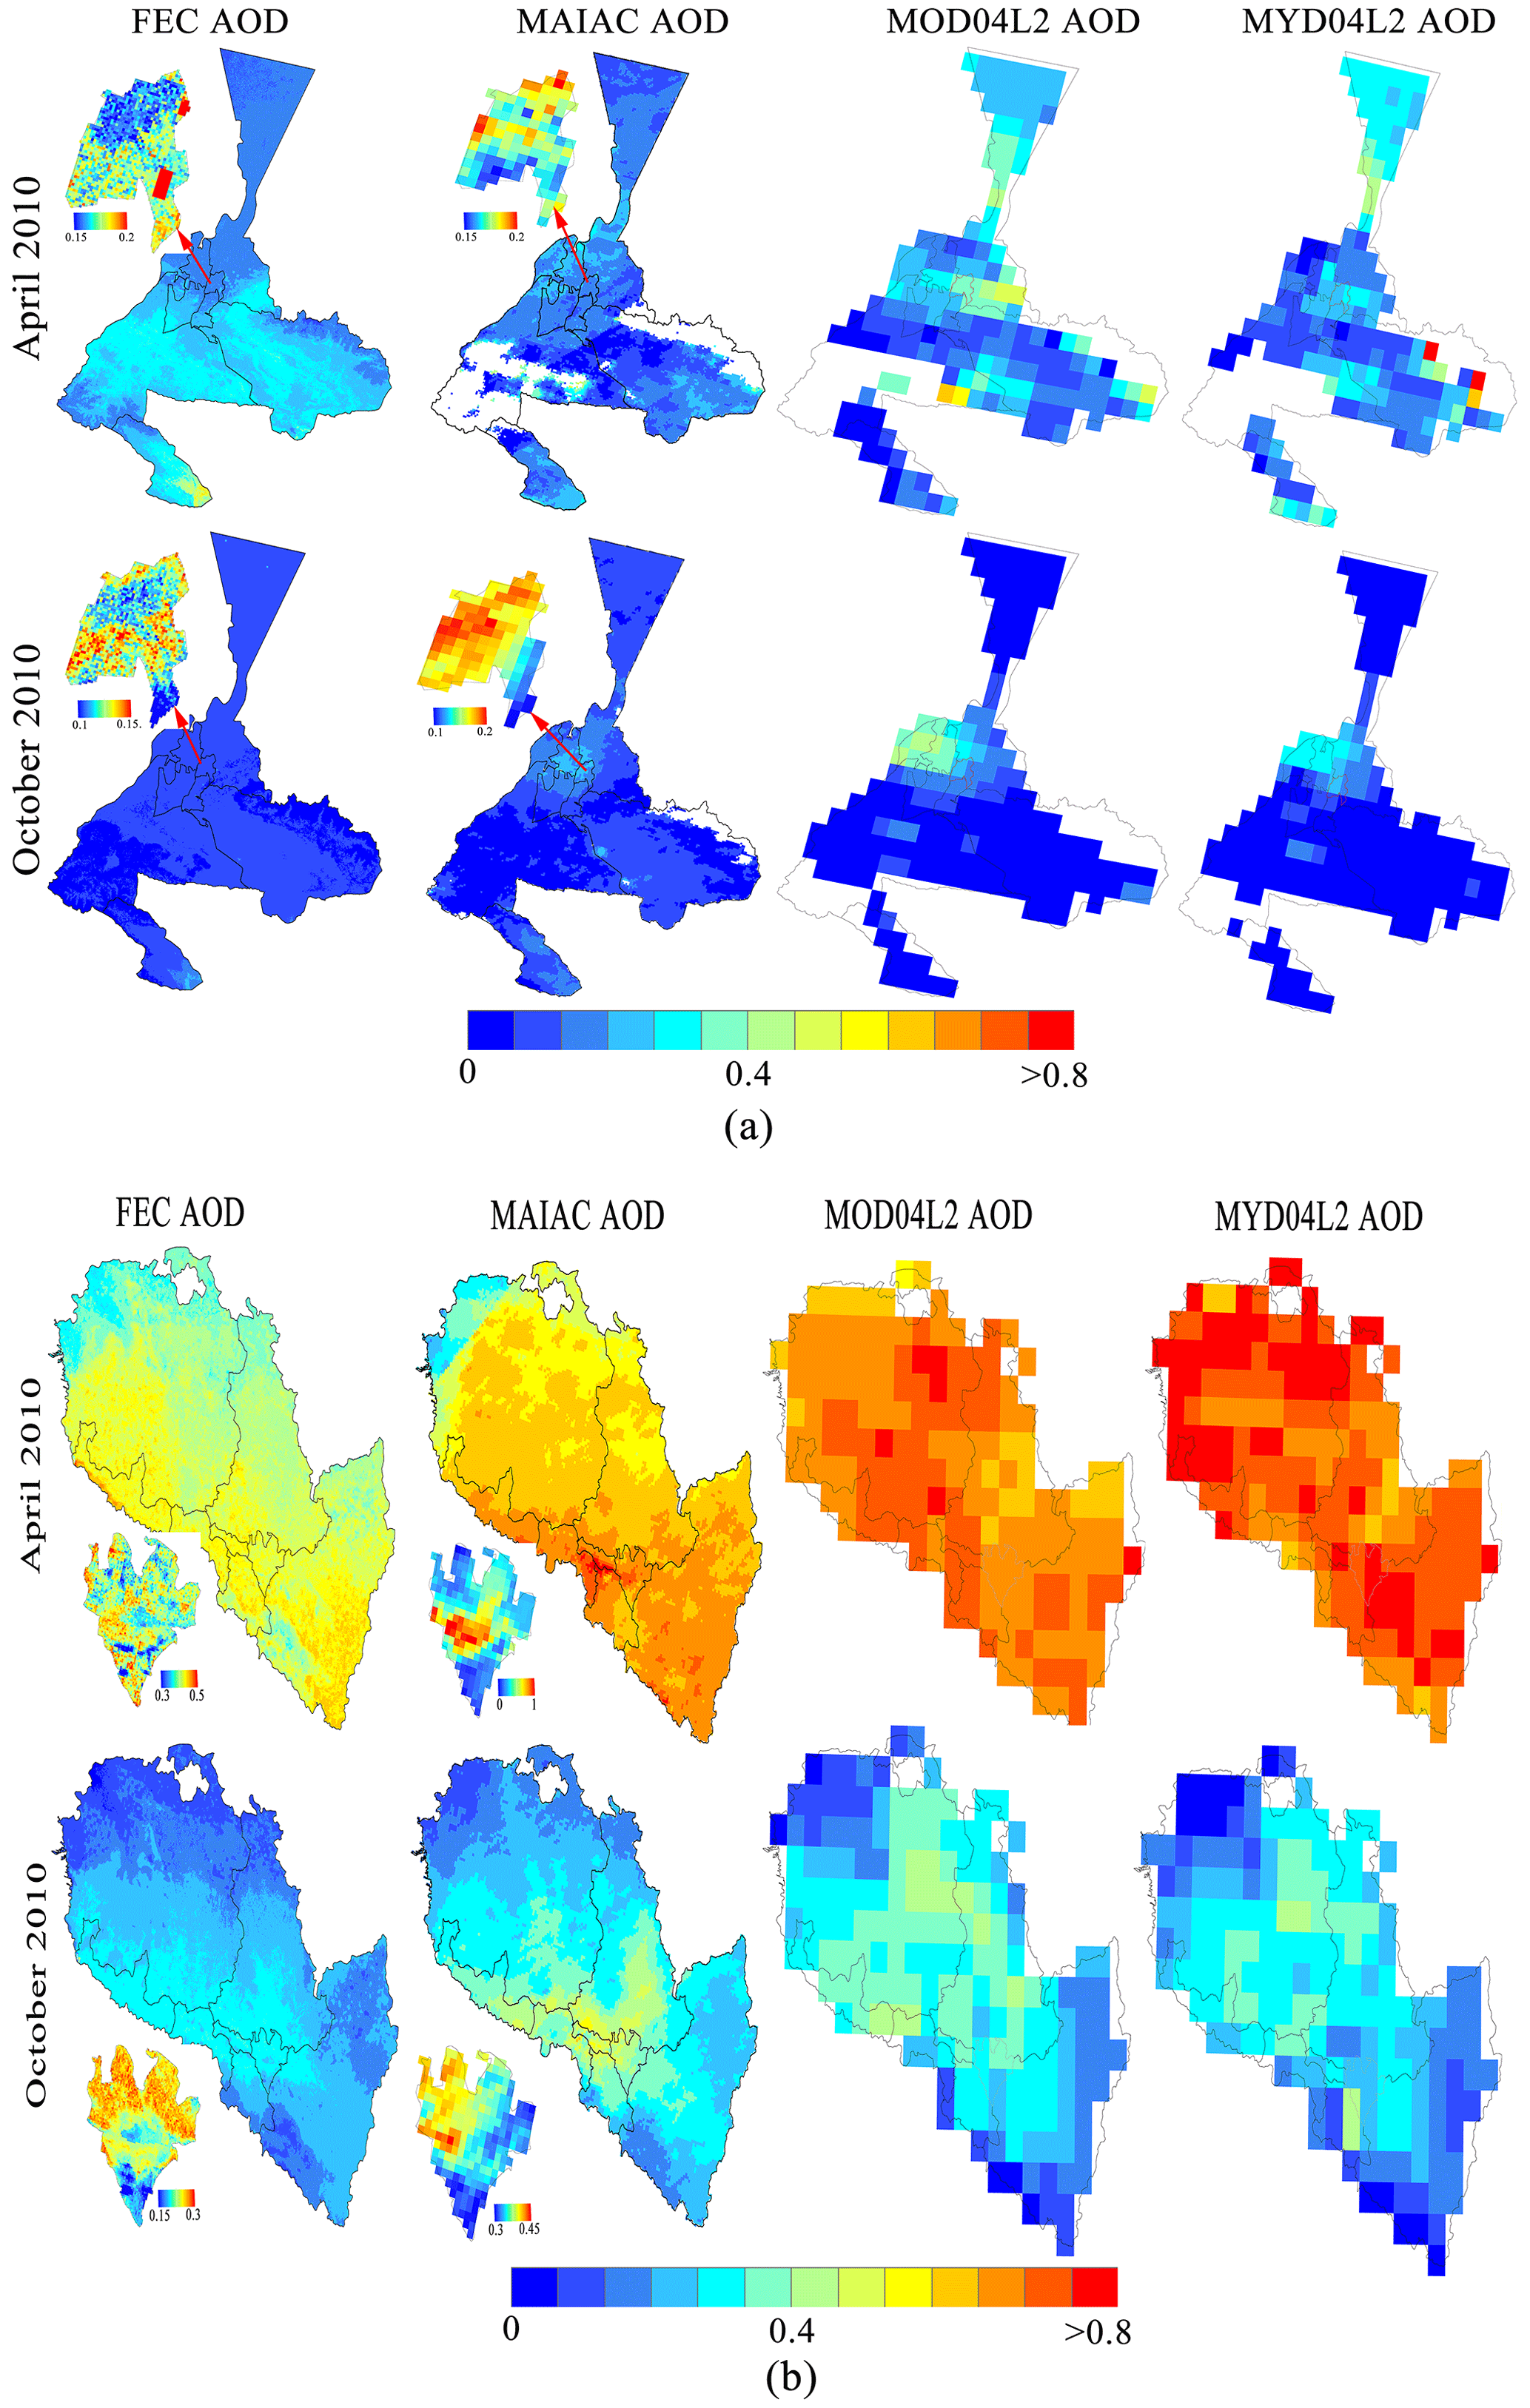
Figure 14The spatial patterns of four AOD products in April and October 2010: (a) Urumqi and (b) Lanzhou.
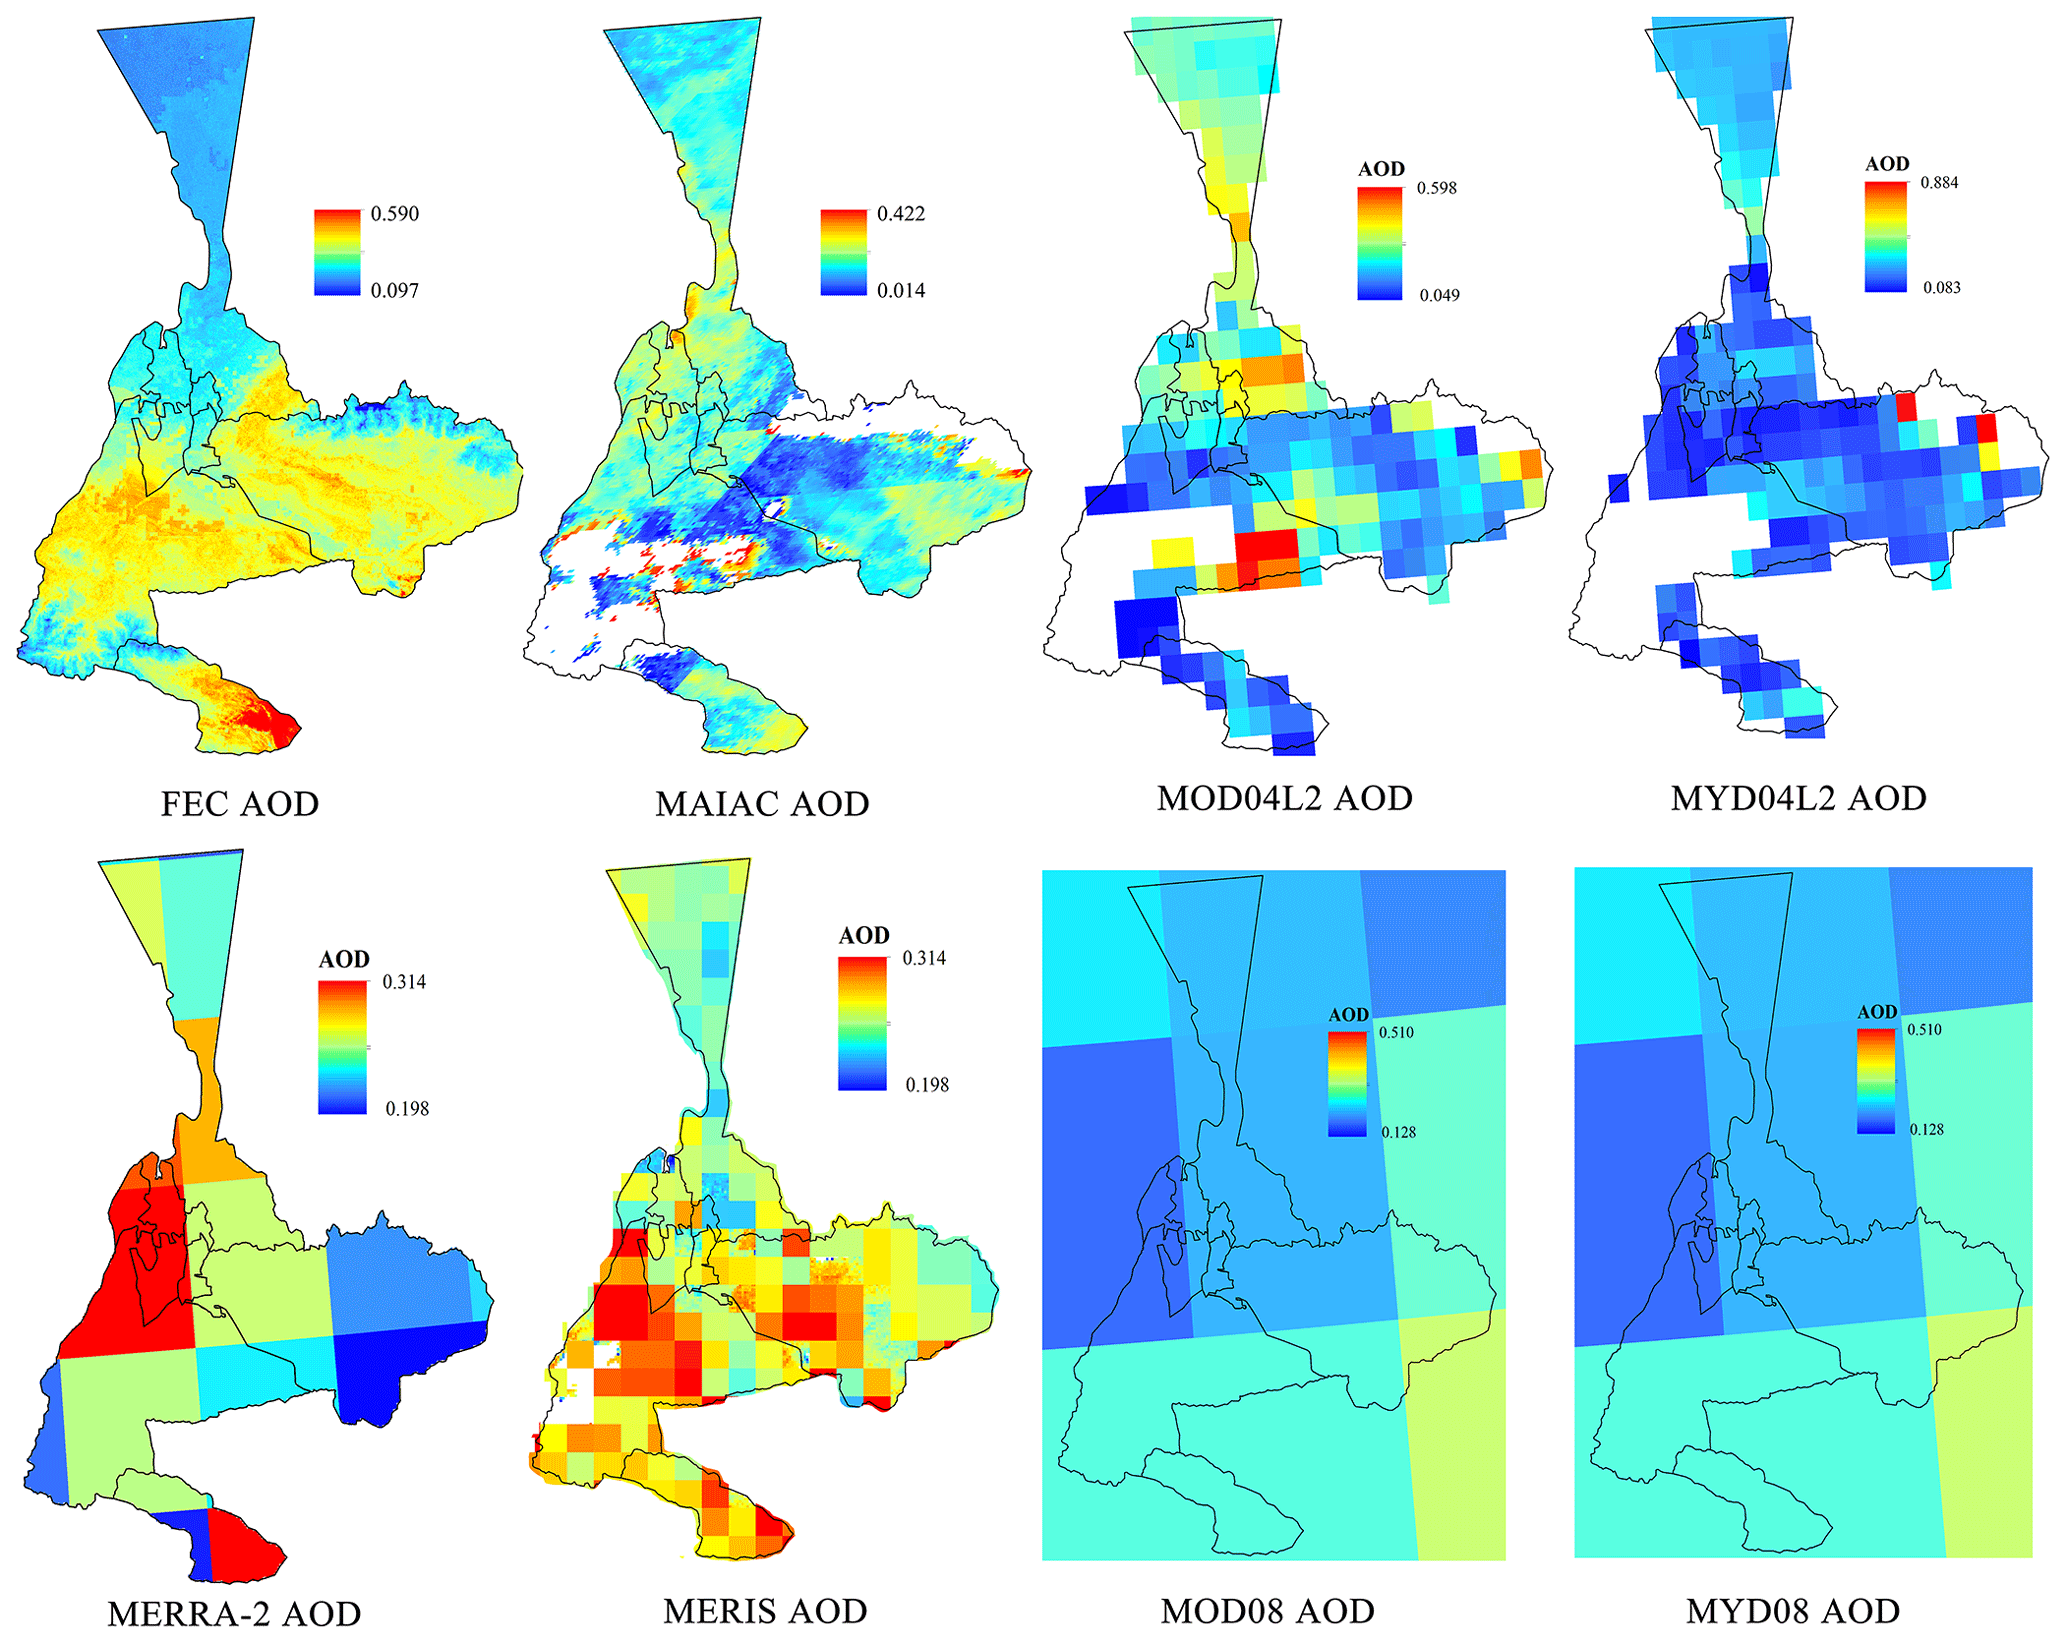
Figure 15The spatial patterns between the FEC AOD product and other AOD products in April 2010 over Urumqi.
4.2 AOD as affected by environmental covariates
The bagging tree ensemble method performance is generally affected by the selection of environmental covariates (Khaledian and Miller, 2020). The prediction accuracy is dependent on input variables, with underpinning static variables, and meteorological factors (dynamic variables) explain most of the AOD variation (Yan et al., 2022). Despite our selection of 12 environmental covariates that could explain most of the AOD variations, approximately 13.4 %–27.5 % of the results could not be well explained, and differences in the interpretation of the environmental covariates existed. Therefore, there is much room for improvement in the optimization of environmental covariates. There is no doubt that the meteorological parameters are the most significant contributors, as the temperature, precipitation, evapotranspiration, and wind speed effectively influence the AOD through direct or indirect interactions in the air (Chen et al., 2020). At the same time, the effect of terrain factors cannot be ignored, as these factors affect the propagation, diffusion, and settlement of the AOD. The surface factors involving the surface cover and soil wetness affect the dust generation and reduction processes. Additionally, some other questions also warrant further research, such as surface properties performance to explain AOD in summer lower spring and examining why the terrain factors have a higher AOD variance analytical power in autumn and winter compared to in spring and summer. We preliminarily speculate that this may be related to multifactor interactions, but this topic needs further analysis. In the following research, we consider introducing more related environmental covariates to try to improve the prediction accuracy. In addition, we plan to further explore the internal correlations among various covariates and the relative contributions of individual covariates to the AOD. Of course, the high spatial resolution and accuracy of the environmental covariates must also be taken into consideration (by adding or replacing data as necessary).
4.3 FEC AOD product for local information characterizations over complex underlying surfaces
Spatial heterogeneity, as the second law of geography, is the source of the scale effects. As a result, the richness of feature information varies in accordance with spatial scales in remote sensing data; in most cases, certain patterns are found only at specific scales (Miller et al., 2015). Complex underlying surfaces are often accompanied by strong spatial heterogeneity and scale effects, which bring great challenges to high-spatial-resolution remote sensing observations and product generation. In this research, the FEC AOD product, which is generated by the way in which MAIAC AOD is constrained by combining dynamic and static variables, was consistent with the MAAC AOD product overall. Specifically, the monthly correlations were all above 0.78 in the study area, and most were higher than 0.9 (N=240, Rmean=0.928, P<0.001, Fig. S3). In addition, the FEC AOD product was also found to be reliable in fine-resolution, long-term trend captures performed on single ecosystems. However, the performance of the FEC AOD product on complex surfaces needs further exploration. Two typical cities (Urumqi and Lanzhou) and 2 months (April and October) were randomly selected to analyze the applicability of the FEC AOD product over complex underlying surfaces, and Shaybak district and Chengguan district were randomly selected for magnification in the cities of Urumqi and Lanzhou, respectively (Fig. 14). Obviously, the MOD04L2 and MYD04L2 AOD products were not suitable for local air quality research because it is difficult to characterize the detailed features of AODs using these products due to their coarse spatial resolutions and excessive no-data values. However, we also identified some evident differences between the FEC AOD and MAIAC AOD products, especially in April 2010 over south-eastern Urumqi. To this end, we quantitatively analyzed the difference between the FEC AOD and MAIAC AOD products in April 2010 over Urumqi (Fig. S9). The FEC AOD and MAIAC AOD products were similar in the north-western region (±0.05, close to the magnitude of 1 standard deviation) but were obviously different in the south-eastern area. Accordingly, we carefully compared multiple AOD products in April 2010 over Urumqi to attempt to identify the reasons for this evident difference and determine its rationality. From Fig. 15, we found significant heterogeneities in some areas, and the portrayal of local AOD features varied from product to product; for example, the FEC, MERRA-2, MERIS, MOD04L2, and MOD08 AOD products showed high values in south-eastern Urumqi. Therefore, we think that the main reasons for the evident difference between the FEC AOD and MAIAC AOD products in south-eastern Urumqi may be as follows: (1) algorithm limitations. The MAIAC algorithm assumes that the surface state is stable over a short period of time, resulting in a large number of high AOD records not being detected in the MAIAC AOD product (Lyapustin et al., 2018, 2011). Certainly, our model and our selection of environmental covariates also introduce some uncertainty, as was systematically discussed above. (2) Scale effects and spatial heterogeneity. Scale effects are common phenomena in remote sensing and are inevitable and difficult to eliminate. When scale effects overlay spatial heterogeneity, it may be difficult for the AOD retrieval algorithm to process data under the existing technology level. In this situation, most modes may have fuzzed or smoothed AOD extrema and thus cannot effectively capture local information. Despite the significant differences in April 2010 over south-eastern Urumqi, we found that the FEC AOD product still has a good ability to capture long-term trends in Urumqi (Figs. S10 and S11). The FEC AOD and MAIAC AOD products have a close relationship in Midong district (R=0.811) and Dabancheng district, while these products have the lowest relationship in Shaybak district (R=0.620). In summary, the evident differences between the FEC AOD and MAIAC AOD products in some highly heterogeneous areas are objective and reasonable in some way, but there is still much research to be done to determine which AOD products are the most reliable in portraying local features.
This monthly advanced-performance, full-coverage, high-resolution AOD dataset (FEC AOD) constructed over northwest China in this study is freely available via https://doi.org/10.5281/zenodo.5727119 (Chen et al., 2021b).
In this paper, a monthly advanced-performance, full-coverage, high-resolution AOD dataset was produced based on the MAIAC AOD product and multiple environmental covariates and utilizing a machine learning method from 2000 to 2019 in the northwest region of China. AERONET and MODIS AOD data were collected to verify the applicability of the FEC AOD product. Then, the spatiotemporal changes reflected in FEC AOD product are analyzed, and an interpretation of the contributions of environmental covariates to the FEC AOD product is explored. The results show that the FEC AOD effectively compensates for the deficiency and constraints of in situ observation and satellite AOD products. Moreover, the FEC AOD product demonstrates a reliable performance and ability to capture local information and long-term trends, even superior to the abilities of the MAIAC and MxD04L2 AOD products; these findings also indicate the necessity of high-spatial-resolution AOD data. The spatial patterns are consistent among different years and greatly differ at the seasonal level. The higher the AOD is, the stronger the temporal variability is. The AODs exhibit a dramatic decrease on the Loess Plateau and an evident increase in the south-eastern Taklimakan Desert between 2000 and 2019. Farmland and construction land have high AOD levels compared to other land cover types. The meteorological factors demonstrated the maximum interpretation ability of AODs on all analyzed temporal scales, while the capability of environmental covariates to explain AODs varies seasonally.
The supplement related to this article is available online at: https://doi.org/10.5194/essd-14-5233-2022-supplement.
XCh designed and developed the methodology and software, conducted the analysis and validation, and wrote the paper. HZ supported and supervised the study. ZiZ developed the methodology and reviewed the paper. XCa and JD investigated and developed the methodology. CZ and ZhZ performed the conceptualization of and investigations in this study. JW supported and supervised the study and reviewed the paper.
The contact author has declared that none of the authors has any competing interests.
Publisher's note: Copernicus Publications remains neutral with regard to jurisdictional claims in published maps and institutional affiliations.
The authors are grateful to the Atmosphere Archive and Distribution System (https://search.earthdata.nasa.gov, last access: 28 June 2021) and AERONET (http://aeronet.gsfc.nasa.gov, last access: 31 May 2021), for providing extensive data support for our research. The authors also thank the anonymous referee, who provided constructive comments that improved the paper.
This research has been supported by the Second Tibetan Plateau Scientific Expedition and Research Program (STEP; grant no. 2019QZKK0103), Basic Research Program of Shenzhen (grant no. 20220811173316001), Guangdong Basic and Applied Basic Research Foundation (grant no. 2020A1515111142), Key Laboratory of Spatial Data Mining and Information Sharing of Ministry of Education, Fuzhou University (grant no. 2022LSDMIS05), and the Open Research Fund of Key Laboratory of Digital Earth Science, Aerospace Information Research Institute Chinese Academy of Sciences, Chinese Academy of Sciences (grant no. 2022LDE007).
This paper was edited by David Carlson and reviewed by two anonymous referees.
Ali, M. A. and Assiri, M.: Analysis of AOD from MODIS-Merged DT–DB Products Over the Arabian Peninsula, Earth Syst. Environ., 3, 625–636, https://doi.org/10.1007/s41748-019-00108-x, 2019.
Ali, G., Bao, Y., Boiyo, R., Tang, W., Lu, Q., and Min, J.: Evaluating MODIS and MISR aerosol optical depth retrievals over environmentally distinct sites in Pakistan, J. Atmos. Solar-Terr. Phy., 183, 19–35, https://doi.org/10.1016/j.jastp.2018.12.008, 2019.
Almazroui, M.: A comparison study between AOD data from MODIS deep blue collections 51 and 06 and from AERONET over Saudi Arabia, Atmos. Res., 225, 88–95, https://doi.org/10.1016/j.atmosres.2019.03.040, 2019.
Ångström, A.: The parameters of atmospheric turbidity, Tellus, 16, 64–75, https://doi.org/10.1016/0038-092X(65)90225-2, 1964.
Bilal, M., Nichol, J. E., and Wang, L.: New customized methods for improvement of the MODIS C6 Dark Target and Deep Blue merged aerosol product, Remote Sens. Environ., 197, 115–124, https://doi.org/10.1016/j.rse.2017.05.028, 2017.
Breiman, L.: Bagging predictors, Mach. Learn., 24, 123–140, https://doi.org/10.1007/BF00058655, 1996.
Chen, B., Song, Z., Pan, F., and Huang, Y.: Obtaining vertical distribution of PM2.5 from CALIOP data and machine learning algorithms, Sci. Total Environ., 805, 150338, https://doi.org/10.1016/j.scitotenv.2021.150338, 2022.
Chen, X., Ding, J., Wang, J., Ge, X., Raxidin, M., Liang, J., Chen, X., Zhang, Z., Cao, X., and Ding, Y.: Retrieval of Fine-Resolution Aerosol Optical Depth (AOD) in Semiarid Urban Areas Using Landsat Data: A Case Study in Urumqi, NW China, Remote Sens., 12, 467, https://doi.org/10.3390/rs12030467, 2020.
Chen, X., Ding, J., Liu, J., Wang, J., Ge, X., Wang, R., and Zuo, H.: Validation and comparison of high-resolution MAIAC aerosol products over Central Asia, Atmos. Environ., 251, 118273, https://doi.org/10.1016/j.atmosenv.2021.118273, 2021a.
Chen, X., Zuo, H., Zhang, Z., Cao, X., Duan, J., Wang, J., Zhu, C., Zhang, Z.: High-resolution and full coverage AOD downscaling based on the bagging model over the arid and semi-arid areas, NW China, Zenodo [data set], https://doi.org/10.5281/zenodo.5727119, 2021b.
Ding, H. and Xingming, H.: Spatiotemporal change and drivers analysis of desertification in the arid region of northwest China based on geographic detector, Environ. Challenges, 4, 100082, https://doi.org/10.1016/j.envc.2021.100082, 2021.
Duveiller, G., Filipponi, F., Walther, S., Köhler, P., Frankenberg, C., Guanter, L., and Cescatti, A.: A spatially downscaled sun-induced fluorescence global product for enhanced monitoring of vegetation productivity, Earth Syst. Sci. Data, 12, 1101–1116, https://doi.org/10.5194/essd-12-1101-2020, 2020.
Ebrahimi, N., Soofi, E. S., and Soyer, R.: Information Measures in Perspective, Int. Stat. Rev., 78, 383–412, https://doi.org/10.1111/j.1751-5823.2010.00105.x, 2010.
Fan, W., Qin, K., Cui, Y., Li, D., and Bilal, M.: Estimation of Hourly Ground-Level PM2.5 Concentration Based on Himawari-8 Apparent Reflectance, IEEE T. Geosci. Remote, 59, 76–85, https://doi.org/10.1109/TGRS.2020.2990791, 2020.
Feng, F. and Wang, K.: Merging ground-based sunshine duration observations with satellite cloud and aerosol retrievals to produce high-resolution long-term surface solar radiation over China, Earth Syst. Sci. Data, 13, 907–922, https://doi.org/10.5194/essd-13-907-2021, 2021.
Ge, Y., Abuduwaili, J., Ma, L., Wu, N., and Liu, D.: Potential transport pathways of dust emanating from the playa of Ebinur Lake, Xinjiang, in arid northwest China, Atmos. Res., 178–179, 196–206, https://doi.org/10.1016/j.atmosres.2016.04.002, 2016.
Giles, D. M., Sinyuk, A., Sorokin, M. G., Schafer, J. S., Smirnov, A., Slutsker, I., Eck, T. F., Holben, B. N., Lewis, J. R., Campbell, J. R., Welton, E. J., Korkin, S. V., and Lyapustin, A. I.: Advancements in the Aerosol Robotic Network (AERONET) Version 3 database – automated near-real-time quality control algorithm with improved cloud screening for Sun photometer aerosol optical depth (AOD) measurements, Atmos. Meas. Tech., 12, 169–209, https://doi.org/10.5194/amt-12-169-2019, 2019.
Goldberg, D. L., Gupta, P., Wang, K., Jena, C., Zhang, Y., Lu, Z., and Streets, D. G.: Using gap-filled MAIAC AOD and WRF-Chem to estimate daily PM2.5 concentrations at 1 km resolution in the Eastern United States, Atmos. Environ., 199, 443–452, https://doi.org/10.1016/j.atmosenv.2018.11.049, 2019.
González, S., García, S., Del Ser, J., Rokach, L., and Herrera, F.: A practical tutorial on bagging and boosting based ensembles for machine learning: Algorithms, software tools, performance study, practical perspectives and opportunities, Information Fusion, 64, 205–237, https://doi.org/10.1016/j.inffus.2020.07.007, 2020.
He, Q., Gu, Y., and Zhang, M.: Spatiotemporal trends of PM2.5 concentrations in central China from 2003 to 2018 based on MAIAC-derived high-resolution data, Environ. Int., 137, 105536, https://doi.org/10.1016/j.envint.2020.105536, 2020.
Hengl, T., de Jesus, J. M., Heuvelink, G. B. M., Gonzalez, M. R., Kilibarda, M., Blagotic, A., Shangguan, W., Wright, M. N., Geng, X., Bauer-Marschallinger, B., Guevara, M. A., Vargas, R., MacMillan, R. A., Batjes, N. H., Leenaars, J. G. B., Ribeiro, E., Wheeler, I., Mantel, S., and Kempen, B.: SoilGrids250m: Global gridded soil information based on machine learning, Plos One, 12, e0169748, https://doi.org/10.1371/journal.pone.0169748, 2017.
Holben, B. N., Eck, T. F., Slutsker, I., Tanre, D., Buis, J., Setzer, A., Vermote, E., Reagan, J. A., Kaufman, Y., and Nakajima, T.: AERONET – A federated instrument network and data archive for aerosol characterization, Remote Sens. Environ., 66, 1–16, https://doi.org/10.1016/S0034-4257(98)00031-5, 1998.
Huang, J., Yu, H., Dai, A., Wei, Y., and Kang, L.: Drylands face potential threat under 2 C global warming target, Nat. Clim. Change, 7, 417–422, https://doi.org/10.1038/nclimate3275, 2017.
Jasiewicz, J. and Stepinski, T. F.: Geomorphons – a pattern recognition approach to classification and mapping of landforms, Geomorphology, 182, 147–156, https://doi.org/10.1016/j.geomorph.2012.11.005, 2013.
Kaufman, Y. J., Tanré, D., and Boucher, O.: A satellite view of aerosols in the climate system, Nature, 419, 215, https://doi.org/10.1038/nature01091, 2002.
Khaledian, Y. and Miller, B. A.: Selecting appropriate machine learning methods for digital soil mapping, Appl. Math. Model., 81, 401–418, https://doi.org/10.1016/j.apm.2019.12.016, 2020.
Lelieveld, J., Klingmüller, K., Pozzer, A., Burnett, R. T., Haines, A., and Ramanathan, V.: Effects of fossil fuel and total anthropogenic emission removal on public health and climate, P. Natl. Acad. Sci., 116, 7192–7197, https://doi.org/10.1073/pnas.1819989116, 2019.
Levy, R. C., Remer, L. A., Kleidman, R. G., Mattoo, S., Ichoku, C., Kahn, R., and Eck, T. F.: Global evaluation of the Collection 5 MODIS dark-target aerosol products over land, Atmos. Chem. Phys., 10, 10399–10420, https://doi.org/10.5194/acp-10-10399-2010, 2010.
Li, K., Bai, K., Ma, M., Guo, J., Li, Z., Wang, G., and Chang, N.-B.: Spatially gap free analysis of aerosol type grids in China: First retrieval via satellite remote sensing and big data analytics, ISPRS J. Photogramm. Remote Sens., 193, 45–59, https://doi.org/10.1016/j.isprsjprs.2022.09.001, 2022.
Li, L., Lurmann, F., Habre, R., Urman, R., Rappaport, E., Ritz, B., Chen, J. C., Gilliland, F., and Wu, J.: Constrained Mixed-Effect Models with Ensemble Learning for Prediction of Nitrogen Oxides Concentrations at High Spatiotemporal Resolution, Environ. Sci. Technol., 51, 9920–9929, https://doi.org/10.1021/acs.est.7b01864, 2017.
Li, L., Zhang, J., Meng, X., Fang, Y., Ge, Y., Wang, J., Wang, C., Wu, J., and Kan, H.: Estimation of PM2.5 concentrations at a high spatiotemporal resolution using constrained mixed-effect bagging models with MAIAC aerosol optical depth, Remote Sens. Environ., 217, 573–586, https://doi.org/10.1016/j.rse.2018.09.001, 2018.
Li, L., Franklin, M., Girguis, M., Lurmann, F., Wu, J., Pavlovic, N., Breton, C., Gilliland, F., and Habre, R.: Spatiotemporal imputation of MAIAC AOD using deep learning with downscaling, Remote Sens. Environ., 237, 111584, https://doi.org/10.1016/j.rse.2019.111584, 2020.
Liang, T., Sun, L., and Li, H.: MODIS aerosol optical depth retrieval based on random forest approach, Remote Sens. Lett., 12, 179–189, https://doi.org/10.1080/2150704X.2020.1842540, 2021.
Lyapustin, A., Wang, Y., Laszlo, I., Kahn, R., Korkin, S., Remer, L., Levy, R., and Reid, J. S.: Multiangle implementation of atmospheric correction (MAIAC): 2. Aerosol algorithm, J. Geophys. Res.-Atmos., 116, 0148–0227, https://doi.org/10.1029/2010JD014986, 2011.
Lyapustin, A., Wang, Y., Korkin, S., and Huang, D.: MODIS Collection 6 MAIAC algorithm, Atmos. Meas. Tech., 11, 5741–5765, https://doi.org/10.5194/amt-11-5741-2018, 2018.
Ma, R., Ban, J., Wang, Q., Zhang, Y., Yang, Y., Li, S., Shi, W., Zhou, Z., Zang, J., and Li, T.: Full-coverage 1 km daily ambient PM2.5 and O3 concentrations of China in 2005–2017 based on a multi-variable random forest model, Earth Syst. Sci. Data, 14, 943–954, https://doi.org/10.5194/essd-14-943-2022, 2022.
Ma, Z., Shi, Z., Zhou, Y., Xu, J., Yu, W., and Yang, Y.: A spatial data mining algorithm for downscaling TMPA 3B43 V7 data over the Qinghai–Tibet Plateau with the effects of systematic anomalies removed, Remote Sens. Environ., 200, 378–395, https://doi.org/10.1016/j.rse.2017.08.023, 2017.
Miller, B. A., Koszinski, S., Wehrhan, M., and Sommer, M.: Impact of multi-scale predictor selection for modeling soil properties, Geoderma, 239–240, 97–106, https://doi.org/10.1016/j.geoderma.2014.09.018, 2015.
Myhre, G., Samset, B. H., Schulz, M., Balkanski, Y., Bauer, S., Berntsen, T. K., Bian, H., Bellouin, N., Chin, M., Diehl, T., Easter, R. C., Feichter, J., Ghan, S. J., Hauglustaine, D., Iversen, T., Kinne, S., Kirkevåg, A., Lamarque, J.-F., Lin, G., Liu, X., Lund, M. T., Luo, G., Ma, X., van Noije, T., Penner, J. E., Rasch, P. J., Ruiz, A., Seland, Ø., Skeie, R. B., Stier, P., Takemura, T., Tsigaridis, K., Wang, P., Wang, Z., Xu, L., Yu, H., Yu, F., Yoon, J.-H., Zhang, K., Zhang, H., and Zhou, C.: Radiative forcing of the direct aerosol effect from AeroCom Phase II simulations, Atmos. Chem. Phys., 13, 1853–1877, https://doi.org/10.5194/acp-13-1853-2013, 2013.
Poggio, L., de Sousa, L. M., Batjes, N. H., Heuvelink, G. B. M., Kempen, B., Ribeiro, E., and Rossiter, D.: SoilGrids 2.0: producing soil information for the globe with quantified spatial uncertainty, SOIL, 7, 217–240, https://doi.org/10.5194/soil-7-217-2021, 2021.
Rodriguez, J. D., Perez, A., and Lozano, J. A.: Sensitivity Analysis of k-Fold Cross Validation in Prediction Error Estimation, IEEE T. Pattern Anal., 32, 569–575, https://doi.org/10.1109/TPAMI.2009.187, 2010.
Singh, M. K., Venkatachalam, P., and Gautam, R.: Geostatistical Methods for Filling Gaps in Level-3 Monthly-Mean Aerosol Optical Depth Data from Multi-Angle Imaging SpectroRadiometer, Aerosol Air Qual. Res., 17, 1963–1974, https://doi.org/10.4209/aaqr.2016.02.0084, 2017.
Sun, J., Gong, J., and Zhou, J.: Estimating hourly PM2.5 concentrations in Beijing with satellite aerosol optical depth and a random forest approach, Sci. Total Environ., 762, 144502, https://doi.org/10.1016/j.scitotenv.2020.144502, 2021.
Sun, W., Song, X., Mu, X., Gao, P., Wang, F., and Zhao, G.: Spatiotemporal vegetation cover variations associated with climate change and ecological restoration in the Loess Plateau, Agric. Forest Meteorol., 209–210, 87–99, https://doi.org/10.1016/j.agrformet.2015.05.002, 2015.
Szilagyi, J., Yinsheng, Z., Ning, M., and Wenbin, L.: Terrestrial evapotranspiration dataset across China (1982–2017), National Tibetan Plateau Data Center [data set], https://doi.org/10.11888/AtmosPhys.tpe.249493.file, 2019.
Tao, M., Chen, L., Wang, Z., Wang, J., Che, H., Xu, X., Wang, W., Tao, J., Zhu, H., and Hou, C.: Evaluation of MODIS Deep Blue Aerosol Algorithm in Desert Region of East Asia: Ground Validation and Intercomparison, J. Geophys. Res.-Atmos., 122, 10357–10368, https://doi.org/10.1002/2017JD026976, 2017.
Waits, A., Emelyanova, A., Oksanen, A., Abass, K., and Rautio, A.: Human infectious diseases and the changing climate in the Arctic, Environ. Int., 121, 703–713, https://doi.org/10.1016/j.envint.2018.09.042, 2018.
Wang, Z., Deng, R., Ma, P., Zhang, Y., Liang, Y., Chen, H., Zhao, S., and Chen, L.: 250-m Aerosol Retrieval from FY-3 Satellite in Guangzhou, Remote Sens., 13, 920, https://doi.org/10.3390/rs13050920, 2021.
Wei, J., Peng, Y., Guo, J., and Sun, L.: Performance of MODIS Collection 6.1 Level 3 aerosol products in spatial-temporal variations over land, Atmos. Environ., 206, 30–44, https://doi.org/10.1016/j.atmosenv.2019.03.001, 2019.
Wei, J., Li, Z., Lyapustin, A., Sun, L., Peng, Y., Xue, W., Su, T., and Cribb, M.: Reconstructing 1-km-resolution high-quality PM2.5 data records from 2000 to 2018 in China: spatiotemporal variations and policy implications, Remote Sens. Environ., 252, 112136, https://doi.org/10.1016/j.rse.2020.112136, 2021.
Wei, X., Bai, K., Chang, N.-B., and Gao, W.: Multi-source hierarchical data fusion for high-resolution AOD mapping in a forest fire event, International Journal of Applied Earth Observation and Geoinformation, 102, 102366, https://doi.org/10.1016/j.jag.2021.102366, 2021.
Xiao, Q., Wang, Y., Chang, H. H., Meng, X., Geng, G., Lyapustin, A., and Liu, Y.: Full-coverage high-resolution daily PM2.5 estimation using MAIAC AOD in the Yangtze River Delta of China, Remote Sens. Environ., 199, 437–446, https://doi.org/10.1016/j.rse.2017.07.023, 2017.
Xue, W., Wei, J., Zhang, J., Sun, L., Che, Y., Yuan, M., and Hu, X.: Inferring Near-Surface PM2.5 Concentrations from the VIIRS Deep Blue Aerosol Product in China: A Spatiotemporally Weighted Random Forest Model, Remote Sens., 13, 505, https://doi.org/10.3390/rs13030505, 2021.
Yan, X., Zang, Z., Li, Z., Luo, N., Zuo, C., Jiang, Y., Li, D., Guo, Y., Zhao, W., Shi, W., and Cribb, M.: A global land aerosol fine-mode fraction dataset (2001–2020) retrieved from MODIS using hybrid physical and deep learning approaches, Earth Syst. Sci. Data, 14, 1193–1213, https://doi.org/10.5194/essd-14-1193-2022, 2022.
Yang, J. and Hu, M.: Filling the missing data gaps of daily MODIS AOD using spatiotemporal interpolation, Sci. Total Environ., 633, 677–683, https://doi.org/10.1016/j.scitotenv.2018.03.202, 2018.
Yang, Q., Yuan, Q., Li, T., and Yue, L.: Mapping PM2.5 concentration at high resolution using a cascade random forest based downscaling model: Evaluation and application, J. Clean. Prod., 277, 123887, https://doi.org/10.1016/j.jclepro.2020.123887, 2020.
Zhang, R., Di, B., Luo, Y., Deng, X., Grieneisen, M. L., Wang, Z., Yao, G., and Zhan, Y.: A nonparametric approach to filling gaps in satellite-retrieved aerosol optical depth for estimating ambient PM2.5 levels, Environ. Pollut., 243, 998–1007, https://doi.org/10.1016/j.envpol.2018.09.052, 2018.
Zhang, Z., Wu, W., Fan, M., Wei, J., Tan, Y., and Wang, Q.: Evaluation of MAIAC aerosol retrievals over China, Atmos. Environ., 202, 8–16, https://doi.org/10.1016/j.atmosenv.2019.01.013, 2019.
Zhang, Z., Ding, J., Zhu, C., Chen, X., Wang, J., Han, L., Ma, X., and Xu, D.: Bivariate empirical mode decomposition of the spatial variation in the soil organic matter content: A case study from NW China, Catena, 206, 105572, https://doi.org/10.1016/j.catena.2021.105572, 2021.
Zhao, C., Liu, Z., Wang, Q., Ban, J., Chen, N. X., and Li, T.: High-resolution daily AOD estimated to full coverage using the random forest model approach in the Beijing-Tianjin-Hebei region, Atmos. Environ., 203, 70–78, https://doi.org/10.1016/j.atmosenv.2019.01.045, 2019.
Zhao, H., Gui, K., Ma, Y., Wang, Y., Wang, Y., Wang, H., Zheng, Y., Li, L., Zhang, L., Che, H., and Zhang, X.: Climatological variations in aerosol optical depth and aerosol type identification in Liaoning of Northeast China based on MODIS data from 2002 to 2019, Sci. Total Environ., 781, 146810, https://doi.org/10.1016/j.scitotenv.2021.146810, 2021.
Zounemat-Kermani, M., Batelaan, O., Fadaee, M., and Hinkelmann, R.: Ensemble machine learning paradigms in hydrology: A review, J. Hydrol., 598, 126266, https://doi.org/10.1016/j.jhydrol.2021.126266, 2021.