the Creative Commons Attribution 4.0 License.
the Creative Commons Attribution 4.0 License.
 | 08 Feb 2022
A global dataset of annual urban extents (1992–2020) from harmonized nighttime lights
Changxiu Cheng
Xuecao Li
Changqing Song
Understanding the spatiotemporal dynamics of global urbanization over a long time series is increasingly important for sustainable development goals. The harmonized nighttime light (NTL) time-series composites created by fusing multi-source NTL observations provide a long and consistent record of the nightscape for characterizing and understanding global urban dynamics. In this study, we generated a global dataset of annual urban extents (1992–2020) using consistent NTL observations and analyzed the spatiotemporal patterns of global urban dynamics over nearly 30 years. The urbanized areas associated with locally high intensity human activities were mapped from the global NTL time-series imagery using a new stepwise-partitioning framework. This framework includes three components: (1) clustering of NTL signals to generate potential urban clusters, (2) identification of optimal thresholds to delineate annual urban extents, and (3) check of temporal consistency to correct pixel-level urban dynamics. We found that the global urban land area percentage of the Earth's land surface rose from 0.22 % to 0.69 % between 1992 and 2020. Urban dynamics over the past 3 decades at the continent, country, and city levels exhibit various spatiotemporal patterns. Our resulting global urban extents (1992–2020) were evaluated using other urban remote sensing products and socioeconomic data. The evaluations indicate that this dataset is reliable for characterizing spatial extents associated with intensive human settlement and high-intensity socioeconomic activities. The dataset of global urban extents from this study can provide unique information to capture the historical and future trajectories of urbanization and to understand and tackle urbanization impacts on food security, biodiversity, climate change, and public well-being and health. This dataset can be downloaded from https://doi.org/10.6084/m9.figshare.16602224.v1 (Zhao et al., 2021).
- Article
(21930 KB) - Full-text XML
- BibTeX
- EndNote


A better understanding of global urban dynamics over the long term is crucial for sustainable development goals in a changing world experiencing complex human–environment interactions (Li and Gong, 2016; Li et al., 2019; Zhu et al., 2019). With increased populations, intensified socioeconomic activities, spatially expanded built-up areas and infrastructures, and escalated industrial structures, such complex processes of urbanization worldwide are supposed to accelerate human-driven modifications of Earth landscape and climate change from local and regional to global scales (Defries et al., 2002; Kuang, 2020; Kuang et al., 2021a). These urbanization-induced environmental changes pose challenges to a variety of fields such as agricultural production (Hou et al., 2021; Jiang et al., 2013), environmental quality (Liang et al., 2019; Qiang et al., 2012), energy consumption (Guneralp et al., 2017; Chen et al., 2013), biodiversity loss (Seto et al., 2012; Lawler et al., 2014), and human health and well-being (Yang et al., 2018; Lu et al., 2019; Cao et al., 2018). As the major gathering areas of human activities, urban areas play a critical role in global change and regional development. For instance, despite covering an extremely small percentage of the global land surface, urban areas are estimated to be responsible for more than 90 % of the economic output, 65 % of the energy consumption, and 70 % of the greenhouse gas emission globally (Solecki et al., 2013). Therefore, global records of annual urbanized areas over the past few decades are the basis for exploring historical laws and predicting future pathways of urban growth and for further understanding and tackling ongoing global change and corresponding consequences for the urban system (Zhou et al., 2018; Liu et al., 2020; Seto et al., 2012).
Satellite remote sensing big data have shown great potential for mapping dynamics of urban areas with continuous observations spanning over years to decades at the global scale (Zhu et al., 2019). Currently, global maps of urban areas have been derived from medium-spatial-resolution data such as the Moderate Resolution Imaging Spectrometer (MODIS) (Schneider et al., 2010, 2009) and Landsat imagery (Liu et al., 2018; Corbane et al., 2018; Gong et al., 2013; Chen et al., 2015; Kuang et al., 2021b), as well as high-resolution observations such as synthetic aperture radar (SAR) and Sentinel data (Gong et al., 2019; Esch et al., 2013; Taubenbock et al., 2012). Most of these maps aim to reveal the spatial distribution of artificial impervious areas, and the extraction results with finer spatial resolutions are more likely to be the real impervious surface. However, the issues of consistency and comparability in the derived urban results of different global maps inevitably hinder the applications of global change studies (Yu et al., 2018). To address these challenges, several-decades-long global maps of annual artificial impervious areas were systematically developed, using the improved automatic mapping algorithms and massive Landsat time-series imagery on Google Earth Engine (GEE) platform (Gong et al., 2020; Liu et al., 2020; Huang et al., 2021). These temporally consistent records of artificial impervious areas provide an essential basis for understanding the urbanization process from the perspective of physical characteristics of the land-use type. Unlike the temporally consistent but broken patches of artificial impervious areas used for revealing the long-term urbanization process, the global urban boundaries obtained from fine-resolution artificial impervious areas by Li et al. (2020b) provide spatially contiguous boundaries of urban extents without hollow regions. Additionally, a global dataset of intra-urban land cover types with a 5-year interval was developed aiming to provide more details of the key urban composites (e.g., green space and impervious areas) (Kuang et al., 2021b). Therefore, different global urban products based on artificial impervious areas have greatly contributed to revealing human modifications to the landscape against the background of rapid global urbanization.
Unlike other traditional remotely sensed products, artificial nighttime light (NTL) observations from satellites have a unique significance in characterizing urbanized areas and urbanization activities (Zhao et al., 2019; Li and Zhou, 2017b). The former mainly focus on reflecting the form and texture information of the landscape, while the latter specializes in providing the coupled information of NTL intensity and location (Ma et al., 2015). The nocturnal lighting signals recorded by different types of NTL imagery are suggested to be salient indicators for revealing the dynamic patterns of human settlements and economic activities from different perspectives (Zhao et al., 2019). Specifically, the stable NTL products obtained from the Defense Meteorological Satellite Program's Operational Linescan System (DMSP-OLS) are widely applied to delineate the boundary of the urban domain (Li and Zhou, 2017b), while the improved NTL composites obtained from the Visible Infrared Imaging Radiometer Suite (VIIRS) instrument on board the Suomi National Polar-orbiting Partnership (NPP) satellite are suitable for depicting further the interior patterns within the urban domain (Chen et al., 2017; Ma et al., 2018; Zhao et al., 2020). Both of them have advantages in capturing urbanization and socioeconomic activities with high local intensities (Zhao et al., 2019). Additionally, the fine NTL images with higher capabilities of NTL detection derived from commercial satellites are supposed to identify different types of urban structures and functions (Zheng et al., 2018; Wang and Shen, 2021). In a sense, urban areas derived from NTL images may be more closely correlated to the areas gathered by higher-intensity socioeconomic activities locally.
The characteristics of NTL spatial structures in potential urban domains have been demonstrated to help identify the ambiguous boundary between urban and surrounding non-urban areas, but previous studies were limited regarding spatial coverage or temporal periods. The key of this type of method is to capture differences in NTL signals from rural areas to urban cores at local scales (Zhao et al., 2020b). Su et al. (2015) extracted the urban built-up areas in the urban agglomeration of the Pearl River Delta in four different periods by applying topographic analysis to NTL images to quantify the relative spatial variations in NTL pixels from built-up areas compared to surrounding non-built-up areas. Additionally, some spatially explicit approaches were applied to China and Southeast Asia for extracting their dynamics of urban extents over the past 2 decades. The key idea of this kind of approach is to identify the optimal urban threshold through the robust quadratic relationship observed at the local scales between pixel-level NTL and its spatial gradient (Zhao et al., 2018; Ma et al., 2015; Kamarajugedda et al., 2017). However, the extracted urban extents are likely to be overestimated when applying the above methods to large cities or metropolitan areas (Zhao et al., 2020b). Differently, a quantile-based approach was proposed by Zhou et al. (2018) to remove such bloomed pixels in suburban areas and delineate the urban extents (1992–2013) in different urban clusters at the global scale. Still, the accuracy of the extraction results cannot be guaranteed when applying this algorithm to other city types (Zhao et al., 2020b). Recently, a new framework, through capturing and quantifying the spatial characteristics of NTL gradients from urban cores to rural areas, was developed to identify the urban extents from the potential urban domains (Zhao et al., 2020b). A salient advantage of this framework is to map the urban extents over different spaces and time by effectively characterizing the diverse patterns of NTL spatial gradients at the local scales from urban to surrounding non-urban areas (Zhao et al., 2020b). Thus far, this approach has been initially applied to Southeast Asia for monitoring its annual urban extents (1992–2018), showing great potential in further applications for studies over large regions and long periods.
Given the advances in the fusion of multi-source luminous remote sensing data for acquiring temporally consistent and comparable NTL observations, a global record of annual urban extents aimed at portraying the spatiotemporal coverage of high-intensity or intensive urbanization and socioeconomic activities has its unique advantage in revealing the global urbanization process (Li et al., 2020a). Despite a proliferation of remotely sensed urban maps for different spatiotemporal scales being developed, the definitions of urban extents vary with different studies and datasets (Liu et al., 2014; Kuang et al., 2021a). In addition to the artificial impervious areas, the population has also been used as an indicator when delineating the boundary between urban and non-urban areas. For instance, urban center areas in the Global Human Settlement (GHS) dataset were defined jointly with population data and previously derived urban extent data (Florczyk et al., 2019). However, this type of urban extent map, delineated by supporting auxiliary data related to population and socioeconomic factors, is always limited at both spatial and temporal scales. Differently, urban extents delineated from NTL imagery, although they may omit small human settlements with low luminance (e.g., villages and small towns), have been demonstrated to effectively identify areas gathered by relatively active urbanization activities at the local scales (Ma et al., 2015, 2018). Additionally, harmonizing the temporally extended NTL dataset by integrating NTL observations from different sensors can provide valuable support for mapping global urban dynamics over the past decades (Li et al., 2020a). In short, global time-series maps of NTL-derived annual urban areas that can characterize the relatively developed areas are pressingly needed.
To further extend the applications of NTL observations for delineating, understanding, and predicting pathways of global urban growth associated with socioeconomic activities, as well as to better support future sustainable development, we generated a global dataset of annual urban extents from 1992 to 2020 using long-term and consistent nighttime lights. The remainder of this article describes the datasets and pre-processing (Sect. 2), details of the stepwise methods for NTL-based urban mapping (Sect. 3), a discussion of the results and findings (Sect. 4), and conclusions (Sect. 5).
We used the harmonized global NTL dataset (1992–2020) as the primary dataset for mapping the global time-series urban extents. This dataset generated using the global integration framework of DMSP and VIIRS data could provide temporally consistent and extended DMSP-like stable NTLs compared to the previous version of DMSP stable NTL imagery (Li et al., 2020a). The DMSP stable NTL composites (1992–2013) inter-calibrated by the NTL stepwise-calibration model (Li and Zhou, 2017a) and the extended DMSP-like data (2014–2020) simulated from the VIIRS NTLs using the NTL integration approach (Zhao et al., 2020a) are two major components of this time-series dataset. These global annual image products consist of 30×30 arcsec gridded cell-based stable NTLs with a 0–63 digital number (DN) range. In this study, we downloaded the nearly 30-year-long records of global stable NTLs tagged in GeoTIFF file format at the figshare repository (https://doi.org/10.6084/m9.figshare.9828827.v2, Li et al., 2021). To slightly distinguish the spatial variations of saturated DMSP NTL observations when developing the urban delineating method, a weight coefficient constructed based on the normalized difference vegetation index (NDVI), defined as (), was used to update the DN values of NTL time-series imagery at the global scale.
Other ancillary data such as masks of water and gas flare were used to filter out the urbanization-unrelated illuminations recorded in the NTL time series. Similarly to in previous attempts (Zhao et al., 2020b), water masks were regarded as the aggregated 1 km water percentage maps with values larger than 50 % derived from 250 m MODIS Land Water Mask data (MOD44W), and gas flare masks were obtained from Elvidge et al. (2009). In addition to the global 1 km binary urban maps used previously (Zhou et al., 2015, 2018), the global artificial impervious area (GAIA) data with a spatial resolution of 30 m (Gong et al., 2020) in 2018 were also processed to a 1 km binary layer of dense artificial impervious area (AIA, pixels with values of GAIA percentage > 50 %) to provide ancillary support for implementing the stepwise urban mapping approach mentioned below.
We mapped the global annual urban extents (1992–2020) from time series of consistent NTL observations based on a new stepwise-partitioning framework (Fig. 1). This framework further improves and extends the urban mapping approach developed in Zhao et al. (2020b). It includes three components: (1) clustering of NTL signals to generate potential urban clusters, (2) identification of optimal thresholds to delineate annual urban extents, and (3) checking of temporal consistency to correct pixel-level urban dynamics. The “urban extents” derived from NTL imagery in this study were defined as core urban domains, where most built-up areas and partially green spaces and other land-use types with urban functions are inside. The global urban mapping framework was designed based on top-down segmentation and local delineating and bottom-up merging. Details of the stepwise urban mapping method are given in the following sections.
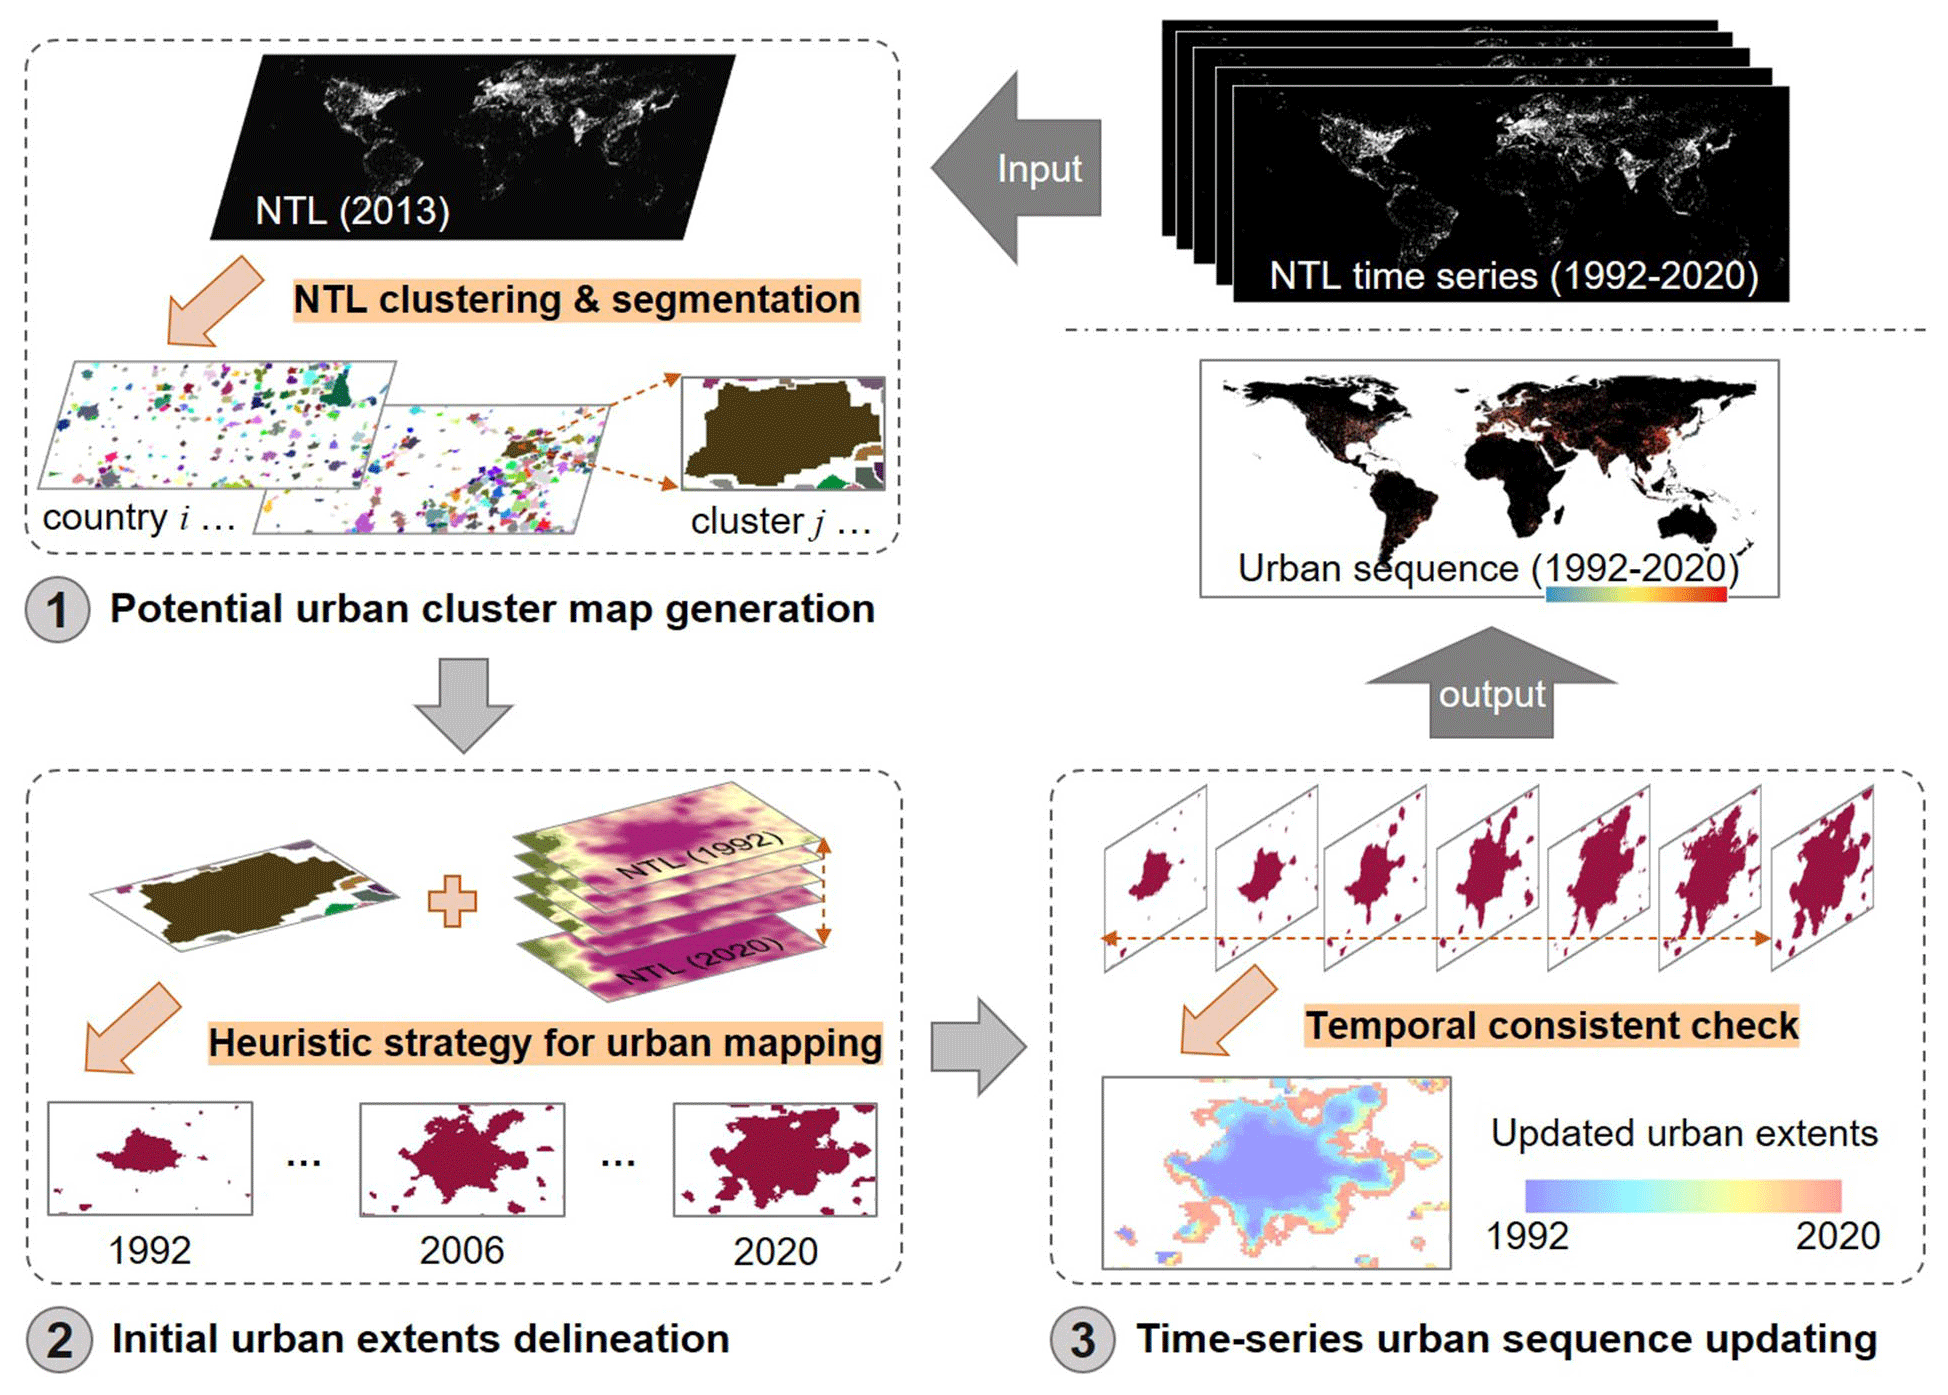
3.1 Potential urban cluster map generation
A global map of potential urban clusters (i.e., urban domains including urban cores and suburban and surrounding rural areas) was generated using the NTL clustering and segmentation approach. This approach includes two major sections. First, we applied the marker-controlled watershed segmentation algorithm (Parvati et al., 2008) to generate global initial urban clusters of spatially contiguous pixels with similar DN values. The increasing of DNs in each urban cluster from the periphery to the core spatially corresponds to the intensification of urbanization and socioeconomic activities from rural areas to urban cores. Therefore, each initial urban cluster is an enclosed zone constituting urban and surrounding non-urban areas. Considering that this grayscale morphology algorithm with dilation and erosion processing is sensitive to the spatial variations of NTL DN values, the filtered NTL imagery in 2013 rather than the latest imagery was used here to avoid the over-segmentation of urban clusters caused by the slight heterogeneity of simulated DMSP-like NTLs in the urban domain (Li et al., 2020a). Second, we used necessary screening rules to identify and remove non-urban clusters from the initial urban clusters which were unrelated to urbanization. Both the global binary urban reference data mentioned in the datasets and temporal trends of the annual average NTL DNs of each initial urban cluster were designed to screen out the non-urban clusters from the initial ones. Here, an updated urban binary layer in 2018 overlaid by its binary layer of dense AIA (GAIA percentage > 50 %) and corresponding NTL luminance layer (DN > 40) was used to mark the areas associated with dense human settlements and high-intensity human activities, respectively. The initial urban clusters, which exclude such areas or exhibit the abnormal NTL temporal trends unrelated to the urbanization process, were identified as non-urban clusters to be removed for generating the potential urban clusters. As demonstrated in Zhou et al. (2015, 2018) at the global scale, these associated parameters could jointly determine the screening rules for identifying non-urban clusters. More details about cluster screening are presented in Zhao et al. (2020b).
3.2 Initial urban extent delineation
The annual urban extents from 1992 to 2020 within each potential urban cluster were automatically delineated by extending a heuristic NTL-based urban mapping approach further developed in Zhao et al. (2020b). The key idea of this approach is to determine a threshold from NTL images of each potential urban cluster in different years by detecting the corresponding feature points of NTL curves. Considering that local patterns of DMSP NTL spatial variations in the potential urban domains over different spaces and time are quite different, the characteristics of NTL quantile curves were first examined to identify their corresponding patterns before each delineation. Building on the work by Zhao et al. (2020b), we revised the parameter details for realizing more robust delineations of the initial urban extents at the global scale.
First, we grouped the patterns of NTL distributions in local areas into two types by characterizing their NTL quantile curves. The quantile curves of NTL NDs at different quantile levels from 0 to 1 were mapped to depict the two patterns of NTL spatial gradients from non-urban areas to urban areas (Fig. 2a). As mentioned in Zhou et al. (2018) and Zhao et al. (2020b), both gradual and non-gradual variation in NTL gradients can be observed during a shift in NTL quantile patterns over long time series. For example, the NTL quantile curves, which nearly coincide with the reference line (2004–2012), show a gradual variation from non-urban to urban areas, while cases in others years exhibit non-gradual NTL gradient variation with obvious turning features (Fig. 2b).
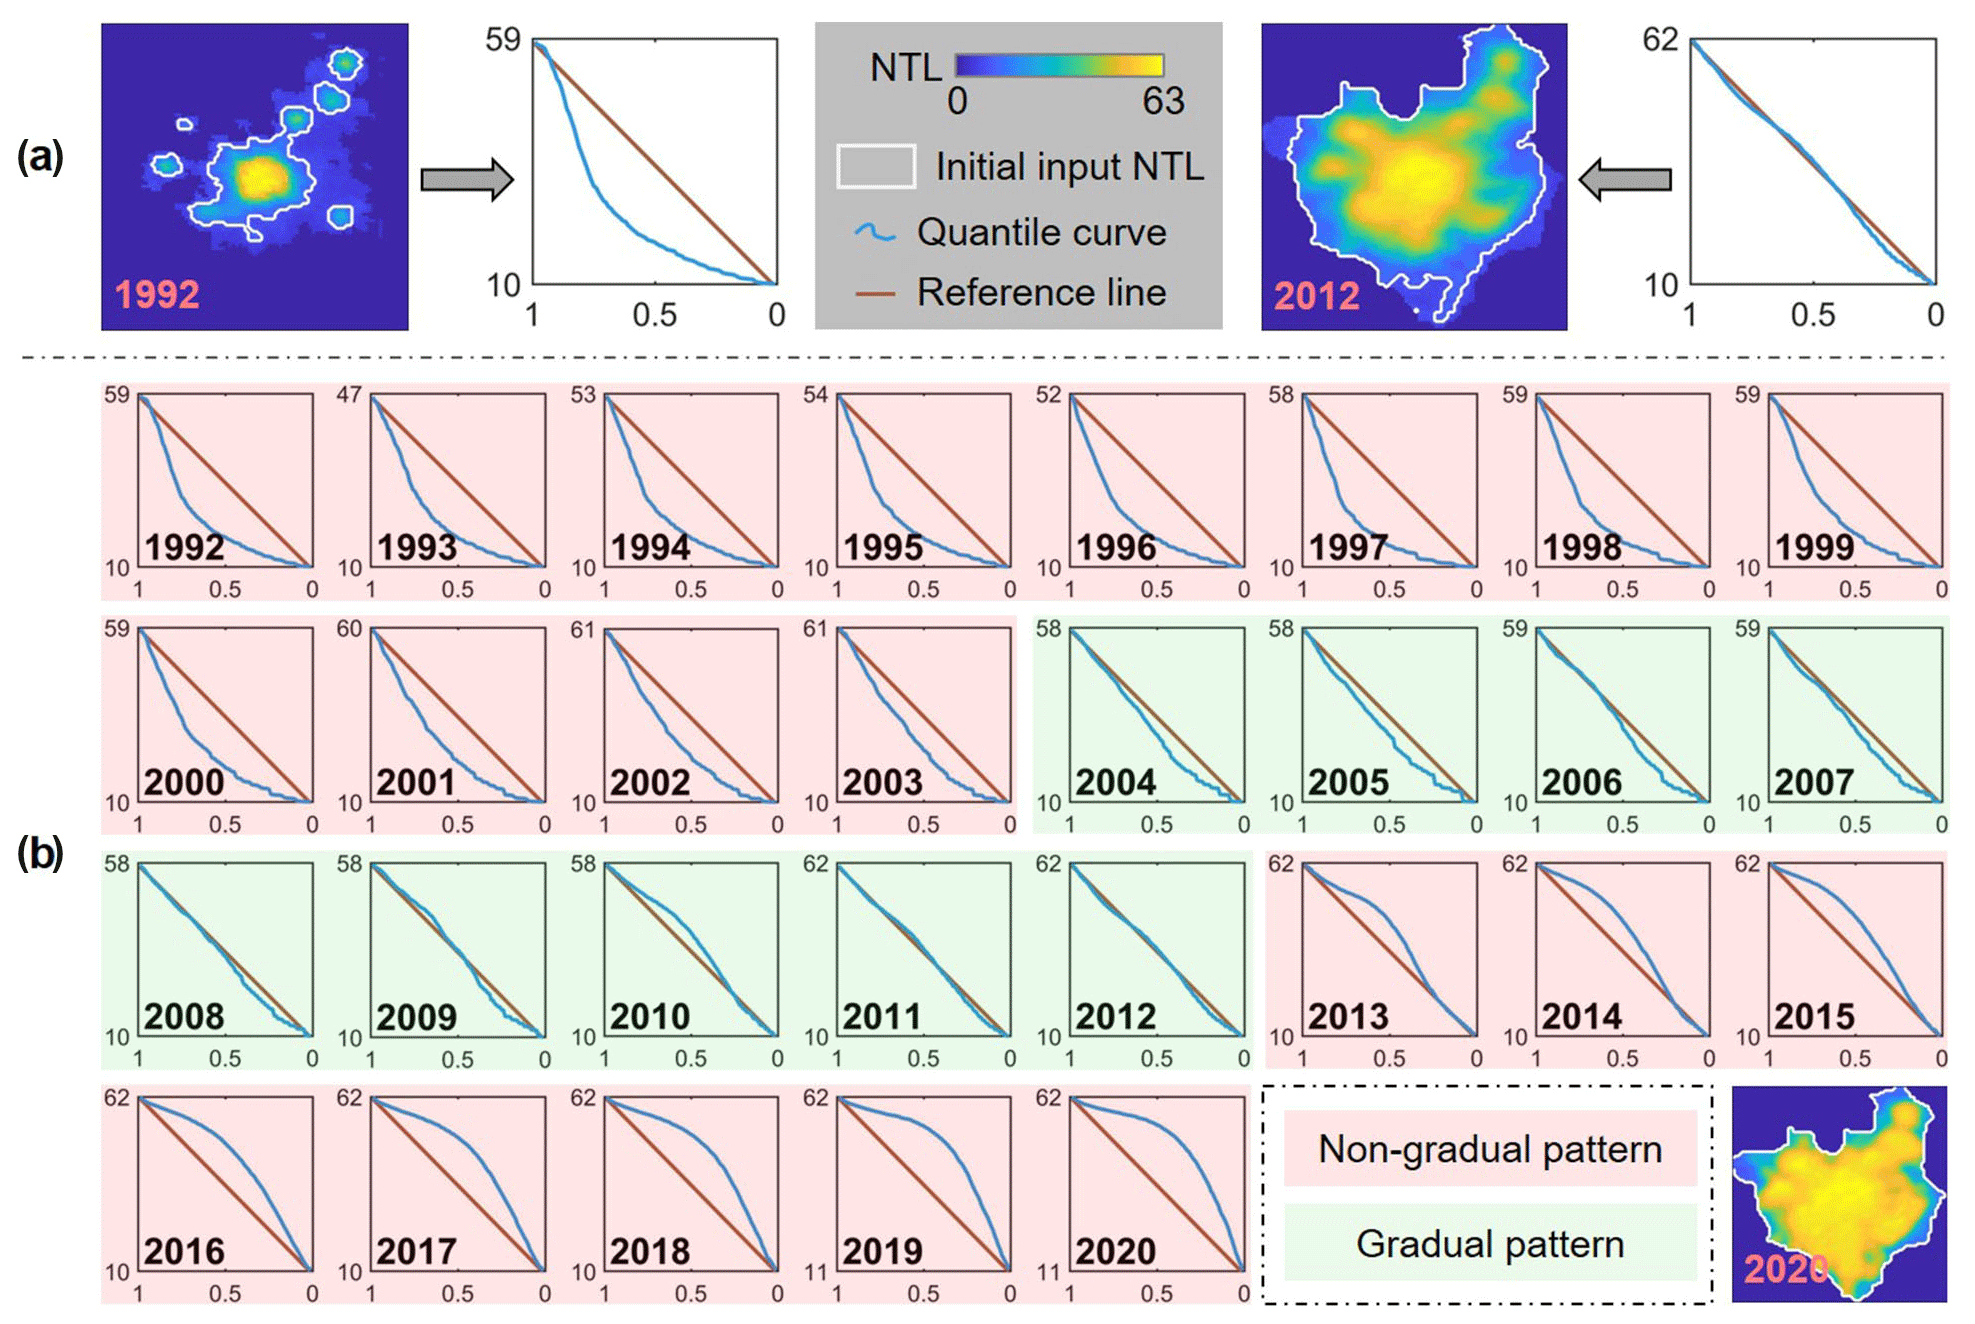
Figure 2Illustration of the patterns of NTL quantile curves from non-urban to urban areas. (a) Two different examples for characterizing the NTL quantile curves. (b) The changing process of NTL quantile curves from 1992 to 2020. Panels (a) and (b) show the selected cases in the potential urban cluster in the Chengdu district, city of Chengdu, Sichuan Province, China.
Second, we identified the NTL thresholds to gradually remove non-urban pixels of the potential urban domains using optimal strategies corresponding to pattern types. Two strategies were jointly applied here to identify the urban extents in areas with various urbanization stages. For example, when the NTL variation pattern from non-urban to urban areas is non-gradual, we remove non-urban pixels using the quantile-based strategy; otherwise, we delineate the urban extents using the parabola-based strategy as an alternative because of the difficulty in distinguishing boundaries among urban, suburban, and rural areas. Both strategies were designed based on the curve feature points of NTL variations from non-urban to urban areas.
3.2.1 Pattern of NTL variation from non-urban to urban areas
We quantified two parameters to classify the NTL variation patterns from non-urban to urban areas into two different types: (1) non-gradual NTL variation pattern and (2) gradual NTL variation pattern. One parameter is the area ratio (Ar) of two parts, the gray part (SR) below the reference line and the yellow part (SQ) enclosed by the quantile curve and reference line (Fig. 3a, arrow 1). The other is the included angle (Aα) between two line segments, connected by the turning point (red dot) and two adjacent intersections (blue dot) on both sides (Fig. 3a, arrow 2). Based on tests at the global scale and the previous parameterization in Zhao et al. (2020b), we used the joint condition of the two parameters calculated from NTL quantile analysis to identify the patterns of NTL variation (Fig. 3b). When Aα is lower than 150∘ or Ar is larger than 0.13, the NTL quantile curve is always far above or below the reference line; we identify the variation pattern of the NTL spatial gradient in the potential urban domain as non-gradual. Otherwise, the pattern is considered a gradual one.
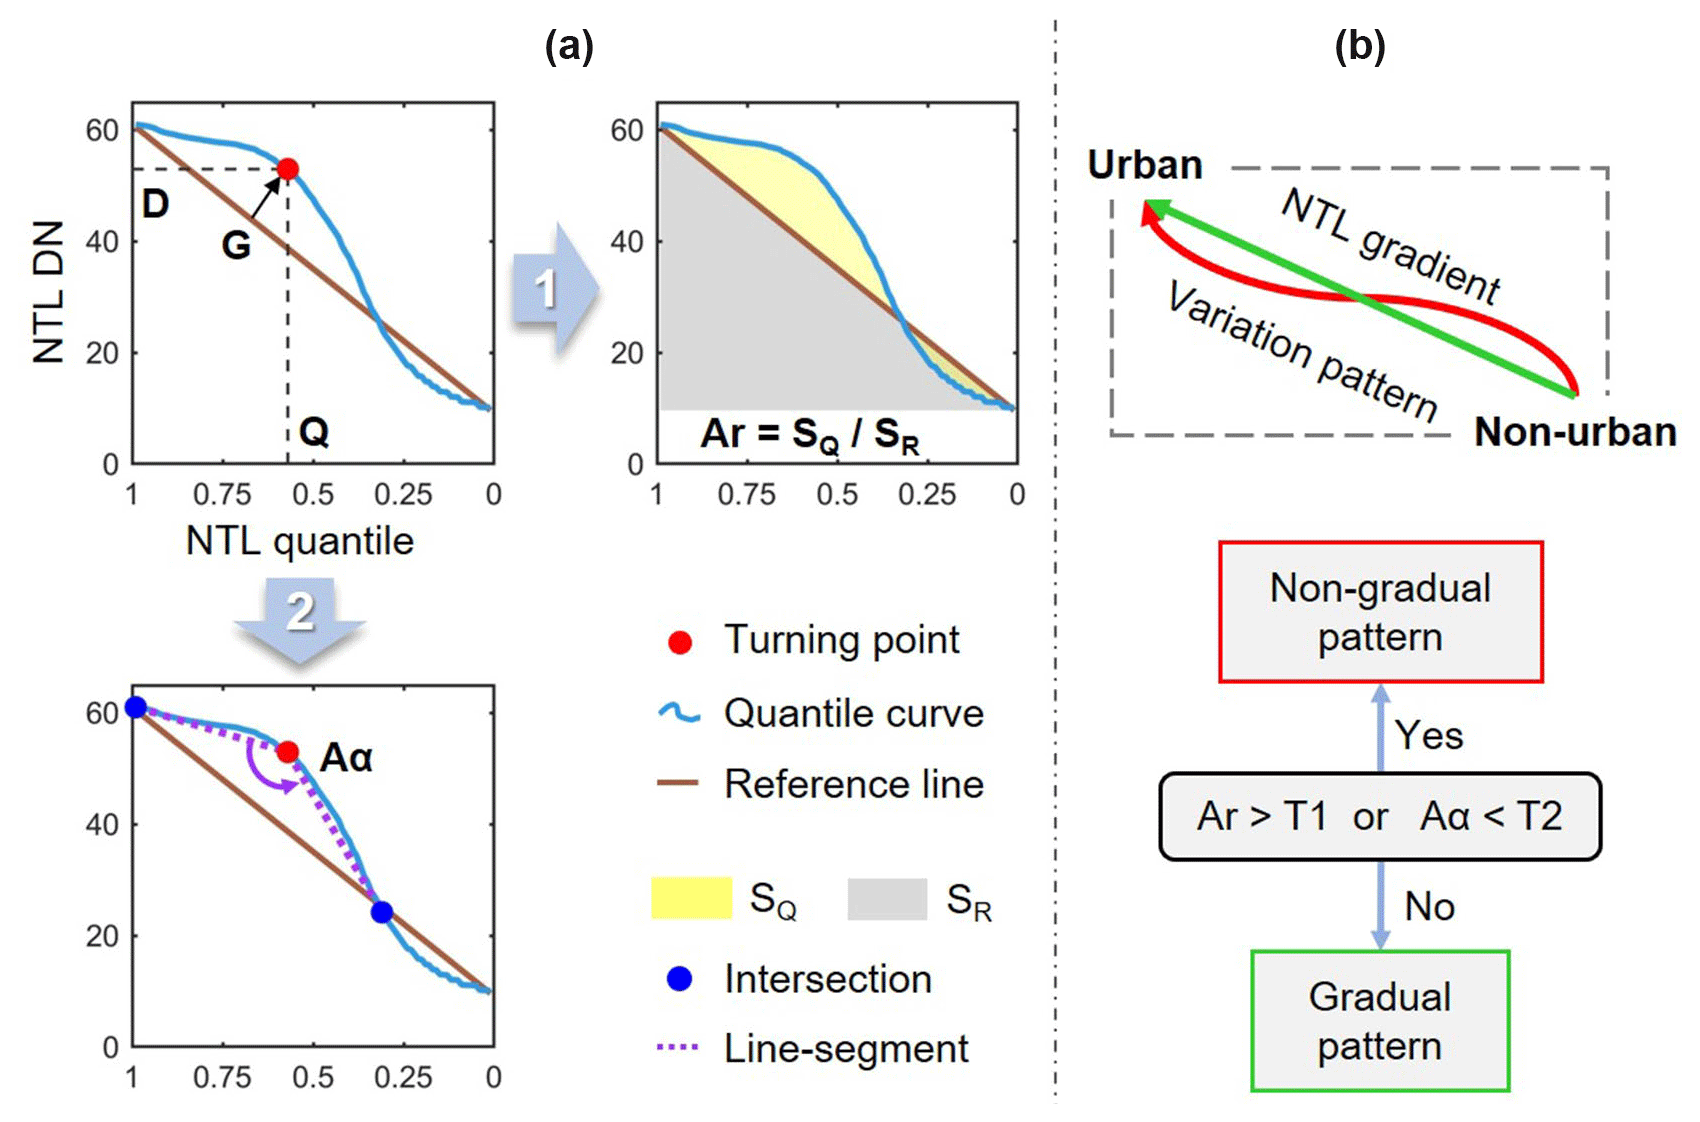
Figure 3Identification of NTL gradient patterns. (a) The quantification of the two parameters for characterizing NTL gradient variations. D and Q represent NTL DN values and corresponding quantile levels; G represents the minimum distance between the reference line and the turning point. (b) The schematic diagram for identifying the variation pattern of the NTL spatial gradient in the potential urban domain.
3.2.2 Quantile-based strategy for non-gradual pattern
We used the quantile-based strategy to gradually separate urban from surrounding non-urban areas in potential urban clusters that exhibit a non-gradual pattern of the NTL spatial gradient. As examined in Zhou et al. (2018) and Zhao et al. (2020b), this approach can effectively capture the notable NTL gradient change among urban, suburban, and rural areas. We used the turning point of the NTL quantile curve for each urban domain to identify the temporary threshold for gradually removing corresponding non-urban areas. For a cluster with G<0, its urbanized category in this year was identified as I. For this case, relatively low-DN pixels are dominant; the DN value of the turning point essentially reveals the potential boundary between rural and suburban. Hence, the turning point of the NTL quantile curve constituted by remaining NTL pixels after the first removal corresponds to the boundary between suburban and urban if the second pattern of NTL variation is also non-gradual. Therefore, the DN value of the turning point in the second removal (D2) was identified as the optimal threshold for delineating urban extent from the potential urban cluster in this year. The urbanized category was identified as II for a cluster with G>0 and Q>0.5. For this case with relatively balanced high- and low-DN pixels, the estimated threshold is likely to separate urban and suburban. Therefore, the DN value of the turning point in the first removal (D1) was applied to identify the corresponding urban extent in this case. For a cluster with G>0 and Q≤0.5, the urbanized category was identified as III. For this case with both dim pixels and the strong blooming effect, the estimated threshold in the first removal is relatively low and another removal is necessary when its gradient pattern is again identified as non-gradual. Therefore, the urban boundary was derived after the second removal/iteration using the threshold D2.
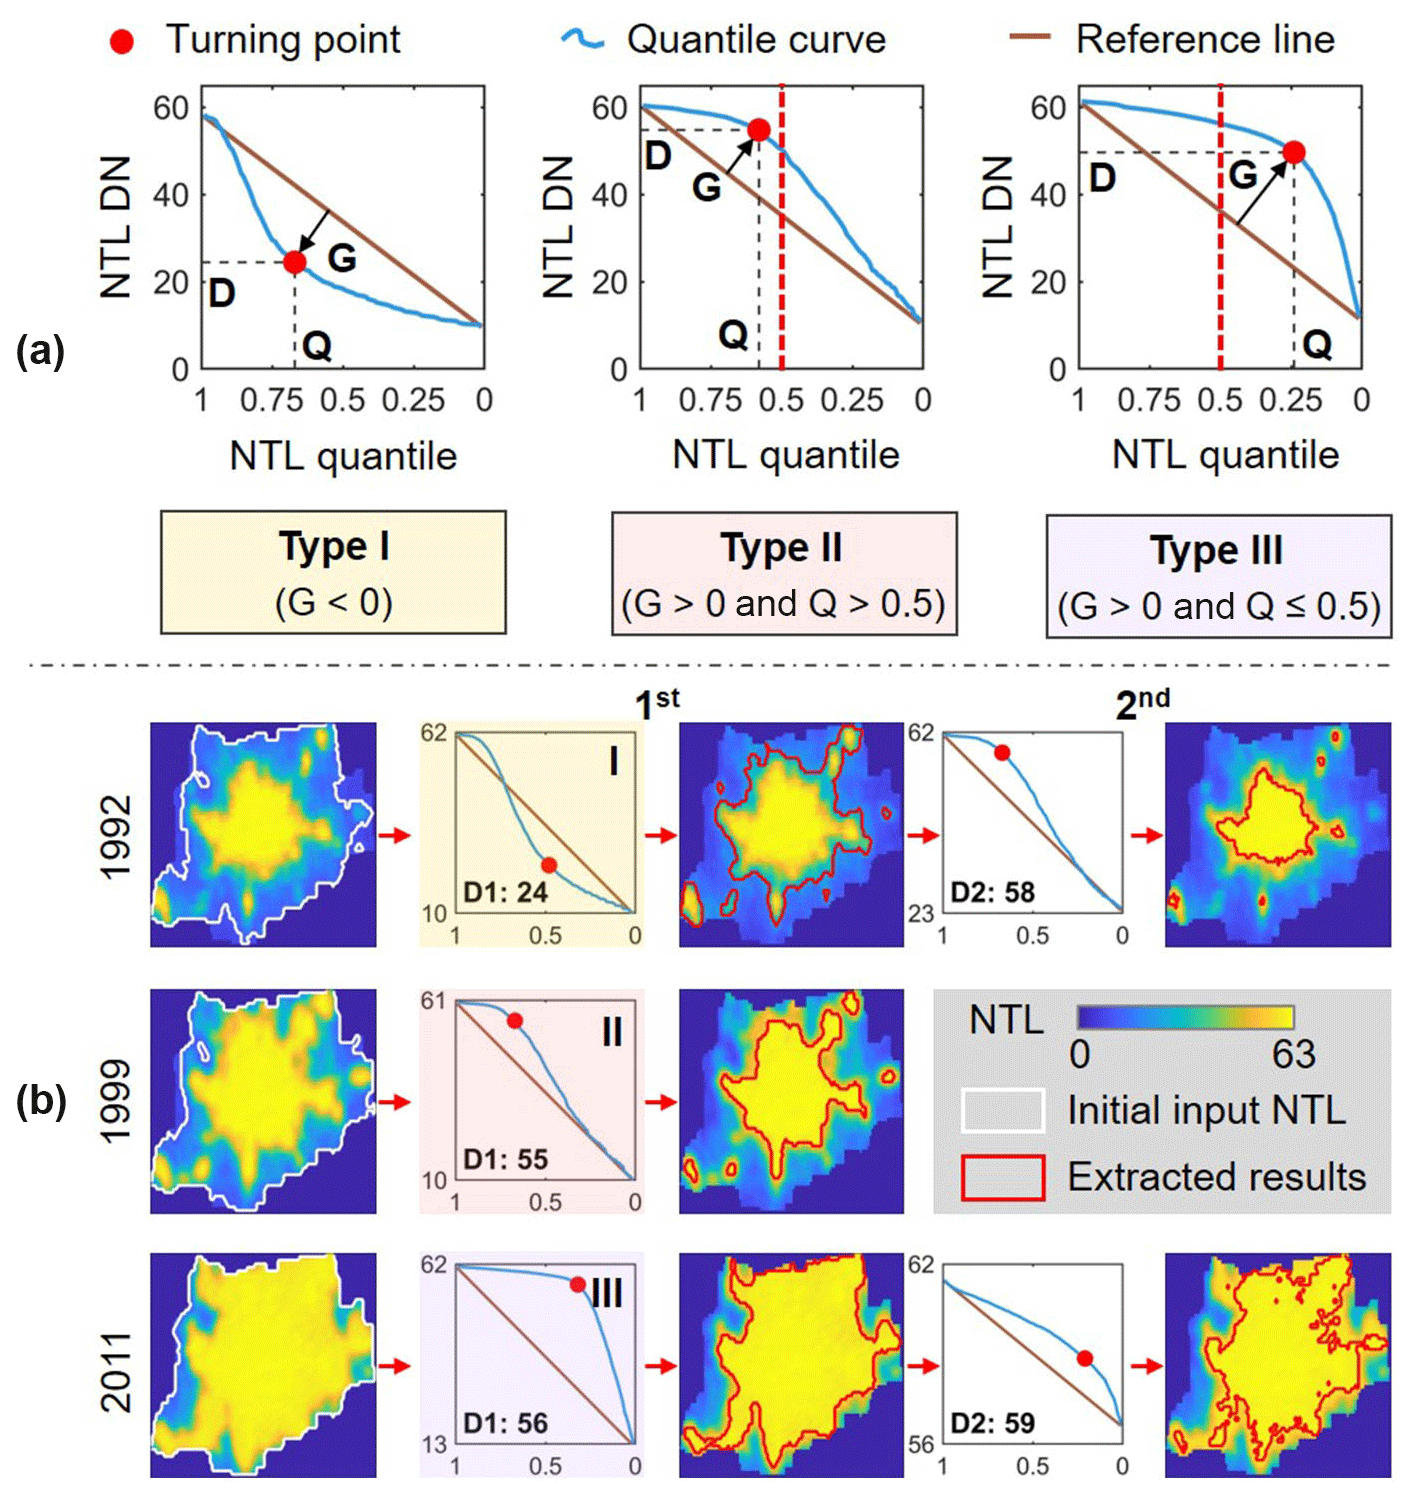
Figure 4Illustration of the quantile-based strategy. (a) The schematic diagram for identifying three types of urban cluster with the non-gradual pattern. (b) Corresponding examples of urban delineation in different urban cluster categories using the quantile-based strategy. The urban clusters in Beijing in 1992 (type I), 1999 (type II), and 2011 (type III) are selected for illustration.
3.2.3 Parabola-based strategy for the gradual pattern
We used the parabola-based strategy to map urban extents from potential urban clusters that exhibit a gradual pattern of the NTL spatial gradient. Since pixels with relatively low, medium, and high DN values constituted in these clusters are generally balanced, the relationships of quadratic curves between pixel-level NTL DNs and corresponding brightness gradient (BG) values should always be robust and insensitive (Ma et al., 2015). This strategy includes three steps. First, the pixel-level BG was calculated to depict the neighboring fluctuations in different urban clusters during the past decades. Then, the relationship between NTL and the BG for each case was fitted using a quadratic parabola. Finally, the split points of the fitting curve were identified to obtain the optimal threshold for delineating urban extents. The key for identifying urban extents in this approach is the law behind the variation in NTL and its neighboring gradient from rural to urban areas. Specifically, due to the intensified luminance of human activities from rural to urban areas and the saturation effect of DMSP NTL in urban cores, urban cores with high NTL and rural areas with low NTL are likely to exhibit low BG values (Fig. 5a). At the same time, urban–rural transition zones with medium NTL always have relatively high BG values because of their spatially increasing NTL DNs (Fig. 5a). Therefore, the quantitative relationship between the NTL DN and BG can be characterized by a quadratic parabola function. The extracted urban extents depend on the range of NTL and the fitted results (Fig. 5b). Similarly to in Ma et al. (2015) and Zhao et al. (2020b), areas with NTL DN larger than that of the urban split point always correspond to the dense artificial surface and thus are identified as urban extents in this study (Fig. 5c). Therefore, despite there being no notable changes along the NTL gradient to delineate urban and non-urban, the urban boundary in this type of potential urban cluster can also be captured by the DN value of the urban split point using the parabola-based strategy as an alternative.
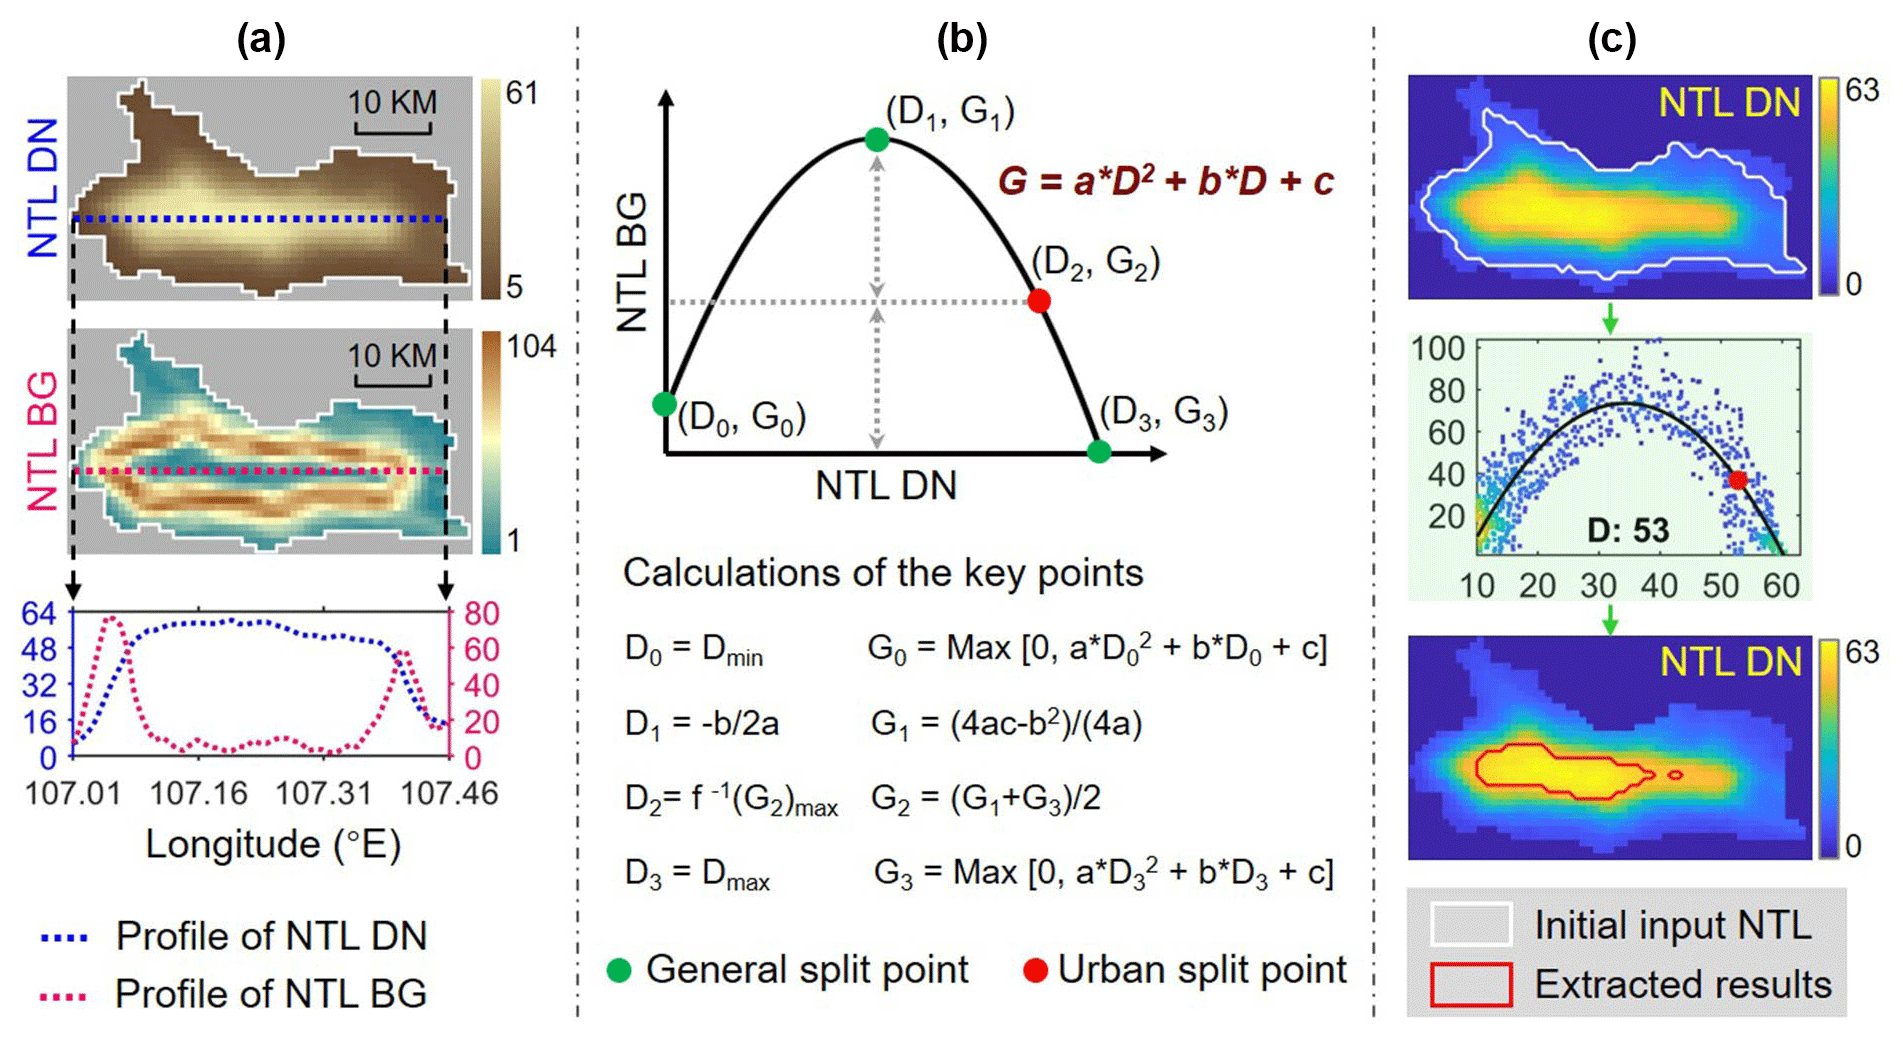
Figure 5 Illustration of the parabola-based strategy. (a) The NTL and corresponding brightness gradient (BG) maps and their profile curves in a latitudinal transect across the urban cluster of Baoji in 2012. (b) A schematic diagram of the parabola-based strategy. (c) An example of mapping urban extents in Baoji in 2012 using the parabola-based strategy. The urban cluster of Baoji in (a) and (c) is a city in the Shaanxi province in China. This cluster exhibits a gradual variation in the NTL spatial gradient in 2012.
3.3 Urban sequence updating
Finally, we post-processed the initial urban extents delineated from NTL imagery to build temporally more consistent time-series urban extents. The post-processing scheme includes two major procedures (Li et al., 2015). First, an iteratively temporal filtering procedure was applied to the initial binary urban sequence, for correcting the temporal inconsistency in the initial urban extents using a multi-temporal moving window. Cases of the pixels with isolated states in their temporal-neighborhood urban sequence can be reduced by changing the labels with low values of temporal-consistency probability. Then, for the filtered urban sequence, a logical reasoning check was performed to ensure that the updated sequence follows a reasonable urbanization process (i.e., non-urban to urban). The alternatively occurring urban and non-urban labels in the filtered urban sequence can be replaced based on the major label category. Details of the two procedures are described in Li et al. (2015).
4.1 Evaluations of derived urban extents
4.1.1 Comparison with global urban time-series products
Urban extents delineated from NTL data spatially agree with the relatively dense artificial impervious areas at the local scales (Fig. 6). We first aggregated the 30 m GAIA data (Gong et al., 2020) to the 1 km resolution to calculate the proportion of impervious surface area (ISA) in each pixel. We then selected urban clusters with different urban sizes and sprawl trends in different continents for illustration. Through overlaying the derived urban boundaries on the ISA percentage maps, we found that our mapped urban results can reveal the spatial distribution of the contiguous areas with relatively high proportions of ISA. These dense artificial impervious areas around urban cores are likely to be the real urban extents containing intensive high-intensity human activities. However, unlike using a single threshold of ISA percentage values to define urban areas (Homer et al., 2015; Zhou et al., 2014), the ISA percentage maps within the NTL-derived urban extents in this study vary over regions and across years.
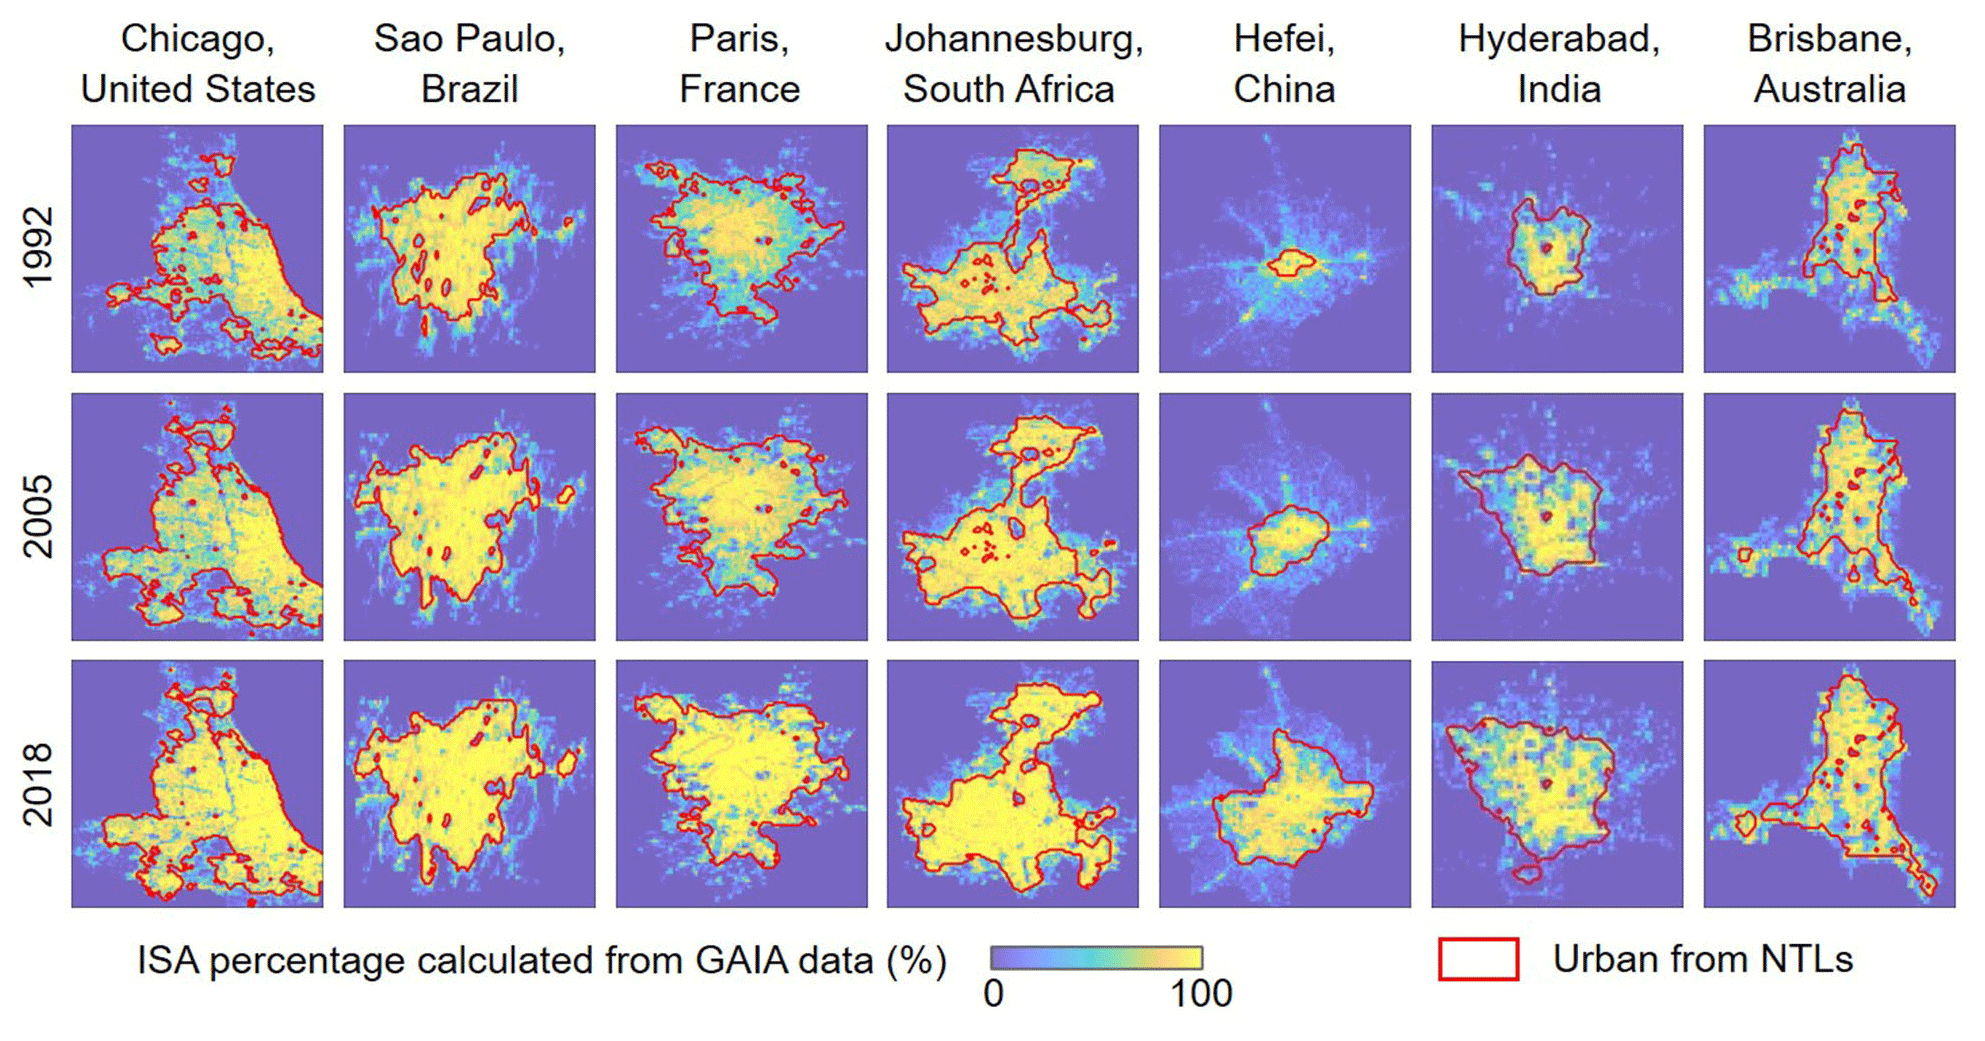
Figure 6Comparisons of urban extent from NTL imagery with the ISA percentage map calculated from GAIA data.
Overall, the total NTL-derived urban areas are largely consistent with the intensive artificial impervious areas at the global and continent scales, corresponding to a reasonable range of ISA percentage levels (20 %–45 %) over the past decades (Fig. 7). We binarized the global ISA percentage maps (1992–2018) at an interval of 5 % to obtain the reference urban boundary corresponding to different ISA levels. At the global scale, the total area of NTL-derived annual urban extents generally matches well with that of the areas with ISA percentage values larger than around 25 %. This comparison is a bit different on different continents. Most ISA percentage thresholds corresponding to the reference boundaries are generally stable, at around 30 % in Asia, 45 % in Oceania, 20 % in Europe, and 25 % in North America. However, the NTL-derived urban results in Africa agree with the ISA-derived reference results when the dynamic thresholds are set from 55 % in 1992 to 20 % in 2018. This difference is mainly because some artificial impervious areas in developing regions (e.g., small towns) in the early period cannot be well reflected on NTL imagery due to the dim luminance at night (Zhao et al., 2019). That is, during the earlier period, the NTL-derived urban areas generally detect the urban core with relatively dense artificial impervious areas, while other land types such as the green space in continuously expanded urban areas are likely to be identified as urban in the later period (Zhou et al., 2018). A similar illustration can also be found in South America. These comparisons suggest that our urban extents derived from NTLs can reveal dense human settlements with ISA percentage levels varying at a reasonable range from 55 % to 5 %.
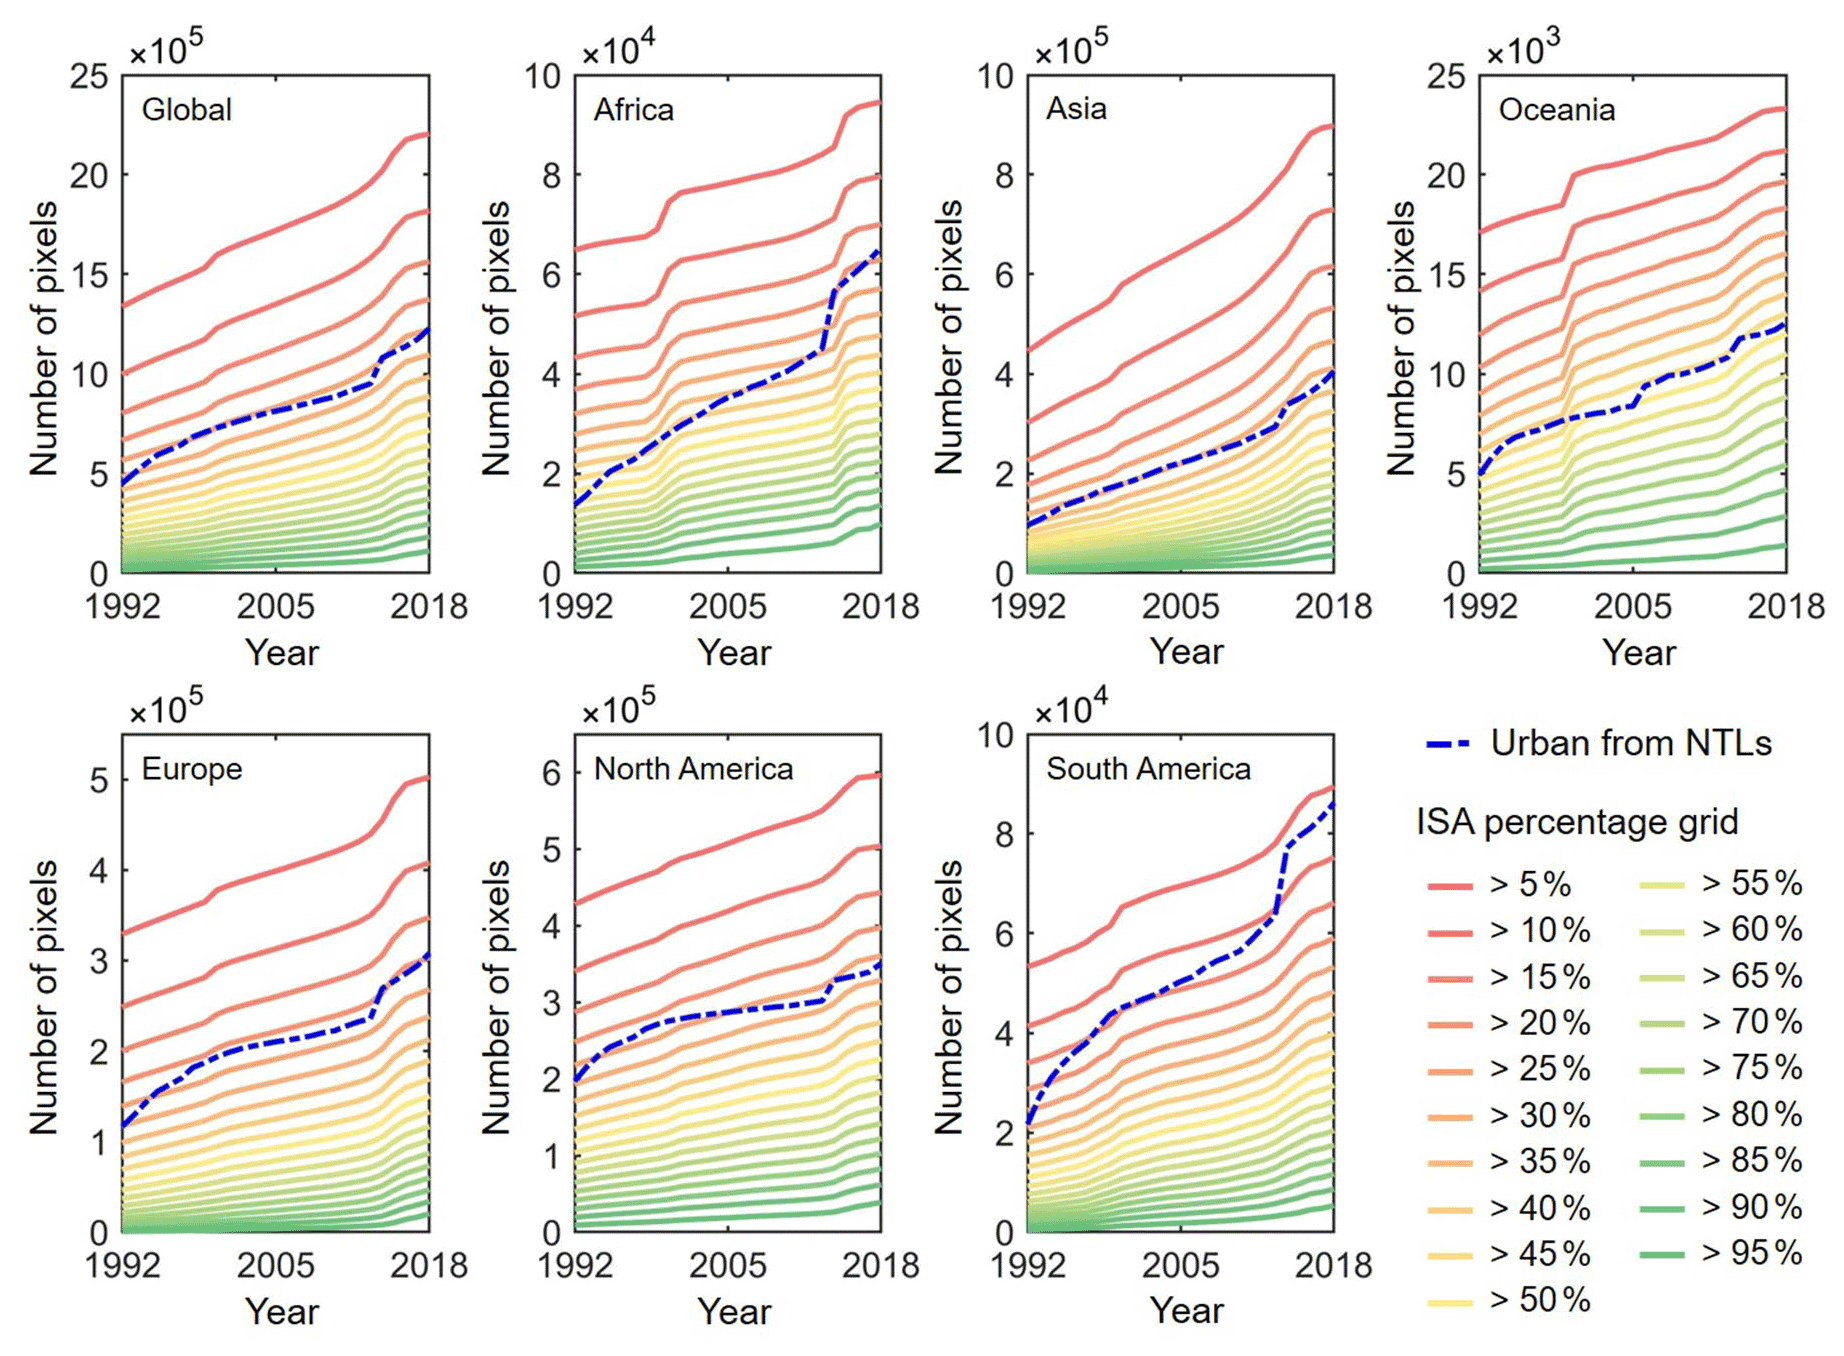
Figure 7Comparisons of urban extent from NTL imagery with the ISA percentage map calculated from GAIA data from 1992 to 2018 at the global and continent levels.
Urban extents derived from NTL imagery for each potential urban cluster are also largely consistent with the global urban boundaries (GUBs) derived from fine-resolution ISA data (Fig. 8). The multi-temporal GUB dataset delineated using 30 m resolution GAIA data provides a physical urban boundary globally over the past decades (Li et al., 2020b). The local urban sizes of NTL-derived results and GUB data are generally consistent worldwide, with R2 values of no less than 0.86, for six different periods (Fig. 8a). Most of the cluster-based evaluation points are distributed near the 1:1 line, showing that the extracted urban results in each potential urban cluster are generally consistent in these two datasets. Specifically, urban areas from this study and the reference dataset in the United States are largely scattered along the 1:1 line, presenting high values of the corresponding R2 larger than 0.9 (Fig. 8c). The comparison results in Asia are also reasonable, despite differences in the total urban areas in some urban clusters being slightly obvious (Fig. 8b). To further analyze the possible reasons for the difference mentioned above, we selected several points aligning far from the 1:1 line (1 and 2 in Fig. 8a and 1, 2, 3, and 4 in Fig. 8b) for illustration. By overlaying our urban boundaries on the NTL images and overlaying the urban reference boundaries (GUBs) on the fine-resolution ISA maps (GAIA data), we found that the spatial inconsistency of these two datasets is acceptable (Fig. 8d). First, the pervious surface areas with both large size and dim artificial luminance (e.g., grass, forest, or farmland of the suburban areas between two towns/cities) are excluded in the NTL-derived urban extents, while they are included in the GUB data (see a1 and a2 in Fig. 8d). Second, the scattered artificial impervious areas with medium artificial luminance distributed around the urban fringe areas (e.g., large-scale shanty towns or villages) are excluded in the NTL-derived urban extents, while they are included in the GUB data (see b1 and b2 in Fig. 8d). Third, continuous and brightly lit areas connecting scattered artificial impervious areas (e.g., small cities with scatter patterns isolated away from surrounding megacities) are included in the NTL-derived urban extents, while they are excluded in the GUB data (see b3 and b4 in Fig. 8d). Besides, several hollow areas can also be observed within the NTL-derived urban extents (see a1, a2, b3, and b4 in Fig. 8d). These hollow areas with lower DNs at the local scales correspond to regions without ISA and therefore should be considered non-urban areas. Therefore, compared with the urban reference boundaries with multi-temporal records, the urban extents detected from NTL imagery using our approach are reasonable when considering the differences in the definitions, data sources, and approaches used in delineating urban boundaries.
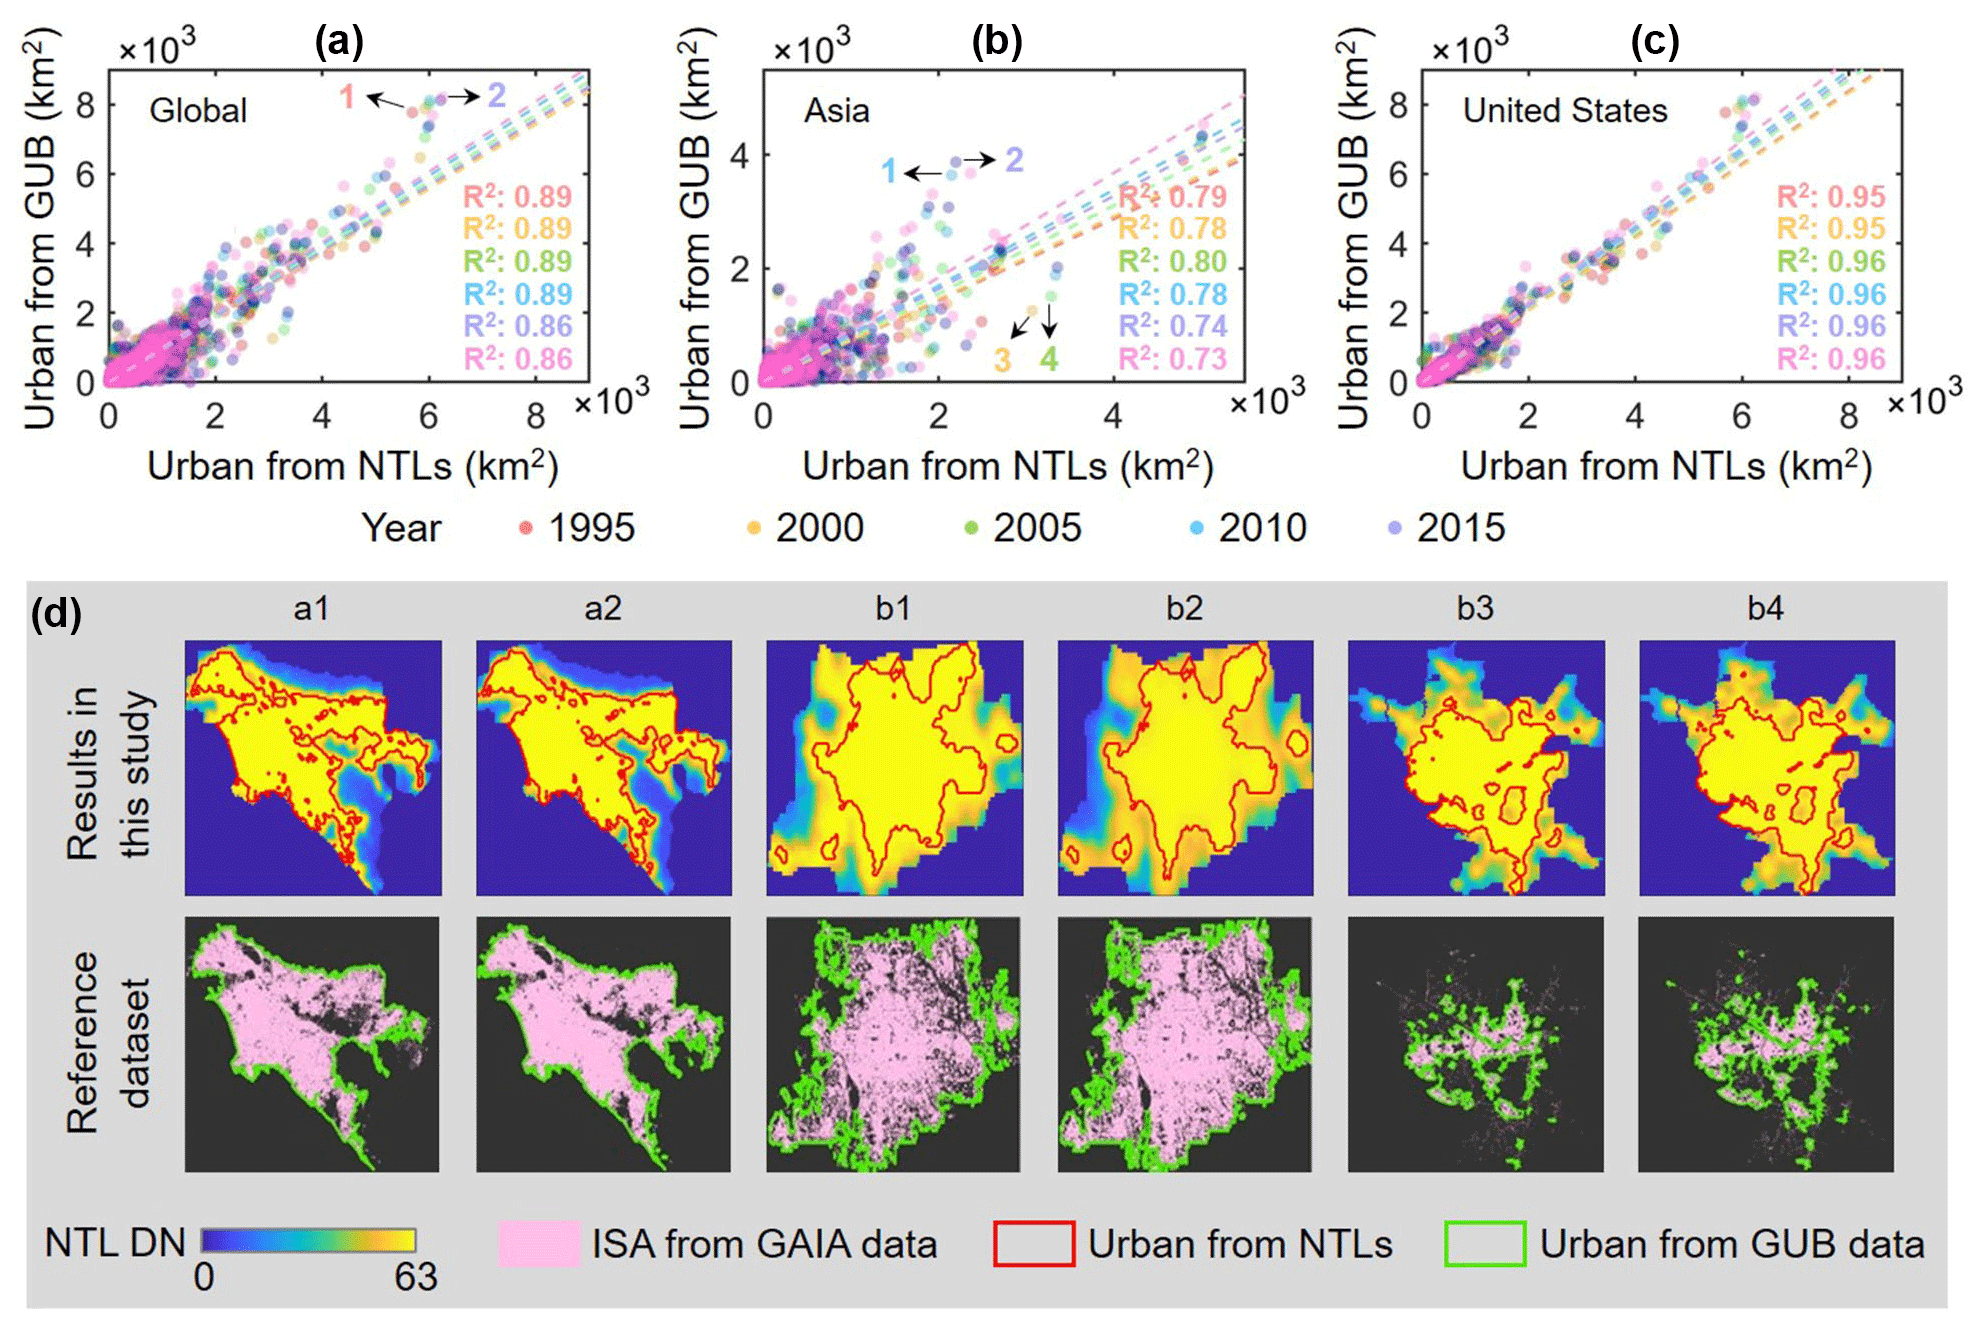
Figure 8Comparisons of spatial extents between NTL- and GUB-derived urban areas. (a–c) Comparisons of the total area of the urban extent for each urban cluster in different periods globally, in Asia, and in the United States, respectively. (d) A comparison of the urban spatial extent within the marked clusters (see a and b) in different years. a1 and a2 are comparisons in the Los Angeles-dominated urban cluster in 1995 and 2015, respectively. b1 and b2 are comparisons in the Beijing-dominated urban cluster in 2010 and 2015, respectively. b3 and b4 are comparisons in the Incheon–Seoul-dominated urban cluster in 2000 and 2005, respectively.
4.1.2 Comparison with historical Google imagery
Urban dynamics derived from NTL imagery also agree well with the actual urban extents in historical Google Earth images, for cities with different expansion patterns (Fig. 9). Here, for illustration, the NTL-derived urban boundaries were overlaid on both corresponding NTL images and corresponding high-resolution historical Google Earth maps (in 1992, 1999, 2006, 2013, and 2020) of two selected urban clusters. We find that our mapped results are capable of detecting the spatial changes in urban dynamics over a long period. That is, the delineated boundaries enable us to automatically distinguish urban areas and surrounding non-urban areas for different urbanization processes. For example, Chengdu (China) experienced an evident urban growth over the nearly 30 years; the derived urban boundary from NTL imagery can well depict the complex expansion patterns such as enclave expansion and multi-center continuous development. Furthermore, urban dynamics can be easily delineated from cities experiencing sprawl expansion; one case can be found in Omaha (United States). The results commonly suggest that the delineated urban extents using our approach include both locally intensive impervious areas and continuously lit areas with bright artificial luminance.
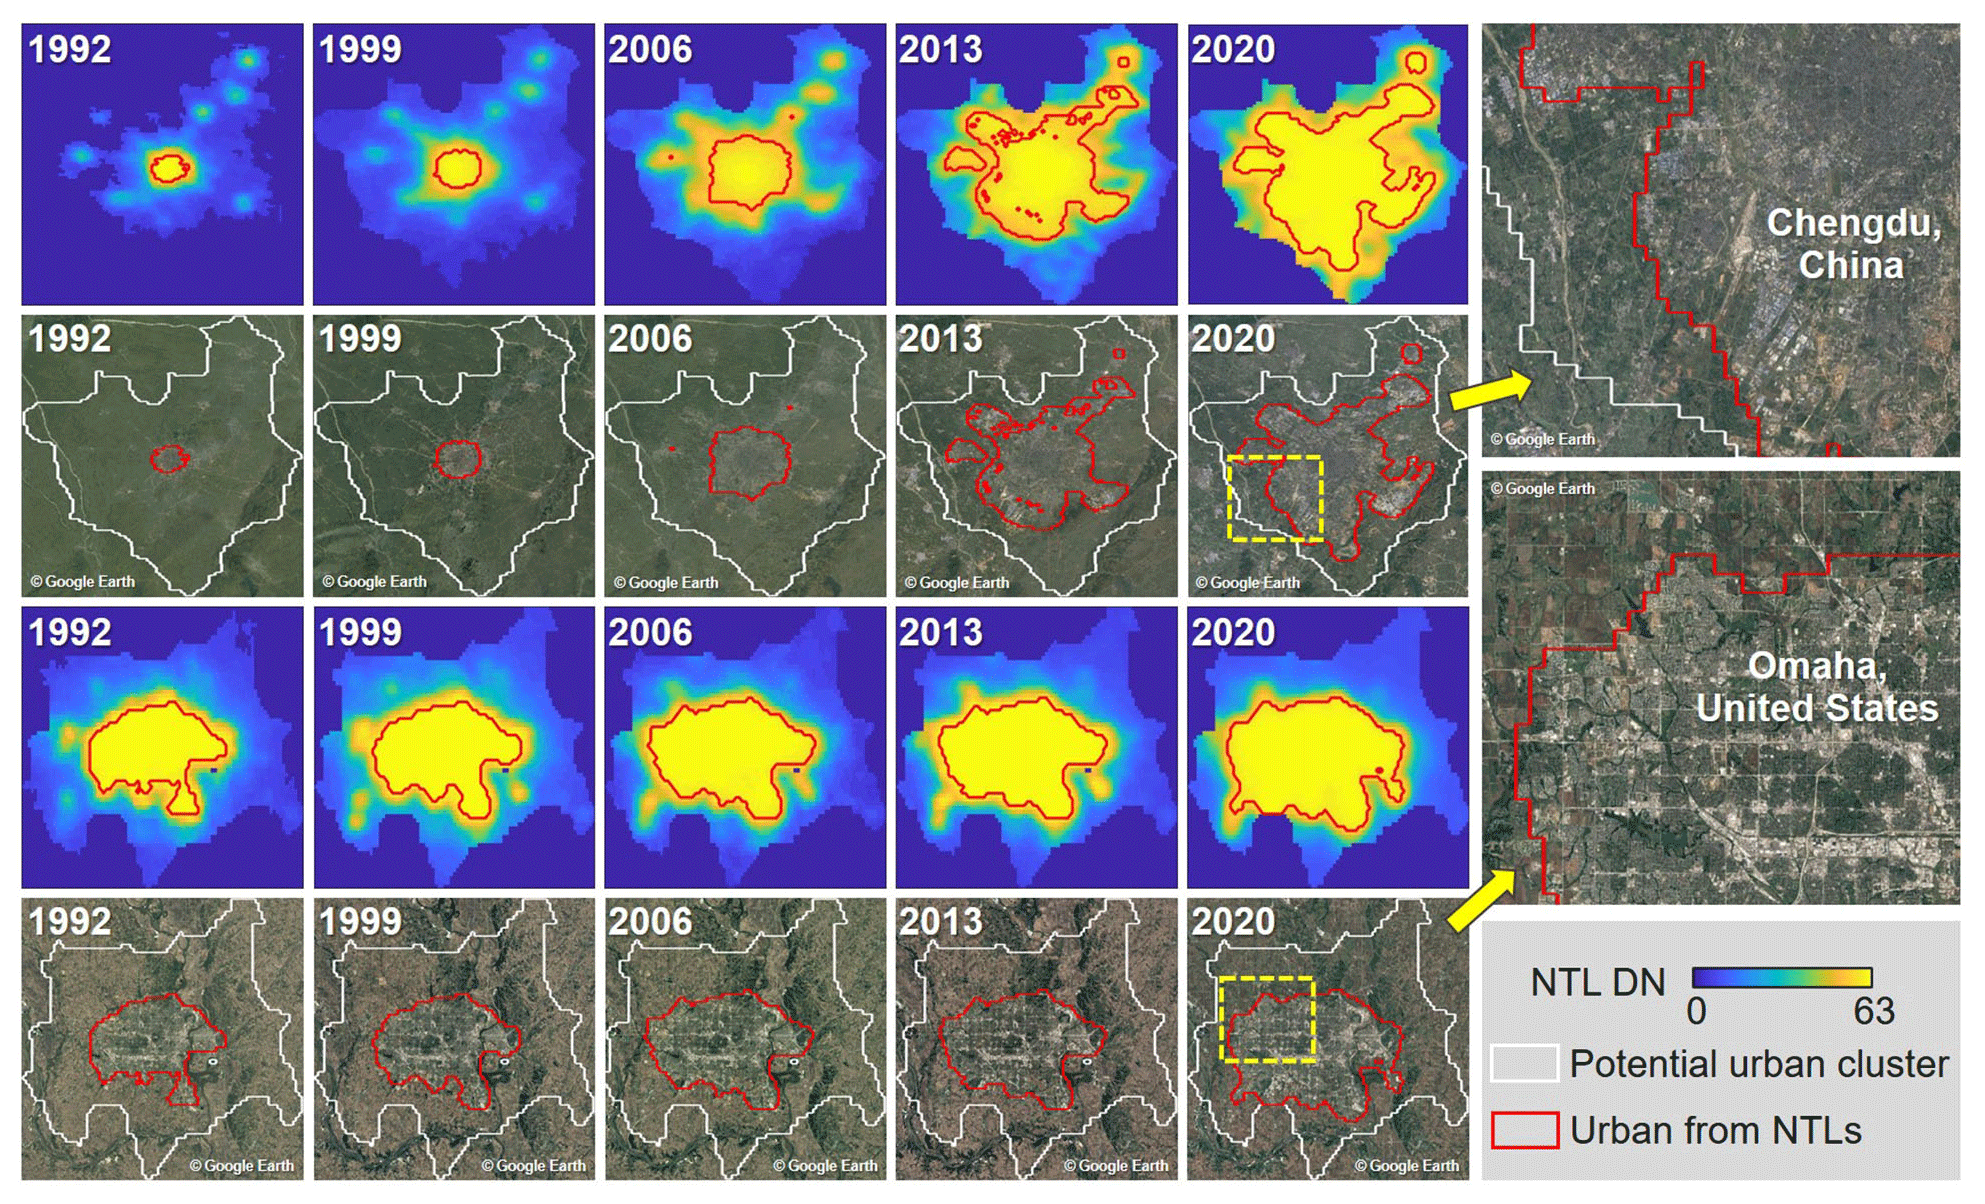
Figure 9Comparisons of urban extent from NTL observations with Google Earth imagery for two selected urban clusters in 1992, 1999, 2006, 2013, and 2020.
4.1.3 Comparison with socioeconomic statistics
Our time-series urban extents delineated from NTL imagery are partly consistent with gridded global population maps (Fig. 10). Considering that urbanization can be characterized in more ways than just human settlement, we applied a population indicator from the Gridded Population of the World (GPW) (Center for International Earth Science Information Network, 2018) to evaluate the reliability of urban extents generated in this study. The gridded populations of each potential urban cluster in different years were calculated to characterize their total populations. In general, we observed the correlation relationships between the urban sizes from NTL data and the total population from GPW data (Fig. 10a–e). Although the relationships between urban size and total population are complex and difficult to quantify, a general linear pattern is obvious between the two processed datasets, with correlation values at about 0.5 in different periods. Such weak correlations are reasonable because of the complex processes of urban expansion and population growth, which not only interact with each other but are also influenced by other factors such as economic growth, transportation infrastructure, governance, and planning controls, as well as the characteristics of the environment. Moreover, it was found that large urban areas in different periods always correspond to high populations, which is consistent with general cognition. Besides, the consistency of the spatial extents between urban areas and the high-population grid is also acceptable, such as a current case in Des Moines in the United States (Fig. 10f).
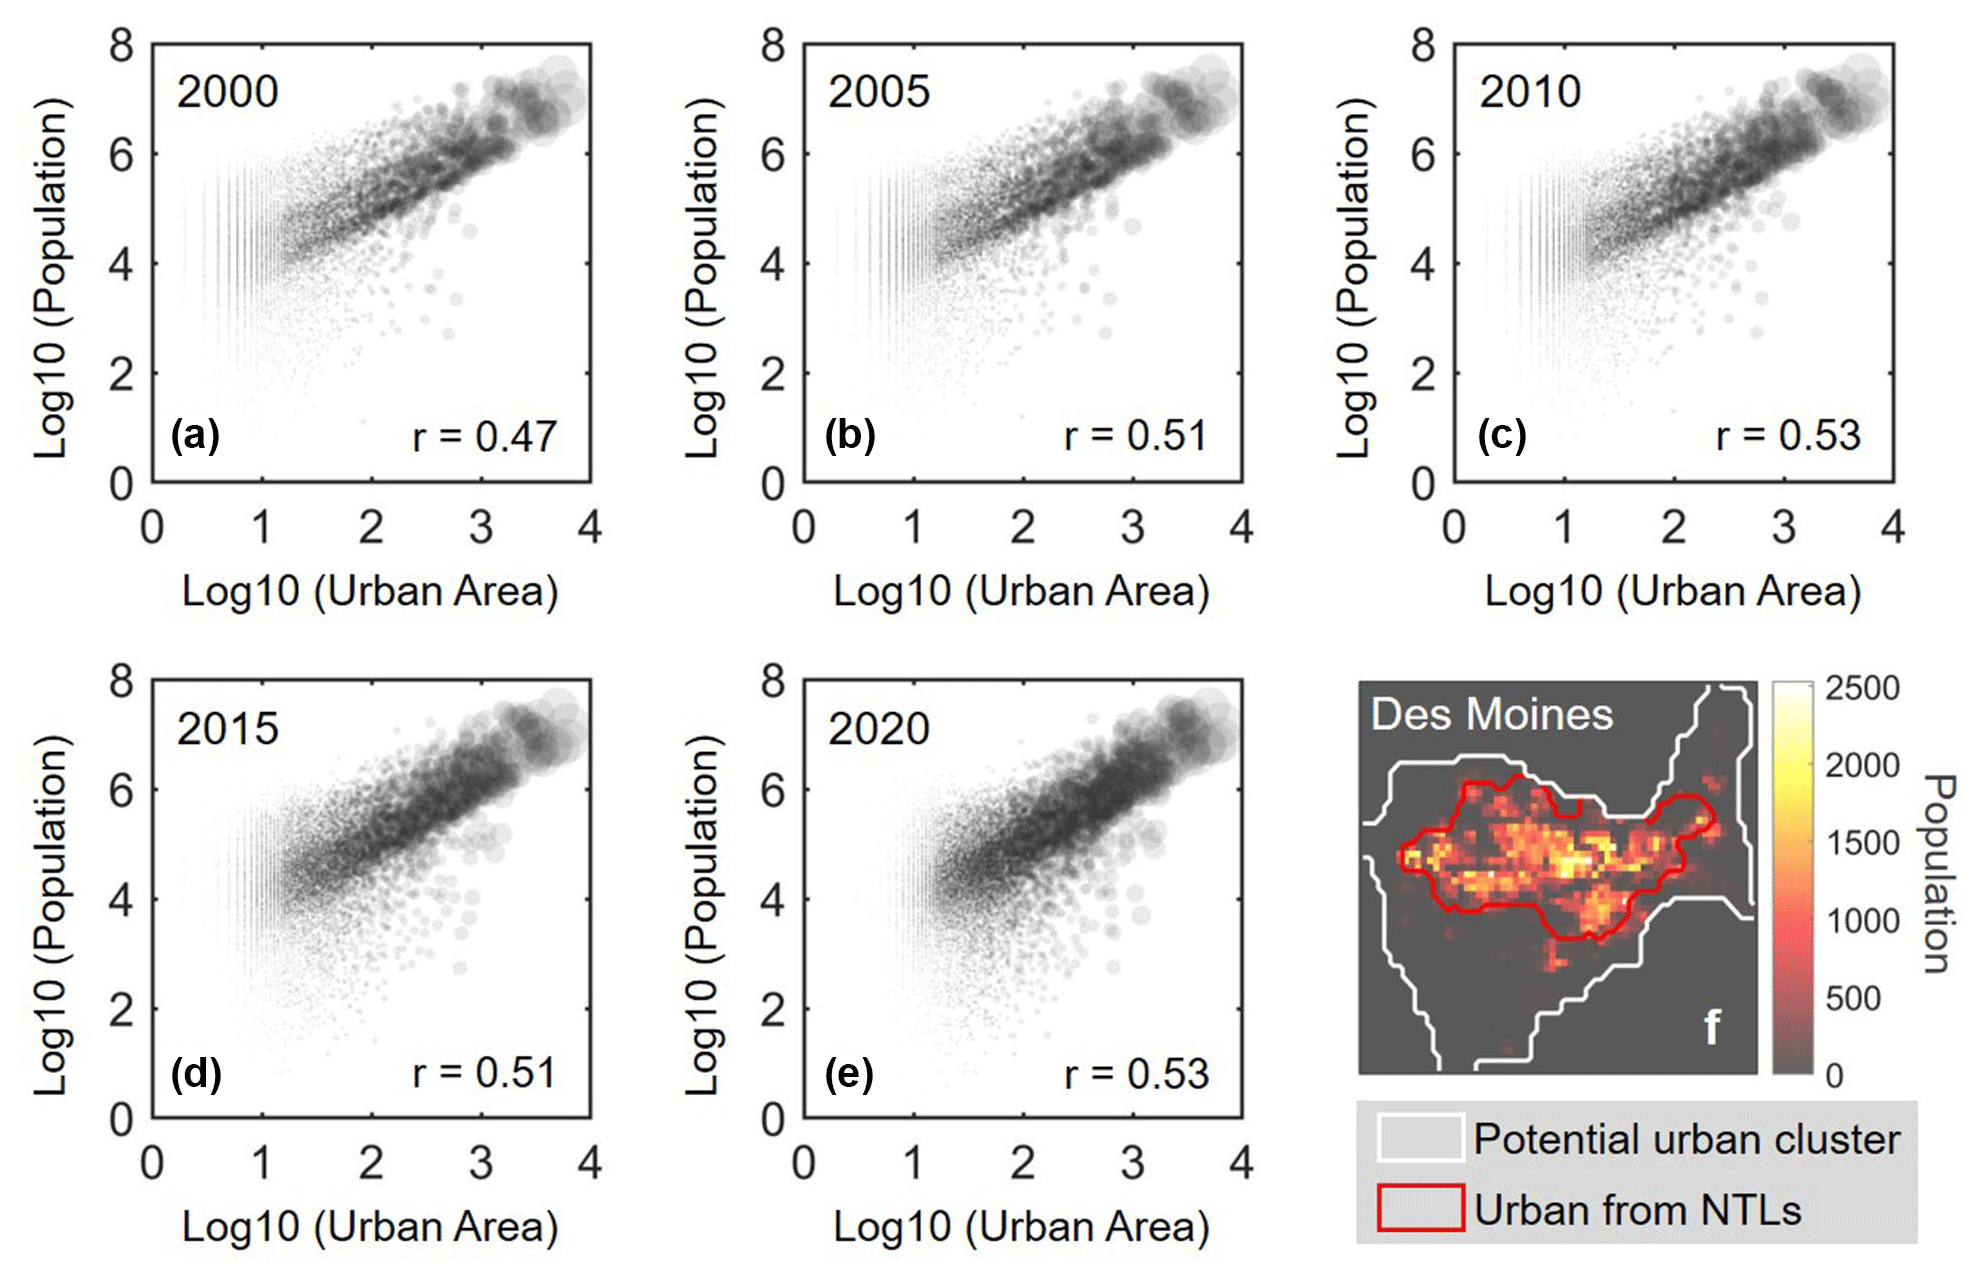
Figure 10Comparisons of the cluster-based urban extent from NTL imagery with the corresponding population from GPW data in different periods, globally. (a–e) The relationships of the total urban area (km2) with the total population for each potential urban cluster in 2000, 2005, 2010, 2015, and 2020, respectively. (f) The spatial distribution of urban extent and the corresponding gridded population at the urban cluster of Des Moines (United States) in 2020.
4.2 Spatiotemporal patterns of global urban dynamics
4.2.1 Global and continent levels
Widespread expansions with different degrees of global urban extents have been observed over the past 3 decades. Globally, the area percentage of global urban land as a proportion of the Earth's land surface was 0.22 % in 1992 and increased to 0.69 % in 2020, with a total increase of about 983 834 km2. The trends and magnitudes of urban growth vary among different continents (Fig. 11a). For example, Asia, Europe, and North America show both larger urban distribution and faster urban expansion from 1992 to 2020 compared with other continents. With a faster urban growth rate in Asia than on other continents, the total area of urban land in Asia has surpassed that in Europe and North America, ranking first in the world. Based on the current situation, the total urban area of Europe may exceed that of North America in the near future. The urban land percentage of each continent as a proportion of the global urban land also varies with time. Specifically, the dynamics of this percentage in Asia show a significant increasing trend, while those in Europe and North America show an obvious decreasing trend and a steady trend, respectively. Additionally, slightly increasing trends of urban land as a proportion of the global urban land are also observed in South America and Africa.
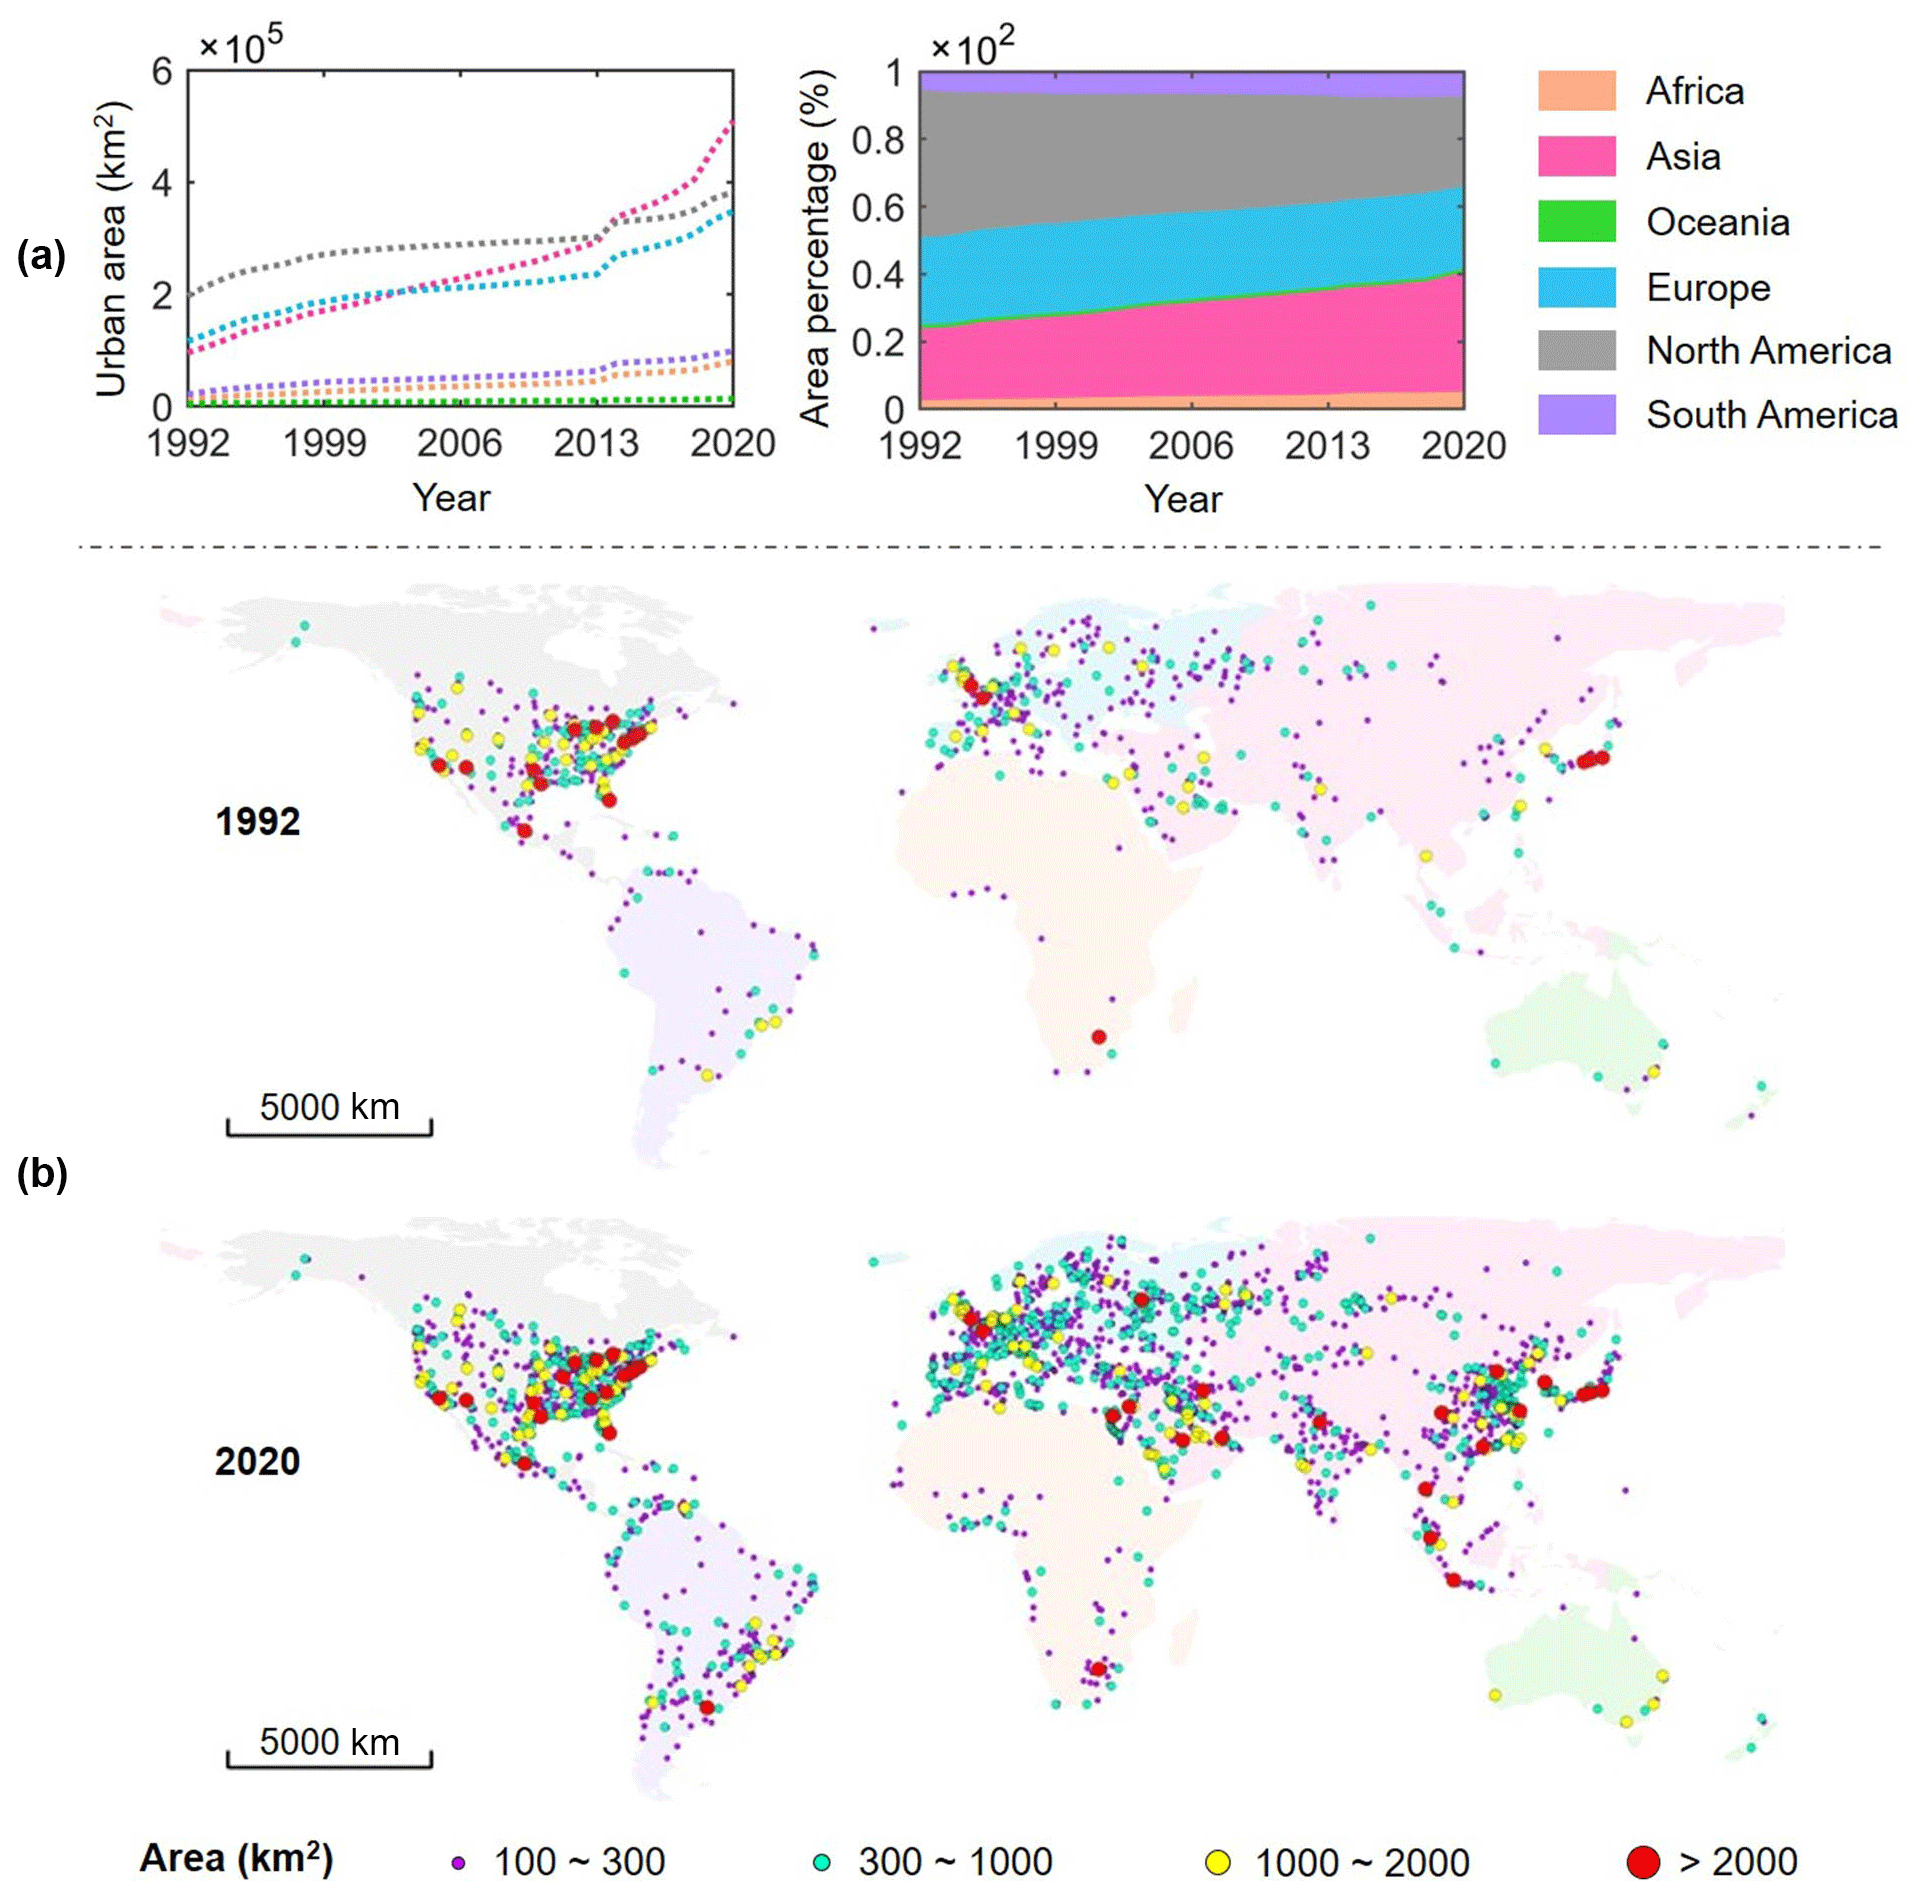
Figure 11Dynamics of urban extents from 1992 to 2020 at the continent level (a) and the spatial pattern of urban size in potential urban clusters in 1992 and 2020 (b).
The spatiotemporal patterns of urban size also vary considerably worldwide (Fig. 11b). To further analyze the general characteristics of local urban dynamics, the total areas of the derived urban extents for each potential urban cluster in 1992 and 2020 were calculated to characterize their urban size. In general, a notable enlargement in urban size has been observed in Asia from 1992 to 2020 due to its rapid urbanization processes. For example, the total number of the largest urban areas (i.e., area > 2000 km2) of Asia in 1992 is 3, increasing to 16 in 2020. Additionally, many small-size urban areas have been developed into medium- or large-size urban areas worldwide, especially in Europe and Asia. The distribution pattern of large and super-large urban areas (i.e., area > 1000 km2) in North America has remained unchanged since the 1990s.
4.2.2 Country level
The dynamics of urban extents from 1992 to 2020 also vary among different countries. The United States and China are the top two countries in terms of the total urban area in 2020, and the urban expansion in China is faster than that in the United States over the nearly 30 years (Fig. 12a). Although the total urban area in the top two countries occupies more than one-third of the global total in 2020, a slightly decreasing trend of this proportion, from 41 % in 1992 to 35 % in 2020, is observed. This can probably be attributed to a steady urbanization process in the United States and relatively rapid urbanization processes in other developing countries except for China. The urban areas of African countries are generally smaller than those of other countries, and the new expanded urban areas over the past 3 decades are also relatively small.
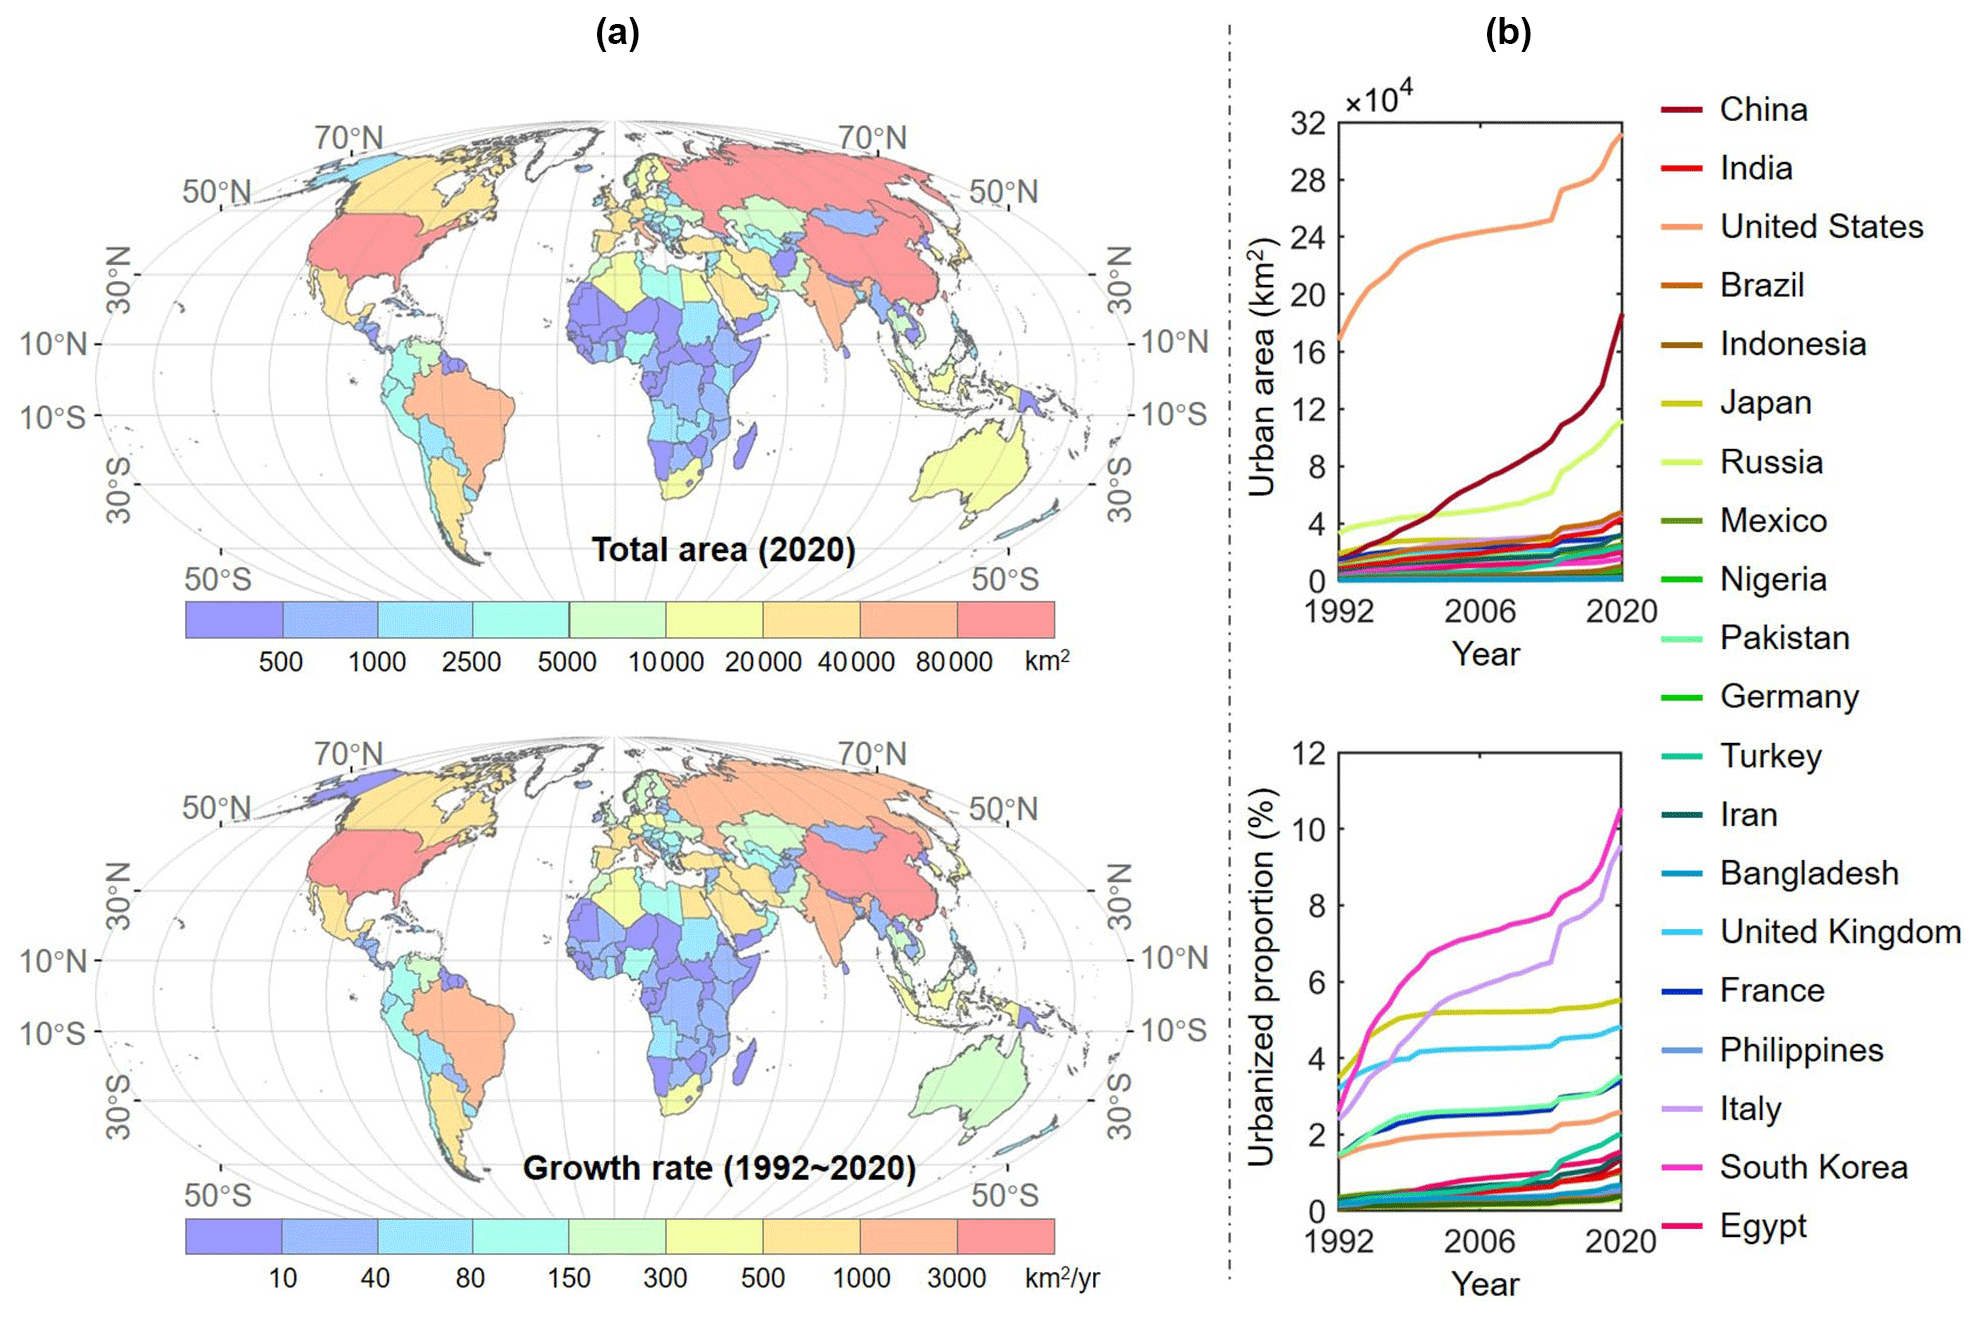
Figure 12Dynamics of urban extents from 1992 to 2020 both at the country level (a) and in the top 20 countries ranked by urban population in 2018 (b).
For the countries with dense urban populations, the growth patterns of urban areas and urbanized proportions also vary with spaces and time (Fig. 12b). We selected the top 20 countries ranked by urban population in 2018 (https://data.worldbank.org, last access: 5 September 2021) for illustration. By 2020, the total urban area in the United States and China occupies about 0.22 % and 0.13 % of the global urban area. Moreover, more than 170 000 km2 of land has been urbanized in China since the 1990s, showing a stronger momentum of increase in urban extents in the future than the remaining countries. At the country level, the urbanized proportion of the total land area in developed countries such as Japan, the United Kingdom, South Korea, and Italy is higher, followed by Germany, France, and the United States. Besides, among these countries with a high proportion of urban extents, South Korea and Italy have experienced a relatively rapid urbanization process from 1992 to 2020.
4.2.3 City level
The spatial patterns of urban expansion at local scales from 1992 to 2020 in China and the United States are quite different (Fig. 13). We mapped the spatiotemporal distribution of the urban extents at both regional and local scales to further compare the historical pathways of the newly expanded urban areas since 1992 in developed as well as developing countries. In general, the spatial extents of the majority of urban areas over the nearly 30 years in the United States are relatively stable, while those in China tend to be enlarged at different degrees. For instance, expansions in metropolises of the United States like Chicago and Houston always occur in the early period. In contrast, slight expansions in small cities (e.g., Clarksville and Omaha) during the last decade can also be detected. However, urban areas in China exhibit diverse patterns of spatial expansion over the past decades in terms of expansion size, pace, direction, and shape. For instance, Chengdu, Xi'an, and Hefei in China have developed into large cities due to the rapid agglomerations of population, industry, and economic activities since the turn of the new century. Moreover, expansions in metropolises of China like Beijing and Shanghai are also evident. As a valley city, the urban sprawl in Lanzhou is mainly restricted by the landform, exhibiting a narrow shape of the strip.
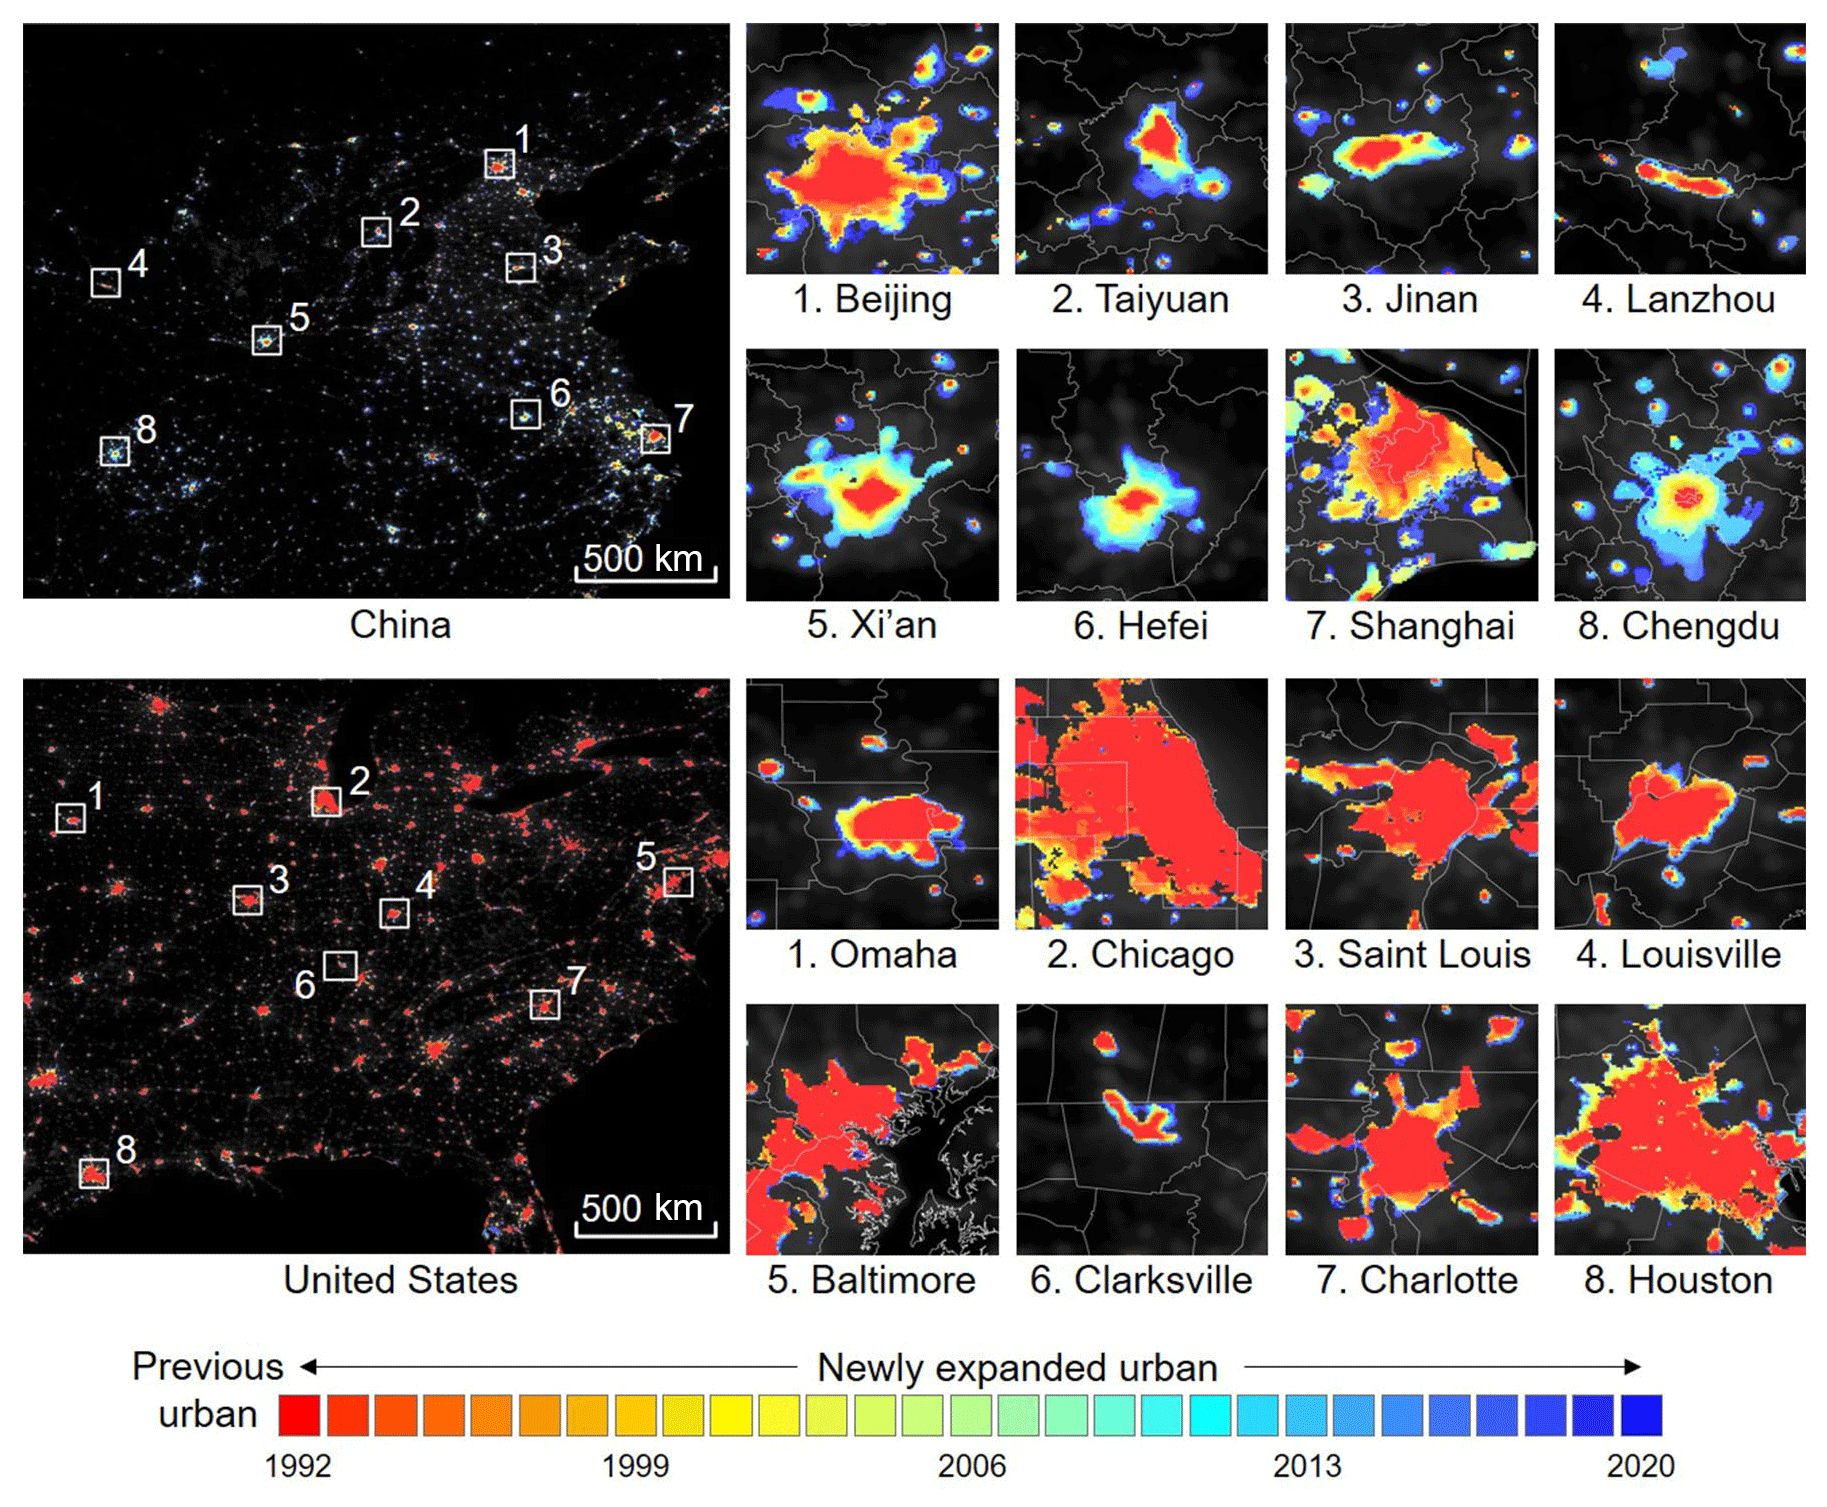
Figure 13Dynamics of urban extents from 1992 to 2020 in different cities of China and the United States. The spatial range of each subset is 100 km × 100 km.
The global dataset of annual urban extents (1992–2020) from nighttime light imagery is available at https://doi.org/10.6084/m9.figshare.16602224.v1 (Zhao et al., 2021). This dataset was tagged in GeoTIFF file format, with a spatial resolution of 30 arcsec (∼ 1 km) under the WGS84 geographic coordinate system. A detailed description of this dataset is also provided. The uploaded imagery can be processed using free GIS software such as QGIS. The harmonized global NTL dataset used as the primary dataset for mapping the global time-series urban extents is available at https://doi.org/10.6084/m9.figshare.9828827.v5 (Li et al., 2021). Additionally, other ancillary data used in this study include water masks derived from MODIS MOD44W data, gas flare data (Elvidge et al., 2009), binary urban map data (Zhou et al., 2015, 2018), and GAIA data (Gong et al., 2020).
In this study, we generated a global dataset of annual urban extents (1992–2020) using consistent NTL observations and analyzed the spatiotemporal patterns of global urban dynamics at different levels over the past 3 decades. The advantage of this dataset is to provide spatially explicit global urban maps with long temporal coverage for depicting the dynamics of urban areas associated with locally high intensity human activities. Based on previous studies, a new stepwise-partitioning framework, including potential urban cluster identification, initial urban extent delineation, and urban sequence updating, was developed to generate the annual urban extents from harmonized NTL time-series imagery at the global scale. Then, we evaluated the global urban extents (1992–2020) using a variety of reference data including fine-resolution ISA data, other urban boundary data, Google Maps, and gridded population data. Next, the spatiotemporal patterns of the global urban dynamics since the 1990s were further discussed at the global, continent, country, and city levels.
The evaluations indicate that this dataset of urban extents is reliable for characterizing spatial extents associated with intensive human settlements and high-intensity socioeconomic activities, over space and time. In general, the global urban land area as a percentage of the total Earth's land surface is 0.22 % in 1992 and increased to 0.69 % in 2020. Specifically, Asia, Europe, and North America show a larger urban distribution and faster urban expansion than other continents. The annual percentages of urban land as a proportion of the global urban land in Asia show a significant increasing trend. In contrast, those in Europe and North America show an obvious decreasing trend and a steady trend, respectively. The United States and China are the top two countries in terms of the total urban area in 2020, and the urban expansion in China is faster than that in the United States over the nearly 30 years. Overall, the spatial extents of the majority of urban areas since the 1990s in the United States are generally stable, while those in China tend to be enlarged at different degrees. This study further extends the applications of NTL remote sensing to urban-related studies. The stepwise urban mapping framework improved in this study specialized in identifying the urbanized areas by classifying NTL signals of the potential urban domains, including urban cores and suburban and rural areas. Differently from other global urban mapping time-series products (e.g., artificial impervious areas), our dataset is unique and advanced in its capacity to identify areas associated with locally high intensity urbanization and socioeconomic activities. It should be noted that some developed areas, such as areas with extensive luminosity loss due to the policy or status of light turndown or turnoff at night (Zhao et al., 2019), may be omitted in this dataset. This limitation may be reduced by fusing NTL signals with other effective information mined from fine-resolution ISA data (Gong et al., 2020) and social media big data (Ma, 2018). In general, our dataset shows great potential in various urban studies, such as studies of urbanization and the corresponding impacts on land use, habitat quality, urban heat islands, and urban climate.
YZ and MZ designed the study; XL collected the data; YZ, CC, and MZ discussed the method and analysis sections; MZ implemented the study and drafted the manuscript; YZ, CC, XL, SS, and CS reviewed and revised the manuscript.
At least one of the (co-)authors is a member of the editorial board of Earth System Science Data. The peer-review process was guided by an independent editor, and the authors also have no other competing interests to declare.
Publisher's note: Copernicus Publications remains neutral with regard to jurisdictional claims in published maps and institutional affiliations.
We would like to thank the high-performance computing support from the Center for Geodata and Analysis, Faculty of Geographical Science, Beijing Normal University (https://gda.bnu.edu.cn/, last access: 5 September 2021). We appreciate the reviewers and handling editor for their constructive comments and suggestions.
This research has been supported by the National Natural Science Foundation of China (grant nos. 42041007 and 42101462) and the China Postdoctoral Science Foundation (grant no. 2021M690019).
This paper was edited by Alexander Gruber and reviewed by two anonymous referees.
Cao, Q., Yu, D., Georgescu, M., Wu, J., and Wang, W.: Impacts of future urban expansion on summer climate and heat-related human health in eastern China, Environ. Int., 112, 134–146, https://doi.org/10.1016/j.envint.2017.12.027, 2018.
Center for International Earth Science Information Network: Gridded Population of the World, Version 4 (GPWv4): Population Count, Revision 11, NASA Socioeconomic Data and Applications Center (SEDAC) [data set], https://doi.org/10.7927/H4JW8BX5, 2018.
Chen, J., Chen, J., Liao, A. P., Cao, X., Chen, L. J., Chen, X. H., He, C. Y., Han, G., Peng, S., Lu, M., Zhang, W. W., Tong, X. H., and Mills, J.: Global land cover mapping at 30 m resolution: A POK-based operational approach, ISPRS J. Photogramm., 103, 7–27, https://doi.org/10.1016/j.isprsjprs.2014.09.002, 2015.
Chen, Y. M., Li, X., Wang, S. J., Liu, X. P., and Ai, B.: Simulating Urban Form and Energy Consumption in the Pearl River Delta Under Different Development Strategies, Ann. Assoc. Am. Geogr., 103, 1567–1585, https://doi.org/10.1080/00045608.2012.740360, 2013.
Chen, Z. Q., Yu, B. L., Song, W., Liu, H. X., Wu, Q. S., Shi, K. F., and Wu, J. P.: A New Approach for Detecting Urban Centers and Their Spatial Structure With Nighttime Light Remote Sensing, IEEE T. Geosci. Remote, 55, 6305–6319, https://doi.org/10.1109/tgrs.2017.2725917, 2017.
Corbane, C., Florczyk, A., Pesaresi, M., Politis, P., and Syrris, V.: GHS-BUILT R2018A – GHS built-up grid, derived from Landsat, multitemporal (1975–1990–2000–2014), European Commission, Joint Research Centre (JRC) [data set], https://doi.org/10.2905/jrc-ghsl-10007, 2018.
Defries, R. S., Bounoua, L., and Collatz, G. J.: Human modification of the landscape and surface climate in the next fifty years, Glob. Change Biol., 8, 438–458, 2002.
Elvidge, C. D., Daniel, Z., Baugh, K. E., Tuttle, B. T., and Mikhail, Z.: A Fifteen Year Record of Global Natural Gas Flaring Derived from Satellite Data, Energies, 2, 595–622, https://doi.org/10.3390/en20300595, 2009.
Esch, T., Marconcini, M., Felbier, A., Roth, A., Heldens, W., Huber, M., Schwinger, M., Taubenbock, H., Muller, A., and Dech, S.: Urban Footprint Processor-Fully Automated Processing Chain Generating Settlement Masks From Global Data of the TanDEM-X Mission, IEEE Geosci. Remote S., 10, 1617–1621, https://doi.org/10.1109/lgrs.2013.2272953, 2013.
Florczyk, A. J., Melchiorri, M., Corbane, C., Schiavina, M., Maffenini, M., Pesaresi, M., Politis, P., Sabo, S., Freire, S., Ehrlich, D., Kemper, T., Tommasi, P., Airaghi, D., and Zanchetta, L.: Description of the GHS Urban Centre Database 2015, Publications Office of the European Union [data set], https://doi.org/10.2760/037310, 2019.
Gong, P., Wang, J., Yu, L., Zhao, Y. C., Zhao, Y. Y., Liang, L., Niu, Z. G., Huang, X. M., Fu, H. H., Liu, S., Li, C. C., Li, X. Y., Fu, W., Liu, C. X., Xu, Y., Wang, X. Y., Cheng, Q., Hu, L. Y., Yao, W. B., Zhang, H., Zhu, P., Zhao, Z. Y., Zhang, H. Y., Zheng, Y. M., Ji, L. Y., Zhang, Y. W., Chen, H., Yan, A., Guo, J. H., Yu, L., Wang, L., Liu, X. J., Shi, T. T., Zhu, M. H., Chen, Y. L., Yang, G. W., Tang, P., Xu, B., Giri, C., Clinton, N., Zhu, Z. L., Chen, J., and Chen, J.: Finer resolution observation and monitoring of global land cover: first mapping results with Landsat TM and ETM+ data, Int. J. Remote Sens., 34, 2607–2654, https://doi.org/10.1080/01431161.2012.748992, 2013.
Gong, P., Liu, H., Zhang, M. N., Li, C. C., Wang, J., Huang, H. B., Clinton, N., Ji, L. Y., Li, W. Y., Bai, Y. Q., Chen, B., Xu, B., Zhu, Z. L., Yuan, C., Suen, H. P., Guo, J., Xu, N., Li, W. J., Zhao, Y. Y., Yang, J., Yu, C. Q., Wang, X., Fu, H. H., Yu, L., Dronova, I., Hui, F. M., Cheng, X., Shi, X. L., Xiao, F. J., Liu, Q. F., and Song, L. C.: Stable classification with limited sample: transferring a 30-m resolution sample set collected in 2015 to mapping 10-m resolution global land cover in 2017, Sci. Bull., 64, 370–373, https://doi.org/10.1016/j.scib.2019.03.002, 2019.
Gong, P., Li, X., Wang, J., Bai, Y., Chen, B., Hu, T., Liu, X., Xu, B., Yang, J., Zhang, W., and Zhou, Y.: Annual maps of global artificial impervious area (GAIA) between 1985 and 2018, Remote Sens. Environ., 236, 111510, https://doi.org/10.1016/j.rse.2019.111510, 2020.
Guneralp, B., Zhou, Y., Urge-Vorsatz, D., Gupta, M., Yu, S., Patel, P. L., Fragkias, M., Li, X., and Seto, K. C.: Global scenarios of urban density and its impacts on building energy use through 2050, P. Natl. Acad. Sci. USA, 114, 8945–8950, https://doi.org/10.1073/pnas.1606035114, 2017.
Homer, C., Dewitz, J., Yang, L. M., Jin, S., Danielson, P., Xian, G., Coulston, J., Herold, N., Wickham, J., and Megown, K.: Completion of the 2011 National Land Cover Database for the Conterminous United States – Representing a Decade of Land Cover Change Information, Photogramm. Eng. Remote Sens., 81, 345–354, https://doi.org/10.1016/S0099-1112(15)30100-2, 2015.
Hou, D., Meng, F., and Prishchepov, A. V.: How is urbanization shaping agricultural land-use? Unraveling the nexus between farmland abandonment and urbanization in China, Landscape Urban Plan., 214, 104170, https://doi.org/10.1016/j.landurbplan.2021.104170, 2021.
Huang, X., Li, J., Yang, J., Zhang, Z., Li, D., and Liu, X.: 30 m global impervious surface area dynamics and urban expansion pattern observed by Landsat satellites: From 1972 to 2019, Sci. China Earth Sci., 64, 1922–1933, https://doi.org/10.1007/s11430-020-9797-9, 2021.
Jiang, L., Deng, X., and Seto, K. C.: The impact of urban expansion on agricultural land use intensity in China, Land Use Policy, 35, 33–39, https://doi.org/10.1016/j.landusepol.2013.04.011, 2013.
Kamarajugedda, S. A., Mandapaka, P. V., and Lo, E. Y. M.: Assessing urban growth dynamics of major Southeast Asian cities using night-time light data, Int. J. Remote Sens., 38, 6073–6093, https://doi.org/10.1080/01431161.2017.1346846, 2017.
Kuang, W. H.: 70 years of urban expansion across China: trajectory, pattern, and national policies, Sci. Bull., 65, 1970–1974, https://doi.org/10.1016/j.scib.2020.07.005, 2020.
Kuang, W. H., Zhang, S., Li, X., and Lu, D.: A 30 m resolution dataset of China's urban impervious surface area and green space, 2000–2018, Earth Syst. Sci. Data, 13, 63–82, https://doi.org/10.5194/essd-13-63-2021, 2021a.
Kuang, W. H., Du, G. M., Lu, D. S., Dou, Y. Y., Li, X. Y., Zhang, S., Chi, W. F., Dong, J. W., Chen, G. S., Yin, Z. R., Pan, T., Hamdi, R., Hou, Y. L., Chen, C. Y., Li, H., and Miao, C.: Global observation of urban expansion and land-cover dynamics using satellite big-data, Sci. Bull., 66, 297–300, https://doi.org/10.1016/j.scib.2020.10.022, 2021b.
Lawler, J. J., Lewis, D. J., Nelson, E., Plantinga, A. J., Polasky, S., Withey, J. C., Helmers, D. P., Martinuzzi, S., Pennington, D., and Radeloff, V. C.: Projected land-use change impacts on ecosystem services in the United States, P. Natl. Acad. Sci. USA, 111, 7492–7497, https://doi.org/10.1073/pnas.1405557111, 2014.
Li, X. and Gong, P.: Urban growth models: progress and perspective, Sci. Bull., 61, 1637–1650, https://doi.org/10.1007/s11434-016-1111-1, 2016.
Li, X., Zhou, Y., Eom, J., Yu, S., and Asrar, G. R.: Projecting Global Urban Area Growth Through 2100 Based on Historical Time Series Data and Future Shared Socioeconomic Pathways, Earth's Future, 7, 351–362, https://doi.org/10.1029/2019ef001152, 2019.
Li, X., Zhou, Y., Zhao, M., and Zhao, X.: A harmonized global nighttime light dataset 1992–2018, Sci. Data, 7, 168, https://doi.org/10.1038/s41597-020-0510-y, 2020a.
Li, X., Gong, P., Zhou, Y., Wang, J., Bai, Y., Chen, B., Hu, T., Xiao, Y., Xu, B., Yang, J., Liu, X., Cai, W., Huang, H., Wu, T., Wang, X., Lin, P., Li, X., Chen, J., He, C., Li, X., Yu, L., Clinton, N., and Zhu, Z.: Mapping global urban boundaries from the global artificial impervious area (GAIA) data, Environ. Res. Lett., 15, 094044, https://doi.org/10.1088/1748-9326/ab9be3, 2020b.
Li, X., Zhou, Y., Zhao, M., and Zhao, X.: Harmonization of DMSP and VIIRS nighttime light data from 1992–2020 at the global scale, figshare [data set], https://doi.org/10.6084/m9.figshare.9828827.v5, 2021.
Li, X. C. and Zhou, Y. Y.: A Stepwise Calibration of Global DMSP/OLS Stable Nighttime Light Data (1992–2013), Remote Sens., 9, 637, https://doi.org/10.3390/rs9060637, 2017a.
Li, X. C. and Zhou, Y. Y.: Urban mapping using DMSP/OLS stable night-time light: a review, Int. J. Remote Sens., 38, 6030–6046, https://doi.org/10.1080/01431161.2016.1274451, 2017b.
Li, X. C., Gong, P., and Liang, L.: A 30-year (1984–2013) record of annual urban dynamics of Beijing City derived from Landsat data, Remote Sens. Environ., 166, 78–90, https://doi.org/10.1016/j.rse.2015.06.007, 2015.
Liang, L., Wang, Z., and Li, J.: The effect of urbanization on environmental pollution in rapidly developing urban agglomerations, J. Clean. Product., 237, 117649, https://doi.org/10.1016/j.jclepro.2019.117649, 2019.
Liu, X., Huang, Y., Xu, X., Li, X., Li, X., Ciais, P., Lin, P., Gong, K., Ziegler, A. D., Chen, A., Gong, P., Chen, J., Hu, G., Chen, Y., Wang, S., Wu, Q., Huang, K., Estes, L., and Zeng, Z.: High-spatiotemporal-resolution mapping of global urban change from 1985 to 2015, Nat. Sustain., 3, 564–570, https://doi.org/10.1038/s41893-020-0521-x, 2020.
Liu, X. P., Hu, G. H., Chen, Y. M., Li, X., Xu, X. C., Li, S. Y., Pei, F. S., and Wang, S. J.: High-resolution multi-temporal mapping of global urban land using Landsat images based on the Google Earth Engine Platform, Remote Sens. Environ., 209, 227–239, https://doi.org/10.1016/j.rse.2018.02.055, 2018.
Liu, Z. F., He, C. Y., Zhou, Y. Y., and Wu, J. G.: How much of the world's land has been urbanized, really? A hierarchical framework for avoiding confusion, Landscape Ecol., 29, 763–771, https://doi.org/10.1007/s10980-014-0034-y, 2014.
Lu, X., Lin, C., Li, W., Chen, Y., Huang, Y., Fung, J. C. H., and Lau, A. K. H.: Analysis of the adverse health effects of PM2.5 from 2001 to 2017 in China and the role of urbanization in aggravating the health burden, The Sci. Total Environ., 652, 683–695, https://doi.org/10.1016/j.scitotenv.2018.10.140, 2019.
Ma, T.: Multi-Level Relationships between Satellite-Derived Nighttime Lighting Signals and Social Media-Derived Human Population Dynamics, Remote Sens., 10, 1128, https://doi.org/10.3390/rs10071128, 2018.
Ma, T., Zhou, Y. K., Zhou, C. H., Haynie, S., Pei, T., and Xu, T.: Night-time light derived estimation of spatio-temporal characteristics of urbanization dynamics using DMSP/OLS satellite data, Remote Sens. Environ., 158, 453–464, https://doi.org/10.1016/j.rse.2014.11.022, 2015.
Ma, T., Yin, Z., and Zhou, A.: Delineating Spatial Patterns in Human Settlements Using VIIRS Nighttime Light Data: A Watershed-Based Partition Approach, Remote Sens., 10, 465, https://doi.org/10.3390/rs10030465, 2018.
Parvati, K., Rao, B. S. P., and Das, M. M.: Image Segmentation Using Gray-Scale Morphology and Marker-Controlled Watershed Transformation, Discrete Dyn. Nat. Soc., 2008, 384346, https://doi.org/10.1155/2008/384346, 2008.
Qiang, Z., He, K., and Hong, H.: Policy: Cleaning China's air, Nature, 484, 161–162, 2012.
Schneider, A., Friedl, M. A., and Potere, D.: A new map of global urban extent from MODIS satellite data, Environ. Res. Lett., 4, 044003, https://doi.org/10.1088/1748-9326/4/4/044003, 2009.
Schneider, A., Friedl, M. A., and Potere, D.: Mapping global urban areas using MODIS 500-m data: New methods and datasets based on “urban ecoregions”, Remote Sens. Environ., 114, 1733–1746, 10.1016/j.rse.2010.03.003, 2010.
Seto, K. C., Giineralp, B., and Hutyra, L. R.: Global forecasts of urban expansion to 2030 and direct impacts on biodiversity and carbon pools, P. Natl. Acad. Sci. USA, 109, 16083–16088, 2012.
Solecki, W., Seto, K. C., and Marcotullio, P. J.: It's Time for an Urbanization Science, Environment, 55, 12–17, https://doi.org/10.1080/00139157.2013.748387, 2013.
Su, Y. X., Chen, X. Z., Wang, C. Y., Zhang, H. O., Liao, J. S., Ye, Y. Y., and Wang, C. J.: A new method for extracting built-up urban areas using DMSP-OLS nighttime stable lights: a case study in the Pearl River Delta, southern China, Geosci. Remote Sens., 52, 218–238, https://doi.org/10.1080/15481603.2015.1007778, 2015.
Taubenbock, H., Esch, T., Felbier, A., Wiesner, M., Roth, A., and Dech, S.: Monitoring urbanization in mega cities from space, Remote Sens. Environ., 117, 162–176, https://doi.org/10.1016/j.rse.2011.09.015, 2012.
Wang, Y. P. and Shen, Z. H.: Comparing Luojia 1-01 and VIIRS Nighttime Light Data in Detecting Urban Spatial Structure Using a Threshold-Based Kernel Density Estimation, Remote Sens., 13, 1574, https://doi.org/10.3390/rs13081574, 2021.
Yang, J., Siri, J. G., Remais, J. V., Cheng, Q., Zhang, H., Chan, K. K. Y., Sun, Z., Zhao, Y., Cong, N., Li, X., Zhang, W., Bai, Y., Bi, J., Cai, W., Chan, E. Y. Y., Chen, W., Fan, W., Fu, H., He, J., Huang, H., Ji, J. S., Jia, P., Jiang, X., Kwan, M.-P., Li, T., Li, X., Liang, S., Liang, X., Liang, L., Liu, Q., Lu, Y., Luo, Y., Ma, X., Schwartländer, B., Shen, Z., Shi, P., Su, J., Wu, T., Yang, C., Yin, Y., Zhang, Q., Zhang, Y., Zhang, Y., Xu, B., and Gong, P.: The Tsinghua–Lancet Commission on Healthy Cities in China: unlocking the power of cities for a healthy China, Lancet, 391, 2140–2184, https://doi.org/10.1016/S0140-6736(18)30486-0, 2018.
Yu, L., Liu, X. X., Zhao, Y. Y., Yu, C. Q., and Gong, P.: Difficult to map regions in 30 m global land cover mapping determined with a common validation dataset, Int. J. Remote Sens., 39, 4077–4087, https://doi.org/10.1080/01431161.2018.1455238, 2018.
Zhao, M., Zhou, Y., Li, X., Cao, W., He, C., Yu, B., Li, X., Elvidge, C. D., Cheng, W., and Zhou, C.: Applications of Satellite Remote Sensing of Nighttime Light Observations: Advances, Challenges, and Perspectives, Remote Sens., 11, 1971, https://doi.org/10.3390/rs11171971, 2019.
Zhao, M., Cheng, W., Zhou, C., Li, M., Huang, K., and Wang, N.: Assessing Spatiotemporal Characteristics of Urbanization Dynamics in Southeast Asia Using Time Series of DMSP/OLS Nighttime Light Data, Remote Sens., 10, 47, https://doi.org/10.3390/rs10010047, 2018.
Zhao, M., Zhou, Y., Li, X., Zhou, C., Cheng, W., Li, M., and Huang, K.: Building a Series of Consistent Night-Time Light Data (1992–2018) in Southeast Asia by Integrating DMSP-OLS and NPP-VIIRS, IEEE T. Geosci. Remote, 58, 1843–1856, https://doi.org/10.1109/tgrs.2019.2949797, 2020a.
Zhao, M., Zhou, Y., Li, X., Cheng, W., Zhou, C., Ma, T., Li, M., and Huang, K.: Mapping urban dynamics (1992–2018) in Southeast Asia using consistent nighttime light data from DMSP and VIIRS, Remote Sens. Environ., 248, 111980, https://doi.org/10.1016/j.rse.2020.111980, 2020b.
Zhao, M., Cheng, C., Zhou, Y., Li, X., Shen, S., and Song, C.: A global dataset of annual urban extents (1992–2020) from harmonized nighttime lights, figshare [data set], https://doi.org/10.6084/m9.figshare.16602224.v1, 2021.
Zhao, X., Li, X., Zhou, Y. Y., and Li, D. R.: Analyzing Urban Spatial Connectivity Using Night Light Observations: A Case Study of Three Representative Urban Agglomerations in China, IEEE J. Sel. Top. Appl., 13, 1097–1108, https://doi.org/10.1109/jstars.2020.2980514, 2020.
Zheng, Q. M., Weng, Q. H., Huang, L. Y., Wang, K., Deng, J. S., Jiang, R. W., Ye, Z. R., and Gan, M. Y.: A new source of multi-spectral high spatial resolution night-time light imagery-JL1-3B, Remote Sens. Environ., 215, 300–312, https://doi.org/10.1016/j.rse.2018.06.016, 2018.
Zhou, Y., Li, X., Asrar, G. R., Smith, S. J., and Imhoff, M.: A global record of annual urban dynamics (1992–2013) from nighttime lights, Remote Sens. Environ., 219, 206–220, https://doi.org/10.1016/j.rse.2018.10.015, 2018.
Zhou, Y., Smith, S. J., Zhao, K., Imhoff, M., Thomson, A., Bond-Lamberty, B., Asrar, G. R., Zhang, X., He, C., and Elvidge, C. D.: A global map of urban extent from nightlights, Environ. Res. Lett., 10, 054011, https://doi.org/10.1088/1748-9326/10/5/054011, 2015.
Zhou, Y. Y., Smith, S. J., Elvidge, C. D., Zhao, K. G., Thomson, A., and Imhoff, M.: A cluster-based method to map urban area from DMSP/OLS nightlights, Remote Sens. Environ., 147, 173–185, https://doi.org/10.1016/j.rse.2014.03.004, 2014.
Zhu, Z., Zhou, Y., Seto, K. C., Stokes, E. C., Deng, C., Pickett, S. T. A., and Taubenböck, H.: Understanding an urbanizing planet: Strategic directions for remote sensing, Remote Sens. Environ., 228, 164–182, https://doi.org/10.1016/j.rse.2019.04.020, 2019.