the Creative Commons Attribution 4.0 License.
the Creative Commons Attribution 4.0 License.
 | 22 Nov 2022
A newly integrated ground temperature dataset of permafrost along the China–Russia crude oil pipeline route in Northeast China
Wei Ma
Fei Wang
Huijun Jin
Alexander Fedorov
Dun Chen
Gang Wu
Yapeng Cao
Yu Zhou
Yanhu Mu
Yuncheng Mao
Jun Zhang
Kai Gao
Xiaoying Jin
Ruixia He
Xinyu Li
Yan Li
The thermal state of permafrost in the present and future is fundamental to ecosystem evolution, hydrological processes, carbon release and infrastructure integrity in cold regions. In 2011, we initiated a permafrost monitoring network along the China–Russia crude oil pipeline (CRCOP) route at the eastern flank of the northern Da Xing'anling Mountains in Northeast China. We compiled an integrated dataset of the ground thermal state along the CRCOP route consisting of meteorological data near the southern limit of latitudinal permafrost, ground temperature (GT) data in 20 boreholes with depths of 10.0–60.6 m, soil volumetric liquid water contents (VWCs) and 2D electrical resistivity tomography (ERT) data at different sites. Results demonstrate a permafrost warming during 2011–2020 in the vicinity of the southern limit of latitudinal permafrost, as manifested by rising GTs at almost all depths in response to climate warming. Local thermal disturbances triggered by the construction and operation of CRCOPs have resulted in significant permafrost warming and subsequent thawing on the right-of-way (ROW) of the pipelines. This permafrost thaw will persist, but it can be alleviated by adopting mitigative measures, such as an insulation layer and thermosyphons. The in situ observational dataset is of great value for assessing the variability of permafrost under the linear disturbances of the CRCOPs and related environmental effects, for understanding hydro–thermal–mechanical interactions between the buried pipelines and permafrost foundation soils, and for evaluating the operational and structural integrity of the pipeline systems in the future. The dataset is available at the National Tibetan Plateau/Third Pole Environment Data Center (https://doi.org/10.11888/Cryos.tpdc.272357; Li, 2022).
- Article
(10498 KB) - Full-text XML
- BibTeX
- EndNote


As a major component of the Earth's cryosphere, permafrost is sensitive to climate change, surface disturbances and human activities (Smith et al., 2022). Over the last few decades, the warming and thawing of permafrost have been observed in most permafrost regions (e.g., Ran et al., 2018; Biskaborn et al., 2019; O'Neill et al., 2019; Etzelmüller et al., 2020; Liu et al., 2021; Noetzli et al., 2021; Smith et al., 2022), and permafrost degradation will continue in response to a warming climate (Koven et al., 2013; Burke et al., 2020). Permafrost degradation affects the geomorphological characteristics, carbon release, hydrological process, ecosystem, climate system, and integrity of infrastructure (Cheng and Jin, 2013; Beck et al., 2015; Hjort et al., 2018, 2022; Turetsky et al., 2020; Jin and Ma, 2021; Jin et al., 2021, 2022; Luo et al., 2021; Jones et al., 2022; Liu et al., 2022; Miner et al., 2022).
Permafrost occurs extensively in the Da and Xiao Xing'anling mountains in Northeast China (referred to as the Xing'an permafrost). The estimated areal extent of existing permafrost in Northeast China ranges from 2.4×10⁵ to 3.1×10⁵ km2 (Ran et al., 2012; Zhang et al., 2021). Its distribution displays both latitudinal and altitudinal zonality and is strongly influenced by local environmental factors (Jin et al., 2008; Guo et al., 2018; He et al., 2021). The Xing'an permafrost has also experienced significant degradation under a warming climate, wildfires and human activities such as deforestation, urbanization, mining and linear infrastructure construction (Guo and Li, 1981; Jin et al., 2007; Wang et al., 2019a; Mao et al., 2019; Li et al., 2021a; Şerban et al., 2021), as evidenced by rising ground temperature (GT), active layer thickness (ALT), development of taliks, shrinking permafrost extent, and increases in thaw-related landscape change and hazards like ground-surface subsidence, settlement of foundation soils and thermokarst. Multiple studies on future changes in the Xing'an permafrost have been conducted based on different modeling approaches and climate-warming scenarios (e.g., Ran et al., 2012; Zhang et al., 2021). Research results indicate that persistent permafrost degradation is likely to occur during the next few decades (Jin et al., 2007; Wei et al., 2011). However, there are great uncertainties in the prediction of the magnitude and timing of these changes (Smith et al., 2022). Field observations of meteorological variables and permafrost thermal states have substantially contributed to the understanding of the responses of GTs to climate change and to hydrothermal processes in the active layer and permafrost, facilitating the evaluation and/or validation of predictive permafrost models, and thus they are of great importance (Zhao et al., 2021; Wu et al., 2022). However, in Northeast China, long-term and continuous datasets of permafrost thermal state are scarce, especially at the eastern flank of the Da Xing'anling Mountains, due to the harsh periglacial environment, inconvenient access, and expensive installation and maintenance costs (Jin et al., 2007; He et al., 2021; Li et al., 2021a).
Since 2008, extensive permafrost investigations for the construction of the China–Russia crude oil pipelines (CRCOPs) I and II were conducted in the permafrost zones on the eastern slopes of the Da Xing'anling Mountains. The CRCOP I was constructed during the 2 cold seasons in 2009–2010 and began operation in January 2011. In January 2018, CRCOP II was completed and began to operate. A permafrost monitoring network along the CRCOP route was gradually established by referring to the experiences and lessons learned from other oil and gas pipelines (e.g., Norman Wells to Zama crude oil pipeline in Canada, Alyeska crude oil pipeline in the United States, and Nadym–Pur–Taz natural gas pipeline in Russia) in permafrost regions (Seligman, 2000; Burgess and Smith, 2003; Johnson and Hegdal, 2008; Smith and Riseborough, 2010; Oswell, 2011). Boreholes were instrumented to measure GTs in the active layer and near-surface permafrost on and off the right-of-way (ROW) of the CRCOPs and electrical resistivity tomography (ERT) surveys were used to delineate frozen and unfrozen ground in the vicinity of the CRCOPs (Kneisel et al., 2008; Farzamian et al., 2020).
We firstly present the integrated dataset of permafrost thermal state along the CRCOP route on the eastern slopes of the northern Da Xing'anling Mountains in Northeast China. This dataset includes meteorological data, GTs, soil volumetric liquid water content (VWC), and subsurface electrical resistivity (ER) on and off the ROW of the pipeline. Detailed information for the integrated dataset is provided so that this dataset can be easily understood, readily accessed and properly applied by potential users.
Five permafrost observation sites, named Xing'an (XA), Xin-tian (XT), Jin-song (JS), Song-ling (SL), and Jagdaqi Bei (North) (JB), respectively, were established along the CRCOP route in Northeast China (50.4710–53.3328∘ N, 123.9875–124.3132∘ E) (Fig. 1) through the joint efforts of the State Key Laboratory of Frozen Soil Engineering (SKLFSE), Northwest Institute of Eco-Environment and Resources (the former Cold and Arid Regions Environmental and Engineering Research Institute), Chinese Academy of Sciences and the Jagdaqi Division of the PetroChina Pipeline Company. Site selection was primarily based on engineering geological conditions of permafrost (Jin et al., 2010). According to the meteorological data of 1972–2017, the study area is characterized of a frigid-temperate continental monsoon climate with mean annual air temperatures (MAATs) of −4.0 to −0.4 ∘C, with annual precipitation of 447 to 525 mm, which falls mostly as summer rain. Snow cover generally occurs at the end of September to the beginning of October and disappears in late April and early May of the following year. The snow depth ranges from 5 to 35 cm. Between 1972 and 2017, the MAAT increased at a rate of 0.32 ∘C per decade while annual precipitation increased at a rate of 14.6 mm per decade (Wang et al., 2019a).
Table 1 summarizes the geographical information and permafrost characteristics of monitoring sites. Permafrost is warm with a mean annual ground temperature (MAGT) at the depth of zero annual amplitude (DZAA) ranging from −1.8 to −0.4 ∘C. The permafrost thickness varies from 0 to more than 60 m, and the observed active layer thickness (ALT) ranges from 1.0 to 2.7 m (Wang et al., 2019b). Along the CRCOP route, the XA site, located in a permafrost wetland, is the most northern and has the lowest air temperature, while the JB site, near the southern limit of the latitudinal permafrost in Northeast China, has the highest air temperature, and permafrost occurs in isolated patches. The XT and JS sites are located in the transition zone between isolated patches of permafrost and sporadic permafrost, making them the ideal locations for examining permafrost dynamics. The SL site is located in a wetland underlain by ice-rich permafrost, where seasonal frost mounds, sometimes migratory, with a maximum height of 2 m are developed (Wang et al., 2015), and monitoring devices are prone to be destroyed due to significant ground deformation related to frost mounds.
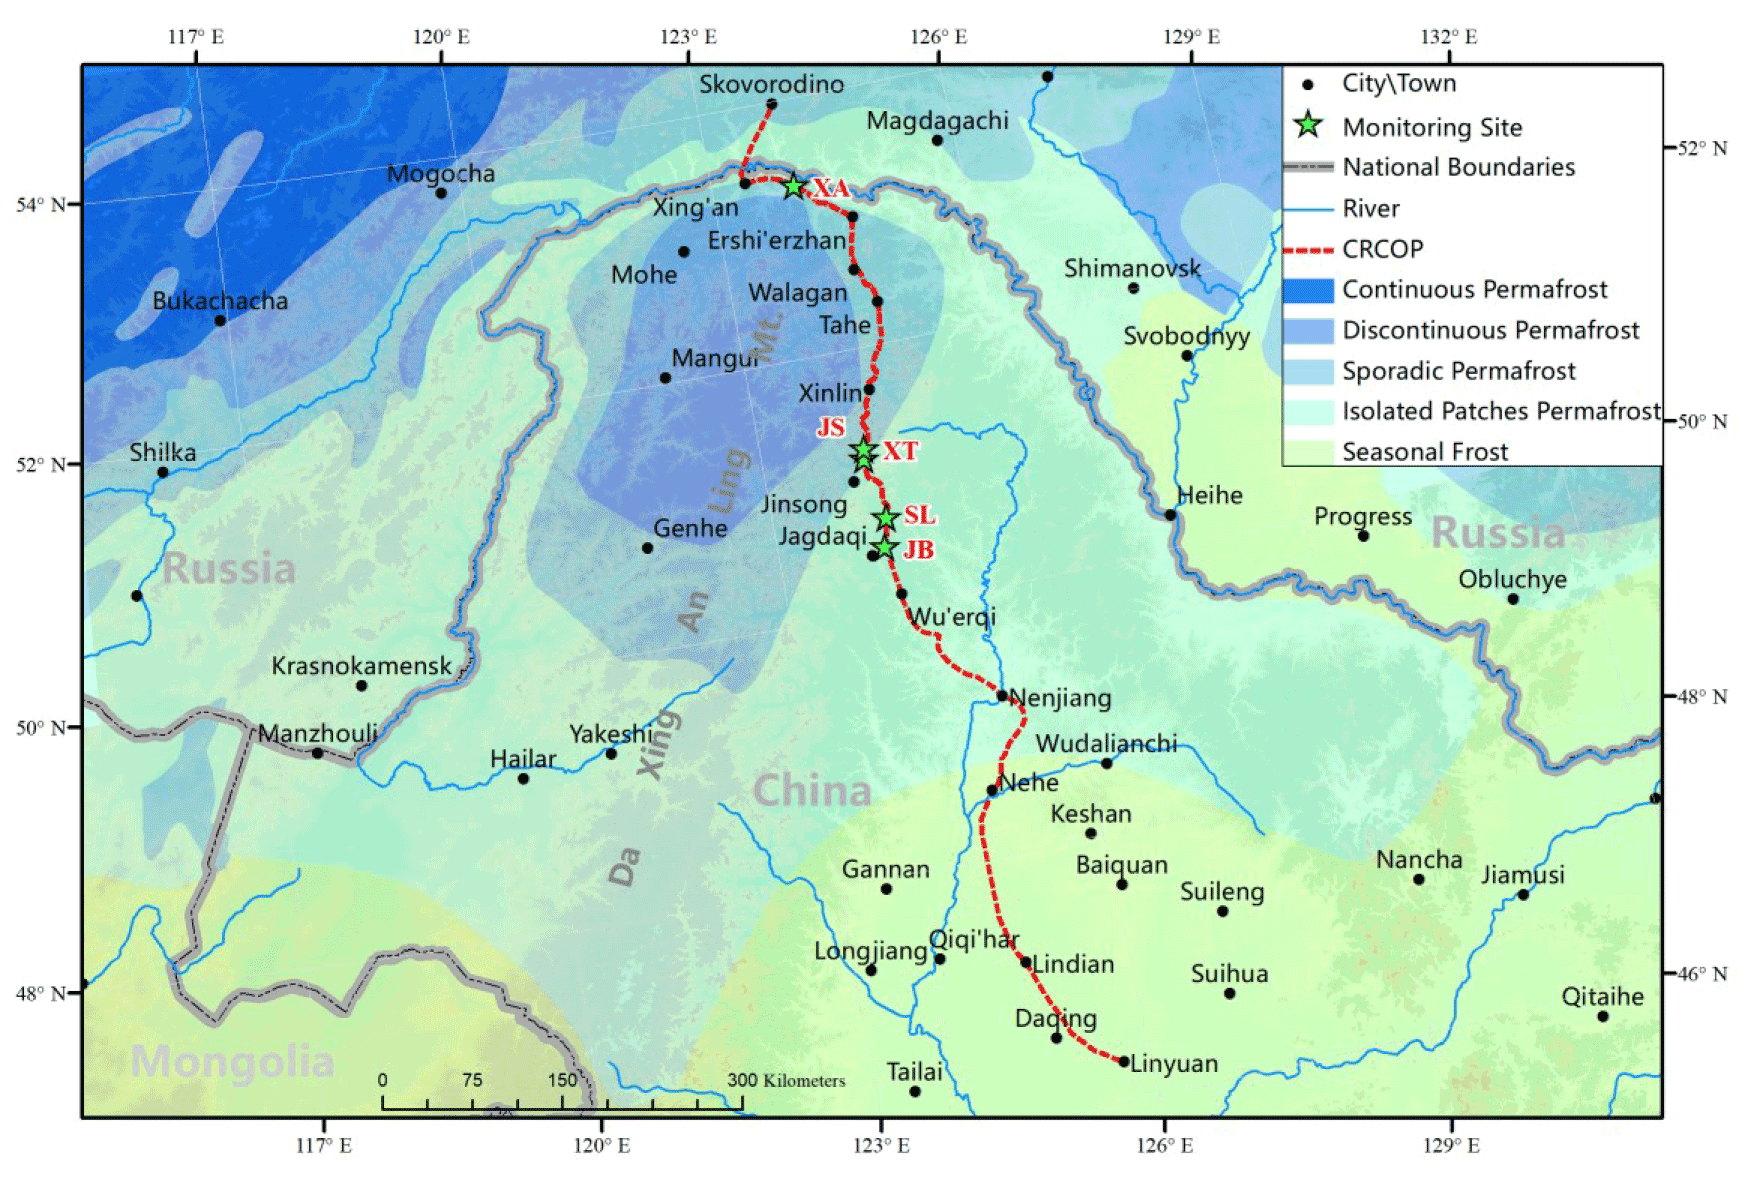
Figure 1Location of permafrost monitoring sites along the route of China–Russia crude oil pipelines (CRCOPs). Permafrost zone from Jin et al. (2007, 2010). The dashed red line represents the paralleling CRCOPs I and II (the inter-pipeline distance is generally limited to approximately 10 m).
Table 1Permafrost characteristics for monitoring sites along the route of China–Russia crude oil pipelines.
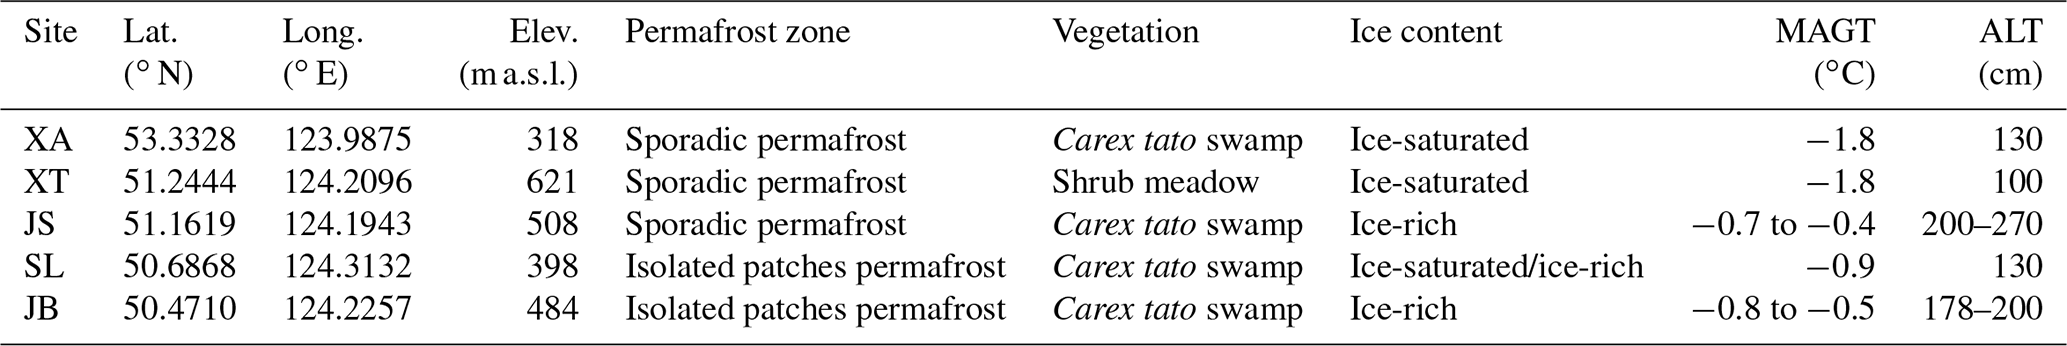
Notes: MAGT – mean annual ground temperature of permafrost at the depth of zero annual amplitude (DZAA), and ALT – active layer thickness.
3.1 Meteorological data
In October 2017, a small automated weather station (AWS; Fig. B1) was installed at the JB site for measuring air temperature, relative humidity (RH), wind speed and direction, and total solar radiation. Details of the sensors used are listed in Table 2. All meteorological data were recorded every 2 h by a CR3000 data logger (Campbell Scientific, Inc., USA) with a relay multiplexer (TRM128, China), powered by a battery cell and solar panel regulated by a solar charge controller (Phocos ECO (10 A), Germany). The collected data have been transferred automatically to the specified server by the wireless transmission module (HKT-DTU, Campbell Scientific, Inc., USA). Using such technology, it would be possible to check collected data in real time and identify possible sensor failures.
Table 2List of sensors, measuring range and accuracy for meteorological data, ground temperature, soil water content, and ground electrical resistivity.

The AWS was regularly maintained and repaired, resulting in data collection with satisfactory quality and continuity. Between 15 October 2017 and 10 August 2020, less than 5 % of the data were missing. However, the meteorological data had been discontinued since 10 August 2020 due to the failure of the online data transmission module and lack of essential on-site maintenance for equipment under the influence of the COVID-19 pandemic.
Air temperature and RH were measured at a height of 1.5 m every 2 h using the Vaisala HMP155A sensor protected by a radiation shield. The accuracy of temperature and RH measurements decreased along with lowering temperatures. For example, the accuracy for the HMP155A sensor was as good as ±0.17 ∘C at an ambient temperature of 20 ∘C but was only ±0.34 ∘C at −40 ∘C. At the JB permafrost site, the annual range of daily air temperature was approximately 56 ∘C. The recorded maximum air temperature was 24.7 ∘C on 25 July 2020, and the minimum, −33.7 ∘C on 27 December 2019 (Fig. 2a). The seasonal variation in RH followed similar patterns with the seasonal variability in air temperature (Fig. 2b).

Figure 2Time series of meteorological variables at the JB site from October 2017 to August 2020.
Total solar radiation was measured at a height of 1.5 m above the ground surface by the LI200X Pyranometer with an accuracy of ±3 % to ±5 %). Although the sensors were regularly checked (e.g., checking the level of the instrument and removing dust) during the site visits and re-calibrated after 2 years of installation, the instruments were largely unattended and their accuracy was therefore likely to worsen up to ±5 %. It is worth noting that the LI200X may read negative solar radiation during the night, which is later set to zero in the data processing. The total solar radiation reached its maximum in summer (June to August) and was lowest in winter (December to next February), with a similar pattern for seasonal variations in air temperature (Fig. 2c).
The wind speed and direction were measured at a height of 2 m above the ground surface by a propeller anemometer (Model 05103, R.M. Young Company). The standard error of wind direction was also calculated using a specific algorithm provided by the CR3000 data logger. The recorded maximum wind speed of 9 m s−1 occurred on 28 May 2019. The average monthly wind speeds ranged from 0.9 to 2.6 m s−1 and reached their maximum in April–May (Fig. 2d).
3.2 Ground temperature and soil water content data
In total, 20 boreholes were drilled and instrumented for GT monitoring both on the ROW of the CRCOPs at varying distances from the pipe centerline/axis lines and in nearby undisturbed terrains (off the ROW, 2.6 to 90 m from the ROW edge) between 2011 and 2021 (Table 3). Generally, the ROW is approximately 20 m wide. The depths of boreholes range from 10.0 to 60.6 m, although most of them are 15 to 20 m deep. In situ temperature monitoring in the borehole JB-B-II (6.6 m from the ROW edge) was deployed starting in November 2011, and 10 boreholes (JB-B-1 to JB-B-10) were drilled on the ROW between 2 and 4 m from the centerline of the pipe in 2014 and 2015 at the JB site. Besides, a new borehole (JB-B-I) was drilled down to 60.6 m near the above-mentioned AWS in March 2017. At the SL site, two on-ROW boreholes (SL-B-1 and SL-B-2, 3 and 5.9 m from the pipe centerline of CRCOP II, respectively) and one off-ROW borehole (SL-B-I, 2.6 m from the edge of the CRCOP I ROW) were drilled in March 2017 and instrumented in September 2017. At the JS site, two boreholes (JS-B-1 and JS-B-2, 2 and 5 m from the pipe centerline, respectively) were established on the CRCOP II ROW in 2017, and an additional borehole (JS-B-I) was drilled 14.8 m from the ROW edge of CRCOP I in 2018. A borehole (XT-B-I) at the XT site, 10 km north of the JS site, was drilled in 2019 to evaluate the spatial differentiation of permafrost distribution influenced by local geo-environmental factors. At the XA site, a borehole with a depth of 60.5 m (XA-B-I) was drilled 7 km south of the first pump station of the CRCOPs in Xing'an Village of Mo'he County, Heilongjiang Province, where there was previously no GT data.
Table 3Summary of monitoring information of ground temperature boreholes, water content monitoring pits, and electrical resistivity tomography (ERT) profiles along the China–Russia crude oil pipelines (CRCOPs) in Northeast China.
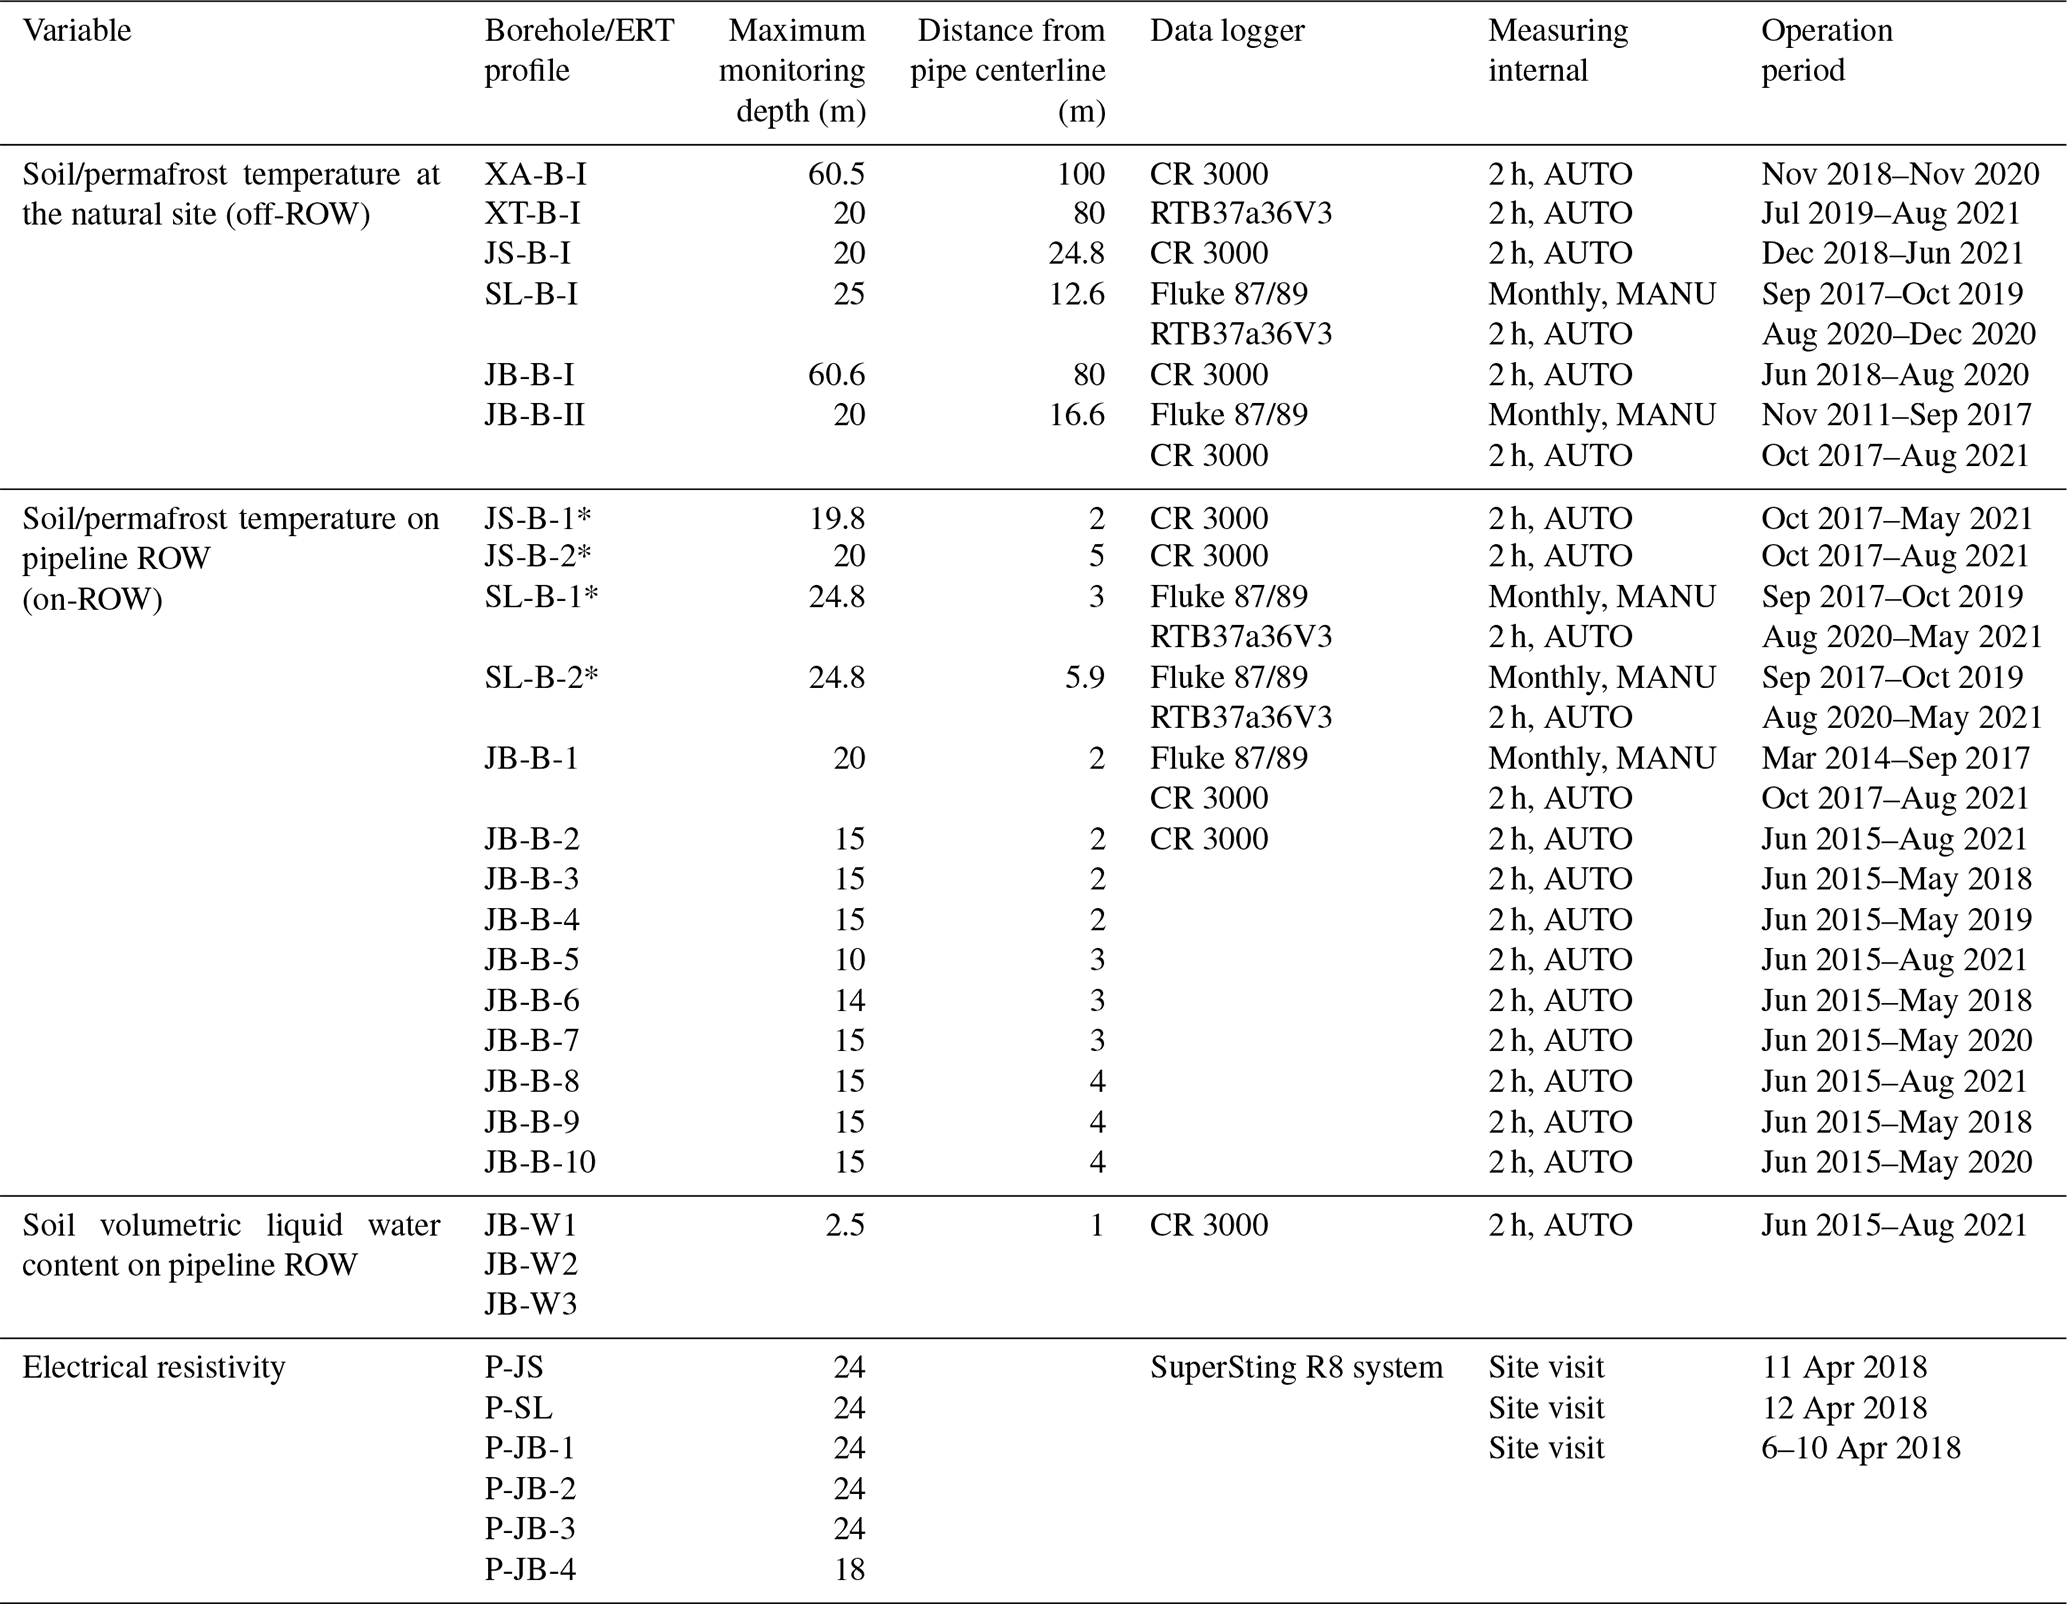
* Boreholes were drilled on the ROW of CRCOP II. The width of the ROW along the pipeline is about 20 m.
The GT measurement was carried out by installing a thermistor cable protected by a steel tube into the borehole (Wang et al., 2019b). The thermistor cable was assembled by the SKLFSE with thermistors at the designed intervals. A manual temperature reading using Fluke 87/89 was made in five boreholes (SL-B-I, SL-B-1, SL-B-2, JB-B-II, and JB-B-1) for some earlier time (Table 3). The accuracy of the manual readings is estimated to be ±0.1 ∘C (Juliussen et al., 2010). Two types of data loggers, which are connected to the thermistor cables, are now used for automatic and continuous monitoring of GTs in boreholes at 2 h intervals. They are CR3000 data loggers and miniature temperature data loggers (RTB37a36V3, jointly developed by Northwestern Polytechnical University and SKLFSE). The latter generally has a lower resolution than the CR3000 data logger (±0.05 ∘C) but is also more widely used due to its lower cost. The GT in boreholes at the SL site has been recorded by this miniature data logger. The soil volumetric liquid water content (VWC) was measured by the Campbell Scientific CS616 water content reflectometer probe (Table 2) by connecting it to a CR3000 data logger. Three pits were excavated on the ROW of the CRCOP I at the JB site and three probes were embedded horizontally at depths of 0.5, 1.5 and 2.5 m in each pit (Table 3).
Quality control of data was carried out by manually checking to detect missing data and obvious erroneous recordings in the GT and VWC data. All the missing or abnormal data were replaced with null values. Then, daily averages were calculated from hourly values at 2 h intervals if at least 10 values (∼83 %) were available within 1 d.
3.2.1 Ground temperature at the undisturbed sites
To analyze the spatial distribution of GT, we chose GTs between 2018 and 2021, when GT data series of all five permafrost sites were available (Fig. 3). The average daily GTs at depths of 0–3 m showed seasonal variations, but the amplitude decreased with depth, with the magnitude of the decrease varying between sites (Fig. 3a). For example, the JS site with a high permafrost temperature had the maximum annual range of GT at a depth of 0.5 m (from −14.9 to 16.6 ∘C) among all five sites, while at a depth of 3 m, the XT site had the maximum range in GT, which was mainly related to the local topography, vegetation, soils and geology (Table 1). Zero-curtain effects were evident at a certain depth in these five sites, but the duration time of zero curtains at the same depth varied greatly with location, which was mainly related to in situ soil water/ice content of these permafrost sites.
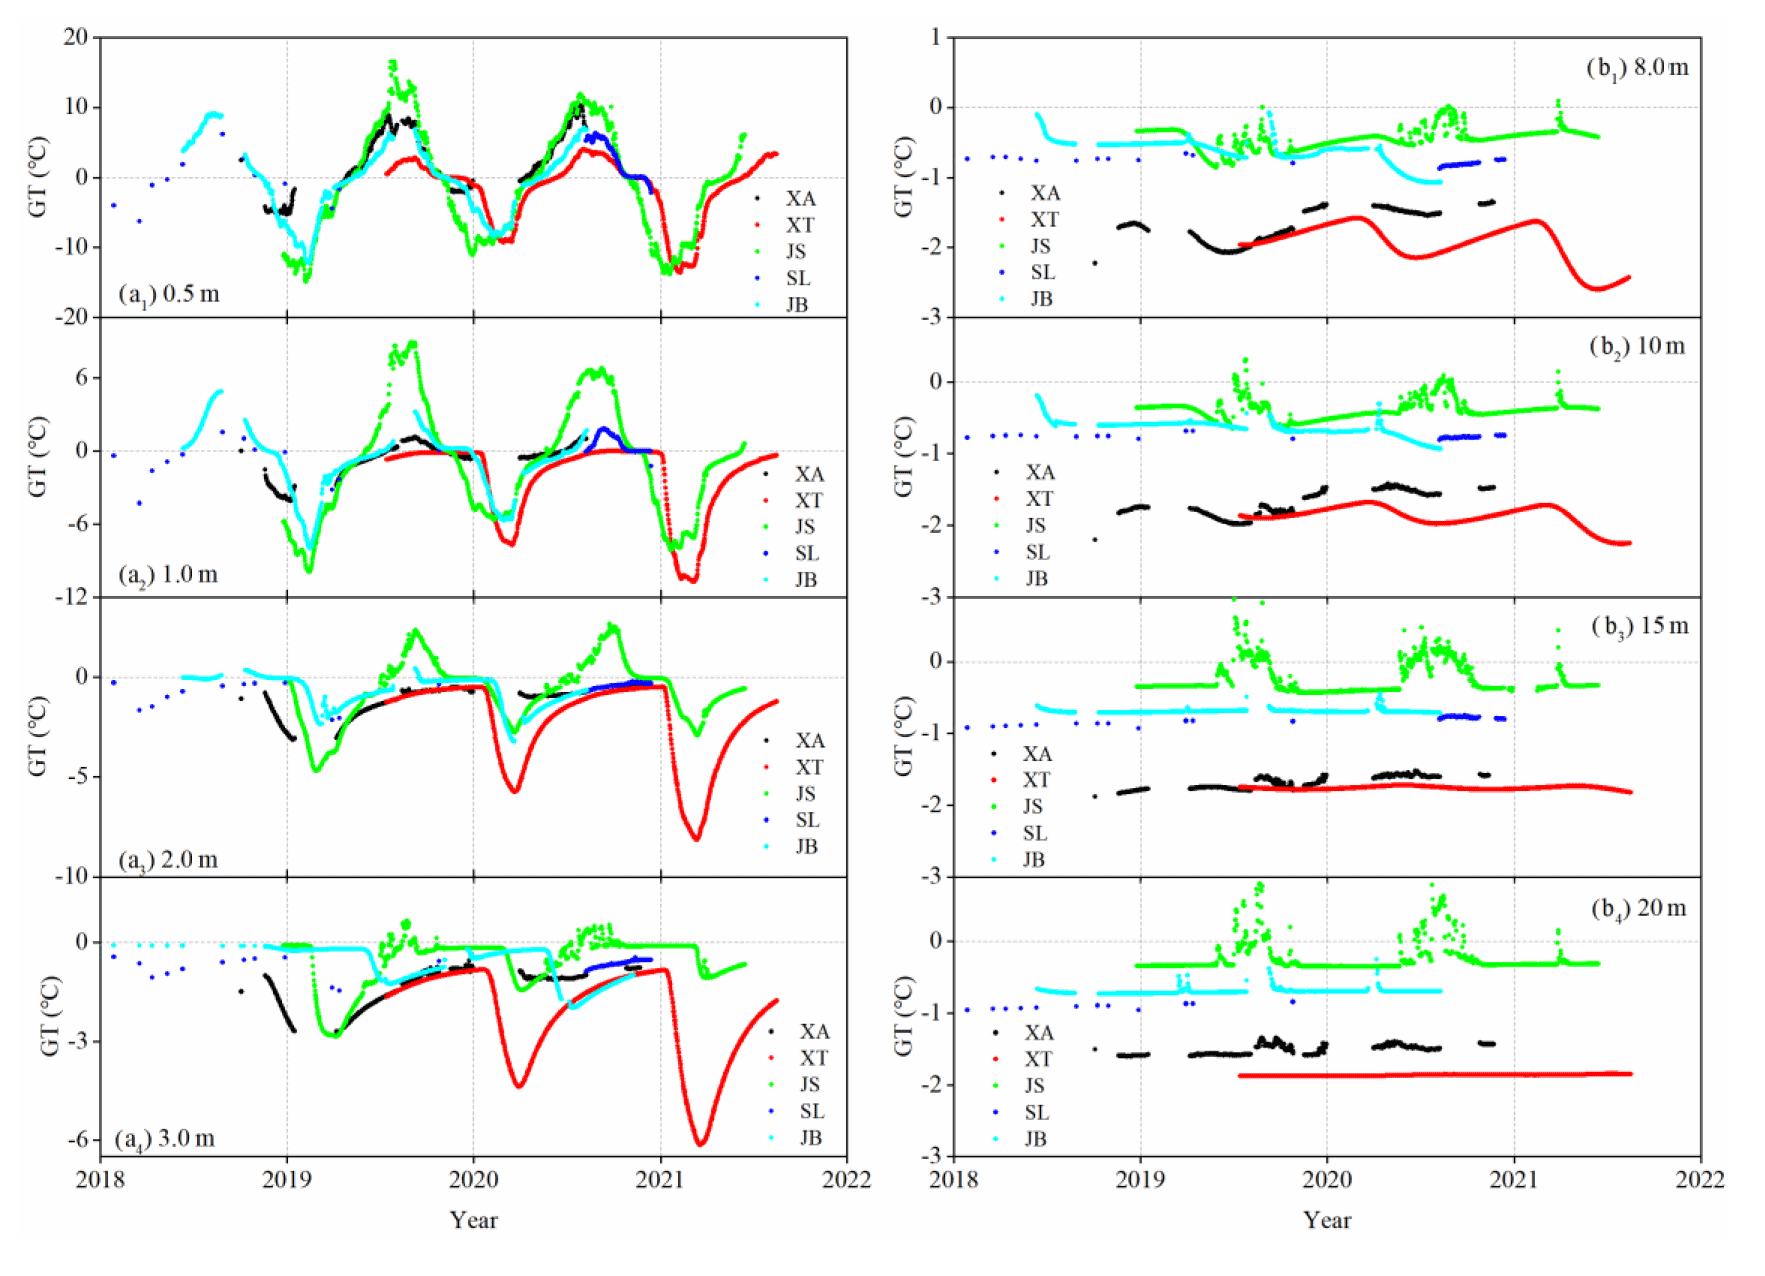
Figure 3Variability of ground temperatures (GTs) at depths of (a) 0–3 m and (b) 8–20 m at the undisturbed sites along the route of China–Russia Crude Oil Pipelines (CRCOPs) in Northeast China, 2018–2021.
Seasonal variations in GTs at depths ≥15 m are negligible at all sites, except for the JS site, which indicates that zero annual amplitude (ZAA) is located below 15 m in depth (Fig. 3b). At the JS site, abnormal positive temperatures were observed in the summers of 2019 and 2020, probably due to the thermal disturbance of supra- and/or intra-permafrost groundwater. The GTs at depths of 8, 10, 15 and 20 m showed that permafrost temperature decreased northward. However, there is substantial scatter in the relationship between GT and latitude (Fig. 4).
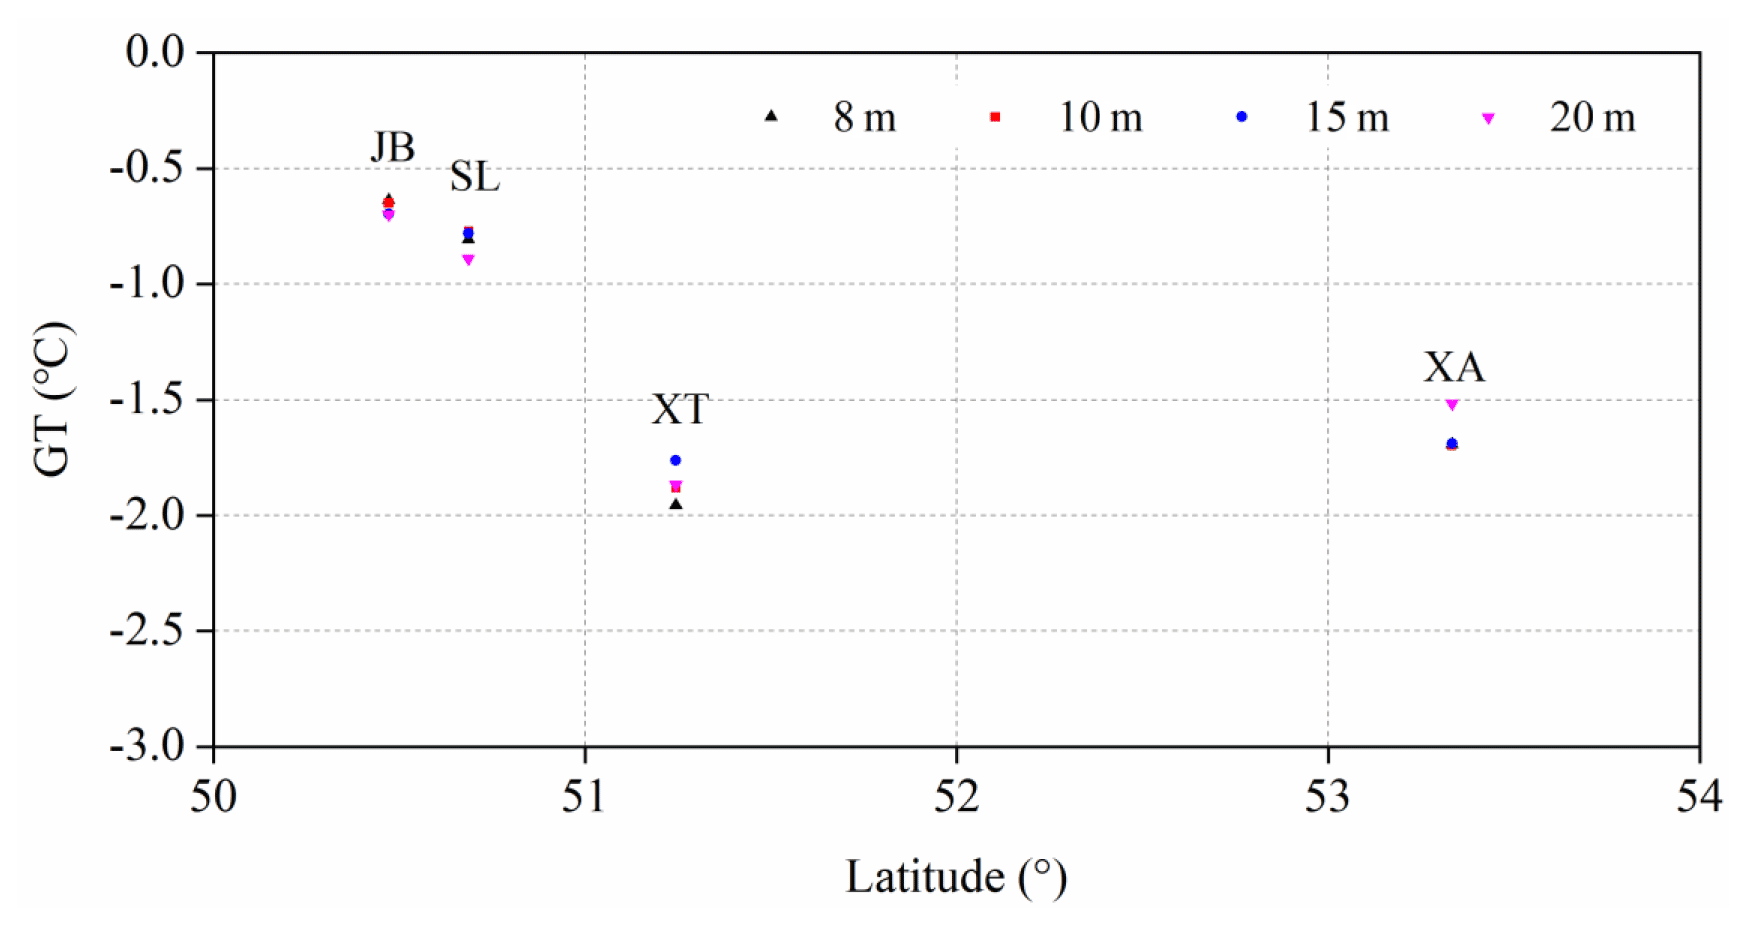
Figure 4Relationship between latitude and GT along the route of China–Russia crude oil pipelines (CRCOPs).
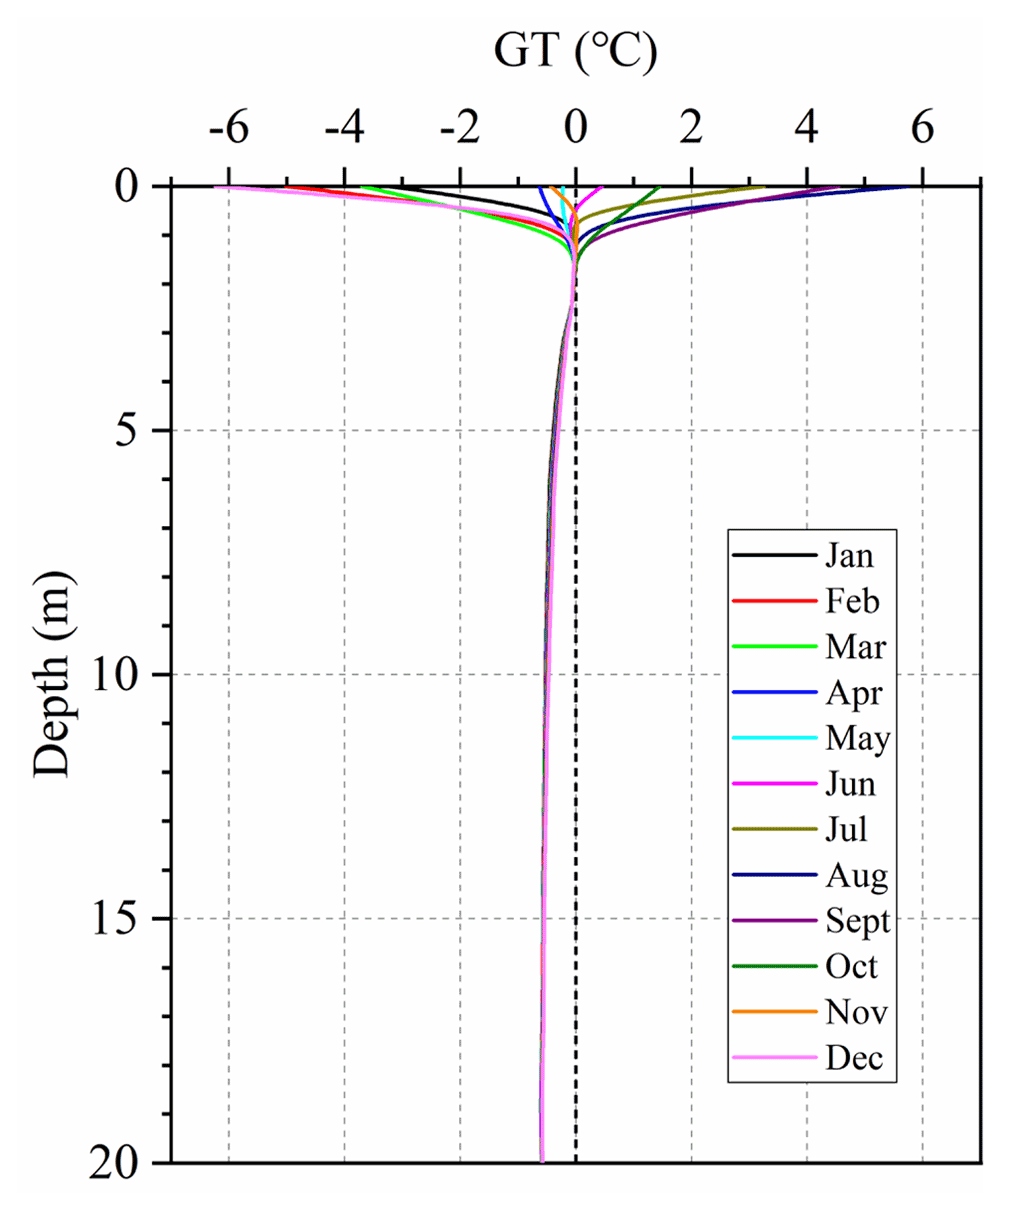
Figure 5Monthly average ground temperatures (GTs) at depths of 0-20 m recorded in the JB-B-II borehole at the JB site in 2018.
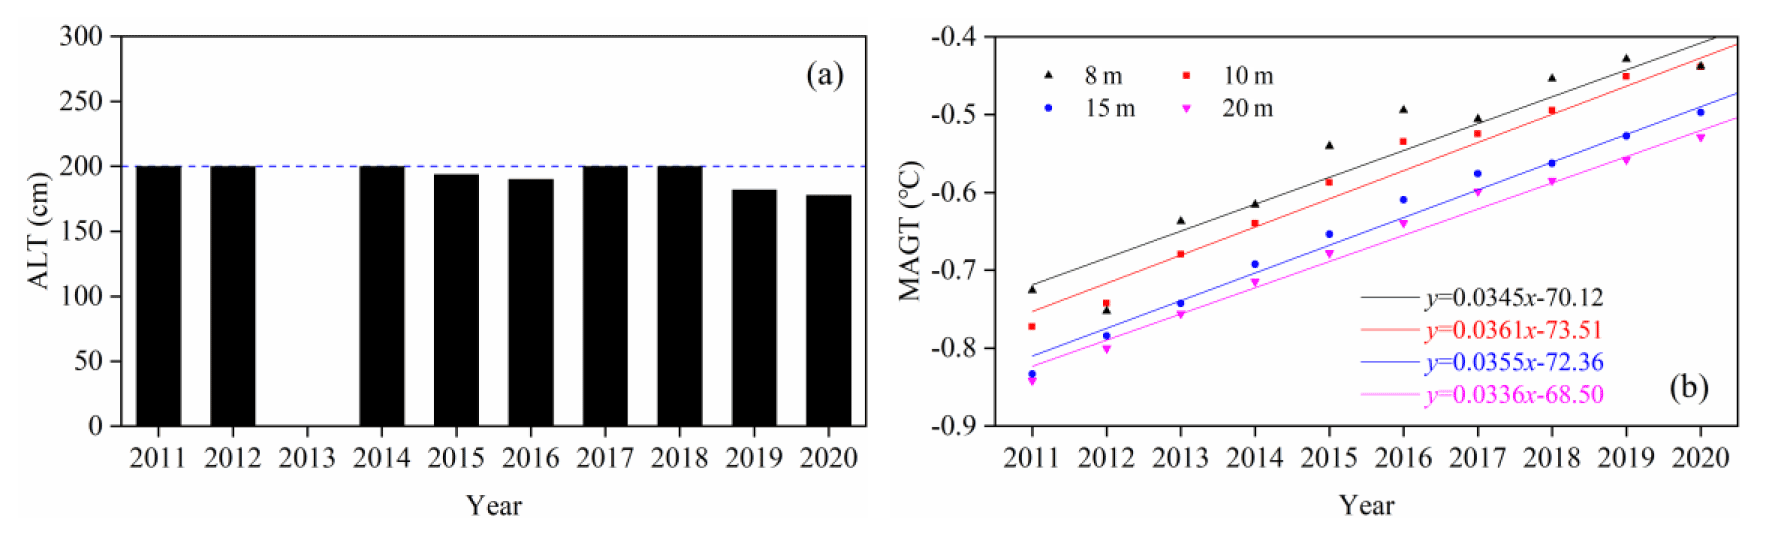
Figure 6Variations in the (a) active layer thickness (ALT) and (b) mean annual ground temperature (MAGT) in borehole JB-B-II at the JB site along the China–Russia crude oil pipeline (CRCOP) I in the northern part of Northeast China from 2011 to 2020.
A decade record (2011–2020) of GTs in the active layer and near-surface permafrost in borehole JB-B-II allows for assessment of the inter-annual trend of permafrost. As displayed in Fig. 5, the monthly average GTs in 2018 at depths from 1 to 2 m were fluctuating in proximity to 0 ∘C without an obvious geothermal gradient (termed as the zero-curtain layer), decreased with a geothermal gradient of 0.08 ∘C m−1 at depths from 2 to 7 m, and remained unchanged below 7 m. The ALT (the maximum depth of 0 ∘C isotherm from linear interpolation of the daily average GTs) in this borehole varied slightly between 178 and 200 cm from 2011 to 2020, mainly due to the damping effect of the zero-curtain layer and thermal properties of soil deposits (Fig. 6a), while the near-surface permafrost at depths of 8–20 m was warming at an average rate of 0.035 ∘C yr−1 in this 10-year observation period (Fig. 6b). At the DZZA of 15 m, the MAGT increased by 0.3 ∘C (from −0.8 to −0.5 ∘C) during 2011–2020 (Romanovsky et al., 2010; Smith et al., 2010).
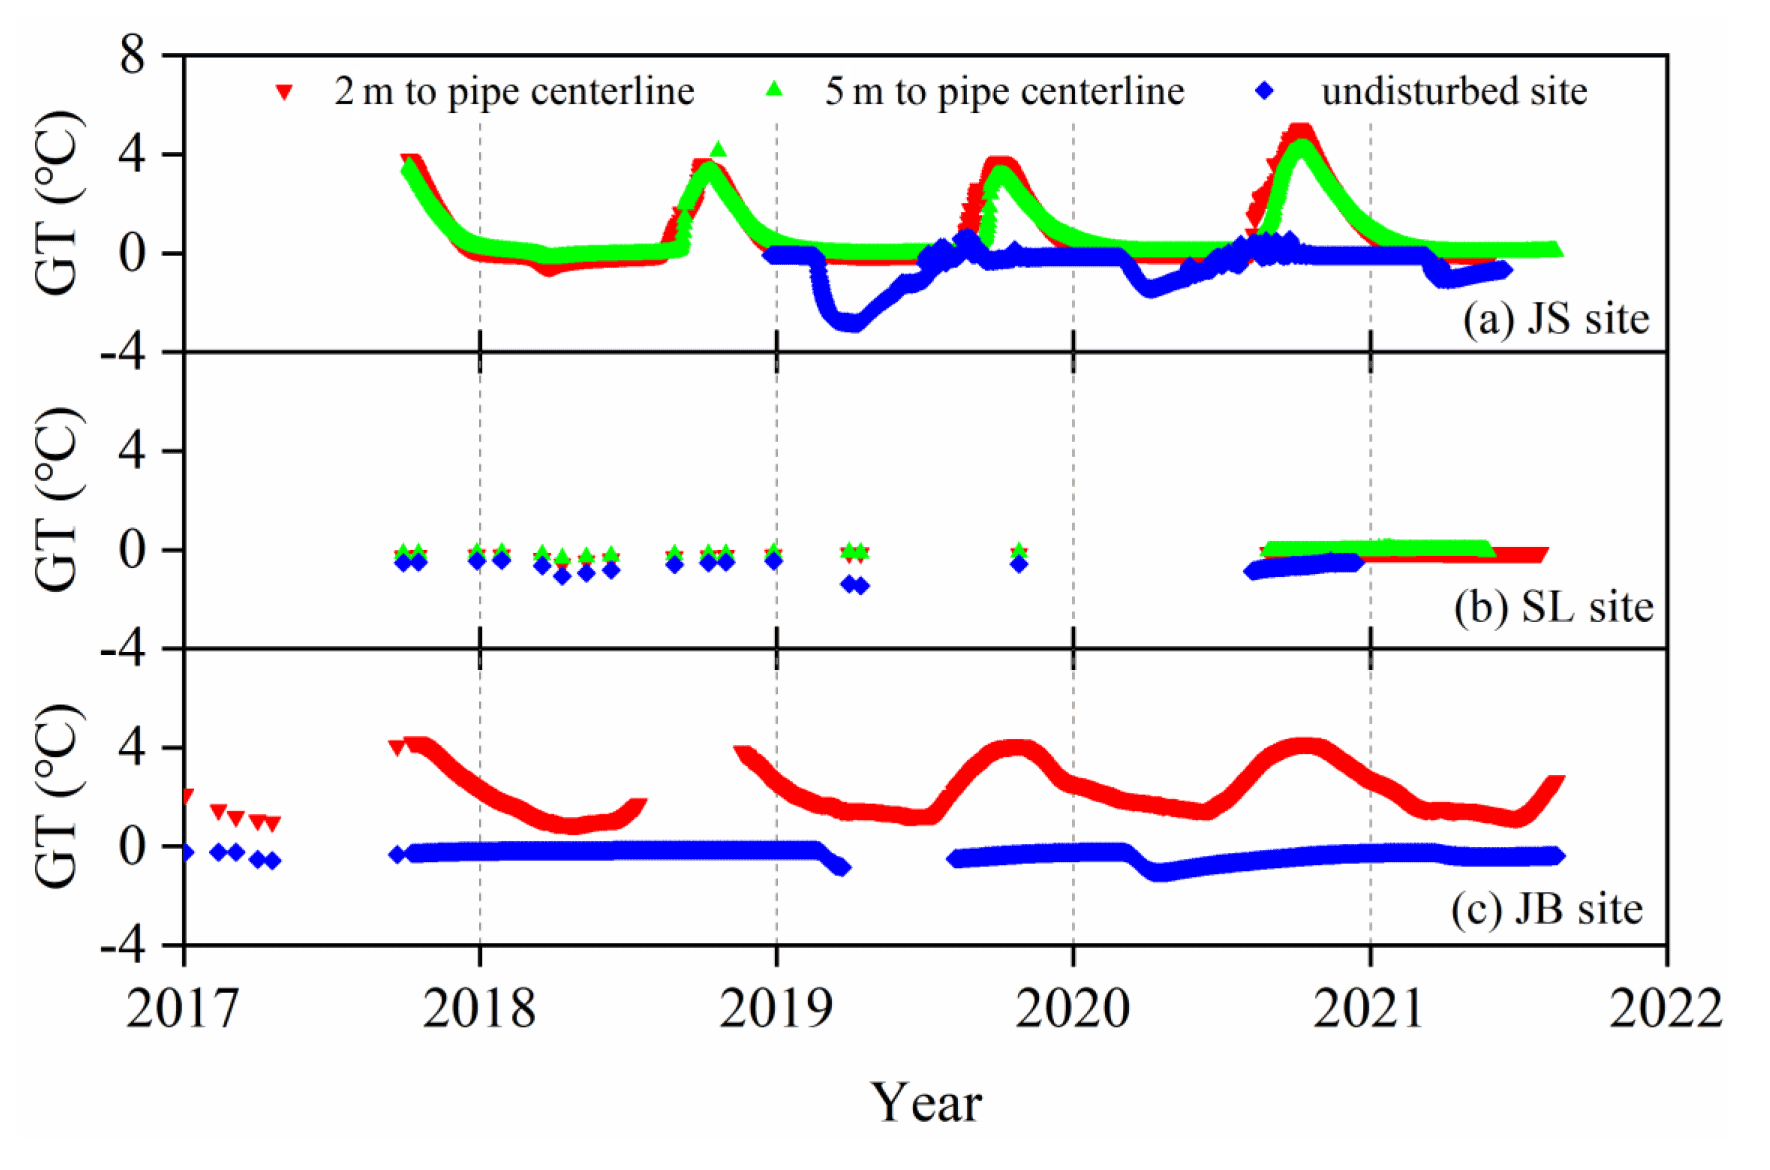
Figure 7Variations in ground temperatures (GTs) at the depth of 3 m on the right-of-way (ROW) at the (a) JS, (b) SL and (c) JB sites along the China–Russia crude oil pipeline (CRCOP) I in the northern part of Northeast China during 2017–2021.
3.2.2 Ground temperature on the ROW of pipeline
Boreholes on the ROW along the CRCOPs were drilled and instrumented for GT monitoring at three permafrost sites (JS, SL and JB) to evaluate the thermal disturbances of the insulated or uninsulated CRCOPs on the surrounding permafrost (Table 3). At the JS and SL sites, the pipelines were insulated and initially buried at depths of 2–3 m, while they were uninsulated and buried at a depth of 1.6–2.4 m at the JB site. The warm oil (with the maximum recorded temperature of 28 ∘C at the first/northernmost pump station of the CRCOPs in China) flowing in the pipeline brought substantial heat into the underlying permafrost, resulting in the rising GTs, even though the pipelines were wrapped by an insulation layer (Fig. 7). However, temperature differences on and off the ROW of the pipeline were substantially reduced by an insulation layer at the JS and SL sites compared to those at the JB site without insulation. The GTs in the borehole 5 m (perpendicular to the CRCOP I) away from the centerline of the pipe were also greater than those at the nearby undisturbed site, indicating that the lateral thermal disturbance range of the pipeline may have extended beyond a horizontal distance of 5 m.
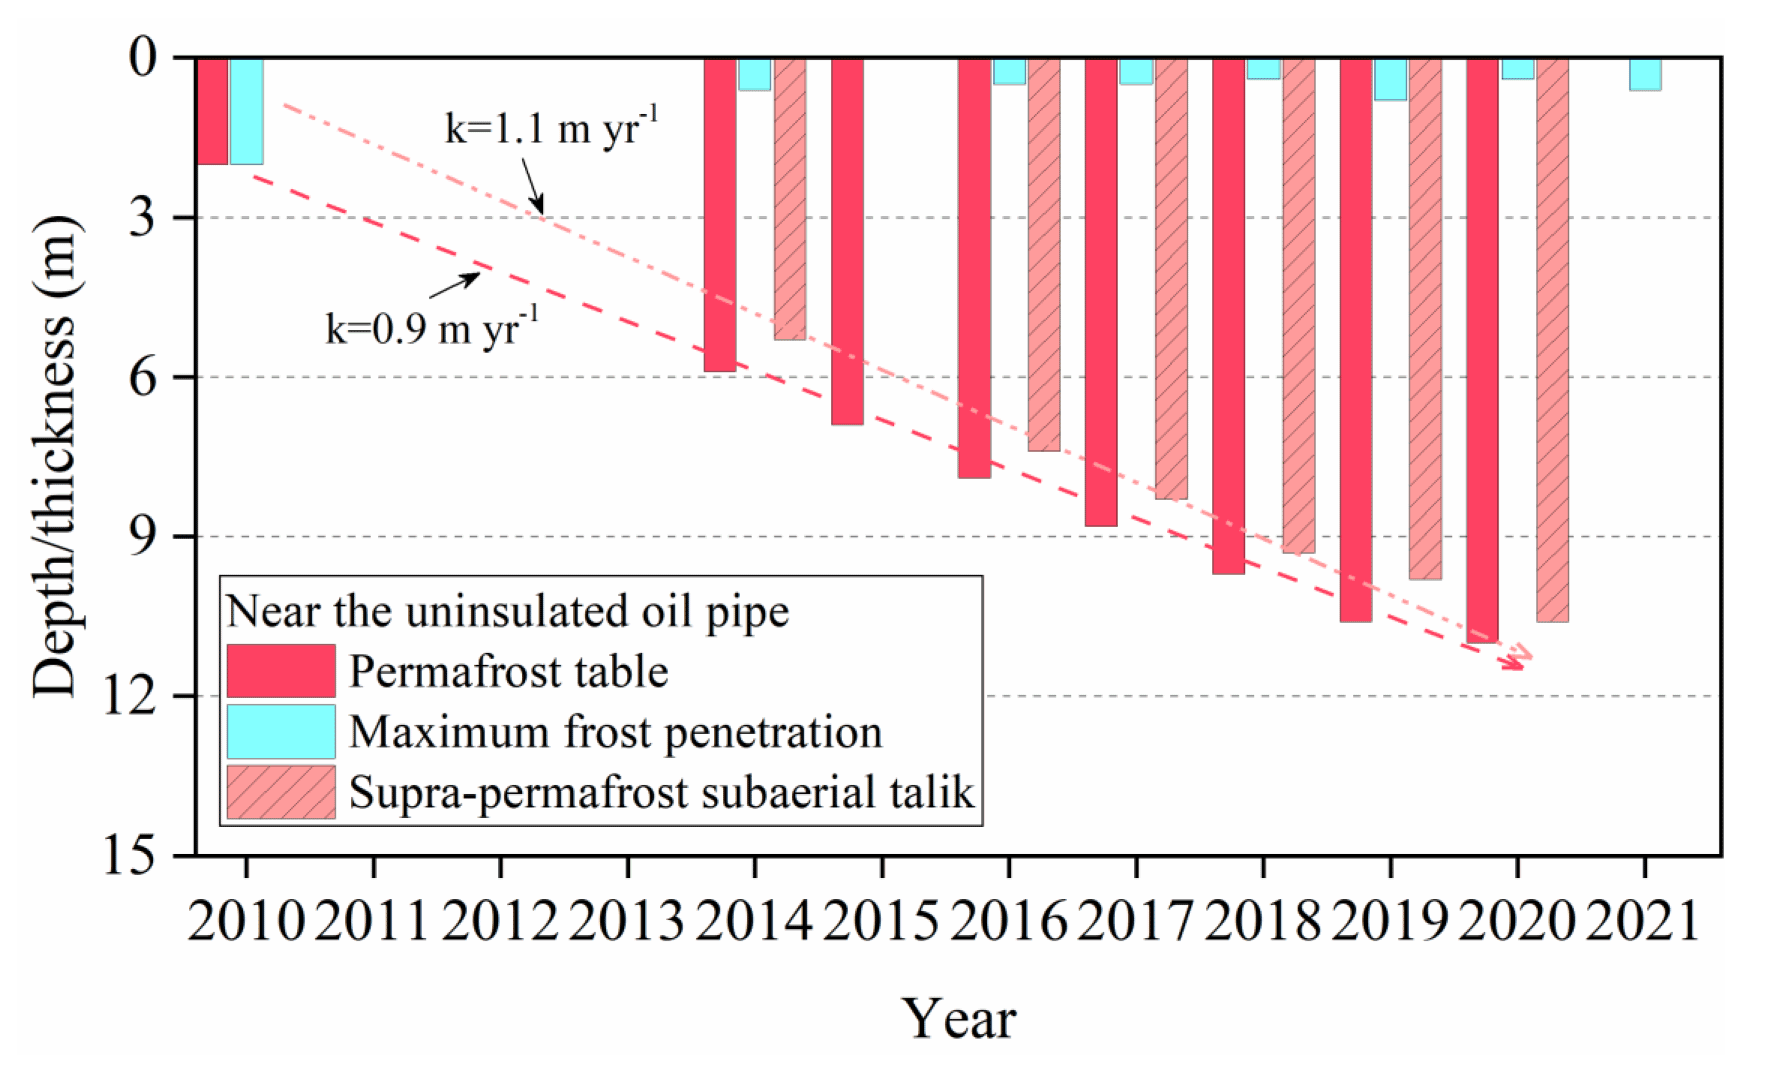
Figure 8Variations in the depths of permafrost table and seasonal frost, and thickness of supra-permafrost subaerial talik (SST) during 2010–2021 in borehole JB-B-1, 2 m away from the centerline of the uninsulated China–Russia crude oil pipeline (CRCOP) I at the JB site in the northern part of Northeast China, where k denotes the increasing rate.
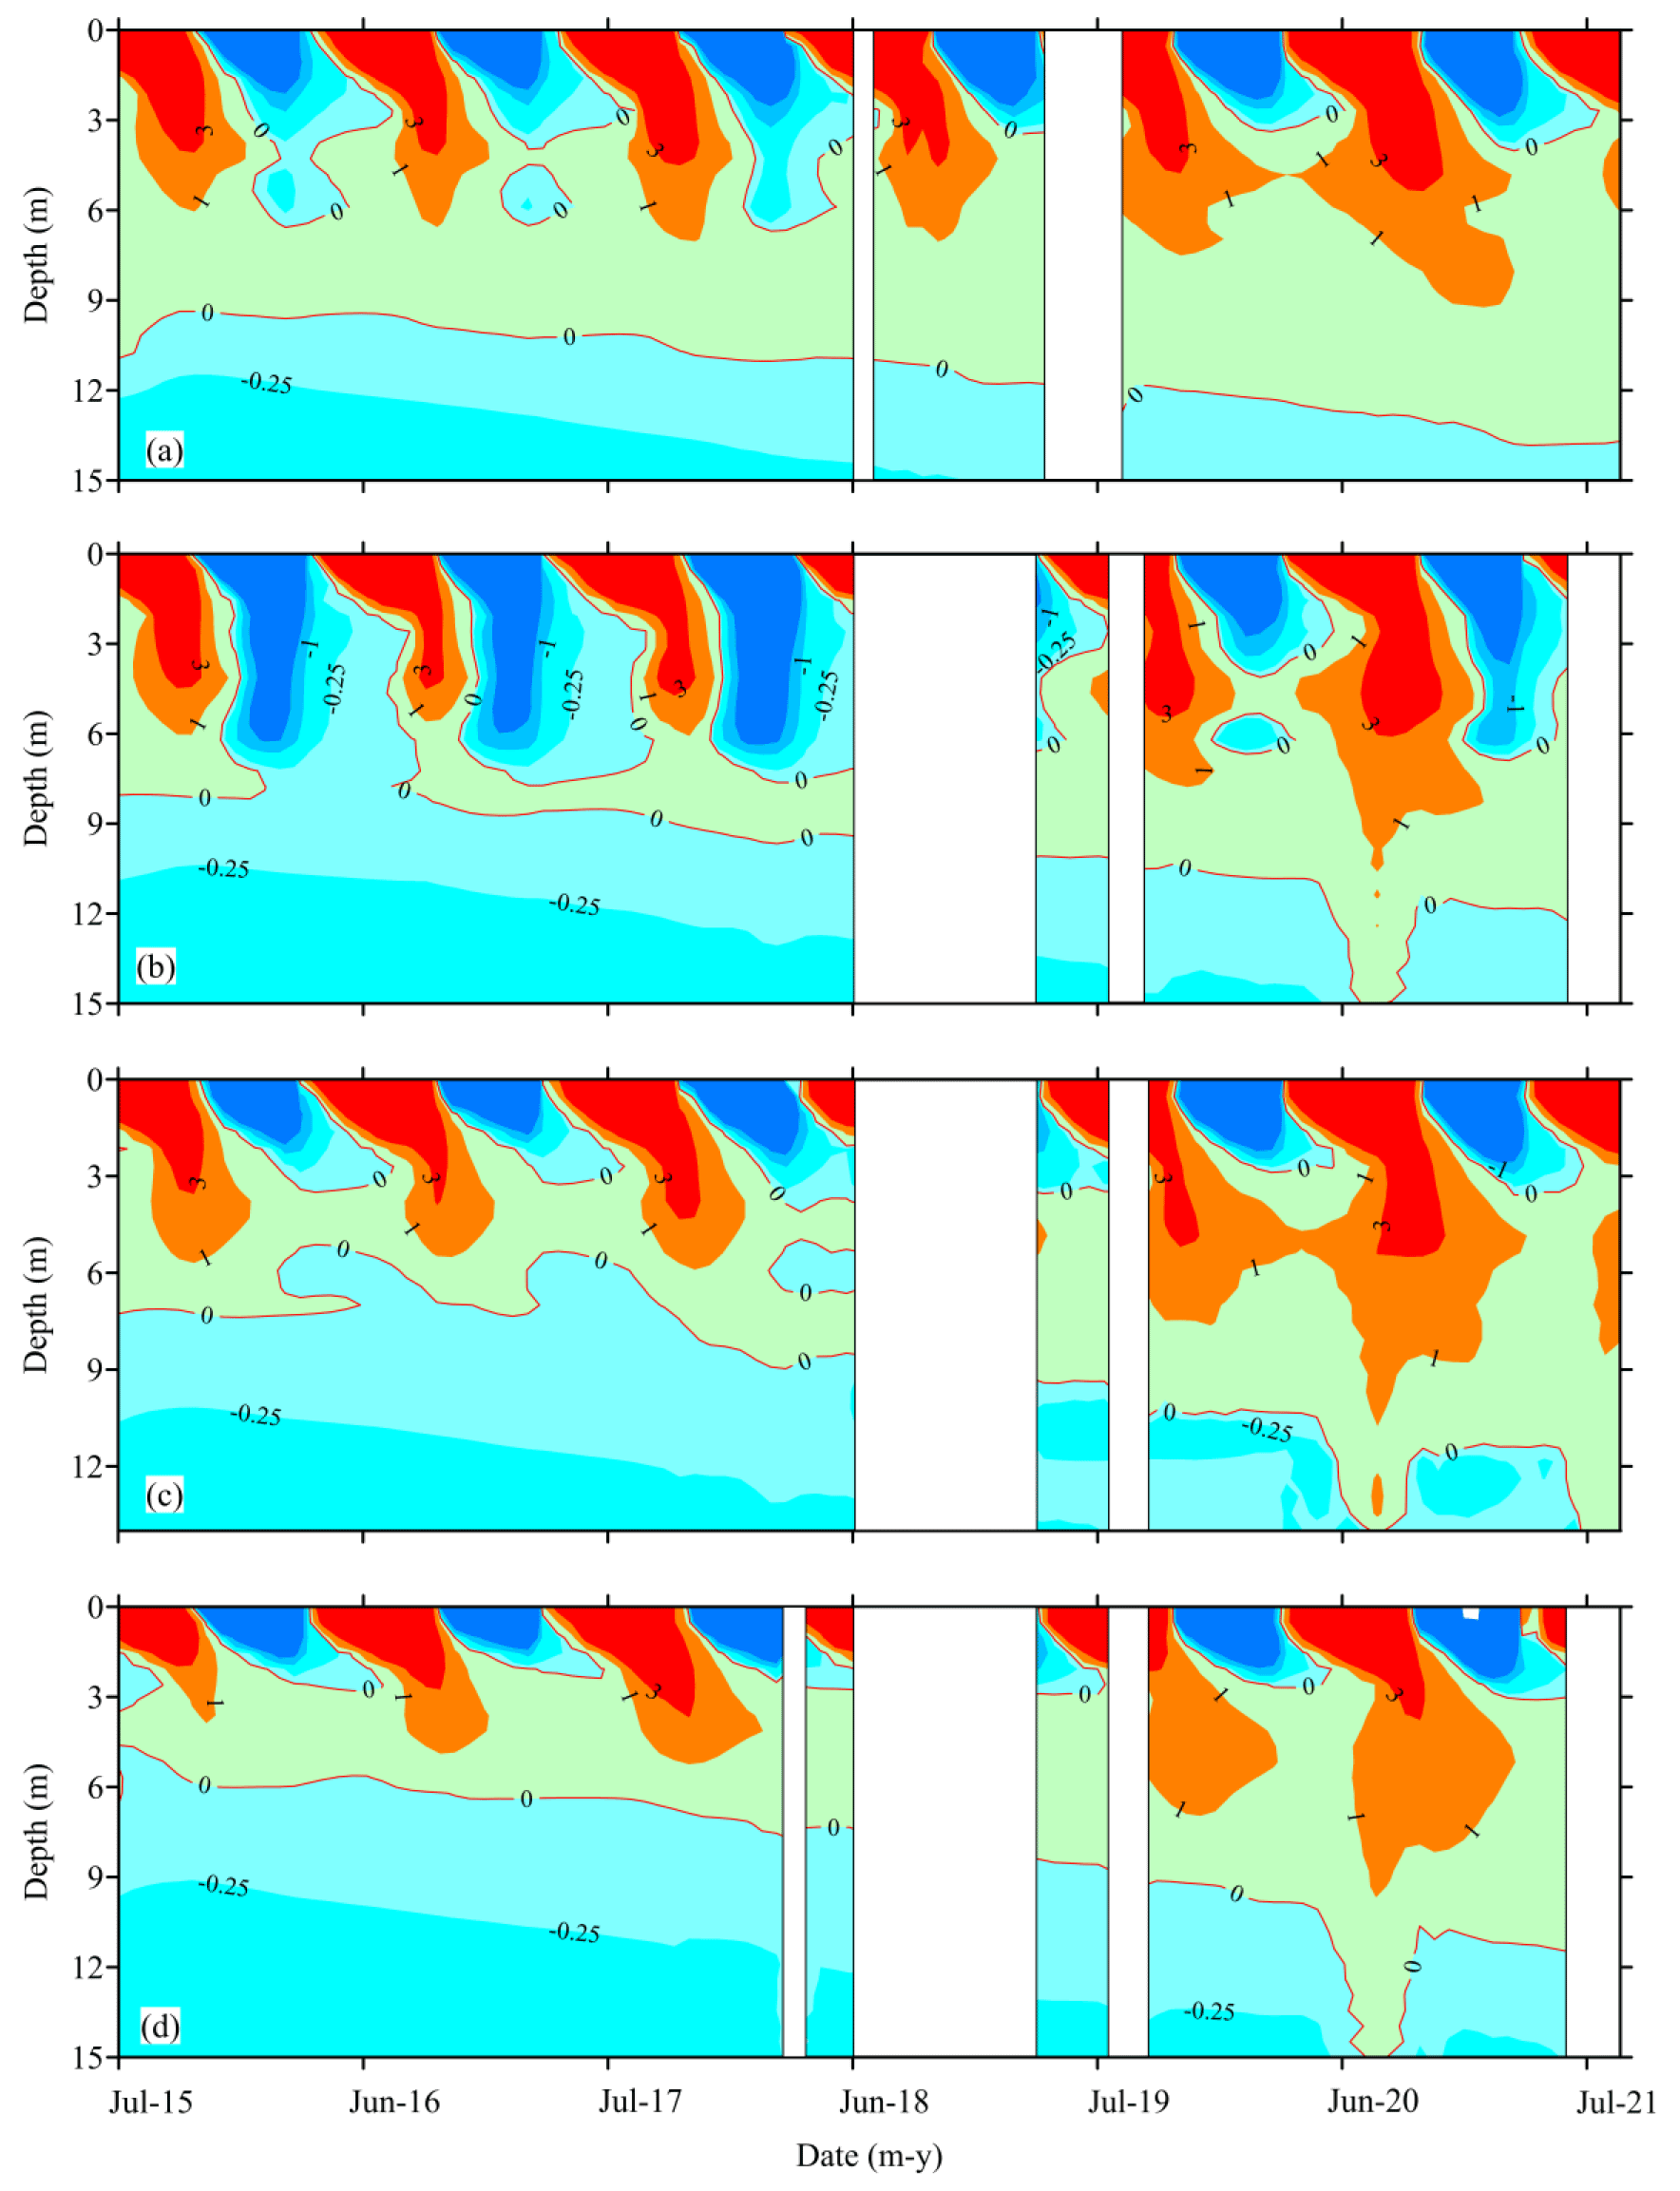
Figure 9Depth–time contour plots of ground temperature (∘C), derived from the boreholes (a) JB-B-2, (b) JB-B-3, (c) JB-B-6 and (d) JB-B-9 at the JB site along the China–Russia crude oil pipeline (CRCOP) I in the northern part of Northeast China. The blank gap indicates the missing data.
The time series of the depths of the permafrost table and maximum frost penetration in borehole JB-B-1, horizontally 2 m away from the uninsulated pipe centerline at the JB site shows that since the initiation of the CRCOP 1 operation in 2011, the depth of the permafrost table has been increasing with an average rate of 0.9 m yr−1 and the depth of seasonal frost penetration decreases rapidly and then varies little (0.4–0.8 m) during 2010–2021 (Fig. 8). Therefore, a thawed interlayer between the permafrost table and the bottom of seasonal frost (i.e., supra-permafrost subaerial talik, SST) formed and developed with an average rate of 1.1 m yr−1 in the same period. This has demonstrated that the pipeline has triggered an intensive and quick permafrost degradation at a local scale. This deepening of the permafrost table and thickening of the SST have led to significant subsidence of the ground surface within the trench area and exposed the pipelines to thawed, low-bearing foundation soils, resulting in potential pipeline damage. For example, the excavation at the JB site in 2015 revealed that the CRCOP I had locally settled down by 1.4 m during 2010–2015.
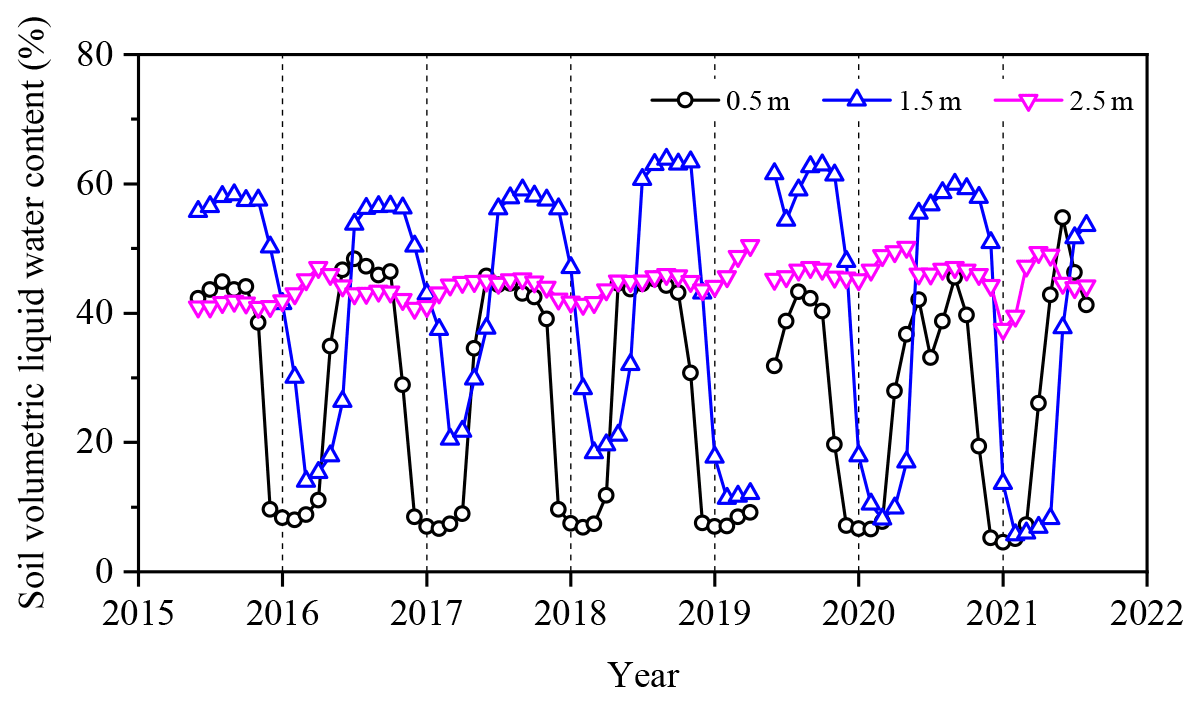
Figure 10Temporal history of soil volumetric liquid water content (VWC) at depths of 0.5, 1.5 and 2.5 m at the JB site along the China–Russia Crude Oil Pipeline (CRCOP) I in the northern part of Northeast China during 2015–2021.
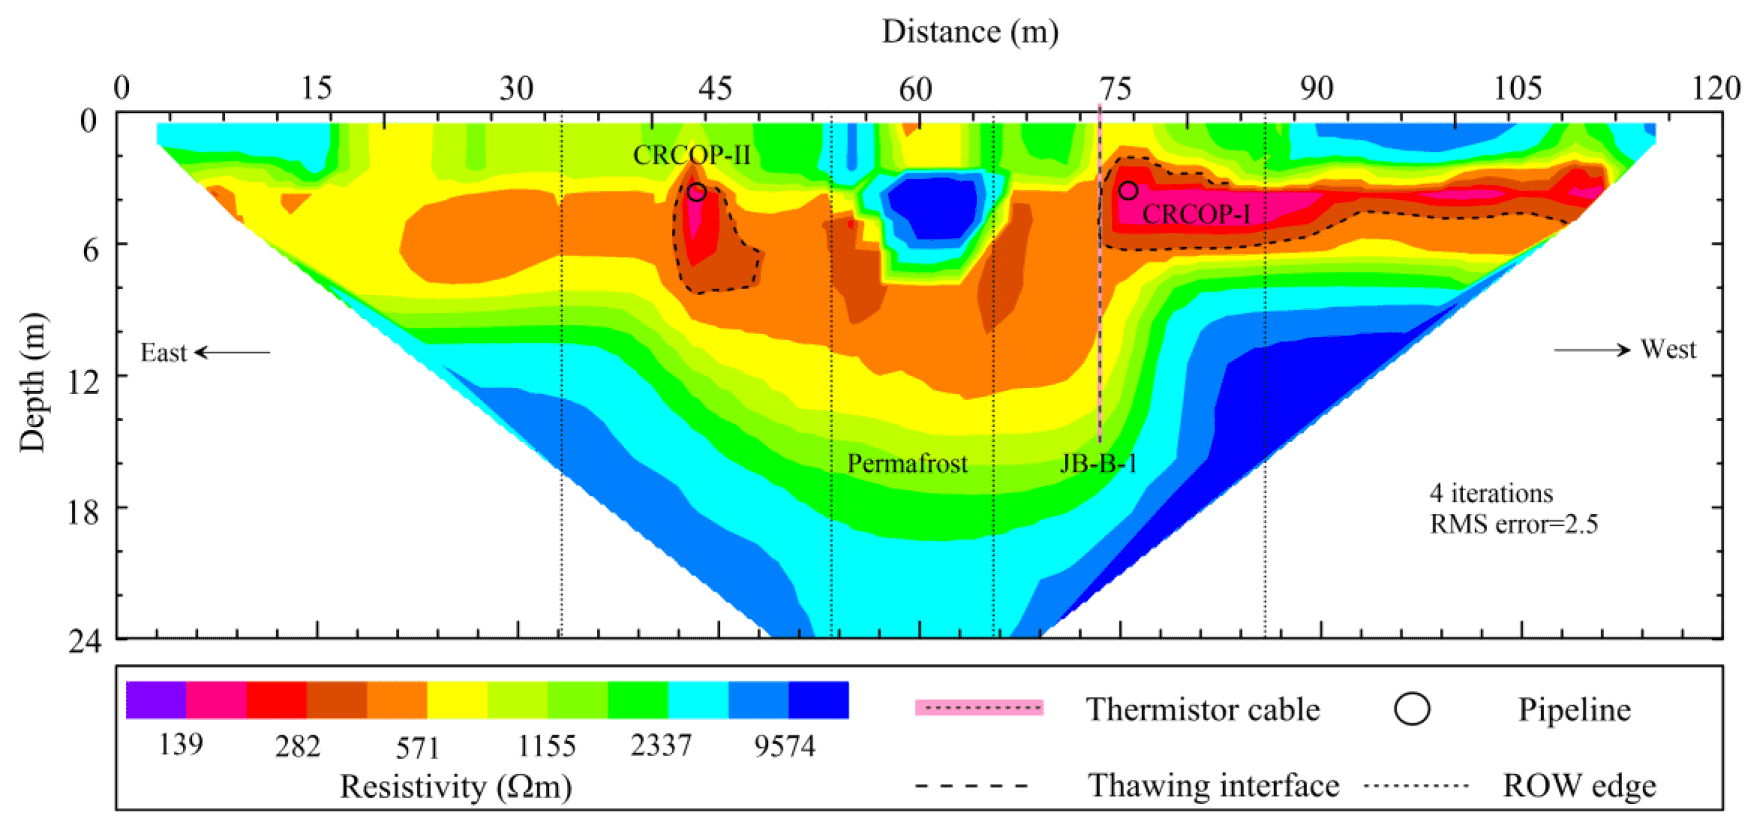
Figure 11Inversion results of electrical imaging along the P-JB-1 profile at the JB site along the China–Russia crude oil pipeline (CRCOP) I in the northern part of Northeast China in April 2018.
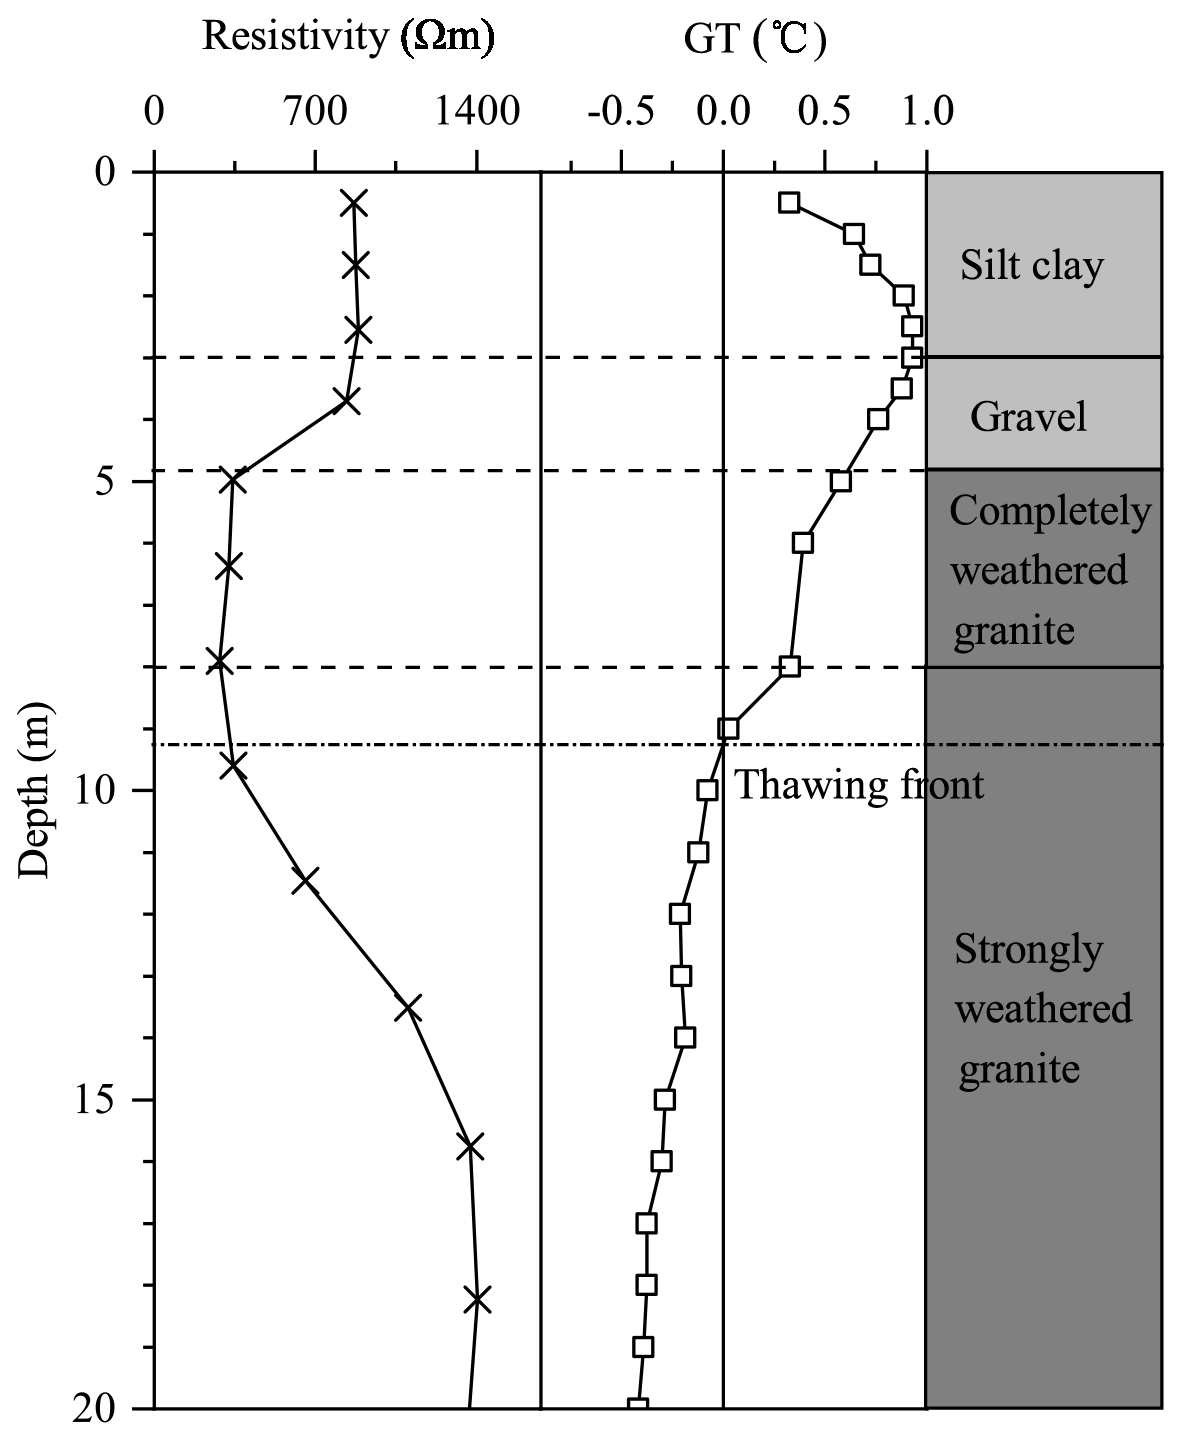
Figure 12Dependence of electrical resistivity on ground temperature and lithology (in the borehole JB-B-1).
Thermosyphons, a widely used mitigative measure for permafrost thaw in cold-region engineering, can effectively change the temporal and spatial variations of local GT distribution. Figure 9 shows the time series of temperature contours in boreholes of JB-B-2, JB-B-3, JB-B-6 and JB-B-9 from July 2015 to August 2021 (the period with high-quality GT data series). Borehole JB-B-2 is located 2 m away from the pipe centerline with one pair of thermosyphons, while boreholes JB-B-3, JB-B-6 and JB-B-9 are respectively set 2, 3 and 4 m away from the centerline of the CRCOP I, but with two pairs of thermosyphons. During the cold season, the permafrost table remains unchanged due to the cooling effect of thermosyphons, but it deepens when the thermosyphons stop working during the warm season. Overall, the depth of the permafrost table has been increasing slowly over the observational decade (Fig. 9a). The cooling performance of the thermosyphons on pipeline foundation soils has been enhanced with an increased number of thermosyphons, as characterized by a lower rate of permafrost table deepening and a wider vertical cooling extent in winter or the cold season (Fig. 9b). The GTs in boreholes of JB-B-6 and JB-B-9 indicate a greater-than-1.5 m cooling range of thermosyphons, and a greater-than-4 m lateral extent on the ground surface of thermal disturbance of the warm pipeline (CRCOP I) (Fig. 9c and d). During June–August 2020, abnormal changes in 0 ∘C isotherm shown in Fig. 9b, c, and d are likely related to the infiltration of surface waters and supra- and/or intra-permafrost waters. The above results show that the vertically inserted thermosyphons are unable to completely prevent the thawing of the underlying permafrost. The unexpectedly warmer oil temperature, thermal erosion of surface water ponding on the ROW, and lowering thermosyphon performance are responsible for the unsatisfactory cooling effect of thermosyphons on the pipeline foundation soils.
3.2.3 Soil water content on the ROW of pipeline
The variations in VWC at depths of 0.5 m (peaty soil) and 1.5 m (silt clay) are controlled by the freeze–thaw processes. In the ground thawing season, VWC is 55 % at 0.5 m in depth and reaches 64 % at 1.5 m. While the VWC at 2.5 m (silt clay) is less variable with an average of 45 % (Fig. 10), offering indirect evidence to the presence of the SST around the warm-oil pipe (Li et al., 2018). All these findings undoubtedly confirm that the construction and operation of the buried warm pipeline have resulted in locally intensive thermal disturbances on the underlying permafrost in the ROW along CRCOPs, although spatially confined.
3.3 Subsurface electrical resistivity data
The electrical resistivity (ER) is dependent on many parameters including lithology, soil water/ice content, and soil temperature. The ER distribution within the subsurface can be visualized by ERT. The inverted ERT results provide a continuous transect of the characteristics of the active layer and near-surface permafrost to delineate the shape and size of talik (unfrozen ground in permafrost regions) or permafrost islands along the CRCOP route (Zhang, 2011). We performed ERT surveys in April 2018 with the SuperSting R8 system (Advanced Geosciences, Inc., Table 2) using the Wenner–Schlumberger configuration due to its high signal-to-noise ratio (Dahlin and Zhou, 2014). In addition to the fourth ERT profile at the JB site (P-JB-4), other profiles were done using stainless steel electrodes spaced by 2 m along the 120 m-long profile, reaching a maximum penetration depth of 24 m (Table 3). The smoothness-constrained least-squares method was employed for ERT inversion.
The configurations of talik around the CRCOPs can be seen in Fig. 11. Here, an ER value of 300 Ωm was used as the critical value to identify the boundary between frozen and unfrozen zones combined with the profile characteristics of resistivity, GT, water/ice content, lithology (obtained from borehole drilling, Fig. 12), and other ERT surveys in Northeast China made by previous scholars (Hu and Shan, 2016; Li et al., 2021b). There was a significant difference in the sizes of taliks around the CRCOPs in April 2018, suggesting that pipeline operation-related thermal disturbances had accelerated permafrost thaw (Fig. 11).
The datasets presented herein can be freely downloaded from the National Tibetan Plateau/Third Pole Environment Data Center at https://doi.org/10.11888/Cryos.tpdc.272357 (Li, 2022).
For this study, an in situ monitoring network for the ground thermal state of permafrost was established along the CRCOP route, at the eastern flank of the northern Da Xing'anling Mountains in Northeast China. The resulting dataset fills the gaps in the spatial coverage of mid-latitude mountain permafrost databases with and without warm pipeline disturbances. This dataset consists of daily GTs at depths of 0–20 m in 20 boreholes (10.0 to 60.6 m deep, spanning a range of latitudes from 50.47 to 53.33∘ N), soil volumetric liquid water contents, meteorological variables, and ERT data. The harsh environmental conditions and inaccessibility to the field sites during the COVID-19 pandemic have resulted in some missing data, but we will continue to update the dataset by overcoming these difficulties in subsequent years.
Analysis of data compiled indicates that permafrost conditions along the eastern flank of the northern Da Xing'anling Mountains are controlled by latitude and strongly influenced by the local geo-environmental factors. The MAGT at 15 m depth ranges from −1.8 to −0.4 ∘C, and the ALT varies from 100 to 270 cm from north to south in permafrost terrains. The record from 2011 to 2020 of GT measurements off the ROW indicates an extensive ground warming in the vicinity of the southern limit of latitudinal permafrost. Permafrost temperatures at depths of 8–20 m have been rising at a rate of 0.035 ∘C yr−1, but there is no significant change in ALT, varying between 178 and 200 cm in the 10-year observation period. The GT measurements on the ROW of the pipeline and the ERT results show that the construction and operation of the CRCOP have brought strong thermal disturbances to the underlying and ambient permafrost foundation soils, leading to a talik formation to a maximum depth of 11.5 m around the pipeline, although laterally much confined to the ROW of the CRCOP I. This permafrost disturbance is still expanding and can persist for decades. The permafrost beneath the pipeline ROW cannot be prevented but can be significantly reduced by installing insulation or thermosyphons. This dataset provides a solid basis for assessing the spatiotemporal variability of ground hydrothermal states of the active layer and near-surface (generally ≤20 m) permafrost under the linear disturbances of the buried warm pipeline and related environmental effects, for revealing hydro–thermal–mechanical interactions between buried pipeline and the ambient permafrost environment, for evaluating the integrity of the pipeline systems, and for offering crucial and badly needed data on the design, construction and maintenance of similar pipelines in permafrost regions.
| ALT | Active layer thickness |
| CRCOP | China–Russia crude oil pipeline |
| ER | Electrical resistivity |
| ERT | Electrical resistivity tomography |
| GT | Ground temperature |
| MAAT | Mean annual air temperature |
| MAGT | Mean annual ground temperature |
| ROW | Right-of-way |
| SST | Supra-permafrost subaerial talik |
| VWC | Volumetric liquid water content |
| ZAA | Zero annual amplitude |
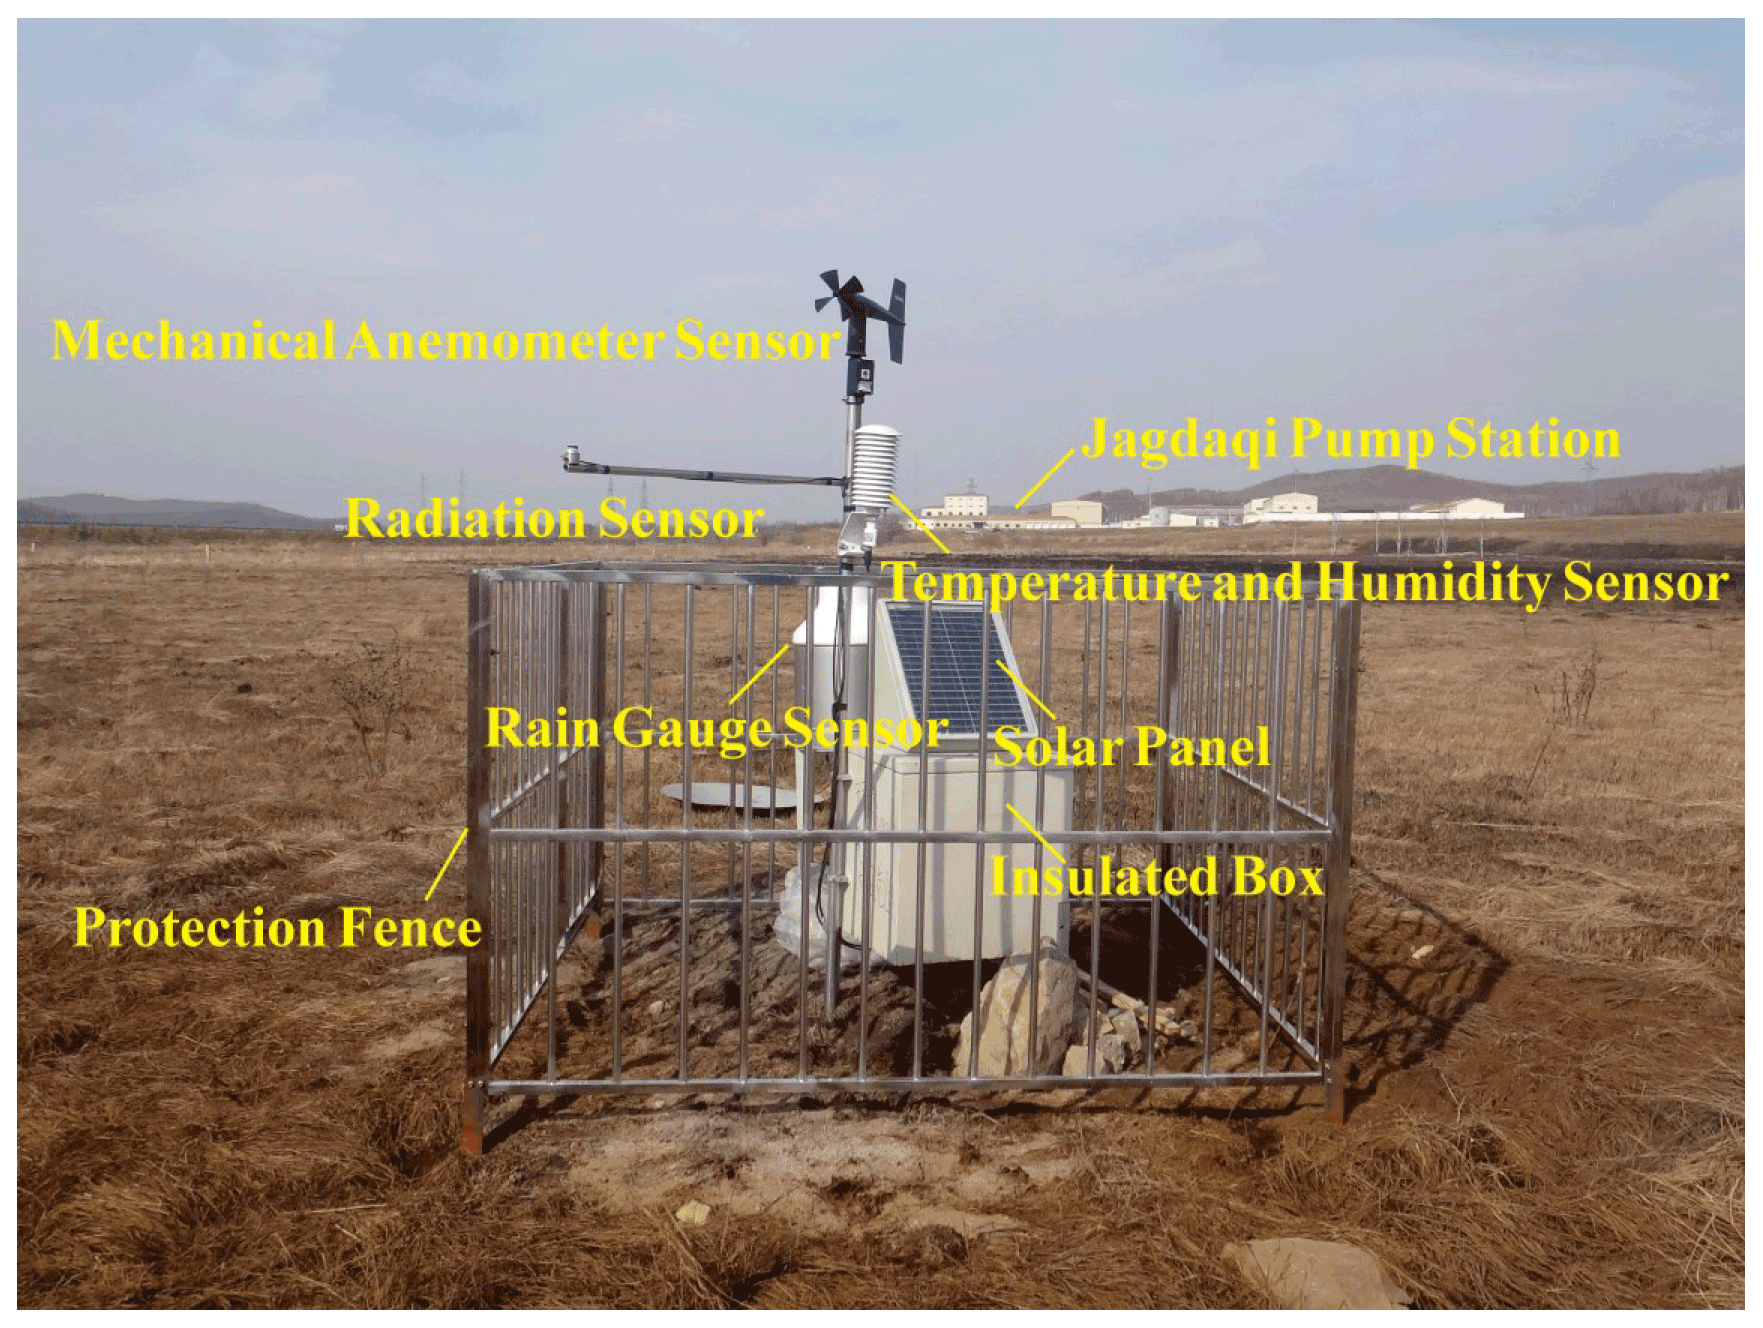
Figure B1The automated weather station and instrumentations at the JB site along the China–Russia crude oil pipeline route in the northern Da Xing'anling Mountains, Northeast China. Notes: photo was taken on 10 April 2018. The rain gauge sensor has been installed but is ineffective. The photo shows the location of the Jagdaqi pump station. The CR3000 data logger, multiplexer, battery cell, solar charge controller, and wireless transmission module are placed in the white box with a solar panel (i.e., insulated box). All monitoring devices are protected by an aluminum alloy fence.
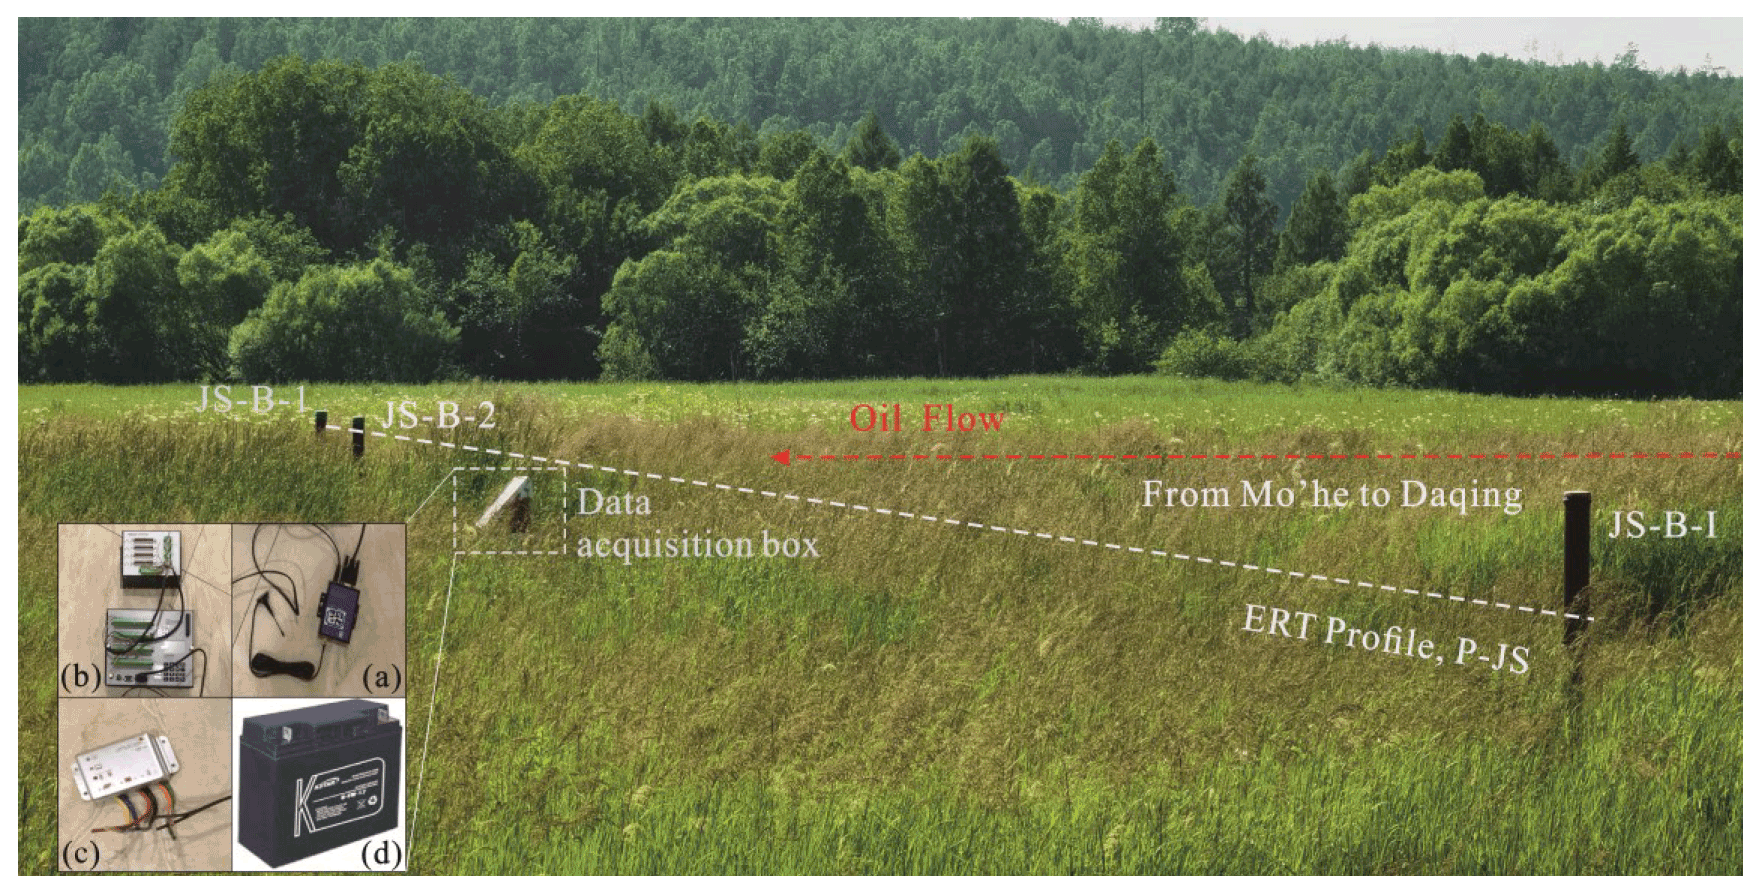
Figure C1Position of boreholes drilled on and off the pipeline ROW and the ERT profile at the JS permafrost site. Photo was taken on 29 June 2021. Ground temperatures are measured using thermistor chains connected to the CR3000 data logger. Notes: (a) wireless transmission module (HKT-DTU, Campbell Scientific, Inc., USA), (b) CR3000 data logger with a TRM128 multiplexer, (c) solar charge controller (Phocos ECO (10 A), Germany), (d) battery cell, a part of the power supply device.
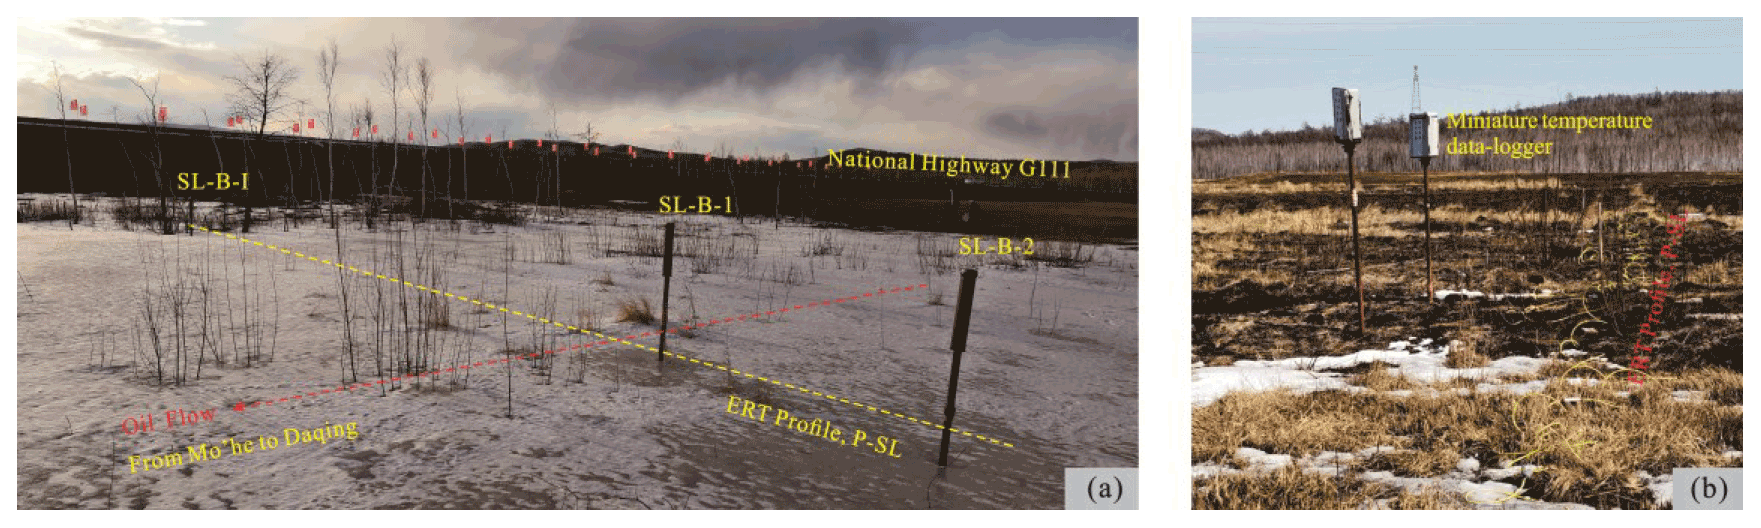
Figure C2Position of boreholes drilled on and off the pipeline ROW and the ERT profile at the SL permafrost site. Notes: (a) Photo was taken on 30 March 2018. The ground surface within the trench is completely covered with ice and snow. (b) Miniature temperature data loggers were installed in August 2020. Photo was taken on 17 April 2021. The surface vegetation was destroyed by a controlled burn.
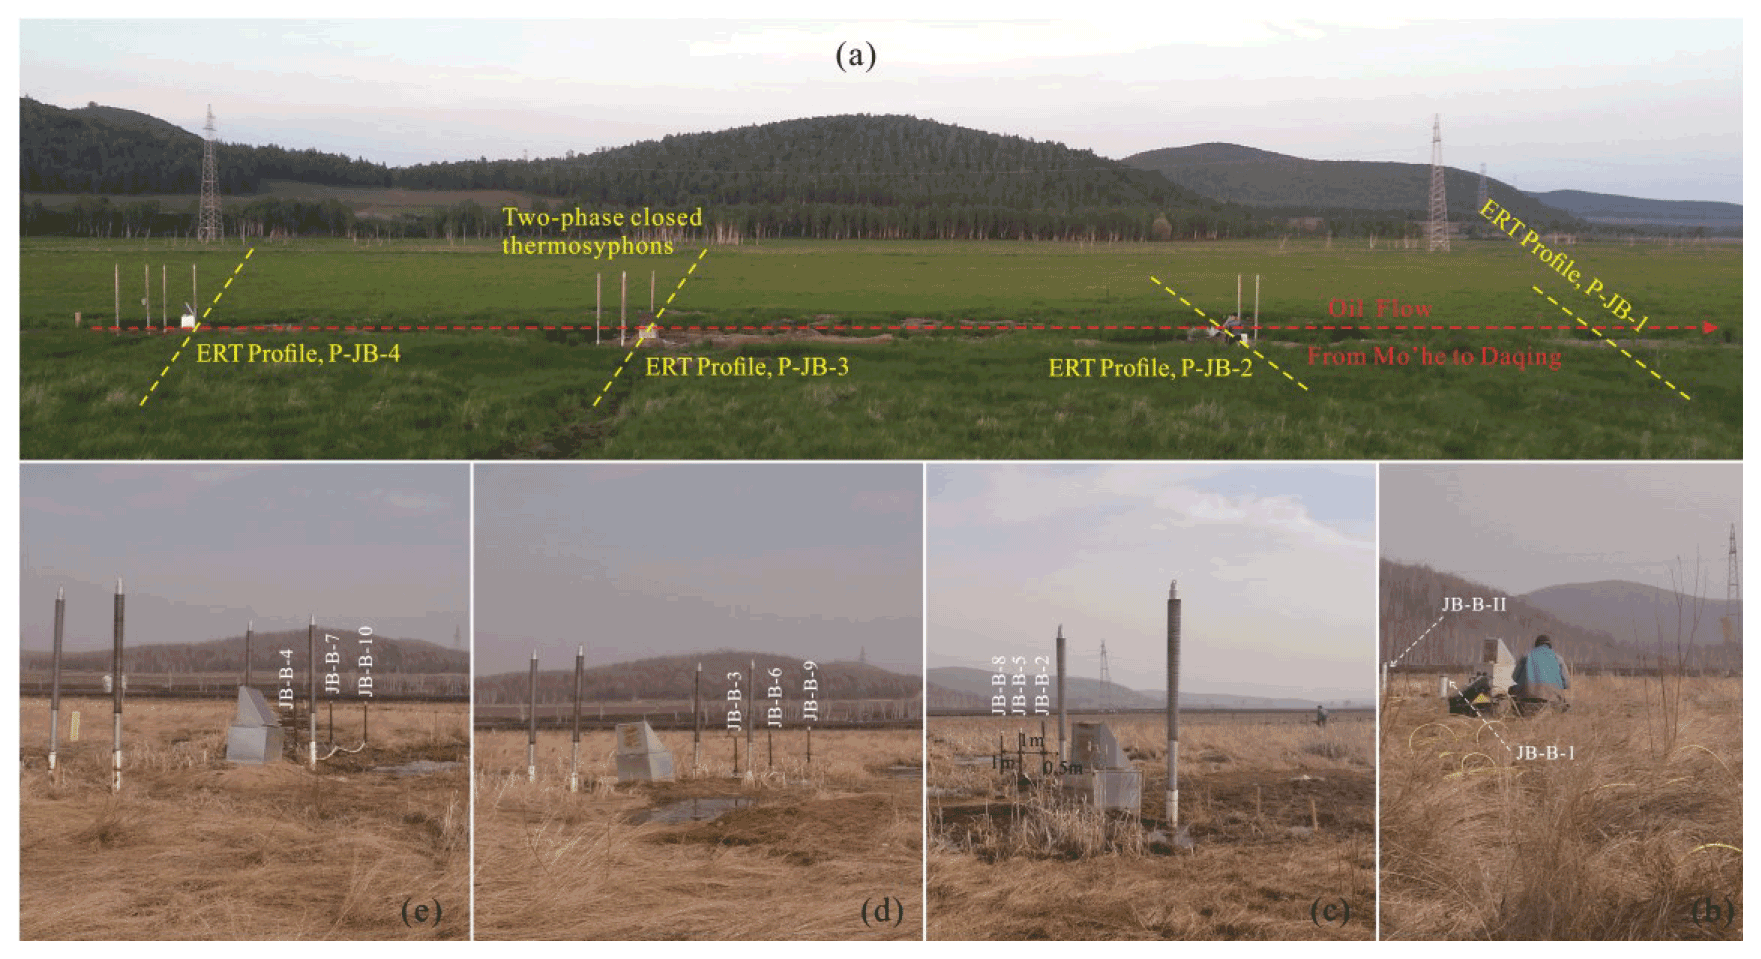
Figure C3Picture of the monitored cross sections, perpendicular to the pipeline at 20 m intervals, at the JB permafrost site. Notes: (a) Plane view, (b) Section 1, without thermosyphon, (c) Section 2, one pair of thermosyphons, (d) Section 3, two pairs of thermosyphons at a longitudinal spacing of 1.3 m, and (e) Section 4, two pairs of thermosyphons at a longitudinal spacing of 1.4 m. The data acquisition device is the same as that at the JS site.
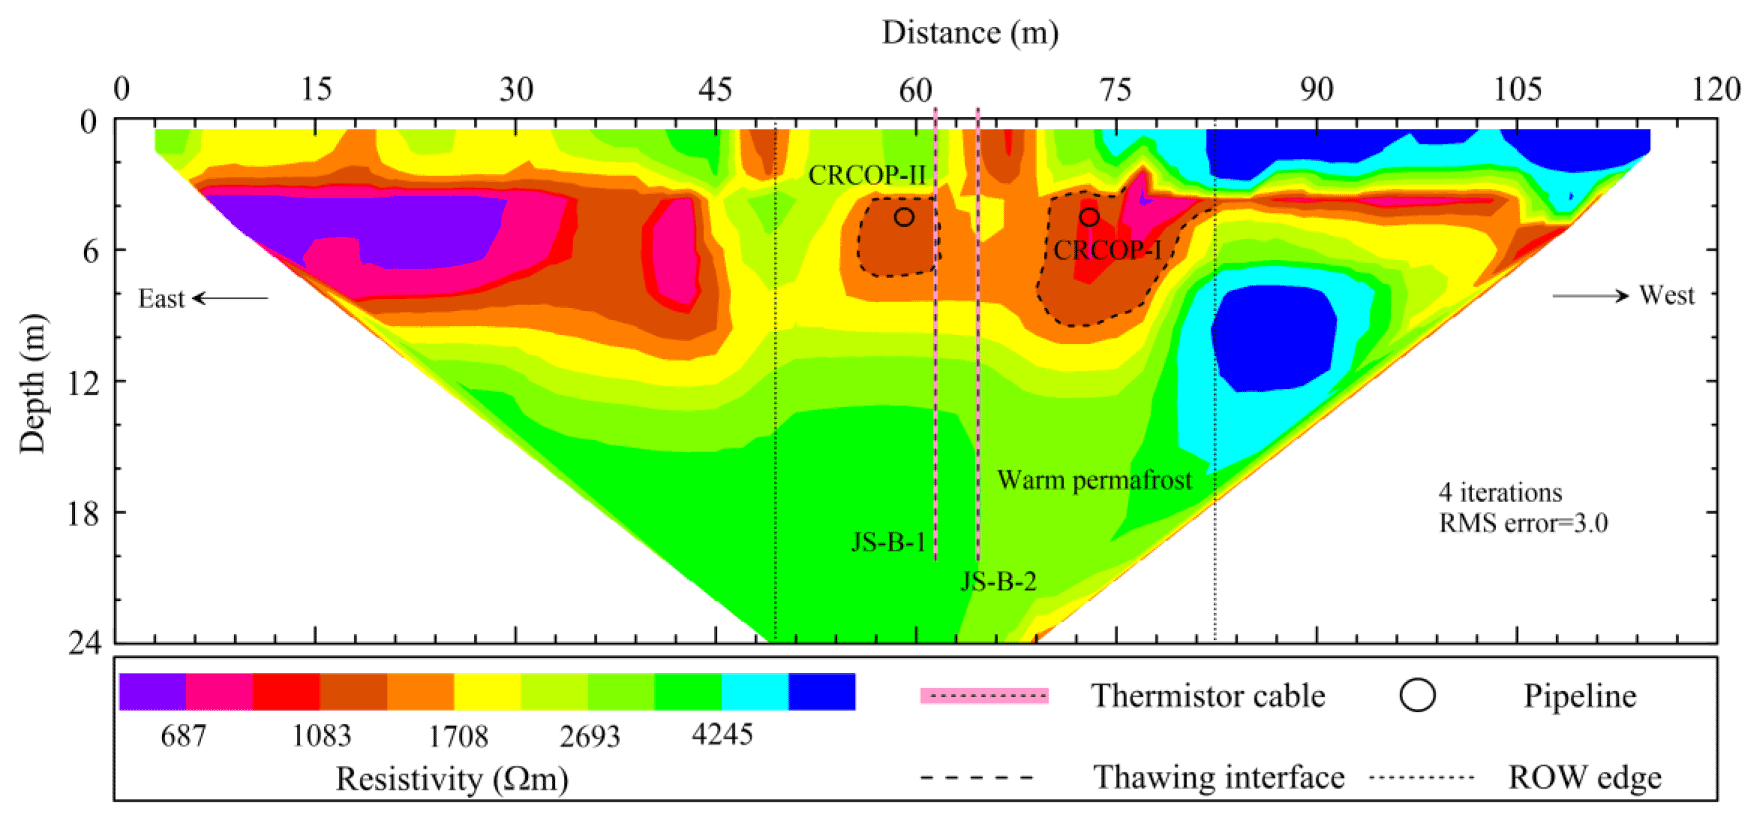
Figure D1Inversion results of electrical imaging along the P-JS profile at the JS site, carried out in April 2018.
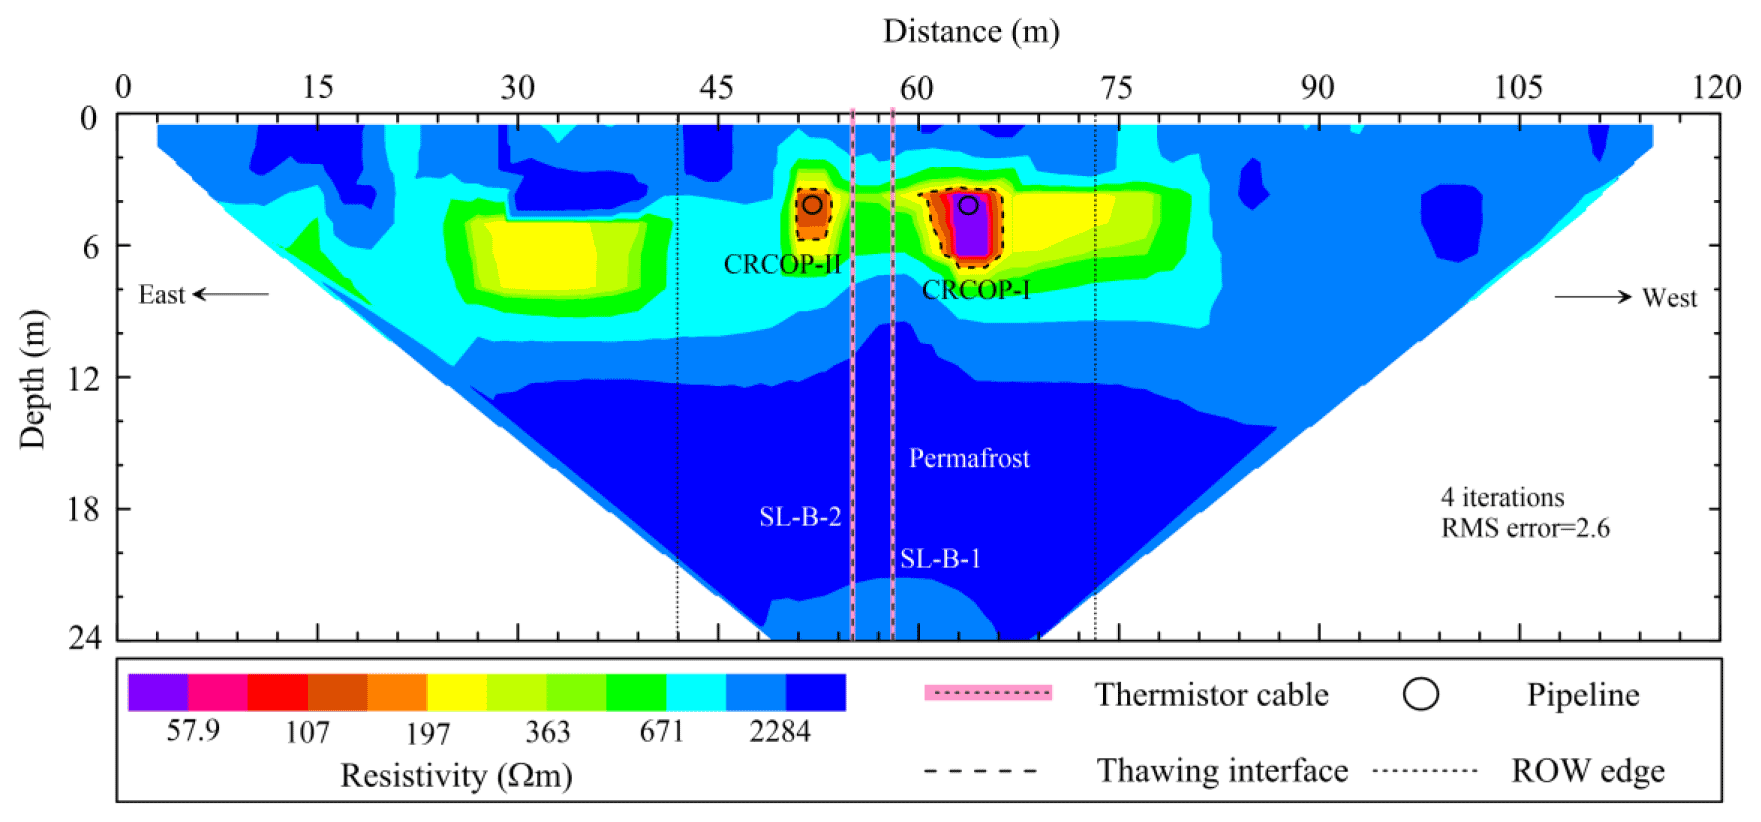
Figure D2Inversion results of electrical imaging along the P-SL profile at the SL site, carried out in April 2018.
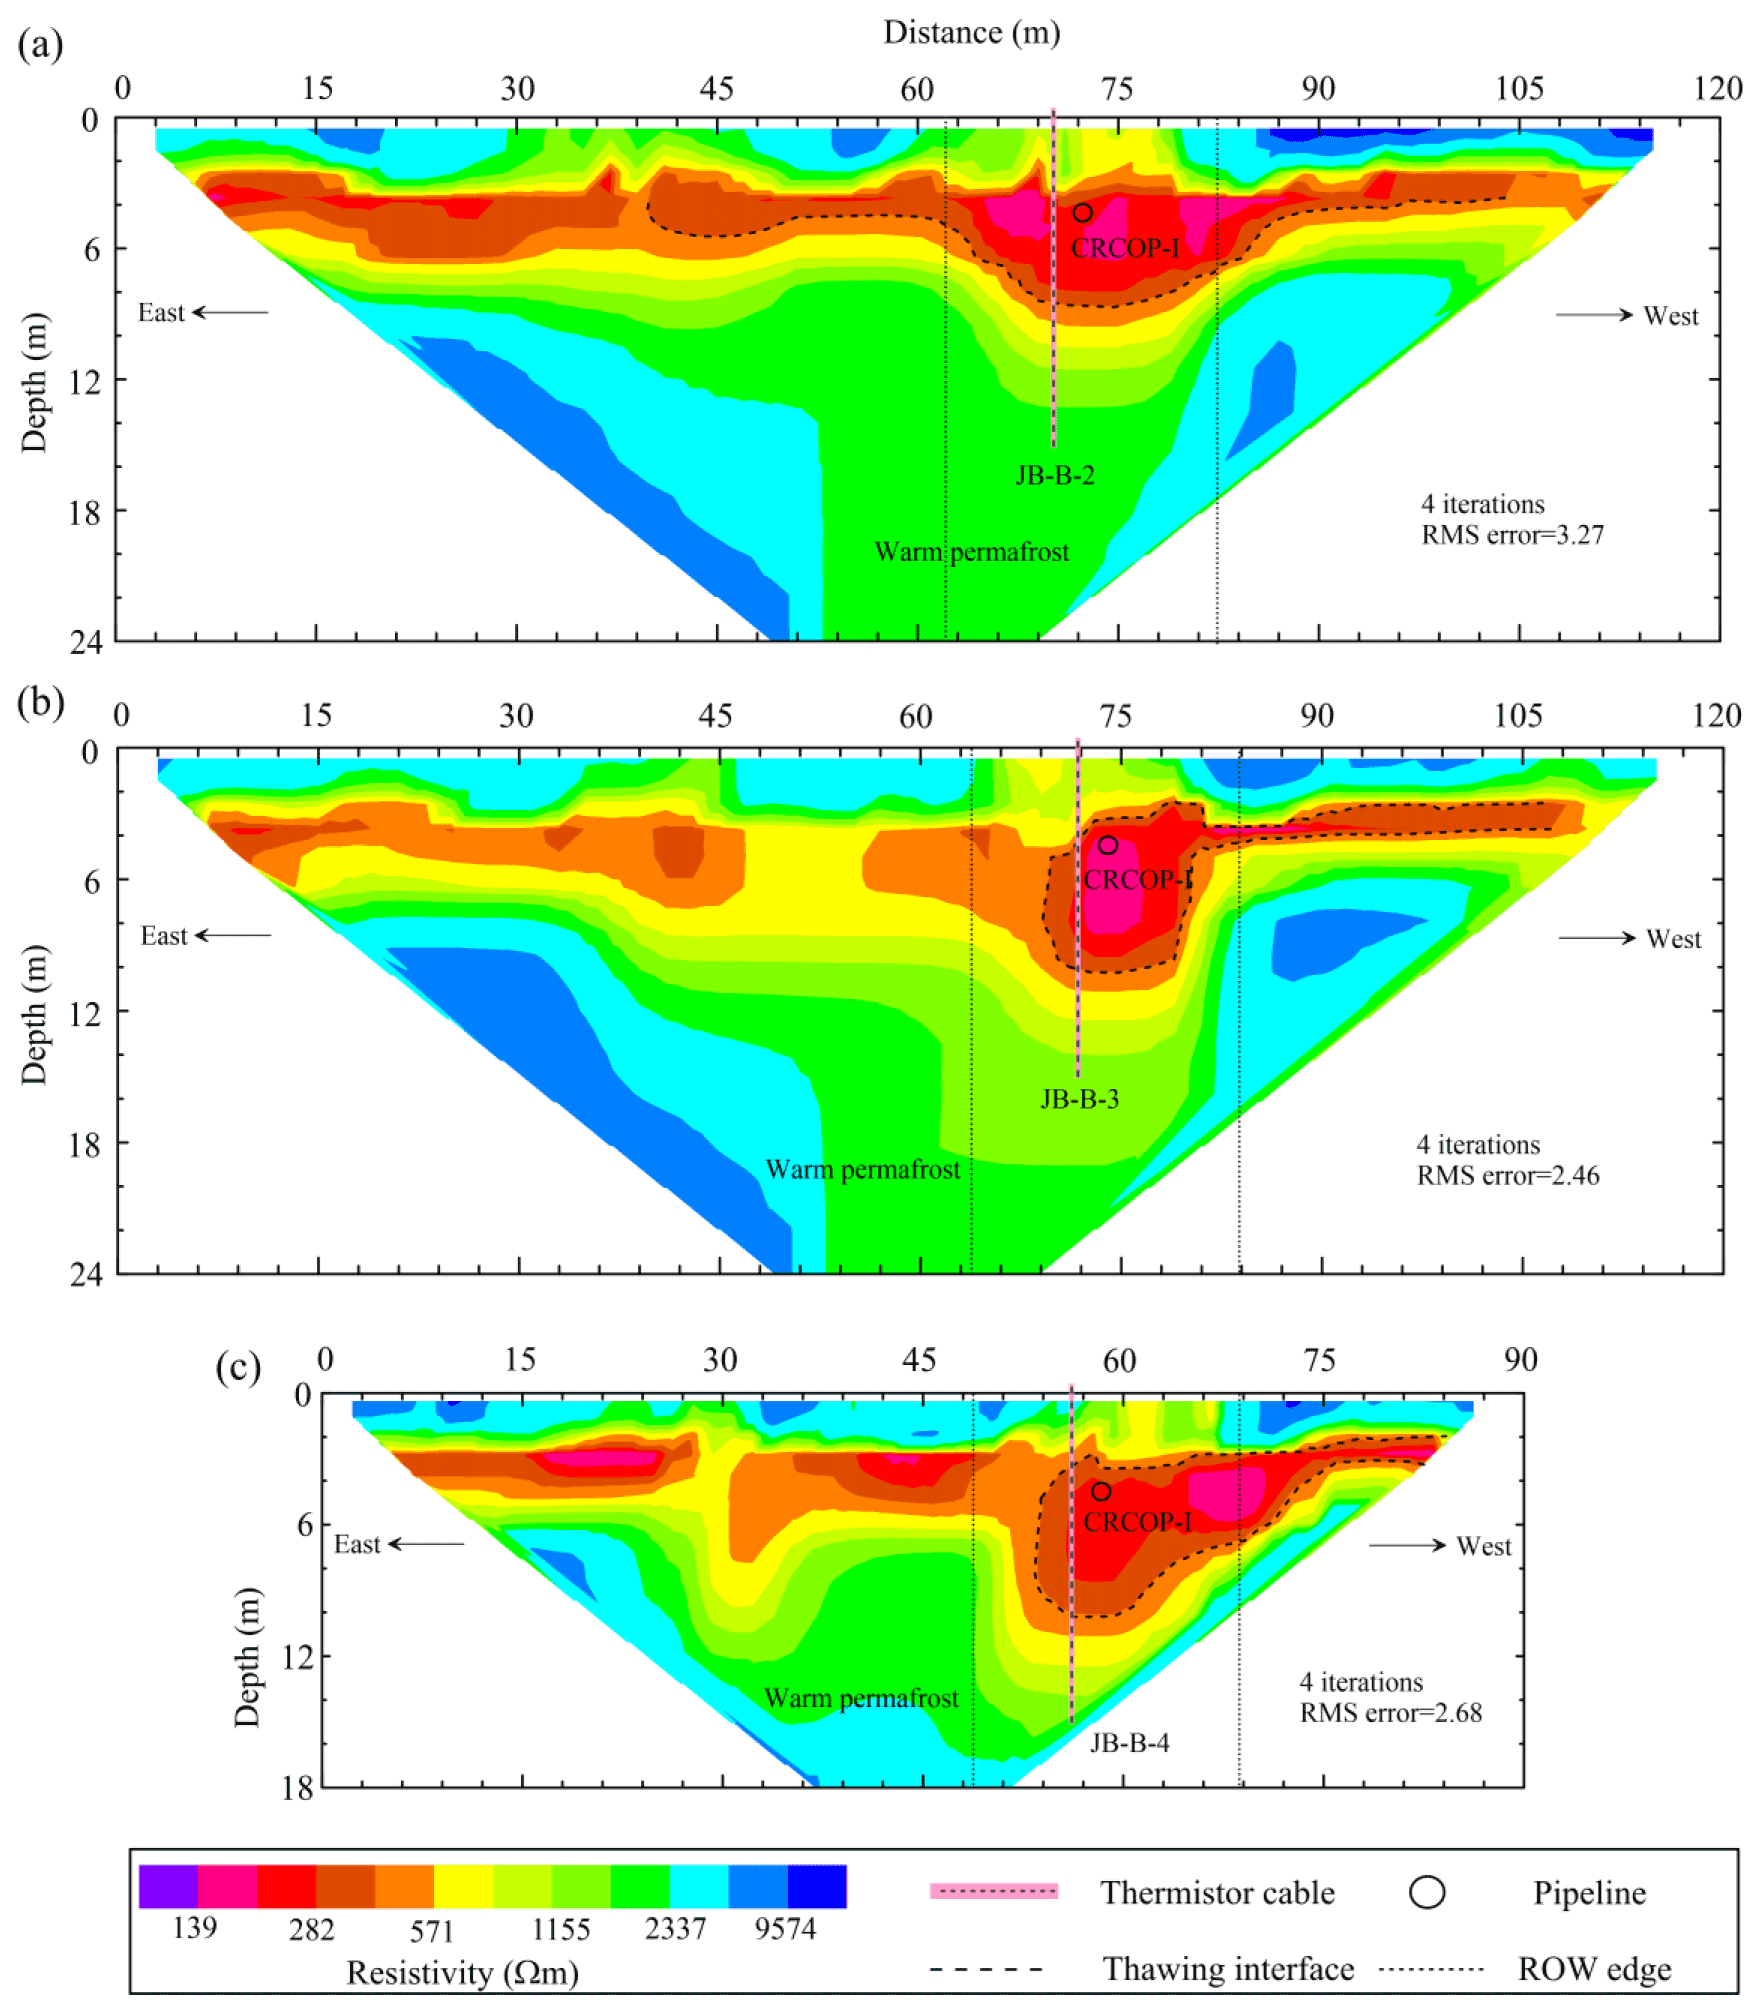
Figure D3Inversion results of electrical imaging along monitored cross sections with thermosyphons at the JB site, carried out in April 2018. Notes: (a) P-JB-2 profile – one pair of thermosyphons, (b) P-JB-3 profile – two pairs of thermosyphons at a longitudinal spacing of 1.3 m, and (c) P-JB-4 profile – two pairs of thermosyphons at a longitudinal spacing of 1.4 m.
GL, WM, HJ and FW designed this study and obtained the financial support to establish and maintain the monitoring sites. FW and GL compiled the dataset, performed the analysis and wrote the manuscript. AF, YM and DC improved the writing. GW, YC, YZ, YM, JZ, KG, RH, XJ, XL and YL participated in the fieldwork and editing of manuscripts at various stages.
The contact author has declared that none of the authors has any competing interests.
Publisher's note: Copernicus Publications remains neutral with regard to jurisdictional claims in published maps and institutional affiliations.
This article is part of the special issue “Extreme environment datasets for the three poles”. It is not associated with a conference.
This work was financially supported by the Strategic Priority Research Program of Chinese Academy of Sciences (grant no. XDA2003020102), the National Natural Science Foundation of China (grant no. 42101121), and the Research Projects of the State Key Laboratory of Frozen Soil Engineering (grant nos. SKLFSE-ZY-20 and SKLFSE202010).
This research has been supported by the Chinese Academy of Sciences (grant no. XDA2003020102), the National Natural Science Foundation of China (grant no. 42101121) and the Research Projects of the State Key Laboratory of Frozen Soil Engineering (grant nos. SKLFSE-ZY-20 and SKLFSE202010).
This paper was edited by Xin Li and reviewed by three anonymous referees.
Beck, I., Ludwig, R., Bernier, M., Strozzi, T., and Boike, J.: Vertical movements of frost mounds in subarctic permafrost regions analyzed using geodetic survey and satellite interferometry, Earth Surf. Dynam., 3, 409–421, https://doi.org/10.5194/esurf-3-409-2015, 2015.
Biskaborn, B. K., Smith, S. L., Noetzli, J., Matthes, H., Vieira, G., Streletskiy, D. A., Schoeneich, P., Romanovsky, V. E., Lewkowicz, A. G., Abramov, A., Allard, M., Boike, J., Cable, W. L., Christiansen, H. H., Delaloye, R., Diekmann, B., Drozdov, D., Etzelmüller, B., Grosse, G., Guglielmin, M., Ingeman-Nielsen, T., Isaksen, K., Ishikawa, M., Johansson, M., Johannsson, H., Joo, A., Kaverin, D., Kholodov, A., Konstantinov, P., Kröger, T., Lambiel, C., Lanckman, J. P., Luo, D., Malkova, G., Meiklejohn, I., Moskalenko, N., Oliva, M., Phillips, M., Ramos, M., Sannel, A. B. K., Sergeev, D., Seybold, C., Skryabin, P., Vasiliev, A., Wu, Q., Yoshikawa, K., Zheleznyak, M., and Lantuit, H.: Permafrost is warming at a global scale, Nat. Commun., 10, 264, https://doi.org/10.1038/s41467-018-08240-4, 2019.
Burgess, M. M. and Smith, S. L.: 17 years of thaw penetration and surface settlement observations in permafrost terrain along the Norman Wells pipeline, Northwest Territories, Canada, in: Proceedings of the 8th International Conference on Permafrost, Zurich, Switzerland, 21–25 July 2003, 107–112, 2003.
Burke, E. J., Zhang, Y., and Krinner, G.: Evaluating permafrost physics in the Coupled Model Intercomparison Project 6 (CMIP6) models and their sensitivity to climate change, The Cryosphere, 14, 3155–3174, https://doi.org/10.5194/tc-14-3155-2020, 2020.
Cheng, G. and Jin, H.: Permafrost and groundwater on the Qinghai-Tibet Plateau and in northeast China, Hydrogeol. J., 21, 5–23, https://doi.org/10.1007/s10040-012-0927-2, 2013.
Dahlin, T. and Zhou, B.: A numerical comparison of 2D resistivity imaging with 10 electrode arrays, Geophys. Prospect., 52, 379–398, https://doi.org/10.1111/j.1365-2478.2004.00423.x, 2004.
Etzelmüller, B., Guglielmin, M., Hauck, C., Hilbich, C., Hoelzle, M., Isaksen, K., and Ramos, M.: Twenty years of European mountain permafrost dynamics-the PACE legacy, Environ. Res. Lett., 15, 104070, https://doi.org/10.1088/1748-9326/abae9d, 2020.
Farzamian, M., Vieira, G., Monteiro Santos, F. A., Yaghoobi Tabar, B., Hauck, C., Paz, M. C., Bernardo, I., Ramos, M., and de Pablo, M. A.: Detailed detection of active layer freeze–thaw dynamics using quasi-continuous electrical resistivity tomography (Deception Island, Antarctica), The Cryosphere, 14, 1105–1120, https://doi.org/10.5194/tc-14-1105-2020, 2020.
Guo, D. and Li, Z.: Historical evolution and formation age of permafrost in northeastern China since the Late Pleistocene, J. Glaciol. Geocryol., 3, 1–6, 1981. (In Chinese)
Guo, W., Liu, H., Anenkhonov, O. A., Shangguan, H., Sandanov, D. V., Korolyuk, A. Y., and Wu, X.: Vegetation can strongly regulate permafrost degradation at its southern edge through changing surface freeze-thaw processes, Agr. Forest. Meteorol., 252, 10–17, https://doi.org/10.1016/j.agrformet.2018.01.010, 2018.
He, R., Jin, H., Luo, D., Li, X., Zhou, C., Jia, N., and Yu, S.: Permafrost changes in the Nanwenghe Wetlands Reserve on the southern slope of the Da Xing'anling-Yile'huli mountains, Northeast China, Adv. Clim. Change Res., 12, 696–709, https://doi.org/10.1016/j.accre.2021.06.007, 2021.
Hjort, J., Karjalainen, O., Aalto, J., Westermann, S., Romanovsky, V. E., Nelson, F. E., Etzelmüller, B., and Luoto, M.: Degrading permafrost puts Arctic infrastructure at risk by mid-century, Nat. Commun., 9, 5147, https://doi.org/10.1038/s41467-018-07557-4, 2018.
Hjort, J., Streletskiy, D., Doré, G., Wu, Q., Bjella, K., and Luoto, M.: Impacts of permafrost degradation on infrastructure, Nat. Rev. Earth Env., 3, 24–38, https://doi.org/10.1038/s43017-021-00247-8, 2022.
Hu, Z. and Shan, W.: Landslide investigations in the northwest section of the lesser Khingan range in China using combined HDR and GPR methods, B. Eng. Geol. Environ., 75, 591–603, https://doi.org/10.1007/s10064-015-0805-y, 2016.
Jin, H. and Ma, Q.: Impacts of permafrost degradation on carbon stocks and emissions under a warming climate: A review, Atmosphere, 12, 1425, https://doi.org/10.3390/atmos12111425, 2021.
Jin, H., Yu, Q., Lü, L., Guo, D., He, R., Yu, S., and Li, Y.: Degradation of permafrost in the Xing'anling Mountains, Northeastern China, Permafrost Periglac., 18, 245–258, https://doi.org/10.1002/ppp.589, 2007.
Jin, H., Sun, G., Yu, S., Jin, R., and He, R.: Symbiosis of marshes and permafrost in Da and Xiao Hinggan Mountains in northeastern China, Chinese Geogr. Sci., 18, 62–69, https://doi.org/10.1007/s11769-008-0062-0, 2008.
Jin, H., Hao, J., Chang, X., Zhang, J., Qi, J., Lü, L., and Wang, S.: Zonation and assessment of frozen-ground conditions for engineering geology along the China–Russia crude oil pipeline route from Mo'he to Daqing, Northeastern China, Cold Reg. Sci. Technol., 64, 213–225, https://doi.org/10.1016/j.coldregions.2009.12.003, 2010.
Jin, H., Wu, Q., and Romanovsky, V. E.: Degrading permafrost and its impacts, Adv. Clim. Change Res., 12, 1–5, https://doi.org/10.1016/j.accre.2021.01.007, 2021.
Jin, H., Huang, Y., Bense, V. F., Ma, Q., Marchenko, S. S., Shepelev, V. V., and Li, X.: Permafrost degradation and its hydrogeological impacts, Water, 14, 372, https://doi.org/10.3390/w14030372, 2022.
Johnson, E. R. and Hegdal, L. A.: Permafrost-related performance of the Trans-Alaska oil pipeline, in: Proceedings of 9th International Conference on Permafrost, Fairbanks, USA, June 28-July 3 2008, 857–864, 2008.
Jones, B. M., Grosse, G., Farquharson, L. M., Roy-Léveillée, P., Veremeeva, A., Kanevskiy, M. Z., and Hinkel, K. M.: Lake and drained lake basin systems in lowland permafrost regions, Nat. Rev. Earth Env., 3, 85–98, https://doi.org/10.1038/s43017-021-00238-9, 2022.
Juliussen, H., Christiansen, H. H., Strand, G. S., Iversen, S., Midttømme, K., and Rønning, J. S.: NORPERM, the Norwegian Permafrost Database – a TSP NORWAY IPY legacy, Earth Syst. Sci. Data, 2, 235–246, https://doi.org/10.5194/essd-2-235-2010, 2010.
Kneisel, C., Hauck, C., Fortier, R., and Moorman, B.: Advances in geophysical methods for permafrost investigations. Permafrost Periglac., 19, 157–178, https://doi.org/10.1002/ppp.616, 2008.
Koven, C. D., Riley, W. J., and Stern, A.: Analysis of permafrost thermal dynamics and response to climate change in the CMIP5 Earth System Models, J. Climate, 26, 1877–1900, https://doi.org/10.1175/JCLI-D-12-00228.1, 2013.
Li, G.: Ground temperature dataset of permafrost along the China-Russia crude oil pipeline route (2011–2021), National Tibetan Plateau Data Center [data set], https://doi.org/10.11888/Cryos.tpdc.272357, 2022.
Li, G., Wang, F., Ma, W., Fortier, R., Mu, Y., Zhou, Z., and Cai, Y.: Field observations of cooling performance of thermosyphons on permafrost under the China-Russia Crude Oil Pipeline, Appl. Therm. Eng., 141, 688–696, https://doi.org/10.1016/j.applthermaleng.2018.06.005, 2018.
Li, X., Jin, H., Wang, H., Marchenko, S. S., Shan, W., Luo, D., He, R., Spektor, V., Huang, Y., Li, X., and Jia, N.: Influences of forest fires on the permafrost environment: A review, Adv. Clim. Change Res., 12, 48–65, https://doi.org/10.1016/j.accre.2021.01.001, 2021a.
Li, X., Jin, X., Wang, X., Jin, H., Tang, L., Li, X., and Zhang, S.: Investigation of permafrost engineering geological environment with electrical resistivity tomography: A case study along the China-Russia crude oil pipelines, Eng. Geol., 291, 106237, https://doi.org/10.1016/j.enggeo.2021.106237, 2021b.
Liu, G., Xie, C., Zhao, L., Xiao, Y., Wu, T., Wang, W., and Liu, W.: Permafrost warming near the northern limit of permafrost on the Qinghai–Tibetan Plateau during the period from 2005 to 2017: A case study in the Xidatan area, Permafrost Periglac., 32, 323–334, https://doi.org/10.1002/ppp.2089, 2021.
Liu, W., Fortier, R., Molson, J., and Lemieux, J. M.: Three-dimensional numerical modeling of cryo-hydrogeological processes in a river-talik system in a continuous permafrost environment. Water Resour. Res., 58, e2021WR031630, https://doi.org/10.1029/2021WR031630, 2022.
Luo, L., Zhuang, Y., Zhang, M., Zhang, Z., Ma, W., Zhao, W., Zhao, L., Wang, L., Shi, Y., Zhang, Z., Duan, Q., Tian, D., and Zhou, Q.: An integrated observation dataset of the hydrological and thermal deformation in permafrost slopes and engineering infrastructure in the Qinghai–Tibet Engineering Corridor, Earth Syst. Sci. Data, 13, 4035–4052, https://doi.org/10.5194/essd-13-4035-2021, 2021.
Mao, Y., Li, G., Ma, W., Mu, Y., Wang, F., Miao, J., and Wu, D.: Field observation of permafrost degradation under Mo'he airport, Northeastern China from 2007 to 2016, Cold Reg. Sci. Technol., 161, 43–50, https://doi.org/10.1016/j.coldregions.2019.03.004, 2019.
Miner, K. R., Turetsky, M. R., Malina, E., Bartsch, A., Tamminen, J., McGuire, A. D., Fix, A., Sweeney, C., Elder, C. D., and Miller, C. E.: Permafrost carbon emissions in a changing Arctic, Nat. Rev. Earth Environ., 3, 55–67, https://doi.org/10.1038/s43017-021-00230-3, 2022.
Noetzli, J., Christiansen, H. H., Hrbacek, F., Isaksen, K., Smith, S. L., Zhao, L., and Streletskiy, D. A.: Permafrost thermal state, in: State of the Climate in 2020, Global Climate, edited by: Dunn, R. J. H., Aldred, F., Gobron, N., Miller, J. B., and Willett, K. M., B. Am. Meteorol. Soc., 102, S42–S44, https://doi.org/10.1175/BAMS-D-21-0098.1, 2021.
O'Neill, H. B., Smith, S. L., and Duchesne, C.: Long-term permafrost degradation and thermokarst subsidence in the mackenzie delta area indicated by thaw tube measurements, in: Proceedings of 18th International Conference on Cold Regions Engineering and 8th Canadian Permafrost Conference, Quebec, Canada, 18–22 August 2019, 643–651, https://doi.org/10.1061/9780784482599.074, 2019.
Oswell, J. M.: Pipelines in permafrost: geotechnical issues and lessons, Can. Geotech. J., 48, 1412–1431, https://doi.org/10.1139/t11-045, 2011.
Ran, Y., Li, X., Cheng, G., Zhang, T., Wu, Q., Jin, H., and Jin, R.: Distribution of Permafrost in China: An overview of existing permafrost maps, Permafrost Periglac., 23, 322–333, https://doi.org/10.1002/ppp.1756, 2012.
Ran, Y., Li, X., and Cheng, G.: Climate warming over the past half century has led to thermal degradation of permafrost on the Qinghai–Tibet Plateau, The Cryosphere, 12, 595–608, https://doi.org/10.5194/tc-12-595-2018, 2018.
Romanovsky, V. E., Drozdov, D. S., Oberman, N. G., Malkova, G. V., Kholodov, A. L., Marchenko, S. S., Moskalenko, N. G., Sergeev, D. O., Ukraintseva, N. G., Abramov, A. A., Gilichinsky, D. A., and Vasiliev, A. A.: Thermal state of permafrost in Russia, Permafrost Periglac., 21, 136–155, https://doi.org/10.1002/ppp.683, 2010.
Seligman, B. J.: Long-term variability of pipeline-permafrost interactions in north-west Siberia, Permafrost Periglac., 11, 5–22, https://doi.org/10.1002/(sici)1099-1530(200001/03)11:1<5::aid-ppp335>3.0.co;2-c, 2000.
Şerban, R. D., Şerban, M., He, R., Jin, H., Li, Y., Li, X., Wang, X., and Li, G.: 46-year (1973–2019) permafrost landscape changes in the Hola Basin, Northeast China using machine learning and object-oriented classification, Remote Sensing, 13, 1910, https://doi.org/10.3390/rs13101910, 2021.
Smith, S. L. and Riseborough, D. W.: Modelling the thermal response of permafrost terrain to right-of-way disturbance and climate warming, Cold Reg. Sci. Technol., 60, 92–103, https://doi.org/10.1016/j.coldregions.2009.08.009, 2010.
Smith, S. L., Romanovsky, V. E., Lewkowicz, A. G., Burn, C. R., Allard, M., Clow, G. D., Yoshikawa, K., and Throop, J.: Thermal state of permafrost in North America: a contribution to the international polar year, Permafrost Periglac., 21, 117–135, https://doi.org/10.1002/ppp.690, 2010.
Smith, S. L., O'Neill, H. B., Isaksen, K., Noetzli, J., and Romanovsky, V. E.: The changing thermal state of permafrost, Nat. Rev. Earth Environ., 3, 10–23, https://doi.org/10.1038/s43017-021-00240-1, 2022.
Turetsky, M. R., Abbott, B. W., Jones, M. C., Anthony, K. W., Olefeldt, D., Schuur, E. A. G., Grosse, G., Kuhry, P., Hugelius, G., Koven, C., Lawrence, D. M., Gibson, C., Sannel, A. B. K., and McGuire, A. D.: Carbon release through abrupt permafrost thaw, Nat. Geosci., 13, 138–143, https://doi.org/10.1038/s41561-019-0526-0, 2020.
Wang, F., Li, G., Ma, W., Mao, Y., Mu, Y., Serban, M., and Cai, Y.: Permafrost warming along the Mo'he-Jiagedaqi section of the China-Russia crude oil pipeline, J. Mt. Sci-Engl., 16, 285–295, https://doi.org/10.1007/s11629-018-5318-2, 2019a.
Wang, F., Li, G., Ma, W., Wu, Q., Serban, M., Vera, S., Alexandr, F., Jiang, N., and Wang, B.: Pipeline–permafrost interaction monitoring system along the China–Russia crude oil pipeline, Eng. Geol., 254, 113–125, https://doi.org/10.1016/j.enggeo.2019.03.013, 2019b.
Wang, Y., Jin, H., Li, G., and Tong, C.: Secondary geohazards along the operating Mohe-Jagdaqi section of China-Russia crude oil pipeline in permafrost regions: a case study on a seasonal frost mound at the Site MDX364, J. Glaciol. Geocryol., 37, 731–739, 2015 (in Chinese).
Wei, Z., Jin, H., Zhang, J., Yu, S., Han, X., Ji, Y., He, R., and Chang, X.: Prediction of permafrost changes in Northeastern China under a changing climate, Sci. China Earth Sci., 54, 924–935, https://doi.org/10.1007/s11430-010-4109-6, 2011.
Wu, T., Xie, C., Zhu, X., Chen, J., Wang, W., Li, R., Wen, A., Wang, D., Lou, P., Shang, C., La, Y., Wei, X., Ma, X., Qiao, Y., Wu, X., Pang, Q., and Hu, G.: Permafrost, active layer, and meteorological data (2010–2020) at the Mahan Mountain relict permafrost site of northeastern Qinghai–Tibet Plateau, Earth Syst. Sci. Data, 14, 1257–1269, https://doi.org/10.5194/essd-14-1257-2022, 2022.
Zhang, T.: Talik, in: Encyclopedia of Snow, Ice and Glaciers, edited by: Singh, V. P., Singh, P., and Haritashya, U. K., Springer Netherlands, Dordrecht, 1143–1144, https://doi.org/10.1007/978-90-481-2642-2_563, 2011.
Zhang, Z., Wu, Q., Hou, M., Tai, B., and An, Y.: Permafrost change in Northeast China in the 1950s–2010s, Adv. Clim. Change Res., 12, 18–28, https://doi.org/10.1016/j.accre.2021.01.006, 2021.
Zhao, L., Zou, D., Hu, G., Wu, T., Du, E., Liu, G., Xiao, Y., Li, R., Pang, Q., Qiao, Y., Wu, X., Sun, Z., Xing, Z., Sheng, Y., Zhao, Y., Shi, J., Xie, C., Wang, L., Wang, C., and Cheng, G.: A synthesis dataset of permafrost thermal state for the Qinghai–Tibet (Xizang) Plateau, China, Earth Syst. Sci. Data, 13, 4207–4218, https://doi.org/10.5194/essd-13-4207-2021, 2021.
- Abstract
- Introduction
- Site description
- Data description
- Data availability
- Conclusions
- Appendix A: Abbreviations
- Appendix B: Photos of meteorological station and instrumentations
- Appendix C: Relative position of boreholes and automatic collection instrumentation for ground temperatures at permafrost monitoring sites
- Appendix D: ERT results along P-JS, P-SL, P-JB-2, P-JB-3, and P-JB-4 profiles
- Author contributions
- Competing interests
- Disclaimer
- Special issue statement
- Acknowledgements
- Financial support
- Review statement
- References