the Creative Commons Attribution 4.0 License.
the Creative Commons Attribution 4.0 License.
 | 15 Nov 2022
The PANDA automatic weather station network between the coast and Dome A, East Antarctica
Xiaowei Zou
Qizhen Sun
Diyi Yang
Wenqian Zhang
Lingen Bian
Changgui Lu
Ian Allison
Petra Heil
Cunde Xiao
This paper introduces a unique multiyear dataset and the monitoring capability of the PANDA automatic weather station network, which includes 11 automatic weather stations (AWSs) across the Prydz Bay–Amery Ice Shelf–Dome A area from the coast to the summit of the East Antarctic Ice Sheet. The ∼ 1460 km transect from Zhongshan to Panda S follows roughly along ∼ 77∘ E longitude and covers all geographic units of East Antarctica. Initial inland observations, near the coast, started in the 1996/97 austral summer. All AWSs in this network measure air temperature, relative humidity, air pressure, wind speed and wind direction at 1 h intervals, and some of them can also measure firn temperature and shortwave/longwave radiation. Data are relayed in near real time via the Argos system. The data quality is generally very reliable, and the data have been used widely. In this paper, we firstly present a detailed overview of the AWSs, including the sensor characteristics, installation procedure, data quality control protocol and the basic analysis of each variable. We then give an example of a short-term atmospheric event that shows the monitoring capacity of the PANDA AWS network. This dataset, which is publicly available, is planned to be updated on a near-real-time basis and should be valuable for climate change estimation, extreme weather events diagnosis, data assimilation, weather forecasting, etc. The dataset is available at https://doi.org/10.11888/Atmos.tpdc.272721 (Ding et al., 2022b).
- Article
(7091 KB) - Full-text XML
- Companion paper
- BibTeX
- EndNote


Antarctica, covered by a vast ice sheet, has the coldest climate on Earth's surface (Qin and Ren, 2001; Van den Broeke and Van Lipzig, 2003; Zhou et al., 2009). Great efforts have been made to study Antarctic climate change under global warming because of its role in the climate system and its capability to greatly impact global sea level rise (IPCC, 2019; Huai et al., 2019). However, the reliability of Antarctic climate change estimation and weather forecasting is still under debate (Hines et al., 2019; Zhang et al., 2021). This is a consequence of the paucity of observations, especially at long-term inland weather stations, which can be directly assimilated into models and reanalysis data (Vignon et al., 2017; Wei et al., 2019).
The first attempt at automatic weather station (AWS) observations in Antarctica was in 1956/57, when station XG-1 was deployed by the United States near McMurdo; but this station was short-lived (Lazzara et al., 2012). Early attempts at AWS observations were also made off the coast of East Antarctica by the Australian National Antarctic Research Expedition (ANARE) at Chick Island (in 1961) and Lewis Island (in 1962). Both these stations were also short-lived.
Development of automatic observational technology in polar regions was greatly advanced with the initiation, in 1978, of the Argos data relay system on polar-orbiting satellites. This, together with more robust and power-efficient electronics, saw successful Antarctic AWS deployments by the University of Wisconsin, USA, commencing in 1980. The Australian Antarctic Division (AAD) also tested its design of AWSs at near-coastal sites in 1980 and deployed its first successful station on the inland ice sheet, at 1830 m elevation, in January 1982 (Allison and Morrissey, 1983). Subsequently, more and more Antarctic AWSs were installed: ∼ 30 by 1990, ∼ 55 by 2000, ∼ 60 by 2010 and ∼ 160 by 2020 (Bromwich et al., 2020). Many of these were installed as part of a United States network on the Ross Ice Shelf, inland from the Adélie Land coast for a study of katabatic wind flow and at other interior ice sheet sites (Lazzara et al., 2012). During the International Antarctic Glaciological Project traverses from Casey Station, ANARE AWSs were deployed on the ice sheet, along about 110∘ E to 3096 m elevation. Australian glaciological traverses between Mawson and Zhongshan deployed five AWSs at 2500 m elevation around the interior of the Lambert Glacier basin (LGB), between 1990 and 1994 (Allison et al., 1993; Allison, 1998; Heil, 2006). Further west in eastern Dronning Maud Land, stations were built and deployed on the ice sheet by Japan at Dome Fuji (in December 1993) and Relay (in January 1993) (Enomoto et al., 1995). To extend knowledge of the near-surface climate and heat budget of Antarctica, the Netherlands started to deploy AWSs in western Dronning Maud Land in January 1997 (Reijmer and Oerlemans, 2002).
Several of the AWSs mentioned failed after a relatively short time, and those in high-accumulation near-coastal areas became buried by snow. But quite a few continued to provide high-quality data for many years. For example, the Australian AWS at GC41, inland of Casey at 2760 m elevation, provided good data for more than 21 years until eventually buried, although it was never visited for maintenance. The interior ice sheet with low accumulation, relatively low wind speeds and no liquid water is a benign environment for electronic systems if properly designed for very low temperatures. The higher-latitude sites also see more transits of polar-orbiting satellites carrying the Argos data relay system.
These AWS observations have made valuable contributions to Antarctic research. Firstly, the data have been used to evaluate weather and climate changes (Turner et al., 2005, 2007; Wei et al., 2019; Wang et al., 2022). For example, Schwerdtfeger (1984) gave a brief characterization of the inland Antarctica climate from AWS data. Allison et al. (1993) analyzed the influence of ice sheet topography on surface meteorology using 10 AWSs from both the US–French network in Adélie Land and the Australian network inland of Casey. Secondly, AWS data, including radiation measurements, can be used to investigate ice/snow–atmosphere interaction processes in Antarctica. Van den Broeke et al. (2004a, b, 2005, 2006) studied the daily and seasonal variation in the surface energy balance in detail in Dronning Maud Land. Ding et al. (2020, 2021a) improved the surface energy balance simulation scheme at Dome A and the inland Antarctic area with long-term AWS measurements. Thirdly, AWS observations are also critical in evaluating the applicability of reanalysis data and numerical models in Antarctica. Nigro et al. (2011) estimated the performance of Antarctic Mesoscale Prediction System (AMPS) under varied synoptic conditions with AWS data for the Ross Ice Shelf. Xie et al. (2014) assessed the accuracy of daily mean surface pressure from different meteorological reanalyzes against in situ observations from automatic weather stations in East Antarctica. Dong et al. (2020) evaluated the robustness of the near-surface wind speed of multiple global atmospheric reanalyses in Antarctica based on many AWSs and meteorological observations made at staffed stations. Recently, Wei et al. (2019) and Turner et al. (2020) used multiple meteorological records to give the spatial–temporal distribution of temperature extremes across Antarctica for the first time.
However, most staffed observational sites and AWSs in Antarctica are still mainly located in the coastal area, and data from the sparse inland sites are interrupted frequently (e.g., the anemometer was often frozen during austral winter at Eagle and Dome A) (Wendler et al., 1988; Van As et al., 2005; Zhou et al., 2009; Lazzara et al., 2012; Sun et al., 2018; Bromwich et al., 2020). More continuous and systematic AWS observations are still required from Antarctica.
Commencing in the 1996/97 austral summer, the Chinese National Antarctic Research Expedition (CHINARE) started deploying AWSs between the coastal Zhongshan and inland Panda S (the PANDA transect). The first stations deployed on this transect were manufactured by the AAD, but after 2012, the Chinese Academy of Meteorological Sciences made great progress in AWS design, especially with respect to the ultra-low-temperature power supply system (patent for invention – Ding et al., 2021b), and deployed seven further AWSs along the PANDA transect.
Initial studies using these observations focused on the coastal area or a single site (e.g., van den Broeke et al., 2004a, b; Chen et al., 2010), while later studies used data from more inland stations (Ma et al., 2010; Ding et al., 2021a). Only a few studies have used meteorological information (shown in Table 1) from the whole transect (Zhou et al., 2009; Ma et al., 2010; Bian et al., 2016). That is because only five of the initial AWSs were still operating in 2012 (Dome A, Eagle, Panda N, Zhongshan and Panda S); others had been buried by snow accumulation or failed due to low air temperature (Ding et al., 2021a). Subsequent AWSs have been installed close to the locations of the failed stations to extend the measurements (e.g., Panda 200 was installed close to LGB69). The more recent deployments now provide consistent, high-quality and real-time meteorological observations from the PANDA AWS network. Some data from the PANDA AWS network have been compiled by the World Meteorological Organization (WMO; e.g., Dome A ID: 89577, Eagle ID: 89578, Kunlun ID: 89572, Taishan ID: 89576), and some are available as monthly means from the Scientific Committee on Antarctic Research (SCAR) REference Antarctic Data for Environmental Research (READER) (https://www.bas.ac.uk/project/reader/, last access: 1 November 2022). But most of these data have not been published before. Here, to promote and make available the value of these AWSs data, we provide metadata of the dataset that will be updated in near real time on the platform “Big Earth Data for Three Poles” (http://poles.tpdc.ac.cn/zh-hans/, last access: 1 November 2022). We also provide an overview of the climate characteristics of the region.
Table 1Locations, operational periods, observed variables and heights, and instrumentation and accuracies of AWSs in the PANDA network.

Abbreviations: SDR, downward shortwave radiation, SUR, upward shortwave
radiation; LDR, downward longwave radiation; LUR, upward longwave radiation;
RH, relative humidity; WS, wind speed; WD, wind direction.
2.1 Observation region and site descriptions
The PANDA transect is approximately along 77∘ E longitude and stretches approximately 1460 km from the coast at Zhongshan to the Dome A region at the summit of the East Antarctic Ice Sheet. This transect is highly representative of East Antarctica, for it covers Prydz Bay, Lambert Glacier–Amery Ice Shelf, and high inland and dome summit regions. According to Zhang et al. (2008) and Ding et al. (2011), the PANDA transect can be divided into three typical topographies: a coastal region characterized by steep terrain (corresponding to Zhongshan to Panda 200), an inland region with strong katabatic wind (Panda 300 to Eagle) and a dome region (Panda 1100 to Panda S).
The PANDA AWS network had 11 AWSs in operation in 2022: Zhongshan, Panda 100, Panda 200 (LGB69), Panda 300, Panda 400, Taishan, Eagle, Panda 1100, Dome A, Kunlun and Panda S. All of them are located on the western side of the LGB (Fig. 1), at different latitudes (69–83∘ S) and at different elevations (detailed information can be found in Table 1). The first site, Zhongshan, was established in March 1989, when CHINARE first arrived in East Antarctica (Ding et al., 2020b; Zeng et al., 2021). It was initially a staffed weather station but has now been replaced by an AWS. LGB69 (192 km from the coast) was first deployed in January 2002 during the AAD Lambert Glacier basin traverse. This station was in a region of high ice velocity (17.7 m a−1) and a high accumulation rate (199 kg m−2 a−1 for 2002–2003) (Zhang et al., 2008; Ma et al., 2010; Ding et al., 2011, 2015), and it became buried approximately every 3 years, requiring digging up and redeploying on the surface. It had stopped operating by 2008 (Ding et al., 2021a). Since it was difficult to maintain an AWS at the original site, Panda 200 was deployed 200 km from the coast in December 2016 and is considered a replacement AWS for LGB69. In January 2005, Eagle and Dome A were installed during the CHINARE 21 expedition, which reached the summit of East Antarctic Ice Sheet, ∼ 1248 km from the coast. Then in January 2008, Panda S was deployed in cooperation with the University of Wisconsin as a contribution to the International Polar Year, but this AWS has only operated intermittently. The other AWSs were manufactured by the Chinese Academy of Meteorological Sciences and were deployed during 2012 (Taishan) and 2019 (Panda 100, Panda 300, Panda 400). The hourly data from all the AWSs are remotely collected and relayed in near real time by the Argos system. The data are not stored internally.
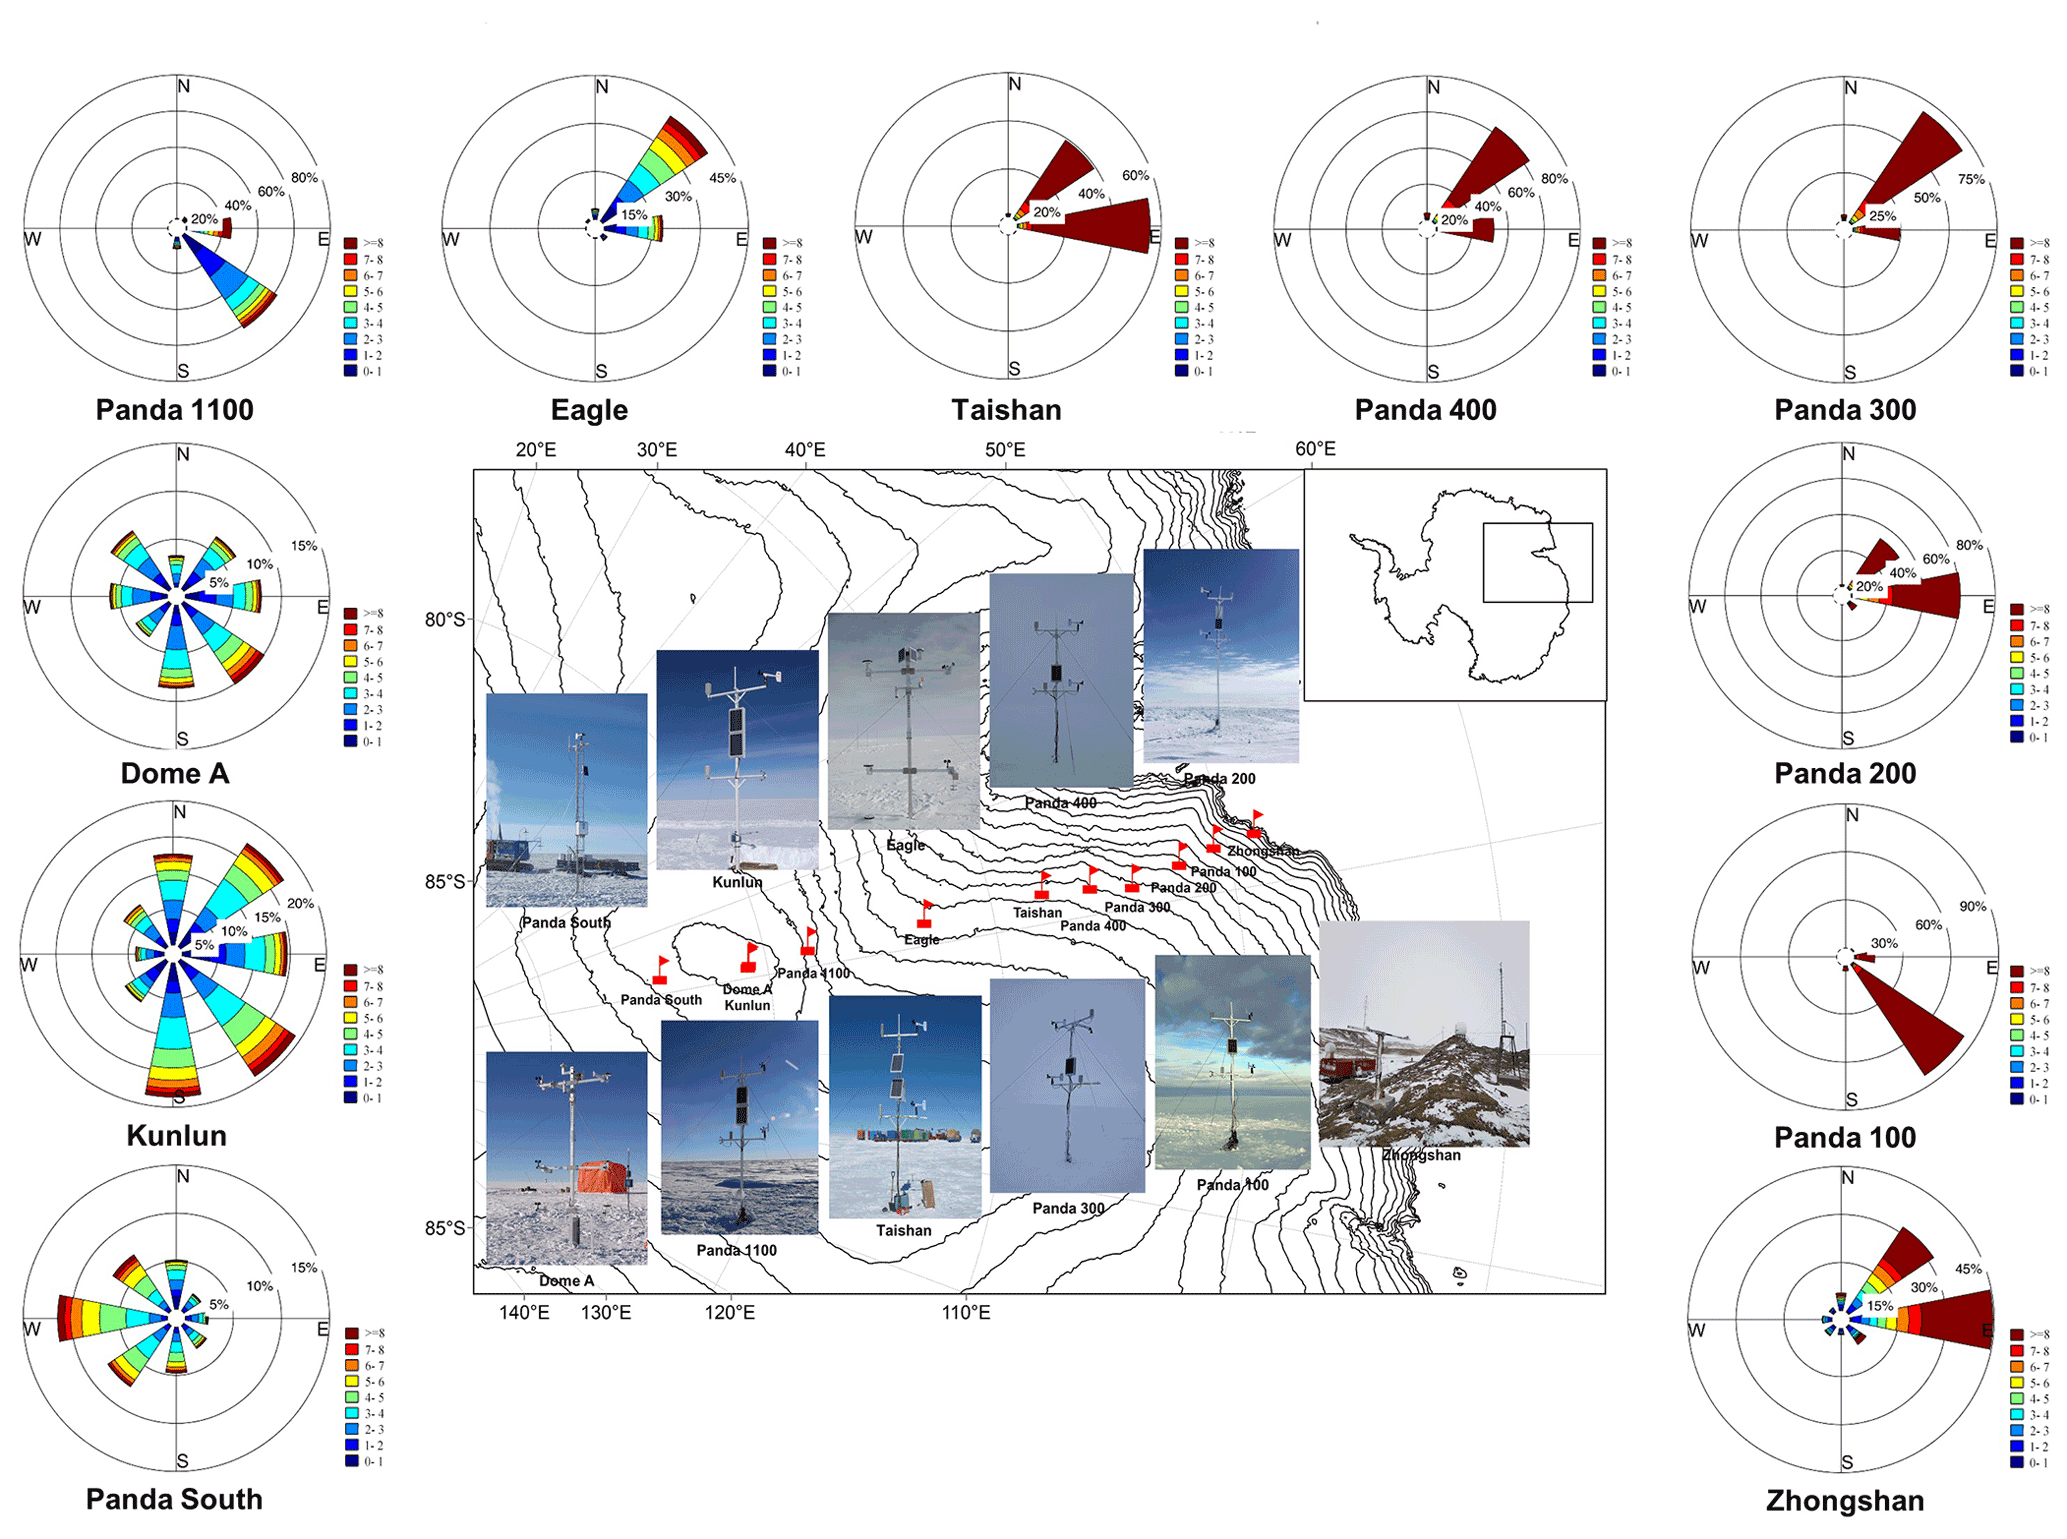
Figure 1The location and wind roses of AWSs in the PANDA network. The red flags are AWSs; the solid black lines are 200 m interval contours. The wind directions are divided into 22.5∘ sectors. Zhongshan is calculated during 1989–2020; Panda 100, Panda 300 and Panda 400 are calculated during 2019–2021; Panda 200 is calculated during 2016–2021; Taishan is calculated during 2012–2021; Eagle and Dome A are calculated during 2005–2020; Kunlun is calculated during 2017–2021; and Panda S is calculated during 2008–2021. Note however that, because some winter data were unreliable, Eagle averages exclude March–August, Dome A averages exclude March–October and Panda S averages exclude May–September.
It should be noted that these AWSs are of several different designs for different scientific purposes. The sensors are for air temperature (Ta), relative humidity (RH), air pressure (P), wind speed (WS) and wind direction (WD), most of which are initially at 2 and 4 m above the surface and some of which are at 1 or 6 m. Sensor height above the surface and station tilt are not part of the monitored variables, and all sensor heights in this paper are the heights at initial deployment. Panda 300, Taishan, Eagle and Dome A AWSs are also equipped with surface and firn temperature probes (detailed information can be found in Table 1). Zhongshan Station is designed to WMO service regulations, so the initial height of wind measurement is 10 m.
The AWSs that were designed by the Chinese Academy of Meteorological Sciences use a Vaisala HMP155 resistance probe to measure air temperature and relative humidity. Eagle and Dome A AWSs use FS23D thermistors and Vaisala HMP35D humidity probes (Xiao et al., 2008). The Vaisala HMP155 is an integrated air temperature and relative humidity sensor and automatically accounts for whether RH is relative to water or ice. The air pressure sensor for Eagle and Dome A is a Paroscientific 6015A. Panda 100 and Taishan use Vaisala PTB110 instruments and Zhongshan and Panda S use Campbell CS106 instruments to measure air pressure, and all other AWSs use Vaisala PTB210. Eagle and Dome A AWSs have cup anemometers which freeze during extreme austral winter cold (Zhou et al., 2009; Ma et al., 2010). The other AWSs are equipped with Huayun Zhongyi XFY3-1 wind propeller anemometers, and they are optimized to prevent “diamond dust” accumulation on the instruments. Some stations (Panda 100, Panda 200, Panda 300, Panda 400, Taishan, Panda 1100, Kunlun) also make radiation measurements. In addition, Panda 400, Taishan, Eagle and Panda 1100 use Campbell 109 instruments to measure subsurface temperature at different depths. These are not discussed in this paper but are available in detail for download from the data site. Further details of the sensor and AWS schemes can be found in Table 1.
All sensors are calibrated before the AWS deployment, but extremely cold weather below −60 ∘C may bring uncertainty. The height of the sensors above the surface gradually decreases with snow accumulation. This has been ignored in the preliminary analysis presented here.
2.2 Data quality control
All data are checked initially to ensure integrity, consistently with the approach of Ma et al. (2010), Lazzara et al. (2012), and Wawrzyniak and Osuch (2020). A schematic diagram of the data-processing workflow is shown in Fig. 2. Firstly, Argos reception may lead to duplicated records or time dislocation; these are removed. For those AWSs with measurements of air temperature and wind speed at multiple levels, a check of the vertical profiles provides particularly strong validation. If the vertical gradients are physically consistent, then the absolute values are likely to be accurate. Secondly, different variables are compared to check their consistency. For instance, wind direction will be eliminated when wind speed is zero. In addition, the height of sensors might change with snow accumulation. A correction method for this error has been introduced in Ma et al. (2008) and Smeets et al. (2018). Daily mean values are averaged from hourly data, and then monthly and annual mean values are progressively calculated. Similarly to the methodology of Maturilli et al. (2013) and Zou et al. (2021), missing values are handled depending on their duration. If more than 21 % of data (5 h) during 1 d, 12 % data (4 d) within 1 month or 25 % of data (3 months) within 1 year are missing, these daily/monthly/annual data are considered a missing value.
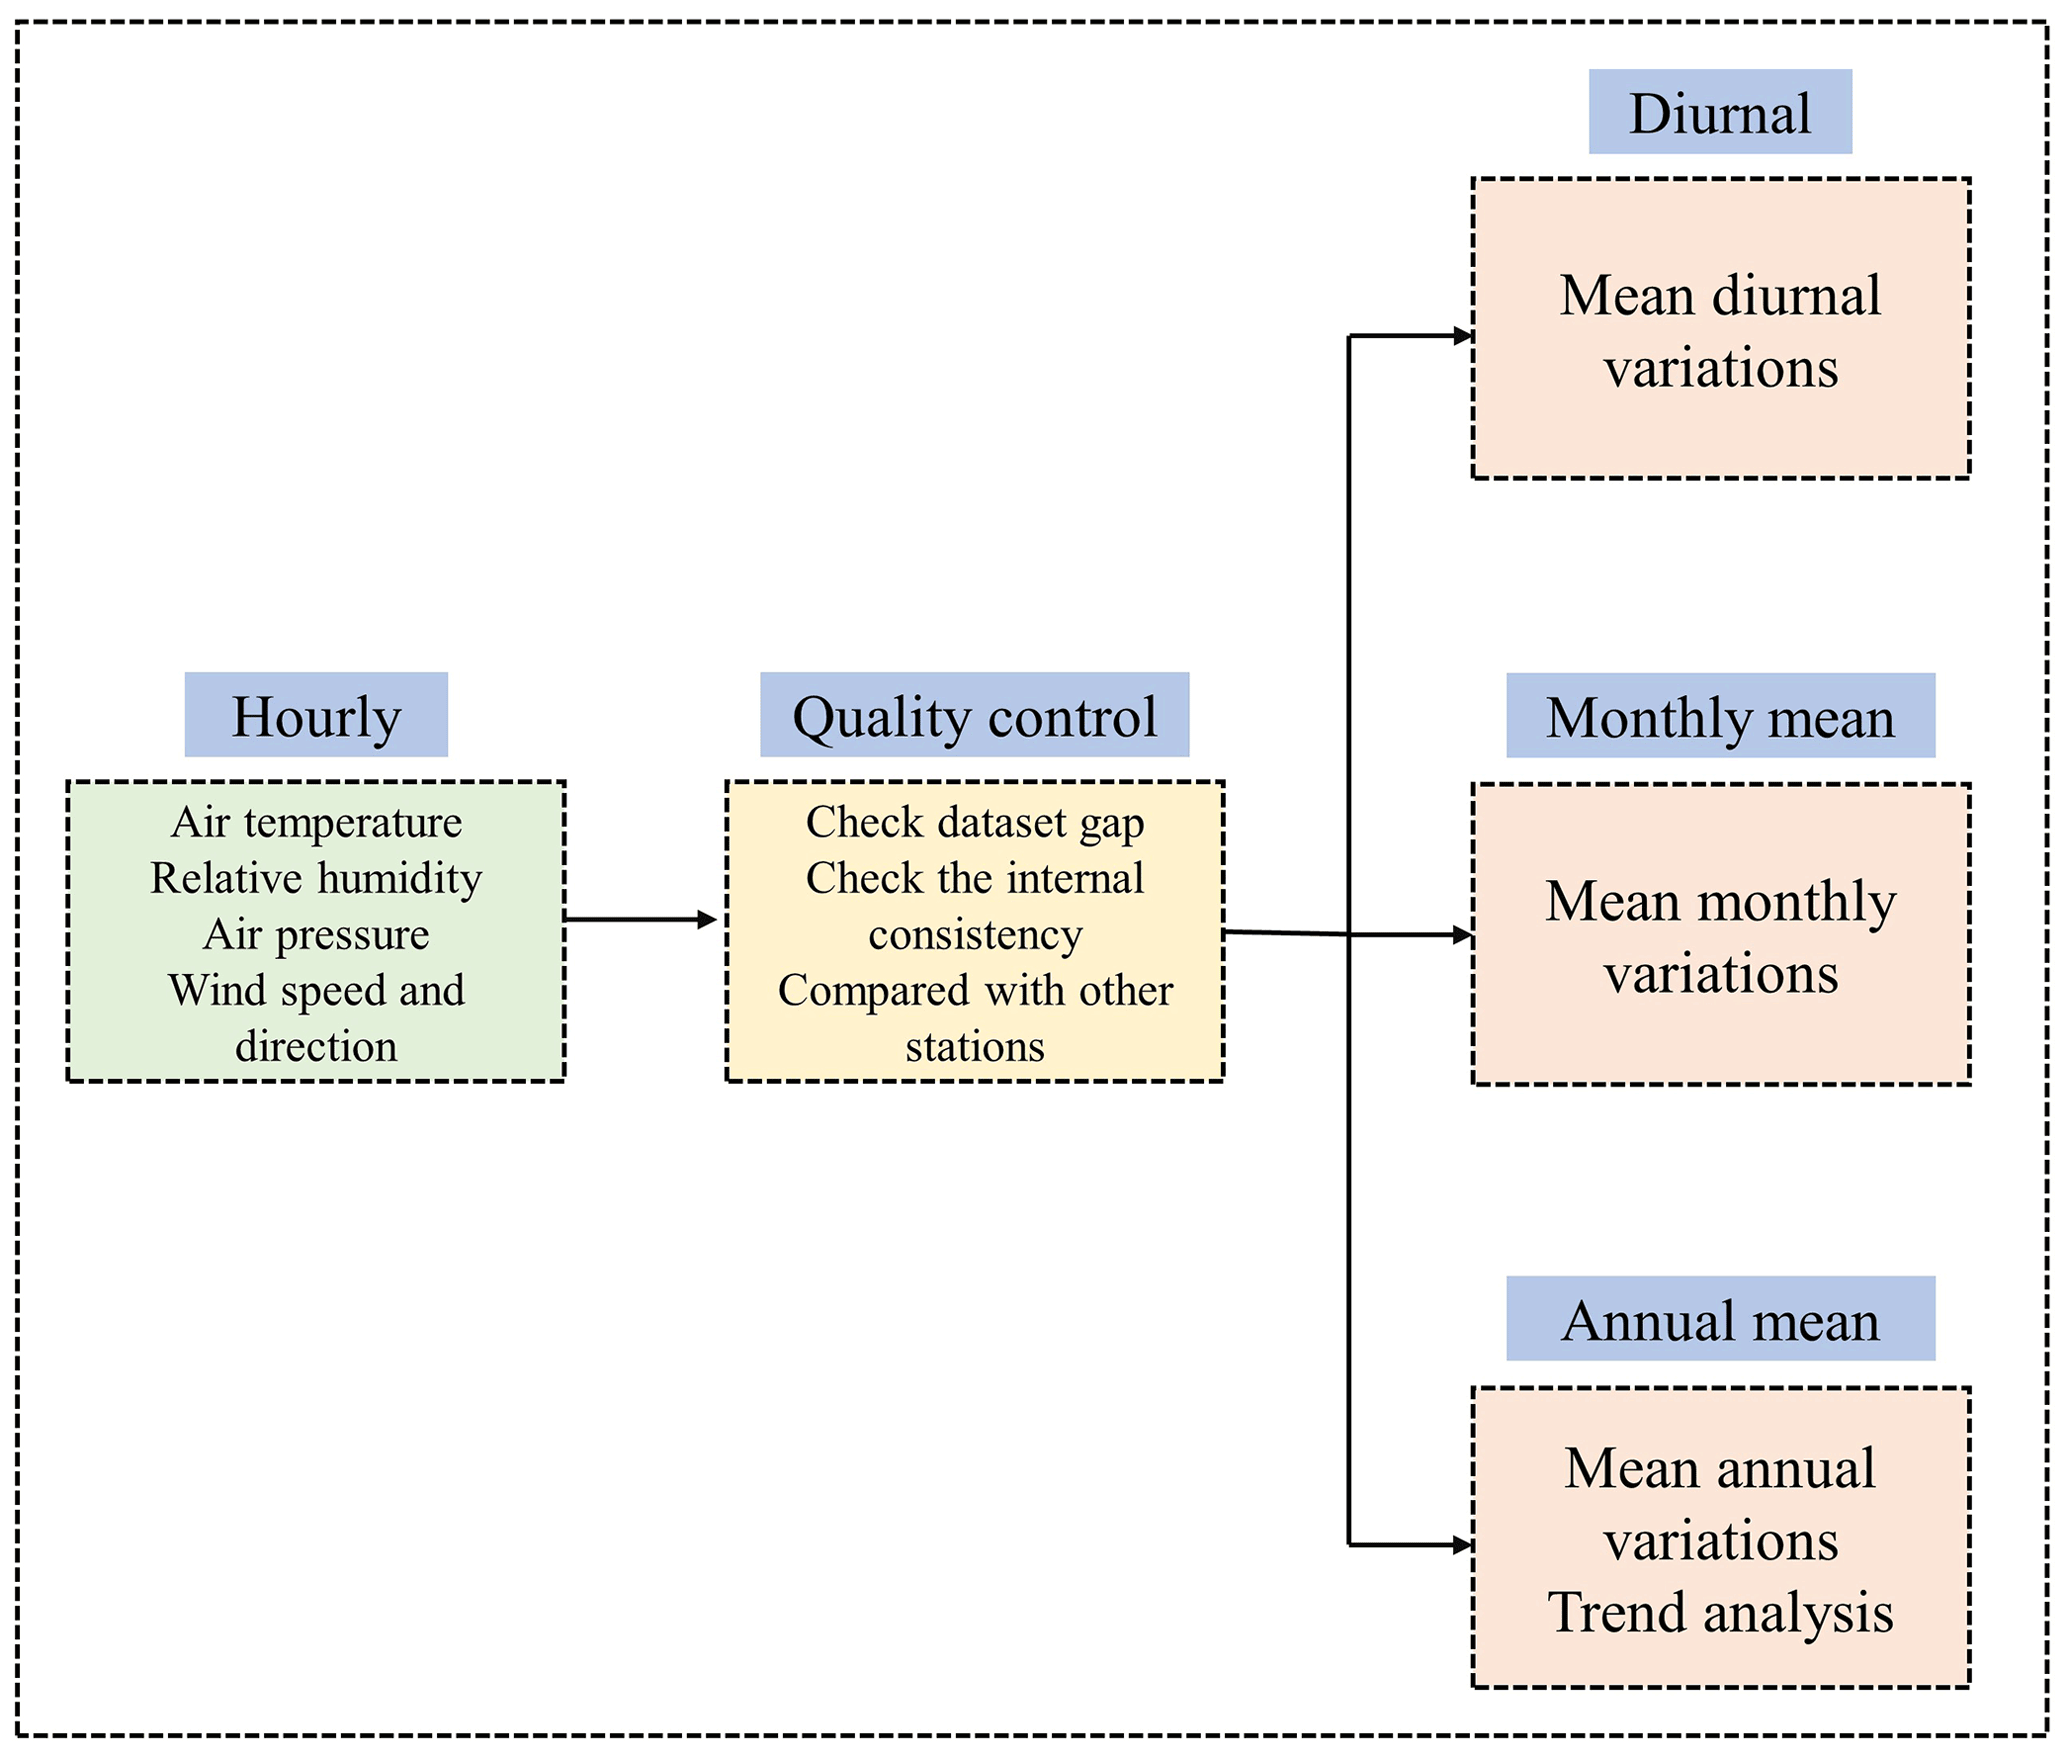
Figure 2Schematic diagram of the data-processing workflow used to compile the AWS meteorology dataset for the network.
The measurements at Zhongshan were made only four times a day (00:00, 06:00, 12:00 and 18:00 UTC) from 1 March 1989 to 31 January 2002. Hence, we analyzed diurnal data only from 2002 to 2020 but monthly and annual values from 1989 to 2020. The averages of meteorological variables at other AWSs were calculated for different periods depending on the AWS deployment dates, which are not the same (Table 1): Panda 100, Panda 300, Panda 400 and Panda 1100 span from 2019 to 2021; Panda 200 spans from 2016 to 2021; Taishan spans from 2012 to 2021; Eagle and Dome A span from 2005 to 2020; Kunlun spans from 2017 to 2021; Panda S spans from 2008 to 2021. All variables are analyzed at a height of 4 m, except at Zhongshan, Panda 200 and Panda 400. The wind speed and direction at Zhongshan are at 10 m, and the air temperature and relative humidity at Panda 200 and Panda 1100 are at 6 and 2 m, respectively.
Due to heavy hoar frost in the Antarctic inland, the anemometers with a vertical axis at Eagle, Dome A and Panda S often froze during austral winter, which led to invalid measurements (Zhou et al., 2009). We used a different type of anemometer on the other AWSs and deleted the wintertime wind speed and direction data for these three AWSs.
3.1 Air temperature
The mean diurnal variation in air temperature follows an approximately sinusoidal curve at all AWSs (Fig. 3). The maximum air temperature occurs at 09:00–11:00 UTC (14:00–16:00 local solar time, LST), and the minimum is at 22:00–23:00 UTC (03:00–04:00 LST). From the coast to the dome area, the standard deviation of diurnal variations gradually increases (from 0.64 ∘C at Zhongshan to 1.42 ∘C at Panda S), which is consistent with the result of King et al. (2006). This regularity may be the result of katabatic wind, marine effects and clouds (van den Broeke et al., 2004a; Zhou et al., 2008).
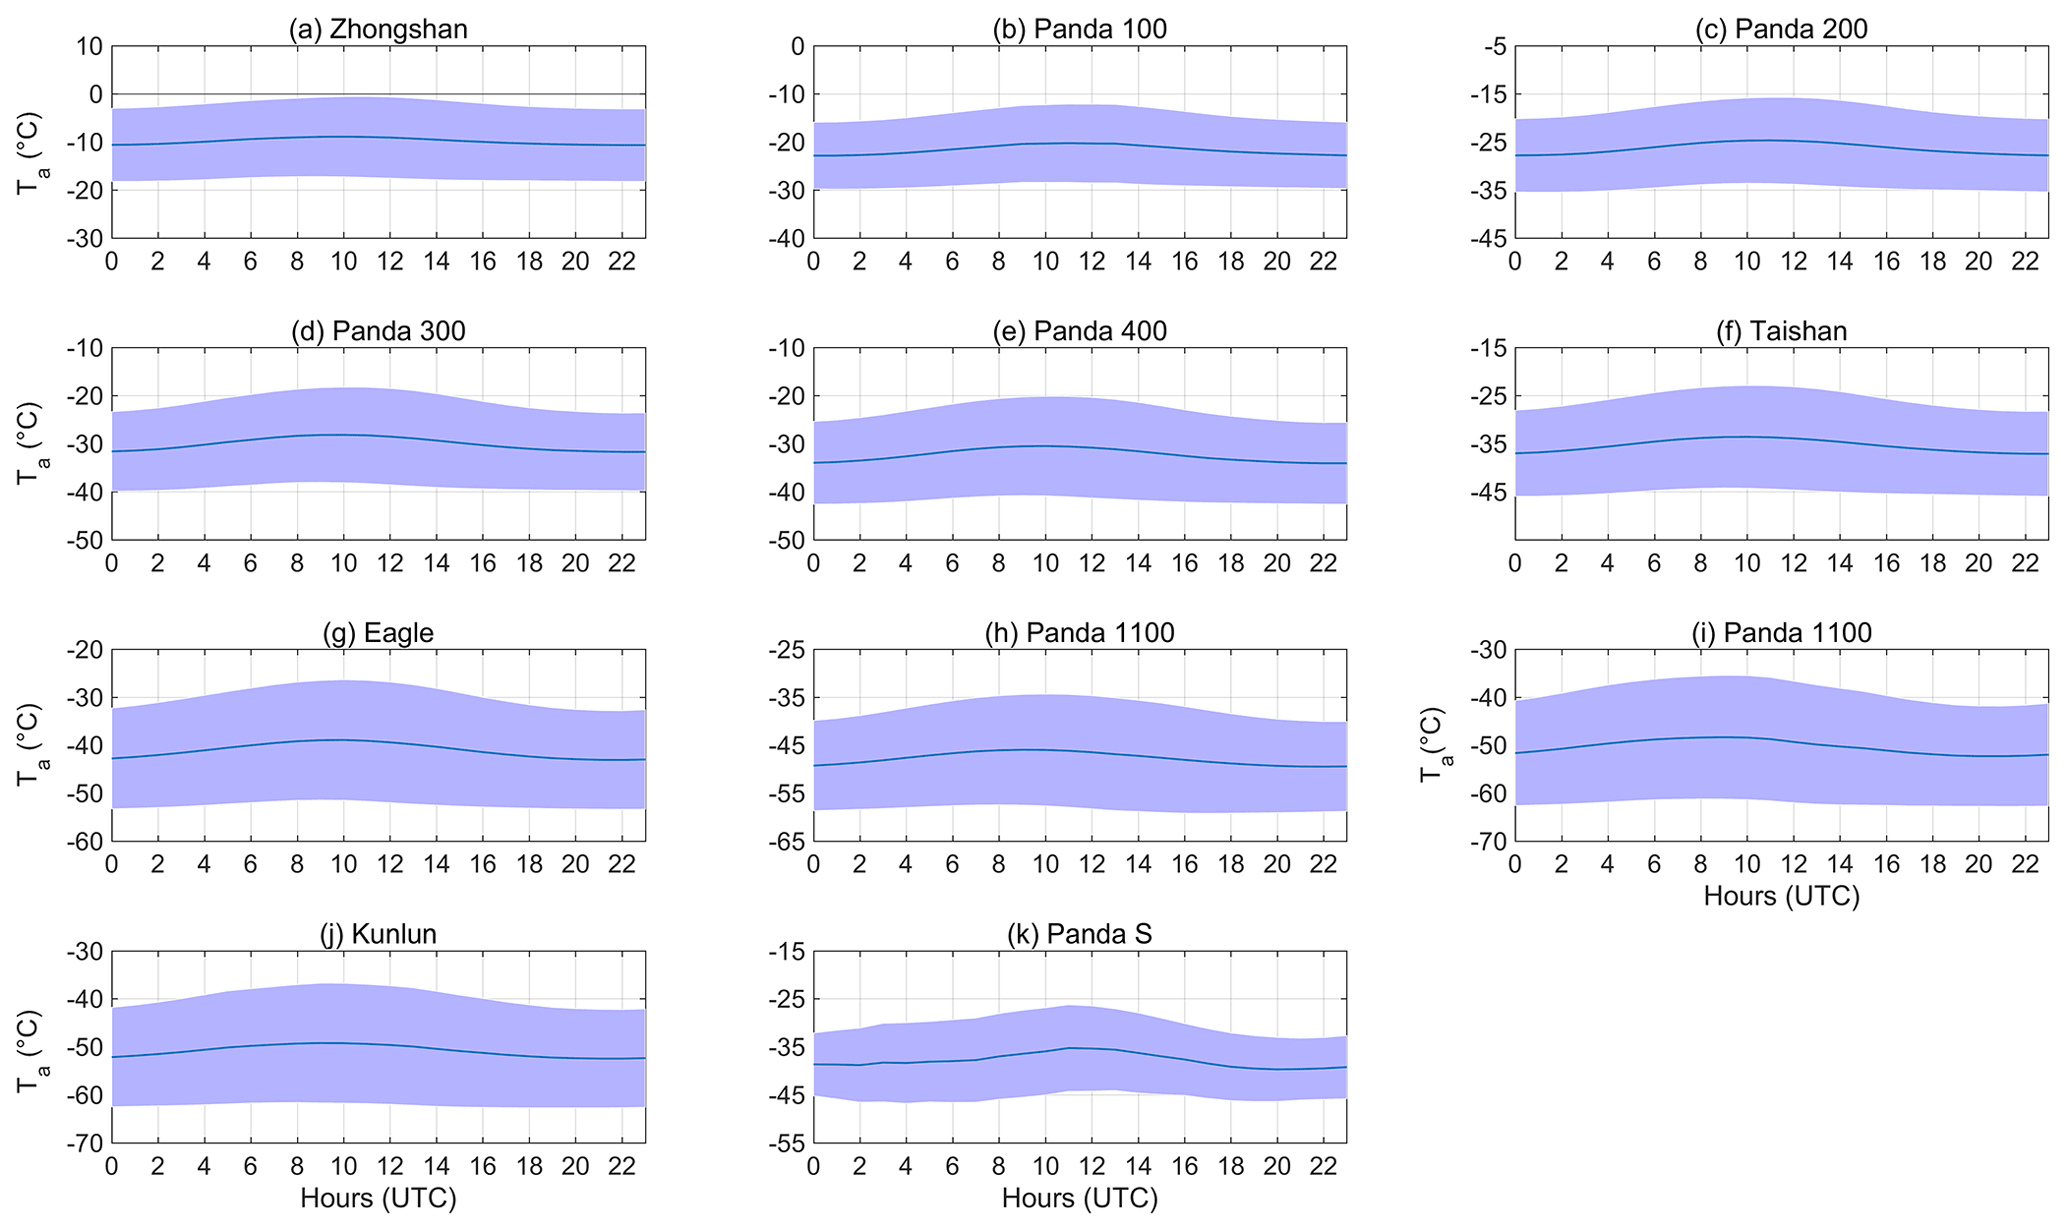
Figure 3Average diurnal variation in air temperature at AWSs in the PANDA network. The calculation years for these sites are the same as for Fig. 1, except that Zhongshan is calculated during 2002–2020.
The monthly mean air temperatures, particularly for the more southern AWSs, show a “coreless” winter with a single “valley” pattern; in other words, there is no distinctive minimum during austral winter (Fig. 4) (Allison et al., 1993; Chen et al., 2010; Ma et al., 2010). The variability (standard deviation of monthly air temperature) in austral winter is much larger than in austral summer, e.g., 2.46 ∘C vs. 1.67 ∘C at Taishan. This indicates that the Antarctic Ice Sheet experiences more weather activities during austral winter. For example, sometime cyclones from the surrounding ocean may bring warm, moist air masses (Qin et al., 2017; Ding et al., 2020a). In addition, the inland region exhibits more dynamic weather than either the coast or the dome summit regions, coinciding with a larger standard deviation in monthly air temperature. This is 1.5 times (3.24 ∘C) that of the others two regions (2.19 ∘C and 2.39 ∘C).

Figure 4Variation in monthly mean air temperature at AWSs in the PANDA network. The calculation periods for these sites are the same as for Fig. 3. For each monthly box, the central line indicates the median; the red dot represents the mean; and the bottom and top edges of the box indicate the 25th and 75th percentiles, respectively.
With consideration of the length of the observation period, the trend in annual mean air temperatures is shown for only four AWSs in Fig. 5. These are Zhongshan (1989 to 2020), Taishan (2013 to 2020), Eagle (2005 to 2020) and Dome A (2005 to 2020). They have annual means of −10.0, −35.4, −41.2 and −50.4 ∘C, respectively, which are similar to the results of Ma et al. (2010). This difference can be attributed to differences in elevation and latitude (Allison et al., 1993).
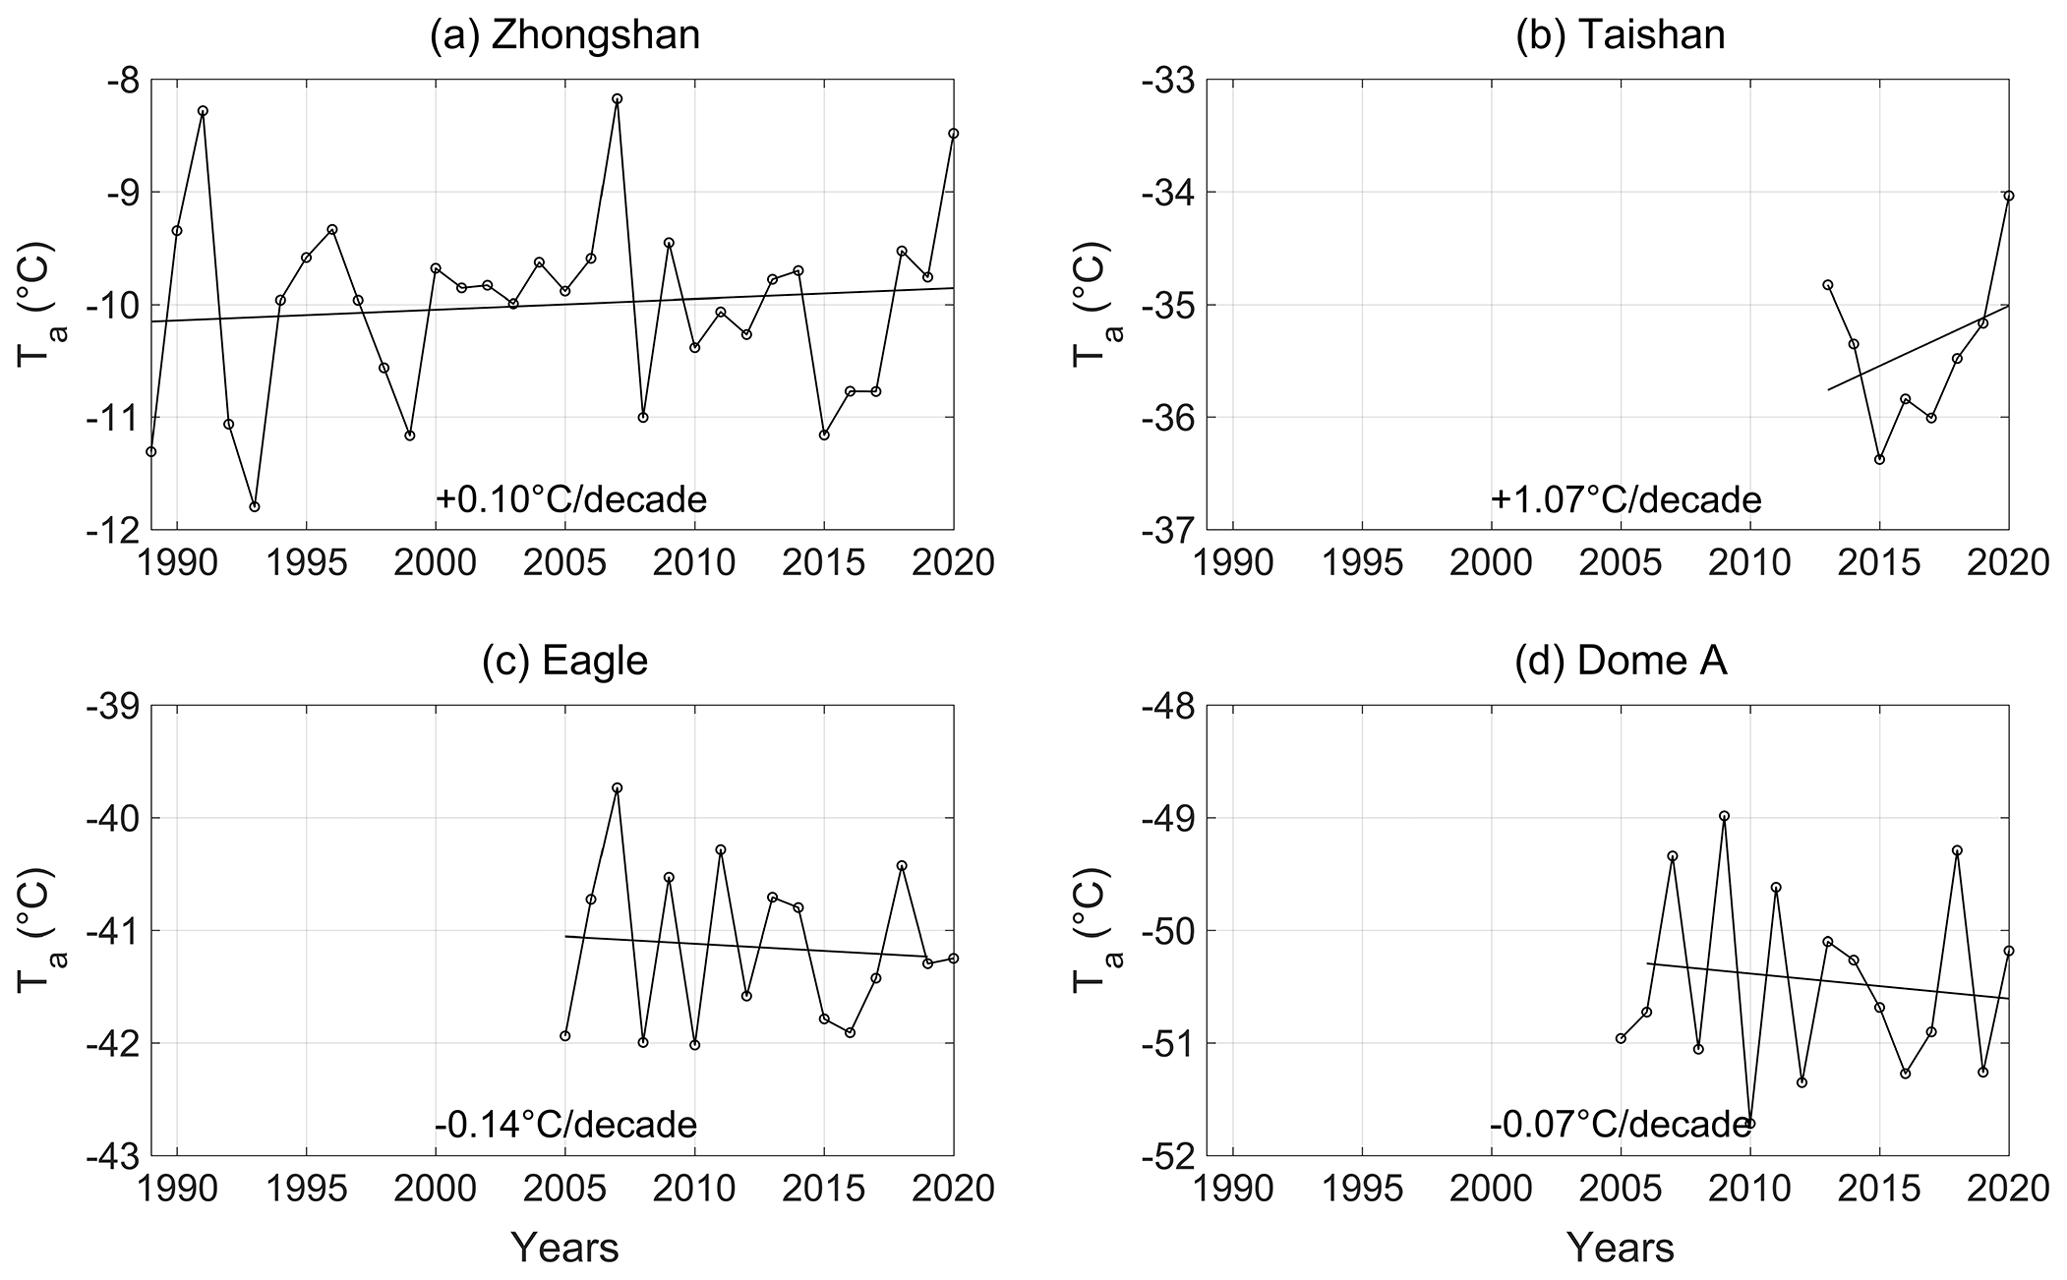
Figure 5Interannual variation in air temperature at Zhongshan, Taishan (p<0.05), Eagle and Dome A. Zhongshan is calculated during 1989–2020; Taishan is calculated during 2013–2020; Eagle and Dome A are calculated during 2005–2020.
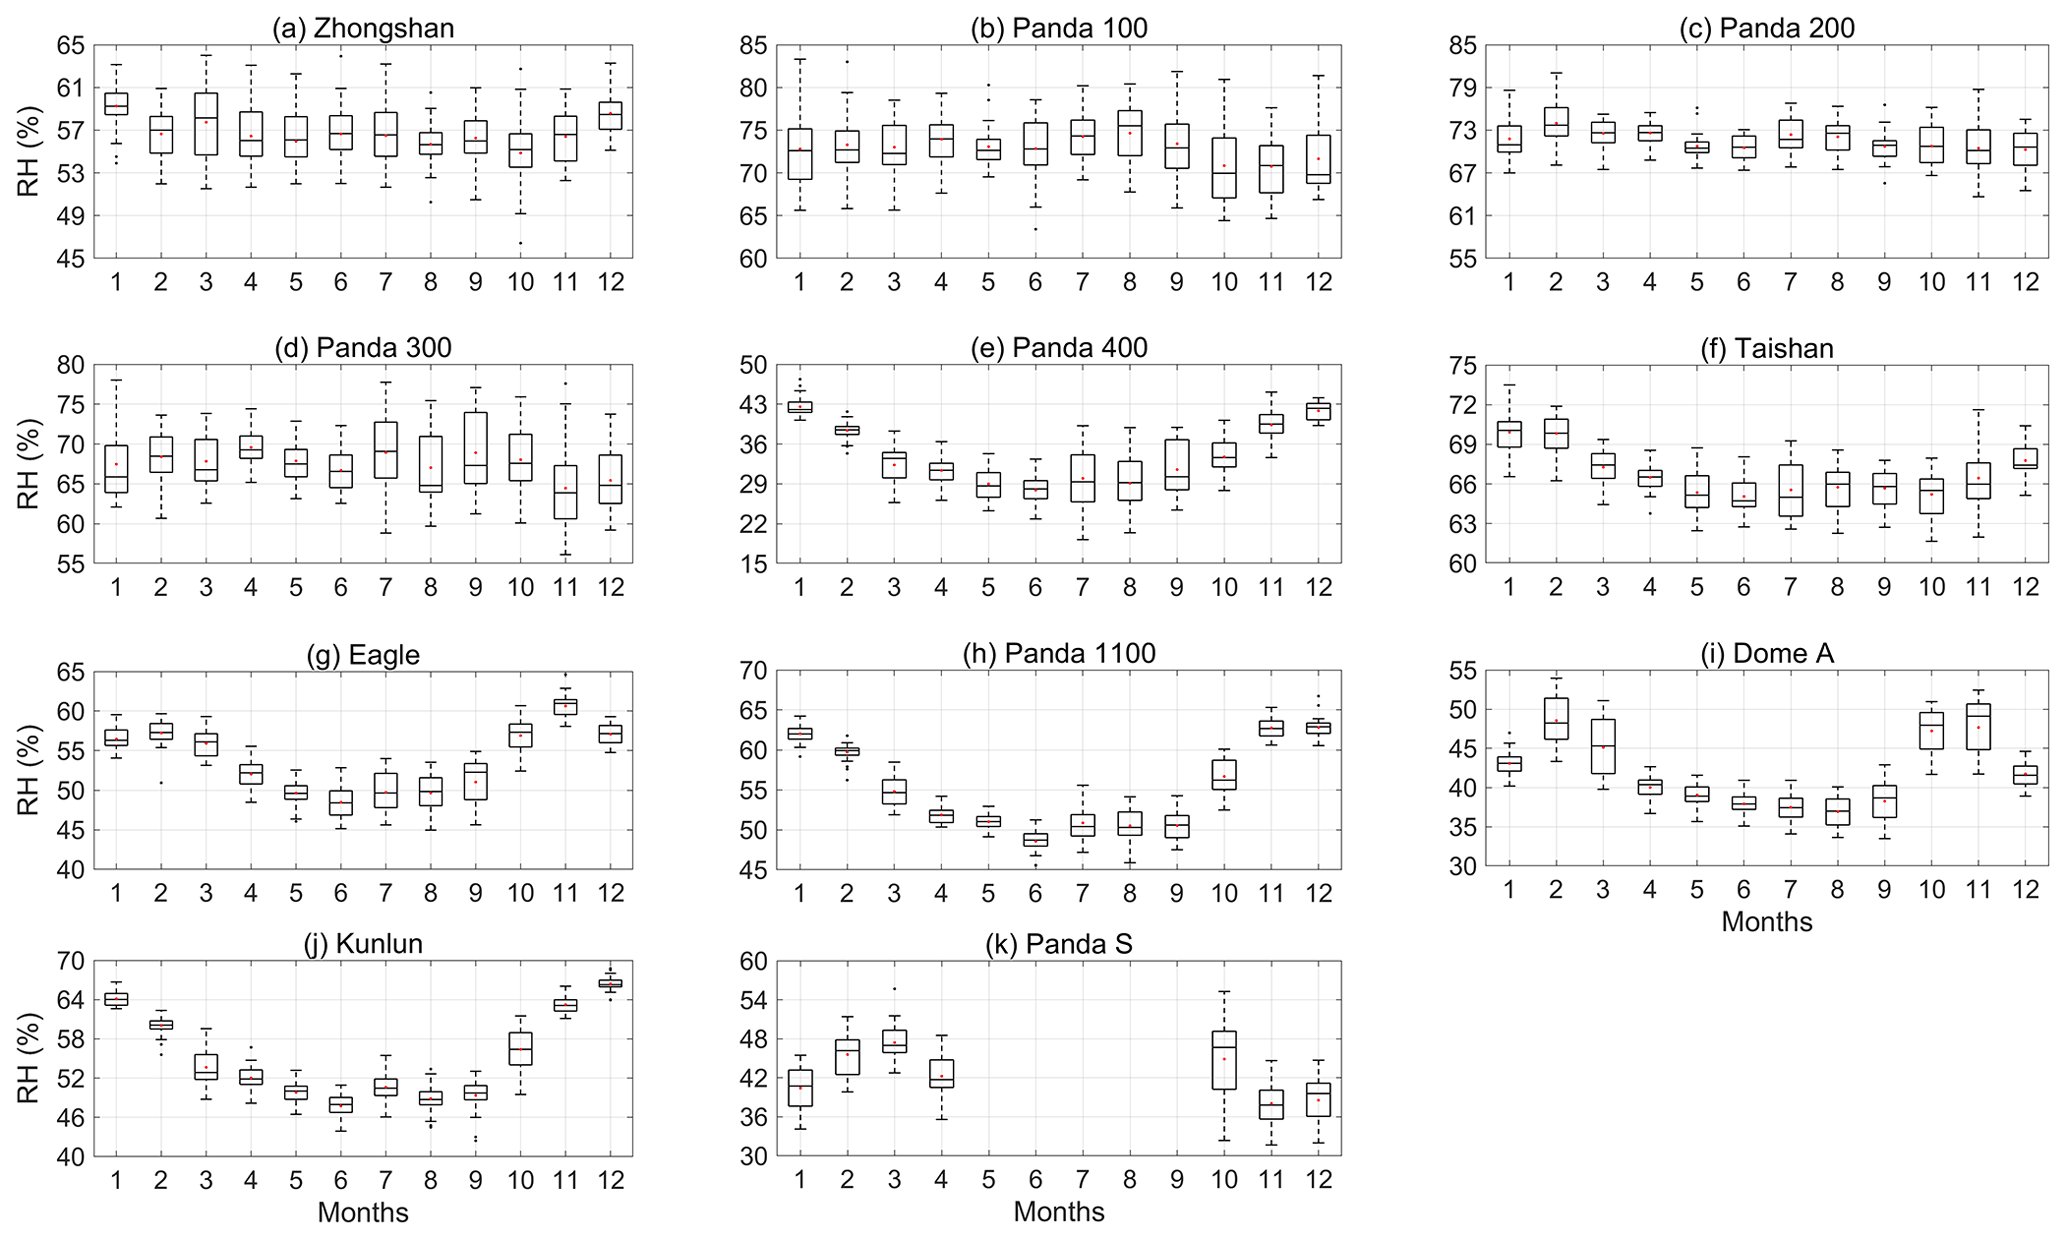
Figure 6Monthly variation in relative humidity at AWSs in the PANDA network. The calculation periods for these sites are the same as for Fig. 3.
3.2 Relative humidity
The variation in local atmospheric moisture is driven by a combination of large-scale advection and local evaporation/sublimation effects (Maturilli et al., 2013). Figure 6 shows a similar distribution to a previous study (Ma et al., 2010); the austral summer is more humid than the austral winter at all AWSs. However, coastal relative humidity fluctuates largely on the monthly scale, but there is little difference between austral summer and winter. At the inland and dome summit regions, the monthly relative humidity has a very clear seasonal cycle (except at Dome A).
Figure 7 shows the annual averages and trends of relative humidity at Zhongshan, Taishan, Eagle and Dome A. Relative humidity varied considerably at all sites, with the driest records at Dome A. Interestingly, the relative humidity is well correlated with air temperature except at Zhongshan, partially because its weather is controlled by the adjacent ocean.
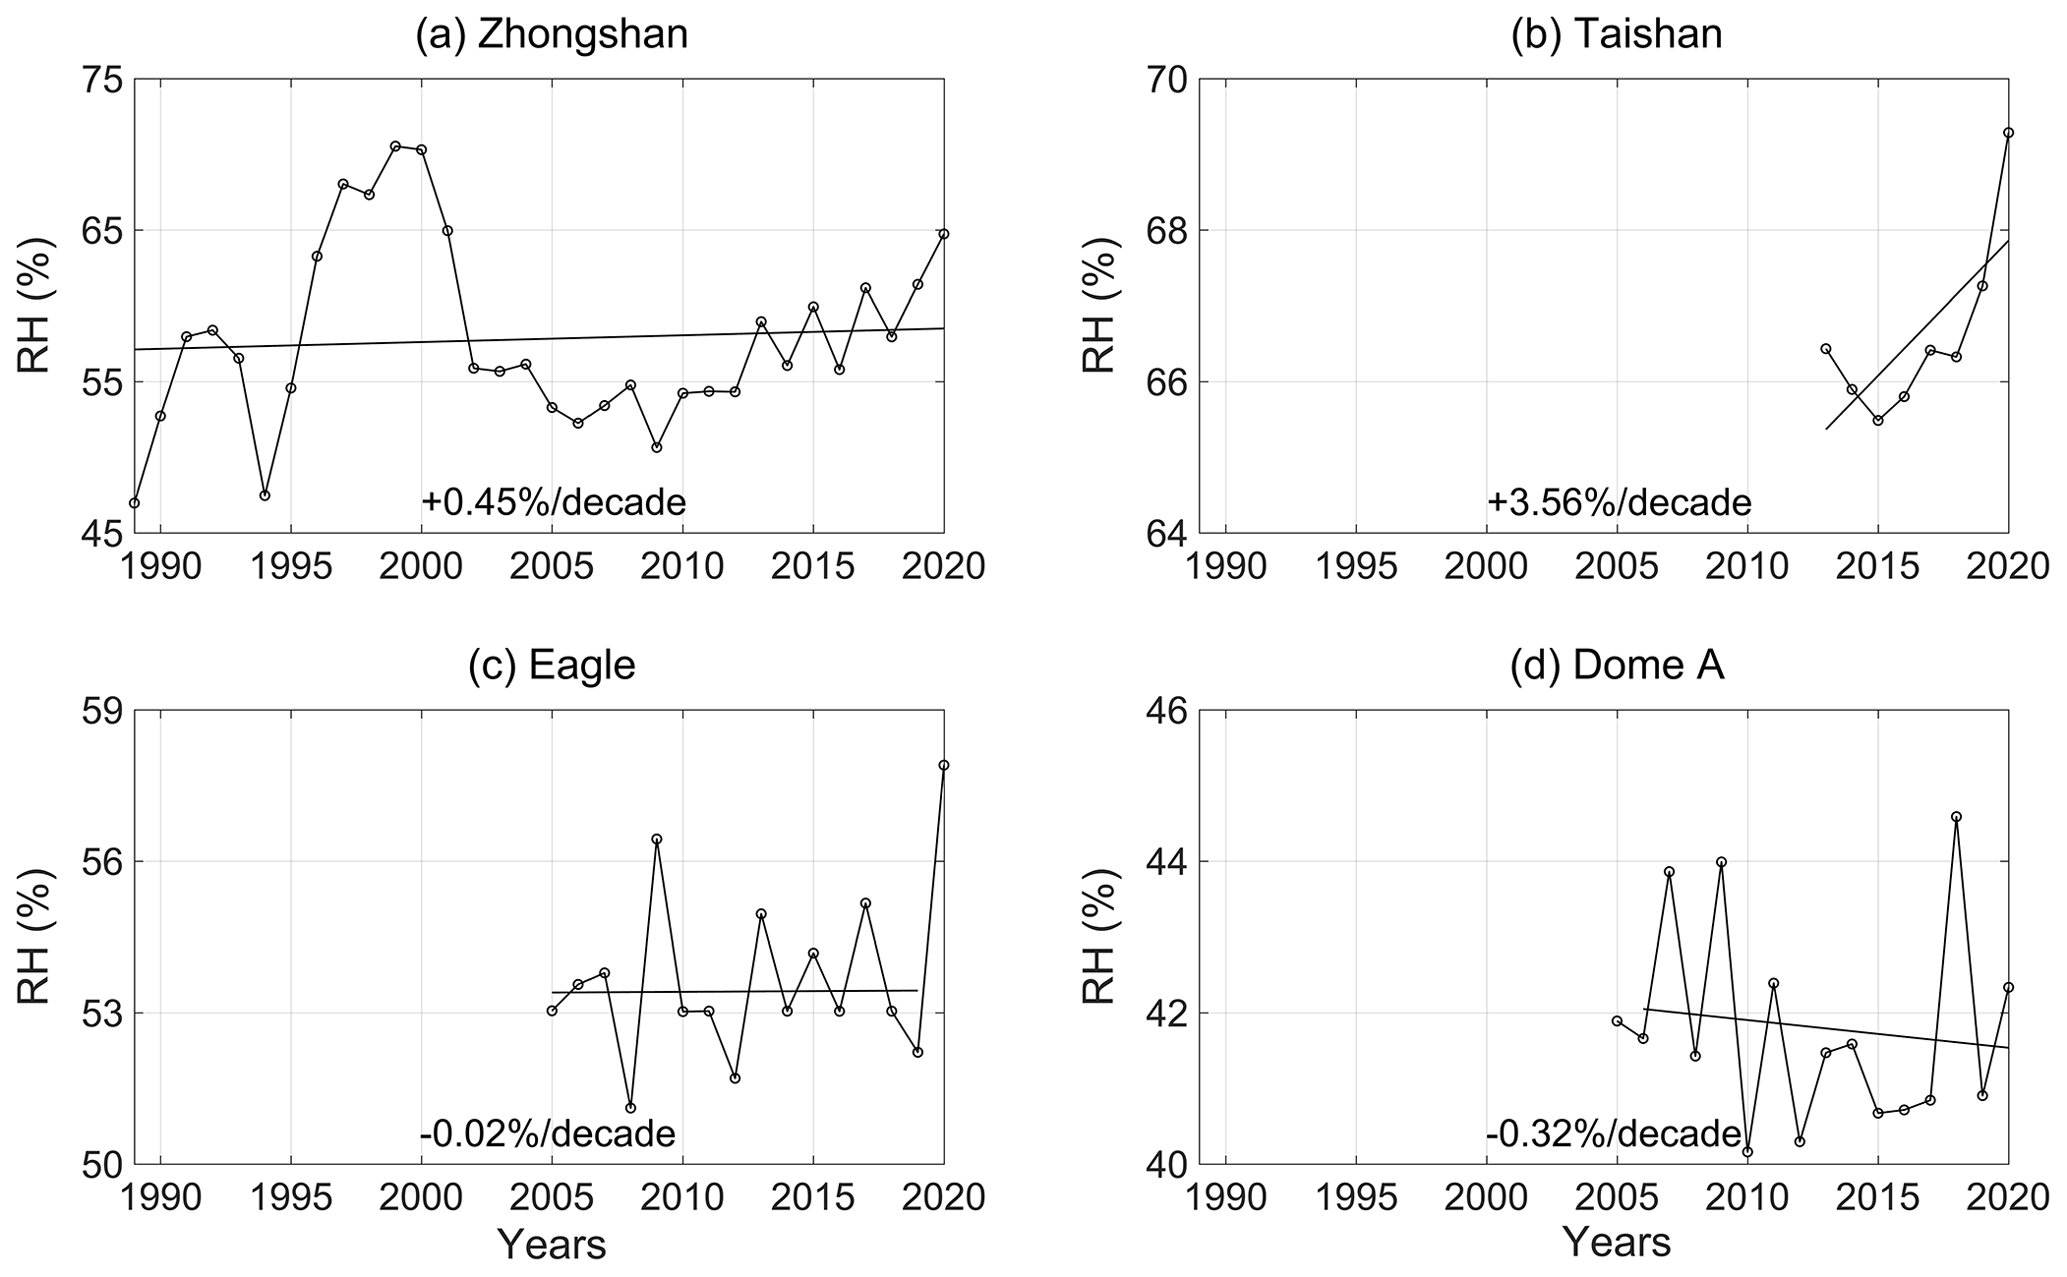
Figure 7Interannual variation in relatively humidity at Zhongshan (p<0.05), Taishan (p<0.05), Eagle and Dome A.
3.3 Air pressure
Air pressure obviously decreases with elevation from the coast to the dome area, and the seasonal cycle becomes clearer. Monthly mean air pressure shows a semi-annual oscillation with equinoctial minima near the coastal and inland areas along the PANDA AWS network but is much less distinct at the dome area. The semi-annual oscillation there could be hidden under larger annual oscillation (Fig. 8) (Radok et al., 1996). Coastal areas like Zhongshan, Panda 100 and Panda 200 show little air pressure difference between austral summer and winter, but there are obvious differences for the inland area, with a stable, strong, low-pressure structure at the plateau surface in austral winter. However, there is more cyclonic activity in the inland area (Panda 300 to Eagle) (Ding et al., 2020a). This is shown by the highest standard deviation of air pressure (705 ± 4 hPa), higher than the coastal (858 ± 3.10 hPa) and the dome (585 ± 2.74 hPa) areas. The annual averages (Table 2) and trend of air pressure at the AWS show no systematic variation, which is consistent with Zhou et al. (2009) and most other studies in East Antarctica.
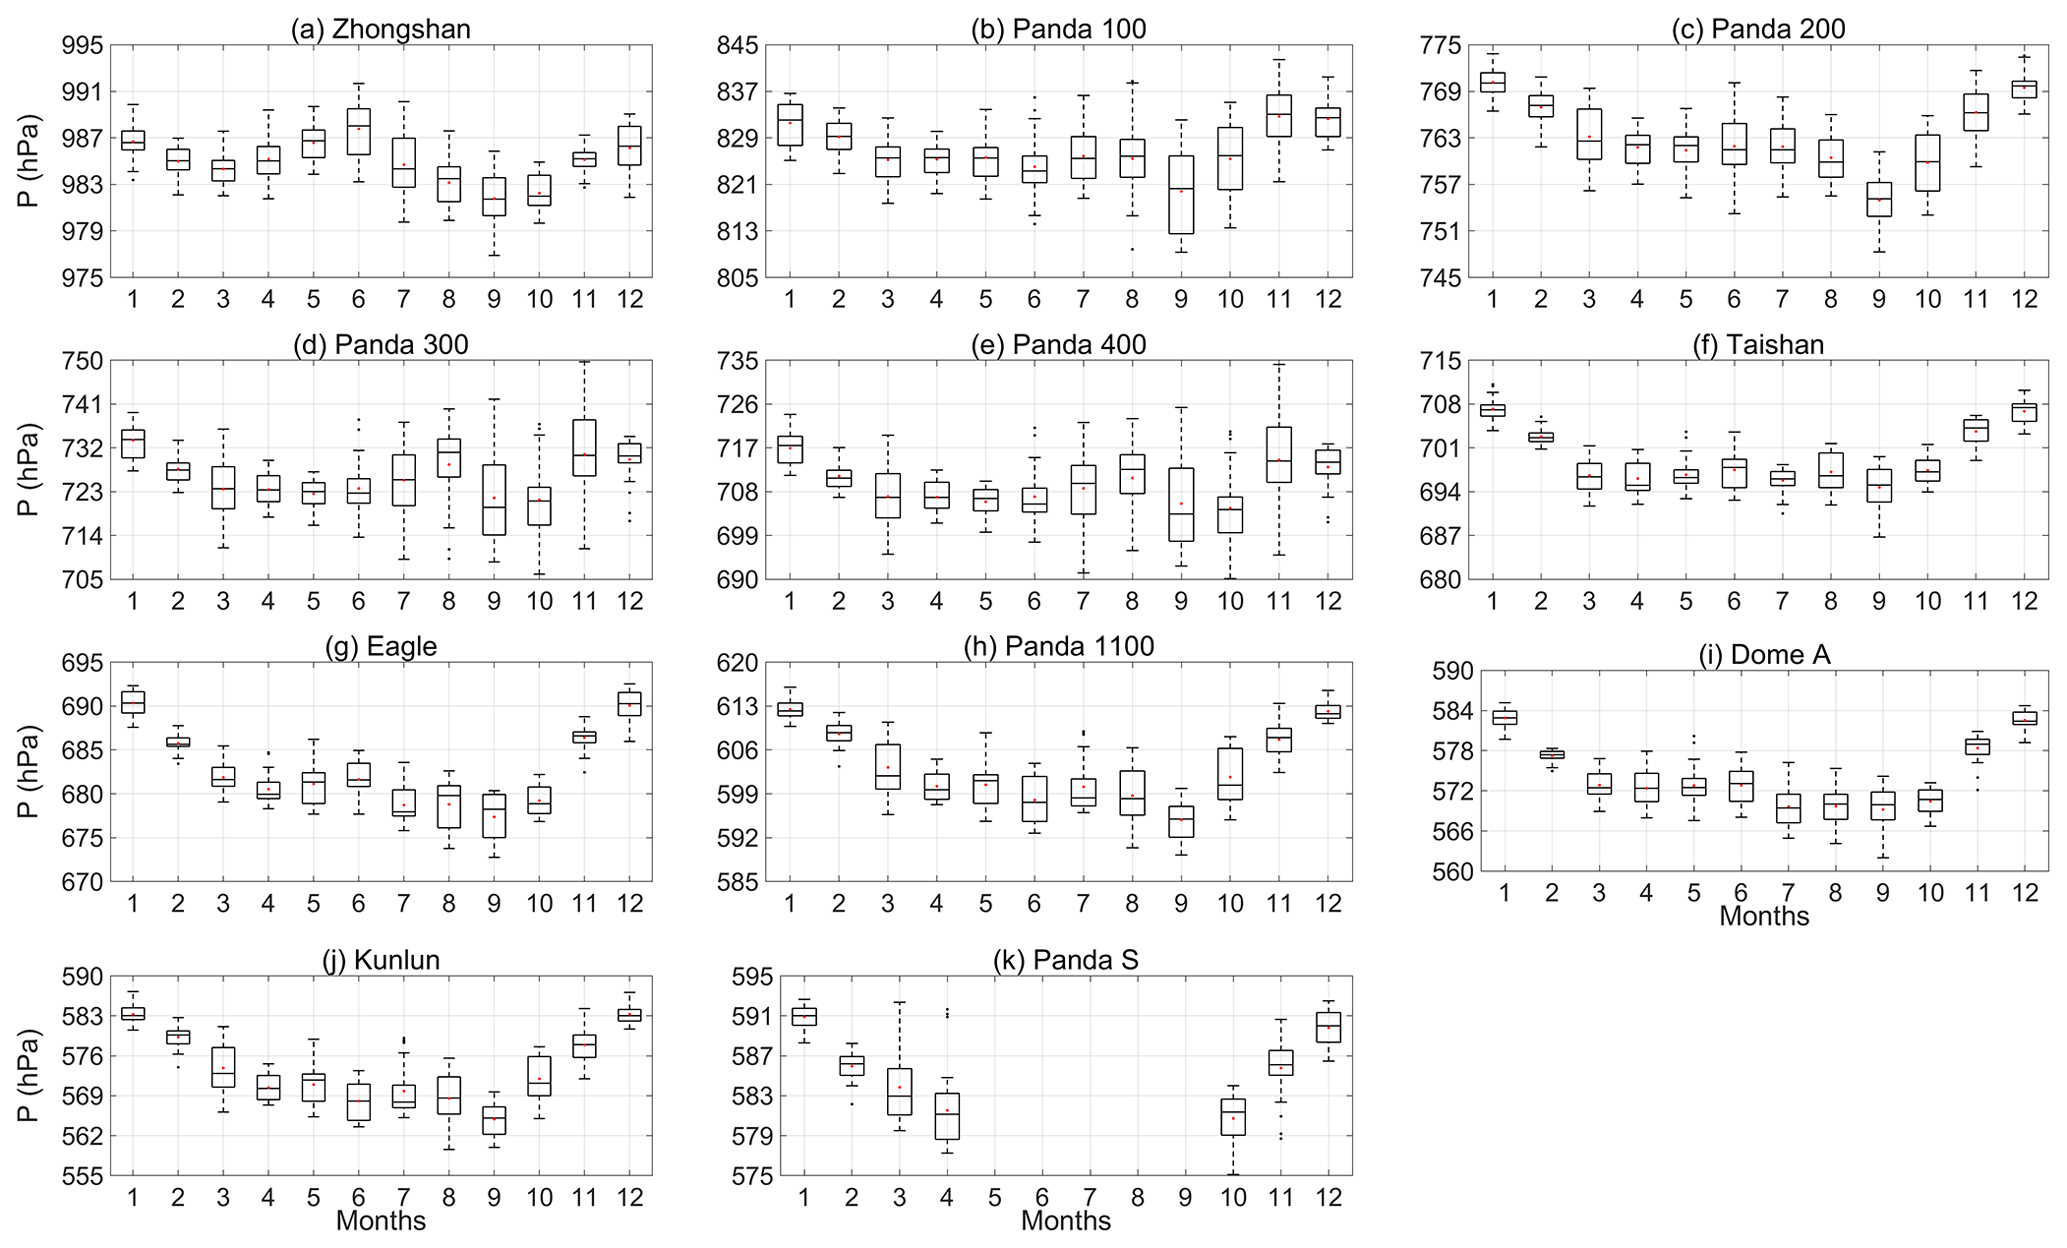
Figure 8Monthly variation in air pressure at AWSs in the PANDA network. The calculation periods for these sites are the same as for Fig. 3.
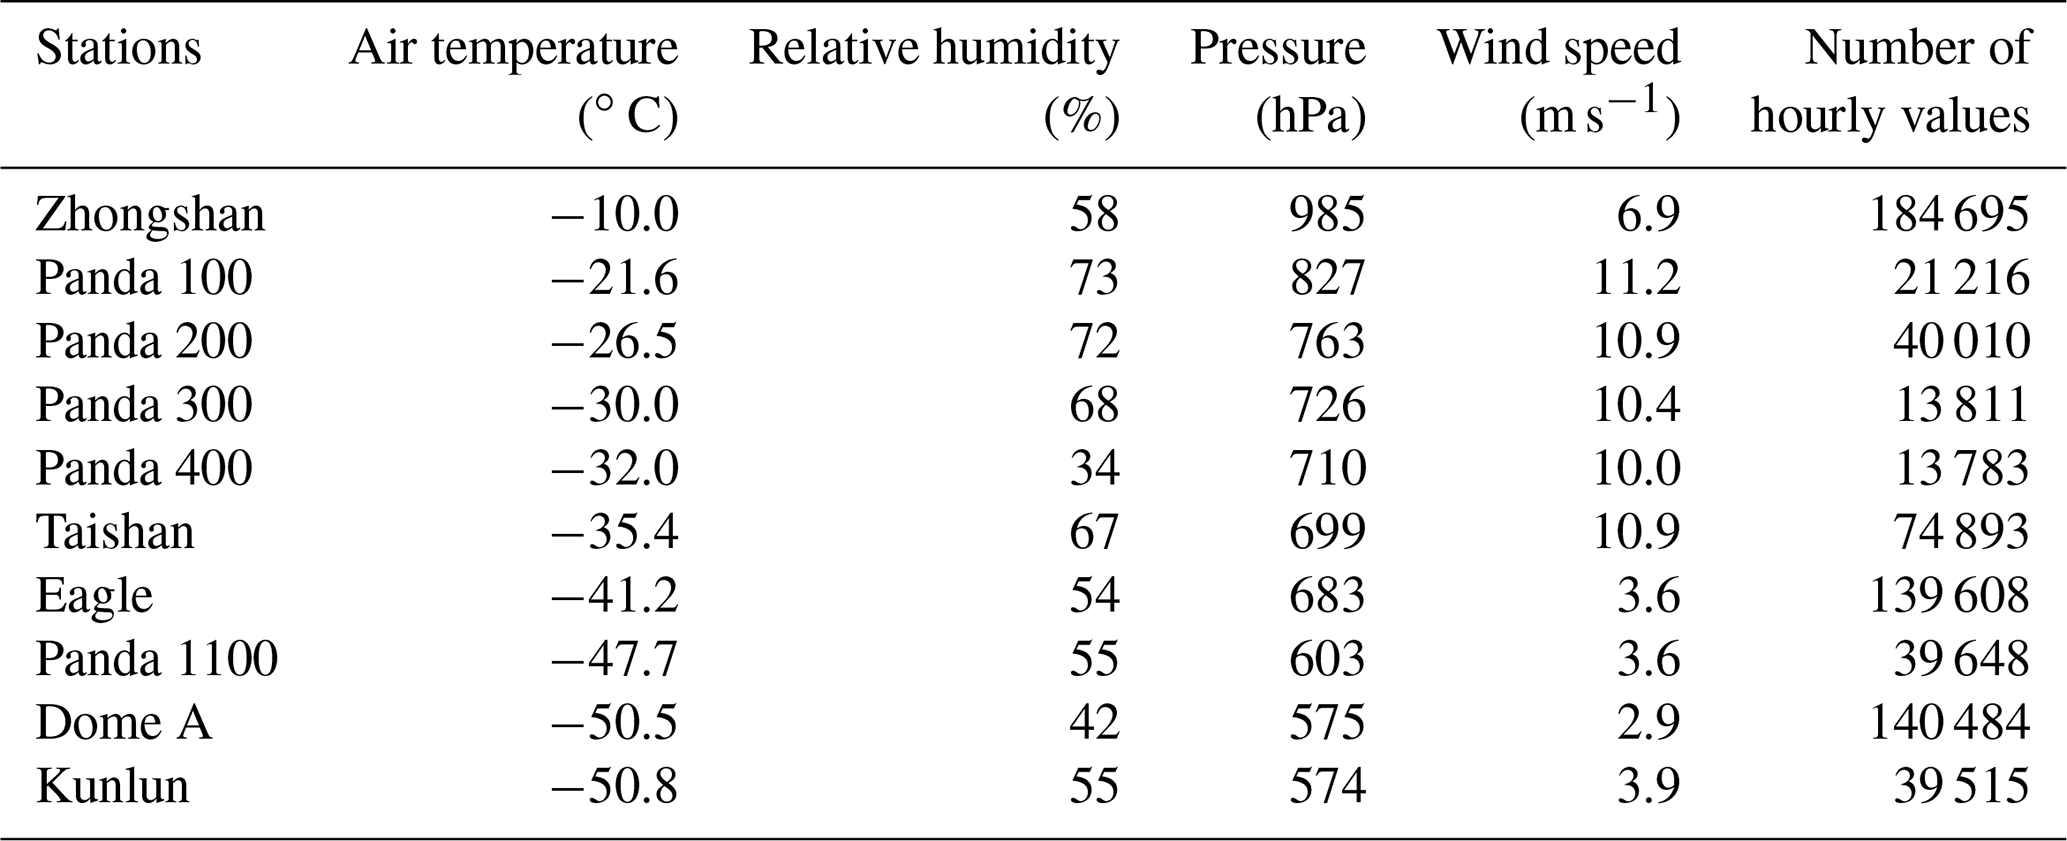
Table 2The mean values of meteorological variables at AWSs in the PANDA network.
3.4 Wind speed and direction
Diurnal variation in wind speed is shown most clearly in the coastal katabatic region (Fig. 9). The maximum wind speed occurs around 04:00–08:00 UTC (09:00–13:00 LST) and the minimum around 14:00–16:00 UTC (19:00–21:00 LST at near-coastal AWSs. Diurnal variation in wind speed gradually decreases from the coast to the dome region, from Panda 1100 to Panda S. Panda S showed very weak fluctuation because the dome area is a sink center for atmosphere circulation and the origin of Antarctic surface wind flow (Parish and Bromwich, 1987; Van den Broeke and Van Lipzig, 2003; Aristidi et al., 2005; Das et al., 2013). This phenomenon is also reflected in the vertical temperature gradient difference. At all times of day, the surface atmosphere has a positive temperature gradient (the 4 m air temperature is higher than 2 m). Thus, the wind is weak and wind direction is stable at Dome A. Similarly, Zhou et al. (2009) and Bian et al. (2016) also found that there was a persistent and stable inversion layer due to strong surface cooling of the Antarctic Ice Sheet.
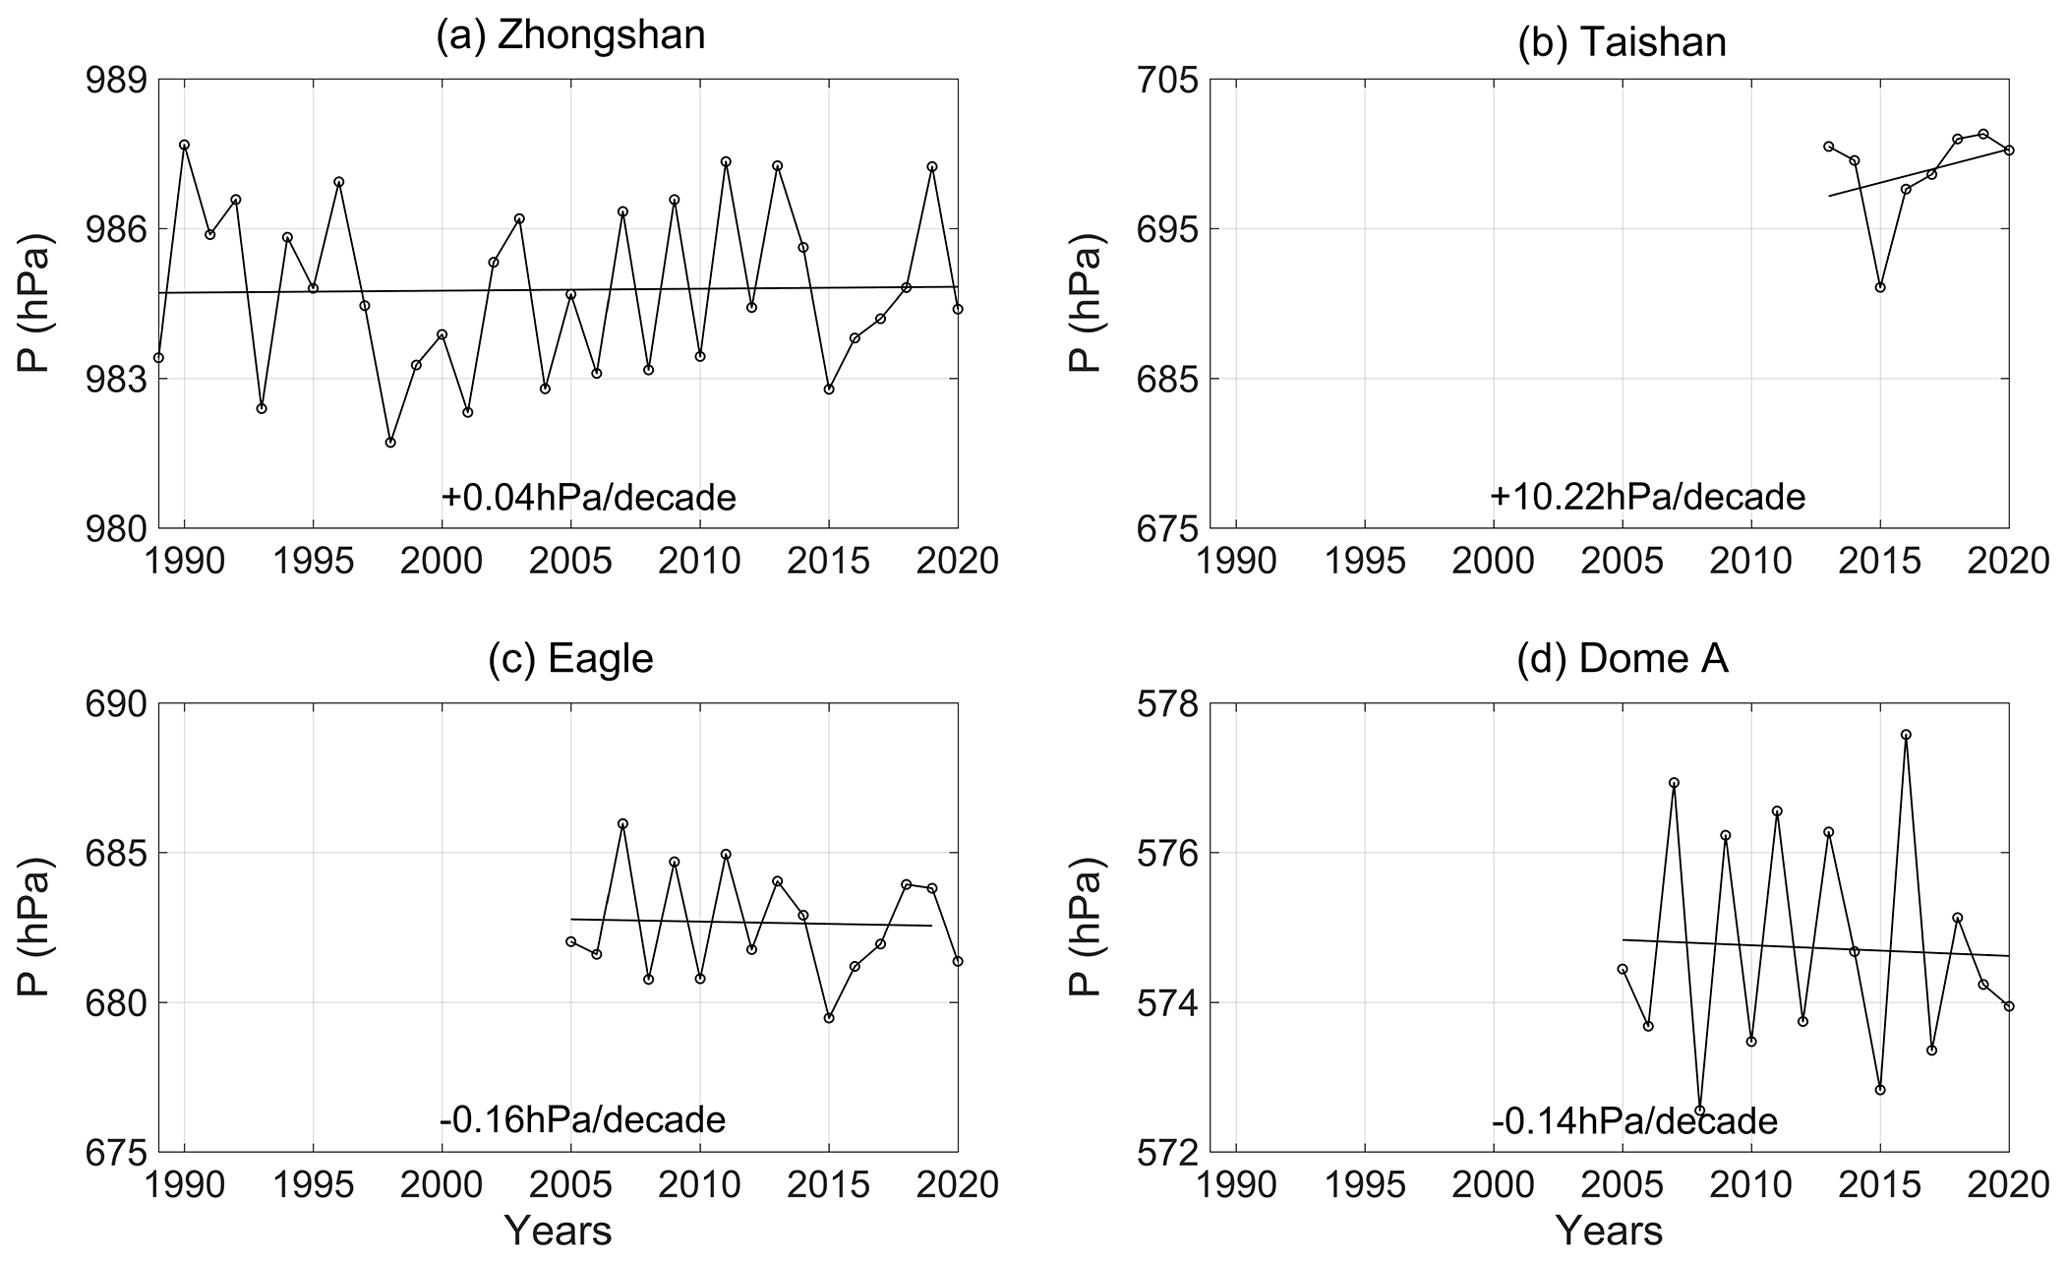
Figure 9Diurnal variation in wind speed of the PANDA AWS network. The calculation periods for these sites are the same as for Fig. 1; Zhongshan is calculated during 2002–2020.
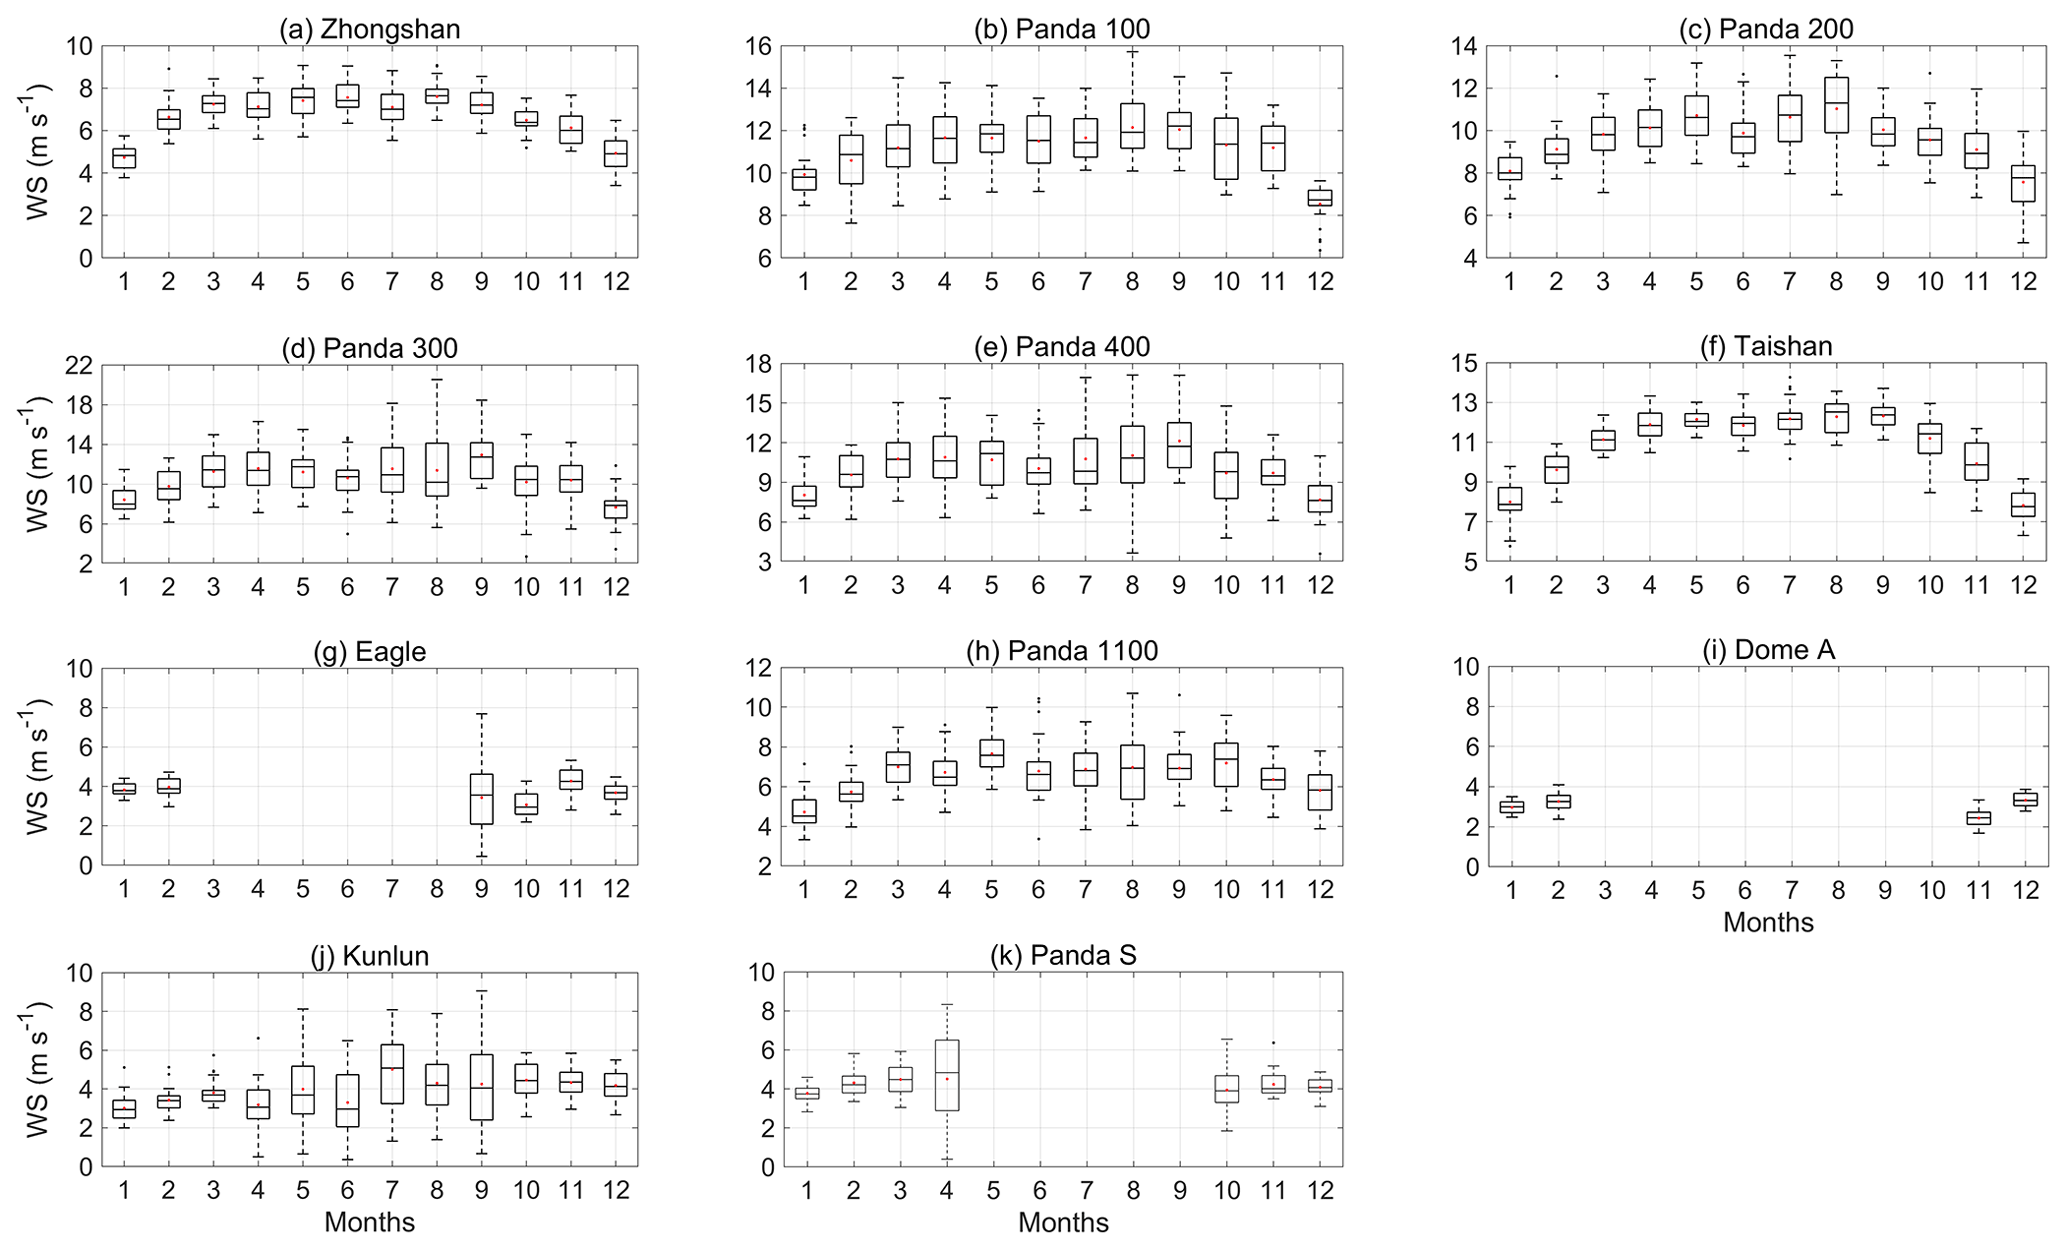
Figure 10Monthly variation in wind speed of the PANDA AWS network. The calculation periods for these sites are the same as for Fig. 1.
There is evidence of seasonal variations in wind speed at all AWSs except Eagle, Dome A and Panda S. The austral winter wind speed is higher than the austral summer one (Fig. 10). This is related to the intensity of surface cooling and topography of the ice sheet. Wind flow can be accelerated by cooling along a slope (Van den Broeke et al., 2002). The fluctuation in wind speed was much greater in austral winter than in summer, e.g., the standard deviations at Panda 200 in austral winter and summer were 1.43 and 0.99 m s−1, respectively. From the coast to the dome area, the wind speed decreased, which has also been discussed by Ma and Bian (2014) and can be attributed to the katabatic wind effect. Zhongshan is an exception: its wind speed is weaker than at the other coastal AWSs. This AWS was deployed on rock more than 2 km from the edge of the ice sheet, where the katabatic wind has weakened.
Over the long term, the wind speed showed a weakening trend over the whole transect (Fig. 11). The trend at Zhongshan was −0.41 m s−1 per decade (p<0.01) from 1989 to 2020. This phenomenon deserves future investigation.
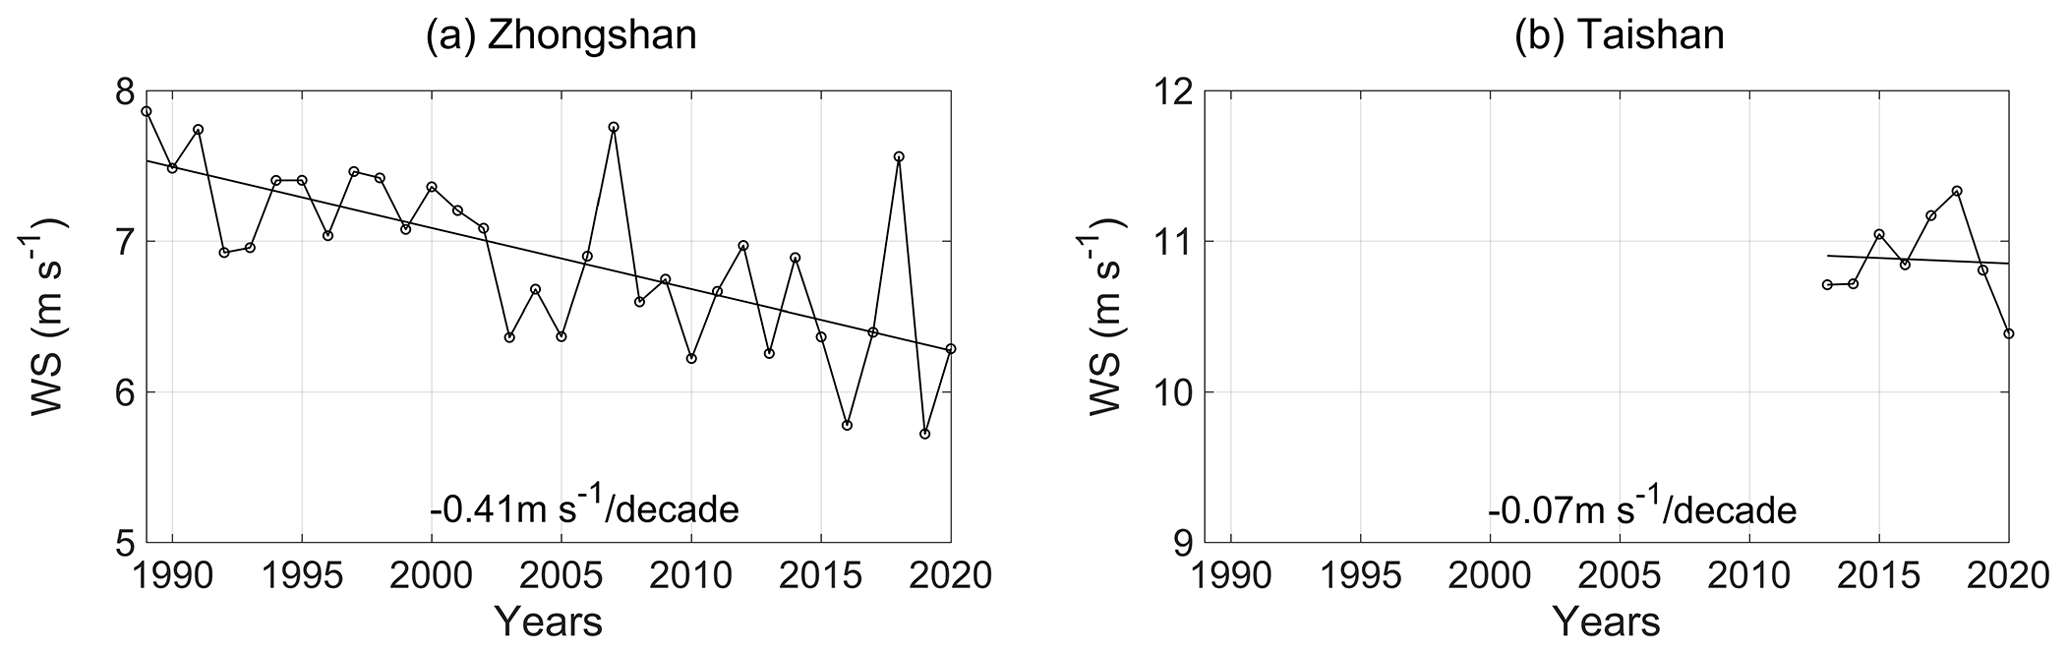
Figure 11Annual variation in wind speed at Zhongshan (p<0.05) and Taishan (p<0.05). The calculation periods for these site are the same as for Fig. 5.
As has been previously noted, the vertical axis anemometers of Dome A and Eagle are often frozen during austral winter, and the data quality of wind during austral fall is poor. Therefore, we only analyzed wind direction for the months from September to February at these two sites. Figure 1 shows the wind rose distribution of all AWSs. The wind directions at coastal and inland areas (from Zhongshan to Taishan) were relatively regular: during austral summer, constant easterlies determined the wind speed on the ice sheet. In austral winter, katabatic forcing from strong surface cooling, a large-scale pressure gradient and the Coriolis force dominated, also resulting in winds from the northeast to southeast (Van den Broeke et al., 2002; Van den Broeke and Van Lipzig, 2003). At the dome summit region, the wind direction has a broad distribution with weak wind speeds to the south, southeast and west. At Dome A, 16 years of observations shows no prevailing wind direction.
Compared to other meteorological observations, one advantage of the PANDA AWS network is that it covers all the terrain and climatic sectors of East Antarctica. The local weather conditions can be deduced from the meteorological surface measurements. Figure 12 shows the course of air pressure, air temperature, relative humidity and wind speed from 30 July to 3 August 2020 and indicates the occurrence of a prominent blocking event. To assess the capability of the AWS network to monitor weather conditions, this physical atmospheric process was analyzed using the PANDA AWS network dataset.
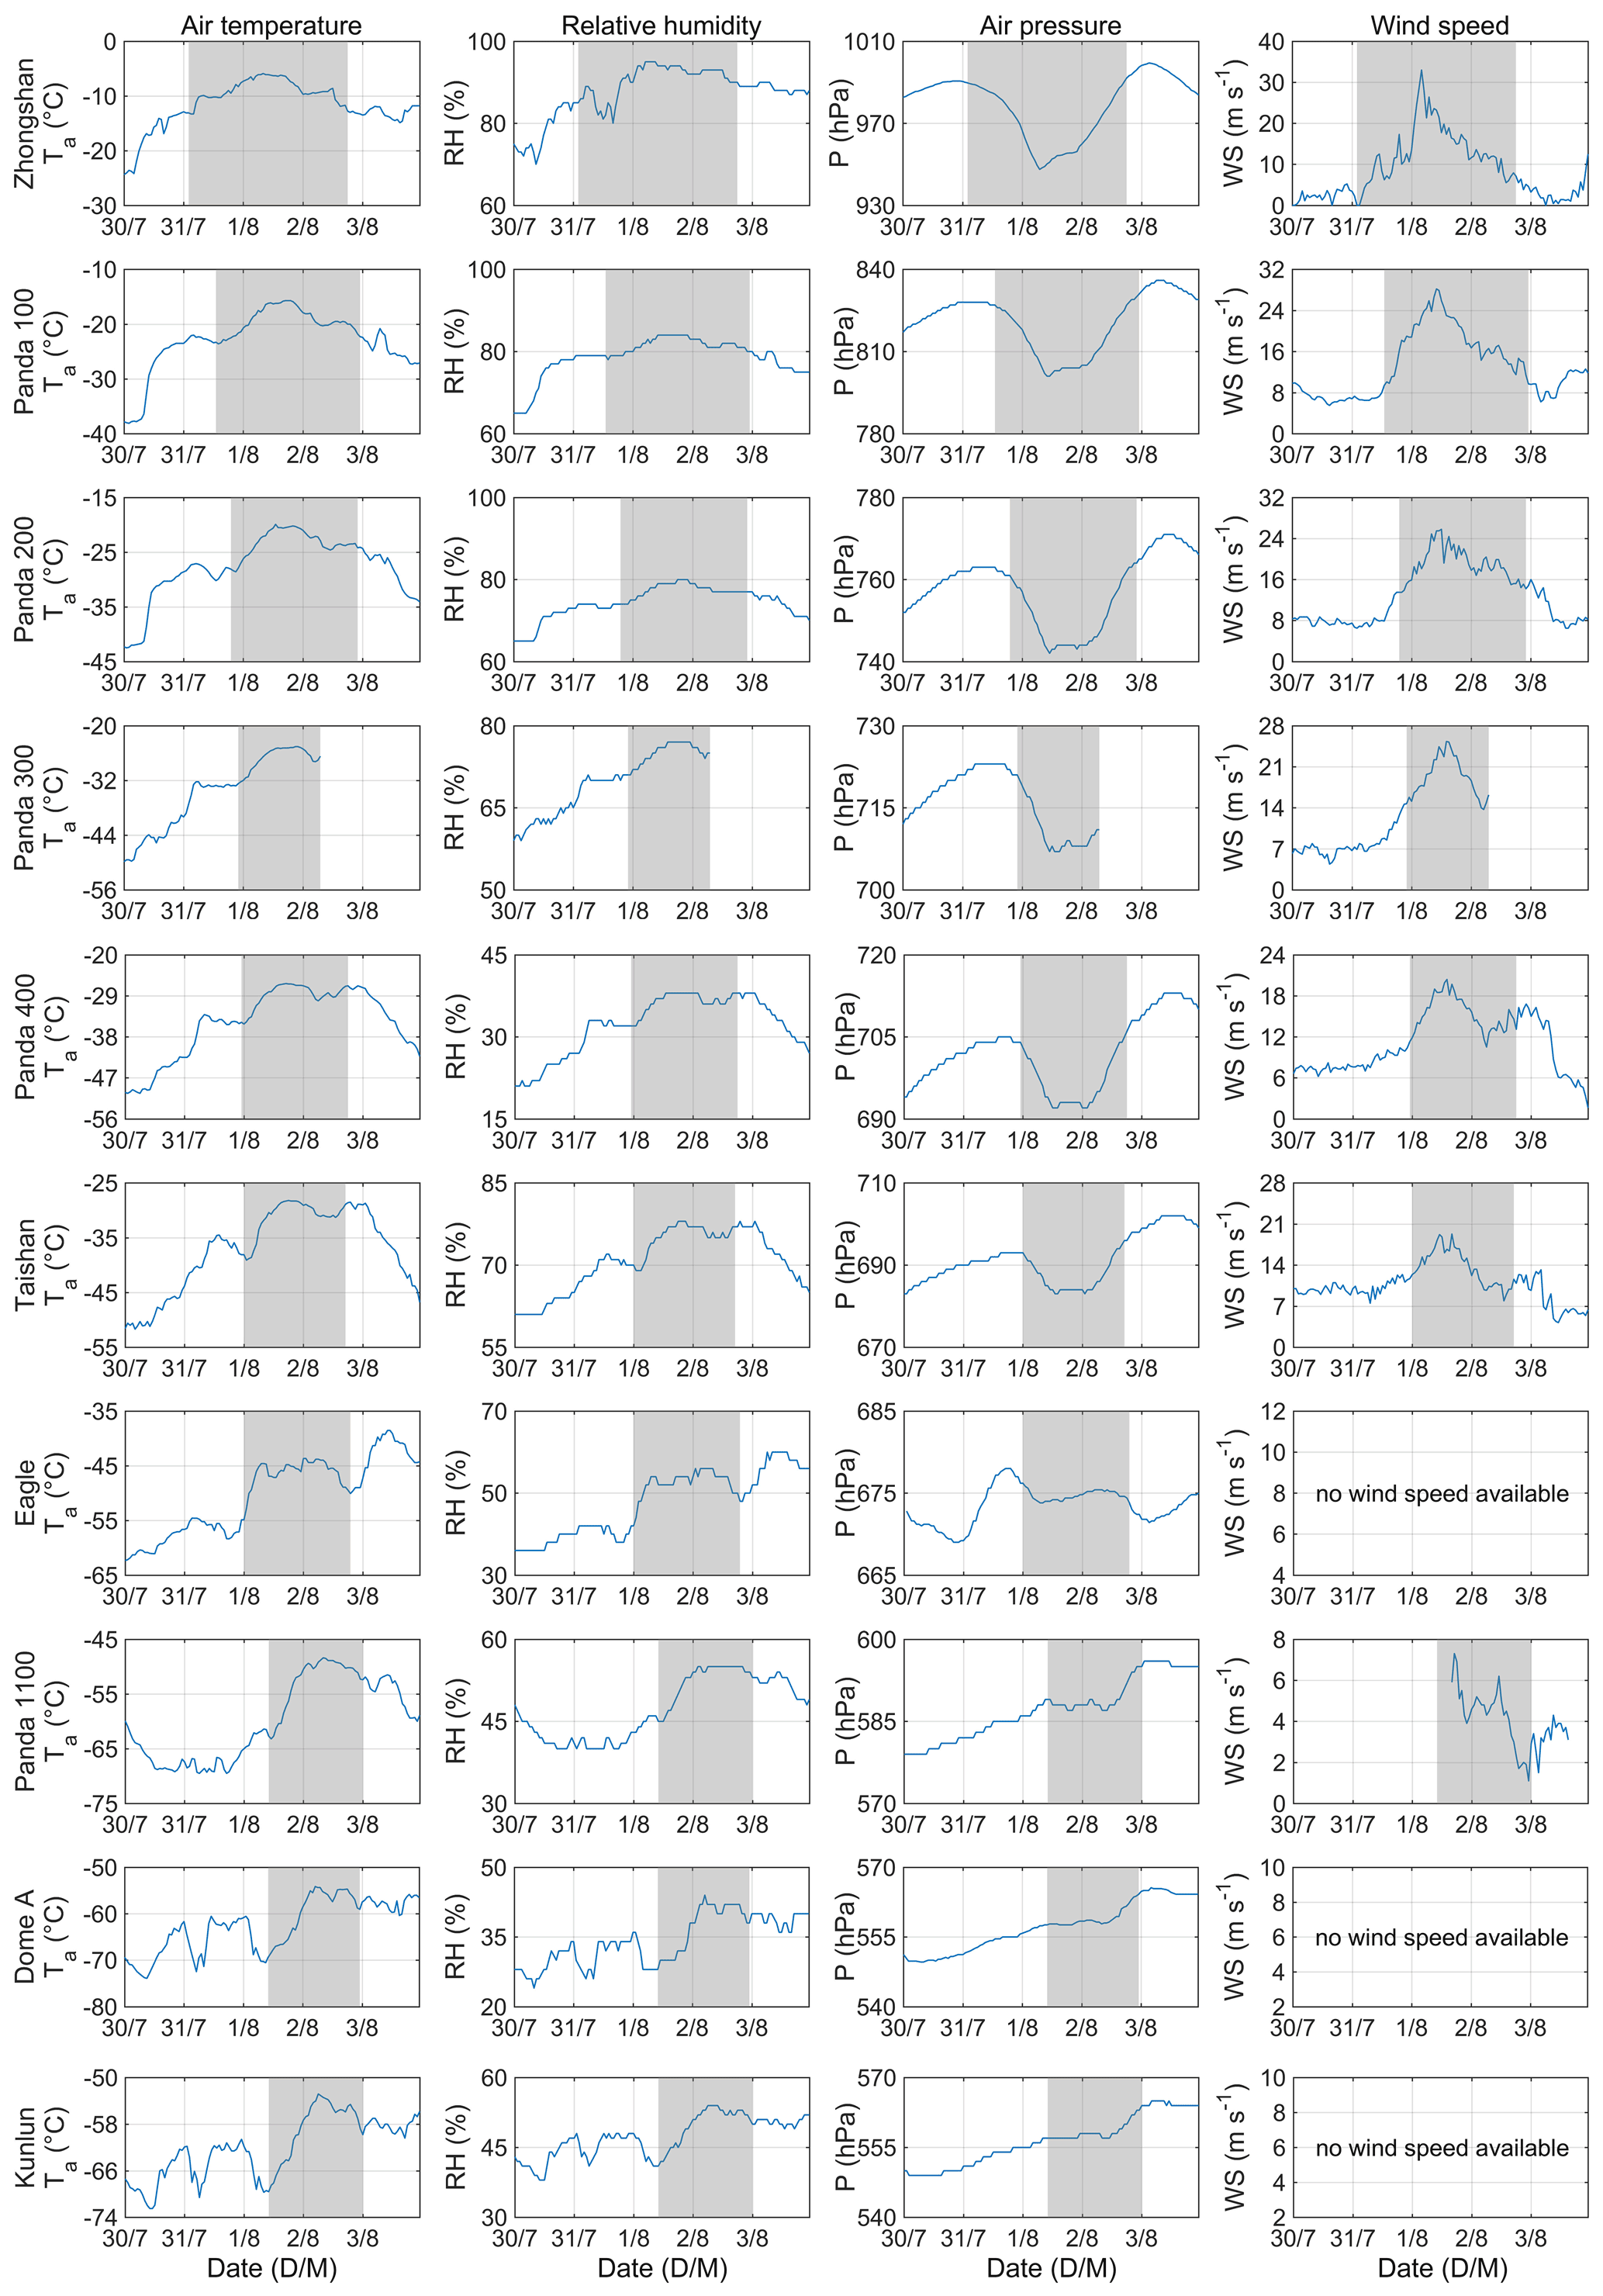
Figure 12Time series of air temperature, relative humidity, air pressure and wind speed at AWSs of the PANDA network (except Panda S) from 00:00 30 July to 23:00 on 3 August 2020 (UTC); gray zone: blocking event.
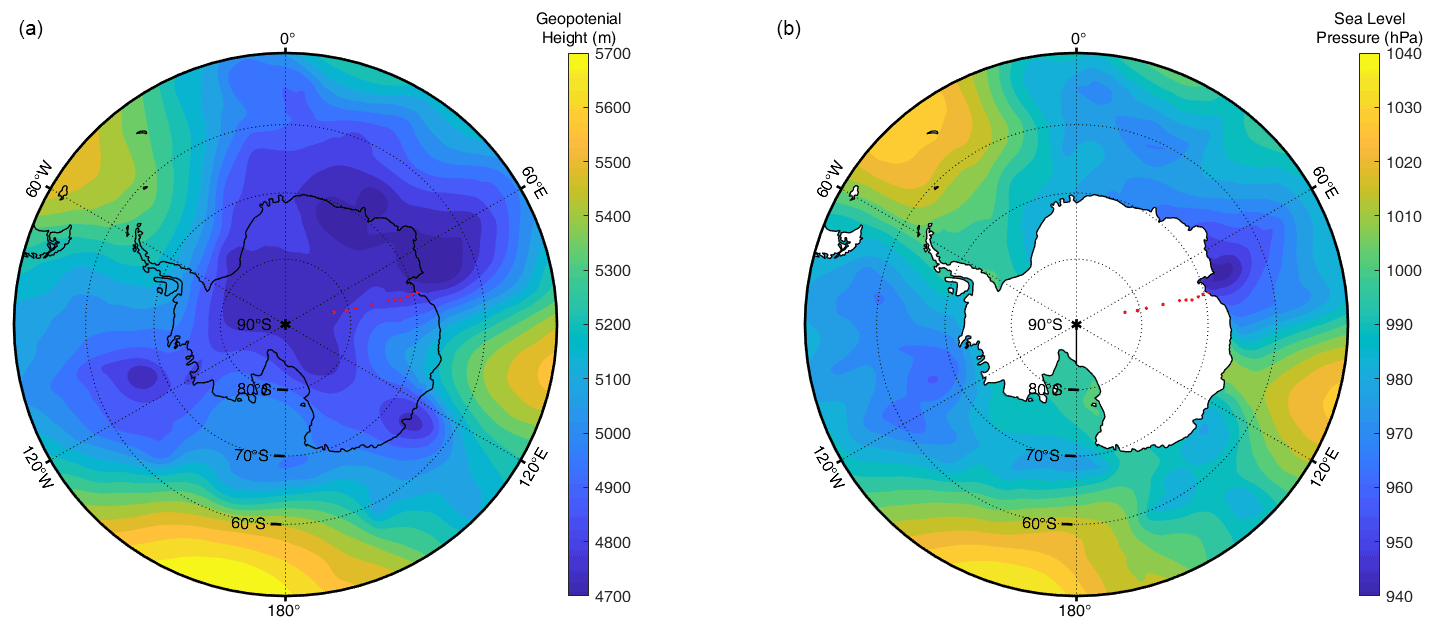
Figure 13The mean 500 hPa geopotential height (a) and sea level pressure (b) at 12:00 (UTC) on 1 August (red dot: surface weather station).
On 1 August 2020, the blocking stretched southward to around 100∘ E, forming a high-pressure ridge in the interior of ice sheet (Fig. 13). The deep low-pressure system was blocked from moving eastward and thus stagnated near Prydz Bay. This situation facilitated the meridional advection of warm, moist air masses. It can be seen in Fig. 12 that the air temperature, relative humidity, air pressure and wind speed from Zhongshan to Dome A changed with the development of the event. The uppermost site to detect the blocking is Dome A at 4093 m a.s.l., and the average speed of the blocking event across the transect was about 40 km h−1. Before 1 August, there was a drastic drop in air pressure at AWSs from Zhongshan to Taishan, reaching the lowest value at local noon, but the air pressure from Eagle to Dome A showed no such changes. Meanwhile, the air temperature, relative humidity and wind speed show the opposite change at all AWSs, rising sharply and reaching the highest values at local noon, indicative of maritime air intrusions to the PANDA transect. On 3 August, the deep low-pressure system was slightly weaker (not shown). The southern section of the Indian Ocean subtropical high became weak in the geopotential height anomaly field, and the blocking event moved eastward and eventually dissipated along the coast. This event was like a recent abrupt warming event at Dome C (Ding et al., 2022a). Therefore, the PANDA AWS network provides high-spatiotemporal-resolution observations and can play an important role in mesoscale circulation research on the Antarctic Ice Sheet.
This dataset is publicly available, and it is planned that it will be updated on a near-real-time basis. The data from all AWSs will be publicly available on the platform Big Earth Data for Three Poles. The links are as follows: for Zhongshan, Panda 100, Panda 200, Panda 300, Panda 400, Taishan Eagle, Panda 1100 and Kunlun, the data can be downloaded from https://doi.org/10.11888/Atmos.tpdc.272721 (Ding et al., 2022b). The Dome A data is publicly available from https://doi.org/10.26179/brjy-g225 (Heil et al., 2017). Panda S data have been posted on the data portal of the University of Wisconsin: https://doi.org/10.48567/1hn2-nw60 (Antarctic Meteorological Research and Data Center, 2022).
In this paper, we have introduced the PANDA AWS network, which can monitor the meteorology from the coastal Zhongshan AWS to Panda S in the interior of the Antarctic continent with high spatial and temporal resolution. The data collected during the past decades are reliable after calibration and homogenization and have been used widely in meteorological and climate change research in Antarctica (e.g., Xie et al., 2016; Ding et al., 2021a). The data can also be assimilated into reanalyses and used to evaluate climate models and to validate satellite data.
In a preliminary analysis, the diurnal, monthly and annual averages as well as long-term changes have been presented. They show distinct differences between coastal, inland and dome summit regions. An example has also been given of a short-term atmospheric process to show this dataset's capability for weather monitoring and investigation.
MD, IA and XZ designed the experiments and wrote the manuscript; MD carried out the experiments; XZ and DY analyzed the experimental results. MD, XZ, PH and DY revised the manuscript; CL, QS and WZ provided the information on AWSs; DY, LB and CX discussed the results.
The contact author has declared that none of the authors has any competing interests.
Publisher's note: Copernicus Publications remains neutral with regard to jurisdictional claims in published maps and institutional affiliations.
The observations and AWS deployments were carried out during the Chinese National Antarctic Research Expedition from Zhongshan to Kunlun. We are grateful to David Mikolajczyk from the Antarctic Meteorological Research and Data Center at the University of Wisconsin for providing meteorological data and AWS information for Panda S.
This research has been supported by the National Science Foundation of China (42122047), the National Key Research and Development Program of China (2021YFC2802504), and the Basic Fund of the Chinese Academy of Meteorological Sciences (2021Z006).
This paper was edited by Baptiste Vandecrux and reviewed by Amélie Kirchgaessner and one anonymous referee.
Allison, I.: Surface climate of the interior of the Lambert Glacier basin, Antarctica, from automatic weather station data, Ann. Glaciol., 27, 515–520, https://doi.org/10.3189/1998AoG27-1-515-520, 1998.
Allison, I. and Morrissy, J. V.: Automatic weather stations in Antarctica, Austr. Meteorol. Mag., 31, 71–76, 1983.
Allison, I., Wendler, G., and Radok, U.: Climatology of the East Antarctic ice sheet (100∘ E to 140∘ E) derived from automatic weather stations, J. Geophys. Res.-Atmos., 98, 8815–8823, https://doi.org/10.1029/93JD00104, 1993.
Antarctic Meteorological Research and Data Center: Automatic Weather Station quality-controlled observational data, AMRDC Data Repository [data set], https://doi.org/10.48567/1hn2-nw60, 2022.
Aristidi, E., Agabi, K., Azouit, M., Fossat, E., Vernin, J., Travouillon, T., Lawrence, J. S., Meyer, C., Storey, J. W. V., Halter, B., Roth, W. L., and Walden, V.: An analysis of temperatures and wind speeds above Dome C, Antarctica, Astron. Astrophys., 430, 739–746, https://doi.org/10.1051/0004-6361:20041876, 2005.
Bian, L., Allison, I., Xiao, C., Ma, Y., Fu, L., and Ding, M.: Climate and meteorological processes of the East Antarctic ice sheet between Zhongshan and Dome-A, Adv. Polar Sci., 27, 90–101, https://doi.org/10.13679/j.advps.2016.2.00090, 2016.
Bromwich, D. H., Werner, K., Casati, B., Powers, J. G., Gorodetskaya, I. V., Massonnet, F., Vitale, V., Heinrich, V. J., Liggett, D., Arndt, S., Barja, B., Bazile, E., Carpentier, S., Carrasco, J. F., Choi, T., Choi, Y., Colwell, S. R., Cordero, R. R., Gervasi, M., Haiden, T., Hirasawa, Na., Inoue, J., Jung, T., Kalesse, H., Kim, S. J., Lazzara, M. A., Manning, K. W., Norris, K., Park, S. J., Reid P.,, Rigor, I., Rowe, P. M., Schmithüsen, H., Seifert, P., Sun, Q., Uttal, T., Zannoni, M., and Zou, X.: The Year of Polar Prediction in the Southern Hemisphere (YOPP-SH), B. Am. Meteorol. Soc., 101, E1653–E1676, https://doi.org/10.1175/BAMS-D-19-0255.1, 2020.
Chen, B., Zhang, R., Xiao, C., Bian, L., and Zhang, T.: Analyses on the air and snow temperatures near ground with observations of an AWS at Dome A, the summit of Antarctic Plateau, Chinese Sci. Bull., 55, 1048–1054, https://doi.org/10.1007/s11434-010-0099-1, 2010.
Das, I., Bell, R. E., Scambos, T. A., Wolovick, M., Creyts, T. T., Studinger, M., Frearson, N., Nicolas, J. P., Lenaerts, J. T. M., and Van Den Broeke, M. R.: Influence of persistent wind scour on the surface mass balance of Antarctica, Nat. Geosci., 6, 367–371, https://doi.org/10.1038/ngeo1766, 2013.
Ding, M., Xiao, C., Li, Y., Ren, J., Hou, S., Jin, B., and Sun, B.: Spatial variability of surface mass balance along a traverse route from Zhongshan station to Dome A, Antarctica, J. Glaciol., 57, 658–666, https://doi.org/10.3189/002214311797409820, 2011.
Ding, M., Xiao, C., Li, C., Qin, D., Jin, B., Shi, G., Xie, A., and Cui, X.: Surface mass balance and its climate significance from the coast to Dome A, East Antarctica, Sci. China Earth Sci., 58, 1787–1797, https://doi.org/10.1007/s11430-015-5083-9, 2015.
Ding, M., Yang, D., Van den Broeke, M. R., Allison, I., Xiao, C., Qin, D., and Huai, B.: The surface energy balance at Panda 1 station, Princess Elizabeth Land: A typical katabatic wind region in East Antarctica, J. Geophys. Res.-Atmos., 125, e2019JD030378, https://doi.org/10.1029/2019JD030378, 2020a.
Ding, M., Tian, B., Ashley, M. C. B., Putero, D., Zhu, Z., Wang, L., Yang, S., Li, C., and Xiao, C.: Year-round record of near-surface ozone and O3 enhancement events (OEEs) at Dome A, East Antarctica, Earth Syst. Sci. Data, 12, 3529–3544, https://doi.org/10.5194/essd-12-3529-2020, 2020b.
Ding, M., Zhang, T., Yang, D., Allison, I., Dou, T., and Xiao, C.: Brief communication: Evaluation of multiple density-dependent empirical snow conductivity relationships in East Antarctica, The Cryosphere, 15, 4201–4206, https://doi.org/10.5194/tc-15-4201-2021, 2021a.
Ding, M., Du, F., Zhang, W., Wen, H., and Lu, C.: Battery system adapted to polar ultra-low temperature environment and its temperature control method, Beijing [patent], CN113659246A, 2021b.
Ding, M., Xiao, C., and Qin, D.: Explosive warming event in Antarctica on 18 March 2022 and its possible causes, Advances in Climate Change Research, 8, 384–388, 2022a
Ding, M., Zou, X., Sun, Q., Yang, D., Zhang, W., Bian, L., Lu, C., Allison, I., Heil, P., and Xiao, C.: The PANDA automatic weather station network between the coast and Dome A, East Antarcitca (1989–2021), A Big Earth Data Platform for Three Poles, National Tibetan Plateau Data Cente [data set], https://doi.org/10.11888/Atmos.tpdc.272721, 2022b.
Dong, X., Wang, Y., Hou, S., Ding, M., Yin, B., and Zhang, Y.: Robustness of the recent global atmospheric reanalyses for Antarctic near-surface wind speed climatology, J. Climate, 33, 4027–4043, https://doi.org/10.1175/JCLI-D-19-0648.1, 2020.
Enomoto, H., Warashina, H., Motoyama, H., Takahashi, S., and Koike, J.: Data-logging automatic weather station along the traverse route from Syowa Station to Dome Fuji, Proc. of the NIPR Symp. on Polar Meteorol. and Glaciol., 9, 66–75, https://doi.org/10.15094/00003880, 1995.
Heil, P.: Atmospheric conditions and fast ice at Davis, East Antarctica: A case study, J. Geophys. Res.-Oceans, 111, C05009 https://doi.org/10.1029/2005JC002904, 2006.
Heil, P., Hyland, G., and Alison, I.: Automatic Weather Station Data obtained at Dome A (Argus), Antarctica, Ver. 1, Australian Antarctic Data Centre [data set], https://doi.org/10.26179/brjy-g225, 2017.
Hines, K. M., Bromwich, D. H., Wang, S.-H., Silber, I., Verlinde, J., and Lubin, D.: Microphysics of summer clouds in central West Antarctica simulated by the Polar Weather Research and Forecasting Model (WRF) and the Antarctic Mesoscale Prediction System (AMPS), Atmos. Chem. Phys., 19, 12431–12454, https://doi.org/10.5194/acp-19-12431-2019, 2019.
Huai, B., Wang, Y., Ding, M., Zhang, J., and Dong, X.: An assessment of recent global atmospheric reanalyses for Antarctic near surface air temperature, Atmos. Res., 226, 181–191, https://doi.org/10.1016/j.atmosres.2019.04.029, 2019.
Intergovernmental Panel on Climate Change (IPCC): IPCC special report on the ocean and cryosphere in a changing climate, IPCC Geneva, https://www.ipcc.ch/srocc/ (last access: 1 November 2022), 2019.
King, J. C., Argentini, S. A., and Anderson, P. S.: Contrasts between the summertime surface energy balance and boundary layer structure at Dome C and Halley stations, Antarctica, J. Geophys. Res.-Atmos., 111, D02105, https://doi.org/10.1029/2005JD006130, 2006.
Lazzara, M. A., Weidner, G. A., Keller, L. M., Thom, J. E., and Cassano, J. J.: Antarctic automatic weather station program: 30 years of polar observation, B. Am. Meteorol. Soc., 93, 1519–1537, https://doi.org/10.1175/BAMS-D-11-00015.1, 2012.
Ma, Y. and Bian, L.: A Surface Climatological Validation of ERA-interim Reanalysis and NCEP FNL Analysis over East Antarctic, Chinese Journal of Polar Research, 26, 469–480, https://doi.org/10.13679/j.jdyj.2014.4.469, 2014.
Ma, Y., Bian, L., Xiao, C., and Allison, I.: Correction of snow accumulation impacted on air temperature from automatic weather station on the Antarctic Ice Sheet, Adv. Polar Sci., 20, 299–309, 2008.
Ma, Y., Bian, L., Xiao, C., Allison, I., and Zhou, X.: Near surface climate of the traverse route from Zhongshan Station to Dome A, East Antarctica, Antarct. Sci., 22, 443–459, https://doi.org/10.1017/S0954102010000209, 2010.
Maturilli, M., Herber, A., and König-Langlo, G.: Climatology and time series of surface meteorology in Ny-Ålesund, Svalbard, Earth Syst. Sci. Data, 5, 155–163, https://doi.org/10.5194/essd-5-155-2013, 2013.
Nigro, M. A., Cassano, J. J., and Seefeldt, M. W.: A weather-pattern-based approach to evaluate the Antarctic Mesoscale Prediction System (AMPS) forecasts: Comparison to automatic weather station observations, Weather Forecast., 26, 184–198, https://doi.org/10.1175/2010WAF2222444.1, 2011.
Parish, T. and Bromwich, D.: The surface wind-field over the Antarctic ice sheets, Nature, 328, 51–54, https://doi.org/10.1038/328051a0, 1987.
Qin, D. and Ren, J.: he Antarctic Glaciology, Science Press, Beijing, ISBN 7030090926, 2001.
Qin, T., Wei, L., and Ling, C.: The statistic and variance of cyclones enter in scientific investigation station of China in Antarctic, Acta. Oceanol. Sin., 39, 44–60, https://doi.org/10.3969/j.issn.0253-4193.2017.05.005, 2017.
Radok, U., Allison, I., and Wendler, G.: Atmospheric surface pressure over the interior of Antarctica, Antarct. Sci., 8, 209–217, 1996.
Reijmer, C. H. and Oerlemans, J.: Temporal and spatial variability of the surface energy balance in Dronning Maud Land, East Antarctica, J. Geophys. Res.-Atmos., 107, ACL9-1–ACL9-12, https://doi.org/10.1029/2000JD000110, 2002.
Schwerdtfeger, W.: Weather and climate of the Antarctic, Elsevier Science, New York, 1984.
Smeets, P. C., Kuipers Munneke, P., Van As, D., van den Broeke, M. R., Boot, W., Oerlemans, H., Snellen, H., Reijmer, C. H., and van de Wal, R. S.: The K-transect in west Greenland: Automatic weather station data (1993–2016), Arctic, Antarct. Alp. Res., 50, S100002, https://doi.org/10.1080/15230430.2017.1420954, 2018.
Sun, Q. Z., Zhang, L., Meng, S., Shen, H., Ding, Z. M., and Zhang, Z. H.: Meteorological observations and weather forecasting services of the CHINARE, Adv. Polar Sci., 28, 291–299, https://doi.org/10.13679/j.advps.2018.4.00291, 2018.
Turner, J., Colwell, S. R., Marshall, G. J., Lachlan-Cope, T. A., Carleton, A. M., Jones, P. D., Lagun, V., Reid, P. A., and Iagovkina, S.: Antarctic climate change during the last 50 years, International J. Climatol., 25, 279–294, https://doi.org/10.1002/joc.1130, 2005.
Turner, J., Overland, J. E., and Walsh, J. E.: An Arctic and Antarctic perspective on recent climate change, Int. J. Climatol., 27, 277–293, https://doi.org/10.1002/joc.1406, 2007.
Turner, J., Marshall, G. J., Clem, K., Colwell, S., Phillips, T., and Lu, H.: Antarctic temperature variability and change from station data, Int. J. Climatol., 40, 2986–3007, https://doi.org/10.1002/joc.6378, 2020.
Van As, D., Van den Broeke, M. R., and Van De Wal, R.: Daily cycle of the surface layer and energy balance on the high Antarctic Plateau, Antarct. Sci., 17, 121–133, https://doi.org/10.1017/S095410200500252X, 2005.
Van den Broeke, M. R. and Van Lipzig, N. P. M.: Factors controlling the near-surface wind field in Antarctica, Mon. Weather Rev., 131, 733–743, https://doi.org/10.1175/1520-0493(2003)131<0733:FCTNSW>2.0.CO;2, 2003.
Van den Broeke, M. R., Van Lipzig, N. P. M., and Van Meijgaard, E.: Momentum budget of the East Antarctic atmospheric boundary layer: Results of a regional climate model, J. Atmos. Sci., 59, 3117–3129, https://doi.org/10.1175/1520-0469(2002)059<3117:MBOTEA>2.0.CO;2, 2002.
Van den Broeke, M. R., Reijmer, C. H., and Van De Wal, R.: Surface radiation balance in Antarctica as measured with automatic weather stations, J. Geophys. Res.-Atmos., 109, D09103, https://doi.org/10.1029/2003JD004394, 2004a.
Van den Broeke, M. R., Reijmer, C. H., and Van De Wal, R. S.: A study of the surface mass balance in Dronning Maud Land, Antarctica, using automatic weather stations, J. Glaciol., 50, 565–582, https://doi.org/10.3189/172756504781829756, 2004b.
Van den Broeke, M. R., Reijmer, C. H., Van As, D., Van de Wal, R., and Oerlemans, J.: Seasonal cycles of Antarctic surface energy balance from automatic weather stations, Ann. Glaciol., 41, 131–139, https://doi.org/10.3189/172756405781813168, 2005.
Van Den Broeke, M. R., Reijmer, C. H., Van As, D., and Boot, W.: Daily cycle of the surface energy balance in Antarctica and the influence of clouds, Int. J. Climatol., 26, 1587–1605, https://doi.org/10.1002/joc.1323, 2006.
Vignon, E., Genthon, C., Barral, H., Amory, C., Picard, G., Gallée, H., Casasanta, G., and Argentini, S.: Momentum-and heat-flux parametrization at Dome C, Antarctica: A sensitivity study, Bound.-Lay. Meteorol., 162, 341–367, https://doi.org/10.1007/s10546-016-0192-3, 2017.
Wang, S., Ding, M., Liu, G., Wei, T., Zhang, W., Chen, W., Dou, T., and Xiao, C.: On the Drivers of Temperature Extremes on the Antarctic Peninsula During Austral Summer, Clim. Dynam., 59, 2275–229, https://doi.org/10.1007/s00382-022-06209-0, 2022.
Wawrzyniak, T. and Osuch, M.: A 40-year High Arctic climatological dataset of the Polish Polar Station Hornsund (SW Spitsbergen, Svalbard), Earth Syst. Sci. Data, 12, 805–815, https://doi.org/10.5194/essd-12-805-2020, 2020.
Wei, T., Yan, Q., and Ding, M.: Distribution and temporal trends of temperature extremes over Antarctica, Environ. Res. Lett., 14, 084040, https://doi.org/10.1088/1748-9326/ab33c1, 2019.
Wendler, G., Ishikawa, N., and Kodama, Y.: The heat balance of the Icy slope of Adelie Land, Eastern Antarctica, J. Appl. Meteorol., 27, 52–65, https://doi.org/10.1175/1520-0450(1988)027<0052:THBOTI>2.0.CO;2, 1988.
Xiao, C., Li, Y., Allison, I., Hou, S., Dreyfus, G., Barnola, J. M., Ren, J., Bian, L., Zhang, S., and Kameda, T.: Surface characteristics at Dome A, Antarctica: first measurements and a guide to future ice-coring sites, Ann. Glaciol., 48, 82–87, https://doi.org/10.3189/172756408784700653, 2008.
Xie, A., Allison, I., Xiao, C., Wang, S., Ren, J., and Qin, D.: Assessment of surface pressure between Zhongshan and Dome A in East Antarctica from different meteorological reanalyses, Arct. Antarct. Alp. Res., 46, 669–681, https://doi.org/10.1657/1938-4246-46.3.669, 2014.
Xie, A., Wang, S., Xiao, C., Kang, S., Gong, J., Ding, M., Li, C., Dou, T., Ren, J., and Qin, D.: Can temperature extremes in East Antarctica be replicated from ERA Interim reanalysis? Arct. Antarct. Alp. Res., 48, 603–621, https://doi.org/10.1657/AAAR0015-048, 2016.
Zeng, Z., Wang, Z., Ding, M., Zheng, X., Sun, X., Zhu, W., Zhu, K., An, J., Zang, L., Guo, J., and Zhang, B.: Estimation and Long-term Trend Analysis of Surface Solar Radiation in Antarctica: A Case Study of Zhongshan Station, Adv. Atmos. Sci., 38, 1497–1509, https://doi.org/10.1007/s00376-021-0386-6, 2021.
Zhang, S., E, D., Wang, Z., Li, Y., Jin, B., and Zhou, C.: Ice velocity from static GPS observations along the transect from Zhongshan station to Dome A, East Antarctica, Ann. Glaciol., 48, 113–118, https://doi.org/10.3189/172756408784700716, 2008.
Zhang, Y., Wang, Y., and Hou, S.: Reliability of Antarctic air temperature changes from Polar WRF: A comparison with observations and MAR outputs, Atmos. Res., 266, 105967, https://doi.org/10.1016/j.atmosres.2021.105967, 2021.
Zhou, M., Zhang, Z., Zhong, S., Lenschow, D., Hsu, H. M., Sun, B., Gao, Z., Li, S., Bian, X., and Yu, L.: Observations of near-surface wind and temperature structures and their variations with topography and latitude in East Antarctica, J. Geophys. Res.-Atmos., 114, D17115, https://doi.org/10.1029/2008JD011611, 2009.
Zou, X., Ding, M., Sun, W., Yang, D., Liu, W., Huai, B., Jin, S., and Xiao, C.: The surface energy balance of Austre Lovénbreen, Svalbard, during the ablation period in 2014, Polar Res., 40, 5318, https://doi.org/10.33265/polar.v40.5318, 2021.