the Creative Commons Attribution 4.0 License.
the Creative Commons Attribution 4.0 License.
 | 11 Nov 2022
Enhanced automated meteorological observations at the Canadian Arctic Weather Science (CAWS) supersites
Laura Huang
Robert Crawford
Jean-Pierre Blanchet
Shannon Hicks-Jalali
Eva Mekis
Ludovick Pelletier
Peter Rodriguez
Kevin Strawbridge
The changing Arctic climate is creating increased economic, transportation, and recreational activities requiring reliable and relevant weather information. However, the Canadian Arctic is sparsely observed, and processes governing weather systems in the Arctic are not well understood. There is a recognized lack of meteorological data to characterize the Arctic atmosphere for operational forecasting and to support process studies, satellite calibration/validation, search and rescue operations (which are increasing in the region), high-impact weather (HIW) detection and prediction, and numerical weather prediction (NWP) model verification and evaluation. To address this need, Environment and Climate Change Canada commissioned two supersites, one in Iqaluit (63.74∘ N, 68.51∘ W) in September 2015 and the other in Whitehorse (60.71∘ N, 135.07∘ W) in November 2017 as part of the Canadian Arctic Weather Science (CAWS) project. The primary goals of CAWS are to provide enhanced meteorological observations in the Canadian Arctic for HIW nowcasting (short-range forecast) and NWP model verification, evaluation, and process studies and to provide recommendations on the optimal cost-effective observing system for the Canadian Arctic. Both sites are in provincial/territorial capitals and are economic hubs for the region; they also act as transportation gateways to the north and are in the path of several common Arctic storm tracks. The supersites are located at or next to major airports and existing Meteorological Service of Canada ground-based weather stations that provide standard meteorological surface observations and upper-air radiosonde observations; they are also uniquely situated in close proximity to frequent overpasses by polar-orbiting satellites. The suite of in situ and remote sensing instruments at each site is completely automated (no on-site operator) and operates continuously in all weather conditions, providing near-real-time data to operational weather forecasters, the public, and researchers via obrs.ca. The two sites have similar instruments, including mobile Doppler weather radars, multiple vertically profiling and/or scanning lidars (Doppler, ceilometer, water vapour), optical disdrometers, precipitation gauges in different shielded configurations, present weather sensors, fog monitoring devices, radiation flux sensors, and other meteorological instruments. Details on the two supersites, the suites of instruments deployed, the data collection methods, and example case studies of HIW events are discussed. CAWS data are publicly accessible via the Canadian Government Open Data Portal (https://doi.org/10.18164/ff771396-b22c-4bc3-844d-38fc697049e9, Mariani et al., 2022a, and https://doi.org/10.18164/d92ed3cf-4ba0-4473-beec-357ec45b0e78, Mariani et al., 2022b); this dataset is being used to improve our understanding of synoptic and fine-scale meteorological processes in the Arctic and sub-Arctic, including HIW detection and prediction and NWP verification, assimilation, and processes.
- Article
(8748 KB) - Full-text XML
- BibTeX
- EndNote


Economic activity in the Arctic is growing due to increasing population, transportation, tourism, and resource development with the opening of the Northwest Passage. For instance, marine and air traffic have significantly increased in the region (Smith and Stephenson, 2013; Arctic Council, 2017). At the same time, the changing climate, which is amplified in the Arctic region, induces changes in weather events with a high socio-economic impact (WMO, 2011). A disproportionate number of search-and-rescue (SAR) incidents occur in Canada's Northern Territories relative to the southern provinces (Government of Canada, 2016; Statistics Canada, 2016). Increasing demands will be placed on transportation and SAR-related infrastructure and services as high-impact weather (HIW) conditions are expected to become more frequent, longer in duration, and less predictable in the future (Ford et al., 2013). The provision of meteorological observations can help individuals, groups, and organizations to make informed decisions about when to safely travel, conduct particular activities, and take precautionary or protective actions. Such observations can reduce weather vulnerability, improve HIW warnings, prevent SAR incidents from occurring, and support SAR operations when undertaken (WMO, 2017).
Given the sparse availability of meteorological data in the Arctic, operational weather forecasters rely heavily on output from numerical weather prediction (NWP) models. Unfortunately, almost all international NWP models exhibit poor performance >60∘ N with significant errors in forecasted pressure and winds (Cassano et al., 2011; Schyberg and Randriamampianina, 2015; Riishojgaard, 2015). The primary cause of these errors is the large geographic gaps in meteorological measurements; despite Canada encompassing roughly 40 % of the entire Arctic region (with >200 000 inhabitants globally), there exist only seven upper-air stations (profile observations above the surface) and no weather radar data. The Canadian Network for the Detection of Climate Change research site at Eureka, NU (80.05∘ N, 86.42∘ W), is equipped with remote sensing meteorological and climate observations (e.g., Lesins et al., 2009); otherwise, the few ground-based weather stations that exist in the Arctic only provide standard surface meteorological observations (surface pressure, temperature, humidity, and wind). An overview of the few previous/current Arctic science projects that provide enhanced meteorological or climatological observations is provided in Joe et al. (2020).
As NWP model resolution increases, there exists a growing need for high spatial- and temporal-resolution meteorological measurements in the Arctic beyond the standard surface measurements. Such observations can be used to validate, inter-compare, and perform NWP process studies which can eventually lead to changes that enhance the performance of NWP systems; this is one of the foci of the World Meteorological Organization's (WMO) Year of Polar Prediction (YOPP) project (core phase: mid-2017 to mid-2019) (Koltzow et al., 2019). Validation of NWP output within the planetary boundary layer (PBL) is particularly essential since the representation of the PBL's structure and physical processes in the Arctic remain a challenge in NWP systems (Cassano et al., 2011; Illingworth et al., 2015; Schyberg and Randriamampianina, 2015).
To address this need, Environment and Climate Change Canada (ECCC) commissioned two supersites at Iqaluit (airport designator: CYFB, 63.74∘ N, 68.51∘ W, 11 m a.s.l.) and Whitehorse (airport designator: CYXY, 60.71∘ N, 135.07∘ W, 682 m a.s.l.). The two sites are representative of their regions and provide contrasting conditions: e.g., eastern vs. western Arctic, tundra vs. mountainous, and marine vs. inland valley. Both sites were designated as official YOPP supersites during the entire YOPP project (including pre- and post-YOPP phases). The sites provide fully automated and continuous observations of vertically resolved winds, water vapour, clouds and aerosols, as well as surface/soil observations of visibility, radiation fluxes, and precipitation during all weather conditions as part of the Canadian Arctic Weather Science (CAWS) project (Joe et al., 2020). The new profiling observations of winds and water vapour, for instance, are crucial for determining fluxes of water vapour transport, the presence of atmospheric rivers, and hazardous wind conditions for aviation. Such integrated profiling observations do not currently exist in the Arctic (except for standard radiosondes every 12 h); as such, these profile observations provide novel data useful for satellite calibration/validation, evaluating and improving NWP model performance above the surface layer, HIW classification (e.g., depth and height of blowing snow during a blizzard), short-term weather forecasting (nowcast), and for cloud microphysics studies. The sites also conducted standard WMO surface meteorological observations at pre-existing co-located Meteorological Service of Canada (MSC) weather stations.
In the design of the CAWS supersites, emphasis was placed on deploying new remote sensing technologies that were fully automated to reduce operational costs and eliminate requirements for on-site personnel. The advantage of relying on remote sensing instruments to fill data gaps (in both time and vertically in space) for operational forecasters and improve NWP models is outlined in Illingworth et al. (2015). These new technologies underwent thorough multi-year evaluations in order to advise on a cost-effective Arctic observing system, a primary goal of the CAWS project (e.g., Mariani et al., 2020a, b, 2021); these are the first multi-year evaluations to occur in the Arctic region for many of these instruments, whereas previous evaluations occurred over shorter periods at mid-latitudes (e.g., Kumer et al., 2014; Päschke et al., 2015; Newsom et al., 2020).
A wide range of meteorological conditions were observed at unprecedented resolution at the CAWS supersites. HIW events were frequently observed, including prolonged stratified wind and water vapour layers (Mariani et al., 2018), blizzards and low-visibility conditions (22 % of days in Iqaluit experienced visibility standard mile during the study period), and more; these events impacted local communities in different ways, including the closure of airports, SAR efforts, and preventing manual in situ observations from taking place (e.g., radiosondes could not be launched at Iqaluit 13 % of the time due to high surface winds).
The data collected during the CAWS project serve as ECCC's primary contribution to providing enhanced meteorological observations during YOPP. Several other supersites from other meteorological agencies also contributed to YOPP; combined, the data collected at these supersites provide the most detailed pan-Arctic observational dataset for NWP evaluation to date. CAWS observations were/are provided to operational forecasters for nowcasting purposes, researchers, and the public in near real time via the website https://obrs.ca (last access: 2 November 2022). The data are also used to support informed decisions on NWP forecast model development and weather forecasting programs, and to enable ground-based calibration and validation of meteorological satellites, such as the ADM-Aeolus (e.g., Chou et al., 2021), GPM, and the upcoming EarthCARE and HAWC-AOS satellite missions.
This paper describes the suite of instrumentation deployed to the two supersites, some of which are new state-of-the-art pre-production commercial units. The data collected at the two supersites fill crucial gaps in Arctic observations, particularly for upper-air (PBL) observations. Section 2 describes the two study areas and their climatology. Section 3 outlines the instrumentation used and datasets collected. Section 4 provides examples of observations at the two supersites in two case studies. Sections 5 and 6 provide details of the online database and concluding remarks, respectively.
2.1 Iqaluit
Iqaluit is the capital of the territory of Nunavut, with a population of over 8000 inhabitants. It is the primary gateway for air and sea traffic for the central and eastern Arctic; it is near many current and planned primary transportation corridors for marine vessels. As such, Iqaluit is commonly referred to as the “gateway to the north.” The CAWS supersite is located ∼ 200 m from the airport runway on an existing MSC weather station property (Fig. 1). All instruments are co-located to within (maximum) 140 m of each other on flat permafrost terrain (rock/soil).
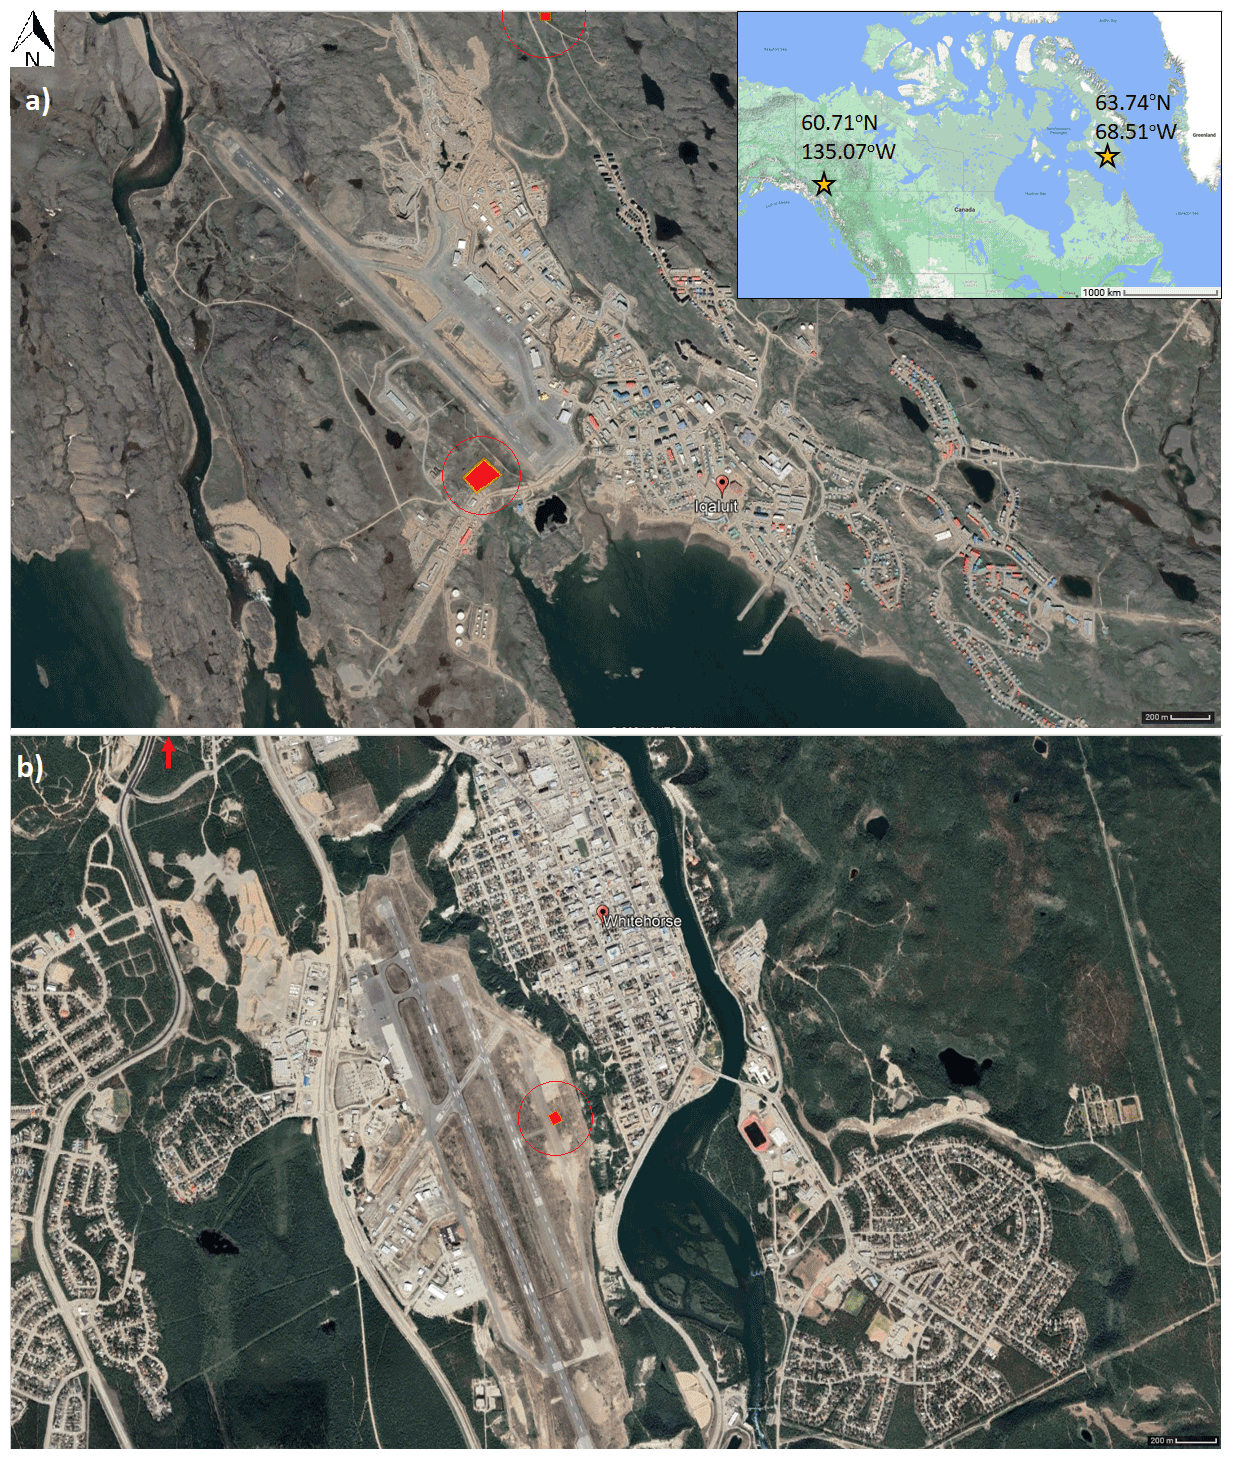
Figure 1(a) Summertime satellite image of Iqaluit, including the CAWS supersite and MSC weather station (red rectangle, image centre-left) located next to the airport runway and south of the smaller T121 site (small red square, image top-centre). The inset topographic map shows the locations of Iqaluit (right star) and Whitehorse (left star). (b) Same as (a) except for the Whitehorse supersite (small red square, image centre). The red arrow in the top left in panel (b) indicates the location of the MSC weather station, just outside of the image's boundary. © Google Earth 2021.
Iqaluit is influenced by a diversity of synoptic storms originating from across the Arctic. Most typical storm tracks originate over the western Arctic or the Prairies. These storms can produce very strong easterly winds within the PBL that, despite Iqaluit's dry climate (<200 mm annual precipitation), can cause blowing snow that severely reduces visibility during non-summer months. During the summer, the frequent formation of fog around the Frobisher Bay area also acts to limit visibility. Iqaluit experiences a wide range in surface temperatures (typically −35 to 20 ∘C) year-round with almost 21 h of sunlight/darkness during polar day/night. The city itself is located along the coast in a valley that runs in the NW–SE direction; thus, the primary direction of surface winds follows this direction. The surrounding region is relatively flat Arctic tundra except for nearby hills (∼ 300 m a.s.l.) approximately 2 km to the NE of the supersite.
2.2 Whitehorse
Whitehorse is the provincial capital of the Yukon Territories, with a population of over 26 000 inhabitants. Similar to Iqaluit, it is the primary gateway for air traffic for all of the Yukon Territories, parts of Alaska, and the western Arctic. The CAWS supersite is located on the Erik Nielsen Whitehorse International Airport property, which itself is situated on a plateau overlooking (∼ 50 m above) the city (Fig. 1). The supersite's instruments are installed on an elevated wooden platform, all within a few metres of each other above compact gravel, while the MSC weather station is located off-site, 2.9 km NNW of the airport.
Most storm tracks that pass through Whitehorse originate from the eastern Pacific or over Alaska. The complex mountainous terrain in this region strongly influences these systems, for instance, blocking systems from entering the valley and causing leeside (upslope) precipitation. In contrast to Iqaluit, Whitehorse is located in a wide valley of the Yukon River with the Yukon Range to its west (∼ 1.6 km a.s.l. mountain peak) and east (∼ 1.4 km a.s.l. mountain peak). Similar to Iqaluit, the primary surface wind direction follows the valley (NNW). Despite its sub-Arctic location, it has a relatively dry climate with annual precipitation <270 mm and experiences an even wider range of temperatures (typically −30 to +30 ∘C) year-round.
3.1 Iqaluit supersite instrumentation
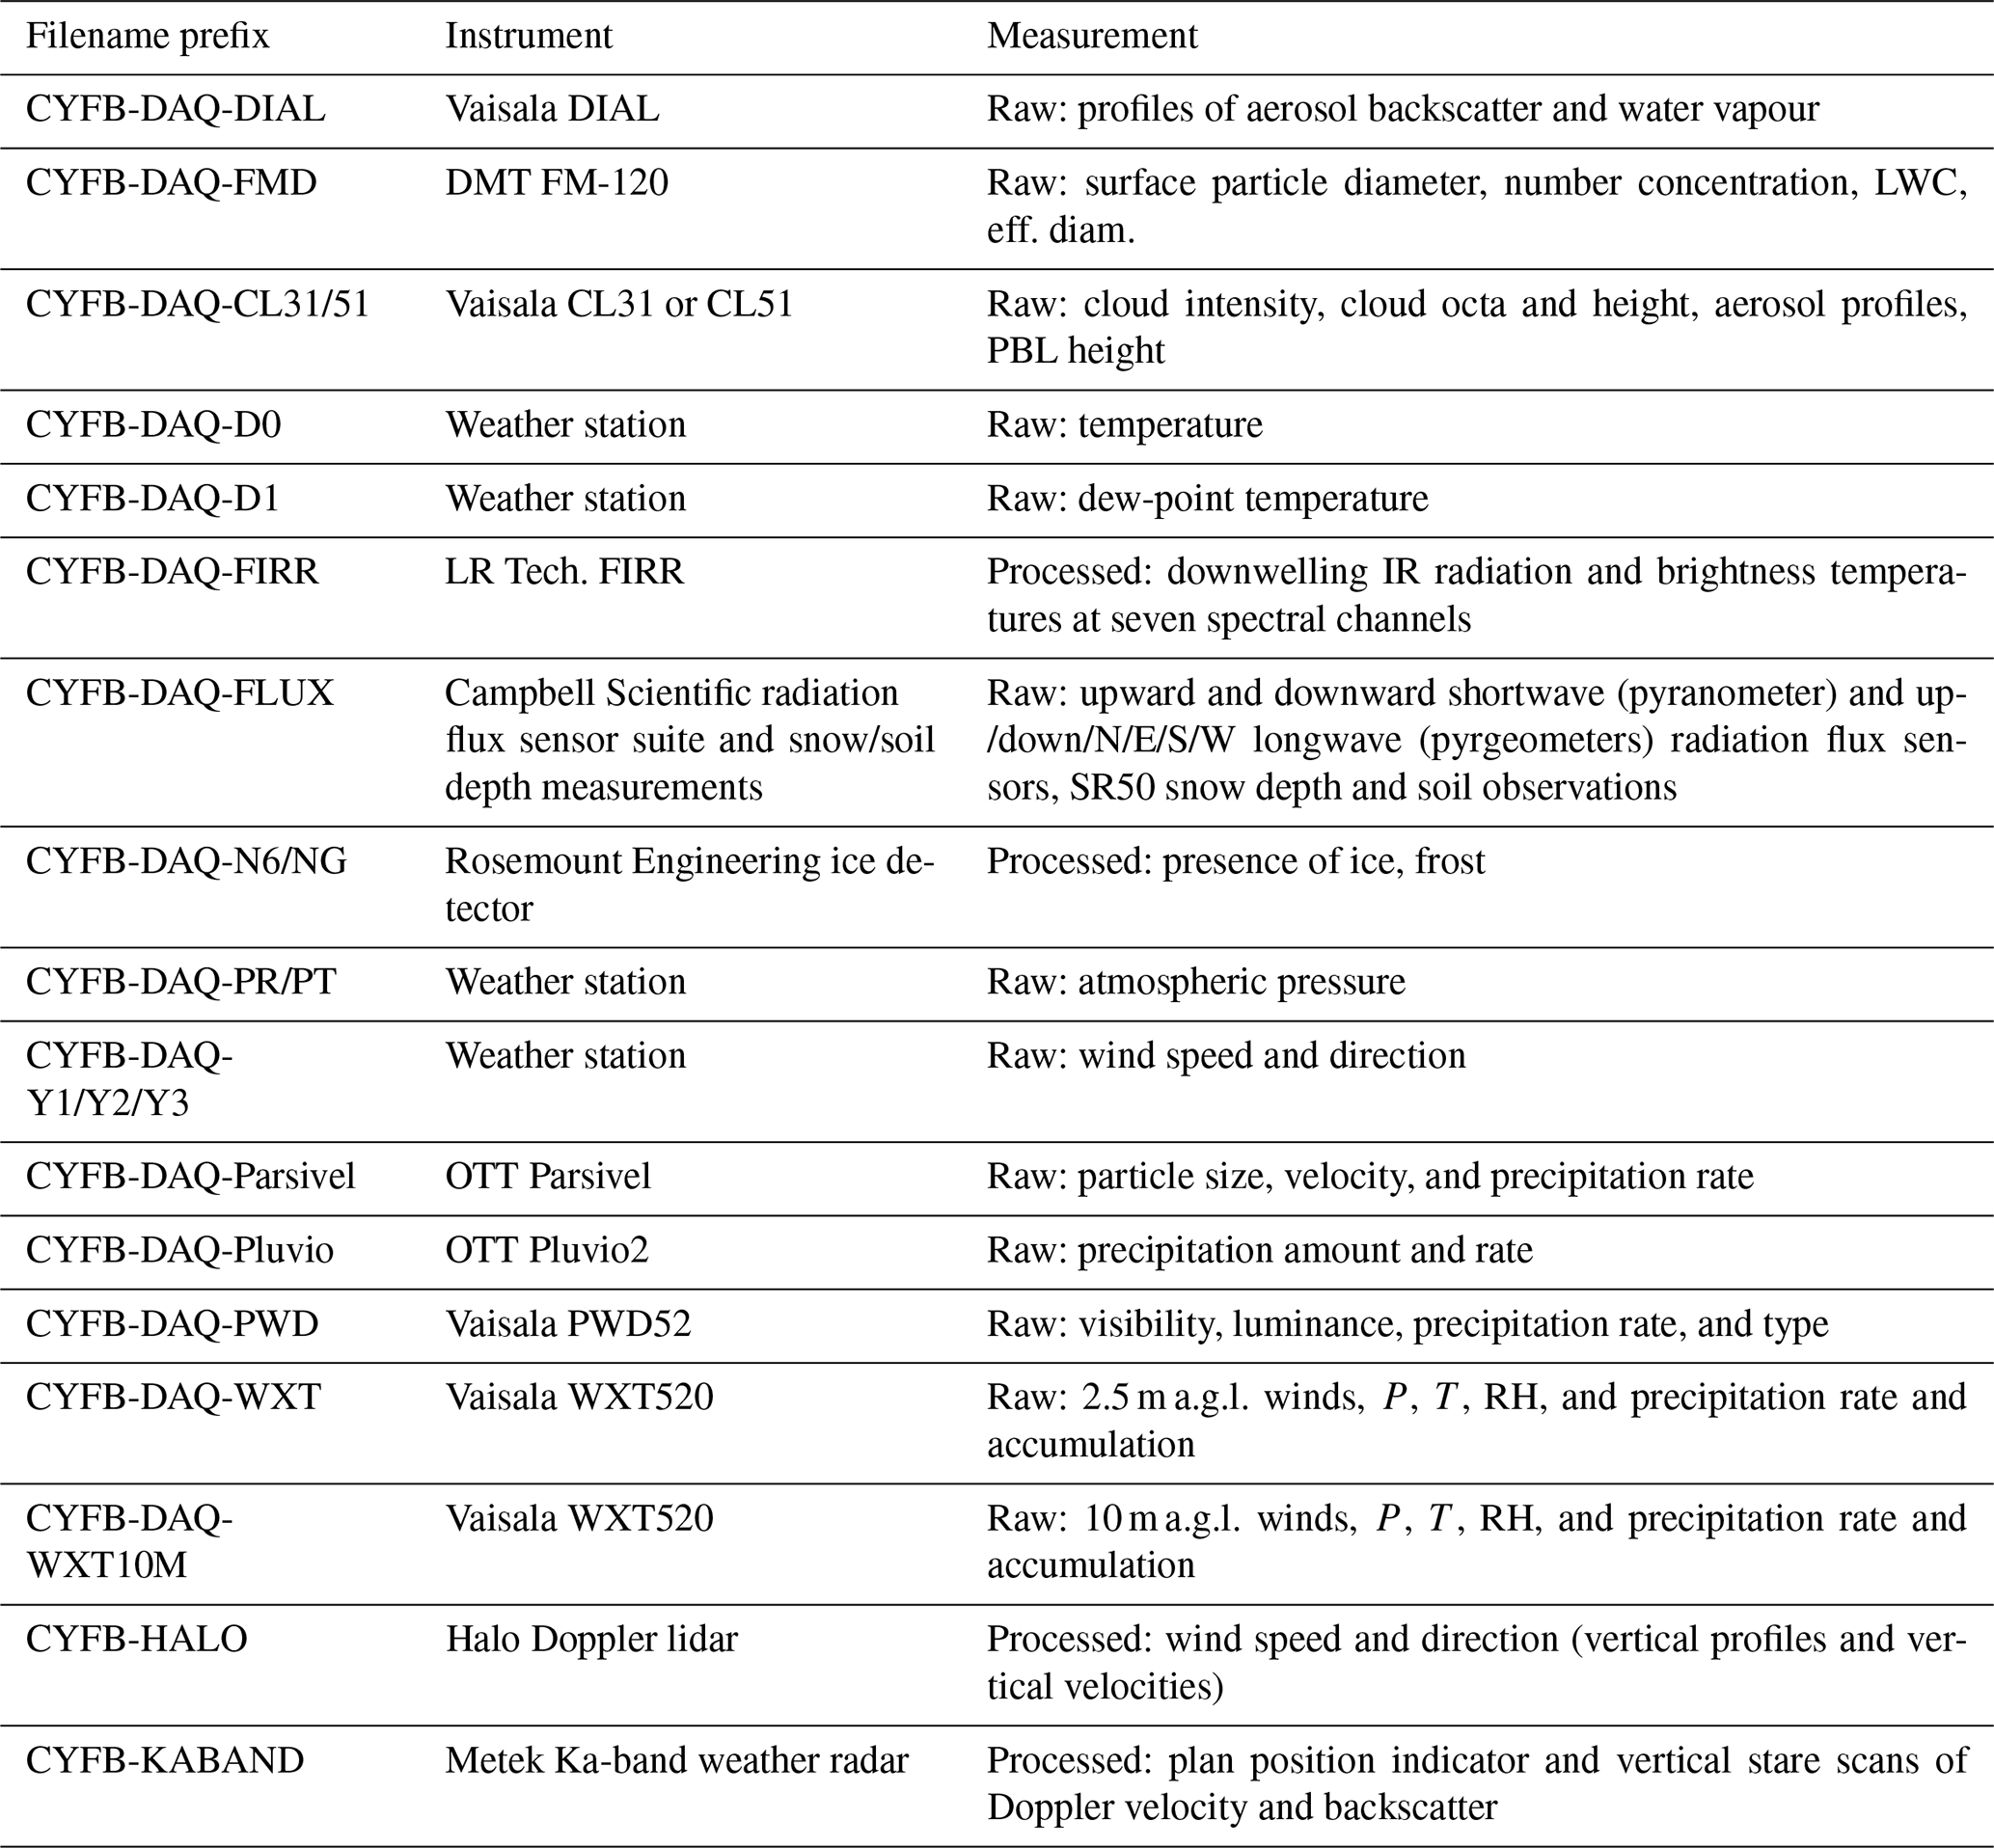
A suite of ground-based remote sensing and in situ instruments was deployed to the Iqaluit supersite over a 3-year period starting in September 2015 as part of the CAWS project. All instruments were fully automated, operated 24/7 without needing an operator at the site, and conducted new meteorological observations of variables not observed by the pre-existing MSC standard surface meteorological observations. Data collection was continuous, except for brief power outages that occurred infrequently (about once a month) at the site or instrument-specific failures that required a remote reboot. All instruments have technical performance ratings suitable for Arctic conditions; as such, they are equipped with heaters, fans, and wiper blades to remove accruing ice/snow. Remote monitoring via 4K cameras also enabled visual confirmation of the absence of snow or ice accumulation (an image archive is available upon request). A complete list of all instruments and their locations is provided in Table 1; images of the site and its instruments are provided in Figs. 2 and 3.
Table 1List of instruments at the Iqaluit supersite, including their technical specifications such as instrument manufacturer, date range of observations, meteorological measurement products, and accuracy (where applicable). Not listed: cameras, MSC standard meteorological surface observations, radiosonde observations, and the WMO C-SPICE precipitation sensor test-field instruments. Variables and accuracies reported in the manufacturer's manual are provided for most instruments. Lidar variables and accuracies are from Mariani et al. (2020a, 2021), and Rosemount accuracies are from Cober et al. (2001). The * denotes an additional instrument of identical design deployed at the T121 ridge site. NA denotes not available.
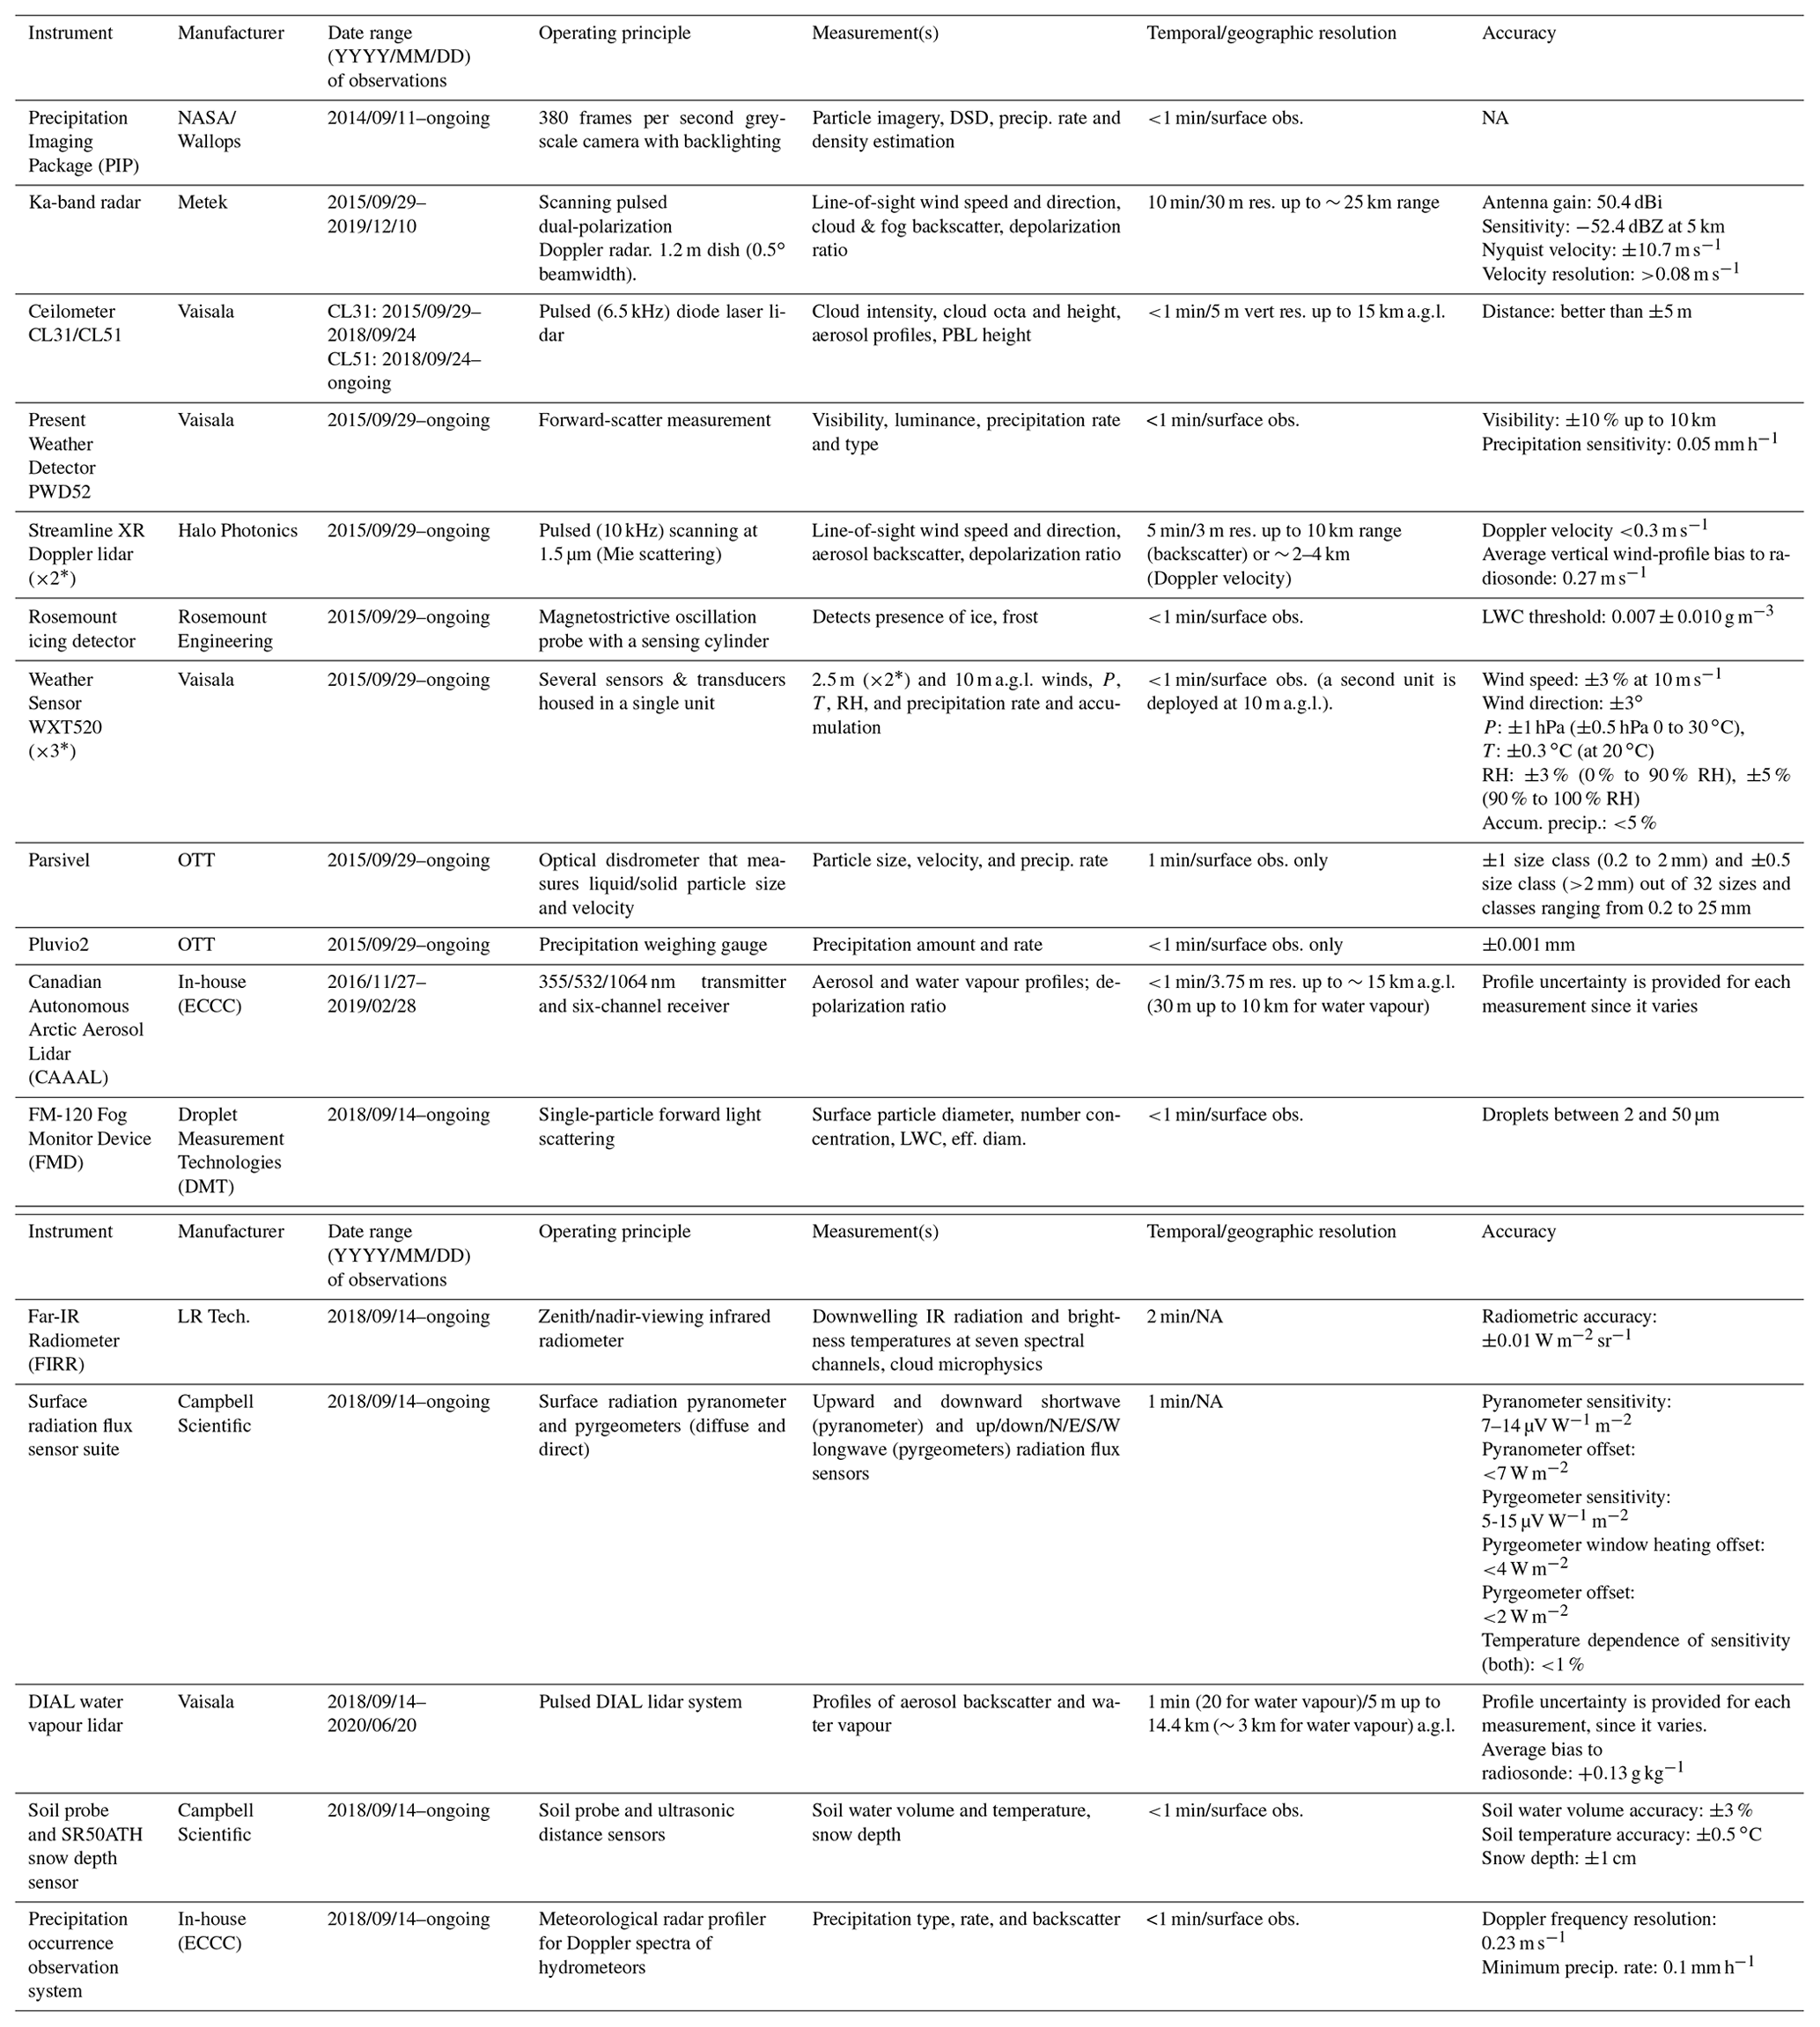
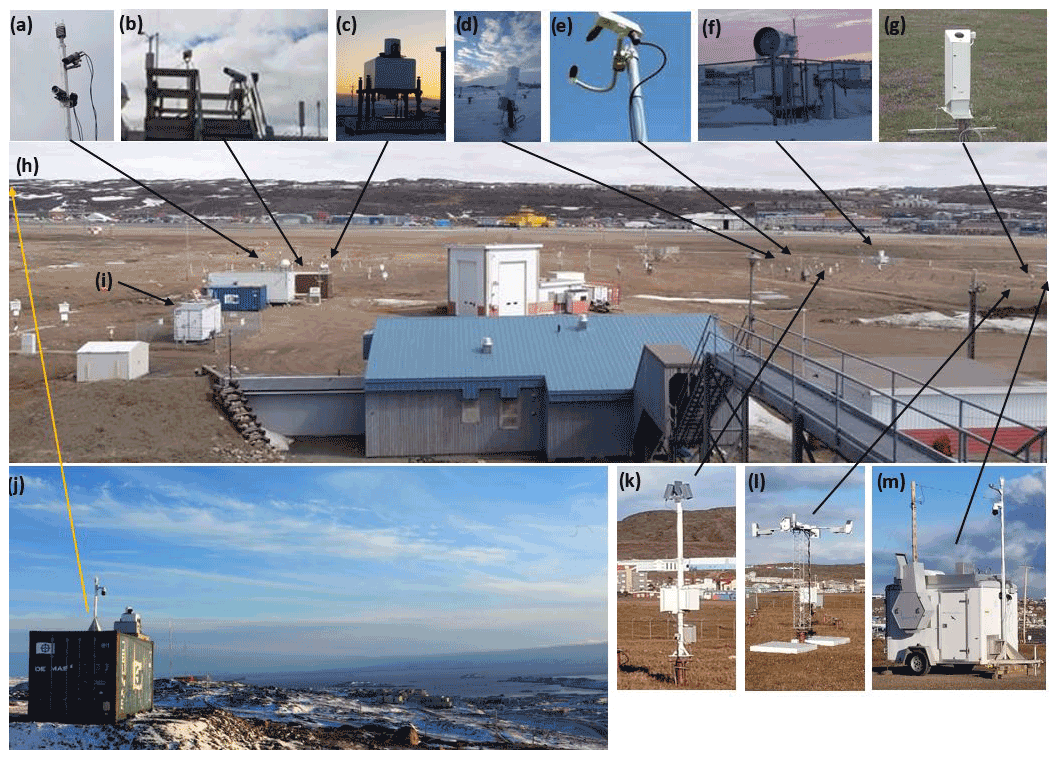
Figure 2The Iqaluit supersite (h) as viewed in September 2017 from behind the main Weather Station Office (looking east from an elevated platform). The white MSC hydrogen building for radiosonde launches is located in the foreground alongside the standard WMO meteorological observation field. The Iqaluit airport (CYFB) is located in the distance, and Frobisher Bay is located to the right (off camera). Most of the CAWS instruments are shown in the insets: (a) WXT520 (top of the mast) with cameras (below), (b) PIP camera and backlight, (c) Doppler lidar, (d) ceilometer, (e) PWD52, (f) Ka-band radar, (g) DIAL, (h) supersite layout, (i) CAAAL trailer, (j) T121 site layout including a WXT520 and Doppler lidar, (k) POSS, (l) a radiation flux sensor suite with soil probes and snow depth sensors, and (m) FIRR (grey instrument) mounted on a trailer. Black arrows indicate each instrument's approximate location; the yellow arrows in panels (h) and (j) indicate the approximate location of T121 atop the nearby ridge as seen from the Iqaluit supersite.
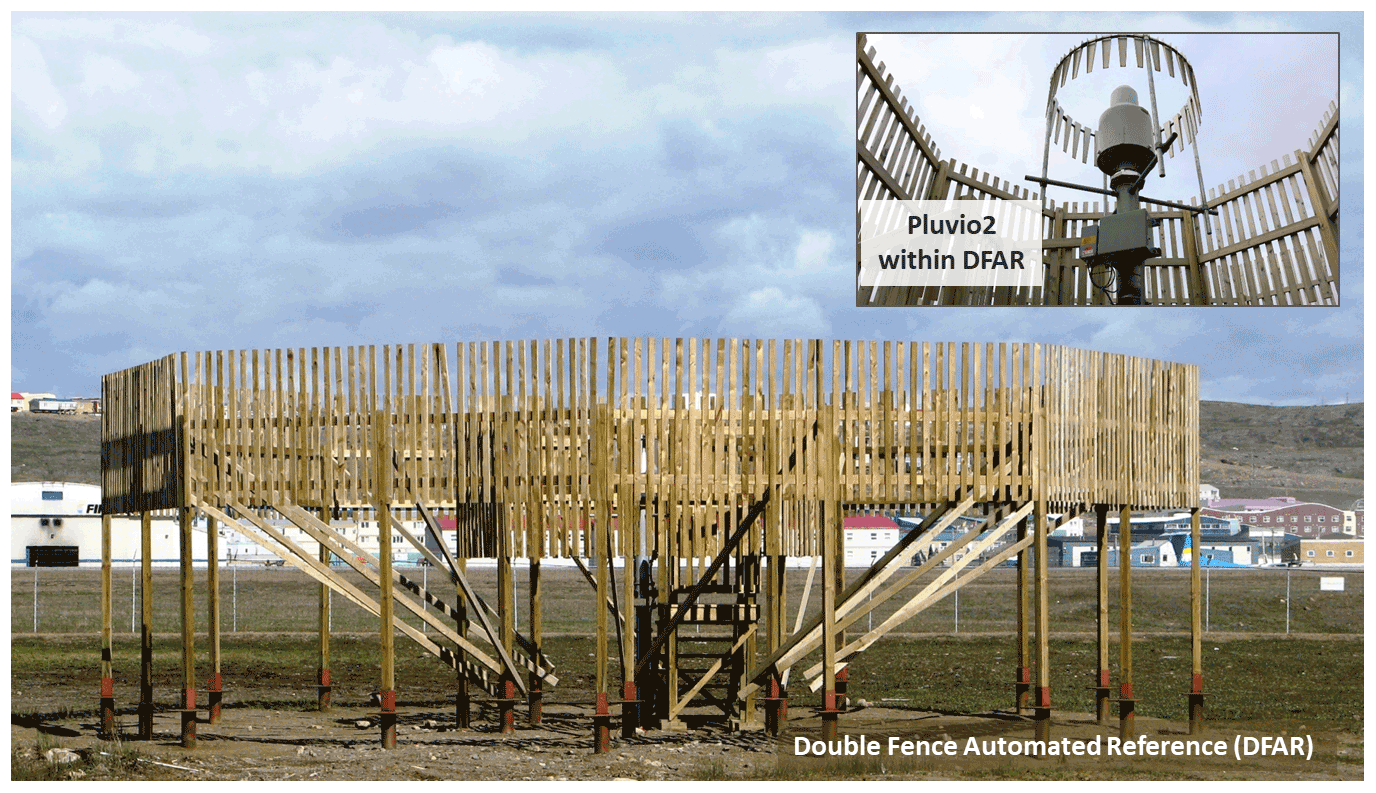
Figure 3Double-fence automated reference (DFAR) configuration at the Iqaluit supersite. Inset: close-up of the single-alter shielded Pluvio2 precipitation gauge (centre) within the inner wooden fence.
Unless stated otherwise, all data files are in standard ASCII text file output formats developed by the instrument manufacturer and are easily readable. Data collection for most instruments is ongoing, though in limited capacity due to issues with travel related to COVID-19. An example of some of the enhanced meteorological observations collected between 2015 and 2021 by the CAWS instruments is provided in Fig. 4; these observations illustrate the large range of different weather conditions observed during the majority of the entire study period.
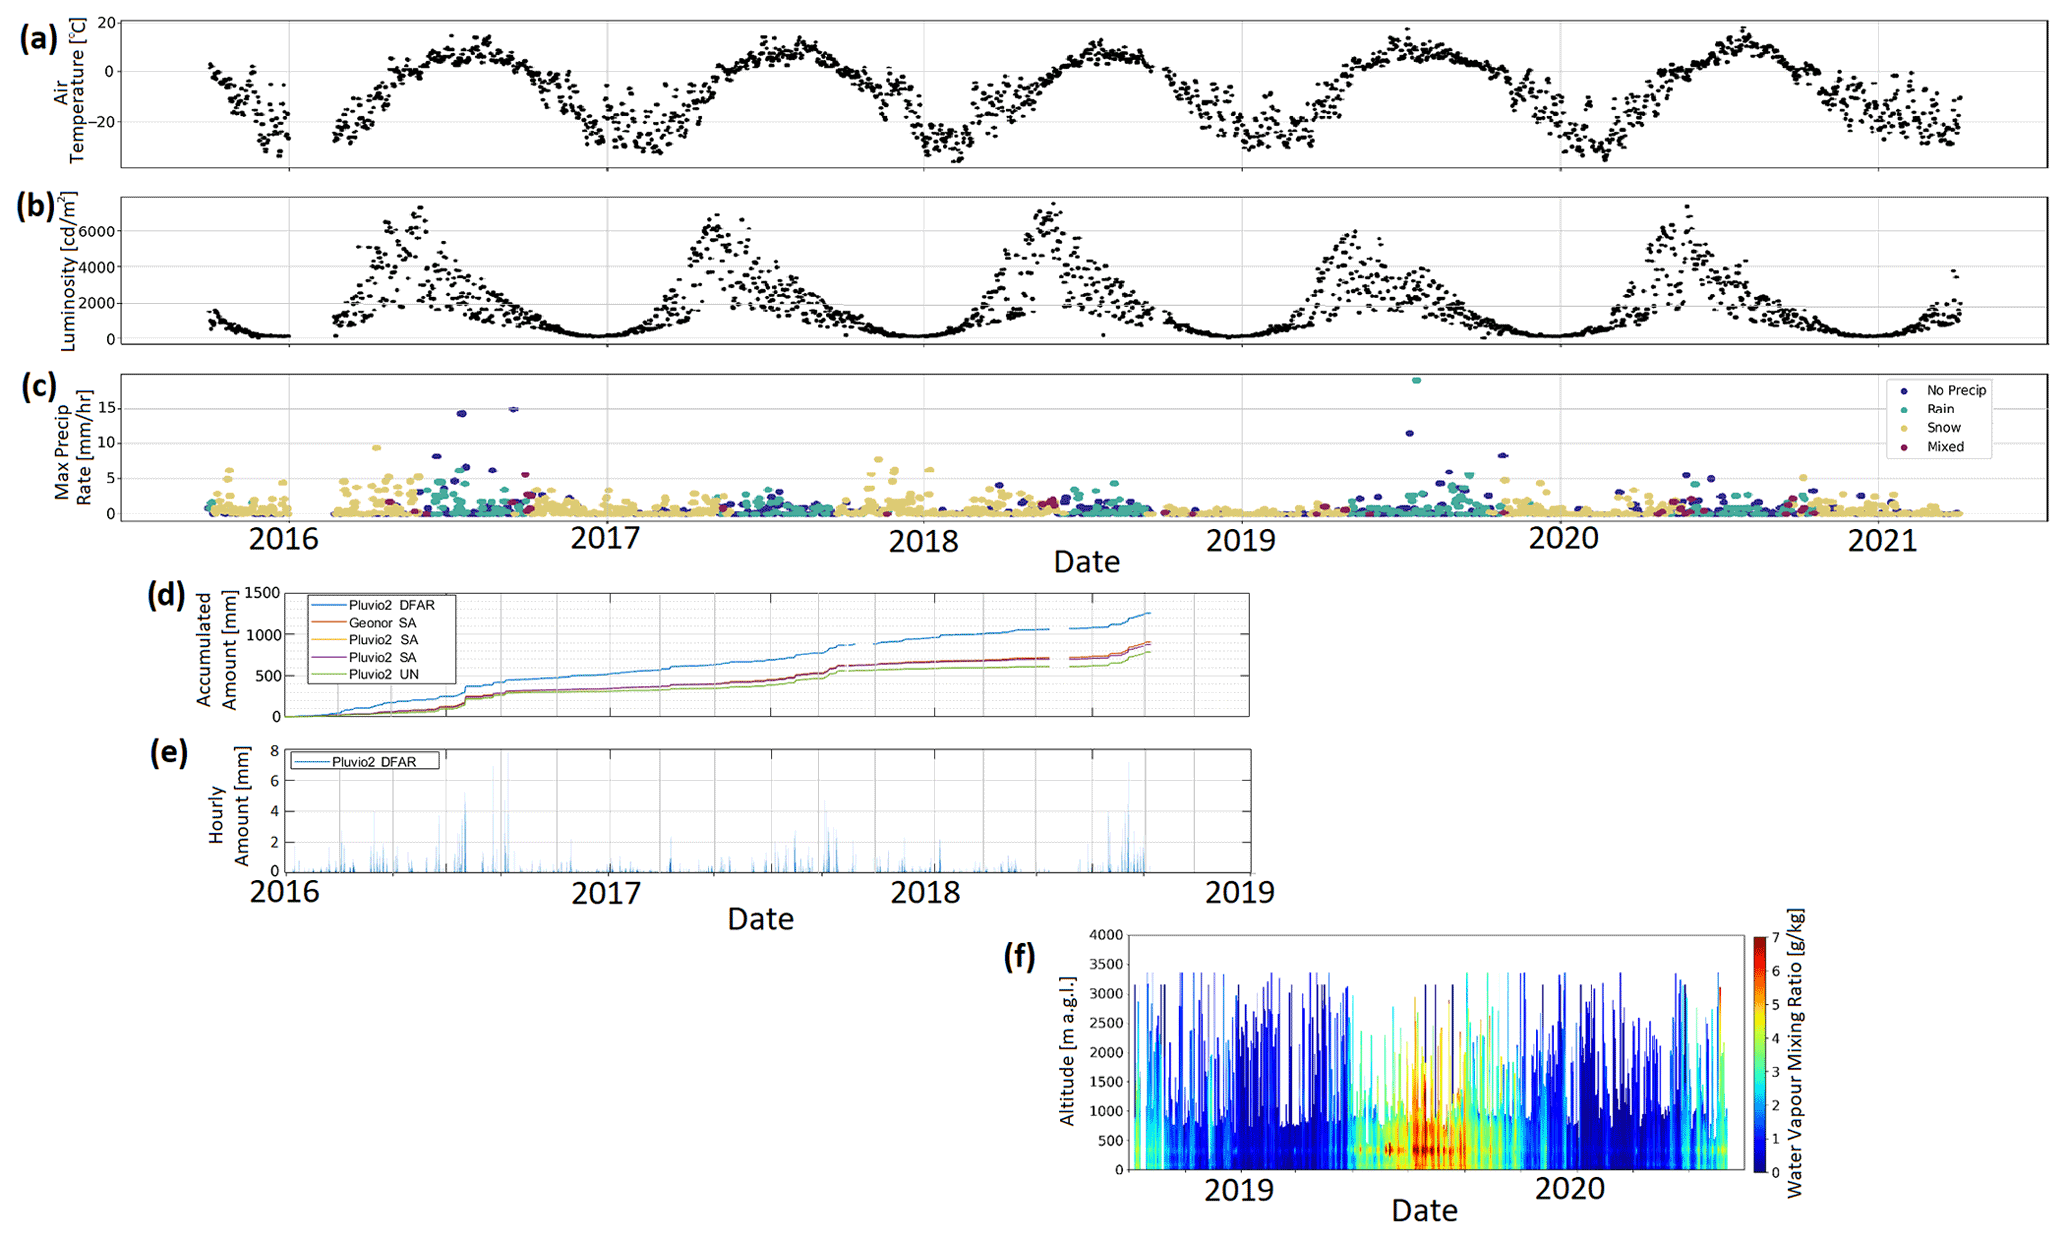
Figure 4Surface meteorological observations conducted at the Iqaluit supersite from 29 September 2015 to 1 April 2021. PWD52 daily averaged air temperature (a), luminosity (b), and daily maximum precipitation rate and type (c) are shown for the entire period. Note that mixed precipitation type represents precipitation that is not rain or snow (e.g., freezing rain, sleet). The C-SPICE's multiple Pluvio2s (DFAR, SA, and UN configurations) and Geonor accumulated precipitation amount (d) and hourly precipitation amount (DFAR Pluvio2 shown only) (e) are shown from 1 January 2016 to September 2018, when the C-SPICE project ended. Daily averaged water vapour mixing ratio profiles observed by the DIAL (f) are shown from the date of its deployment (14 September 2018) until 20 June 2020, when the instrument required maintenance.
A second, smaller site named “T121” is located on the NavCanada property on a ridge on the city's perimeter. The instruments at T121 overlook the airport and rest of the city (Fig. 2). It sits atop a 170 m-high ridge 2.28 km NNE of the main supersite. Since T121 is located above and outside of the valley, the meteorological data collected there provide a context for the synoptic conditions surrounding the city.
3.1.1 Meteorological Service of the Canada Weather Station
The MSC weather station has been in operation at Iqaluit since 1953. The building is managed by the Observing Systems and Engineering Division in MSC and acts as the central hub, connecting all instruments and related infrastructure at the Iqaluit supersite. The weather station conducts WMO-standardized hourly surface meteorological observations of surface temperature, relative humidity, pressure, wind speed and direction, and precipitation (Joe et al., 2020). These surface data are also available in near real time at weather.gc.ca. Vaisala RS92 (Vaisala, 2007) and, after 2018, GRAW DFM-09 (GRAW, 2020) radiosondes were launched by an MSC operator twice a day (00:00 and 12:00 Coordinated Universal Time – UTC) as per WMO guidelines at the Iqaluit weather station (WMO station code 71909). Radiosondes provide highly accurate vertical profile observations of atmospheric temperature, relative humidity, pressure, wind speed and direction, and other parameters up to ∼ 40 km a.g.l. Meteorological Reports (METAR) were given at the Iqaluit airport every hour and occasionally in between hours when conditions warranted a special (manual) report; they provide additional meteorological information, including weather type, cloud amount, and cloud height in three layers.
3.1.2 Surface visibility and precipitation type
Two Vaisala PWD52 present weather detectors were deployed: one at the Iqaluit supersite and the other at the T121 site. The instruments were operated continuously with limited data gaps. They provide observations of visibility, precipitation rate and type, and luminescence. Data were output in Vaisala's Data Message 7 format (see user manual). Forward-scatter present weather detectors are ideally suited for observing Arctic conditions as they have greater sensitivity and respond to light precipitation conditions better than unshielded weighing gauges. Their sensitivities and applications are also well characterized (Barthazy and Schefold, 2006; Battaglia et al., 2010; Liu et al., 2013; Tokay et al., 2014; Zhang et al., 2015; Gultepe et al., 2016, 2017). While these instruments have enabled more accurate estimates of light precipitation (see Table 1, “accuracy”), they are inherently limited to point measurements.
The PWD52 (and FS11P used in Whitehorse) meet Federal Aviation Administration and International Civil Aviation Organization specifications. Precipitation type and intensity are estimated based on an optical principle via the attenuation of a laser beam by falling particles. The precipitation type can be estimated by using empirical relationships between the observed diameter and fall speed of the particles (Gunn and Kinzer, 1949). Default settings for the precipitation intensity limits define the light (<2 mm h−1), moderate (2–8 mm h−1), and heavy (>8 mm h−1) precipitation flags reported in the data (different thresholds are used for snow). The precipitation classification algorithm is proprietary to the manufacturer (Vaisala) and was used without modification.
3.1.3 Precipitation
A shielded OTT Pluvio2 weighing gauge provides surface measurements of precipitation amount and intensity (mm). It operated continuously with limited data gaps. These instruments are commonly used in various climates and have become an established and reliable measurement platform (Milewska et al., 2019; Smith et al., 2022). No adjustment for wind undercatch of solid precipitation was performed; as such, this dataset should be used with caution.
An optical disdrometer, the OTT Parsivel, provides surface measurements of hydrometeors, including particle size, velocity, and precipitation rate. It operated continuously with limited data gaps. Observations from the Parsivel have been processed to estimate the precipitation type, intensity, and kinetic energy (Battaglia et al., 2010; Tokay et al., 2014). The instrument uses a transmitter and receiver separated by a small distance to remotely measure the properties of hydrometeors falling in between the two sensors.
3.1.4 Particle Imaging Package
The Particle Imaging Package (PIP) is a video disdrometer designed and built by NASA. It consists of a high-speed video camera (380 frames s−1) with a 640 × 480-pixel charge-coupled device image sensor. It operated continuously with limited data gaps. This camera is aimed at a bright (150 W) halogen lamp 2 m away, resulting in an image resolution of ∼ 0.1 mm × 0.1 mm. The PIP setup is unique in that precipitation particles are unimpeded by the instrument itself. Hydrometeor shadows are recorded as they fall through the observation volume; this enables observations of particle imagery used to calculate particle size distributions (PSDs), fall speed estimates, droplet size distributions (DSDs), precipitation rate, and density estimates continuously with 1 min resolution (Newman et al., 2009; Tiira et al., 2016; von Lerber et al., 2018; Pettersen et al., 2020, 2021).
3.1.5 Radiation flux sensor suite
Short and longwave radiation flux sensors were deployed to the Iqaluit supersite to characterize the radiative budget at the site. It was installed in September 2018 and operated continuously from that point onwards with limited data gaps. The flux sensor suite consists of a 4 m mast with a sensor cross arm attached near the top. The ends of the cross-arm point in the four cardinal directions (N, E, S, W). Two Kipp & Zonen CMP10 pyranometers (facing up and down) and six CGR4 pyrgeometers (facing up, down, and horizontally in the N, E, S, and W directions) were installed on the mast's cross arms to provide measurements of short and longwave radiation, respectively. The horizontal longwave sensors are a unique feature of the flux sensor suite; they are used to investigate horizontal longwave radiation fluxes at the site due to surrounding buildings and topography. All sensors were equipped with CVF4 ventilation units to prevent fog/frost forming on the sensor's dome, improving data quality and reliability. All sensors were tested in an environmental chamber for extreme cold in March 2018 at the ECCC Downsview Lab before being deployed to Iqaluit to ensure the units could perform nominally during the harsh climate in the Canadian Arctic. Despite this, the observations should be treated with caution since the absence of ice/frost/snow on the radiometer's dome was not verified for every observation as it was in Cox et al. (2021). A Campbell Scientific CR1000X data logger and CMD-A108 eight-channel analogue input module were used to record data.
In addition to the radiation fluxes, two Campbell Scientific SR50ATH snow depth sensors and a CS655 soil water content reflectometer with a soil temperature sensor were also installed. They provide observations of snow depth, soil moisture, and soil temperature below the flux sensor suite to further help characterize the site's radiative budget. Two flat calibration target pads were installed under each SR50ATH to ensure snow depth measurements were calibrated and recorded on a standardized surface. Finally, a Rosemount icing detector provides an indication of icing conditions (i.e., the presence of super-cooled water and an estimate of its quantity). It consists of a piezoelectric sensor that detects changes in its natural vibration frequency due to ice buildup. As such, it is useful for determining whether ice and/or frost formed on/near the surface.
3.1.6 Far-Infrared Radiometer
The Far-Infrared Radiometer (FIRR) measures the downwelling longwave far-infrared radiation emitted by the atmosphere using newly developed microbolometer technology. The Iqaluit FIRR is a second-generation infrared radiometer developed by LR Tech Inc. based on its earlier version (Libois et al., 2016; Libois and Blanchet, 2017). It was installed in September 2018 and operated continuously from that point onwards, with the exception of several data outages (at times lasting a couple of months) due to issues with the instrument's viewing hatch. Measurements are taken continuously and autonomously, except during precipitation, when the hatch is closed to prevent damage to the optics, every 47 s using seven optical filters: 7.9–9.5, 10–12, 17–18.5, 17.25–19.75, 18.5–20.5, 20.5–22.5, and 22.5–27.5 µm. Due to the strong variation in emissivity between small and large ice crystals in this spectral region, the FIRR bands are sensitive to cloud phases, optical thicknesses, and microphysical properties. The bands with a wavelength >17 µm are also very sensitive to small variations in atmospheric water vapour. Detector linearity and radiometric accuracy tests performed at LR Tech and again in the field at Iqaluit confirmed the instrument's accuracy and precision of <0.1 % and ±0.01 W m−2 sr−1.
Each day, the FIRR produces a series of .EEF files totalling 13.8 GB d−1. These files are only readable by the licensed EDGAR software (LR Tech Inc.) and contain all unprocessed raw data elements, including housekeeping data. From the .EEF files, EDGAR produces a netCDF file once per day at the end of each day of approximately 1 MB in size containing only essential, processed data (radiance values).
3.1.7 FM-120 Fog Monitor Device
The Droplet Measurement Technologies (DMT) FM-120 Fog Monitor Device (FMD) provides continuous and autonomous in situ observations of PSDs between 2 and 50 µm. It was installed in September 2018 and operated continuously from that point onwards with limited data gaps. By processing the PSD observations, the number concentration, liquid water content, fog intensity, water vapour, and extinction/visibility observations at the surface can be retrieved. As such, its observations are crucial for detecting and understanding the evolution of fog microphysical processes (Gultepe et al., 2017).
3.1.8 Precipitation occurrence sensor system
The precipitation occurrence sensor system (POSS) is a bistatic X-band Doppler radar designed in-house by ECCC (Sheppard and Joe, 2008; Sheppard et al., 2021). It was installed in September 2018 and operated continuously from that point onwards with limited data gaps. It measures a signal whose frequency is proportional to the raindrop Doppler velocity and whose amplitude is proportional to the raindrop diameter. This provides autonomous and continuous measurements of the precipitation type, rate, raindrop size distribution, and reflectivity. Such high temporal resolution measurements of precipitation are particularly useful for a variety of applications ranging from nowcasting to long-term climatological studies.
3.1.9 Ceilometer
The Vaisala CL31 and CL51 ceilometers are lidar instruments that provide aerosol backscatter profile observations to retrieve cloud information, such as cloud height, cloud amount (octa, intensity), and aerosol layers, up to a range of 15 km a.g.l. A Vaisala CL31 was initially installed at the supersite until 24 September 2018; the unit was swapped out for the higher-powered Vaisala CL51 model (operating from 24 September 2018 to present). The ceilometers were operated at 5 m vertical resolution and output data in Vaisala's Data Message 2 format (see user manual). Estimates of the PBL height (or mixing layer height) were retrieved from the ceilometer's aerosol backscatter observations using algorithms developed in-house based on existing methodologies (e.g., Kotthaus et al., 2020).
3.1.10 Doppler lidar
Two identical scanning Halo Photonics Inc. StreamLine XR Doppler lidars were deployed to Iqaluit, one at the main supersite (operated continuously with limited data gaps) and one at T121 (operated continuously from 29 August 2016 onwards but encountering several data outages lasting hours to weeks due to loss of power at T121). The lidars provide accurate observations of aerosol backscatter, depolarization ratio, Doppler velocity at high temporal and spatial resolutions along the lidar's beam (radial direction), as well as vertical wind profile observations. While they can scan in all directions like a weather radar, their observations are limited to the PBL. Their ability to perform rapid scans enables them to observe fast-evolving meteorological features, such as lake breezes, stratified wind layers, low-level jets, and cloud microphysical properties (e.g., Mariani et al., 2018a, b; Thériault et al., 2021).
Both lidars operated using the same configuration settings and scan strategies as outlined in Mariani et al. (2020a). Vertical staring, over-the-top north–south/east–west/up-valley (135∘ azimuth) range–height indicator (RHI), plan position indicator (PPI) (4∘ elevation), Doppler beam swinging, and eight-beam velocity–azimuth display (VAD) vertical wind profile scans were repeated in a 10 min cycle. The retrieved wind profiles are highly accurate, comparable to radiosonde observations (see Table 1, “accuracy”) based on inter-comparison studies (Mariani et al., 2020a). A single raw .hpl file was generated for each scan; each file contains all metadata and measurements during that scan, including scan position (azimuth/elevation), aerosol backscatter, signal-to-noise ratio, intensity, and Doppler velocity for each range gate. These raw .hpl files were quality-controlled and post-processed to produce final wind measurement products (e.g., vertical wind profile) output in standard ASCII files (Mariani et al., 2018a).
3.1.11 Differential absorption lidar (DIAL) and Raman water vapour lidars
The Vaisala pre-production broadband DIAL was the first commercial system capable of performing continuous (night and day) observations of the vertical water vapour mass mixing ratio profile. Its design includes two vertically pointing measurement units placed side by side, contained within a larger shelter, with a Vaisala CL-series ceilometer-type telescope (Dabberdt et al., 2016; Roininen et al., 2017). The DIAL underwent initial testing in Helsinki and Toronto before being deployed to Iqaluit (Mariani et al., 2020b). It was installed in September 2018 and operated continuously from that point onwards with limited data gaps, except for a large gap after 20 June 2020, when the instrument required maintenance. This new system and its predecessor were extensively evaluated in different climates and demonstrated excellent agreement with independent water vapour profile observations from co-located radiosondes, radiometers, UAVs, and Raman lidars (Newsom et al., 2020; Mariani et al., 2021; Gaffard et al., 2021).
Water vapour profiles were generated using a 20 min running average up to 3 km a.g.l. (maximum range) output to an ASCII file every minute. Aerosol backscatter profiles were collected every minute up to 14.4 km a.g.l. and output to a separate ASCII file. Estimates of the uncertainty in the water vapour profile and maximum effective range are provided by the DIAL's quality control algorithm (Newsom et al., 2020). The DIAL's unique 24 h continuous water vapour observations enable detailed model inter-comparison studies and measurements of height-resolved diurnal water vapour cycles (Hicks-Jalali et al., 2021). The DIAL stopped collecting observations on 20 June 2020 in order to perform repairs; it will be redeployed to the Toronto area.
A second water vapour lidar, the Canadian Autonomous Arctic Aerosol Lidar (CAAAL), was installed at the Iqaluit supersite. This Raman lidar conducts measurements of the vertical structure of particulate matter, except during precipitation, up to 15 km a.g.l. (Strawbridge, 2013; Strawbridge et al., 2018). The lidar was housed in a trailer and was designed and built in-house by ECCC. The lidar conducted simultaneous measurements of aerosol profiles at three wavelengths, including particle size and shape, depolarization ratio measurements at 355 nm, and nighttime water vapour mixing ratio measurements using Raman scattering signals at 387 and 407 nm. Its water vapour mixing ratio observations were routinely calibrated using the radiosonde observations at Iqaluit. The CAAAL was redeployed to southern Canada and ended operations at Iqaluit on 28 February 2019. Note that the raw CAAAL data are not available on the CAWS archive but can be accessed via coralnet.ca (a password-encoded website that can be accessed by sending a request to kevin.strawbridge@ec.gc.ca).
3.1.12 Ka-band radar
A Metek Doppler Ka-band weather radar (Bauer-Pfundstein, 2007; Görsdorf et al., 2015) provides observations of Doppler velocity, backscatter, and depolarization ratio observations at the Iqaluit site. The scanning radar operates at 35.1 GHz using a 30 kW magnetron with a pulse width of 2.0 µs, a pulse repetition frequency of 5 kHz, and a range resolution of 30 m to a maximum range of 25 km. It was configured to repeat VAD vertical wind profile scans along with several low-elevation PPI and over-the-top RHI scans every 10 min, similar to the Doppler lidars. The radar's rapid scan rate enables observation of fast-moving meteorological features such as stratified wind layers, and its high sensitivity to light precipitation complements observations from the Doppler lidar (Mariani et al., 2018b). During the study period, the radar operated continuously, except for when it experienced several outages caused by inclement weather, resulting in a substantial downtime of nearly 50 %. Some of these outages lasted several months before repairs could be performed. As such, its available dataset is limited compared to the other instruments at Iqaluit.
3.1.13 WXT520 weather sensor
Three Vaisala WXT520 weather sensors were deployed at Iqaluit: two at the main supersite (one co-located with the FIRR instrument and one at the top of a 10 m tower near the Doppler lidar) and one beside the Doppler lidar at the T121 site. They all operated continuously with limited data gaps, except for the one located at T121, which encountered longer downtime periods due to power outages at T121. Each instrument contains a suite of sensors that conduct in situ measurements of atmospheric temperature, relative humidity, pressure, wind speed and direction, and precipitation rate (Vaisala, 2012). Data were collected at 1 min resolution.
3.1.14 Other observations
Additional measurements of precipitation have been conducted at the Iqaluit supersite as part of the WMO's Solid Precipitation Inter-Comparison Experiment (SPICE) and Canadian SPICE (C-SPICE) projects since 2013 (Nitu et al., 2018). The reference configuration used in WMO-SPICE for the measurement of snowfall was the double-fence automated reference (DFAR), as shown in Fig. 3. It was designed and characterized for this inter-comparison and employs a suite of instruments, including an automated precipitation gauge (either a Geonor T-200B3 or an OTT Pluvio2) in a single-alter shield, surrounded by a large octagonal double fence. The DFAR reference measurement incorporates precipitation amount, precipitation occurrence (yes or no) and type (where available) from a sensitive precipitation detector, and environmental conditions such as wind speed and temperature; the reference dataset is therefore a composite dataset from multiple instruments. Additional automatic gauges deployed near the DFAR include a single-alter (SA) shielded Geonor weighing gauge (600 mm), unshielded (UN) and SA shielded Pluvio2 weighing gauges (1500 mm), and a Thies Laser Precipitation Monitor (LPM) present weather sensor (not shown in Fig. 3). This suite of instruments belongs to and is maintained by MSC's Observing Systems and Engineering Section (OSE). Data quality processing of the 6 s Geonor and Pluvio weighing gauges includes time formatting, the application of maximum, minimum, and data jump filters, manual quality control of the aggregated 1 min data, and a neutral aggregating filter (Ross et al., 2020). The quality-controlled observations enable detailed study of low snow, cold temperature, high wind, and blowing snow conditions. Observations are available up until September 2018, when the C-SPICE project ended.
Other observations conducted at the supersite include camera images, aerosol optical depth, and Global Positioning System (GPS) integrated water vapour (IWV). All-sky and 4K pan-tilt camera images were taken every 10 min at the site from three vantage points, including multiple sky and cardinal direction views. These images help verify weather conditions at the site and also acted as means to visually check the instruments remotely (e.g., confirm the absence of ice/snow on optics or domes). An aerosol robotic network (AERONET) Cimel sun photometer measured aerosol optical and columnar microphysical properties. Its data are not part of the CAWS archive but are openly available via https://aeronet.gsfc.nasa.gov/ (last access: 2 November 2022). The Iqaluit ground-based GPS receiver is managed by National Resources Canada and the International GNSS Service (IGS). The station was installed in 2009 and has been operating continuously since, with less than 2 % downtime. The IGS provides IWV and other products at 5 min resolution, daily, in ASCII format (Jones et al., 2020). Its data are not available as part of this CAWS archive but are openly accessible via http://geodesy.unr.edu/ (last access: 2 November 2022) (Blewitt et al., 2018).
3.2 Whitehorse supersite instrumentation
A similar but smaller suite of ground-based instruments was deployed to the Whitehorse supersite in 2017 as part of the CAWS project. All instruments were fully automated and operated continuously without an operator at the site. Most of the geophysical variables observed at the supersite were unique for the region and not observed by the MSC weather station 2.9 km away. Data collection was continuous, except for brief power outages when airport runway maintenance was required (seasonal). A complete list of all instruments and their locations is provided in Table 2; photos of the site and its instruments are provided in Fig. 5. An example of some of the enhanced surface meteorological observations collected from 2018 to 2022 (almost its entire study period) is provided in Fig. 6. Due to a planned expansion of the Whitehorse airport facility, the site was decommissioned in June 2022.
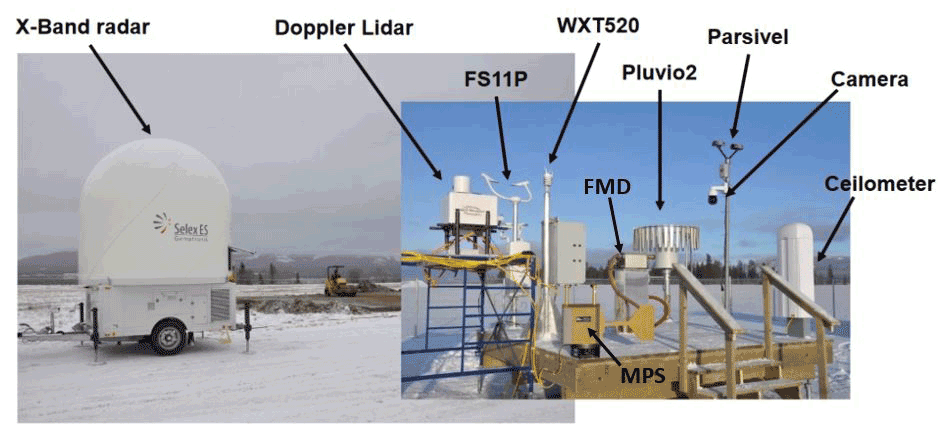
Figure 5The Whitehorse supersite instrument platform and X-band radar (∼ 10 m away) as viewed on 12 December 2017. Images were taken facing NE, with the CYXY Whitehorse airport runway behind the photographer. All instruments are labelled.
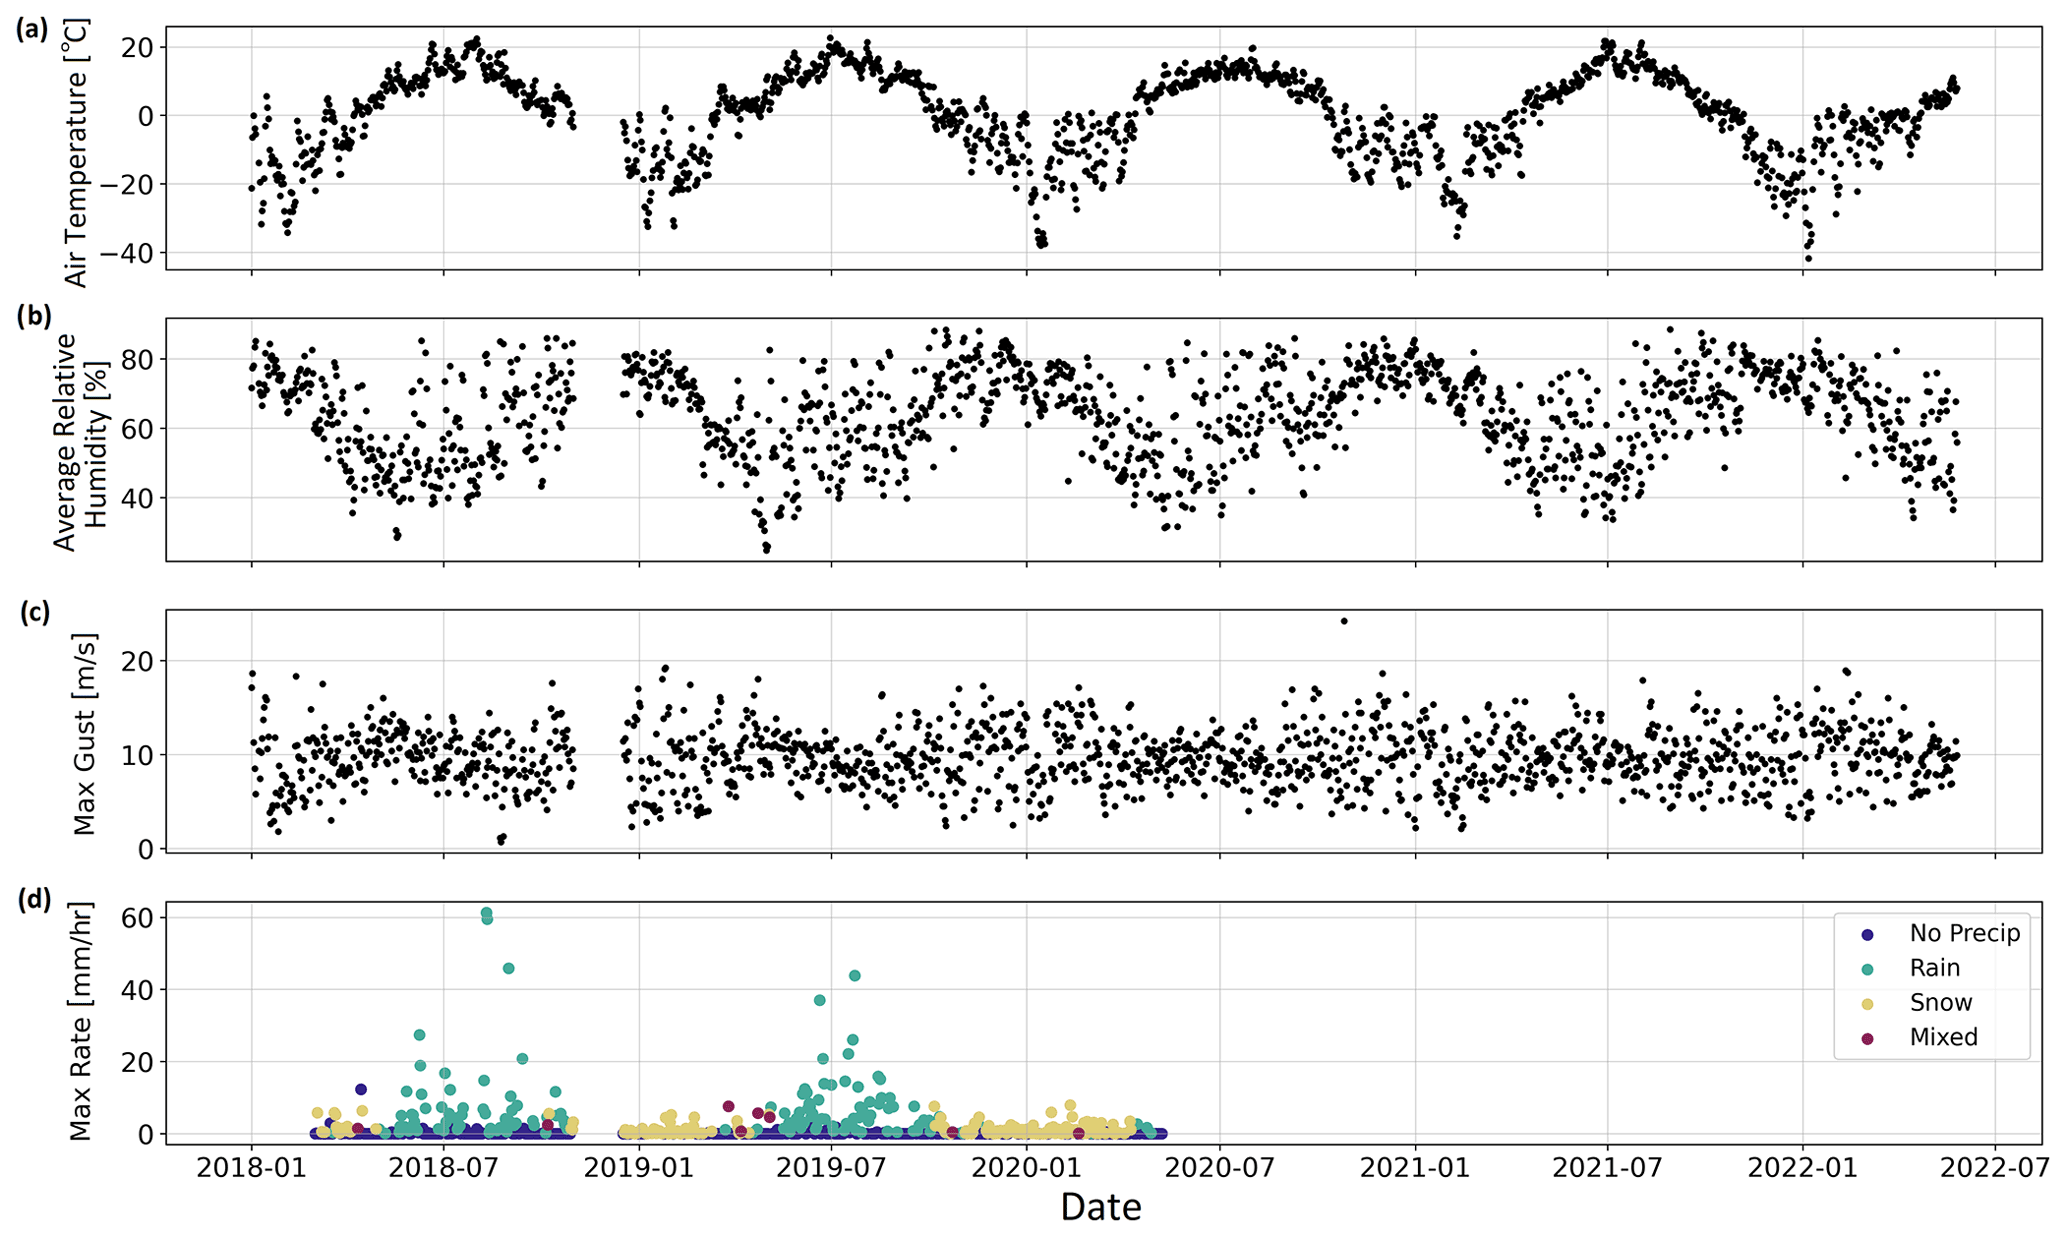
Figure 6Surface meteorological observations conducted at the Whitehorse supersite during almost the entire study period (1 January 2018 to 1 June 2022). WXT520 daily averaged surface air temperature (a), relative humidity (b), and daily maximum wind speed (c) are shown. The daily maximum precipitation rate and type (d) were provided by the FS11P, which did not start recording data until February 2018 and experienced a laser failure in June 2020. The gap in observations in November 2018 was due to a power outage at the site.
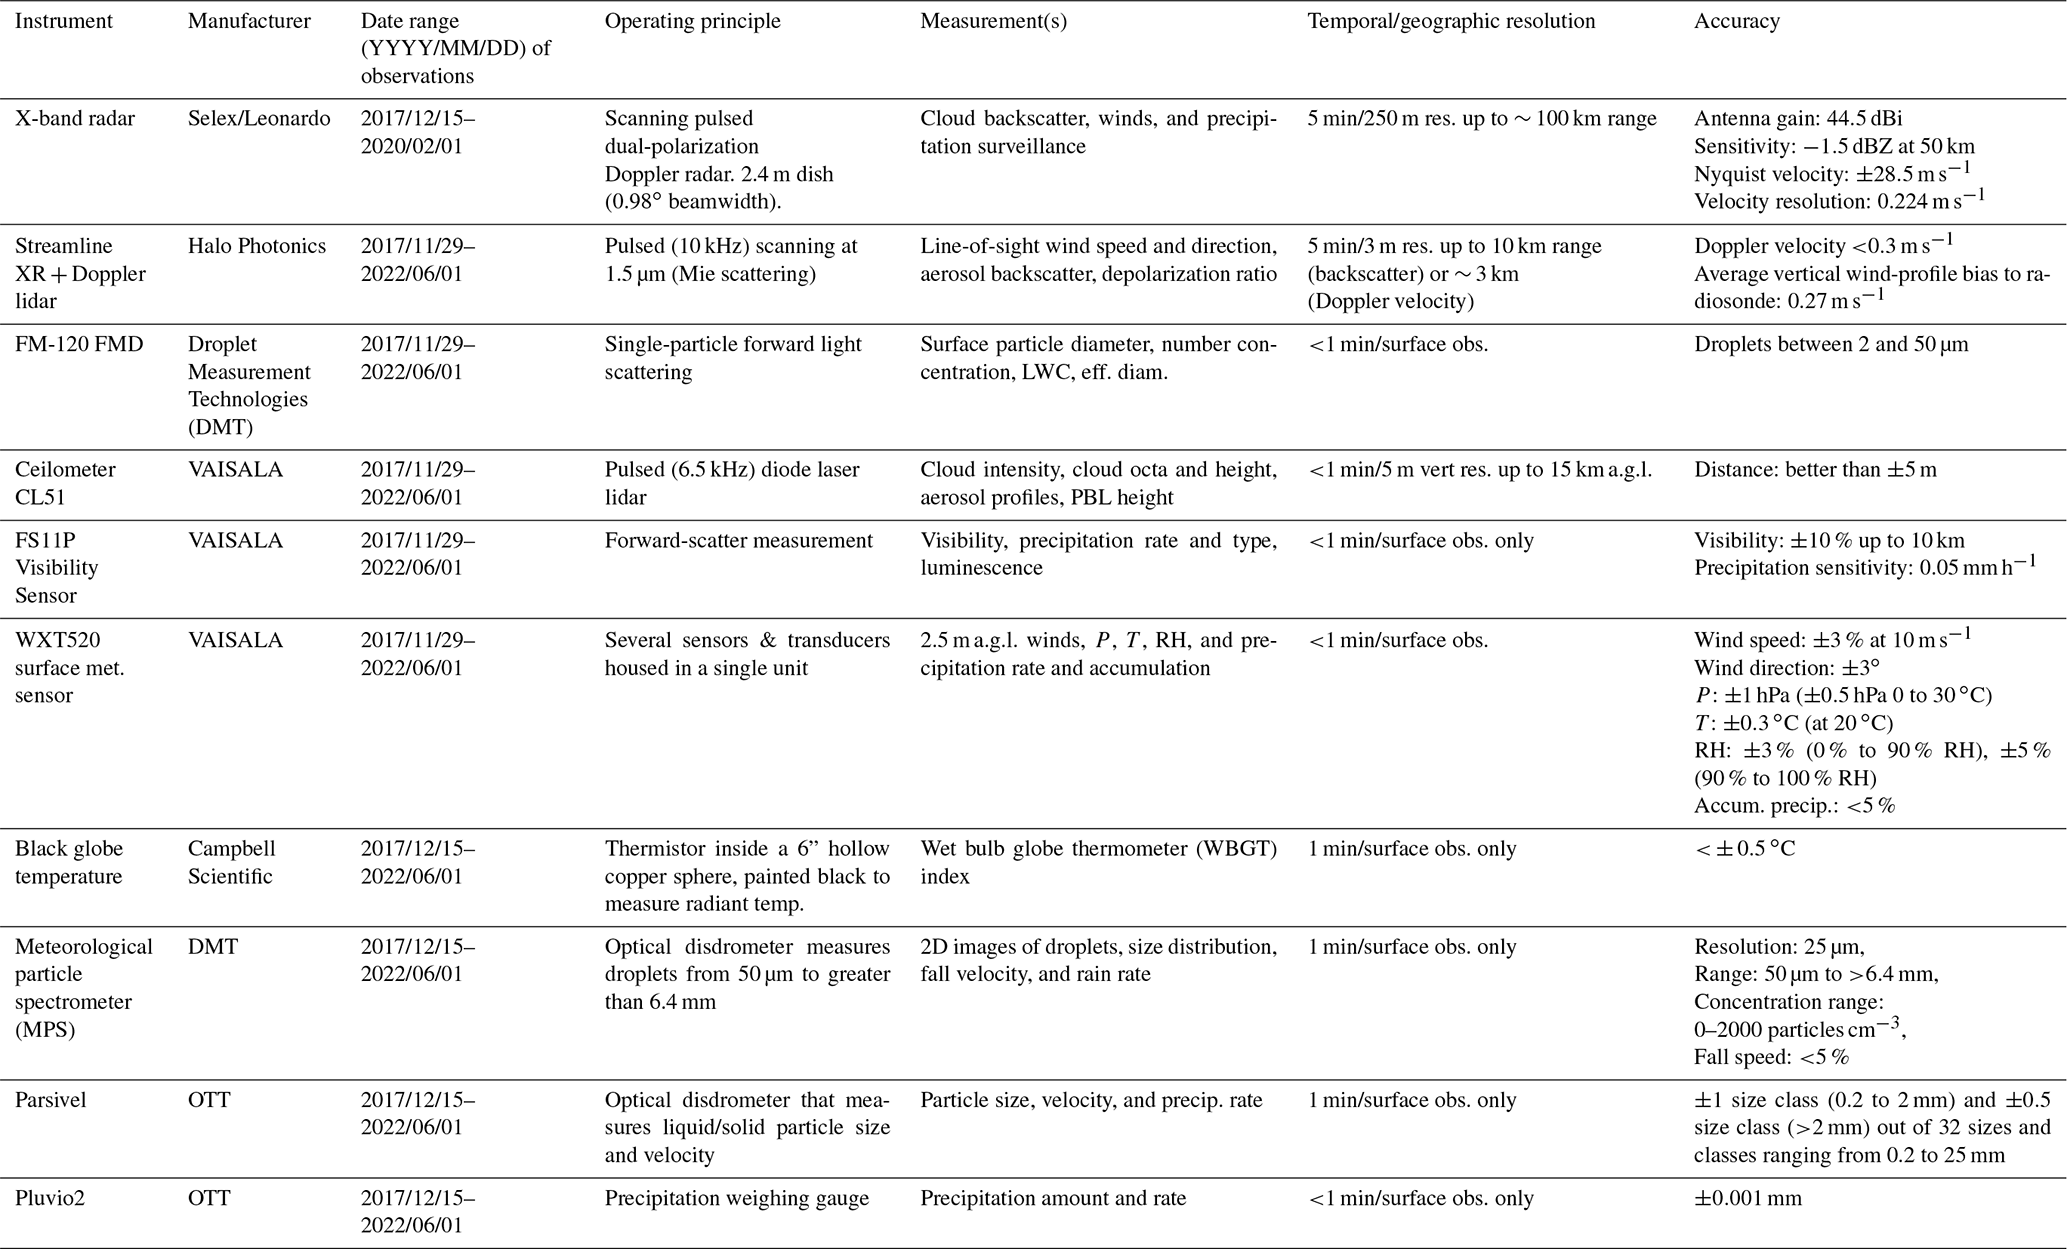
As with Iqaluit, the Whitehorse supersite is equipped with an FM-120 FMD, Vaisala CL51 ceilometer, Halo Photonics Streamline XR Doppler lidar, WXT520 weather sensor, Vaisala FS11P present weather sensor, Pluvio2 and Parsivel precipitation sensors, and all-sky and 4K pan-tilt cameras. These instruments were configured and operated in a nearly identical manner to their counterparts at the Iqaluit supersite. Thus, the instruments listed in the following subsections are only the ones unique to the Whitehorse supersite. Note that the Vaisala FS11P present weather sensor deployed to Whitehorse is similar in design and operation to the Vaisala PWD52 in Iqaluit (Sect. 3.1.2) and operated continuously during the study period up until June 2020, at which point it experienced a laser failure and had to be removed.
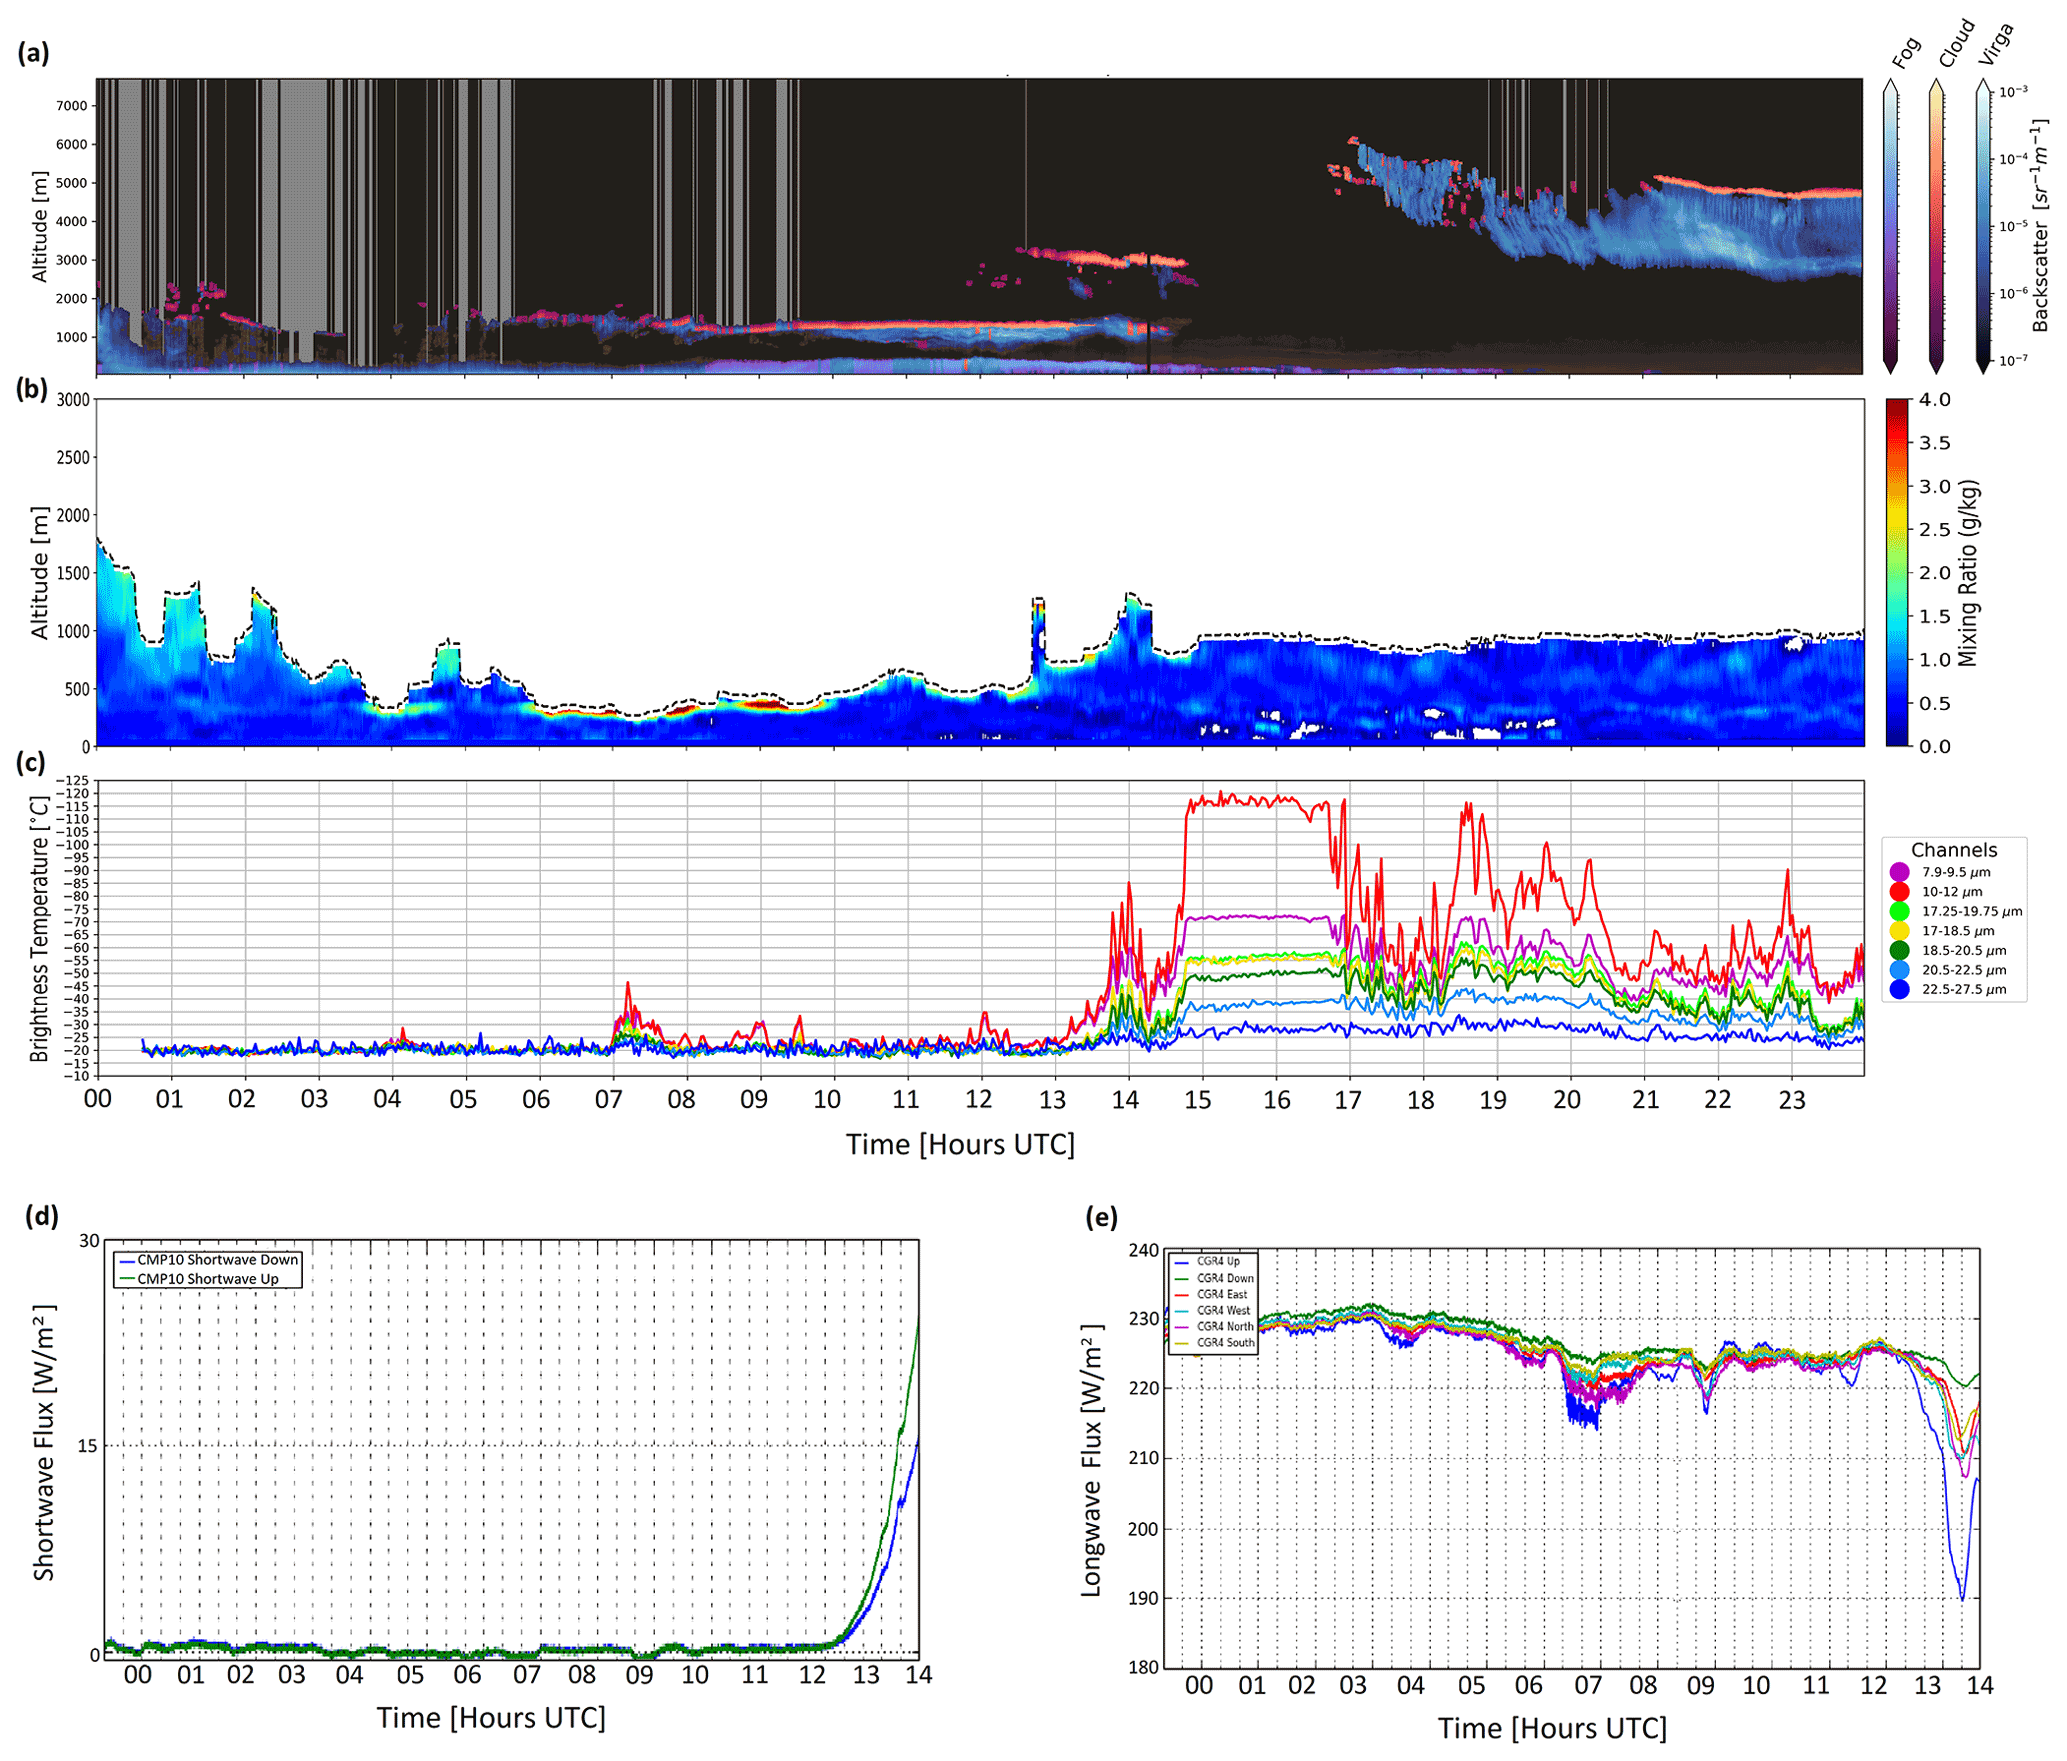
Figure 7Multi-instrument observations at the Iqaluit supersite during a blizzard on 23 November 2018, including (a) CL51 ceilometer aerosol backscatter observations coloured by meteorological type classification (clear skies, fog, cloud, and virga), (b) DIAL water vapour mixing ratio profiles up to the instruments' effective height (black dashed line), (c) downwelling brightness temperature measurements from the FIRR's seven channels, (d) CMP10 shortwave upward (green) and downward (blue) radiation fluxes, and (e) CGR4 longwave upward (blue), downward (green), eastward (red), westward (teal), northward (purple), and southward (yellow) radiation fluxes. Note that panels (d) and (e) are only shown up to 14:00 UTC due to an instrument malfunction, whereas panels (a)–(c) are shown for the entire day.
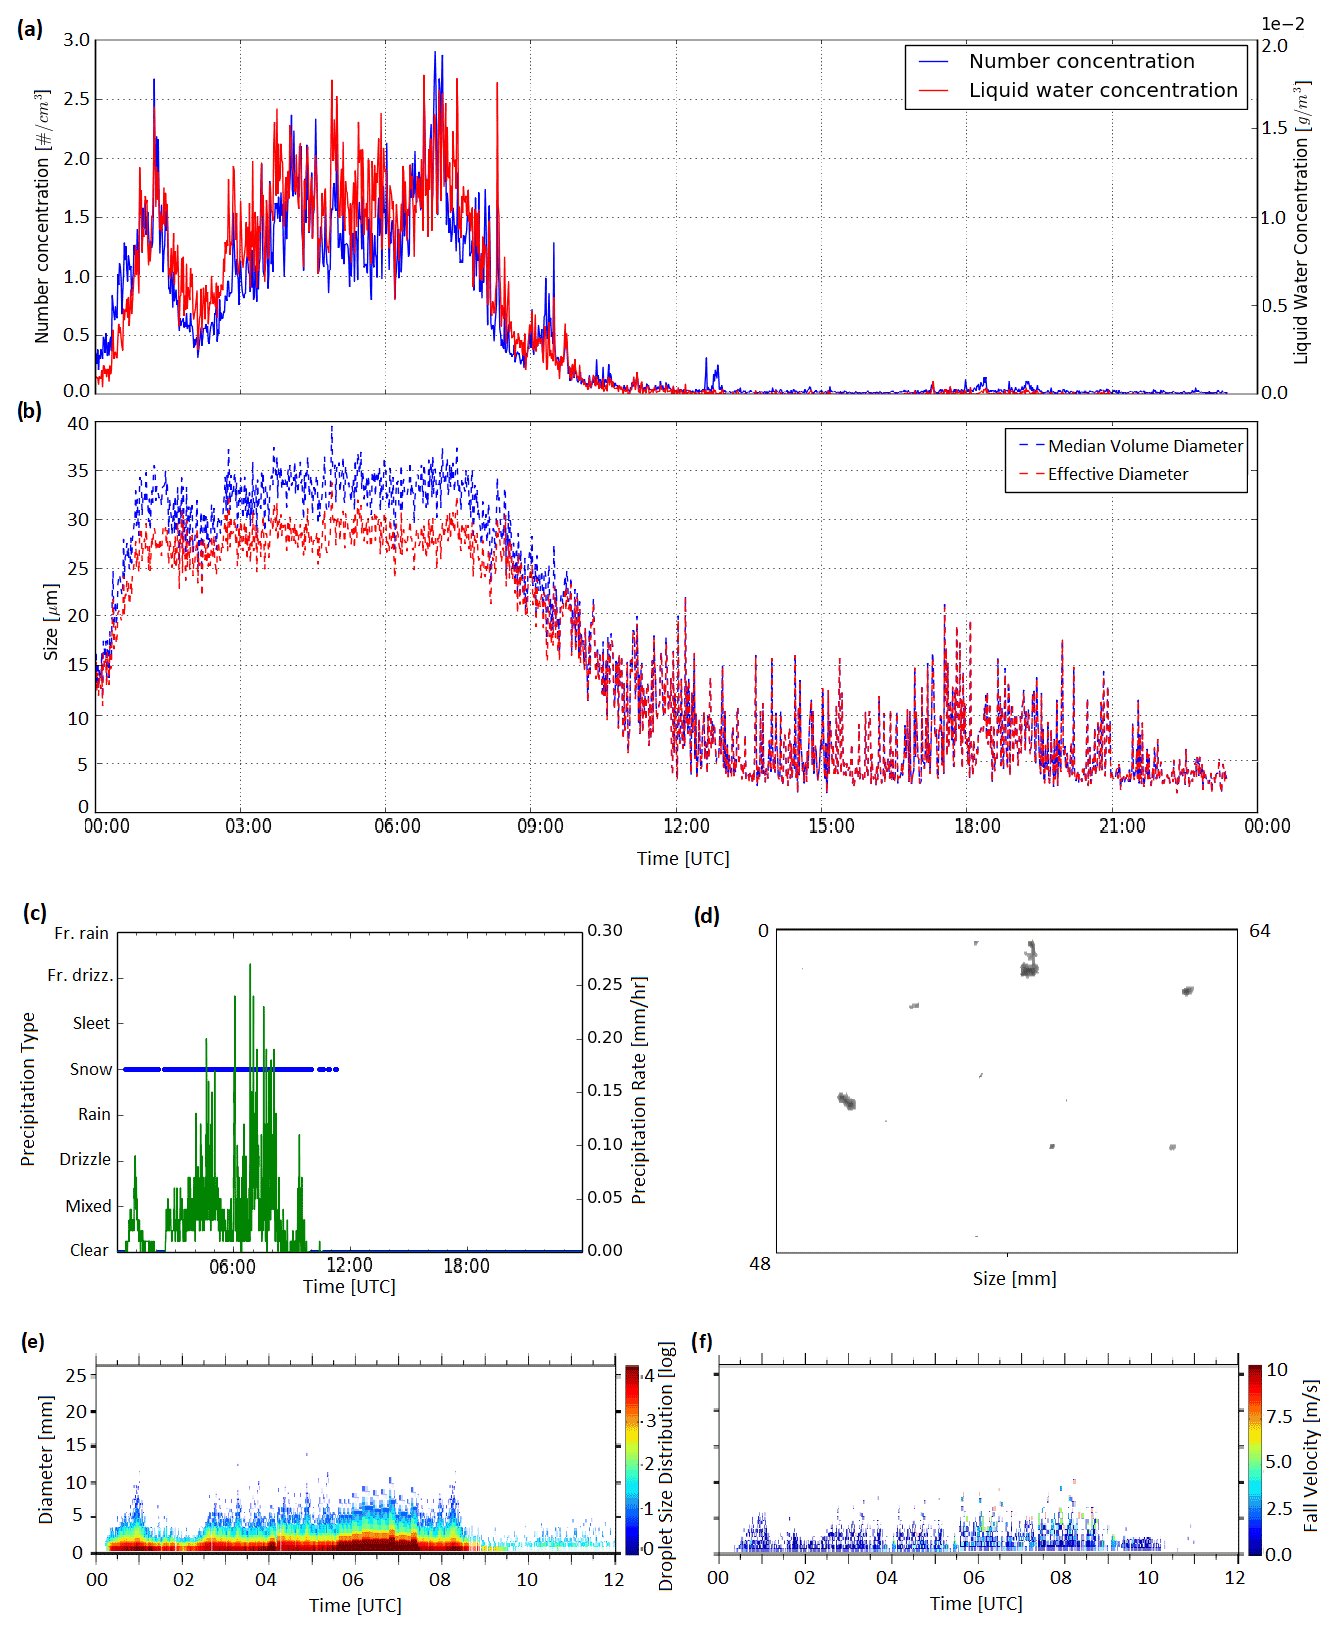
Figure 8In situ observations of microphysical properties of precipitation during the 23 November 2018 blizzard at Iqaluit: (a) FMD number (blue) and liquid water (red) concentration, (b) FMD median volume diameter (blue) and effective diameter (red) particle size, (c) PWD52 precipitation rate (green) and type (blue), PIP observations of (d) snowflakes (photo) taken at 08:37 UTC, (e) DSD, and (f) particle fall velocity during the blizzard.
3.2.1 Meteorological Service of the Canada Weather Station
The Whitehorse MSC weather station is 2.9 km northwest of the Whitehorse supersite; as such, it operates completely independently. It has been in operation since 1900. All WMO-standard meteorological surface and upper-air (radiosonde; WMO station code 71964) observations are conducted identically to those at the Iqaluit MSC weather office described in Sect. 3.1.1.
3.2.2 Particle size and precipitation rate
A DMT meteorological particle spectrometer (MPS) is a precipitation-measuring optical disdrometer. It operated continuously with limited data gaps. It measures hydrometeor size distribution and fall velocity, enabling estimates of the precipitation rate for droplets ranging from 50 µm to >6.4 mm. The instrument processes 2D images of the hydrometeors and a 1D histogram of particle sizes to produce its measurements (Montero-Martinez et al., 2009).
3.2.3 X-band radar
The Selex/Leonardo METEOR 60DX mobile X-band dual-polarization radar with a 2.4 m dish was moved from Vancouver Island, where it was previously operated during the Olympic Mountains Experiment (OLYMPEX), to Whitehorse in December 2017 (Hudak et al., 2016; Houze et al., 2017). The radar provides line-of-sight wind speed and direction, cloud and fog backscatter, and depolarization ratio observations, similar to the Ka-band radar at Iqaluit. The scanning radar operates at 9472 MHz using a 75 kW magnetron with a pulse width of 1.0 µs and a dual-pulse repetition frequency of 1200 or 900 Hz. It operated in a 5 min cycle conducting three PPI scans (1.5, 3.5, and 5.0∘ elevation), two RHI scans (170 and 350∘ azimuth), and a vertical stare. Sector blocking was applied from 200 to 275∘ in azimuth and below 60∘ in elevation to protect the other instruments at the supersite, which were located only a few metres away in this direction on a raised platform. Similarly to Iqaluit's Ka-band radar, the X-band radar operated continuously during the study period but experienced several outages caused by inclement weather as well as airport operations requiring the radar to be turned off; as such, its available dataset is limited compared to the other instruments at Whitehorse.
3.2.4 Black globe temperature sensor
A Campbell Scientific black globe temperature sensor provides measurements of heat stress. It uses a thermistor inside a hollow copper sphere that is painted black to measure radiant temperature and operated continuously with limited data gaps. Combined with the measurement of ambient air and wet-bulb temperatures, it is used to calculate the wet-bulb globe temperature (WBGT) index, which is crucial for observing the environmental heat stress felt by an individual.
3.2.5 Data storage rules and identifiers
All geophysical variables observed at the Iqaluit and Whitehorse sites were archived as raw data files and processed in the same manner. Several levels of data processing were published as outlined in Table 3; raw (level-0) data with no quality control (QC) imposed were made available for all instruments, enabling the user to impose their own QC algorithms. As such, all raw data files should be treated with caution, particularly for the radiation flux observations, which typically require additional QC processing prior to analysis. Processed datasets (for a limited number of instruments; e.g., lidar VAD wind profiles) are also available as flat text files and images (.pngs). For the processed products, notes in the published readme files point to the types of QC algorithms applied and whom to contact to obtain processing codes, QC algorithms, or more information in general. In all the cases, time is reported as UTC, and heights are above ground level. When no data were available (due to the instrument being down or loss of power at the site), gaps exist or the value −9999 was used. When instruments were maintained and/or recalibrated by technicians visiting the site (roughly twice a year), an identifier in the published metadata is included to mark these service visits.
Table 3Description of the filename structure and its contents in the Iqaluit (“CYFB”) dataset. Additional information is available via the database's readme files. A similar file structure is used for Whitehorse, with the exception of the prefix airport code (“CYXY”).
4.1 Iqaluit blizzard: 23 November 2018
Integrated observations were collected during a blizzard on 23 November 2018 at the Iqaluit supersite. A low-pressure system brought thick low-level clouds (1 to 2 km a.g.l.) to Iqaluit on the evening of 22 November 2018. Strong surface winds >15 m s−1 produced a mixture of drifting and blowing snow into the next day. Combined with precipitating snow from the low-level clouds, surface visibility conditions were near zero for the entire morning of 23 November, as observed by the PWD52 and the METAR. Surface temperatures ranged from −19.9 to −23.7 ∘C throughout the blizzard, as measured by the WXT520. The storm lasted until around 11:00 UTC, when surface winds decreased to <13 m s−1 and precipitation ended. This improved surface visibility to >5 km. Thick persistent cloud cover remained after the storm, including thin ice clouds and ice crystals (diamond dust). A total of 1.8 mm of precipitation was measured at the MSC weather station during the blizzard.
Figures 7 and 8 provide examples of some of the data collected at the supersite during the blizzard. Aerosol backscatter observations from the CL51 ceilometer (including meteorological type classifications), water vapour profile observations from the DIAL, downwelling brightness temperatures from the FIRR, and shortwave and longwave fluxes measured by the radiation flux sensor suite are provided in Fig. 7. These observations characterize the radiative budget at the site during and after the blizzard with large variations observed as a result of the changing snow and cloud conditions. For instance, a period of clear skies between 14:45 and 16:45 UTC shown in Fig. 7a resulted in a sudden decrease in the downwelling brightness temperatures in Fig. 7c. The extremely low water vapour profile concentrations (Fig. 7b, ∼ 0.5 g kg−1) enable the FIRR channels that are mostly transparent to other trace gases (e.g., 10–12 µm) to effectively observe the downwelling radiation from near space. Changes in the shortwave and longwave fluxes (Fig. 7d–e) also corresponded to changing cloud cover; note that they are only shown up to 14:00 UTC due to an instrument malfunction soon after the blizzard ended.
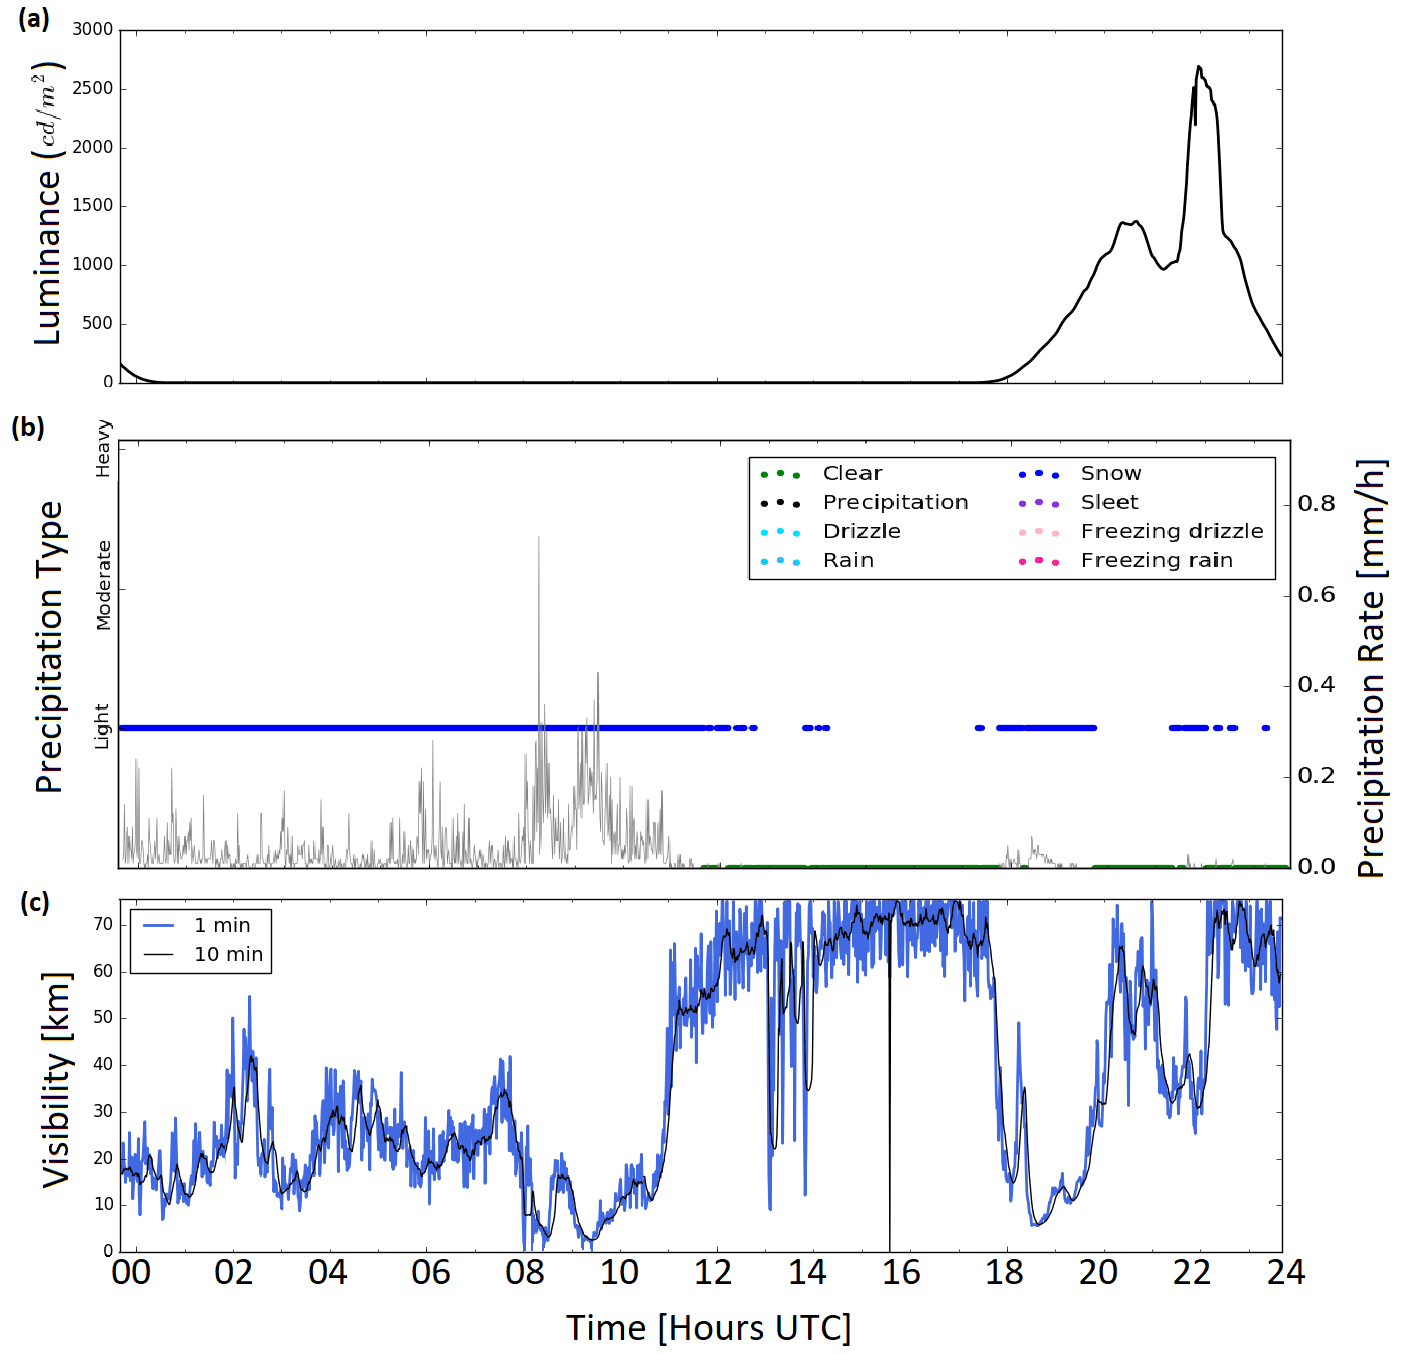
Figure 9FS11P observations at Whitehorse during the blizzard on 16 December 2019: (a) luminance, (b) precipitation rate (grey) based on pre-defined intensity thresholds (mm h−1) and type (colour-coded), and (c) averaged 1 min (blue) and 10 min (black) surface visibility during and after the blizzard.
Observations of microphysical particle properties during the blizzard are provided in Fig. 8. The number concentration, liquid water concentration, and particle size as measured by the FMD are provided in Fig. 8a–b, precipitation type (blue) and rate (green) observations from the PWD52 are shown in Fig. 8c, and a PIP particle image of snowflakes taken at 08:37 UTC is shown in Fig. 8d, with corresponding DSDs and fall velocities processed by the PIP shown in Fig. 8e, f. Note that Fig. 8e, f are shown only up to 12:00 UTC since there was no blowing or precipitating snow recorded after this time. All observations are consistent with the presence of moderate or heavy blowing and/or precipitating snow, ranging in sizes mostly <5 mm (some cases up to 10 mm). Residual blowing snow was observed by the FMD and PIP for several hours after the main snowfall event (10:00 UTC onwards).
4.2 Whitehorse blizzard: 16–17 December 2019
A HIW event occurred at Erik Nielsen Whitehorse International Airport on 16–17 December 2019. A low-pressure system brought persistent thick and precipitating low-level clouds (∼ 400 m a.g.l.) on 16 December that covered the entire Whitehorse valley, including the airport. Surface temperatures ranged between −15.4 and −11.5 ∘C, as observed by the WXT520. A total of 1.6 mm of precipitation was measured at the MSC weather station during the blizzard.
Periods of near-zero surface visibility, precipitating wet snow, and a very low cloud base made flights into and out of Whitehorse hazardous, particularly given the complex mountainous terrain surrounding the airport. Several flights were cancelled or diverted, severely impacting transportation for the entire western Arctic region. One 2 h flight, Air Canada AC 279, which departed from Vancouver, British Columbia, to Whitehorse on 16 December, received notable media attention when it turned into a 2 d international trip, detouring to Anchorage, Alaska, after it was deemed unsafe to land in Whitehorse due to the inclement weather.
Data collected by the PWD52 at the Whitehorse supersite during the event are shown in Fig. 9, including the luminance, precipitation type (blue) and rate (grey), and surface visibility. Periods of near-zero surface visibility are correlated with increased precipitating snow rates. Luminance was zero for most of the day (except when clouds began to dissipate after 18:00 UTC), further exacerbating the poor visibility conditions. Periods of intermittent precipitation continued with intermittent thick cloud cover throughout the evening and on 17 December.
Doppler lidar and X-band radar remote sensing observations provided high temporal and spatial resolution upper-air observations during the HIW event. Such observations are extremely relevant for aviation nowcasting operations. Doppler lidar vertical profiles of the attenuated backscatter, vertical velocity (w component of the wind), depolarization ratio (to distinguish ice/water composition), and horizontal winds (u and v components of the wind) on 16 December 2019 are shown in Fig. 10a–d, respectively. A low cloud ceiling of ∼ 400 m a.g.l. was relatively constant throughout most of the day, limiting the lidar's vertical observations to this altitude. Vertical velocities indicated mixing and turbulent motions within the PBL throughout most of the day, with strong horizontal winds (∼ 15 m s−1) observed at the cloud base (∼ 500 m a.g.l.) after 16:00 UTC and a strong wind shear at ∼ 1.25 km a.g.l. Note that these wind conditions occurred within the Whitehorse valley, below the mountain peaks, producing dangerous circumstances for aircraft operations, particularly considering the near-zero visibility.
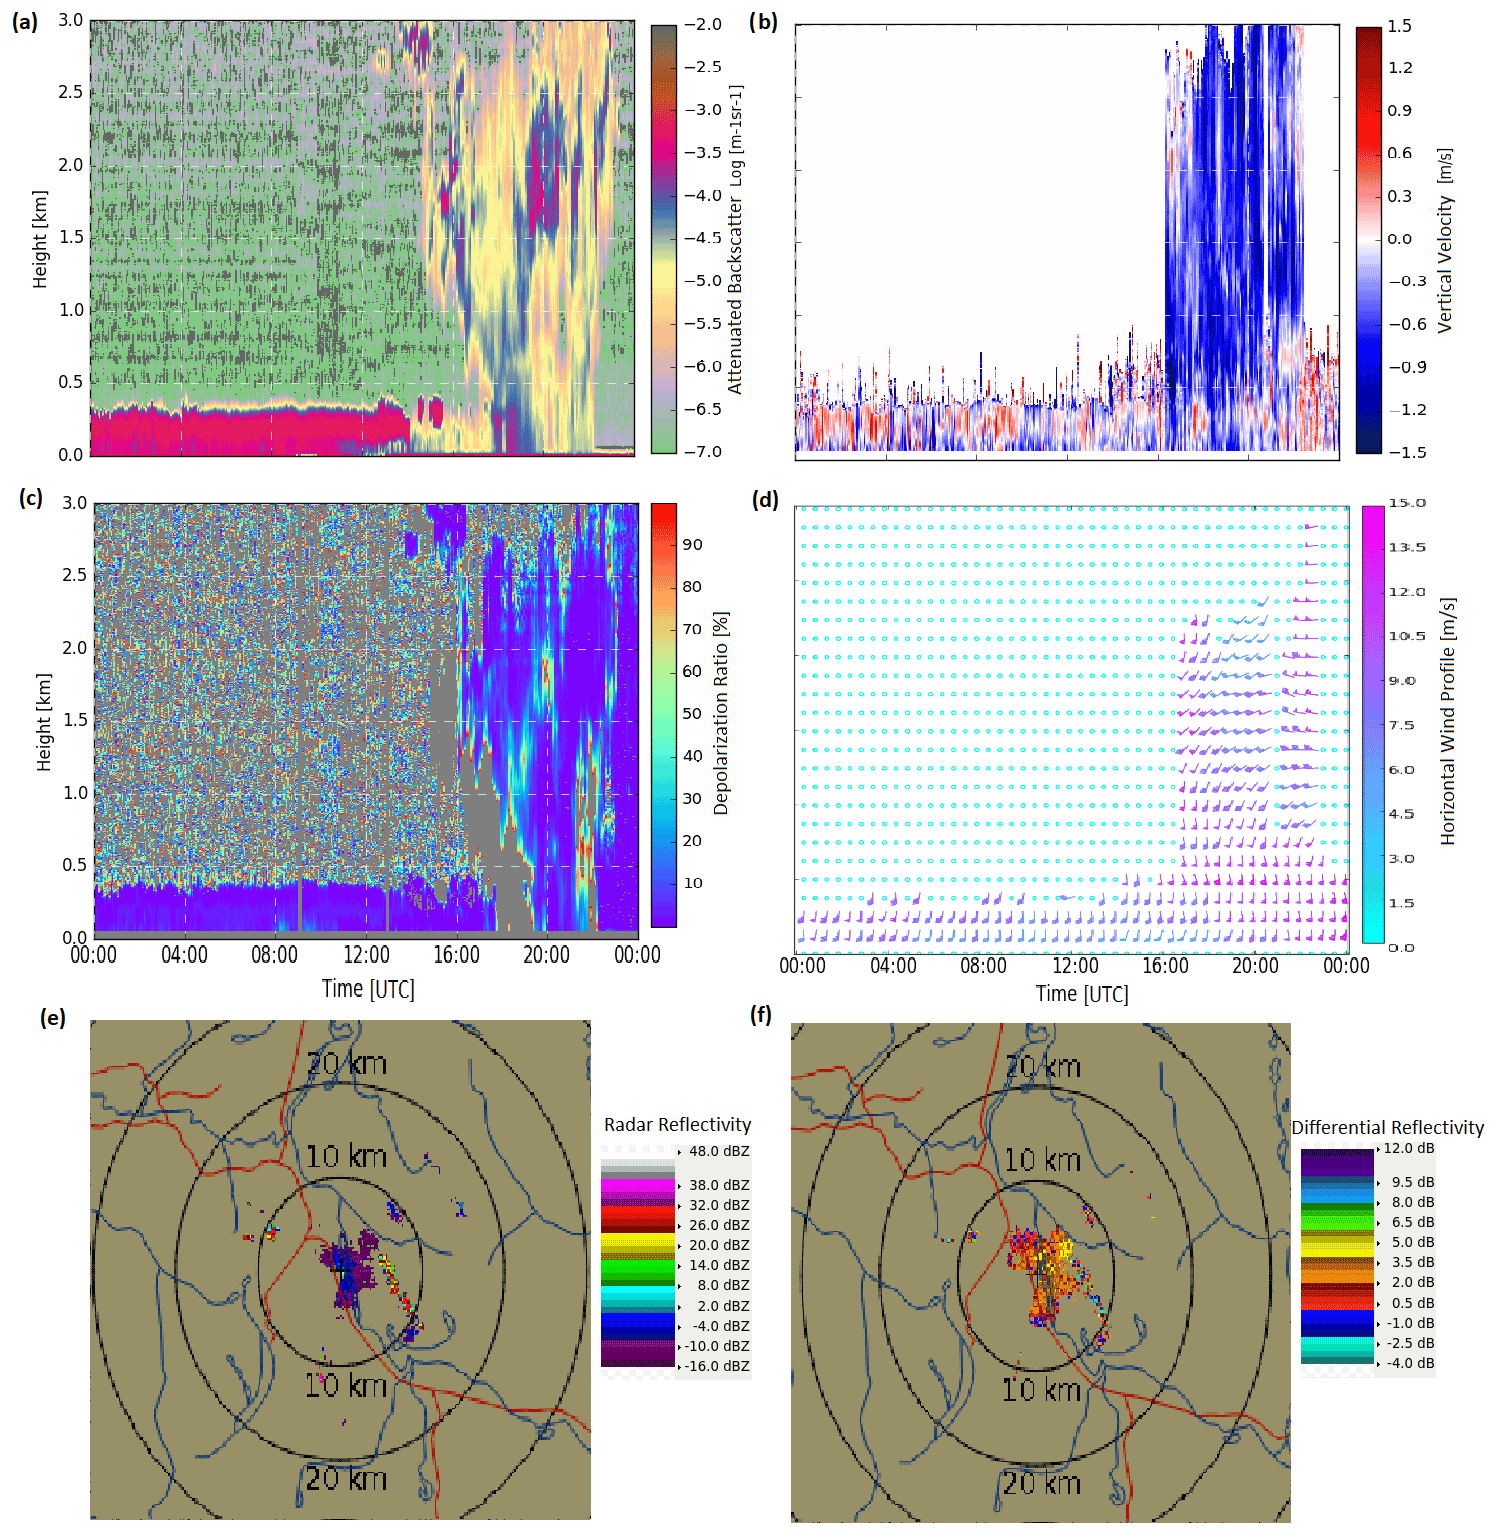
Figure 10Doppler lidar and X-band radar observations during the HIW event at Whitehorse on 16 December 2019. Doppler lidar vertical profiles of the (a) attenuated backscatter, (b) vertical velocity, (c) depolarization ratio, and (d) horizontal winds are shown. X-band 3.5∘ elevation PPI scans of radar reflectivity (e) and differential reflectivity (ZDR) (f) provide snapshots of the blizzard in the Whitehorse valley during its peak at 09:45 UTC.
The X-band radar's 3.5∘ elevation PPI scans at 09:45 UTC provide snapshots of the horizontal extent of the storm during its peak in precipitation throughout the Whitehorse valley. Radar reflectivity is shown in Fig. 10e, and differential reflectivity (ZDR) is shown in Fig. 10f. Both the Doppler lidar depolarization ratio vertical profiles (Fig. 10c) and the X-band radar's horizontal differential reflectivity (Fig. 10f) indicate the presence of wet precipitating snow throughout and above the entire valley. Note that the X-band data in Fig. 10e–f are limited not by their range, but by the topography of the region, with nearby mountains blocking the radar's beam. Though logistically challenging, if the radar was moved to a higher position near the top of the nearby mountains, the improved sightlines would significantly improve its ability to detect such storm systems earlier.
The CAWS dataset is available via the Government of Canada Open Data Portal and can be accessed at https://doi.org/10.18164/ff771396-b22c-4bc3-844d-38fc697049e9 (Iqaluit supersite, Mariani et al., 2022a) and https://doi.org/10.18164/d92ed3cf-4ba0-4473-beec-357ec45b0e78 (Whitehorse supersite, Mariani et al., 2022b). Meteorological Service of Canada surface and radiosonde data are available via https://weather.gc.ca (Government of Canada, 2022).
Two unique datasets of enhanced meteorological observations were collected at the Iqaluit and Whitehorse supersites during the CAWS project. Data at Iqaluit were collected starting in September 2015 and are partially ongoing (depending on the instrument), while data collected at Whitehorse were collected from November 2017 to June 2022. These new datasets fill large gaps in meteorological observations in the Arctic and improve existing observing capabilities via the deployment and integration of new, at times prototype remote sensing technologies. These data are being used to fulfil the CAWS project's goal of providing recommendations on a cost-effective Arctic observing system. Improved Arctic infrastructure, satellite calibration/validation, new weather products for northern communities, and enhanced near-real-time HIW observing capabilities have also been achieved as a result of CAWS.
The combination of multiple in situ and remote sensing instruments deployed at the two sites provides an unprecedented wealth of integrated meteorological observations for the Canadian Arctic. The sites' automated and continuous observations of vertically resolved winds, water vapour, clouds and aerosols, visibility, radiation fluxes, and precipitation are a unique high-resolution dataset encompassing all essential meteorological parameters from the sub-surface soil up to PBL and beyond. Overall, the CAWS dataset will significantly contribute to our understanding of synoptic and fine-scale meteorological processes in the Arctic, including cloud microphysical processes, the radiative budget, HIW detection and prediction, nowcasting, PBL dynamics, and NWP verification, assimilation, and processes, particularly in the context of WMO YOPP.
ZM wrote the first draft of the manuscript and conducted analyses. ZM, SHJ, EM, LP, and PR conducted scientific analyses and created plots. ZM, LH, and RC managed data archiving and publication to the Government of Canada Open Data Portal. All co-authors contributed to the writing and the editing of the manuscript.
The contact author has declared that none of the authors has any competing interests.
Use of specific instrument manufacturers/models and suppliers mentioned in
the manuscript and/or used at the supersites is not a commercial endorsement
of their products.
Publisher's note: Copernicus Publications remains neutral with regard to jurisdictional claims in published maps and institutional affiliations.
This article is part of the special issue “Extreme environment datasets for the three poles”. It is not associated with a conference.
Special thanks to Sorin Pinzariu, Michael Harwood, Robert Reed, Reno Sit, Jason Iwachow, Michael Travis, Bernard Firanski, and Daniel Coulombe (ECCC) for their help with instrumentation at the Iqaluit site. Thank you to Larry Bliven and David Wolff (NASA) for providing the PIP instrument and its data processing package. Thank you to the Meteorological Service of Canada radiosonde operators and the Observing System and Engineering Division's management of the Iqaluit MSC weather station. Thank you to the Erik Nielsen Whitehorse International Airport Management and the government of Yukon for providing access to the Whitehorse Airport field in order to commission the Whitehorse supersite. All data products are produced by ECCC and are available via http://obrs.ca (last access: 9 November 2022), the Government of Canada Open Data Portal (https://doi.org/10.18164/ff771396-b22c-4bc3-844d-38fc697049e9, Mariani et al., 2022a, and https://doi.org/10.18164/d92ed3cf-4ba0-4473-beec-357ec45b0e78, Mariani et al., 2022b), or upon request.
This paper was edited by Tao Che and reviewed by two anonymous referees.
Arctic Council: Telecommunications Infrastructure in the Arctic: a circumpolar assessment, https://oaarchive.arctic-council.org/handle/11374/1924 (last access: 3 February 2019), 2017.
Barthazy, E. and Schefold, R.: Fall velocity of snowflakes of different riming degree and crystal types, Atmos. Res., 82, 391–398, 2006.
Battaglia, A., Rustemeier, E., Tokay, A., Blahak, U., and Simmer, C.: Parsivel snow observations: a critical assessment, J. Atmos. Ocean. Tech., 27, 333–344, https://doi.org/10.1175/2009JTECHA1332.1, 2010.
Bauer-Pfundstein, M. R.: Target Separation and Classification using Cloud Radar Doppler-Spectra, in: Proceedings of the AMS 33rd International Conference on Radar Meteorology, Cairns, Australia, 6–10 August 2007, https://ams.confex.com/ams/pdfpapers/123456.pdf (last access: 4 November 2022), 2007.
Blewitt, G., Hammond, W. C., and Kreemer, C.: Harnessing the GPS data explosion for interdisciplinary science, EOS, 99, https://doi.org/10.1029/2018EO104623, 2018.
Cassano, J., Higgins, M., and Seefeldt, M.: Performance of the Weather Research and Forecasting Model for Month-Long Pan-Arctic Simulations, Mon. Weather Rev., 139, 3469–3488, 2011.
Chou, C.-C., Kushner, P. J., Laroche, S., Mariani, Z., Rodriguez, P., Melo, S., and Fletcher, C. G.: Validation of the Aeolus Level-2B wind product over Northern Canada and the Arctic, Atmos. Meas. Tech., 15, 4443–4461, https://doi.org/10.5194/amt-15-4443-2022, 2022.
Cober, S. G., Isaac, G. A., and Korolev, A. V.: Assessing the Rosemount Icing Detector with In Situ Measurements, J. Atmos. Ocean. Tech., 18, 515–528, 2001.
Cox, C. J., Morris, S. M., Uttal, T., Burgener, R., Hall, E., Kutchenreiter, M., McComiskey, A., Long, C. N., Thomas, B. D., and Wendell, J.: The De-Icing Comparison Experiment (D-ICE): a study of broadband radiometric measurements under icing conditions in the Arctic, Atmos. Meas. Tech., 14, 1205–1224, https://doi.org/10.5194/amt-14-1205-2021, 2021.
Dabberdt, W. F., Munkel, C., Kallio, J., Komppula, M., Laukkanen, S., and O'Connor, E. J.: Advances in Continuous Atmospheric Boundary Layer Humidity Profiling with a Compact DIAL Instrument, in: Proceedings of the 18th Symposium on Meteorological Observation and Instrumentation, New Orleans, LA, USA, 13 January 2016, American Meteorological Society, Boston, MA, USA, 2016, Volume 8.4, https://ams.confex.com/ams/96Annual/webprogram/Paper285586.html (last access: 14 July 2021), 2016.
Ford, J. D., McDowell, G., Shirley, J., Pitre, M., Siewierski, R., Gough, W., Duerden, F., Pearce, T., Adams, P., and Statham, S.: The dynamic multiscale nature of climate change vulnerability: An Inuit harvesting example, Ann. Assoc. Am. Geogr., 103, 1193–1211, https://doi.org/10.1080/00045608.2013.776880, 2013.
Gaffard, C., Li, Z., Harrison, D., Lehtinen, R., and Roininen, R.: Evaluation of a Prototype Broadband Water-Vapour Profiling Differential Absorption Lidar at Cardington, UK, Atmosphere, 12, 1521, https://doi.org/10.3390/atmos12111521, 2021.
Görsdorf, U., Lehmann, V., Bauer-Pfundstein, M., Peters, G., Vavriv, D., Vinogradov, V., and Volkov, V.: A 35-GHz Polarimetric Doppler Radar for Long-Term Observations of Cloud Parameters – Description of System and Data Processing, J. Atmos. Ocean. Tech., 32, 675–690, https://doi.org/10.1175/JTECH-D-14-00066.1, 2015.
Government of Canada: Quadrennial Search and Rescue Review, 16 pp., https://www.publicsafety.gc.ca/cnt/rsrcs/pblctns/archive-nss-qdrnnl-rvw/index-en.aspx (last access: 4 November 2022), 2016.
Government of Canada: Homepage, https://weather.gc.ca, last access: 2 November 2022.
GRAW: DFM Radiosonde Manual, https://www.graw.de/products/radiosondes/dfm-09/ (last access: 19 January 2022), 2020.
Gultepe, I., Rabin, R., Ware, R., and Pavolonis, M.: Chapter three – light snow precipitation and effects on weather and climate, Adv. Geophys., 57, 147–210, https://doi.org/10.1016/bs.agph.2016.09.001, 2016.
Gultepe, I., Heymsfield, A., Field, P., and Axisa, D.: Ice-phase precipitation, AMS Meteorological Monographs, 58, 6.1–6.36, https://doi.org/10.1175/AMSMONOGRAPHS-D-16-0013.1, 2017.
Gunn, R. and Kinzer, G. D.: The terminal velocity of fall for water droplets in stagnant air, J. Meteorol., 6, 243–248, https://doi.org/10.1175/1520-0469(1949)006<0243:TTVOFF>2.0.CO;2, 1949.
Hicks-Jalali, S., Mariani, Z., and Crawford, R. W.: DIAL and GNSS observations of the diurnal water-vapour cycle above Iqaluit, Nunavut, Q. J. Roy. Meteorol. Soc., 147, 4228–4250, https://doi.org/10.1002/qj.4175, 2021.
Houze Jr., R. A., McMurdie, L. A., Petersen, W. A., Schwaller, M. R., Baccus, W., Lundquist, J. D., Mass, C. F., Nijssen, B., Rutledge, S. A., Hudak, D. R., Tanelli, S., Mace, G. G., Poellot, M. R., Lettenmaier, D. P., Zagrodnik, J. P., Rowe, A. K., DeHart, J. C., Madaus, L. E., Barnes, H. C., and Chandrasekar, V.: The Olympic Mountains Experiment (OLYMPEX), B. Am. Meteorol. Soc., 98, 2167–2188, https://doi.org/10.1175/BAMS-D-16-0182.1, 2017.
Hudak, D., Rodriguez, P., Donaldson, N., and Kirshbaum, D.: OLYMPEX Canada, in: Proceedings of the AMS 17th Conference on Mountain Meteorology, Burlington, Vermont, USA, 27 June–1 July 2016, https://ams.confex.com/ams/17Mountain/webprogram/Paper296448.html (last access: 2 November 2022), 2016.
Illingworth, A. J., Cimini, D., Gaard, C., Haeelin, M., Lehmann, V., Löhnert, U., O'Connor, E. J., and Rueux, D.: Exploiting existing ground-based remote sensing networks to improve high-resolution weather forecasts, B. Am. Meteorol. Soc., 96, 2107–2125, 2015.
Joe, P., Melo, S., Burrows, W. R., Casati, B., Crawford, R. W., Dehghan, A., Gascon, G., Mariani, Z., Milbrandt, J., and Strawbridge, K.: The Canadian Arctic Weather Science Project: Introduction to the Iqaluit Site, B. Am. Meteorol. Soc., 101, E109–E128, 2020.
Jones, J., Guerova, G., Dousa, J., Dick, G., de Haan, S., Pottiaux, E., Bock, O., Pacione, R., and van Malderen, R.: Advanced GNSS Tropospheric Products for Monitoring Severe Weather Events and Climate, edited by: Jones, J., Guerova, G., Douša, J., Dick, G., de Haan, S., Pottiaux, E., Bock, O., Pacione, R., and van Malderen, R., Springer Nature Switzerland, Cham, Switzerland, ISBN 978-3-030-13901-8, 2020.
Koltzow, M., Casati, B., Bazile, E., Haiden, T., and Valkonen, T.: An NWP model intercomparison of surface weather parameters in the European Arctic during the year of polar prediction special observing period northern hemisphere 1, Weather Forecast., 34, 959–983, 2019.
Kotthaus, S., Haeffelin, M., Drouin, M.-A., Dupont, J.-C., Grimmond, S., Haefele, A., Hervo, M., Poltera, Y., and Wiegner, M.: Tailored Algorithms for the Detection of the Atmospheric Boundary Layer Height from Common Automatic Lidars and Ceilometers (ALC), Remote Sens., 12, 3259, https://doi.org/10.3390/rs12193259, 2020.
Kumer, V. M., Reuder, J., and Furevik, B. R.: A comparison of LiDAR and radiosonde wind measurements, Energy Proced., 53, 214–220, 2014.
Lesins, G., Bourdages, L., Duck, T. J., Drummond, J. R., Eloranta, E. W., and Walden, V. P.: Large surface radiative forcing from topographic blowing snow residuals measured in the High Arctic at Eureka, Atmos. Chem. Phys., 9, 1847–1862, https://doi.org/10.5194/acp-9-1847-2009, 2009.
Libois, Q., Proulx, C., Ivanescu, L., Coursol, L., Pelletier, L. S., Bouzid, Y., Barbero, F., Girard, É., and Blanchet, J.-P.: A microbolometer-based far infrared radiometer to study thin ice clouds in the Arctic, Atmos. Meas. Tech., 9, 1817–1832, https://doi.org/10.5194/amt-9-1817-2016, 2016.
Libois, Q. and Blanchet, J.-P.: Added value of far-infrared radiometryfor remote sensing of ice clouds, J. Geophys. Res.-Atmos., 122, 6541–6564, https://doi.org/10.1002/2016JD026423, 2017.
Liu, X. C., Gao, T. C., and Liu, L.: A comparison of rainfall measurements from multiple instruments, Atmos. Meas. Tech., 6, 1585–1595, https://doi.org/10.5194/amt-6-1585-2013, 2013.
Mariani, Z., Dehghan, A., Sills, D. M., and Joe, P.: Observations of Lake Breeze Events during the Toronto 2015 Pan-American Games, Bound. Lay. Meteorol., 166, 113–135, https://doi.org/10.1007/s10546-017-0289-3, 2018a.
Mariani, Z., Dehghan, A., Gascon, G., Joe, P., Hudak, D., Strawbridge, K., and Corriveau, J.: Multi-instrument observations of prolonged stratified wind layers at Iqaluit, Nunavut, Geophys. Res. Lett., 45, 1654–1660, 2018b.
Mariani, Z., Crawford, R., Casati, B., and Lemay, F.: A Multi-Year Evaluation of Doppler Lidar Wind-Profile Observations in the Arctic, Remote Sens., 12, 323, https://doi.org/10.3390/rs12020323, 2020a.
Mariani, Z., Stanton, N., Whiteway, J., and Lehtinen, R.: Toronto Water Vapor Lidar Inter-Comparison Campaign, Remote Sens., 12, 3165, https://doi.org/10.3390/rs12193165, 2020b.
Mariani, Z., Hicks-Jalali, S., Strawbridge, K., Gwozdecky, J., Crawford, R. W., Casati, B., Lemay, F., Lehtinen, R., and Tuominen, P.: Evaluation of Arctic Water Vapor Profile Observations from a Differential Absorption Lidar, Remote Sens., 13, 551, https://doi.org/10.3390/rs13040551, 2021.
Mariani, Z., Huang, L., and Crawford, R.: Iqaluit, Nunavut (CYFB) Enhanced Site for Canadian Arctic Weather Science (CAWS) Project, Government of Canada Open Data Portal [data set], https://doi.org/10.18164/ff771396-b22c-4bc3-844d-38fc697049e9, 2022a.
Mariani, Z., Huang, L., and Crawford, R.: Whitehorse, Yukon (CYXY) Enhanced Site for Canadian Arctic Weather Science (CAWS) Project, Government of Canada Open Data Portal [data set], https://doi.org/10.18164/d92ed3cf-4ba0-4473-beec-357ec45b0e78, 2022b.
Milewska, E. J., Vincent, L. A., Hartwell, M. M., Charlesworth, K., and Mekis, É.: Adjusting precipitation amounts from Geonor and Pluvio automated weighing gauges to preserve continuity of observations in Canada, Can. Water Res. J., 44, 127–145, https://doi.org/10.1080/07011784.2018.1530611, 2019.
Montero-Martinez, G., Kostinski, A. B., Shaw, R. A., and Garcia-Garcia, F.: Do all raindrops fall at terminal speed?, Geophys. Res. Lett., 36, L11818, https://doi.org/10.1029/2008GL037111, 2009.
Newman, A. J., Kucera, P. A., and Bliven, L. F.: Presenting the snowflake video imager (SVI), J. Atmos. Oceanic Technol., 26, 167–179, https://doi.org/10.1175/2008JTECHA1148.1, 2009.
Newsom, R. K., Turner, D. D., Lehtinen, R., Münkel, C., Kallio, J., and Roininen, R.: Evaluation of a Compact Broadband Differential Absorption Lidar for Routine Water Vapor Profiling in the Atmospheric Boundary layer, J. Atmos. Ocean. Technol., 37, 47–65, 2020.
Nitu, R., Roulet, Y., Wolff, M., Earle, M., Reverdin, A., Smith, C., Kochendorfer, J., Morin, S., Rasmussen, R., Wong, K., Alastru ìe, J., Arnold, L., Baker, B., Buisan, S., Collado, J. L., Colli, M., Collins, B., Gaydos, A., Hannula, H.R., Hoover, J., Joe, P., Kontu, A., Laine, T., Lanza, L., Lanzinger, E., Lee, G.W., Lejeune, Y., Leppanen, L., Mekis, E., Panel, J., Poikonen, A., Ryu, S., Sabatini, F., Theriault, J., Yang, D., Genthon, C., van den Heuvel, F., Hirasawa, N., Konishi, H., Nishimura, K., and Senese, A.: WMO solid precipitation intercomparison experiment (SPICE) (2012–2015), https://library.wmo.int/doc_num.php?explnum_id=5686 (last access: 2 November 2022), 2018.
Päschke, E., Leinweber, R., and Lehmann, V.: An assessment of the performance of a 1.5 µm Doppler lidar for operational vertical wind profiling based on a 1-year trial, Atmos. Meas. Tech., 8, 2251–2266, https://doi.org/10.5194/amt-8-2251-2015, 2015.
Pettersen, C., Bliven, L. F., von Lerber, A., Wood, N. B., Kulie, M. S., Mateling, M. E., Moisseev, D. N., Munchak, S. J., Petersen, W. A., and Wolff, D. B.: The Precipitation Imaging Package: Assessment of Microphysical and Bulk Characteristics of Snow, Atmosphere, 11, 785, https://doi.org/10.3390/atmos11080785, 2020.
Pettersen, C., Bliven, L. F., Kulie, M. S., Wood, N. B., Shates, J., Anderson, J., Mateling, M., Petersen, W. A., Lerber, A. V., and Wolff, D. B.: The Precipitation Imaging Package: Phase Partitioning Capabilities, Remote Sens., 13, 2183, https://doi.org/10.3390/rs13112183, 2021.
Riishojgaard, L.: Wind Measurements in the WMO Global Observing System, ADM-Aeolus Science and Cal/Val Workshop, ESRIN, Frascati, Frascati, Italy, 10–13 February 2015, https://www.corallia.org/en/all-events/50-adm-aeolus-science-and-cal-val-workshop.html (last access: 4 November 2022), 2015.
Roininen, R. and Münkel, C.: Results from Continuous Atmospheric Boundary Layer Humidity Profiling with a Compact DIAL Instrument, in: Proceedings of the Eighth Symposium on Lidar Atmospheric Applications, Seattle, WA, USA, 23 January 2017, American Meteorologic Society, Boston, MA, USA, 2017, Volume 12.3, https://ams.confex.com/ams/97Annual/webprogram/Paper301717.html (last access: 14 July 2021), 2017.
Ross, A., Smith, C. D., and Barr, A.: An improved post-processing technique for automatic precipitation gauge time series, Atmos. Meas. Tech., 13, 2979–2994, https://doi.org/10.5194/amt-13-2979-2020, 2020.
Schyberg, H. and Randriamampianina, R.: MET Norway plans for contribution to calibration-validation and use of Aeolus winds, ADM-Aeolus Science and Cal/Val Workshop, ESRIN, Frascati, Italy, 10–13 February 2015, https://www.corallia.org/en/all-events/50-adm-aeolus-science-and-cal-val-workshop.html (last access: 4 November 2022), 2015.
Sheppard, B. E. and Joe, P. I.: Performance of the Precipitation Occurrence Sensor System as a Precipitation Gauge, J. Atmos. Ocean. Tech., 25, 196–212, https://doi.org/10.1175/2007JTECHA957.1, 2008.
Sheppard, B. E., Thurai, M., Rodriguez, P., Kennedy, P. C., and Hudak, D.: Improved Precipitation Typing Using POSS Spectral Modal Analysis, J. Atmos. Ocean. Tech., 38, 537–554, https://doi.org/10.1175/JTECH-D-20-0075.1, 2021.
Smith, C. D., Mekis, E., Hartwell, M., and Ross, A.: The hourly wind-bias adjusted precipitation data set from the Environment and Climate Change Canada automated surface observation network (2001–2019), Earth Syst. Sci. Data Discuss. [preprint], https://doi.org/10.5194/essd-2022-208, in review, 2022.
Smith, L. C. and Stephenson, S. R.: New Trans-Arctic Shipping routes navigable by mid century, P. Natl. Acad. Sci. USA, 110, 4871–4872, 2013.
Statistics Canada: Table 051-0005 – Estimates of population, Canada, provinces and territories, quarterly (persons), CANSIM (database), https://www150.statcan.gc.ca/t1/tbl1/en/tv.action?pid=1710000901 (last access: 4 November 2022), 2016.
Strawbridge, K. B.: Developing a portable, autonomous aerosol backscatter lidar for network or remote operations, Atmos. Meas. Tech., 6, 801–816, https://doi.org/10.5194/amt-6-801-2013, 2013.
Strawbridge, K. B., Travis, M. S., Firanski, B. J., Brook, J. R., Staebler, R., and Leblanc, T.: A fully autonomous ozone, aerosol and nighttime water vapor lidar: a synergistic approach to profiling the atmosphere in the Canadian oil sands region, Atmos. Meas. Tech., 11, 6735–6759, https://doi.org/10.5194/amt-11-6735-2018, 2018.
Thériault, J. M., Déry, S. J., Pomeroy, J. W., Smith, H. M., Almonte, J., Bertoncini, A., Crawford, R. W., Desroches-Lapointe, A., Lachapelle, M., Mariani, Z., Mitchell, S., Morris, J. E., Hébert-Pinard, C., Rodriguez, P., and Thompson, H. D.: Meteorological observations collected during the Storms and Precipitation Across the continental Divide Experiment (SPADE), April–June 2019, Earth Syst. Sci. Data, 13, 1233–1249, https://doi.org/10.5194/essd-13-1233-2021, 2021.
Tiira, J., Moisseev, D. N., von Lerber, A., Ori, D., Tokay, A., Bliven, L. F., and Petersen, W.: Ensemble mean density and its connection to other microphysical properties of falling snow as observed in Southern Finland, Atmos. Meas. Tech., 9, 4825–4841, https://doi.org/10.5194/amt-9-4825-2016, 2016.
Tokay, A., Wolff, D., and Petersen, W.: Evaluation of the new version of the laser-optical disdrometer, OTT Parsivel2, J. Atmos. Ocean. Tech., 31, 1276–1288, https://doi.org/10.1175/JTECH-D-13-00174.1, 2014.
Vaisala: Vaisala Radiosonde RS92 Measurement Accuracy, Technical Report, Vaisala, Vantaa, Finland, https://www.vaisala.com/sites/default/files/documents/WEA-MET-WMO-Test-White_Paper-B211129EN-D-LOW.pdf (last access: 4 November 2022), 2007.
Vaisala: User's Guide: VaisalaWeather Transmitter WXT520, https://www.vaisala.com/sites/default/files/documents/M210906EN-C.pdf (last access: 22 October 2019), 2012.
von Lerber, A., Moisseev, D., Marks, D. A., Petersen, W., Harri, A. M., and Chandrasekar, V.: Validation of GMI snowfall observations by using a combination of weather radar and surface measurements. J. Appl. Meteor. Climatol., 57, 797–820, https://doi.org/10.1175/JAMC-D-17-0176.1, 2018.
WMO: Weather extremes in a changing climate: hindsight on foresight. World Meteorological Organization (WMO), WMO-No. 1075, 1–20, ISBN 978-92-63-11075-6, https://library.wmo.int/?lvl=notice_display&id=4132 (last access: 4 November 2022), 2011.
WMO: Dawson, J., Hoke, W., Lamers, M., Liggett, D., Ljubicic, G., Mills, B., Stewart, E., et al., Navigating Weather, Water, Ice and Climate Information for Safe Polar Mobilities, WWRP/PPP No. 5 – 2017, World Meteorological Organization, Geneva, https://core.ac.uk/download/pdf/149404002.pdf (last access: 4 November 2022), 2017.
Zhang, L., Zhao, L., Xie, C., Liu, G., Gao, L., Xiao, Y., Shi, J., and Qiao, Y.: Intercomparison of Solid Precipitation Derived from the Weighting Rain Gauge and Optical Instruments in the Interior Qinghai-Tibetan Plateau, Adv. Meteorol., 2015, 936724, https://doi.org/10.1155/2015/936724, 2015.