the Creative Commons Attribution 4.0 License.
the Creative Commons Attribution 4.0 License.
 | 04 Feb 2022
Homogenized century-long surface incident solar radiation over Japan
Qian Ma
Yanyi He
Liangyuan Su
Qizhong Wu
Han Liu
Youren Zhang
Surface incident solar radiation (Rs) plays a key role in climate change on Earth. Rs can be directly measured, and it shows substantial variability on decadal scales, i.e. global dimming and brightening. Rs can also be derived from the observed sunshine duration (SunDu) with reliable accuracy. The SunDu-derived Rs has been used as a reference to detect and adjust inhomogeneity in the observed Rs. However, both the observed Rs and SunDu-derived Rs may have inhomogeneity. In Japan, SunDu has been measured since 1890, and Rs has been measured since 1961 at ∼100 stations. In this study, the observed Rs and SunDu-derived Rs were first checked for inhomogeneity independently using the statistical software RHtests. If confirmed by the metadata of these observations, the detected inhomogeneity was adjusted based on the RHtests quantile-matching method. Second, the two homogenized time series were compared to detect further possible inhomogeneity. If confirmed by the independent ground-based manual observations of cloud cover fraction, the detected inhomogeneity was adjusted based on the reference dataset. As a result, a sharp decrease of more than 20 W m−2 in the observed Rs from 1961 to 1975 caused by instrument displacement was detected and adjusted. Similarly, a decline of about 20 W m−2 in SunDu-derived Rs due to steady instrument replacement from 1985 to 1990 was detected and adjusted too. After homogenization, the two estimates of Rs agree well. The homogenized SunDu-derived Rs show an increased at a rate of 0.9 W m−2 per decade (p<0.01) from 1961 to 2014, which was caused by a positive aerosol-related radiative effect (2.2 W m−2 per decade) and a negative cloud cover radiative effect (−1.4 W m−2 per decade). The brightening over Japan was the strongest in spring, likely due to a significant decline in aerosol transported from Asian dust storms. The observed raw Rs data and their homogenized time series used in this study are available at https://doi.org/10.11888/Meteoro.tpdc.271524 (Ma et al., 2021).
- Article
(5035 KB) - Full-text XML
-
Supplement
(283 KB) - BibTeX
- EndNote


Surface incident solar radiation (Rs) plays a vital role in atmospheric circulation, hydrologic cycling, and ecological equilibrium; therefore, its decrease and increase, termed global dimming and brightening (Wild et al., 2005; Shi et al., 2008), have received widespread interest from the public and scientific community (Allen et al., 2013; Xia, 2010; Wang et al., 2013; Tanaka et al., 2016; Ohmura, 2009; He et al., 2018). In addition, the impact factors such as clouds and aerosols on the variation in Rs have been widely studied (Wild et al., 2021; Qian et al., 2006; Feng and Wang, 2021a).
Ground-based observations of Rs are the first recommendation for detecting global dimming and brightening. However, observational data may be inevitably ruined by artificial shifts, which my lead to the variability in Rs with large uncertainties. Wang et al. (2015) point out that instrument replacements and the reconstruction of the observational network introduced substantial inhomogeneity into the time series of observed Rs over China for 1990–1993. Manara et al. (2016) also show the instrument changes from the Robitzsch pyranometer to the Kipp & Zonen CM11 pyranometer before 1980 caused no clear dimming in Italy. Until recently, Wild et al. (2021) use a well-maintained data series at a site in Germany with long time duration to investigate the dimming and brightening in central Europe under clear-sky conditions and point out that the aerosol pollutants are likely major drivers in the Rs variations. Augustine and Hodges (2021) use Surface Radiation Budget (SURFRAD) Network observations to explore the variability in Rs over the US from 1996 to 2019 and find that cloud fraction can explain 62 % of the variation of Rs, while aerosol optical depth (AOD) only accounts for 3 %. Both studies also indicate the measurement instruments have been changed over the observational time periods, which may introduce non-climatic shifts and inhomogeneity in the raw data series.
Homogenizing the observed Rs has been attempted in China (Wang et al., 2015; Tang et al., 2011; Yang et al., 2018), Italy (Manara et al., 2016), Spain (Sanchez-Lorenzo et al., 2013), and Europe (Sanchez-Lorenzo et al., 2015). It is essential to find a homogeneous reference station to compare with the possible inhomogeneous station to test and adjust the inhomogeneity in the observed time series, as done for the homogenization of air temperature (Du et al., 2020; Zhou et al., 2021). However, this process is difficult for Rs because the instrument replacement of Rs generally occurs nearly simultaneously throughout a country. Therefore, the sunshine-duration-derived (SunDu-derived) Rs (Yang et al., 2006) has been used as a homogeneous reference dataset to detect and adjust the inhomogeneity in Rs in China (Wang et al., 2015).
SunDu records the hours of surface direct solar radiation exceeding 120 W m−2 and provides an alternative way to estimate Rs (Yang et al., 2006; Stanhill and Cohen, 2008). SunDu-derived Rs is capable of capturing the variability in Rs. He et al. (2018) use the SunDu-derived Rs at ∼2600 stations to revisit the global dimming and brightening over different continents and restate the dimming over China and Europe is consistent with the increasing trend of clouds and aerosols. Feng and Wang (2021a, b) merge the satellite retrievals with SunDu-derived Rs to produce high-resolution long-term solar radiation over China and indicate the cloud fraction could explain approximately 86 %–97 % of Rs variation. Zeng et al. (2020) demonstrate that SunDu plays a dominant role in determining Rs based on a random forest model framework across China. Stanhill and Cohen (2005) indicate the high correlation between SunDu and Rs at the 26 stations in the United States. Sanchez-Lorenzo et al. (2008) show the variation in SunDu is consistent with that in Rs over western Europe for 1938–2004 and the SunDu time evolution in spring can partly be explained by clouds and that in winter can be related to the anthropogenic aerosol emissions. Stanhill and Cohen (2008) establish a simple linear relationship between Rs and SunDu to determine the long-term variation in Rs over Japan. Manara et al. (2017) highlight that atmospheric turbidity should be considered when using SunDu for investigating multidecadal evolution of Rs.
Artificial shifts in SunDu observations may come from the replacement of instruments. It has been revealed that the Jordan recorder is 10 % more sensitive than the Campbell–Stokes recorder for SunDu measurements (Noguchi, 1981). The homogenization of SunDu has been carried out in the Iberian Peninsula (Sanchez-Lorenzo et al., 2007), Switzerland (Sanchez-Lorenzo and Wild, 2012), and Italy (Manara et al., 2015).
The measurement of Rs, which started in 1961 in Japan, has a long history (Tanaka et al., 2016), and a data record of more than half a century has been accumulated. The dataset has been widely used to study decadal variability (Wild et al., 2005; Stanhill and Cohen, 2008) and to evaluate model simulations (Allen et al., 2013; Dwyer et al., 2010). The Eppley and Robitzsch pyranometers used to measure Rs over Japan were replaced by the Moll–Gorczynski thermopile pyranometers in the early 1970s (Tanaka et al., 2016). However, the possible inhomogeneity of the observed Rs over Japan has not been well quantified, and most existing studies directly used raw Rs data (Wild et al., 2005; Tanaka et al., 2016; Tsutsumi and Murakami, 2012; Allen et al., 2013; Wild and Schmucki, 2011; Kudo et al., 2012; Ohmura, 2009). Some studies have had to abandon data from the early years and focused on only Rs data collected after 1975 (Tsutsumi and Murakami, 2012; Dwyer et al., 2010). Therefore, the observed decadal variability in Rs over Japan is questionable, especially for the 1961–1975 time period.
In Japan, SunDu observations started in 1890, and more than a century of data have been recorded. They cannot be too precious for the climate change detection on a century scale. It is reported that the Jordan recorders used to measure SunDu were replaced by EKO rotating-mirror recorders in approximately 1986 (Inoue and Matsumoto, 2003; Stanhill and Cohen, 2008). Therefore, SunDu observations over Japan themselves may suffer inhomogeneity issues.
Non-climatic shifts in the observations may severely influence the climate assessment; therefore rigorous homogenization is required. The World Meteorological Organization (WMO) guidelines on climate metadata and homogenization list 14 data homogenization assessment techniques developed and applied by different groups/authors (Aguilar et al., 2003). Reeves et al. (2007) compared eight representative homogenization methods and provided guidelines for which procedures work best in different situations; for example the standard normal homogeneity (SNH) test (Alexandersson, 1986) works best if good reference series are available, and two-phase regressions of the Wang procedure (Wang, 2003) are optimal for an unavailable condition of good reference series. Based on the comparison work, the RHtests method was improved by detecting multiple change points in the climate data no matter if the reference series are available (Wang, 2008b; Wang et al., 2010, 2007; Wang, 2008a). This method, which first detects the change points in a series using penalized maximal tests and then tunes the inhomogeneous data segments to be consistent with other segments in empirical distributions, has been widely used in homogenizing climate variables (Dai et al., 2011; Wang et al., 2010; Du et al., 2020; Zhou et al., 2021).
Discontinuities inevitably occurred in the long-term observation system which are required to be checked out and adjusted in the raw data. The homogenized series pose a significant role in the realistic and reliable assessment of climate trend and variability. The main objective of this study is to detect and adjust the inhomogeneity in Rs estimates over Japan. The metadata were first extracted from website information and related records at each site. The SunDu observations were converted into Rs. The RHtests method was applied to homogenize the observed Rs and SunDu-derived Rs, and finally, the century-long homogenized Rs data were produced over Japan. Furthermore, the impacts of cloud cover and aerosols on Rs variation over Japan in recent decades were explored.
2.1 Surface incident solar radiation and sunshine duration
The monthly observed Rs at 105 stations and SunDu at 156 stations were downloaded from the Japan Meteorology Agency (JMA) website (see Table S1 in the Supplement and Fig. 1). Rs records were available from 1961. During the 1960s, two Rs measurements were conducted in parallel by both Eppley and Robitzsch pyranometers. In the early 1970s (see Fig. 2 and Table S2), these instruments were replaced by Moll–Gorczynski thermopile pyranometers. This replacement occurred at approximately 12.4 % of Rs stations in 1971, followed by 22.9 %, 24.8 %, 3.8 %, and 30.5 % in the next 4 years, which may have caused severe data discontinuity problems (Tanaka et al., 2016).
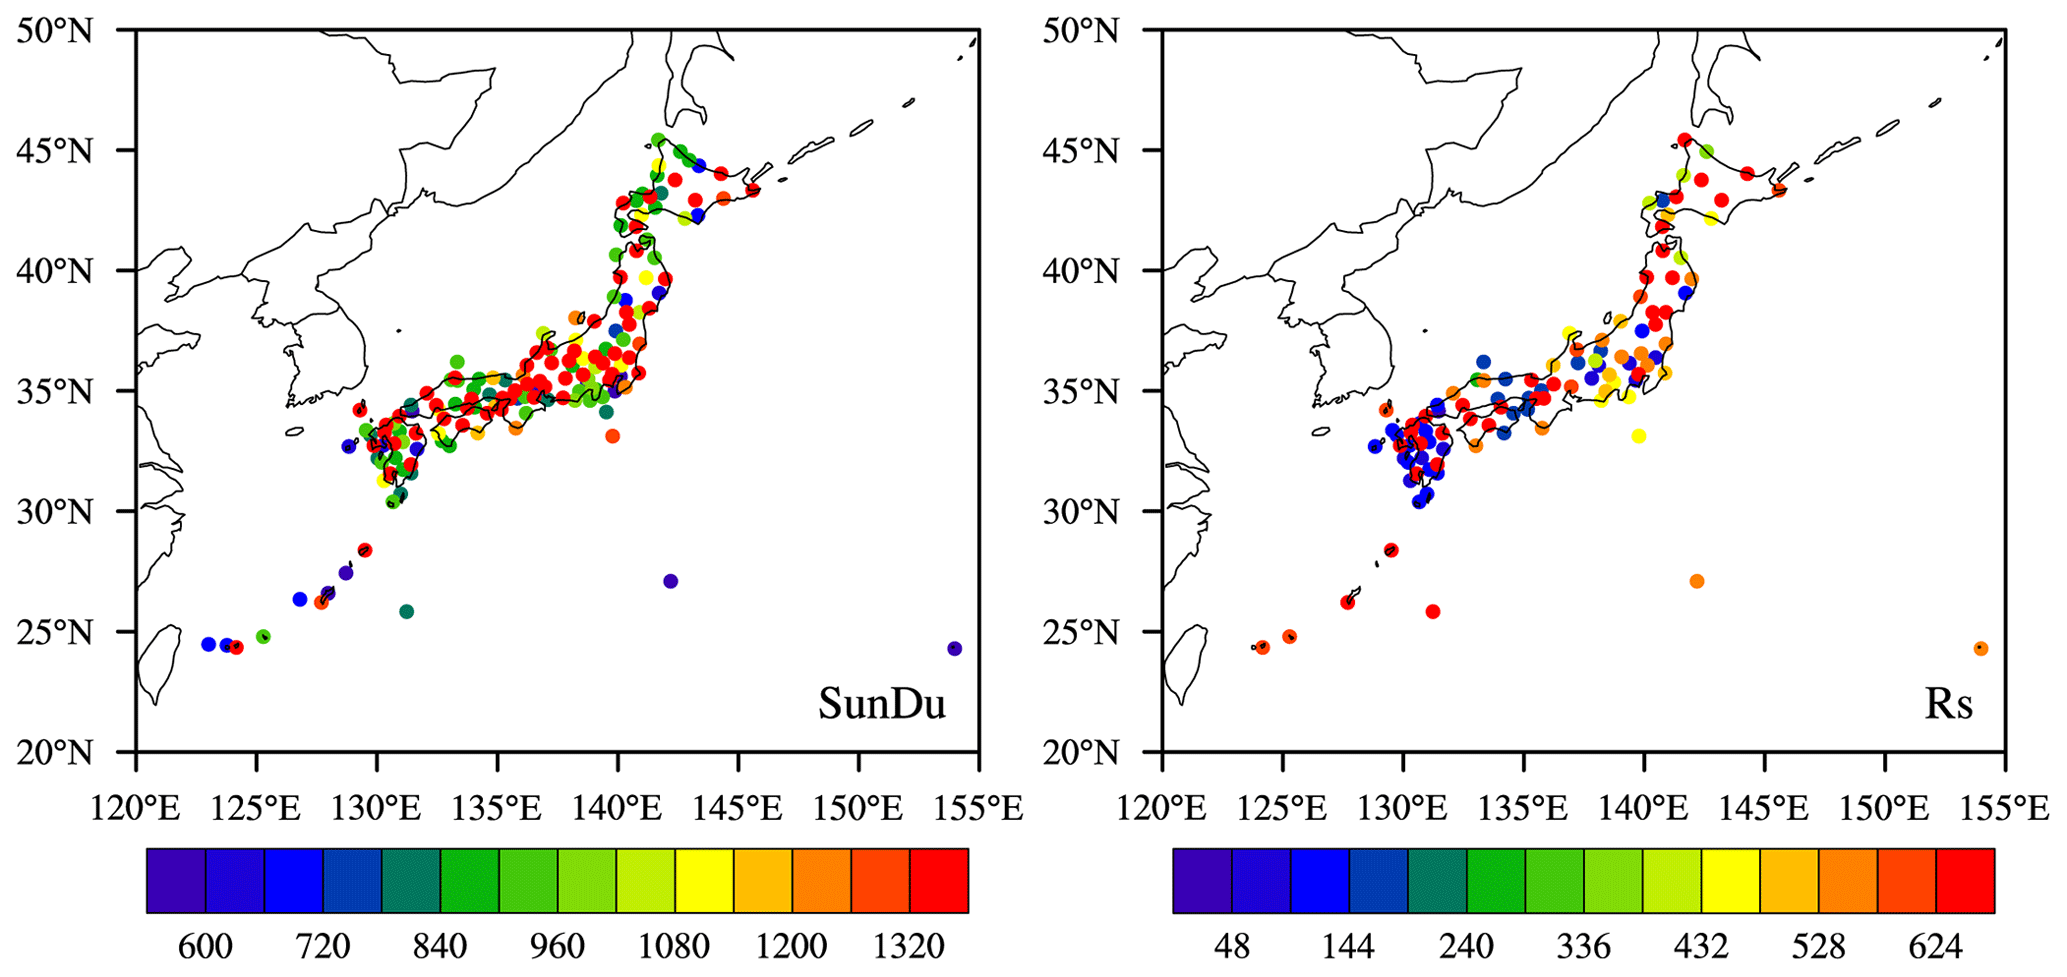
Figure 1The spatial distribution of stations over Japan with observed sunshine duration (SunDu, 156 stations) and surface incident solar radiation (Rs, 105 stations) data. The colours indicate the data length of the SunDu records from 1890 to 2015 and Rs records from 1961 to 2015. Unit: month.
SunDu has been routinely measured since 1890. Jordan recorders were replaced by EKO rotating-mirror recorders at 49.4 % of SunDu stations in 1986. Until 1990, nearly all of the SunDu stations used new instruments for observations; 4.5 % of SunDu stations before 1985 and 9.0 % of SunDu stations after 2000 were moved away from the original sites (see Fig. 2 and Table S2) (Stanhill and Cohen, 2008).
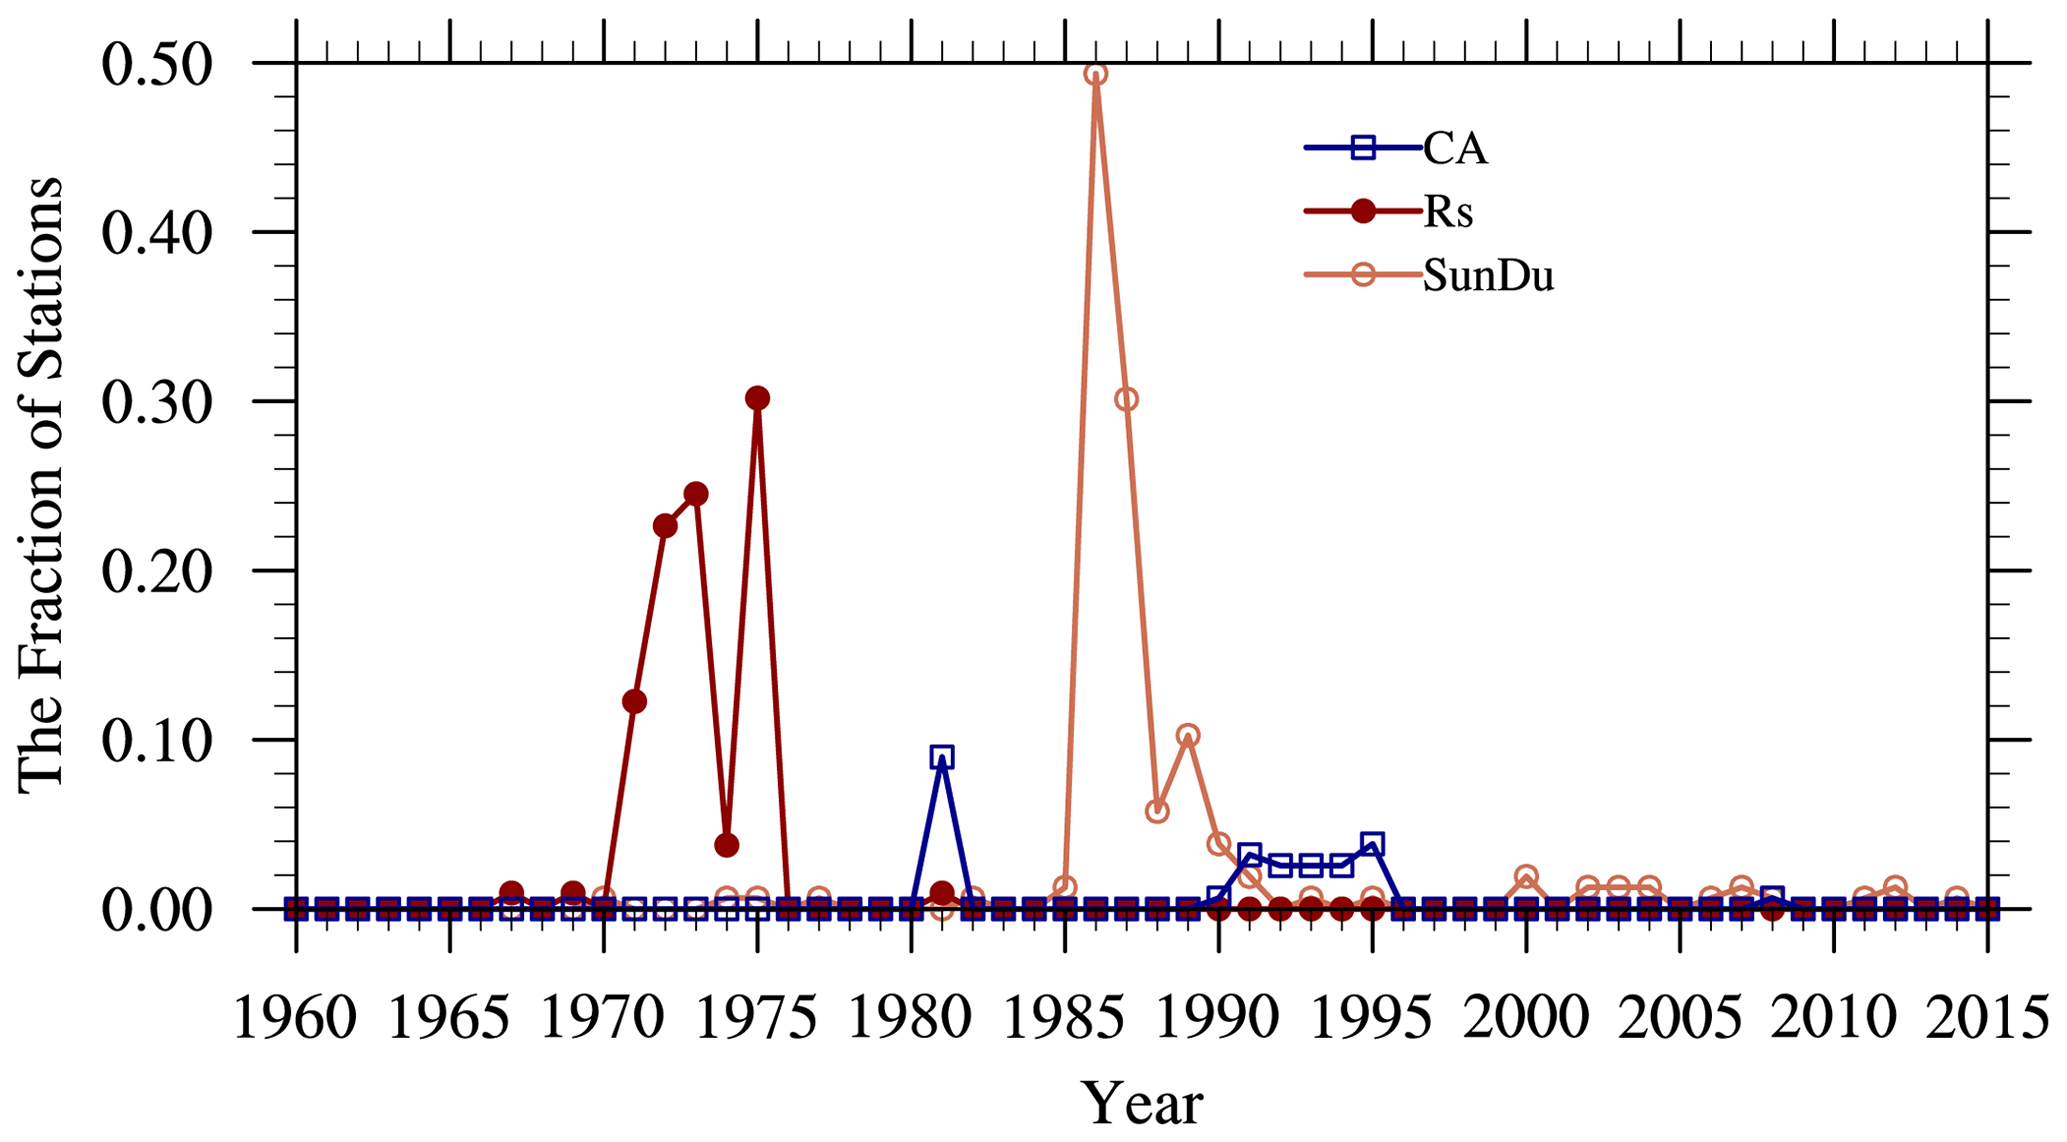
Figure 2The fraction of stations that suffer from data inhomogeneity due to site relocation, the change of instruments, and the measurement method for sunshine duration (SunDu) records, cloud amount (CA) records, and surface incident solar radiation (Rs) records. In total, there were 156 stations with SunDu records, 105 of which had Rs records and 155 of which had CA records. The inhomogeneity information shown here was derived from metadata from https://www.data.jma.go.jp/obd/stats/data/en/smp/index.html (last access: 21 January 2022) and was used as primary information to perform the inhomogeneity adjustment in the RHtests method detailed in Sect. 2.2.
In this study, SunDu was used to derive Rs based on the following equation (Yang et al., 2006):
where n is sunshine duration hours; N is the maximum possible sunshine duration; Rc is surface solar radiation under clear skies; and a0, a1, and a2 are coefficients. This method was recommended in many studies (Wang et al., 2015; Tang et al., 2011).
2.2 Homogenization method
Both Rs and SunDu measurements over Japan suffer severe inhomogeneity problems, which require rigorous data homogenization. RHtests (http://etccdi.pacificclimate.org/software.shtml, last access: 21 January 2022) is a widely used method to detect and adjust multiple change points in a climate data series, such as in surface temperature (Du et al., 2020), radiosonde temperature (Zhou et al., 2021), precipitation (Wang et al., 2010), and surface incident solar radiation (Yang et al., 2018). RHtests provides two algorithms, the penalized maximal t (PMT) test (Wang et al., 2007) and the penalized maximal F (PMF) test (Wang, 2008b), to detect change points. The problem of lag-1 autocorrelation in detecting mean shifts in time series was also resolved (Wang, 2008a). The PMT algorithm requires the base time series to have no trend, and hence a reference series is needed. It is invalid when a reference series is not often available or its homogeneity is not sure; also the trend in the base and reference series are probably different. The PMF algorithm allows the time series to be in a constant trend and thus is applicable without a reference series. Both algorithms have higher detection power, and the false-alarm rate can be reduced by an empirically constructed penalty function.
As the instrument changes for Rs and SunDu observation happened nearly nationwide and simultaneously, it is difficult to find reference data series to match the base data series, and hence the PMF algorithm was used to detect the change points in this study. Multiple change points were detected including climate signals and artificial shifts, and only the ones confirmed by discontinuity information from metadata in Table S2 were left to be adjusted. Then two homogenized series based on the direct measurement of Rs and SunDu-derived Rs were obtained.
Large uncertainties may still exist in both homogenized data series, as the discontinuities in the raw observations may not be sufficiently and correctly recorded in the metadata. Further change points can be detected by considering the impact of the variation in independent climate variables such as clouds and aerosols on the Rs variation. If these uncertainties were found, further change point detections were needed based on the PMT or PMF algorithm.
To diminish all significant artificial shifts caused by the change points, newly developed quantile-matching (QM) adjustments in RHtests (Vincent et al., 2012; Wang et al., 2010) were performed to adjust the series so that the empirical distributions of all segments of the detrended base series agree with each other. The corrected values are all based on the empirical frequency of the datum to be adjusted.
Another independent homogenization method proposed by Katsuyama (1987), which was developed due to the replacement of the Jordan recorders with EKO rotating-mirror recorders during the late 1980s, is denoted as follows:
where SJ is the daily SunDu observed by the Jordan recorders before replacement and SR is the daily SunDu adjusted to be consistent with the values observed with the EKO rotating-mirror recorders.
These two homogenization methods were compared in this study and yielded nearly the same SunDu-derived Rs variation, as shown in Fig. 3. Although the second method proposed by Katsuyama (1987) is simple and efficient, we just use it to cross-validate the accuracy of the RHtests method. Since most artificial shifts in the observation system were undocumented worldwide, the statistical methods including RHtests are optimal to identify these non-climatic signals and reduce the discontinuities in the data series. As RHtests can detect the change points in the raw data series when the metadata are unavailable, while Katsuyama (1987) cannot, RHtests was selected in this study.
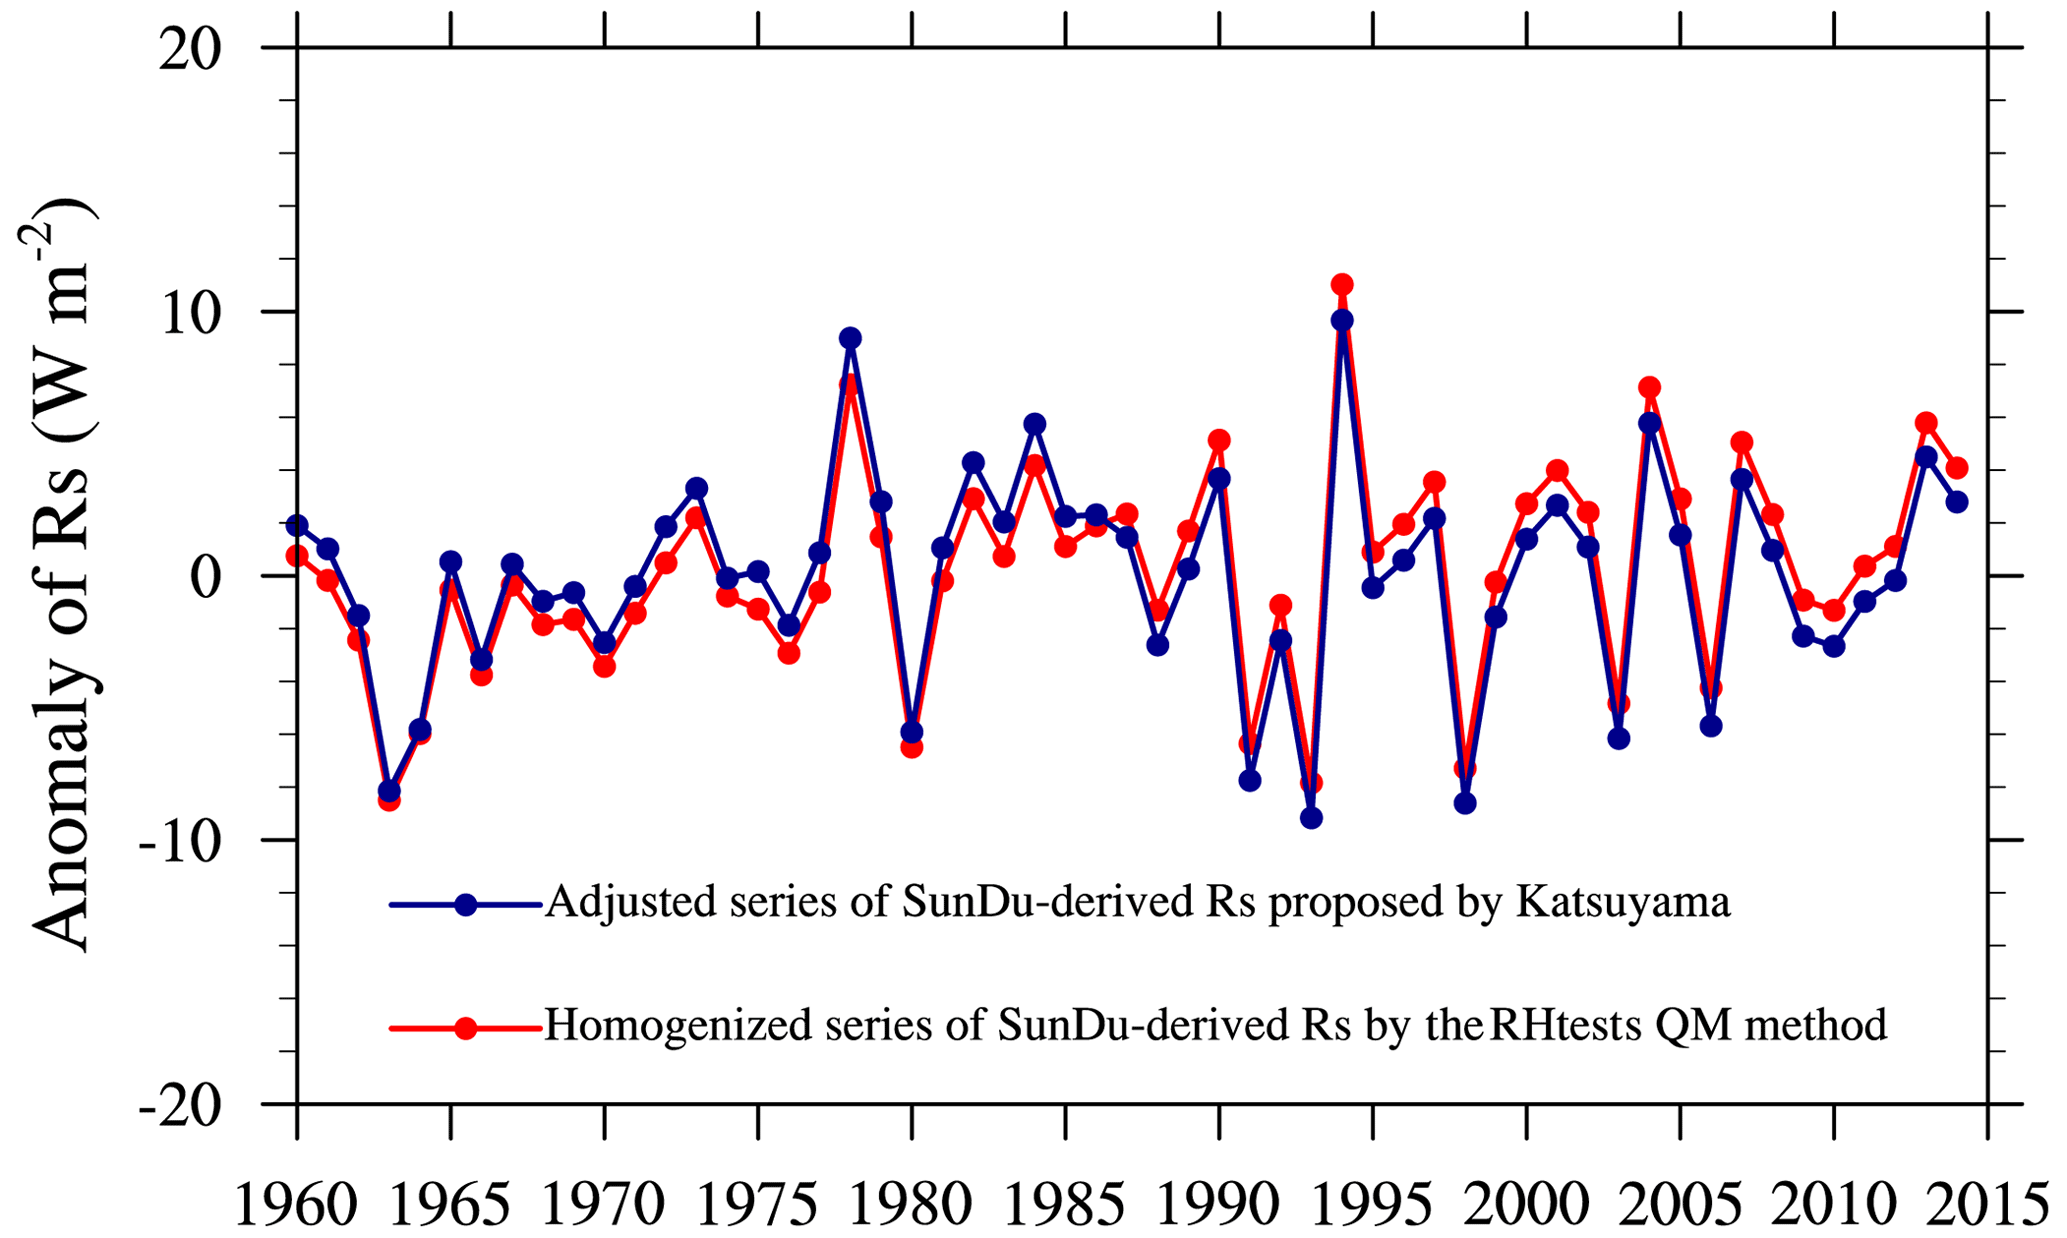
Figure 3The anomalies of surface incident solar radiation (Rs) derived from homogenized sunshine duration (SunDu) data (red line) by the RHtests QM method and other independent data (blue line) adjusted by the method in Katsuyama (1987). Both of the homogenized datasets yield nearly the same Rs variation.
2.3 Clouds
Clouds play an important role in Rs variation (Norris and Wild, 2009). Monthly cloud cover observations at 155 stations were also available on the JMA website. The observation time for cloud amount has been 08:00–19:00 LT since 1981 at 9.0 % of cloud amount stations and 08:30–17:00 LT from 1990 to 1995 at another 15.4 % of cloud amount stations (see Fig. 2 and Table S2). However, the difference between annual raw and homogenized cloud data is trivial, as cloud data are relatively homogeneous in space compared with Rs and SunDu observations. A site observation of cloud amount can represent the value over a large spatial scale, likely leading to a few inhomogeneity issues for cloud data.
To explore the impact of the cloud cover anomaly on the Rs variation, the cloud cover radiative effect (CCRE), defined as the change in Rs produced by a change in cloud cover, was proposed by the following (Norris and Wild, 2009):
where lat is the latitude, long is the longitude, y is the year, m is the month, CCRE′ is the cloud cover radiative effect anomaly, CC′ is the cloud cover anomaly, is the climatology of cloud cover in 12 months, and CRE is the cloud radiative effect calculated by the Rs difference under all-sky and clear-sky conditions.
The residual radiative effect was determined by removing the CCRE anomalies from the Rs anomalies. It is noted that a part of the cloud albedo radiative effect proportional to the cloud amount was contained in the CCRE, as a large cloud amount tends to yield enhanced cloud albedo, whereas another part of the cloud albedo radiative effect due to the aerosol first indirect effect (more aerosols facilitating more cloud condensation nuclei may enhance cloud albedo) may be included in the residual radiative effect, which mainly contains the aerosol radiative effect.
Clouds and the Earth's Radiant Energy System (CERES) provides a reliable surface incident solar radiation (Ma et al., 2015) primarily based on the Moderate Resolution Imaging Spectroradiometer (MODIS) cloud and aerosol products (Kato et al., 2012). The cloud amount in CERES agrees well with the observations, and the annual CRE in CERES is well correlated with the annual cloud amount in Fig. 10. The regional average cloud amount over Japan in Fig. 10 (blue line) increases at a rate of 0.7 % per decade from 1960 to 2015, which is consistent with the previous results (Fig. 4 in Tsutsumi and Murakami, 2012).
In this study, long-term observations of cloud amount and monthly cloud radiative effect (CRE) data in the CERES EBAF (Energy Balanced and Filled) edition were used following Eq. (4) to distinguish the cloud cover radiative effect from Rs variation.
2.4 Data processing
We first interpolated the monthly observational data at sites into grid data and then calculated the area average of the climate variables. As the brightening and dimming over Japan were the main concern in this study, monthly values were converted into annual values for calculation. If there are missing values in any month in a specific year, the annual value for that year is set to a missing value. The linear regression was used for trend calculation.
In this section, we first compared the observed Rs and sunshine-duration-derived Rs before and after adjustment to demonstrate the necessity and feasibility of the homogenization procedure in Sect. 3.1. As artificial shifts may not be sufficiently and correctly documented by metadata, uncertainties may still exist in the homogenized series. We then tried to explore these uncertainties by considering the influence of other independent climate variables such as clouds and aerosols on the Rs variation and ultimately created a more reasonable homogenized Rs series in Sect. 3.2. In Sect. 3.3, we claimed the significant correction in trend analysis of Rs in Japan and quantified the influence of clouds and aerosols on the Rs variation.
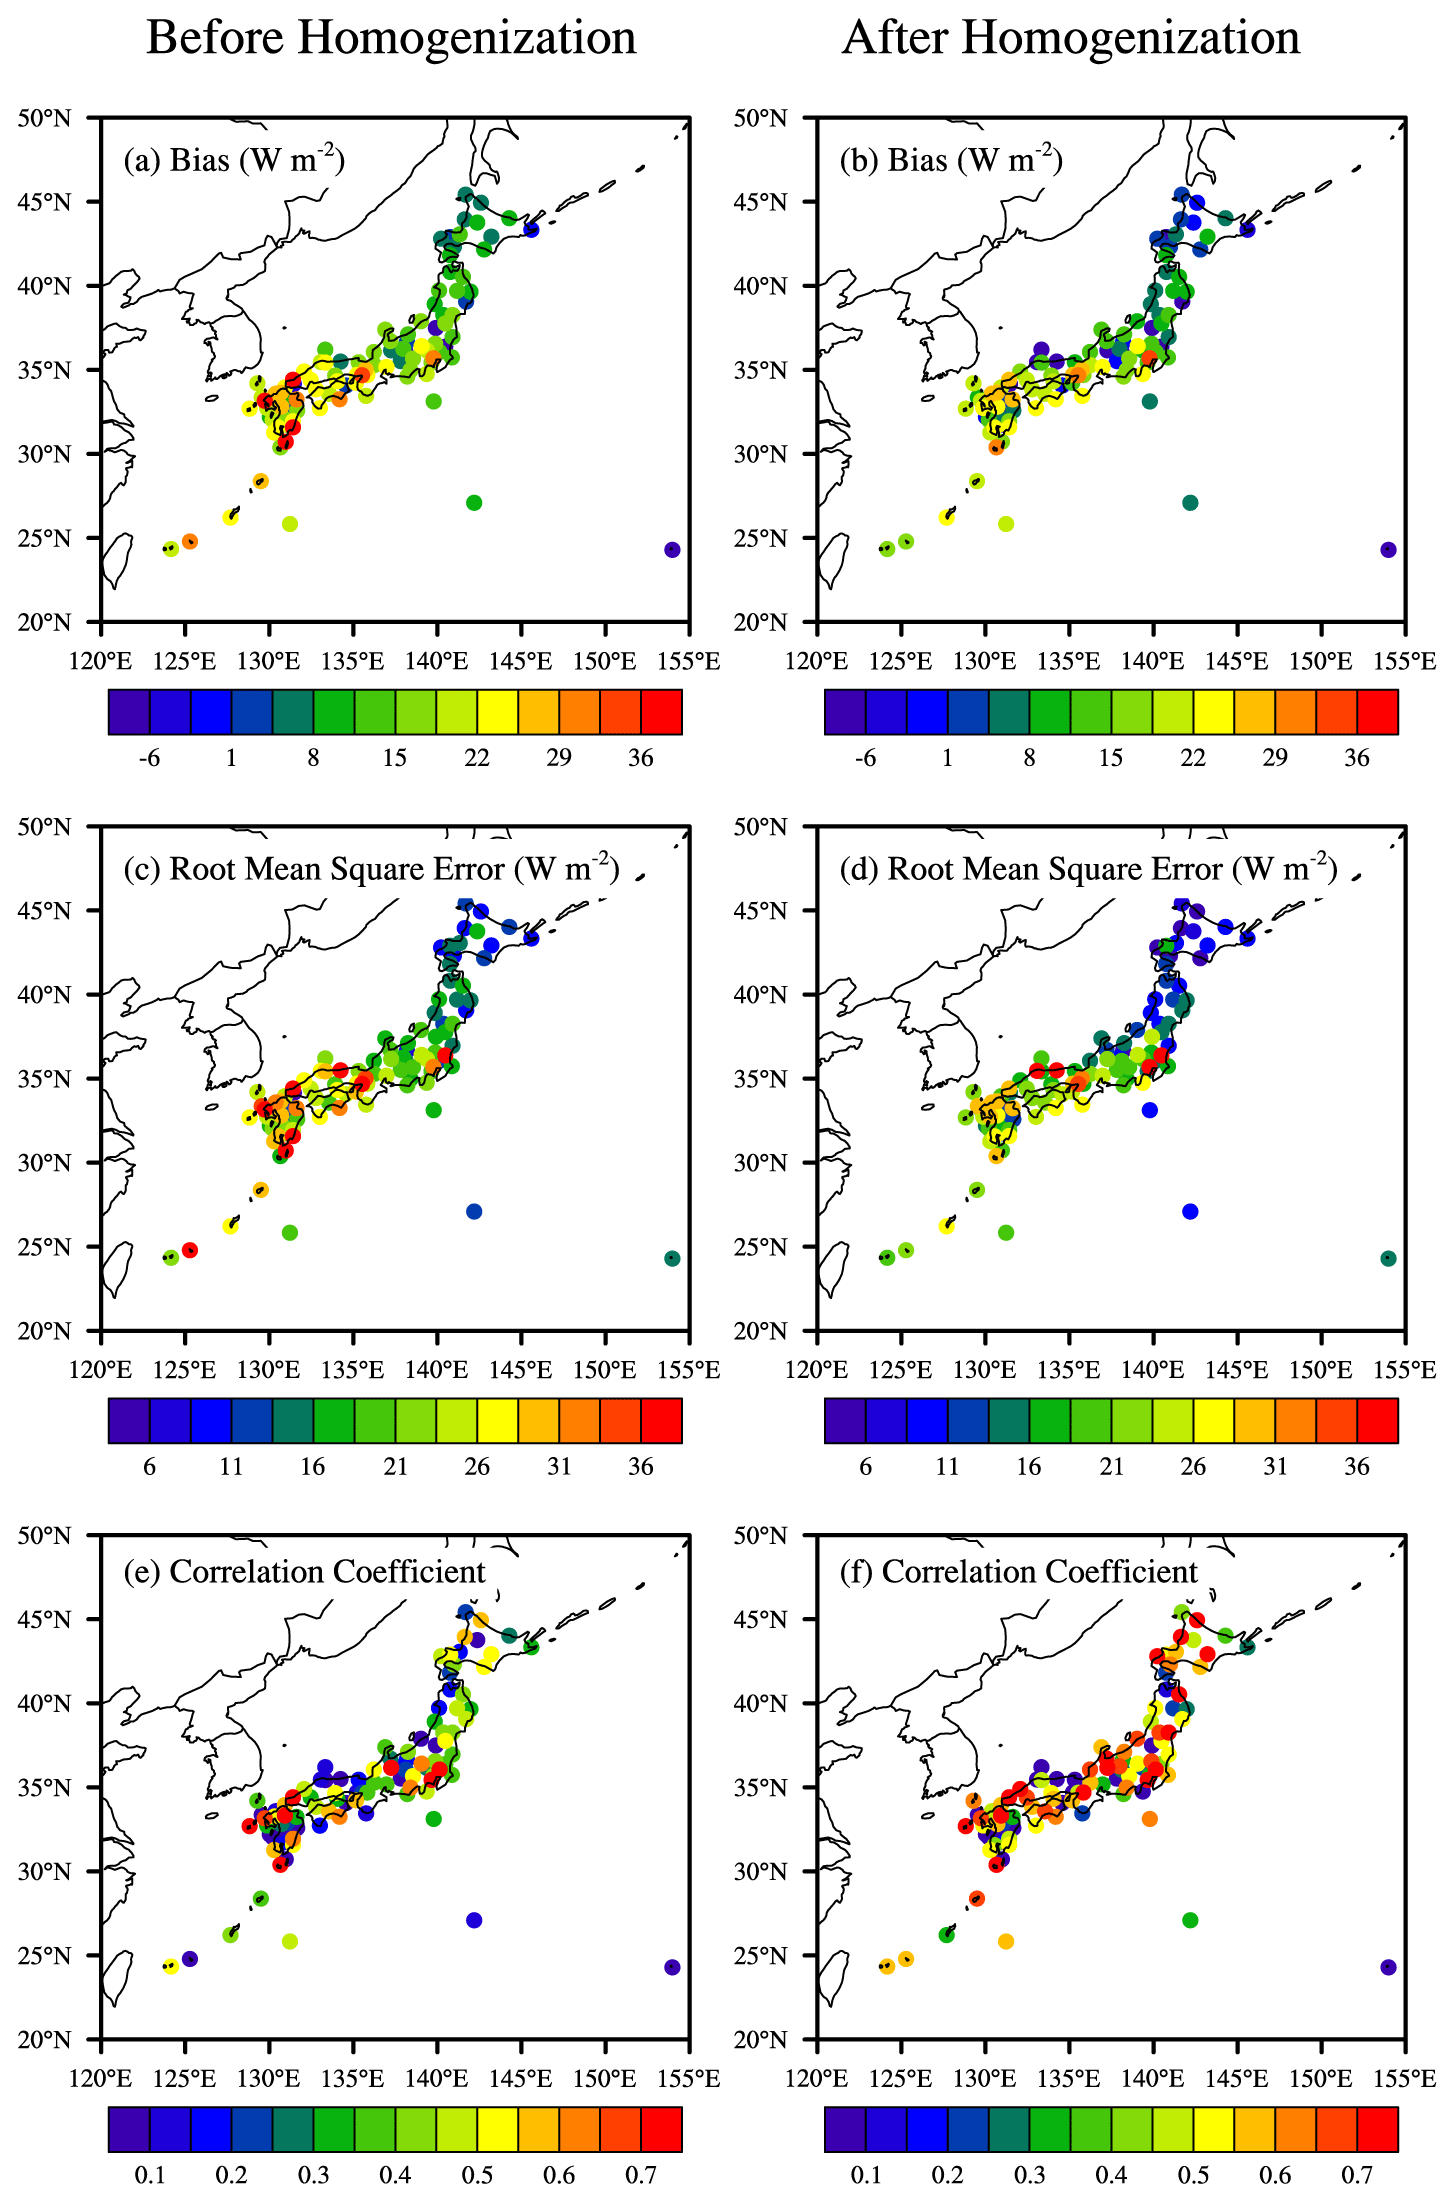
Figure 4The spatial distribution of bias, root mean square error, and the correlation coefficient between SunDu-derived surface incident solar radiation (Rs) and observed Rs before (a, c, e) and after (b, d, f) homogenization. Improvements were made at most sites after homogenization.
3.1 Homogenization of observed Rs and sunshine-duration-derived Rs
The comparisons between raw data and homogenized data at each site were shown in Fig. 4, and their differences were illustrated in Fig. 5. Compared with raw data, the absolute values of biases between Rs and SunDu-derived Rs at 74 stations decrease after homogenization, of which the absolute values of biases decrease by more than 4 W m−2 at 42 stations and more than 10 W m−2 at 8 stations. The root mean square errors at 80 stations were reduced after homogenization, of which reductions are more than 4 W m−2 at 40 stations. After adjustments, the correlation coefficients between the annual observed Rs and annual SunDu-derived Rs are improved at 68 stations, including an improvement of more than 0.2 at 31 stations. There are 41 stations (marked with red in Table S1, Fig. 6) at which the correlation coefficients were greater than 0.5, and the biases and the root mean square errors generally decrease after homogenization.
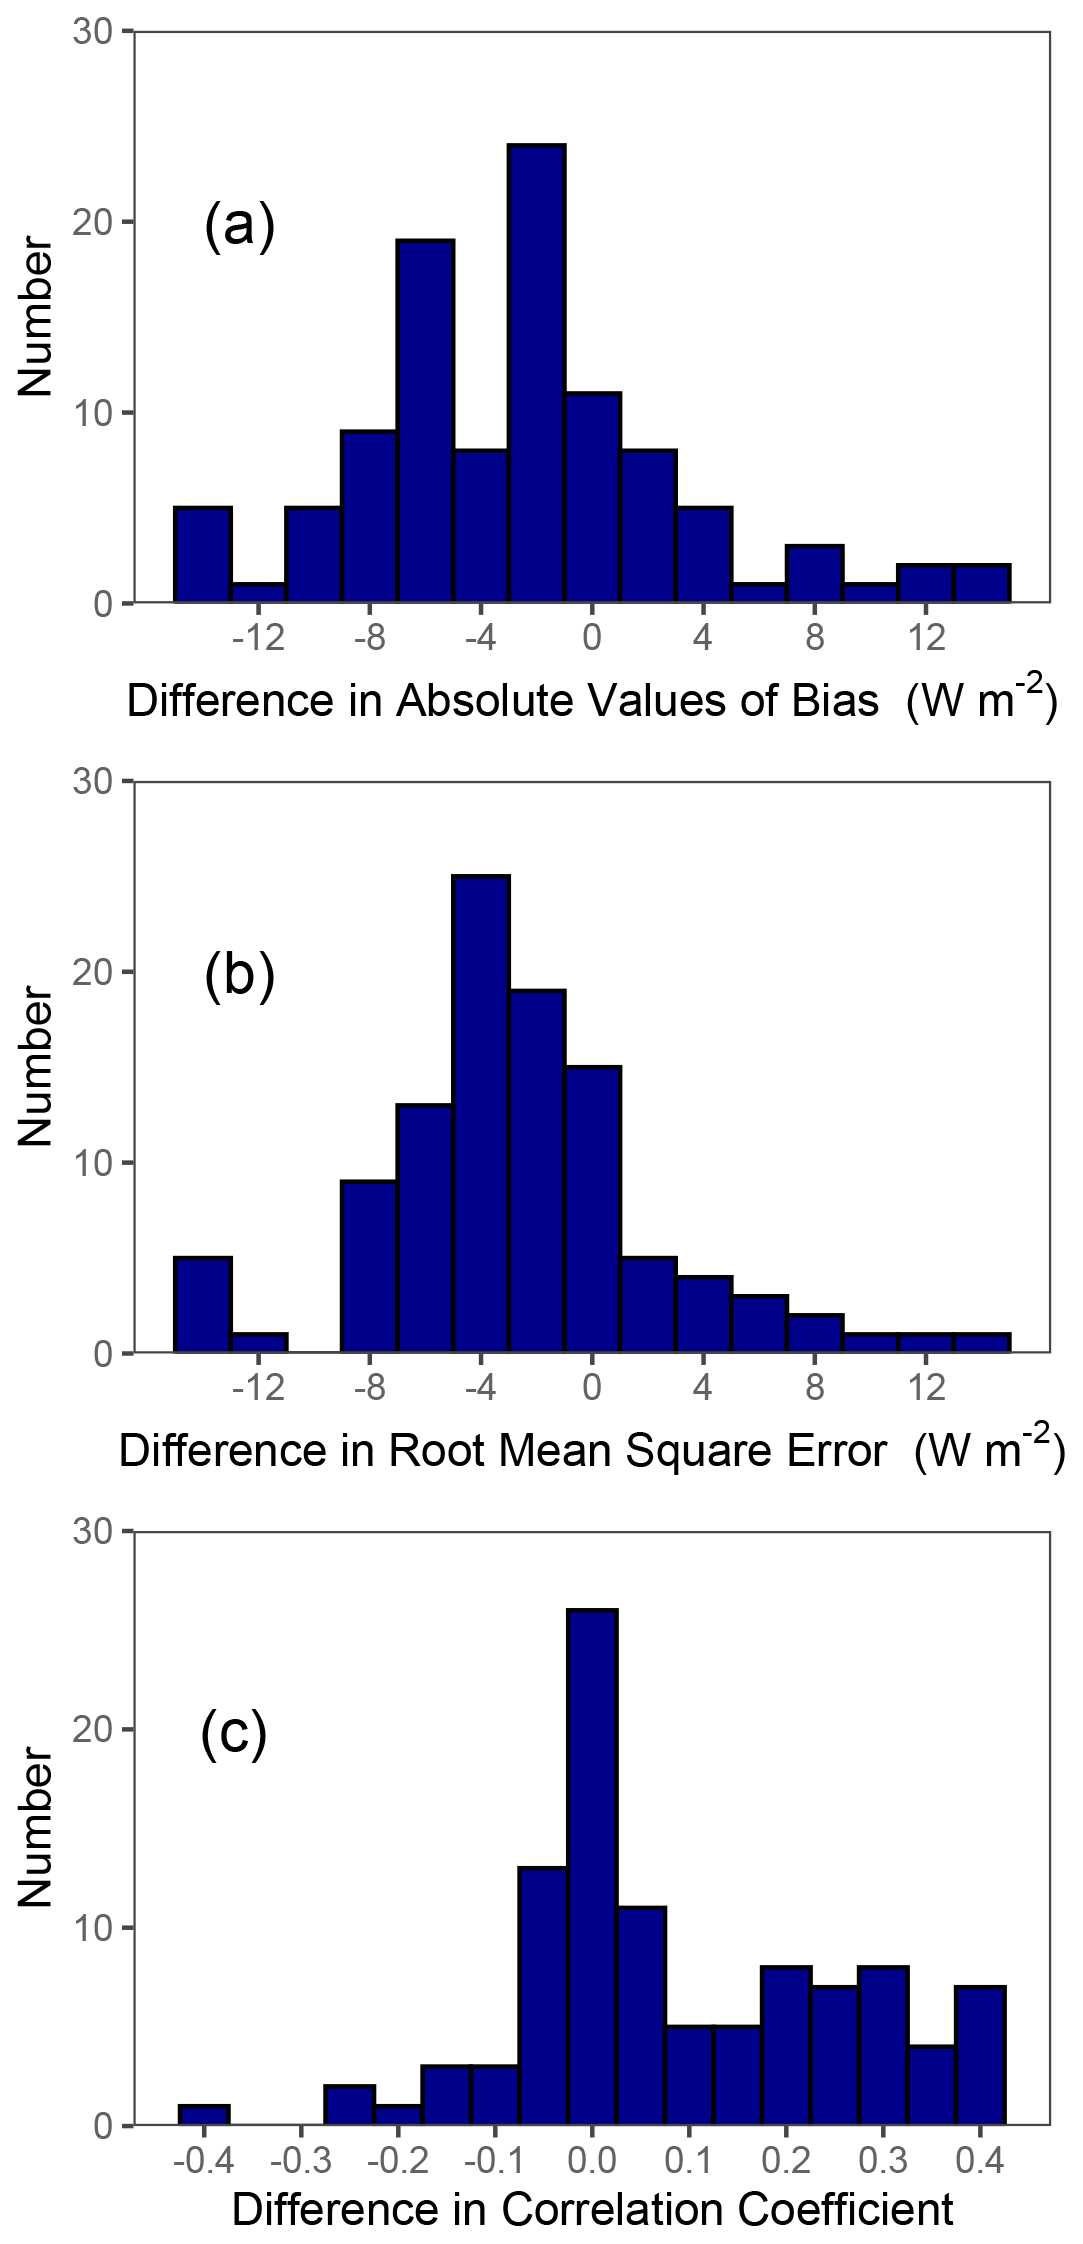
Figure 5Histograms of the difference of (a) absolute values of bias, (b) root mean square error, and (c) correlation coefficient between SunDu-derived surface incident solar radiation (Rs) and observed Rs before and after homogenization. Their differences decrease after homogenization.

Figure 6Taylor diagram describing the relative biases, standardized deviations, and correlation coefficients between the annual observed surface incident short-wave radiation (Rs) and annual sunshine-duration-derived (SunDu-derived) Rs before and after homogenization at 41 selected stations (numbered 1–41 here). “REF” can be treated as the perfect point, where values the closer to this point indicate a better evaluation. The size and direction of the triangles denote the magnitude and negativity or positivity of biases, respectively. The boxes indicate the smaller bias in raw (black colour) or HM (red colour) series. This figure shows that biases decrease at most sites (in red boxes) after homogenization, except for the five stations numbered 4, 25, 32, 36, and 41 (in black boxes). Three stations (numbered 1, 8, and 40 in black colour) listed below the panel are beyond the scope of the figure, with the bias (triangle), ratio of the standardized deviation (above the — line), and correlation coefficient (below the — line) shown. In addition to the improvements in the correlation coefficients after homogenization, the biases and the standard deviations generally become small in this Taylor diagram.
Figure 7, as an example, shows the time series of surface incident solar radiation (Rs and SunDu-derived Rs) at the Hamada site (WMO ID: 47755; lat 34.9, long 132.07) before and after homogenization. Details in the improvements after homogenization at most stations can be traced back to Figs. 4, 5, and 6. The improved patterns of time series of surface incident solar radiation after homogenization highlight the necessity and feasibility of the RHtests method. The SunDu-derived Rs variation over Japan during recent decades inferred from these “perfect” data at 41 sites (Fig. 8) was nearly identical to that from all available data at 156 sites (as shown in Table 1 and Fig. 9).

Figure 7Time series of annual anomalies of observed surface incident solar radiation (Rs) and SunDu-derived Rs at the Hamada site (WMO ID: 47755; lat 34.9, long 132.07) before and after homogenization.
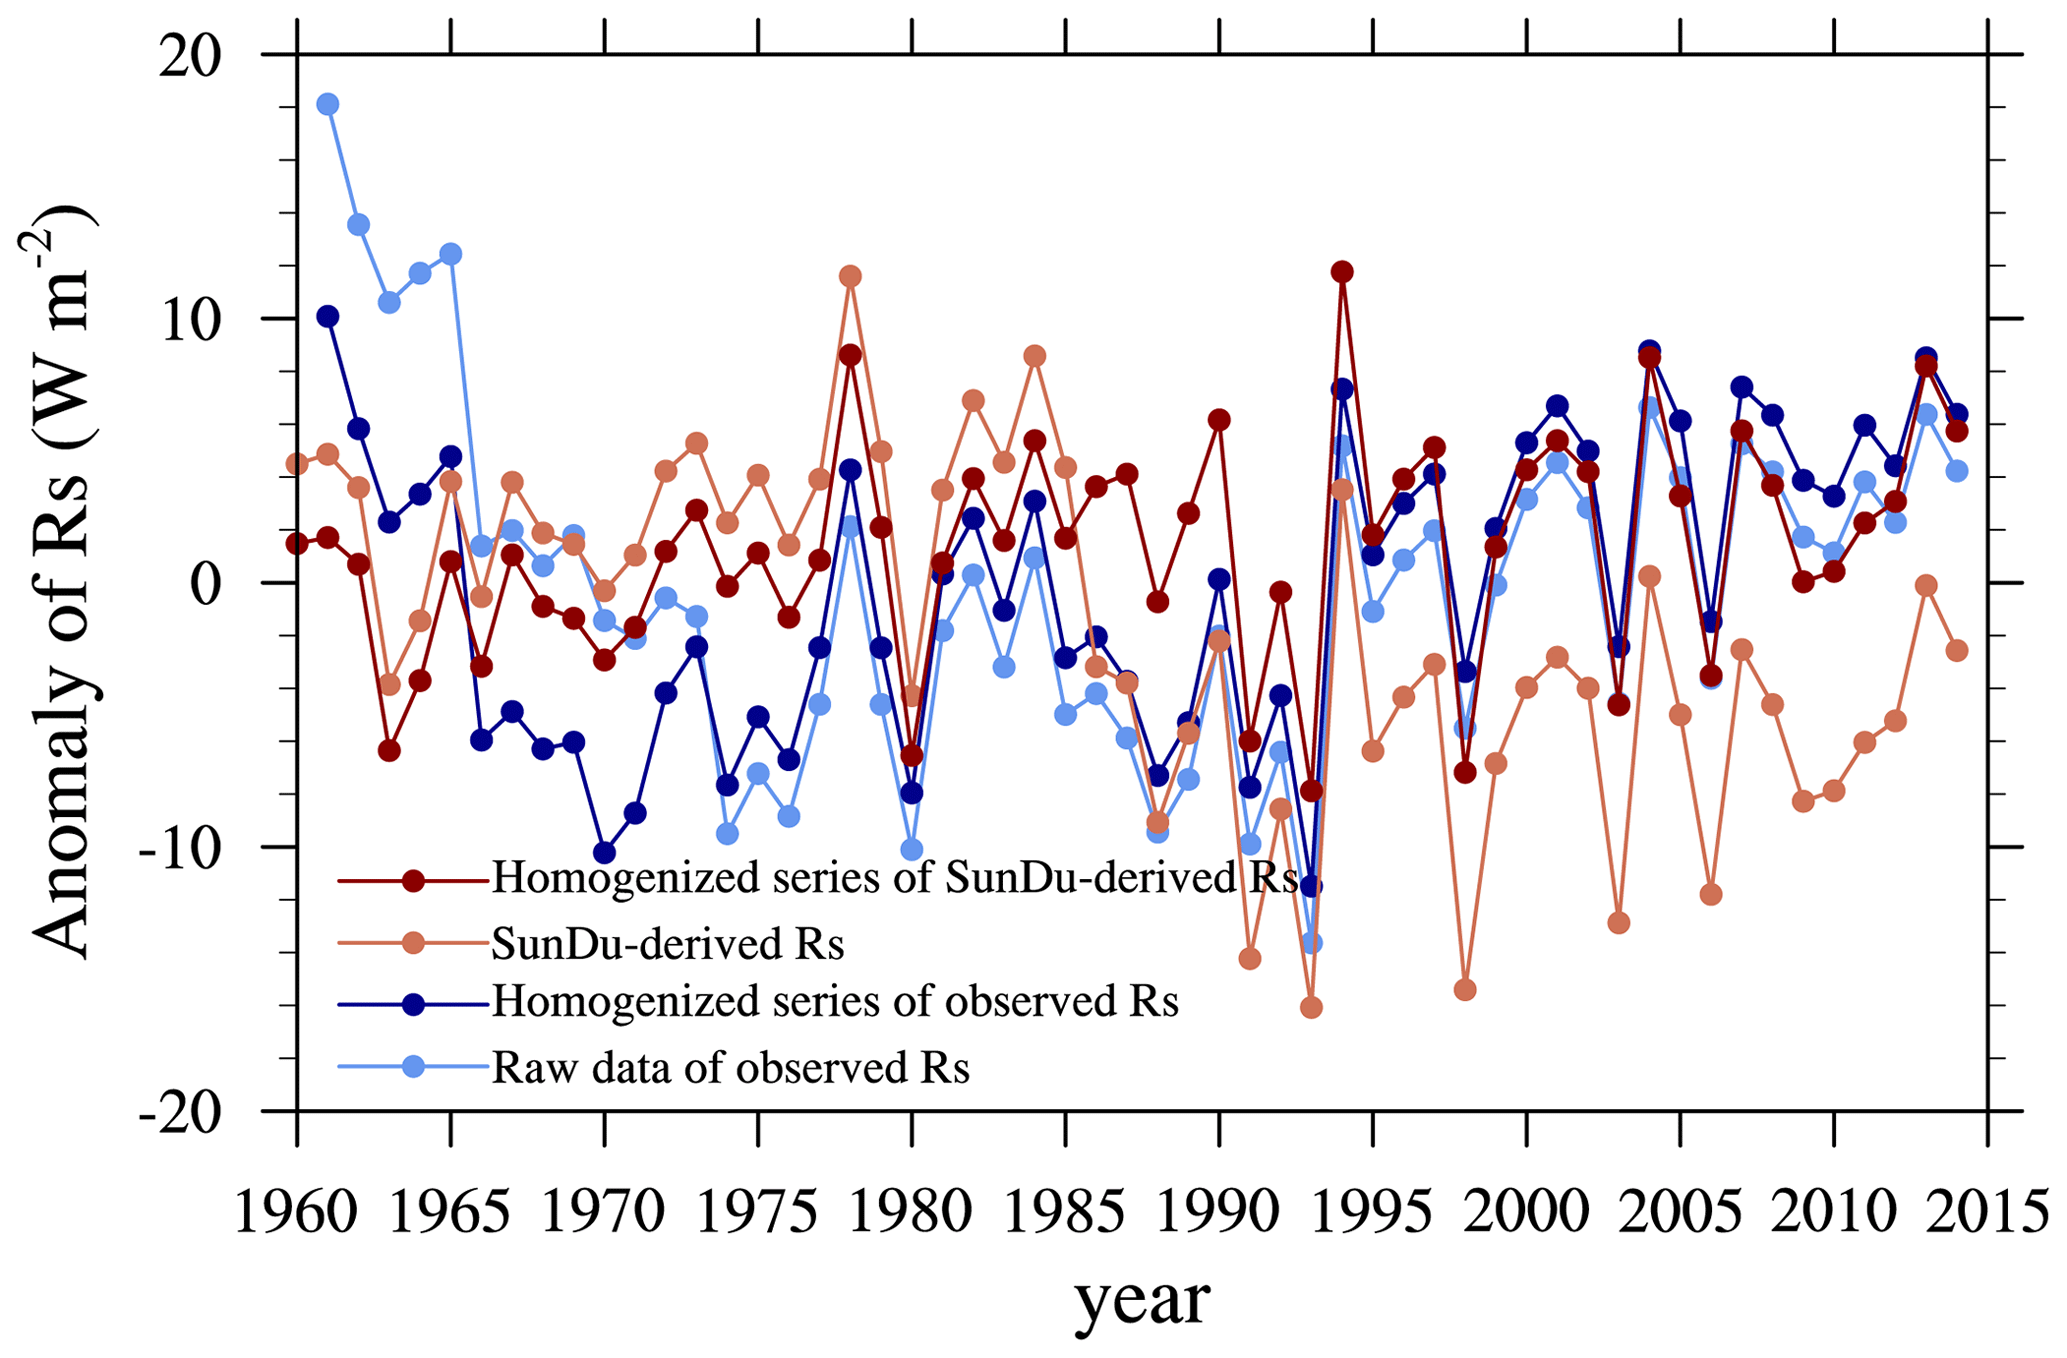
Figure 8Time series of annual anomalies of surface incident solar radiation (Rs) based on direct Rs observations (light-blue line) and their homogenized series (dark-blue line) and sunshine-duration-derived (SunDu-derived) Rs (light-red line) and their homogenized series (dark-red line). All of the lines were calculated based on observations at 41 sites. Details on how these 41 sites were selected are given in Sect. 3.1. The Rs variations are nearly the same as those shown in Fig. 7, which were calculated based on all available observations.
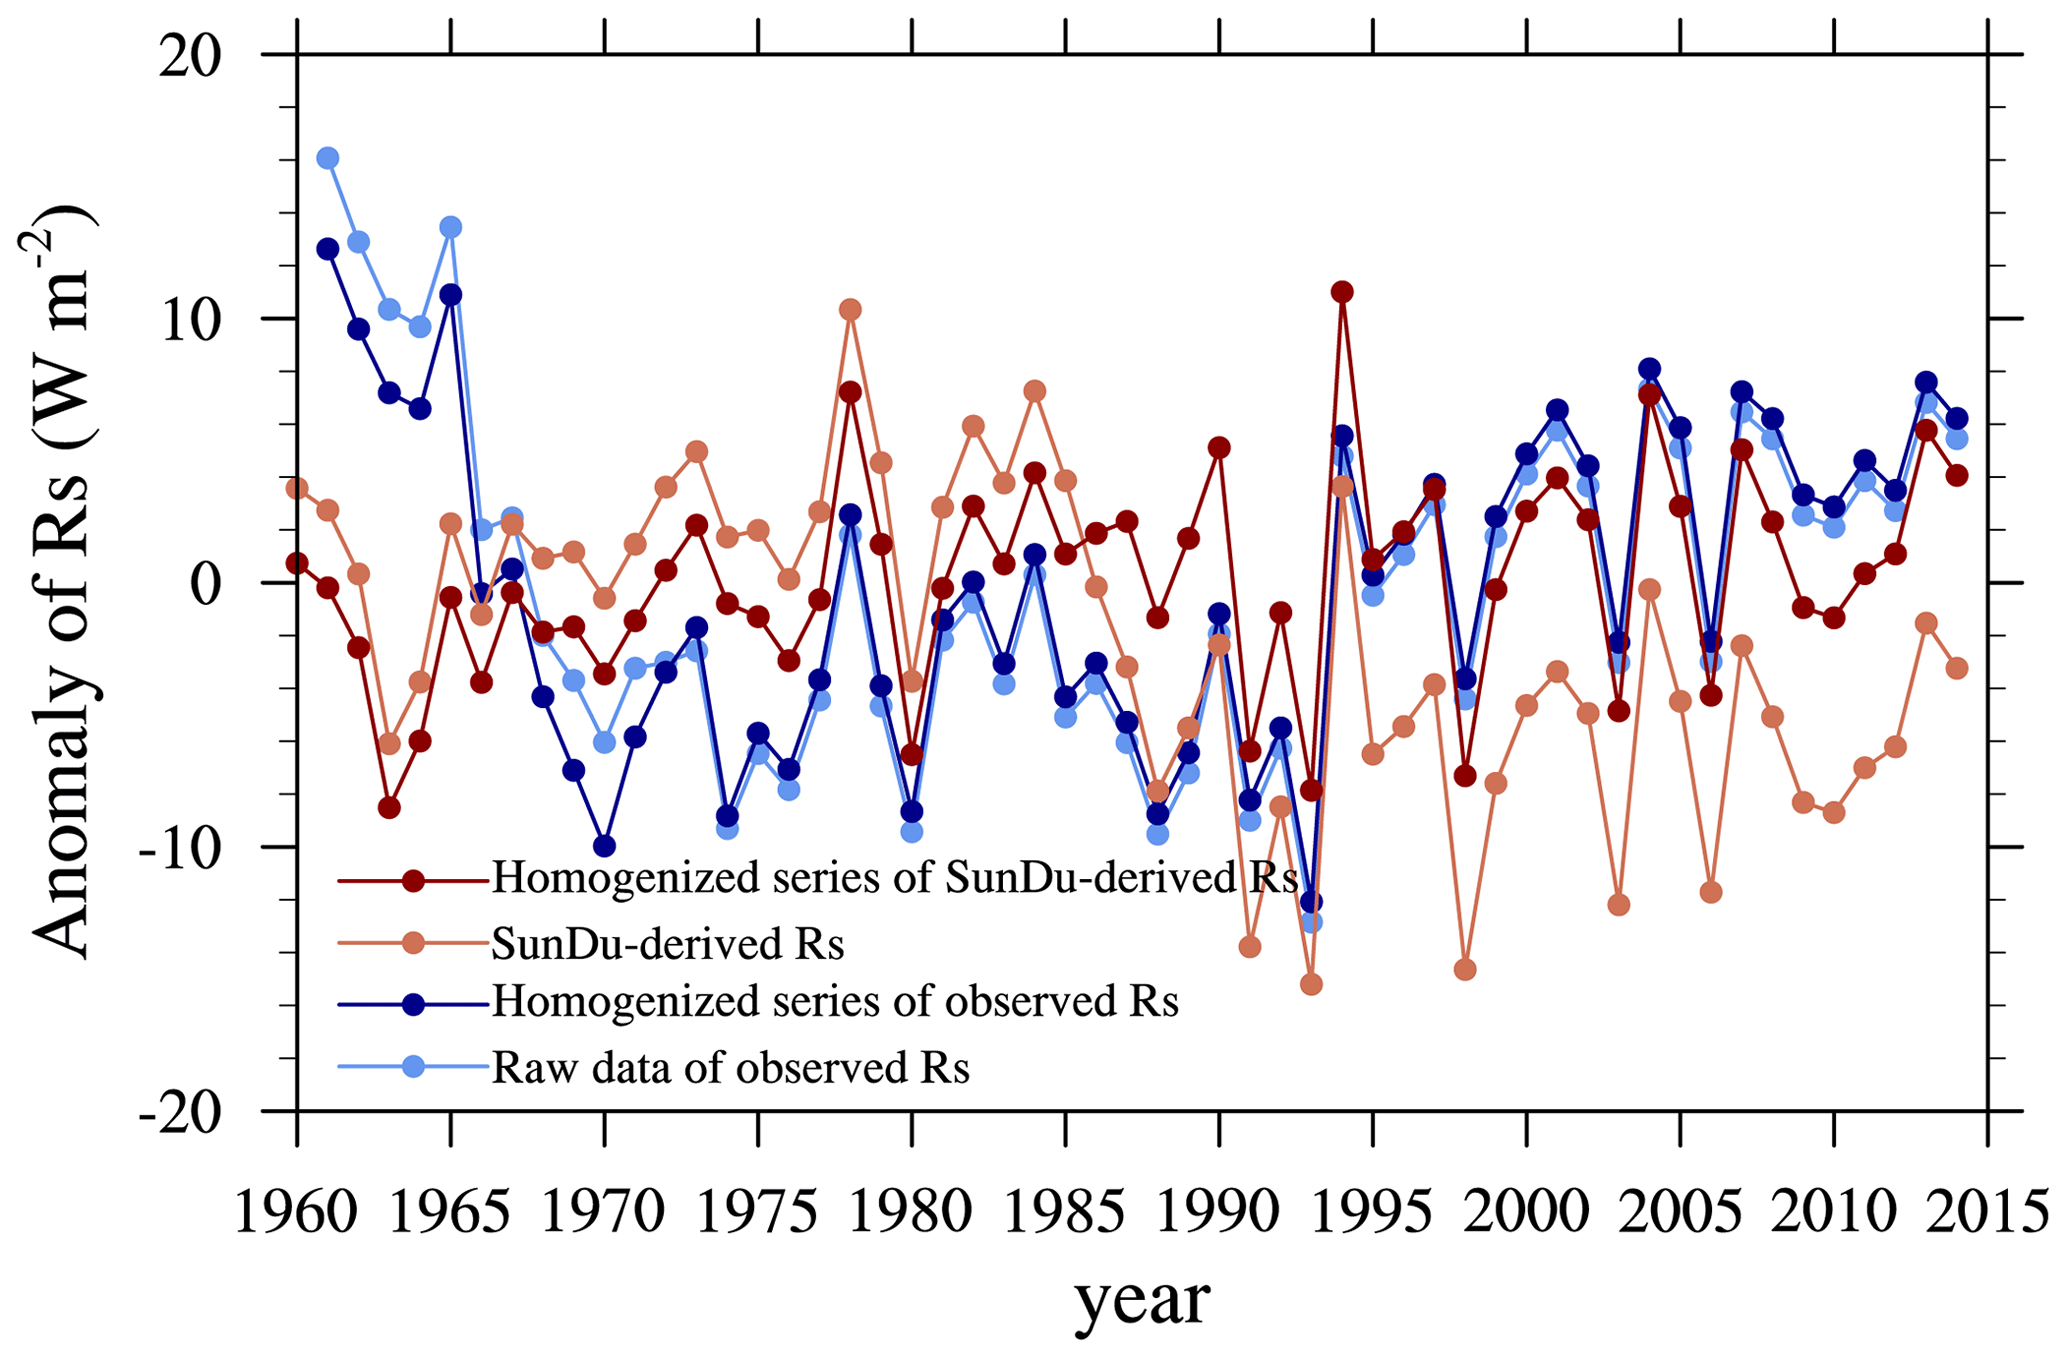
Figure 9Time series of annual anomalies of the surface incident solar radiation (Rs) based on direct observations (light-blue line) and their homogenized series (dark-blue line) and sunshine-duration-derived (SunDu-derived) Rs (light-red line) and their homogenized series (dark-red line). All of the lines were calculated based on as many observations as possible. The light-blue line and dark-blue line were calculated from the Rs observations at 105 sites, while the light-red line and dark-red line were derived from the SunDu-derived Rs at 156 sites. The Rs variations are nearly the same as those shown in Fig. 6, which were calculated based on the 41 selected sites in Sect. 3.1. Large discrepancies were found in the homogenized data series (dark-blue and dark-red lines).
Table 1Trends of surface incident solar radiation (Rs) in Japan during specific time periods for different types of datasetsa. Unit: W m−2 per decade.
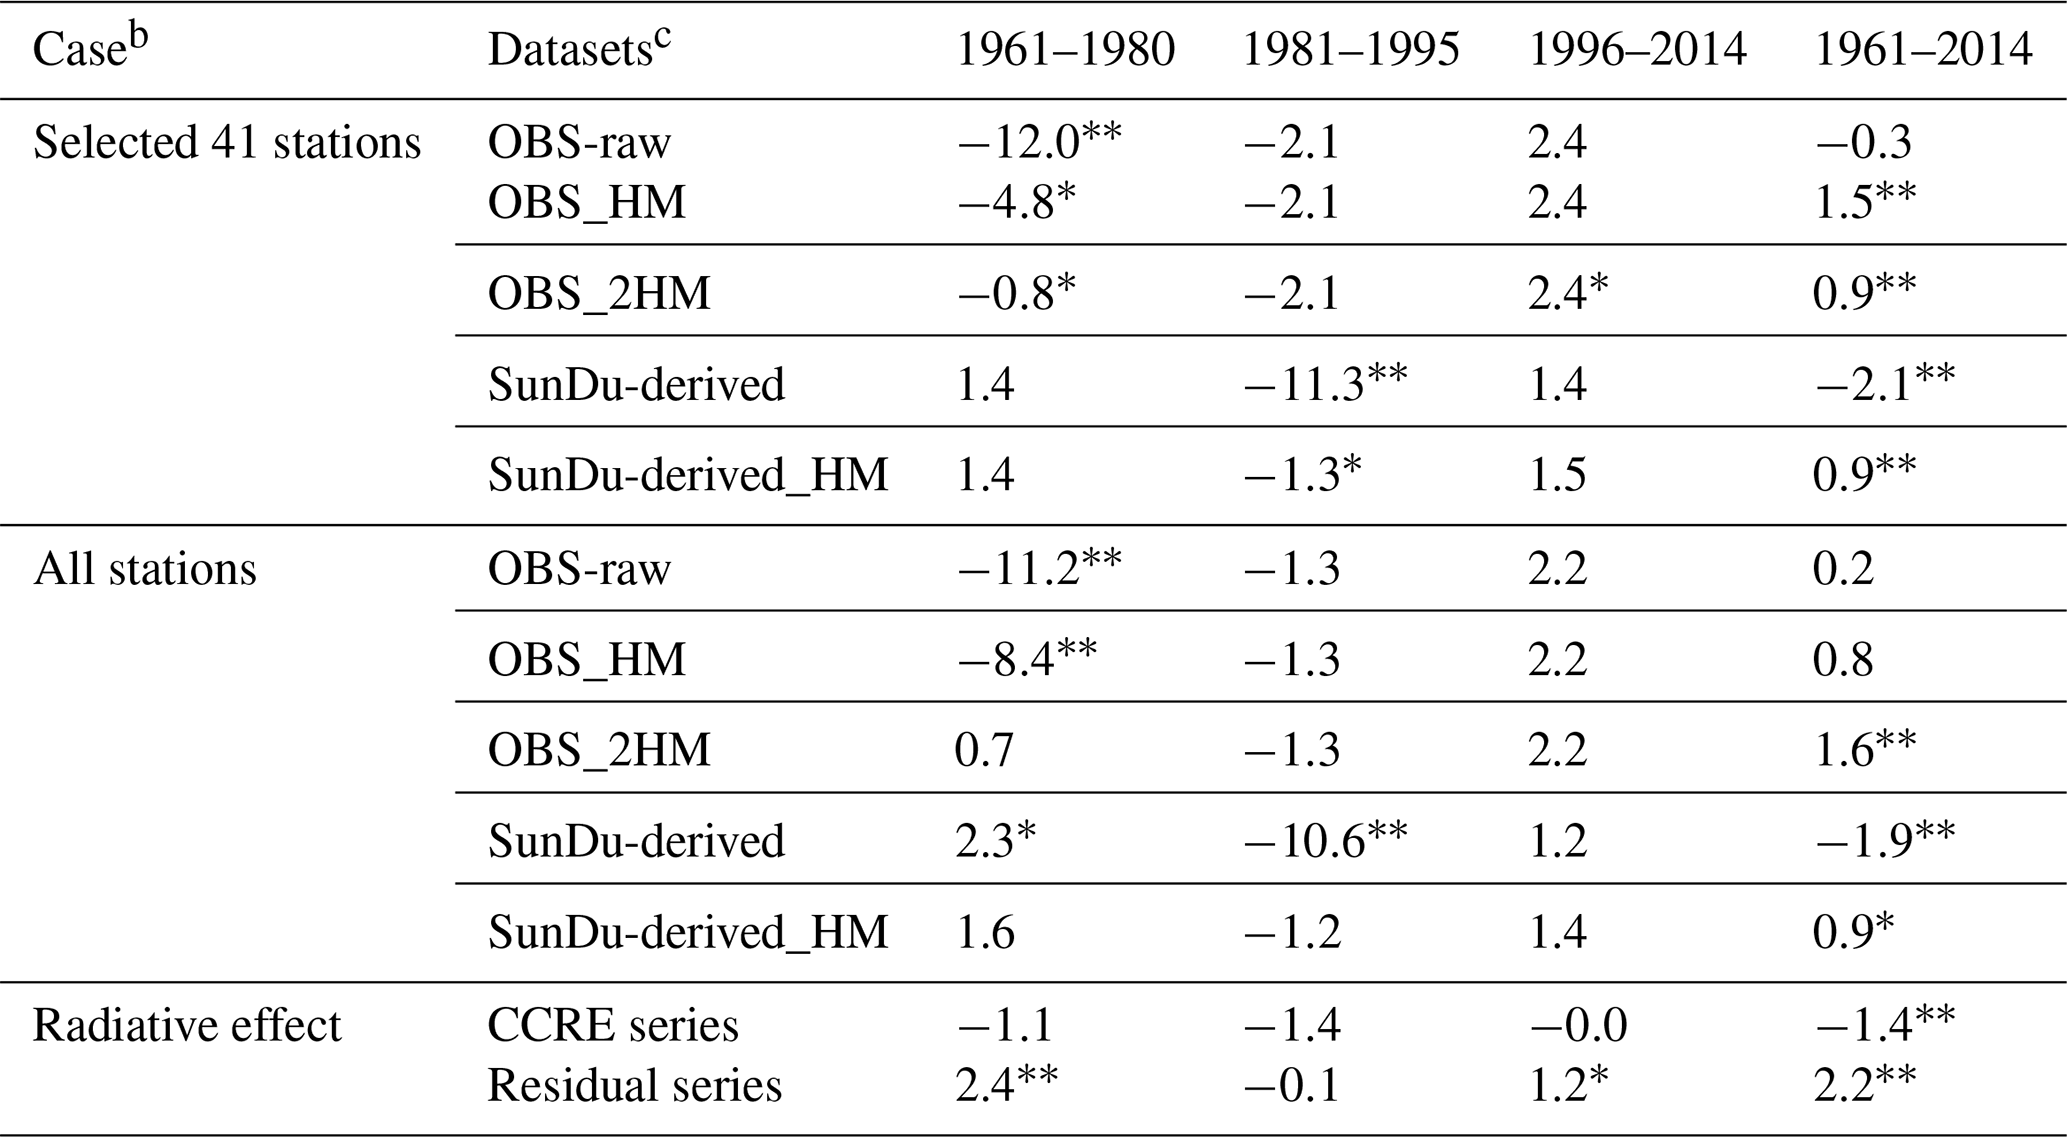
a The trend calculations were based on the linear regression method.
Values with two asterisks () imply p<0.01, and those with one
asterisk (*) imply .
b Rs trends were calculated by different numbers of observations,
including all stations that are available on the JMA website and 41 stations
(marked with red in Table S1, detailed in Sect. 3.1) that are
significantly improved after homogenization. This implies that the sample
number has a subtle impact on the trend calculation over Japan. Radiative
effects from clouds and aerosols were also explored.
c Trend calculations were based on the raw (observational) measurements of surface
incident solar radiation (OBS-raw), their homogenized series
(OBS_HM), derived incident solar radiation from sunshine
duration hours (SunDu-derived), and their homogenized series
(SunDu-derived_HM). OBS_HM from 1961 to 1970
was further homogenized by using SunDu-derived_HM as
reference data, termed OBS_2HM. It is found that homogenized
SunDu-derived Rs values have the lowest uncertainties among these five datasets in
Sect. 3.1. The cloud cover radiative effect (CCRE) was denoted as the
change in Rs produced by a change in cloud cover, and the CCRE calculations
were performed following Eq. (4) by observed cloud amounts and the
cloud radiative effect (CRE) from CERES satellite retrieval. Residual effect
series were obtained by removing the CCRE from homogenized SunDu-derived Rs
anomalies.
3.2 Uncertainties in Rs observations
Figure 9 displays the change in Rs during the last 5 decades, while Fig. 10 shows the variation in observed clouds over Japan. The sharp decrease in Rs in 1963 caused by the volcanic eruption of Mount Agung in Indonesia (Witham, 2005) can be clearly found. The sharp decreases in Rs in 1991 and 1993 are due to the combined effect of the volcanic eruption of Mount Pinatubo in the Philippines in 1991 (Robock, 2000) and the simultaneous significant increases in clouds (Fig. 8 in Tsutsumi and Murakami, 2012). The volcanic eruption of El Chichón in Mexico in 1982 exerted little impact on the decline in Rs and may have been compensated by the decrease in clouds, as shown in Fig. 10. The pronounced Rs decline in 1980 coincides with the significant increase in clouds, while the lightening of Rs in 1978 and 1994 encounters abrupt decreases in cloud covers.
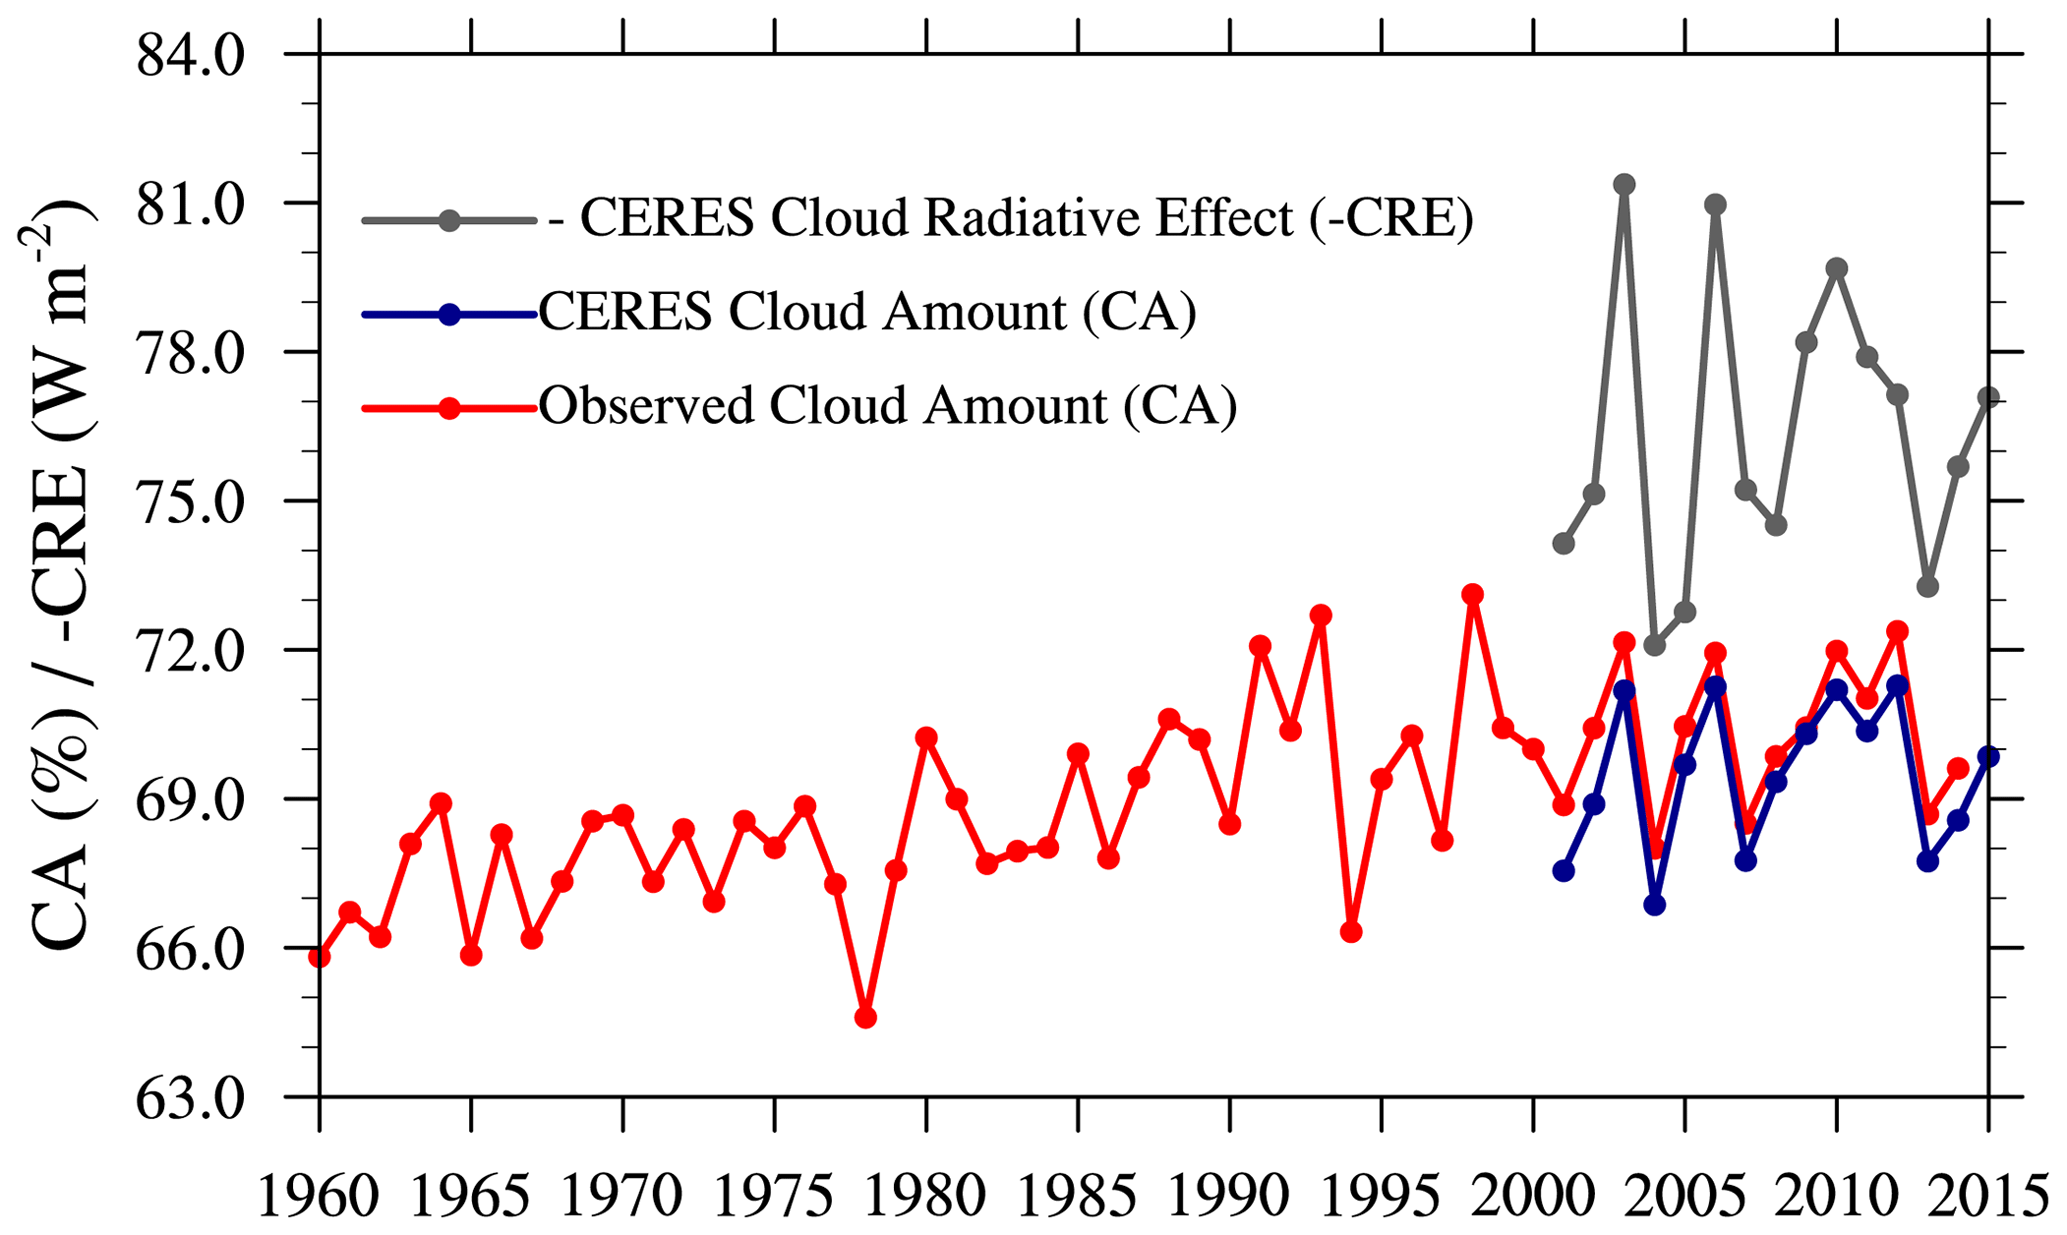
Figure 10The cloud amount (CA) from CERES (blue line) agrees well with that derived from surface observations (red line) over Japan. At the annual timescale, the negative cloud radiative effect (-CRE, grey line) in CERES correlated well with the cloud amount.
As shown in Fig. 9, no major modifications were found in Rs observations before and after homogenization (comparison between the light-blue and dark-blue lines). However, the SunDu-derived Rs series are smoother after adjustment by the QM method, as the sharp decrease from 1983 to 1993 caused by the replacement of sunshine duration instruments (Jordan recorders were replaced with EKO rotating-mirror recorders) (Stanhill and Cohen, 2008) was repaired (comparison between the light-red line and dark-red lines). Despite the identical increase in Rs via both the homogenized direct measurements of Rs and the homogenized SunDu-derived Rs during the 1995–2014 period, their variations in Rs from 1961 to 1994 are different (dark-red line and dark-blue line).
Large discrepancies in Rs variation were found during the time period of 1961–1970, although homogenization was performed on the direct measurements of Rs and SunDu-derived Rs (dark-blue line and dark-red line in Fig. 9). An existing study noted the inaccurate instruments used at the beginning of operation in the Rs observation network in approximately 1961, and the parallel use of two different types of instruments during the 1960s may result in the large variability in observed Rs (Tanaka et al., 2016). At this time, the clouds fluctuated gently, as shown in Fig. 10, and the change in volcanic aerosols from 1965 to 1966 was nearly the same as that from 1962 to 1963 (Table 2 in Sato et al., 1993), so the sudden decline in the direct observations of Rs from 1965 to 1966, which was twice as large as that from 1962 to 1963, is suspicious. It is inferred that anthropogenic aerosols play a subtle role in the significant reduction in Rs, as this type of phenomenon is common for both polluted and pristine stations in Japan (Fig. 22 in Tanaka et al., 2016).
Figure 11 shows the correlation coefficients between homogenized Rs (observed and SunDu-derived) and cloud amount. In general, the observed Rs (−0.45) is less correlated than the SunDu-derived Rs (−0.67), particularly from 1961 to 1970, −0.21 compared with −0.64. This in turn supports the reliability of homogenized SunDu-derived Rs, especially during the time period of 1961–1970. The false variability of the observed Rs from 1961 to 1970 was modified by the RHtests method against the homogenized SunDu-derived Rs as shown in Fig. 12.
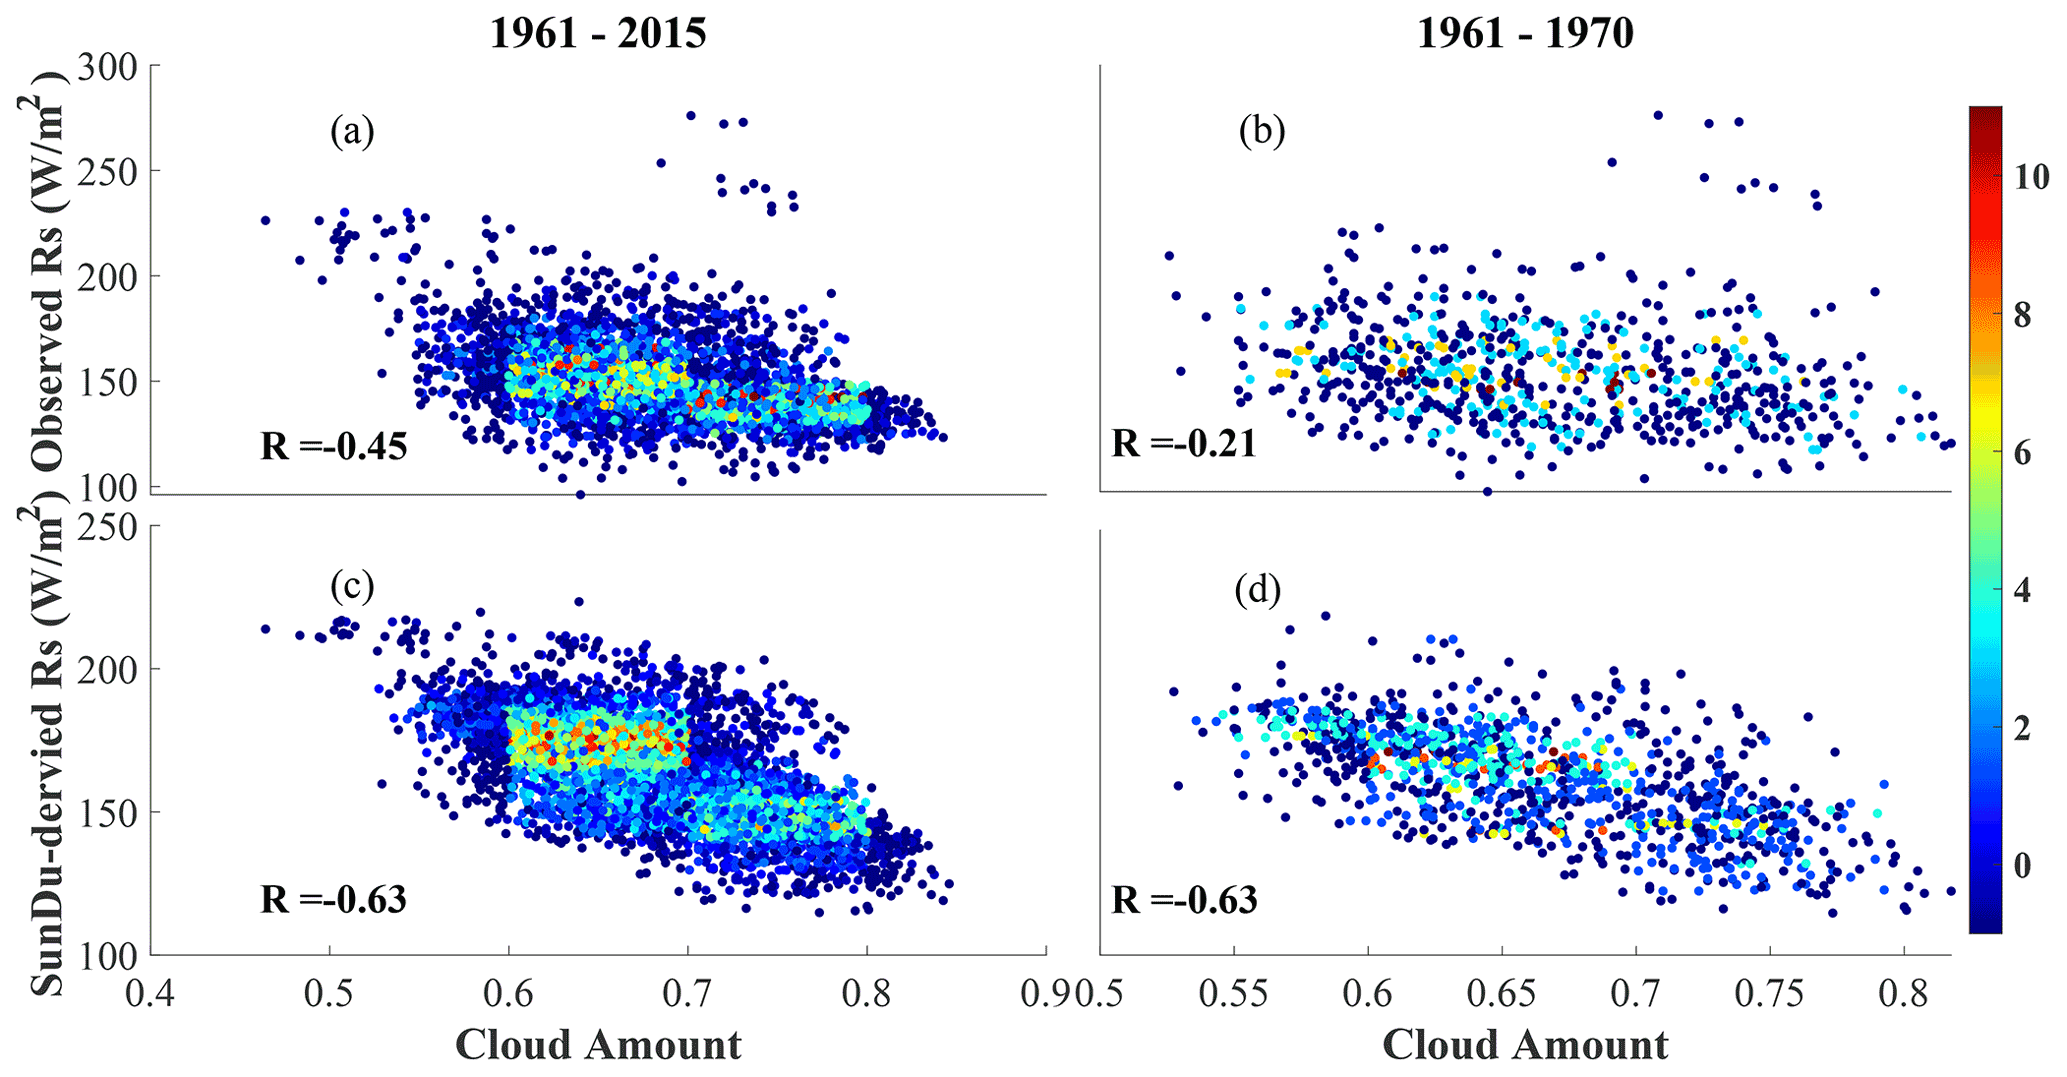
Figure 11Scatter plot of homogenized monthly surface incident solar radiation (Rs) (observed and SunDu-derived solar radiation) as a function of ground-based observations of cloud amount over Japan at all stations only when both cloud amount data and observed Rs data are available: (a, c) for 1961–2015 and (b, d) for 1961–1970. The smallest correlation coefficient in (b) indicates that the observed Rs data are spurious for 1961–1970 and that SunDu-derived Rs are more convincing.

Figure 12Time series of annual anomalies of the surface incident solar radiation (Rs) based on Rs observations after two rounds of homogenization (dark-blue line). The homogenized series of observed Rs from 1961 to 1970 shown in Fig. 7 was tuned by the RHtests method again using the homogenized series of SunDu-derived Rs (dark-red line in Figs. 7 and 10) as a reference.
General decreases in stratospheric aerosol optical depth (AOD) were reported in Sato et al. (1993) from 1965 to 1980, and clouds fluctuated slightly, as shown in Fig. 10; both of these factors contributed to a brightening of Rs. This is in agreement with the SunDu-derived Rs and contrasts with the direct measurements of Rs.
During the 1985–1990 period, clouds varied slightly, as shown in Fig. 10, and the observed atmospheric transmission under cloud-free conditions increased (Wild et al., 2005), which suggests that the large declines in directly observed Rs and SunDu-derived Rs are defective and reinforce the reliability of the adjusted SunDu-derived Rs (dark-red line in Fig. 9).
From the above analysis, it can be inferred that fewer uncertainties exist in homogenized SunDu-derived Rs, which was confirmed by another work that utilized a different data-adjusted method (Stanhill and Cohen, 2008).
3.3 Trends of Rs over Japan
The trends of Rs during specific time periods for different types of datasets are listed in Table 1. Direct measurements of Rs and SunDu-derived Rs from 41 selected stations and all available stations reveal similar variations in Rs over Japan, which demonstrates that the sample number has a subtle impact on the estimation of global brightening and dimming over Japan.
A revisit of global dimming and brightening was listed in Table 1. Major differences were found in the time period of 1961–1980, ranging from −11.2 (−12.0) to −8.4 (−4.8) W m−2 per decade before and after Rs homogenization for all available stations (41 selected stations) over Japan; significant repairs occurred during the 1981–1995 period, ranging from −10.6 (−11.3) to −1.2 (−1.3) W m−2 per decade before and after SunDu-derived Rs homogenization for all available stations (41 selected stations) over Japan. Both corrections were mainly attributed to the homogenization of corrupted raw data caused by the replacement of instruments for Rs and SunDu measurements. After careful checking and adjustment of the SunDu-derived Rs series, the decadal variation in Rs over Japan, which was totally different from former studies (Wild et al., 2005; Norris and Wild, 2009), was remedied. Direct measurements of Rs display a trend of nearly zero from 1961 to 2014 over Japan, while their homogenization series report a positive change of 0.8–1.6 W m−2 per decade; SunDu-derived Rs decreases at a rate of 1.9 W m−2 per decade, while its homogenized series reveals a brightening of 0.9 W m−2 per decade.
The combined effects of clouds and aerosols on Rs make the global dimming and brightening complicated. The CCRE can explain 70 % of global brightening from 1961 to 2014 at monthly and interannual timescales, while the residual radiative effect dominates the decadal variation in Rs, as shown in Fig. 13 and Table 1, which is in agreement with Wang et al. (2012). Homogenized SunDu-derived Rs shows an increase of 1.6 W m−2 per decade from 1961 to 1980; however, a persistent increase in cloud amount yields a CCRE decrease of 1.1 W m−2 per decade. The residual radiative effect accounts for an increase of 2.4 W m−2 per decade for this time period. The cloud radiative effect (−1.4 W m−2 per decade) modulates Rs variation of −1.2 W m−2 per decade for the 1981–1995 period, while the residual radiative effect (1.2 W m−2 per decade) dominates Rs variation of 1.4 W m−2 per decade from 1996 to 2014.
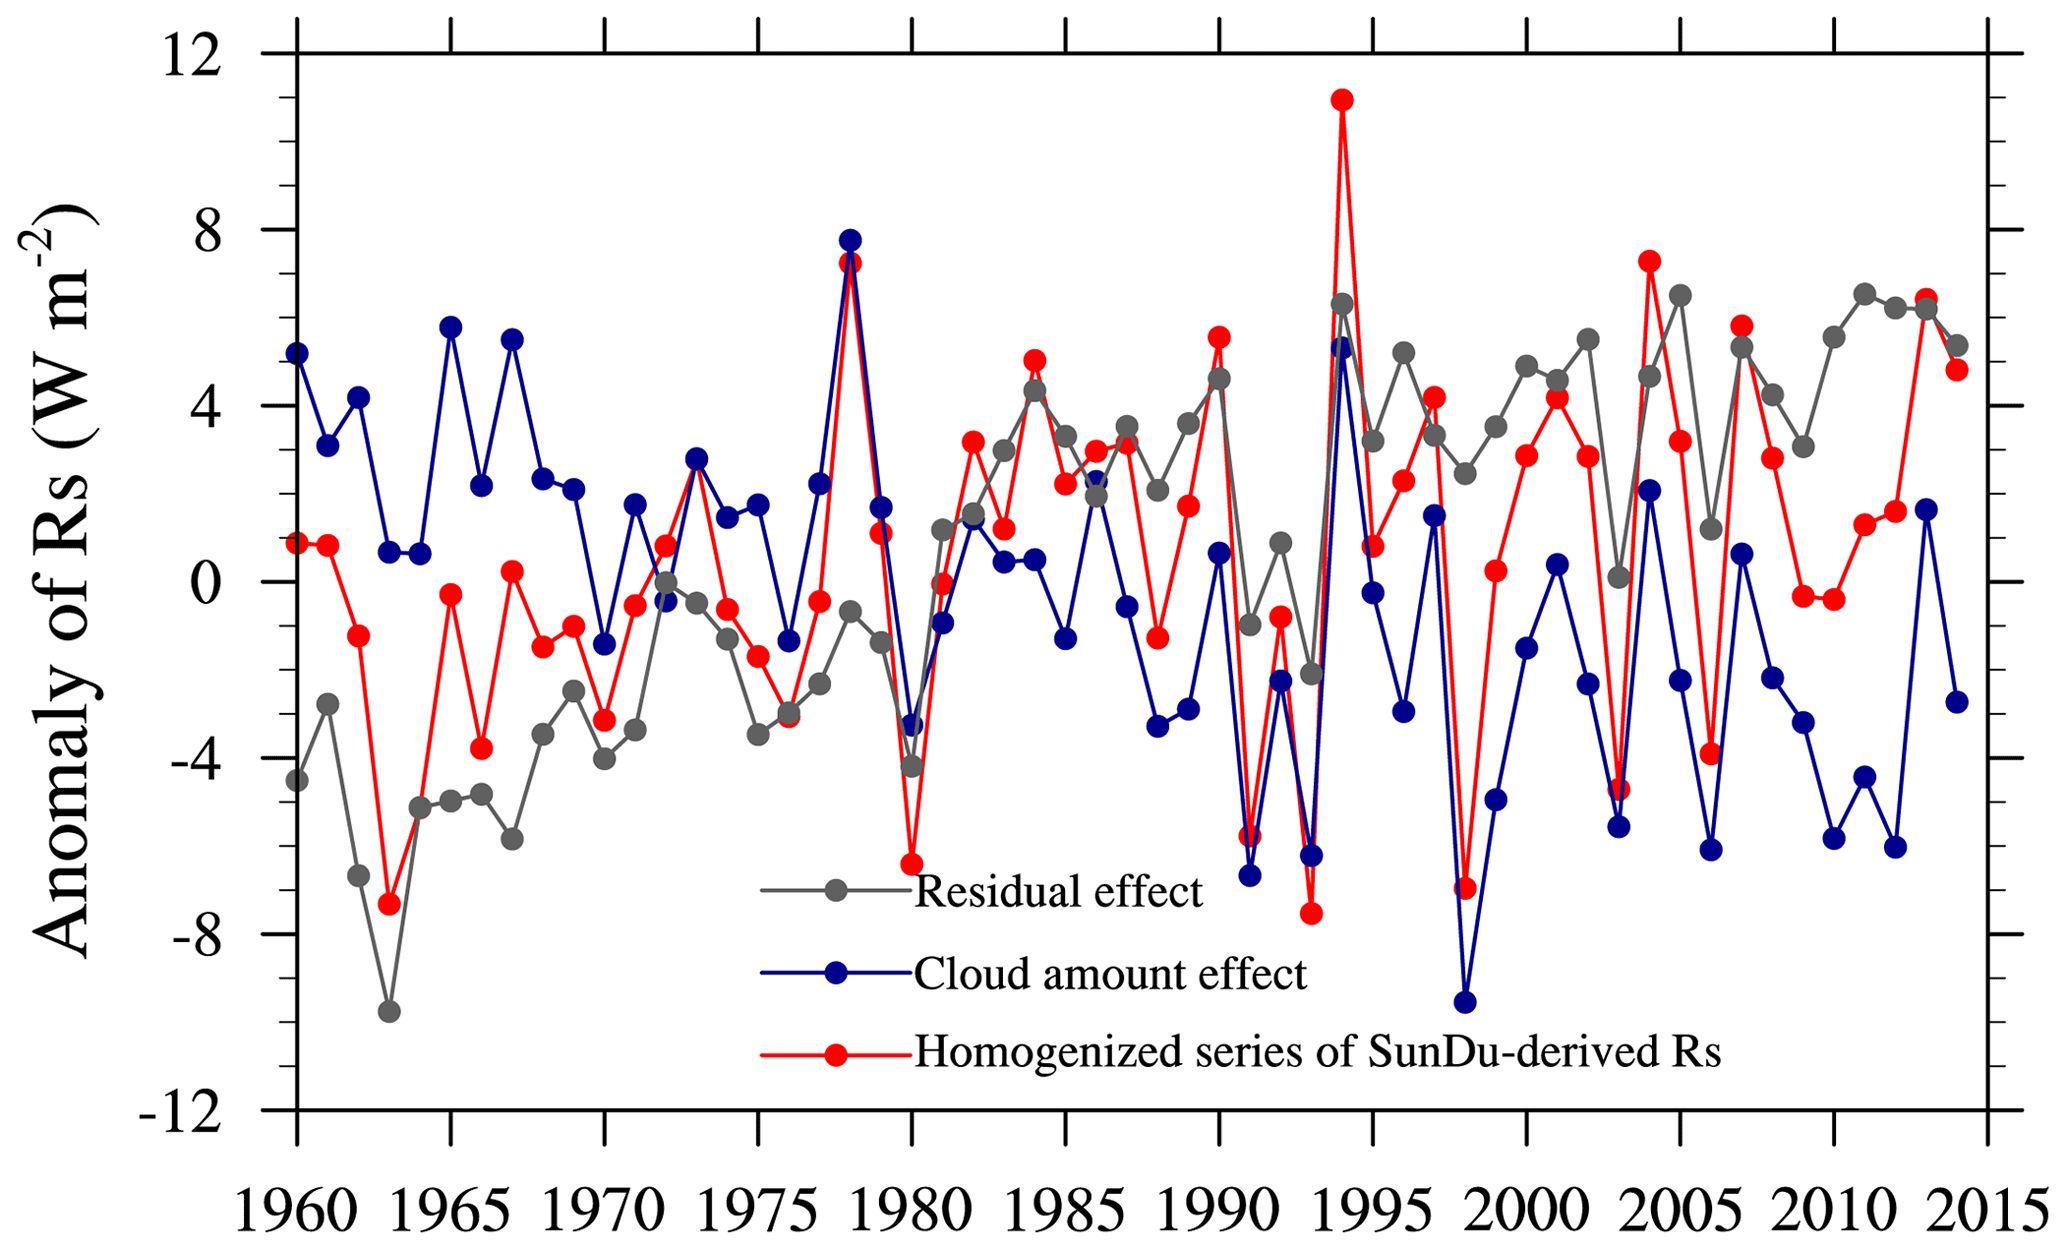
Figure 13Area-averaged anomalies of homogenized SunDu-derived Rs (red line) over Japan. The cloud cover radiative effect (CCRE, blue line) was denoted as the change in Rs produced by a change in cloud cover and calculated following Eq. (4) by observed cloud amounts and the cloud radiative effect (CRE) from the CERES satellite retrieval. The residual effect (grey line) was obtained by removing the cloud cover radiative effect (CCRE) from the homogenized SunDu-derived Rs anomalies.
Homogenized SunDu-derived Rs shows a slight increase of 0.9 W m−2 per decade from 1961 to 2014 with a 90 % confidence interval. However, the CCRE accounts for a deceased Rs of 1.4 W m−2 per decade, which implies that cloud cover changes are not the primary driving forces for the Rs trend over Japan. Meanwhile, the residual radiative effect exhibits an increase of 2.2 W m−2 per decade, which surpasses the negative CCRE.
Several studies demonstrate a generally cleaner sky over Japan from the 1960s to the 2000s (except for the years impacted by volcanic eruptions) based on atmospheric transparency and aerosol optical properties (Wild et al., 2005; Kudo et al., 2012), which supports the dominant role of aerosols in Rs brightening over Japan, as revealed by the residual radiative effect here. Furthermore, the residual radiative effect in this study is stronger than that in Norris and Wild (2009), as raw data were remedied and more accurate satellite data from CERES were adopted to quantify the radiative effect. Tsutsumi and Murakami (2012) demonstrate that cloud amount categories exert an important effect on Rs variation. Rs enhancement by the increased appearance of large cloud amounts is superior to Rs decline by the decreased appearance of small cloud amounts during 1961–2014, which yields increased Rs with increasing total cloud amount. They also pointed out that the decrease in cloud optical thickness due to the large emissions of SO2 and black carbon from East Asia through the aerosol semi-direct effect (absorption of more energy by aerosols results in the evaporation or suppression of clouds) may have facilitated the increased Rs over Japan.
The decrease in spring dust storms in March–May during the last 5 decades from China (Qian et al., 2002; Zhu et al., 2008), which may travel to neighbouring countries (Uno et al., 2008; Choi et al., 2001), could also have triggered the increase in Rs over Japan. The Rs variation and radiative effect in different seasons are categorized in Fig. 14 and Table 2, in which an increasing trend of 1.5 W m−2 per decade in the homogenized SunDu-derived Rs prevails in spring for the whole time period, dominated by a dramatic increase of 2.8 W m−2 per decade in the residual effect and an even larger increase for 1961–1980 (3.1 W m−2 per decade) and 1996–2014 (3.4 W m−2 per decade).
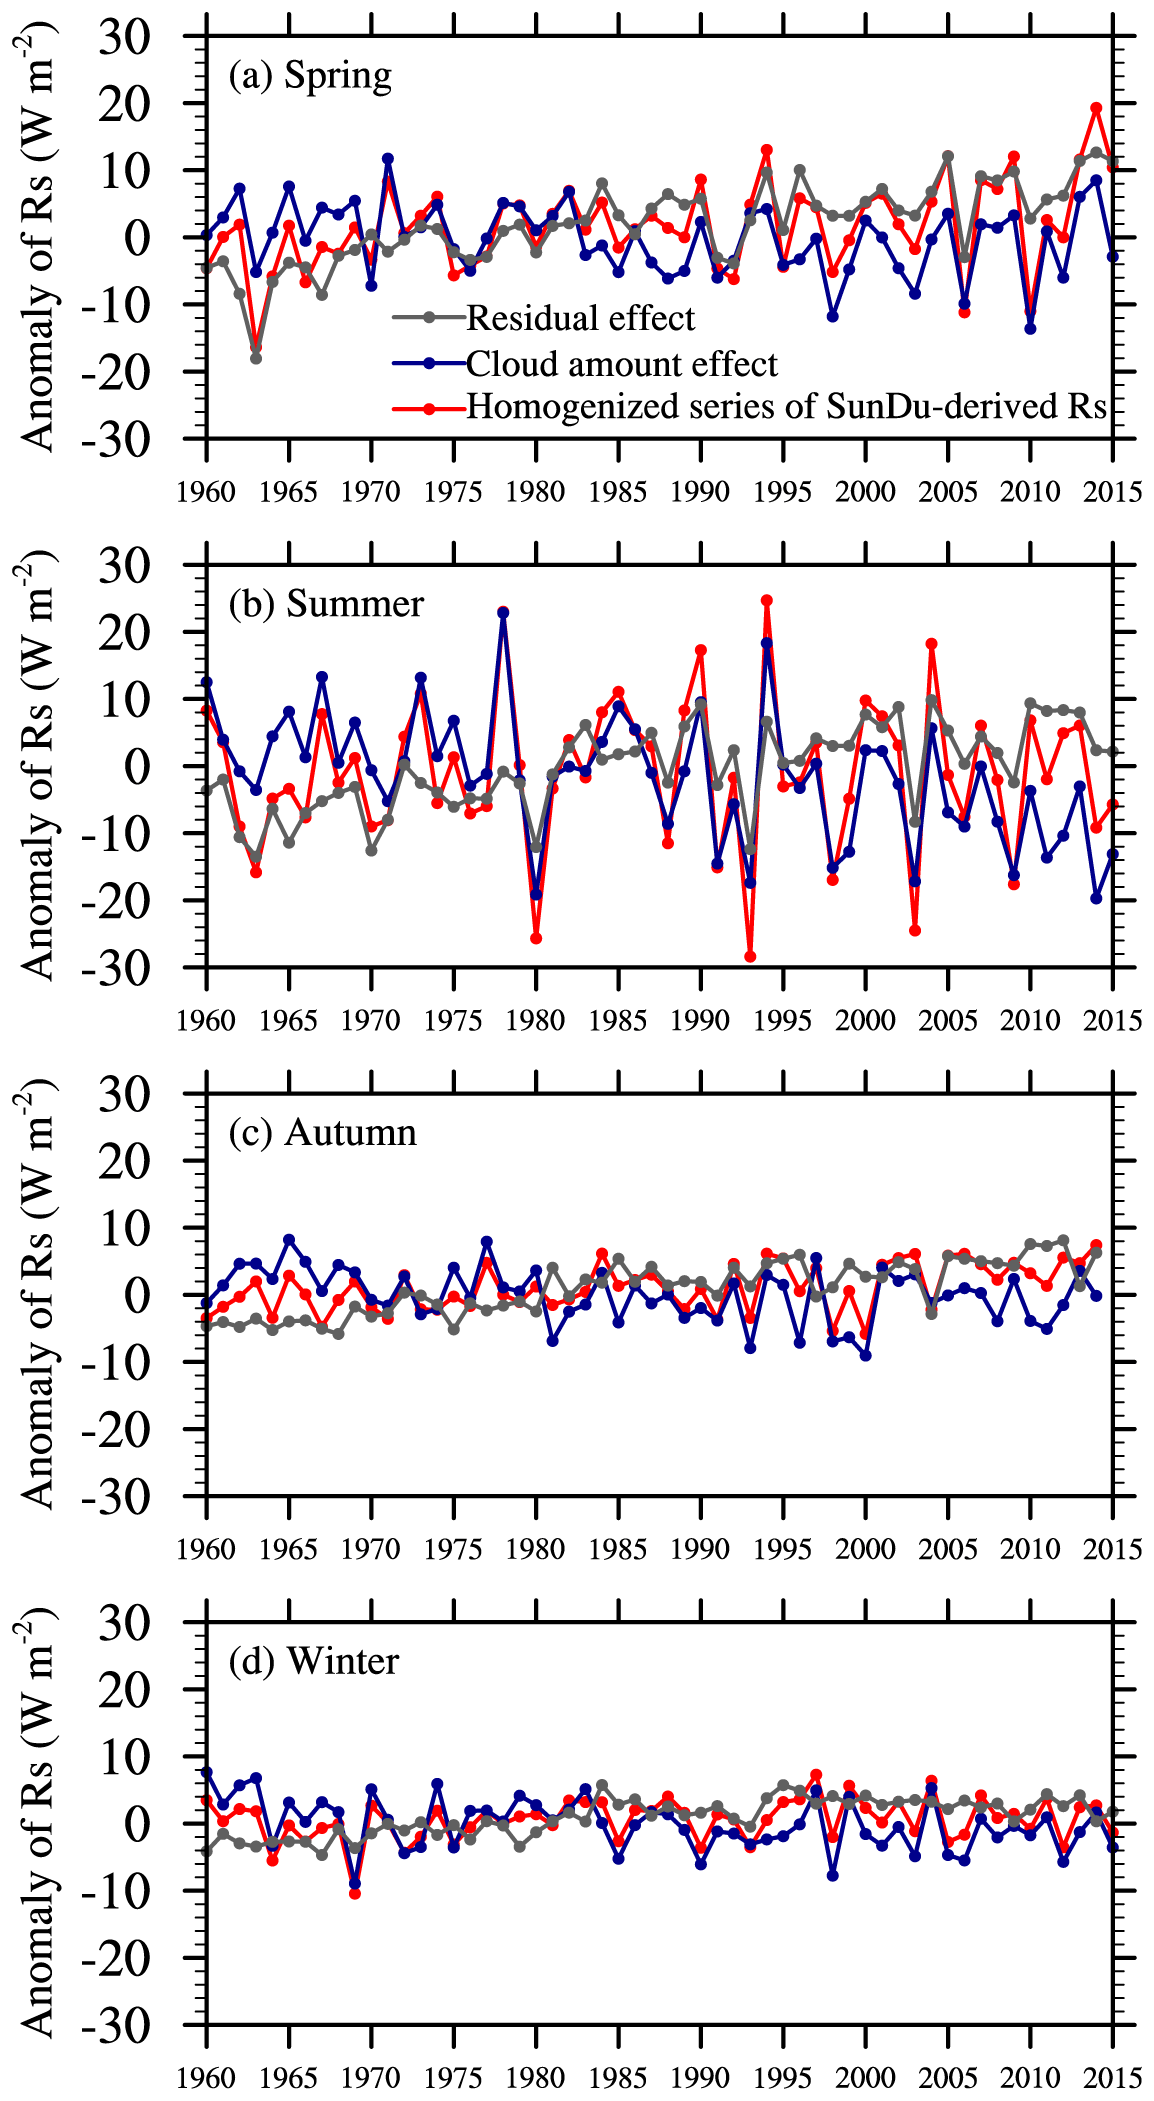
Figure 14Same as Fig. 12 but for the four seasons. The decrease in Asian spring dust may have triggered the brightening over Japan for 1961–2015, as the Rs in spring increases most among the seasons.
Table 2Trends of surface incident solar radiation (Rs) in Japan during specific time periods for different types of datasets for all seasons. Unit: W m−2 per decade.
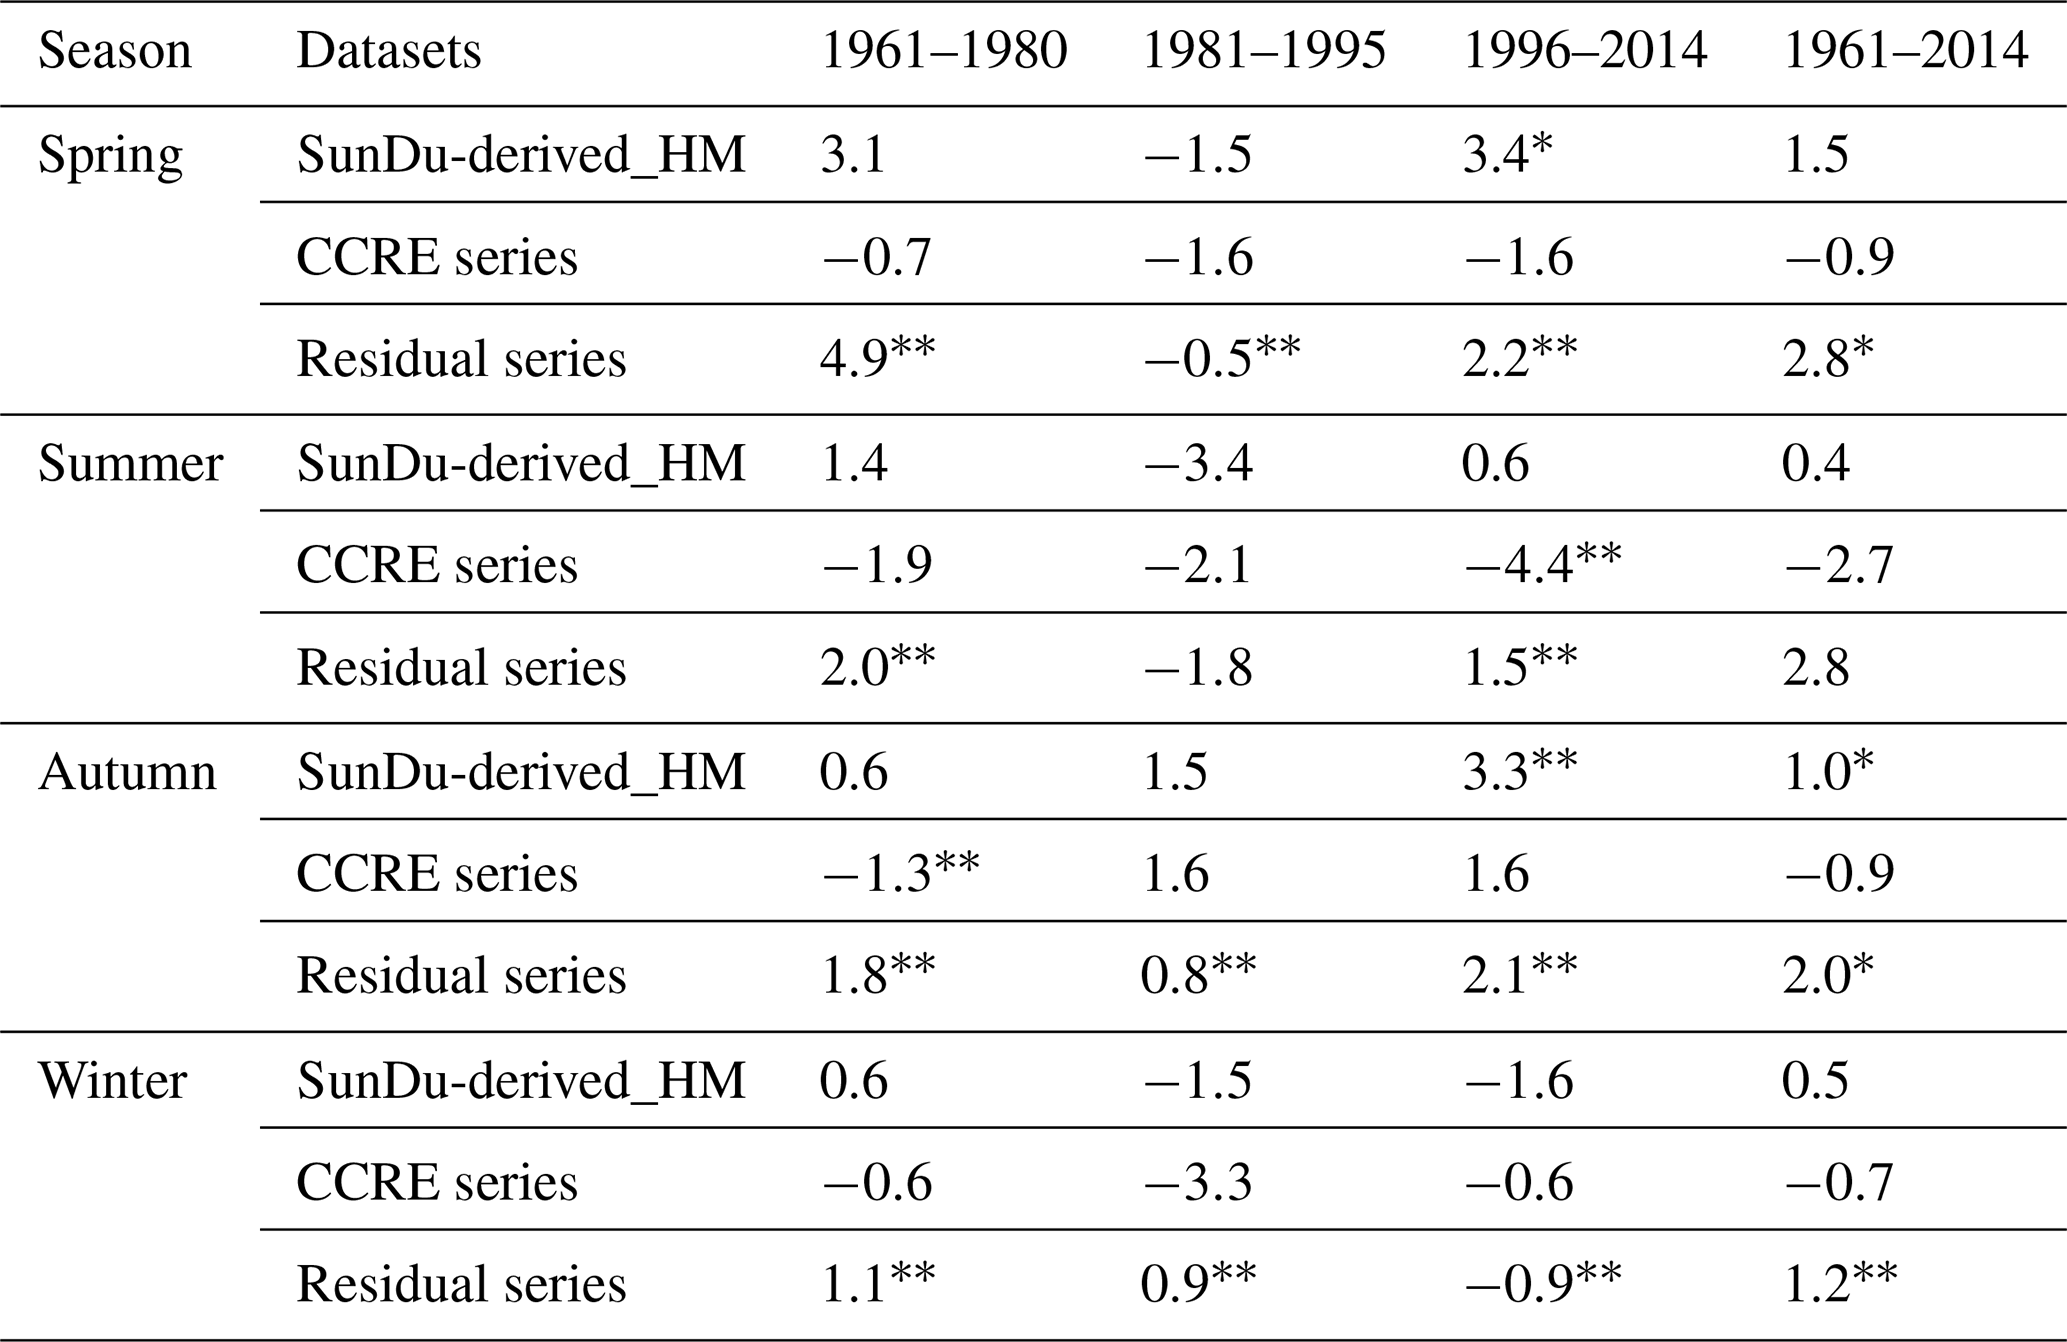
* . p<0.01.
Monthly observed surface incident solar radiation, sunshine duration, and cloud amount data were provided by Japan Meteorological Agency (2022; https://www.data.jma.go.jp/obd/stats/data/en/smp/index.html, last access: 21 January 2022), and monthly cloud radiative effect (CRE) data were derived from Clouds and the Earth's Radiant Energy System for CERES EBAF data (https://ceres.larc.nasa.gov/order_data.php, last access: 21 January 2022; CERES Science Team, 2022). The homogenized observed Rs and SunDu-derived Rs used in this study are available at https://doi.org/10.11888/Meteoro.tpdc.271524 (Ma et al., 2021).
The homogenization of raw observations related to Rs can significantly improve the accuracy of global dimming and brightening estimation and provide a reliable assessment of climate trends and variability. In this study, we for the first time homogenized the raw Rs observations and obtained a more reliable Rs data series over Japan for a century.
Documented artificial shifts in metadata play an important role in regulating the raw observations. If change points were confirmed by metadata or other independent climate variables, the RHtests method was applied to remove the discontinuities. In this study, shifts in the homogenized raw Rs were further checked by exploring the relationship with the ground-based cloud amount and tuned again using homogenized SunDu-derived Rs as the reference data. By comparing the variations in independent climate variables of clouds and aerosols, the homogenized SunDu-derived Rs proved to be more reliable in detecting Rs variability over Japan.
A revisit of global dimming and brightening is made based on the homogenized Rs series. Rs over Japan increases at a rate of 1.6 W m−2 per decade for 1961–1980, which is contrary to the trend (−4.8 to −12.0 W m−2 per decade) in the unreasonable Rs observation. A slight decrease of 1.2 W m−2 per decade for 1981–1995 in homogenized SunDu-derived Rs accounts for only of the trend in its unadjusted series. This directly contributes a brightening of 0.9 W m−2 per decade (with a 99 % confidence interval) for the last 5 decades in homogenized series, which is totally contrary to the variation in its original series. Global brightening since 1961 over Japan is consistent with that in Stanhill and Cohen (2008), except that the magnitude is not as large.
We also explored how the clouds and aerosols mediate the transformation of Rs. The brightening in Japan for 1961–1980 was the combined effect of cloud cover (negative effect) and aerosols (positive effect). The dimming for 1981–1995 was governed by reduced cloud amounts, while the increase in Rs for 1996–2014 was controlled by decreased aerosols. These results are different from those in Norris and Wild (2009), as homogenization was performed on the raw data, and more accurate cloud radiative effect data series from CERES were utilized in our study. During the entire period of 1961–2014, cloud amounts dominated seasonal and interannual Rs variations, while aerosols (including aerosol–cloud interactions) drove decadal Rs variations over Japan, noted by other studies, in response to general cleaner skies and a reduction in spring Asian dust storms (Wang et al., 2012; Kudo et al., 2012).
The supplement related to this article is available online at: https://doi.org/10.5194/essd-14-463-2022-supplement.
QM and KW designed the research and wrote the paper. LS collected the raw data. YH homogenized the raw data. QW provided the technical support. YZ and HL checked the data.
The contact author has declared that neither they nor their co-authors have any competing interests.
Publisher’s note: Copernicus Publications remains neutral with regard to jurisdictional claims in published maps and institutional affiliations.
This study is funded by the National Key R&D Program of China (grant no. 2017YFA0603601) and the National Science Foundation of China (grant no. 41930970), and the project is supported by the State Key Laboratory of Earth Surface Processes and Resource Ecology (grant no. 2017-KF-03). We thank many institutions for sharing their data, including the Japan Meteorological Agency for observation data over Japan (https://www.data.jma.go.jp/obd/stats/data/en/smp/index.html, last access: 21 January 2022) and Clouds and the Earth's Radiant Energy System for CERES EBAF data (https://ceres.larc.nasa.gov/order_data.php, last access: 21 January 2022). We thank the Expert Team on Climate Change Detection and Indices (ETCCDI) for providing the RHtestsV4 homogenization package (http://etccdi.pacificclimate.org/software.shtml, last access: 21 January 2022).
This research has been supported by the National Key R&D Program of China (grant no. 2017YFA0603601) and the National Science Foundation of China (grant no. 41930970), and the project is supported by the State Key Laboratory of Earth Surface Processes and Resource Ecology (grant no. 2017-KF-03).
This paper was edited by Bo Zheng and reviewed by two anonymous referees.
Aguilar, E., Auer, I., Brunet, M., Peterson, T. C., and Wieringa, J.: Guidelines on climate metadata and homogenization, World Meteorological Organization, Geneva, WMO-TD No. 1186, 55 pp., 2003.
Alexandersson, H.: A homogeneity test applied to precipitation data, J. Climatol., 6, 661–675, https://doi.org/10.1002/joc.3370060607, 1986.
Allen, R. J., Norris, J. R., and Wild, M.: Evaluation of multidecadal variability in CMIP5 surface solar radiation and inferred underestimation of aerosol direct effects over Europe, China, Japan, and India, J. Geophys. Res.-Atmos., 118, 6311–6336, https://doi.org/10.1002/jgrd.50426, 2013.
Augustine, J. A. and Hodges, G. B.: Variability of Surface Radiation Budget Components Over the U.S. From 1996 to 2019–Has Brightening Ceased?, J. Geophys. Res.-Atmos., 126, e2020JD033590, https://doi.org/10.1029/2020JD033590, 2021.
CERES Science Team: Dataset of CERES EBAF, NASA LaRC [data set], https://ceres.larc.nasa.gov/data/, last access: 21 January 2022.
Choi, J. C., Lee, M., Chun, Y., Kim, J., and Oh, S.: Chemical composition and source signature of spring aerosol in Seoul, Korea, J. Geophys. Res., 106, 18067–18074, https://doi.org/10.1029/2001JD900090, 2001.
Dai, A., Wang, J., Thorne, P. W., Parker, D. E., Haimberger, L., and Wang, X. L.: A New Approach to Homogenize Daily Radiosonde Humidity Data, J. Climate, 24, 965–991, https://doi.org/10.1175/2010JCLI3816.1, 2011.
Du, J., Wang, K., Cui, B., and Jiang, S.: Correction of Inhomogeneities in Observed Land Surface Temperatures over China, J. Climate, 33, 8885–8902, https://doi.org/10.1175/JCLI-D-19-0521.1, 2020.
Dwyer, J. G., Norris, J. R., and Ruckstuhl, C.: Do climate models reproduce observed solar dimming and brightening over China and Japan?, J. Geophys. Res., 115, D00K08, https://doi.org/10.1029/2009JD012945, 2010.
Feng, F. and Wang, K.: Merging ground-based sunshine duration observations with satellite cloud and aerosol retrievals to produce high-resolution long-term surface solar radiation over China, Earth Syst. Sci. Data, 13, 907–922, https://doi.org/10.5194/essd-13-907-2021, 2021a.
Feng, F. and Wang, K.: Merging High-Resolution Satellite Surface Radiation Data with Meteorological Sunshine Duration Observations over China from 1983 to 2017, Remote Sens., 13, 602, https://doi.org/10.3390/rs13040602, 2021b.
He, Y., Wang, K., Zhou, C., and Wild, M.: A Revisit of Global Dimming and Brightening Based on the Sunshine Duration, Geophys. Res. Lett., 45, 4281–4289, https://doi.org/10.1029/2018GL077424, 2018.
Inoue, T. and Matsumoto, J.: Seasonal and secular variations of sunshine duration and natural seasons in Japan, Int. J. Climatol., 23, 1219–1234, https://doi.org/10.1002/joc.933, 2003.
Japan Meteorological Agency (JMA): Tables of Monthly Climate Statistics, JMA [data set], https://www.data.jma.go.jp/obd/stats/data/en/smp/index.html, last access: 21 January 2022.
Kato, S., Loeb, N. G., Rose, F. G., Doelling, D. R., Rutan, D. A., Caldwell, T. E., Yu, L., and Weller, R. A.: Surface Irradiances Consistent with CERES-Derived Top-of-Atmosphere Shortwave and Longwave Irradiances, J Climate, 26, 2719–2740, https://doi.org/10.1175/JCLI-D-12-00436.1, 2012.
Katsuyama, M.: On comparison between rotating mirror sunshine recorders and Jordan sunshine recorders, Weather Service Bulletin, 54, 169–183, 1987.
Kudo, R., Uchiyama, A., Ijima, O., Ohkawara, N., and Ohta, S.: Aerosol impact on the brightening in Japan, J. Geophys. Res., 117, D07208, https://doi.org/10.1029/2011JD017158, 2012.
Ma, Q., Wang, K. C., and Wild, M.: Impact of geolocations of validation data on the evaluation of surface incident shortwave radiation from Earth System Models, J. Geophys. Res.-Atmos., 120, 6825–6844, https://doi.org/10.1002/2014JD022572, 2015.
Ma, Q., He, Y., Wang, K., and Su, L.: Homogenized solar radiation data set over Japan (1870-2015), National Tibetan Plateau Data Center [dataset], 10.11888/Meteoro.tpdc.271524, 2021.
Manara, V., Beltrano, M. C., Brunetti, M., Maugeri, M., Sanchez-Lorenzo, A., Simolo, C., and Sorrenti, S.: Sunshine duration variability and trends in Italy from homogenized instrumental time series (1936–2013), J. Geophys. Res.-Atmos., 120, 3622–3641, https://doi.org/10.1002/2014JD022560, 2015.
Manara, V., Brunetti, M., Celozzi, A., Maugeri, M., Sanchez-Lorenzo, A., and Wild, M.: Detection of dimming/brightening in Italy from homogenized all-sky and clear-sky surface solar radiation records and underlying causes (1959–2013), Atmos. Chem. Phys., 16, 11145–11161, https://doi.org/10.5194/acp-16-11145-2016, 2016.
Manara, V., Brunetti, M., Maugeri, M., Sanchez-Lorenzo, A., and Wild, M.: Sunshine duration and global radiation trends in Italy (1959–2013): To what extent do they agree?, J. Geophys. Res.-Atmos., 122, 4312–4331, https://doi.org/10.1002/2016JD026374, 2017.
Noguchi, Y.: Solar radiation and sunshine duration in East Asia, Arch. Meteor. Geophy. B, 29, 111–128, https://doi.org/10.1007/BF02278195, 1981.
Norris, J. R. and Wild, M.: Trends in aerosol radiative effects over China and Japan inferred from observed cloud cover, solar “dimming”, and solar “brightening”, J. Geophys. Res., 114, D00D15, https://doi.org/10.1029/2008JD011378, 2009.
Ohmura, A.: Observed decadal variations in surface solar radiation and their causes, J. Geophys. Res., 114, D00D05, https://doi.org/10.1029/2008JD011290, 2009.
Qian, W., Quan, L., and Shi, S.: Variations of the Dust Storm in China and its Climatic Control, J. Climate, 15, 1216–1229, https://doi.org/10.1175/1520-0442(2002)015<1216:VOTDSI>2.0.CO;2, 2002.
Qian, Y., Kaiser, D. P., Leung, L. R., and Xu, M.: More frequent cloud-free sky and less surface solar radiation in China from 1955 to 2000, Geophys. Res. Lett., 33, L01812, https://doi.org/10.1029/2005gl024586, 2006.
Reeves, J., Chen, J., Wang, X. L., Lund, R., and Lu, Q. Q.: A Review and Comparison of Changepoint Detection Techniques for Climate Data, J. Appl. Meteorol. Clim., 46, 900–915, https://doi.org/10.1175/jam2493.1, 2007.
Robock, A.: Volcanic eruptions and climate, Rev. Geophys., 38, 191–219, https://doi.org/10.1029/1998RG000054, 2000.
Sanchez-Lorenzo, A. and Wild, M.: Decadal variations in estimated surface solar radiation over Switzerland since the late 19th century, Atmos. Chem. Phys., 12, 8635–8644, https://doi.org/10.5194/acp-12-8635-2012, 2012.
Sanchez-Lorenzo, A., Brunetti, M., Calbó, J., and Martin-Vide, J.: Recent spatial and temporal variability and trends of sunshine duration over the Iberian Peninsula from a homogenized data set, J. Geophys. Res., 112, D20115, https://doi.org/10.1029/2007JD008677, 2007.
Sanchez-Lorenzo, A., Calbó, J., and Martin-Vide, J.: Spatial and Temporal Trends in Sunshine Duration over Western Europe (1938–2004), J. Climate, 21, 6089–6098, https://doi.org/10.1175/2008jcli2442.1, 2008.
Sanchez-Lorenzo, A., Calbó, J., and Wild, M.: Global and diffuse solar radiation in Spain: Building a homogeneous dataset and assessing their trends, Global Planet. Change, 100, 343–352, https://doi.org/10.1016/j.gloplacha.2012.11.010, 2013.
Sanchez-Lorenzo, A., Wild, M., Brunetti, M., Guijarro, J. A., Hakuba, M. Z., Calbó, J., Mystakidis, S., and Bartok, B.: Reassessment and update of long-term trends in downward surface shortwave radiation over Europe (1939–2012), J. Geophys. Res.-Atmos., 120, 9555–9569, https://doi.org/10.1002/2015JD023321, 2015.
Sato, M., Hansen, J. E., McCormick, M. P., and Pollack, J. B.: Stratospheric aerosol optical depths, 1850–1990, J. Geophys. Res., 98, 22987–22994, https://doi.org/10.1029/93JD02553, 1993.
Shi, G. Y., Hayasaka, T., Ohmura, A., Chen, Z. H., Wang, B., Zhao, J. Q., Che, H. Z., and Xu, L.: Data quality assessment and the long-term trend of ground solar radiation in China, J. Appl. Meteorol. Clim., 47, 1006–1016, https://doi.org/10.1175/2007jamc1493.1, 2008.
Stanhill, G. and Cohen, S.: Solar Radiation Changes in the United States during the Twentieth Century: Evidence from Sunshine Duration Measurements, J. Climate, 18, 1503–1512, https://doi.org/10.1175/jcli3354.1, 2005.
Stanhill, G. and Cohen, S.: Solar Radiation Changes in Japan during the 20th Century: Evidence from Sunshine Duration Measurements, J. Meteorol. Soc. Jpn., Ser. II, 86, 57–67, https://doi.org/10.2151/jmsj.86.57, 2008.
Tanaka, K., Ohmura, A., Folini, D., Wild, M., and Ohkawara, N.: Is global dimming and brightening in Japan limited to urban areas?, Atmos. Chem. Phys., 16, 13969–14001, https://doi.org/10.5194/acp-16-13969-2016, 2016.
Tang, W.-J., Yang, K., Qin, J., Cheng, C. C. K., and He, J.: Solar radiation trend across China in recent decades: a revisit with quality-controlled data, Atmos. Chem. Phys., 11, 393–406, https://doi.org/10.5194/acp-11-393-2011, 2011.
Tsutsumi, Y. and Murakami, S.: Increase in Global Solar Radiation with Total Cloud Amount from 33 Years Observations in Japan, J. Meteorol. Soc. Jpn., 90, 575–581, https://doi.org/10.2151/jmsj.2012-409, 2012.
Uno, I., Yumimoto, K., Shimizu, A., Hara, Y., Sugimoto, N., Wang, Z., Liu, Z., and Winker, D. M.: 3D structure of Asian dust transport revealed by CALIPSO lidar and a 4DVAR dust model, Geophys. Res. Lett., 35, L06803, https://doi.org/10.1029/2007GL032329, 2008.
Vincent, L. A., Wang, X. L., Milewska, E. J., Wan, H., Yang, F., and Swail, V.: A second generation of homogenized Canadian monthly surface air temperature for climate trend analysis, J. Geophys. Res., 117, D18110, https://doi.org/10.1029/2012JD017859, 2012.
Wang, K., Dickinson, R. E., Ma, Q., Augustine, J. A., and Wild, M.: Measurement Methods Affect the Observed Global Dimming and Brightening, J. Climate, 26, 4112–4120, https://doi.org/10.1175/JCLI-D-12-00482.1, 2013.
Wang, K., Ma, Q., Li, Z., and Wang, J.: Decadal variability of surface incident solar radiation over China: Observations, satellite retrievals, and reanalyses, J. Geophys. Res.-Atmos., 120, 6500–6514, https://doi.org/10.1002/2015JD023420, 2015.
Wang, K. C., Dickinson, R. E., Wild, M., and Liang, S.: Atmospheric impacts on climatic variability of surface incident solar radiation, Atmos. Chem. Phys., 12, 9581–9592, https://doi.org/10.5194/acp-12-9581-2012, 2012.
Wang, X. L.: Comments on “Detection of Undocumented Changepoints: A Revision of the Two-Phase Regression Model”, J. Climate, 16, 3383–3385, https://doi.org/10.1175/1520-0442(2003)016<3383:Codouc>2.0.Co;2, 2003.
Wang, X. L.: Accounting for Autocorrelation in Detecting Mean Shifts in Climate Data Series Using the Penalized Maximal t or F Test, J. Appl. Meteorol. Clim., 47, 2423–2444, https://doi.org/10.1175/2008jamc1741.1, 2008a.
Wang, X. L.: Penalized maximal F test for detecting undocumented mean shift without trend change, J. Atmos. Ocean Tech., 25, 368–384, https://doi.org/10.1175/2007JTECHA982.1, 2008b.
Wang, X. L., Wen, Q. H., and Wu, Y.: Penalized Maximal t Test for Detecting Undocumented Mean Change in Climate Data Series, J. Appl. Meteorol. Clim., 46, 916–931, https://doi.org/10.1175/jam2504.1, 2007.
Wang, X. L., Chen, H. F., Wu, Y. H., Feng, Y., and Pu, Q. A.: New Techniques for the Detection and Adjustment of Shifts in Daily Precipitation Data Series, J. Appl. Meteorol. Clim., 49, 2416–2436, https://doi.org/10.1175/2010JAMC2376.1, 2010.
Wild, M. and Schmucki, E.: Assessment of global dimming and brightening in IPCC-AR4/CMIP3 models and ERA40, Clim. Dynam., 37, 1671–1688, https://doi.org/10.1007/s00382-010-0939-3, 2011.
Wild, M., Gilgen, H., Roesch, A., Ohmura, A., Long, C. N., Dutton, E. G., Forgan, B., Kallis, A., Russak, V., and Tsvetkov, A.: From Dimming to Brightening: Decadal Changes in Solar Radiation at Earth's Surface, Science, 308, 847–850, https://doi.org/10.1126/science.1103215, 2005.
Wild, M., Wacker, S., Yang, S., and Sanchez-Lorenzo, A.: Evidence for Clear-Sky Dimming and Brightening in Central Europe, Geophys. Res. Lett., 48, e2020GL092216, https://doi.org/10.1029/2020GL092216, 2021.
Witham, C. S.: Volcanic disasters and incidents: A new database, J. Volcanol. Geoth. Res., 148, 191–233, https://doi.org/10.1016/j.jvolgeores.2005.04.017, 2005.
Xia, X.: A closer looking at dimming and brightening in China during 1961–2005, Ann. Geophys., 28, 1121–1132, https://doi.org/10.5194/angeo-28-1121-2010, 2010.
Yang, K., Koike, T., and Ye, B. S.: Improving estimation of hourly, daily, and monthly solar radiation by importing global data sets, Agr. Forest Meteorol., 137, 43–55, https://doi.org/10.1016/j.agrformet.2006.02.001, 2006.
Yang, S., Wang, X. L., and Wild, M.: Homogenization and Trend Analysis of the 1958–2016 In Situ Surface Solar Radiation Records in China, J. Climate, 31, 4529–4541, https://doi.org/10.1175/JCLI-D-17-0891.1, 2018.
Zeng, Z., Wang, Z., Gui, K., Yan, X., Gao, M., Luo, M., Geng, H., Liao, T., Li, X., An, J., Liu, H., He, C., Ning, G., and Yang, Y.: Daily Global Solar Radiation in China Estimated From High-Density Meteorological Observations: A Random Forest Model Framework, Earth Space Sci., 7, e2019EA001058, https://doi.org/10.1029/2019EA001058, 2020.
Zhou, C., Wang, J., Dai, A., and Thorne, P. W.: A New Approach to Homogenize Global Subdaily Radiosonde Temperature Data from 1958 to 2018, J. Climate, 34, 1163–1183, https://doi.org/10.1175/JCLI-D-20-0352.1, 2021.
Zhu, C., Wang, B., and Qian, W.: Why do dust storms decrease in northern China concurrently with the recent global warming?, Geophys. Res. Lett., 35, L18702, https://doi.org/10.1029/2008GL034886, 2008.