the Creative Commons Attribution 4.0 License.
the Creative Commons Attribution 4.0 License.
Permafrost changes in the northwestern Da Xing'anling Mountains, Northeast China, in the past decade
Xiaoli Chang
Huijun Jin
Ruixia He
Yanlin Zhang
Xiaoying Li
Xiaoying Jin
Under a pronounced climate warming, permafrost has been degrading in most areas globally, but it is still unclear in the northwestern part of the Da Xing'anling Mountains, Northeast China. According to a 10-year observation of permafrost and active-layer temperatures, the multi-year average of mean annual ground temperatures at 20 m was −2.83, −0.94, −0.80, −0.70, −0.60, and −0.49 ∘C, respectively, at boreholes Gen'he4 (GH4), Mangui3 (MG3), Mangui1 (MG1), Mangui2 (MG2), Gen'he5 (GH5), and Yituli'he2 (YTLH2), with the depths of the permafrost table varying from 1.1 to 7.0 m. Ground cooling at shallow depths has been detected, resulting in declining thaw depths in Yituli'he during 2009–2020, possibly due to relatively stable mean positive air temperature and declining snow cover and a dwindling local population. In most study areas (e.g., Mangui and Gen'he), permafrost warming is particularly pronounced at larger depths (even at 80 m). These results can provide important information for regional development and engineering design and maintenance and also provide a long-term ground temperature dataset for the validation of models relevant to the thermal dynamics of permafrost in the Da Xing'anling Mountains. All of the datasets are published through the National Tibetan Plateau Data Center (TPDC), and the link is https://doi.org/10.11888/Geocry.tpdc.271752 (Chang, 2021).
- Article
(6364 KB) - Full-text XML
- BibTeX
- EndNote
Permafrost, defined as ground that remains at or below 0 ∘C consecutively for 2 or more years, is widespread in high-latitude and high-elevation regions (Zhang et al., 2007). One-quarter of the Northern Hemisphere and 17 % of the Earth's currently exposed land surface are underlain by permafrost (Gruber, 2012). Due to climate warming (Farquharson et al., 2019; Sim et al., 2021; Zhang et al., 2019; Ran et al., 2018) and surface disturbances (Guo et al., 2018; Li et al., 2019, 2021), permafrost has experienced widespread degradation during the last decades (Jin et al., 2000, 2007; Zhang et al., 2019; Jin et al., 2021; Chen et al., 2020), evidenced by deeper seasonal thawing (Luo et al., 2018), thinning and warming permafrost (Gruber, 2012; Jin et al., 2021, 2007; Romanovsky et al., 2010; Wu et al., 2022), and areal reduction (Li et al., 2021; Zhang et al., 2021). Permafrost change has attracted extensive attention worldwide (Biskaborn et al., 2019), because it has significant potential impacts on the terrestrial ecohydrological processes (Zhang et al., 2017; Schuur and Mack, 2018; Y. Zhang et al., 2018; Ala-Aho et al., 2021; Ran et al., 2022; Luo et al., 2022) and carbon cycling (Mu et al., 2020; Schuur et al., 2015). In recent decades, huge efforts have been dedicated to developing physically based models aiming to reproduce and predict the thermal dynamic processes of permafrost and their consequences. However, the lack of long-term and systematic in situ observations of permafrost temperature becomes an apparent bottleneck for relevant analysis and model calibration or validation. Observations in deep permafrost are especially rare and precious.
The areal extent of permafrost in China is estimated at about 1.59 × 10⁶ km2 (Ran et al., 2022), mainly in the mountainous areas of northwestern China (Cao et al., 2018), on the Qinghai–Tibet Plateau (about 1.06 × 10⁶–1.17 × 10⁶ km2) (Zou et al., 2017; Cao et al., 2019), and in Northeast China (about 3.1 × 10⁵ km2) (Zhang et al., 2021). The northern part of Northeast China, e.g., the Da Xing'anling Mountains, is characterized by thick surficial deposit of organic soil and peat, dense vegetation, widespread distribution of wetlands in valley bottoms and lowlands, and extensive and stable inversion of air temperature and snow cover in winter, resulting in strong regional differentiations in permafrost features (Jin et al., 2007). Therefore, the permafrost in the Da Xing'anling Mountains is referred to as “Xing'an (Hinggan)-Baikal permafrost (XBP)” (Jin et al., 2007), a distinct type of ecosystem-dominated permafrost (Shur and Jorgenson, 2007). However, the intensity and progress of permafrost observation in this region fell far behind other permafrost regions in China, e.g., the Qinghai–Tibet Plateau (Zhao et al., 2021; Wu et al., 2022). Most permafrost investigations and observations in the Da Xing'anling Mountains were aimed at serving some specific short-term projects in economic development, engineering design, and construction, e.g., road construction and coal mining (Jin et al., 2007), and they were terminated upon the project completion without persistence. In recent years, numerous local studies on permafrost change have been carried out. However, most of them were based on air and/or ground surface temperatures provided by weather stations, reanalysis data (Wei et al., 2011; Z. Zhang et al., 2018; Zhang et al., 2021), or short-term ground thermal observations (He et al., 2021; Jin et al., 2007). Without direct observation of ground temperature profiles and their temporal changes, it is hard to more accurately feature and evaluate the latest distribution and future changes in permafrost in Northeast China under the combined influences of warming climate and human activities (Serban et al., 2021). Similarly to Circumpolar Active Layer Monitoring (CALM) sites (Brown et al., 2000; Grebenets et al., 2021; Shiklomanov et al., 2012) or CALM-South sites (Guglielmin, 2006; Guglielmin et al., 2012; Hrbáček et al., 2021), a comprehensive and persistent observing system has been gradually established since 2009 at Gen'he (GH), Yituli'he (YTLH), and Mangui (MG) in the northwestern part of the Da Xing'anling Mountains, Northeast China. Periodic collection and calibration of data on the thermal regimes of soils in the active layer and permafrost at depths have been carried out in boreholes, generally reaching 20 m in depth and, in one of them, 80 m. Thus, the observing system presents an opportunity to investigate the thermal characteristics of XBP at depths and to understand and evaluate the temporal changes in permafrost features in different landscapes under a warming climate. It can obtain a long-term ground temperature dataset for calibration and validation of models relevant to the thermal dynamics of permafrost in the Da Xing'anling Mountains and provide important information for regional planning, development, and engineering design and maintenance in Northeast China.
The Gen'he station of the China Forest Ecological Research Network (CFERN), Yituli'he Permafrost Observatory (YTLH), and Mangui Permafrost Station (MG) are found in the discontinuous permafrost zone of Northeast China (Fig. 1), where it is characterized by a cold temperate continental climate under the influences of alternating monsoons. The multi-year average of mean annual air temperature (MAAT) was −4.0 ∘C at Gen'he (1961–2020), −5.2 ∘C at Yituli'he (1965–2005), and −5.8 ∘C at Mangui (1996–2005). During the same periods, the multi-year average of annual precipitation was 440 mm at Gen'he, 460 mm at Yituli'he, and 480 mm at Mangui (Yang, 2007; Jin et al., 2007). The precipitation falls mainly in the form of summer rain, and snowfall accounts for about 12 %–20 % (in snow water equivalent, or SWE). Stable snow cover on the ground surface usually starts to occur in late October and generally disappears in the next April.
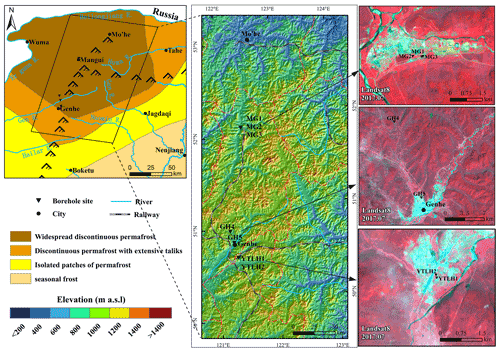
Figure 1Location of the study area and the distribution of Mangui1 (MG1), Mangui2 (MG2), Mangui3 (MG3), Gen'he4 (GH4), Gen'he5 (GH5), Yituli'he1 (YTLH1), and Yituli'he2 (YTLH2) in zones of frozen ground in the northern Da Xing'anling Mountains, Northeast China (the permafrost distribution is from Jin et al., 2007).
In the vicinity of the CFERN, five boreholes were installed at Gen'he, and the datasets at GH4 and GH5 (Fig. 1) with good quality were presented in this study. Two boreholes (YTLH1 and YTLH2) and three boreholes (MG1, MG2, and MG3) were installed at YTLH and MG, respectively (Fig. 1). The vegetation differs slightly from site to site at all mentioned boreholes (Table 1). For example, GH4 is located in a larch (Larix gmelinii) forest, whereas GH5, YTLH1, YTLH2, and MG2 are in sedge (Carex tato) meadows. MG3 is in an open backyard, and MG1 is located in a birch (Betula) shrubland with sedges (Carex tato) as an understory. The soil types at all the boreholes are the same, i.e., brown coniferous forest soil.
Table 1Characteristics and monitoring information of ground temperature boreholes in the northwestern part of the Da Xing'anling Mountains, Northeast China.
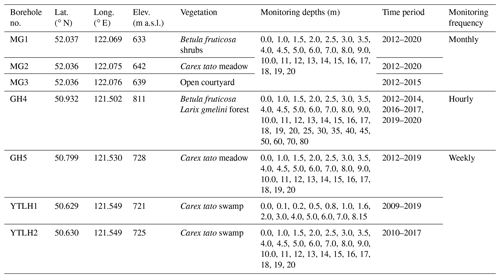
Among the seven boreholes, YTLH1 with a depth of 8.15 m was first installed for monitoring the hydrothermal dynamics of the active layer and shallow permafrost at the end of 2008, with weekly manual measurement of soil temperatures since 2009. However, in order to monitor the permafrost temperature at the depth of zero annual amplitude (generally at 10–25 m in Northeast China), YTLH2 was drilled to a depth of 20 m at a nearby site (10 m away from the YTLH1) with almost identical physical and vegetative conditions on the ground surface. Thermistor cables for monitoring the ground temperatures had been permanently installed in the boreholes since 2010. GH4, GH5, MG1, MG2, and MG3 have been installed and working since the beginning of 2012 but with different observational frequencies (Table 1). All the thermistor cables were assembled with the same technology standards by the State Key Laboratory of Frozen Soils Engineering (SKLFSE) in the Cold and Arid Regions Environmental and Engineering Research Institute (CAREERI; now renamed the Northwest Institute of Eco-Environment and Resources, or NIEER) of the CAS (Chinese Academy of Sciences). The accuracies of ground temperature measurement are ±0.05 ∘C in the temperature range from −30 to +30 ∘C and ±0.1 ∘C in the ranges from −45 to −30 ∘C and from +30 to +50 ∘C.
For continuous observation, the thermistor cables at GH4 were connected to a micrologger of CR3000 (Compbell®), and the ground temperatures were automatically collected in an hourly time step, whereas the ground temperatures at other boreholes were manually measured with a multi-meter (Fluke 189®). Unfortunately, not all records for ground temperatures are complete in time for all boreholes. For example, there were two hiatuses for the records of GH4 (2014–2016 and 2017–2019) due to the logger damage. Manual records from January to June in 2014 for the other boreholes were lost in mailing. The measurement at MG3 was halted in 2016 because of borehole damage and that at GH5 and YTLH2 in 2020, due to the outbreak of the COVID-19 virus and the ensuing traffic control. The specifics are presented in Table 1.
3.1 Ground temperatures in near-surface permafrost and the active layer
Ground temperatures of near-surface soil (e.g., at depths of 1 and 2 m) respond quickly to changes in air temperature, but the change patterns of ground temperatures show a reduction in amplitude with increasing depth in all boreholes. In boreholes GH4, MG3, YTLH1, and YTLH2, seasonal variations in ground temperature could still be detected at the depth of 5 m. However, at depths of 3 and 4 m, variations in winter ground temperatures gradually flatten out in boreholes GH5, MG1, and MG2, and only the annual variability in summer ground temperatures can be detected at the depth of 5 m (Fig. 2). Therefore, only a small temperature amplitude (0.5–1.0 ∘C) was detected at the depth of 5 m in comparison with that at 3 m (2–3 ∘C).
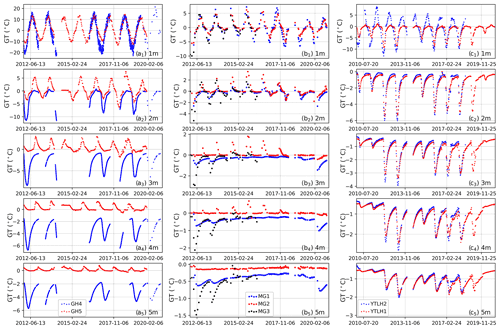
Figure 2Variability of measured ground temperatures at depths of 1–5 m for boreholes GH4 and GH5 (a), MG1, MG2, and MG3 (b), and YTLH1 and YTLH2 (c).
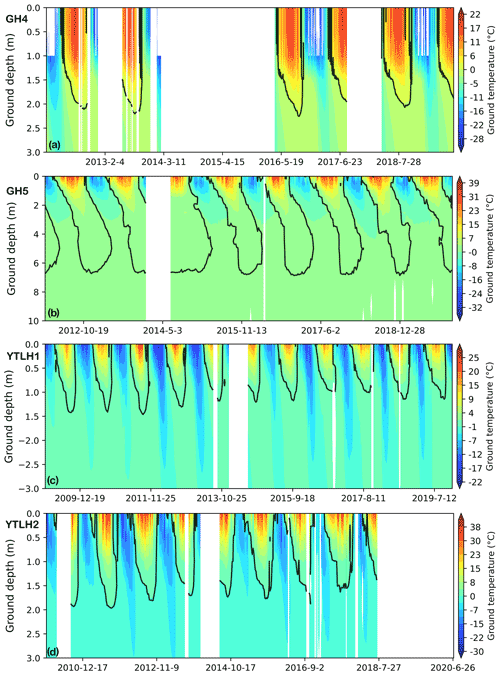
Based on the thermal observation at MG1, 2.6 m (2017) and 1.9 m (2020) in depth were, respectively, the maximum and minimum depths of the permafrost table (Table 2). Combining the data in Fig. 2b and other observational data, the active layer thickness (ALT) at MG2 increased from 4.3 m (2012) to 4.8 m (2016) but thinned to 4.2 m (2019) afterwards. The permafrost table at MG3 was located at 2.8 m (2012 and 2013), 4.0 m (2014), and 3.3 m (2015) in depth during the observation period. Subtle freeze–thaw cycles were observed at 2.0 m in depth in GH4 (Fig. 2a2), and the 0 ∘C isotherms in Fig. 3a indicated a range of ALT from 2.2 m (2016) to 2.0 m (2018). In GH5, there still exist obvious freeze–thaw cycles at the depth of 6.0 m, despite a small varying range in ground temperature (0.5 ∘C). However, the ground temperature at the depth of 7.0 m stayed below 0 ∘C all year round during the monitoring period, approximating to 0 ∘C and with a multi-year average of mean annual ground temperature at −0.08 ∘C. That is, the thawing front reached down to the depth of 7.0 m every year (Fig. 3b), which means that the permafrost table here has been lowered to 7.0 m in depth. In YTLH1, ground thawing occurred occasionally at 2.0 m, as an example, in October 2016, but the ALT mostly varied from 1.5 m (2011) to 1.0 m (2017) during the observation (Fig. 3c). In the same period in 2016, −0.1 ∘C was registered as the highest temperature at 2.0 m in depth in YTLH2 (Fig. 2c2), but an above-zero temperature at 1.5 m. The depth of the permafrost table fluctuated between 1.6 m (2017) and 2.0 m (2011 and 2016) (Fig. 3d and Table 2).
Table 2ALT and average MAGTs of boreholes at depths of 8–20 m in the northwestern Da Xing'anling Mountains, Northeast China.

3.2 Changes in permafrost temperature at depth
Figure 4 highlights the changes in thermal regimes of permafrost at different depths in boreholes MG1, MG2, and MG3. Ground temperature was on the rise, but its amplitude decreased with depth since the beginning of the observation in 2012. The depth of zero annual amplitude (ZAA) was estimated to be the place where ground temperature changes by no more than 0.1 ∘C throughout a year (Permafrost Subcommittee, Associate Committee on Geotechnical Research, 1998, revised 2005). Although the ground temperature was not measured periodically with a very fine time step and some values were lost, the estimation could still be reasonable, because the temperature fluctuation in deep ground is significantly dampened. According to the monitoring data, the depth of ZAA varies among different boreholes (Table 2) without considering interannual changes. In order to show more accurate thermal states of permafrost, ground temperatures of 20 m were chosen to compare within different boreholes in this study. In MG1, the varying amplitudes of ground temperatures for depths deeper than 8 m were no more than 0.4 ∘C, and seasonal variability was hardly detectable at depths of 16 and 20 m. The results of linear fitting (red trend lines) indicate an overall warming trend of permafrost during 2012–2020. A multi-year average of mean annual ground temperature (MAGT, at 20 m, from 2012 to 2020) of −0.77 ∘C was obtained in borehole MG1. In MG2, the ground temperature varied slightly (±0.06 ∘C) with seasons even at the depth of 20 m, where the MAGT was about −0.69 ∘C. Permafrost here was also warming, with a rising amplitude of 0.1–0.2 ∘C from 2012 to 2020. The valid monitoring period was less than 5 years in MG3 (1 January 2012 to 29 April 2016), when the largest ground temperature range of 0.2–0.5 ∘C was detected between the depths from 8 to 20 m. Similar to that in MG2, the permafrost temperature at the depth of 20 m in borehole MG3 has been experiencing some seasonal variations, with a multi-year average of MAGT at −0.94 ∘C (Table 2).
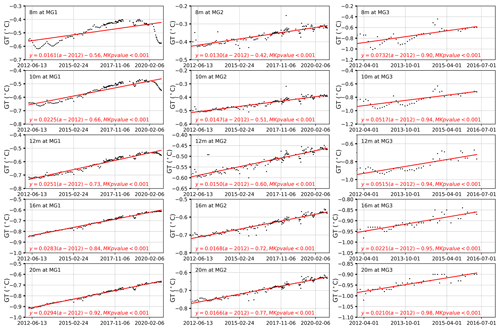
Figure 4Variability of permafrost temperatures at depths of 8, 10, 12, 16, and 20 m in boreholes MG1, MG2, and MG3 in Mangui, northern Da Xing'anling Mountains, Northeast China, during 2012–2020. GT stands for ground temperature.
During 2012–2020, permafrost at depths of 8 and 20 m in GH4 and GH5 (Fig. 5) warmed by 1.5–0.2 and 0.2–0.1 ∘C, respectively. The warming of permafrost at GH5 was insignificant in comparison with that at other sites. Mean annual ground temperature at 8 m in depth slightly warmed from −0.17 ∘C in 2012 to −0.16 ∘C in 2019 and the MAGT at 20 m in depth from −0.60 to −0.57 ∘C over the same period. MAGT at 20 m in depth was averaged at −0.59 ∘C during 2012–2019. However, permafrost at GH4 was obviously colder, with a multi-year average of MAGT at −2.84 ∘C at 20 m in depth. According to Fig. 5, ground temperatures at depths of 8–20 m fluctuated seasonally. However, seasonal variations in ground temperature dwindled gradually at depths deeper than 30 m (Fig. 6), leaving only interannual variations. Ground temperatures in GH4 increased with increasing depth (−2.51, −1.76, and −0.41 ∘C at 30, 50, and 80 m, respectively), whereas the thermal fluctuations declined downwards (0.2 ∘C at 20 and 30 m in depth but 0.03 ∘C at 80 m). During 2012–2020, the permafrost at depths of 30–80 m at GH4 was warming at an average rate of 0.04–0.20 ∘C per decade.
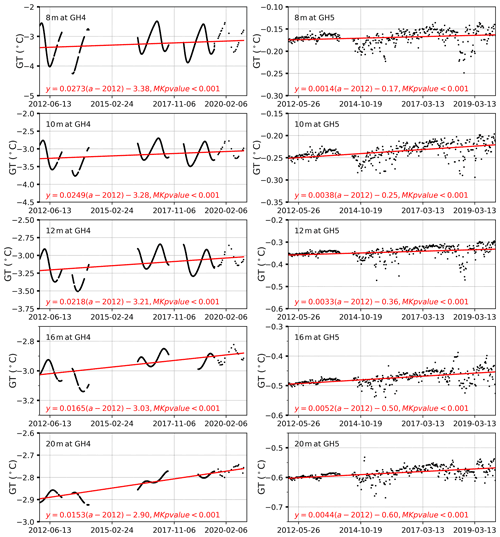
Figure 5Variations in permafrost temperatures at depths of 8, 10, 12, 16, and 20 m in boreholes GH4 and GH5 in Gen'he, northern Da Xing'anling Mountains, Northeast China, during 2012–2020.
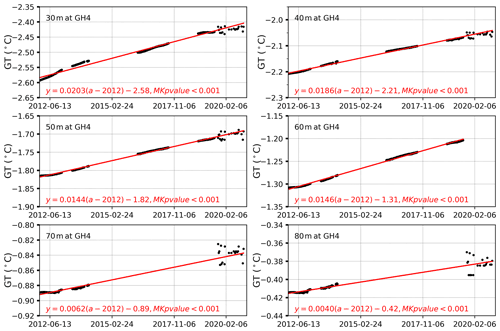
Figure 6Variability of deep permafrost temperatures at depths of 30–80 m for borehole GH4 in Gen'he, northern Da Xing'anling Mountains, Northeast China, during 2012–2020.
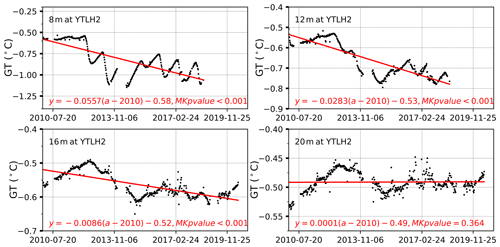
In borehole YTLH2, remarkable seasonal variations were noted at each measured depth. The seasonal variation amplitude of ground temperature gradually dampened with increasing depth, varying from approximately 0.5 ∘C at 8 m in depth to less than 0.1 ∘C at 20 m. Unlike permafrost in Mangui and Gen'he, a significant cooling of permafrost was detected at all depths except 20 m at YTLH2 during the 10-year observation (Fig. 7). The average rate of temperature change at 20 m depth is close to 0 ∘C per decade, and the MAGT here has been roughly maintained at −0.49 ∘C in the past decade (Table 2).
4.1 Changes in near-surface permafrost temperatures
Based on the analysis in Sect. 3.1, it can be inferred that changes in ground thermal regimes (especially in ALT) of the ecosystem-dominated permafrost on the northwestern slope of the Da Xing'anling Mountains are mainly controlled by the changes in local factors, such as vegetation and snow covers and human activities. For example, ALT ranges from 2.5 m in 2016 and 2017 to 1.9 m in 2020 for the borehole in shrubs (MG1), 4.8 m in 2017 to 4.2 m in 2020 for the borehole in sedge meadow (MG2), and 2.9 m in 2012 to 4.0 m in 2014 for the borehole in a farmer's backyard (MG3) during the observation period. Apparently, borehole MG1, far away from downtown Mangui, had the lowest ALT because of the more shading effect of shrubs than that of the meadow (MG2) and a less anthropogenic impact than that of the backyard (MG3). A declining trend of ALT was also observed in the Nanwenghe Wetlands Reserve on the southern slope of the Da Xing'anling–Yile'huli mountain knots, Northeast China, probably driven by rising surface and thermal offsets of vegetation cover and organic soils (He et al., 2021). Additionally, at MG3, the smaller ALT could be attributed to the shading effect of the farmer's house and more heat loss to the atmosphere caused by snow removal in the yard in winter as well. In Gen'he, at the site of GH4 in a primeval forest, ALT remained unchanged at 2.2 m from 2012 to 2016 and, without human disturbance, permafrost was well-preserved. By contrast, at the GH5 site in the suburb meadow frequently disturbed by the nearby livestock, a complex thermal regime was observed in the active layer. Ground temperatures at the depths of 3.5–6.0 m were below 0 ∘C from March to September and above 0 ∘C at other times every year, and not until 7.0 m in depth, where they became below 0 ∘C all year round. By definition, the active layer is the layer above permafrost that freezes in winter and thaws in summer. Therefore, 7 m is supposed to be the reasonable ALT or the depth of the permafrost table, and there might be no supra-permafrost subaerial talik (Jin et al., 2021) between the active layer and the permafrost table at this site, i.e., attached permafrost. However, the supra-permafrost subaerial talik, which has appeared in the Nanwenghe Wetlands Reserve about 300 km to the east of the study site (He et al., 2021), may develop at this site in future. In Yituli'he, the two boreholes (YTLH1 and YTLH2) are about 20 m apart, both in a meadowy swamp to the east of the railway and to the west of a highway. Permafrost here is well-developed, partially attributed to the sufficient moisture provided by the lowland swamp, which also possibly facilitates the formation of ice wedges (Yang and Jin, 2011).
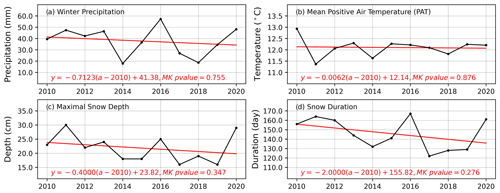
Notably, there was a decreasing trend in ground temperatures at shallow depths regardless of summer or winter during 2010–2020 (Fig. 2), suggesting a cooling permafrost at shallow depths in the last decade on the northwestern slope of the Da Xing'anling Mountains. The maximum thaw depth (MTD) in Yituli'he rose gradually with fluctuations during 1980–2005, and it showed a downward trend during 2010–2019 (Fig. 8). This could be related to the thriving vegetation and declining winter precipitation or snow cover in this area during the observational period. In the last decade, although the mean positive air temperature (MPAT) barely changed in Gen'he (Fig. 9b), precipitation in warm seasons increased slightly, leading to a wetter condition in favor of vegetation thriving. For example, the maximum vegetation height of Carex tato at YTLH1 and YTLH2 grew significantly from 2009 to 2014. Bushes have also emerged recently near the borehole. Thriving vegetation reduces the solar irradiance incident onto the soil surface in summer, cooling the ground. By contrast, the winter precipitation (Fig. 9a) and snow cover, including the maximal snow depth (Fig. 9c) and snow duration (Fig. 9d), declined slightly. The thermal insulation effect of snow cover weakens when the depth of the snow cover declines, which will lead to a larger heat removal from the permafrost to air in winter and drive the permafrost cooling. Detailed mechanisms for the cooling permafrost will be further investigated with the help of some physically based models after complementing observations of the interactions of energy balance between the permafrost, vegetation, and snow cover.
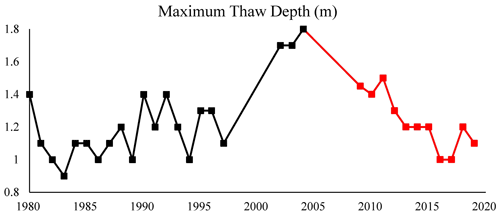
Figure 8The maximum thaw depth (1980–2019) in Yituli'he on the northwestern flank of the northern Da Xing'anling Mountains in Northeast China. Black squares appeared in the paper from Jin et al. (2007), and red ones are obtained in this observation. The two boreholes are 10 m from each other, with similar surface, hydrology, and soil conditions.
4.2 Changes in permafrost temperatures at depth
4.2.1 Permafrost in Mangui
During the observation period, the averages of MAGTs at the depth of 20 m were −0.79, −0.70, and −0.93 ∘C, respectively, in shrubs (MG1), meadow (MG2), and the farmer's backyard (MG3), indicating a poor correlation between the thermal state of deep permafrost and vegetation cover or anthropic disturbances. However, there was a close relationship between the permafrost change at depth and land surface conditions. The permafrost deeper than 8 m was significantly warming in the last decade under a warming climate (Fig. 4). In MG1 and MG2 in particular, the rates of ground warming increased slightly with depth (<0.3∘ per decade for MG1 and <0.2∘ per decade for MG2). Within the zone of discontinuous permafrost, the negative relationship between effective leaf area index (LAIe) and soil moisture content may contribute to differential rates of permafrost thaw (Baltzer et al., 2014). Therefore, more effective water uptake by shrubs than meadow results in lower soil moisture, leading to a more rapid thaw of permafrost at MG1 than that at MG2. The warming rate of permafrost in MG3, with a large warming range, decreased with depth (0.5∘ per decade at depths of 10 and 12 m but approximately 0.2∘ per decade at depths of 16 and 20 m), probably due to the short monitoring period and fewer data. However, it does verify that, in Mangui, permafrost at depth has been warming or degrading in the last decade.
4.2.2 Permafrost in Gen'he
Indeed, there exist some long periods with missing data at GH4. However, although the fluctuation of ground temperatures is relatively large at surface layers, the collected data have generally captured the maximal and minimal ground temperatures for some important years. Simply by visual inspection, the minimal or maximal ground temperatures in the observed years have an apparent warming trend from 2012 to 2020, which has a good coincidence with the trend analysis in this study. That is, although the missing values could make some loss for the accuracy of the trending analysis or make it less robust, they will not change the trend in an antipodal way. In addition, in the ground deeper than 8 m, the annual fluctuation of ground temperature was much less than that in the surface layers, as shown in Figs. 5 and 6. The missing values will not vary too much from the closest collected values in time. Therefore, we assume that the influence of missing values on the trending analysis of ground temperature at depth will be smaller than that in the surface layers, and it will decrease with depth, which can be inferred from Figs. 5 and 6.
In GH4, lower ground temperatures and greater warming rates were observed in comparison with those in GH5 in the last decade (Fig. 5). Even at the depths of 70 and 80 m, the ground temperatures were still rising with time at appreciable warming rates (Fig. 6). A subtle warming trend of permafrost at depths of 8–20 m in GH5 was also detected with a rate of 0.04∘ per decade during the observation period (Figure 5). This warming rate of ground temperature is similar to that of the borehole 85-8A in the southern zone of discontinuous permafrost in North America, where the permafrost is often vertically isothermal and close to 0∘ in ground temperature (Smith et al., 2010). In this situation, latent heat effects are considered the key factor in leading to isothermal conditions in the ground and allowing permafrost to persist under a warming climate (Smith et al., 2010). If the effect of large thermal inertia lasts long enough, the supra-permafrost subaerial talik will be highly likely to form, and permafrost will be gradually buried. Overall, the permafrost at depth in a forested landscape in Gen'he is in an evident warming trend at present.
4.2.3 Permafrost in Yituli'he
According to a previous study (Jin et al., 2007), MAGT at 13 m in Yituli'he rose by 0.2 ∘C during 1984–1997, continuously rising from −1.00 ∘C in 1997 to −0.55 ∘C in 2010, except during the short suspension of monitoring (2005–2008), and peaking at −0.53 ∘C in 2013. After that, it kept decreasing consecutively, and by 2018 it was lower than −0.70 ∘C, showing an evident cooling trend of permafrost, in sharp contrast to the ground warming trends in Gen'he, Mangui, and other permafrost regions in the world (Douglas et al., 2021; Farquharson et al., 2019). Based on an investigation, there was once a railway branch administration in Yituli'he from 1964 to the 1970s, with a population of over 30 000, but the branch was terminated in 1998. After that, more and more people emigrated, and fewer than 10 000 residents remain at present, thus leaving a chance for recovery of the local eco-environment and permafrost temperature.
So far, the mitigation of permafrost degradation has become considerably difficult in the context of persistent climate warming (Brown et al., 2015; Luo et al., 2018). However, within the dried margin of the Twelvemile Lake (66∘27′ N, 145∘34′ W), permafrost aggradation has taken place due to willow shrub uptake of summer recharge and summer shading recharge reduction (Briggs et al., 2014). Beer et al. (2020) also found that most permafrost-affected soil could be preserved by increasing the population density of big herbivores in northern high-latitude ecosystems as a result of reducing the insulation of winter snow cover. The fact that permafrost is cooling in Yituli'he demonstrates that the ecosystem-protected permafrost in the discontinuous permafrost zone may recover if the disturbances, such as human activities, dwindle. Thus, our research results would provide key evidence of the preservation of permafrost in areas with intense past anthropic disturbances (Serban et al., 2021).
The dataset is available from the National Tibetan Plateau/Third Pole Environment Data Center (https://doi.org/10.11888/Geocry.tpdc.271752, Chang, 2021).
Long-term records of permafrost monitoring presented here from the northwestern flank of the Da Xing'anling Mountains in Northeast China show some important characteristics of ground thermal regimes in the past 8 years (2012–2020). The lowest MAGT at 20 m in depth was −2.83∘ in GH4 in a primeval larch forest and −0.94, −0.80, −0.70, −0.60, and −0.49∘, respectively, at MG3, MG1, MG2, GH5, and YTLH2. The maximum of burial depth of the permafrost table at about 7.0 m was discovered in GH5 and the minimum, 1.1–1.5 m, at YTLH1. The permafrost table was at depths of about 2.0 m at GH4 and YTLH2 and 2.5, 5.0, and 4.0 m at MG1, MG2, and MG3, respectively. Local factors, such as vegetation, snow cover, and human activities, are supposed to be mainly responsible for the changes in ALT and the thermal state of shallow permafrost in the study area. The most important fact is that ground cooling at shallow depths, as well as the declining ALT in Yituli'he after 2009, has been detected during the observation period, which is probably caused by fairly constant MPAT (mean positive air temperature) and weakened insulation of winter snow cover.
Apart from Yituli'he, permafrost warming at depth was particularly pronounced during the observation period, even at depths of 70 and 80 m, with different ground warming rates. It is noteworthy that the geothermal gradient at depth in GH5 is almost zero (vertically no change) and, with MAGT, about 0 ∘C due to the huge thermal inertia of the ice-rich permafrost. This will most likely lead to the formation of a supra-permafrost subaerial talik soon. At the Yituli'he Permafrost Observatory, permafrost has been cooling since the re-establishment of the monitoring program in 2010; the rapidly declining local population might have relieved its stress on the eco-environment and resulted in permafrost recovery. This fact makes it possible to mitigate the permafrost degradation in zones of ecosystem-dominated permafrost, offering new thought for permafrost protection.
XC, HJ, and RH designed the study. XC wrote the manuscript and performed the analysis. YZ plotted the figures. XL, XJ, and GL contributed parts of the field data. HJ improved the writing and structure of the paper.
The contact author has declared that none of the authors has any competing interests.
Publisher's note: Copernicus Publications remains neutral with regard to jurisdictional claims in published maps and institutional affiliations.
This article is part of the special issue “Extreme environment datasets for the three poles”. It is not associated with a conference.
Thanks go to the Inner Mongolia Agricultural University for fieldwork support and the Gen'he Weather Bureau for meteorological data provision. This study was financially supported by the National Natural Science Foundation of China (grant nos. 41971079, 41671059, 41871052, and U20A2082) and the Natural Science Program of Hunan Province (grant no. 2020JJ5161).
This research has been supported by the National Natural Science Foundation of China (grant nos. 41971079, 41671059, 41871052, and U20A2082) and the Science and Technology Program of Hunan Province (grant no. 2020JJ5161).
This paper was edited by Min Feng and reviewed by two anonymous referees.
Ala-Aho, P., Autio, A., Bhattacharjee, J., Isokangas, E., Kujala, K., Marttila, H., Menberu, M., Meriö, L. J., Postila, H., Rauhala, A., Ronkanen, A. K., Rossi, P. M., Saari, M., Haghighi, A. T., and Kløve, B.: What conditions favor the influence of seasonally frozen ground on hydrological partitioning? A systematic review, Environ. Res. Lett., 16, 043008, https://doi.org/10.1088/1748-9326/abe82c, 2021.
Baltzer, J. L., Veness, T., Chasmer, L. E., Sniderhan, A. E., and Quinton, W. L.: Forests on thawing permafrost: fragmentation, edge effects, and net forest loss, Glob. Change Biol., 20, 824–834, https://doi.org/10.1111/gcb.12349, 2014.
Beer, C., Zimov, N., Olofsson, J., Porada, P., and Zimov, S.: Protection of Permafrost Soils from Thawing by Increasing Herbivore Density, Sci. Rep., 10, 4170, https://doi.org/10.1038/s41598-020-60938-y, 2020.
Biskaborn, B. K., Smith, S. L., Noetzli, J., Matthes, H., Vieira, G., Streletskiy, D. A., Schoeneich, P., Romanovsky, V. E., Lewkowicz, A. G., Abramov, A., Allard, M., Boike, J., Cable, W. L., Christiansen, H. H., Delaloye, R., Diekmann, B., Drozdov, D., Etzelmüller, B., Grosse, G., Guglielmin, M., Ingeman-Nielsen, T., Isaksen, K., Ishikawa, M., Johansson, M., Johannsson, H., Joo, A., Kaverin, D., Kholodov, A., Konstantinov, P., Kröger, T., Lambiel, C., Lanckman, J.-P., Luo, D., Malkova, G., Meiklejohn, I., Moskalenko, N., Oliva, M., Phillips, M., Ramos, M., Sannel, A. B. K., Sergeev, D., Seybold, C., Skryabin, P., Vasiliev, A., Wu, Q., Yoshikawa, K., Zheleznyak, M., and Lantuit, H.: Permafrost is warming at a global scale, Nat. Commun., 10, 264, https://doi.org/10.1038/s41467-018-08240-4, 2019.
Briggs, M. A., Walvoord, M. A., McKenzie, J. M., Voss, C. I., Day-Lewis, F. D., and Lane, J. W.: New permafrost is forming around shrinking Arctic lakes, but will it last?, Geophys. Res. Lett., 41, 1585–1592, https://doi.org/10.1002/2014GL059251, 2014.
Brown, D. R. N., Jorgenson, M. T., Douglas, T. A., Romanovsky, V. E., Kielland, K., Hiemstra, C., Euskirchen, E. S., and Ruess, R. W.: Interactive effects of wildfire and climate on permafrost degradation in Alaskan lowland forests, J. Geophys. Res.-Biogeosc., 120, 1619–1637, https://doi.org/10.1002/2015JG003033, 2015.
Brown, J., Hinkel, K. M., and Nelson, F. E.: The circumpolar active layer monitoring (CALM) program: Research designs and initial results, Pol. Geogr., 24, 166–258, https://doi.org/10.1080/10889370009377698, 2000.
Cao, B., Zhang, T., Peng, X., Mu, C., Wang, Q., Zheng, L., Wang, K., and Zhong, X.: Thermal Characteristics and Recent Changes of Permafrost in the Upper Reaches of the Heihe River Basin, Western China, J. Geophys. Res.-Atmos., 123, 7935–7949, https://doi.org/10.1029/2018JD028442, 2018.
Cao, B., Zhang, T., Wu, Q., Sheng, Y., Zhao, L., and Zou, D.: Permafrost zonation index map and statistics over the Qinghai-Tibet Plateau based on field evidence, Permafrost Periglac., 30, 178–194, https://doi.org/10.1002/ppp.2006, 2019.
Chang, X.: Geotemperature observation data set of Genhe River (2012–2019), National Tibetan Plateau Data Center [data set], https://doi.org/10.11888/Geocry.tpdc.271752, 2021.
Chen, S.-S., Zang, S., and Sun, L.: Characteristics of permafrost degradation in Northeast China and its ecological effects: A review, Sci. Cold Arid Reg., 12, 1–11, https://doi.org/10.3724/sp.j.1226.2020.00001, 2020.
Douglas, T. A., Hiemstra, C. A., Anderson, J. E., Barbato, R. A., Bjella, K. L., Deeb, E. J., Gelvin, A. B., Nelsen, P. E., Newman, S. D., Saari, S. P., and Wagner, A. M.: Recent degradation of interior Alaska permafrost mapped with ground surveys, geophysics, deep drilling, and repeat airborne lidar, The Cryosphere, 15, 3555–3575, https://doi.org/10.5194/tc-15-3555-2021, 2021.
Permafrost Subcommittee, Associate Committee on Geotechnical Research: Multi-language glossary of permafrost and related ground-ice terms, National Snow and Ice Data Centre, Boulder, CO, https://globalcryospherewatch.org/reference/glossary_docs/Glossary_of_Permafrost_and_Ground-Ice_IPA_2005.pdf (last access: 14 January 2016), 1998 (revised 2005).
Farquharson, L. M., Romanovsky, V. E., Cable, W. L., Walker, D. A., Kokelj, S. V., and Nicolsky, D.: Climate Change Drives Widespread and Rapid Thermokarst Development in Very Cold Permafrost in the Canadian High Arctic, Geophys. Res. Lett., 46, 6681–6689, https://doi.org/10.1029/2019GL082187, 2019.
Grebenets, V. I., Tolmanov, V. A., and Streletskiy, D. A.: Active Layer Dynamics Near Norilsk, Taimyr Peninsula, Russia, Geogr. Environ. Sustain., 14, 55–66, https://doi.org/10.24057/2071-9388-2021-073, 2021.
Gruber, S.: Derivation and analysis of a high-resolution estimate of global permafrost zonation, The Cryosphere, 6, 221–233, https://doi.org/10.5194/tc-6-221-2012, 2012.
Guglielmin, M.: Ground surface temperature (GST), active layer and permafrost monitoring in continental Antarctica, Permafrost Periglac., 17, 133–143, https://doi.org/10.1002/ppp.553, 2006.
Guglielmin, M., Worland, M. R., and Cannone, N.: Spatial and temporal variability of ground surface temperature and active layer thickness at the margin of maritime Antarctica, Signy Island, Geomorphology, 155–156, 20–33, https://doi.org/10.1016/j.geomorph.2011.12.016, 2012.
Guo, W., Liu, H., Anenkhonov, O. A., Shangguan, H., Sandanov, D. V., Korolyuk, A. Y., Hu, G., and Wu, X.: Vegetation can strongly regulate permafrost degradation at its southern edge through changing surface freeze-thaw processes, Agr. Forest Meteorol., 252, 10–17, https://doi.org/10.1016/j.agrformet.2018.01.010, 2018.
He, R.-X., Jin, H.-J., Luo, D.-L., Li, X.-Y., Zhou, C.-F., Jia, N., Jin, X.-Y., Li, X.-Y., Che, T., Yang, X., Wang, L.-Z., Li, W.-H., Wei, C.-L., Chang, X.-L., and Yu, S.-P.: Permafrost changes in the Nanwenghe Wetlands Reserve on the southern slope of the Da Xing'anling-Yile'huli mountains, Northeast China, Adv. Clim. Change Res. 12, 696–709, https://doi.org/10.1016/j.accre.2021.06.007, 2021.
Hrbáček, F., Vieira, G., Oliva, M., Balks, M., Guglielmin, M., de Pablo, M. Á., Molina, A., Ramos, M., Goyanes, G., Meiklejohn, I., Abramov, A., Demidov, N., Fedorov-Davydov, D., Lupachev, A., Rivkina, E., Láska, K., Kňažková, M., Nývlt, D., Raffi, R., Strelin, J., Sone, T., Fukui, K., Dolgikh, A., Zazovskaya, E., Mergelov, N., Osokin, N., and Miamin, V.: Active layer monitoring in Antarctica: an overview of results from 2006 to 2015, Pol. Geogr., 44, 217–231, https://doi.org/10.1080/1088937X.2017.1420105, 2021.
Jin, H., Li, S., Cheng, G., Shaoling, W., and Li, X.: Permafrost and climatic change in China, Global Planet. Change, 26, 387–404, https://doi.org/10.1016/S0921-8181(00)00051-5, 2000.
Jin, H., Yu, Q., Lü, L., Guo, D., He, R., Yu, S., Sun, G., and Li, Y.: Degradation of permafrost in the Xing'anling Mountains, northeastern China, Permafrost Periglac., 18, 245–258, 2007.
Jin, H., Wu, Q., and Romanovsky, V.: Degrading permafrost and its impacts, Adv. Clim. Change Res., 12, 1–5, https://doi.org/10.1016/j.accre.2021.01.007, 2021.
Li, X., Jin, H., He, R., Huang, Y., Wang, H., Luo, D., Jin, X., Lü, L., Wang, L., Li, W., Wei, C., Chang, X., Yang, S., and Yu, S.: Effects of forest fires on the permafrost environment in the northern Da Xing'anling (Hinggan) mountains, Northeast China, Permafrost Periglac., 30, 163–177, https://doi.org/10.1002/ppp.2001, 2019.
Li, X.-Y., Jin, H.-J., Wang, H.-W., Marchenko, S. S., Shan, W., Luo, D.-L., He, R.-X., Spektor, V., Huang, Y.-D., Li, X.-Y., and Jia, N.: Influences of forest fires on the permafrost environment: A review, Adv. Clim. Change Res., 12, 48–65, https://doi.org/10.1016/j.accre.2021.01.001, 2021.
Luo, D., Guo, D., Jin, H., Yang, S., Phillips, M. K., and Frey, B.: Ecological Impacts of Degrading permafrost, Front. Earth Sci., 10, 967530, https://doi.org/10.3389/feart.2022.967530, 2022.
Luo, L., Ma, W., Zhuang, Y., Zhang, Y., Yi, S., Xu, J., Long, Y., Ma, D., and Zhang, Z.: The impacts of climate change and human activities on alpine vegetation and permafrost in the Qinghai-Tibet Engineering Corridor, Ecol. Indic., 93, 24–35, https://doi.org/10.1016/j.ecolind.2018.04.067, 2018.
Mu, C., Abbott, B. W., Norris, A. J., Mu, M., Fan, C., Chen, X., Jia, L., Yang, R., Zhang, T., Wang, K., Peng, X., Wu, Q., Guggenberger, G., and Wu, X.: The status and stability of permafrost carbon on the Tibetan Plateau, Earth Sci. Rev., 211, 103433, https://doi.org/10.1016/j.earscirev.2020.103433, 2020.
Ran, Y., Li, X., and Cheng, G.: Climate warming over the past half century has led to thermal degradation of permafrost on the Qinghai–Tibet Plateau, The Cryosphere, 12, 595–608, https://doi.org/10.5194/tc-12-595-2018, 2018.
Ran, Y., Li, X., Cheng, G., Che, J., Aalto, J., Karjalainen, O., Hjort, J., Luoto, M., Jin, H., Obu, J., Hori, M., Yu, Q., and Chang, X.: New high-resolution estimates of the permafrost thermal state and hydrothermal conditions over the Northern Hemisphere, Earth Syst. Sci. Data, 14, 865–884, https://doi.org/10.5194/essd-14-865-2022, 2022.
Romanovsky, V. E., Smith, S. L., and Christiansen, H. H.: Permafrost thermal state in the polar Northern Hemisphere during the international polar year 2007–2009: a synthesis, Permafrost Periglac., 21, 106–116, https://doi.org/10.1002/ppp.689, 2010.
Schuur, E. A. G., McGuire, A. D., Schädel, C., Grosse, G., Harden, J. W., Hayes, D. J., Hugelius, G., Koven, C. D., Kuhry, P., Lawrence, D. M., Natali, S. M., Olefeldt, D., Romanovsky, V. E., Schaefer, K., Turetsky, M. R., Treat, C. C., and Vonk, J. E.: Climate change and the permafrost carbon feedback, Nature, 520, 171–179, https://doi.org/10.1038/nature14338, 2015.
Schuur, E. A. G. and Mack, M. C.: Ecological Response to Permafrost Thaw and Consequences for Local and Global Ecosystem Services, Annu. Rev. Ecol. Evol. S., 49, 279–301, https://doi.org/10.1146/annurev-ecolsys-121415-032349, 2018.
Serban, R., Serban, M., He, R., Jin, H., Yan, L., Xinyu, L., Wang, X., and Li, G.: 46-Year (1973–2019) Permafrost Landscape Changes in the Hola Basin, Northeast China Using Machine Learning and Object-Oriented Classification, Remote Sensing, 13, 1910, https://doi.org/10.3390/rs13101910, 2021.
Shiklomanov, N., Streletskiy, D., and Nelson, F.: Northern Hemisphere Component of the Global Circumpolar Active Layer Monitoring (CALM) Program, International Conference on Permafrost (ICOP) Proceedings, 10, 377–382, 2012.
Shur, Y. and Jorgenson, M.: Patterns of Permafrost Formation and Degradation in Relation to Climate and Ecosystems, Permafrost Periglac., 18, 7–19, https://doi.org/10.1002/ppp.582, 2007.
Sim, T. G., Swindles, G. T., Morris, P. J., Baird, A. J., Cooper, C. L., Gallego-Sala, A. V., Charman, D. J., Roland, T. P., Borken, W., Mullan, D. J., Aquino-López, M. A., and Gałka, M.: Divergent responses of permafrost peatlands to recent climate change, Environ. Res. Lett., 16, 034001, https://doi.org/10.1088/1748-9326/abe00b, 2021.
Smith, S. L., Romanovsky, V. E., Lewkowicz, A. G., Burn, C. R., Allard, M., Clow, G. D., Yoshikawa, K., and Throop, J.: Thermal state of permafrost in North America: a contribution to the international polar year, Permafrost Periglac., 21, 117–135, https://doi.org/10.1002/ppp.690, 2010.
Wei, Z., Jin, H., Zhang, J., Yu, S., Han, X., Ji, Y., He, R., and Chang, X.: Prediction of permafrost changes in Northeastern China under a changing climate, Science China Earth Sciences, 54, 924–935, https://doi.org/10.1007/s11430-010-4109-6, 2011.
Wu, T., Xie, C., Zhu, X., Chen, J., Wang, W., Li, R., Wen, A., Wang, D., Lou, P., Shang, C., La, Y., Wei, X., Ma, X., Qiao, Y., Wu, X., Pang, Q., and Hu, G.: Permafrost, active layer, and meteorological data (2010–2020) at the Mahan Mountain relict permafrost site of northeastern Qinghai–Tibet Plateau, Earth Syst. Sci. Data, 14, 1257–1269, https://doi.org/10.5194/essd-14-1257-2022, 2022.
Yang, J. M.: Genhe annals (1996–2005), Inner Mongolia Culture Press, Hailar, 67–71, ISBN 9787805061580, 2007 (in Chinese).
Yang, S. and Jin, H.: δ18O and δD records of inactive ice wedge in Yitulihe, Northeastern China and their paleoclimatic implications, Science China Earth Sciences, 54, 119–126, https://doi.org/10.1007/s11430-010-4029-5, 2011.
Zhang, G., Nan, Z., Wu, X., Ji, H., and Zhao, S.: The Role of Winter Warming in Permafrost Change Over the Qinghai-Tibet Plateau, Geophys. Res. Lett., 46, 11261–11269, https://doi.org/10.1029/2019GL084292, 2019.
Zhang, T., Nelson, F., and Gruber, S.: Introduction to special section: Permafrost and Seasonally Frozen Ground Under a Changing Climate, J. Geophys. Res., 112, F02S01, https://doi.org/10.1029/2007JF000821, 2007.
Zhang, Y., Cheng, G., Jin, H., Yang, D., Flerchinger, G., Chang, X., Bense, V., Han, X., and Liang, J.: Influences of frozen ground and climate change on the hydrological processes in an alpine watershed: A case study in the upstream area of the Hei'he River, Northwest China, Permafrost Periglac., 28, 420–432, 2017.
Zhang, Y., Cheng, G., Jin, H., Yang, D., Flerchinger, G., Chang, X., Wang, X., and Liang, J.: Influences of Topographic Shadows on the Thermal and Hydrological Processes in a Cold Region Mountainous Watershed in Northwest China, J. Adv. Model. Earth Syst., 10, 1439–1457, https://doi.org/10.1029/2017MS001264, 2018.
Zhang, Z., Wu, Q., Xun, X., Wang, B., and Wang, X.: Climate change and the distribution of frozen soil in 1980–2010 in northern northeast China, Quaternary Int., 467, 230–241, https://doi.org/10.1016/j.quaint.2018.01.015, 2018.
Zhang, Z.-Q., Wu, Q.-B., Hou, M.-T., Tai, B.-W., and An, Y.-K.: Permafrost change in Northeast China in the 1950s–2010s, Adv. Clim. Change Res., 12, 18–28, https://doi.org/10.1016/j.accre.2021.01.006, 2021.
Zhao, L., Zou, D., Hu, G., Wu, T., Du, E., Liu, G., Xiao, Y., Li, R., Pang, Q., Qiao, Y., Wu, X., Sun, Z., Xing, Z., Sheng, Y., Zhao, Y., Shi, J., Xie, C., Wang, L., Wang, C., and Cheng, G.: A synthesis dataset of permafrost thermal state for the Qinghai–Tibet (Xizang) Plateau, China, Earth Syst. Sci. Data, 13, 4207–4218, https://doi.org/10.5194/essd-13-4207-2021, 2021.
Zou, D., Zhao, L., Sheng, Y., Chen, J., Hu, G., Wu, T., Wu, J., Xie, C., Wu, X., Pang, Q., Wang, W., Du, E., Li, W., Liu, G., Li, J., Qin, Y., Qiao, Y., Wang, Z., Shi, J., and Cheng, G.: A new map of permafrost distribution on the Tibetan Plateau, The Cryosphere, 11, 2527–2542, https://doi.org/10.5194/tc-11-2527-2017, 2017.


