the Creative Commons Attribution 4.0 License.
the Creative Commons Attribution 4.0 License.
 | 25 Aug 2022
A dataset of lake-catchment characteristics for the Tibetan Plateau
Pengcheng Fang
Yefeng Que
Liang-Jun Zhu
Zheng Duan
Guoan Tang
Pengfei Liu
Yongqin Liu
The management and conservation of lakes should be conducted in the context of catchments because lakes collect water and materials from their upstream catchments. Thus, the datasets of catchment-level characteristics are essential for limnology studies. Lakes are widely spread on the Tibetan Plateau (TP), with a total lake area exceeding 50 000 km2, accounting for more than half of the total lake area in China. However, there has been no dataset of lake-catchment characteristics in this region to date. This study constructed the first dataset of lake-catchment characteristics for 1525 lakes with areas from 0.2 to 4503 km2 on the TP. Considering that large lakes block the transport of materials from upstream to downstream, lake catchments are delineated in two ways: the full catchment, which refers to the full upstream-contributing area of each lake, and the inter-lake catchments, which are obtained by excluding the contributing areas of upstream lakes larger than 0.2 km2 from the full catchment. There are six categories (i.e., lake body, topography, climate, land cover/use, soil and geology, and anthropogenic activity) and a total of 721 attributes in the dataset. Besides multi-year average attributes, the time series of 16 hydrological and meteorological variables are extracted, which can be used to drive or validate lumped hydrological models and machine learning models for hydrological simulation. The dataset contains fundamental information for analyzing the impact of catchment-level characteristics on lake properties, which on the one hand, can deepen our understanding of the drivers of lake environment change, and on the other hand can be used to predict the water and sediment properties in unsampled lakes based on limited samples. This provides exciting opportunities for lake studies in a spatially explicit context and promotes the development of landscape limnology on the TP. The dataset of lake-catchment characteristics for the Tibetan Plateau (LCC-TP v1.0) is accessible at the National Tibetan Plateau/Third Pole Environment Data Center (https://doi.org/10.11888/Terre.tpdc.272026, Liu, 2022).
- Article
(14139 KB) - Full-text XML
-
Supplement
(465 KB) - BibTeX
- EndNote


Lakes are an essential component of inland water and play a key role in maintaining regional ecosystem services (Cole et al., 2007). The management and conservation of lakes should be conducted in the context of catchments because lakes collect water and materials from their upstream catchments. The properties of lake water and sediments (e.g., nutrient concentrations and carbon storage) are affected by catchment-level characteristics such as terrain, land cover, and precipitation amount (Soranno et al., 2010). It was reported that catchment-level land-use composition could explain 45 %–62 % of lake water-quality metrics (e.g., turbidity, total nitrogen, and dissolved organic carbon) across conterminous United States (CONUS) (Read et al., 2015). Therefore, characterizing the upstream catchments of lakes is essential for the scientific study and management of lakes.
Multiple steps and specialized geospatial techniques are required to calculate catchment-level characteristics (Hill et al., 2018; Hao et al., 2021). First, flow directions should be determined from a DEM, and catchment boundaries are then delineated according to flow direction. After that, multiple related spatial datasets are collected and processed (e.g., data format conversion and reprojection). Finally, zonal statistical analyses are performed to get catchment-level characteristics. These procedures have to be repeated for every lake in a region, which is time-consuming; therefore, automatic processing needs to be implemented. This is not easy for people who are not experts in geospatial techniques. In addition, the lake-catchment characteristics calculated by different researchers are usually not consistent in the aspects of feature types and data sources, making the analysis based on these characteristics less comparable.
To provide consistent baseline datasets of lake-catchment characteristics, several products, such as the LAGOS-NE and Lake-Catchment (LakeCat) datasets (Soranno et al., 2017; Hill et al., 2018), have been produced. The LAGOS-NE dataset contains catchment-level characteristics for 51 101 lakes and reservoirs larger than 4 ha in the 17 northeastern-most US states. In this dataset, lake catchments were defined as “inter-lake watersheds” which contains two parts: the area draining directly into a lake and the area draining into its upstream streams and lakes smaller than 0.1 km2 (Soranno et al., 2017). The contributing areas of upstream lakes larger than 0.1 km2 were not included because large lakes can block the transport of materials from upstream to downstream (Zhang et al., 2012). The LakeCat dataset, as an extension to LAGOS-NE, covers the CONUS and contains the data for 378 088 lakes. Besides inter-lake watersheds, the whole upstream watershed was also used as the statistical units and there were more than 200 catchment-level attributes characterizing soil, lithology, land cover, mines, roads, etc. (Hill et al., 2018). These datasets facilitated the research on landscape limnology, which means the study of lakes in the context of catchment-level landscapes (Soranno et al., 2010). Besides, the river-oriented datasets of catchment characteristics, represented by the CAMELS (Catchment Attributes and Meteorology for Large-sample Studies) series of datasets such as CMALES (Addor et al., 2017), CAMLES-CL (Alvarez-Garreton et al., 2018), CMALES-BR (Chagas et al., 2020), CAMLES-GB (Coxon et al., 2020), CCAM (Hao et al., 2021), and LamaH-CE (Klingler et al., 2021) also showed the great value of such catchment-level attribute datasets.
In this research, we focus on the Tibetan Plateau (TP), which has a total lake area exceeding 50 000 km2, accounting for more than half of the total area of lakes in China (Zhang et al., 2019). Due to the paucity of in situ measurements in lakes on the TP, catchment-level characteristics are especially important as they can be used to predict water and sediment properties in unsampled lakes based on limited samples. However, there has been no dataset of lake-catchment characteristics on the TP available to date, which hinders the research on lakes in this region. This study aims to construct the first dataset of lake-catchment characteristics for the TP (LCC-TP v1.0) and to provide indispensable data for studies on TP lakes. Section 2 introduces the study area. Section 3 describes the methodology for metrics calculation of lake-catchment characteristics, including catchment delineation, attribute data collection, and zonal statistics. The main lake-catchment characteristics on the TP are presented in Sect. 4. Section 5 concludes and discusses the potential application of the constructed dataset.
The TP is located between 74–98∘ E and 28–40∘ N (Fig. 1). It is the largest and highest plateau in the world, covering an area of about 2.5 × 10⁶ km2 and with an average altitude over 4000 m above sea level (Zhang et al., 2019). The TP is the source of more than 10 big rivers, such as the Yangtze River, the Yellow River, and the Ganges River, and therefore also acknowledged as the “Water Tower of Asia” (Immerzeel et al., 2010; Gao et al., 2021). Figure 1 shows the major basins over the TP, including Brahmaputra, Hexi Corridor, Indus, Inner TP, Mekong, Qaidam, Salween, Tarim, Yangtze River, and Yellow River. Lakes are a key component of the Asia Water Tower, and there are 1424 lakes with an area of more than 1 km2 (Zhang et al., 2019). Most lakes on the TP are seldom disturbed by human activities, and thus they are good information carriers of global changes in this region (Li et al., 1998).
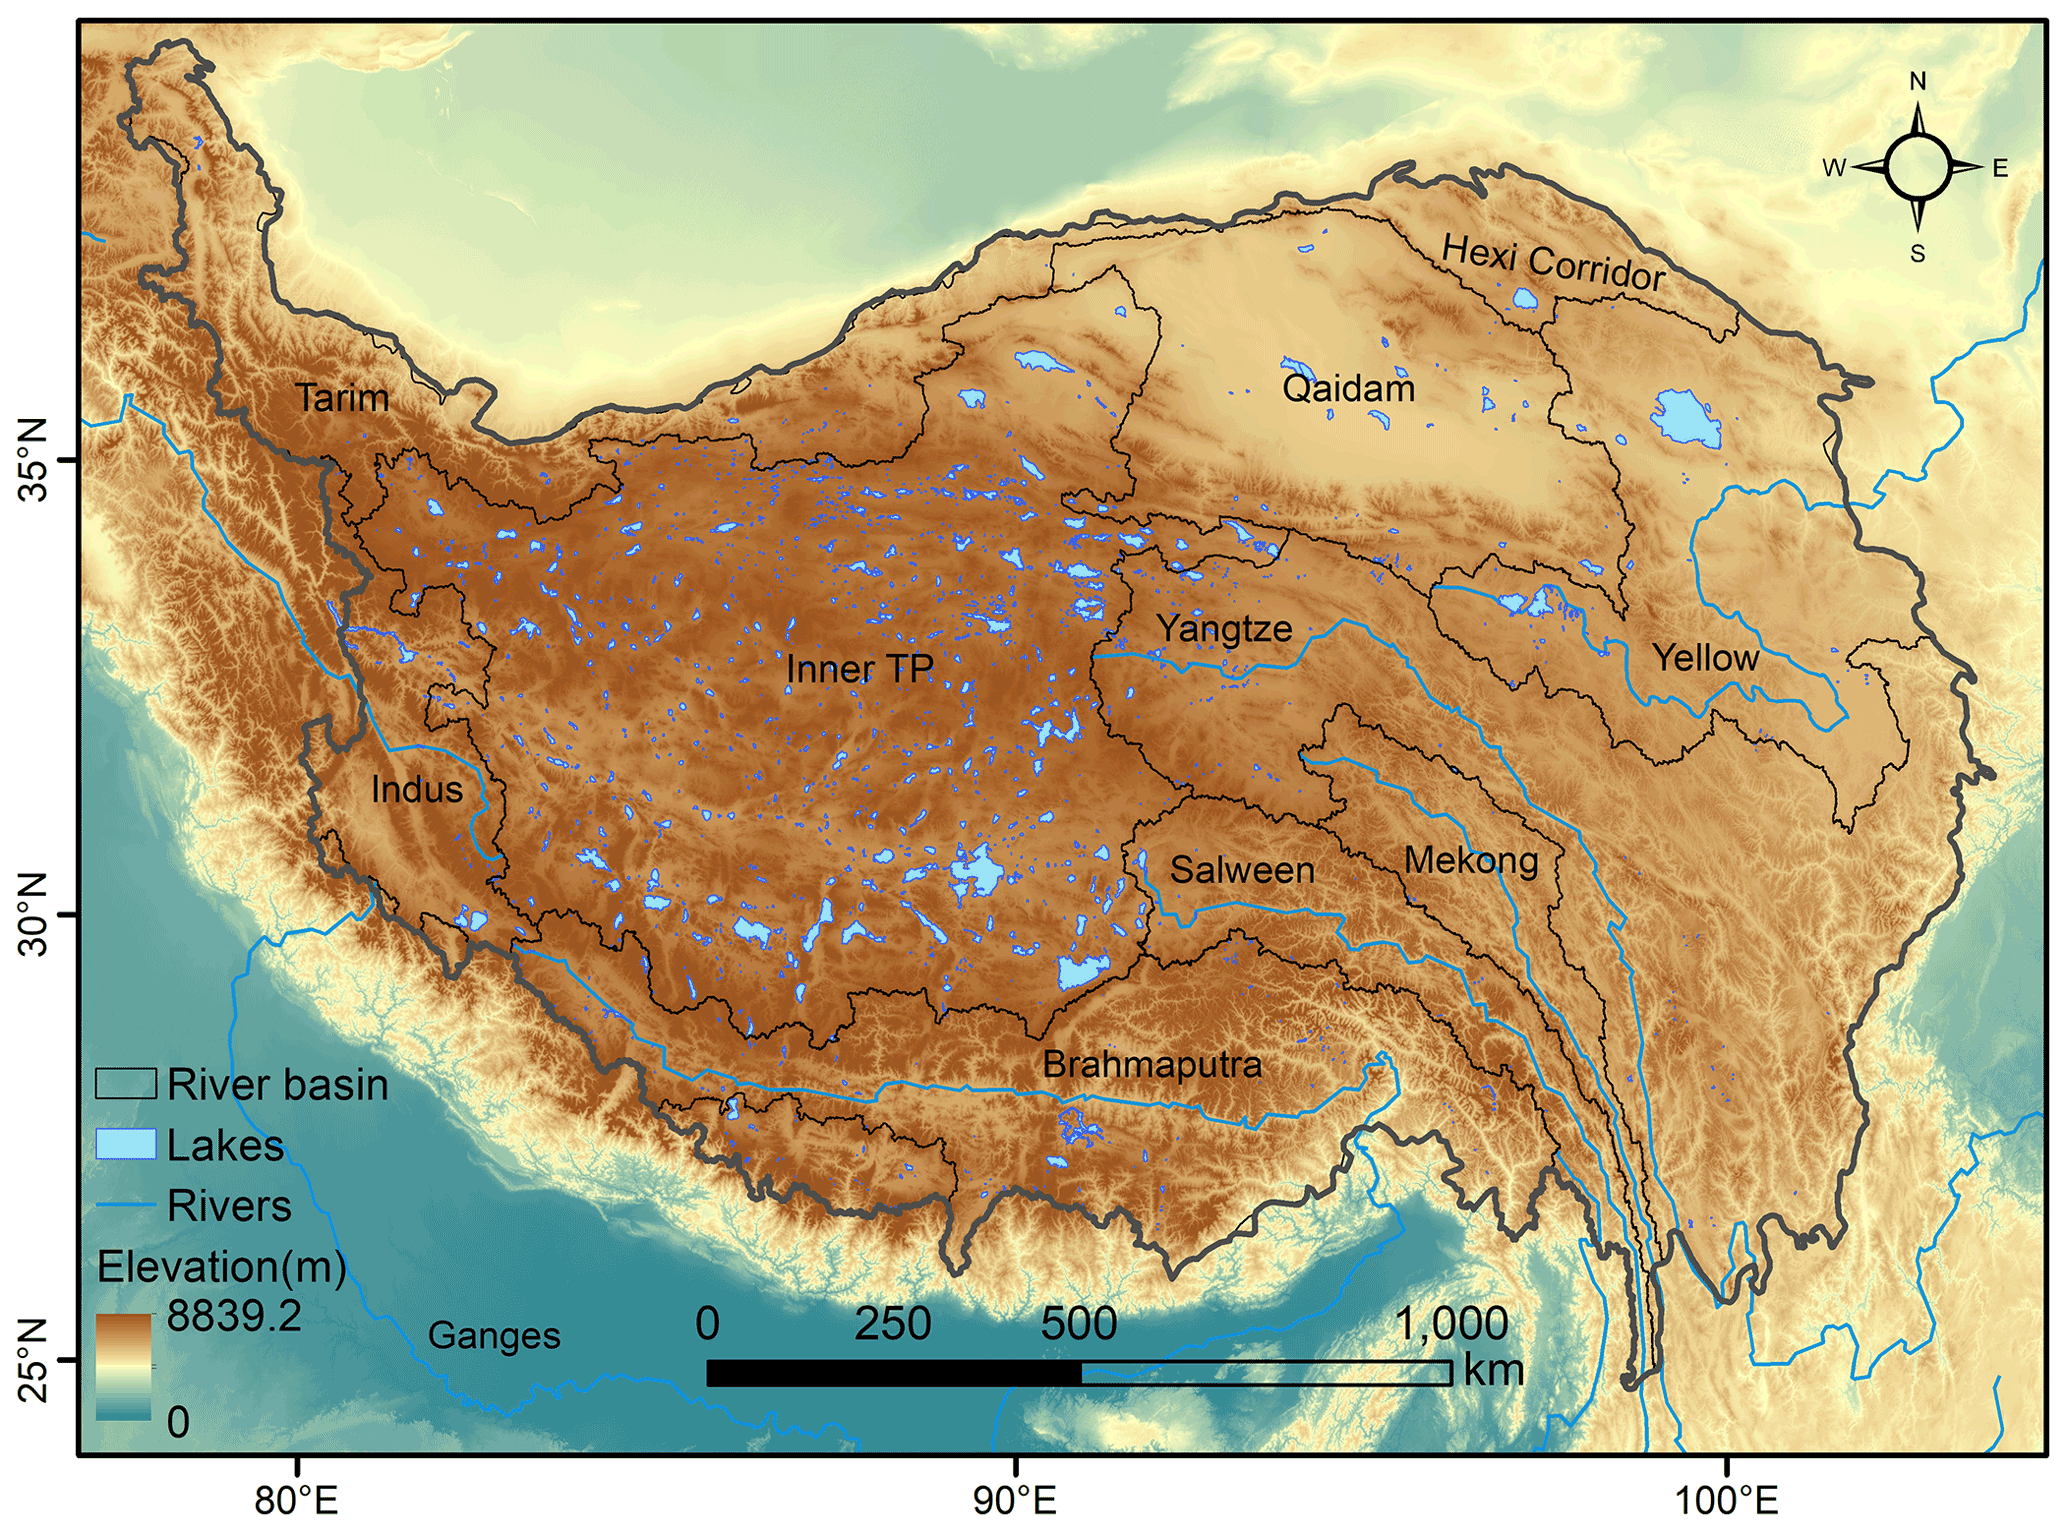
Figure 1The spatial distribution of lakes on the Tibetan Plateau.
Three steps are carried out to construct the LCC-TP dataset (Fig. 2). First, delineate the lake catchments and establish the topological relationships among nested lakes. Meanwhile, collect related attribute datasets and conduct necessary processing such as data format conversion and reprojection. Then perform zonal statistical analysis using catchment extents and datasets of spatial attributes to obtain the catchment-level attributes.
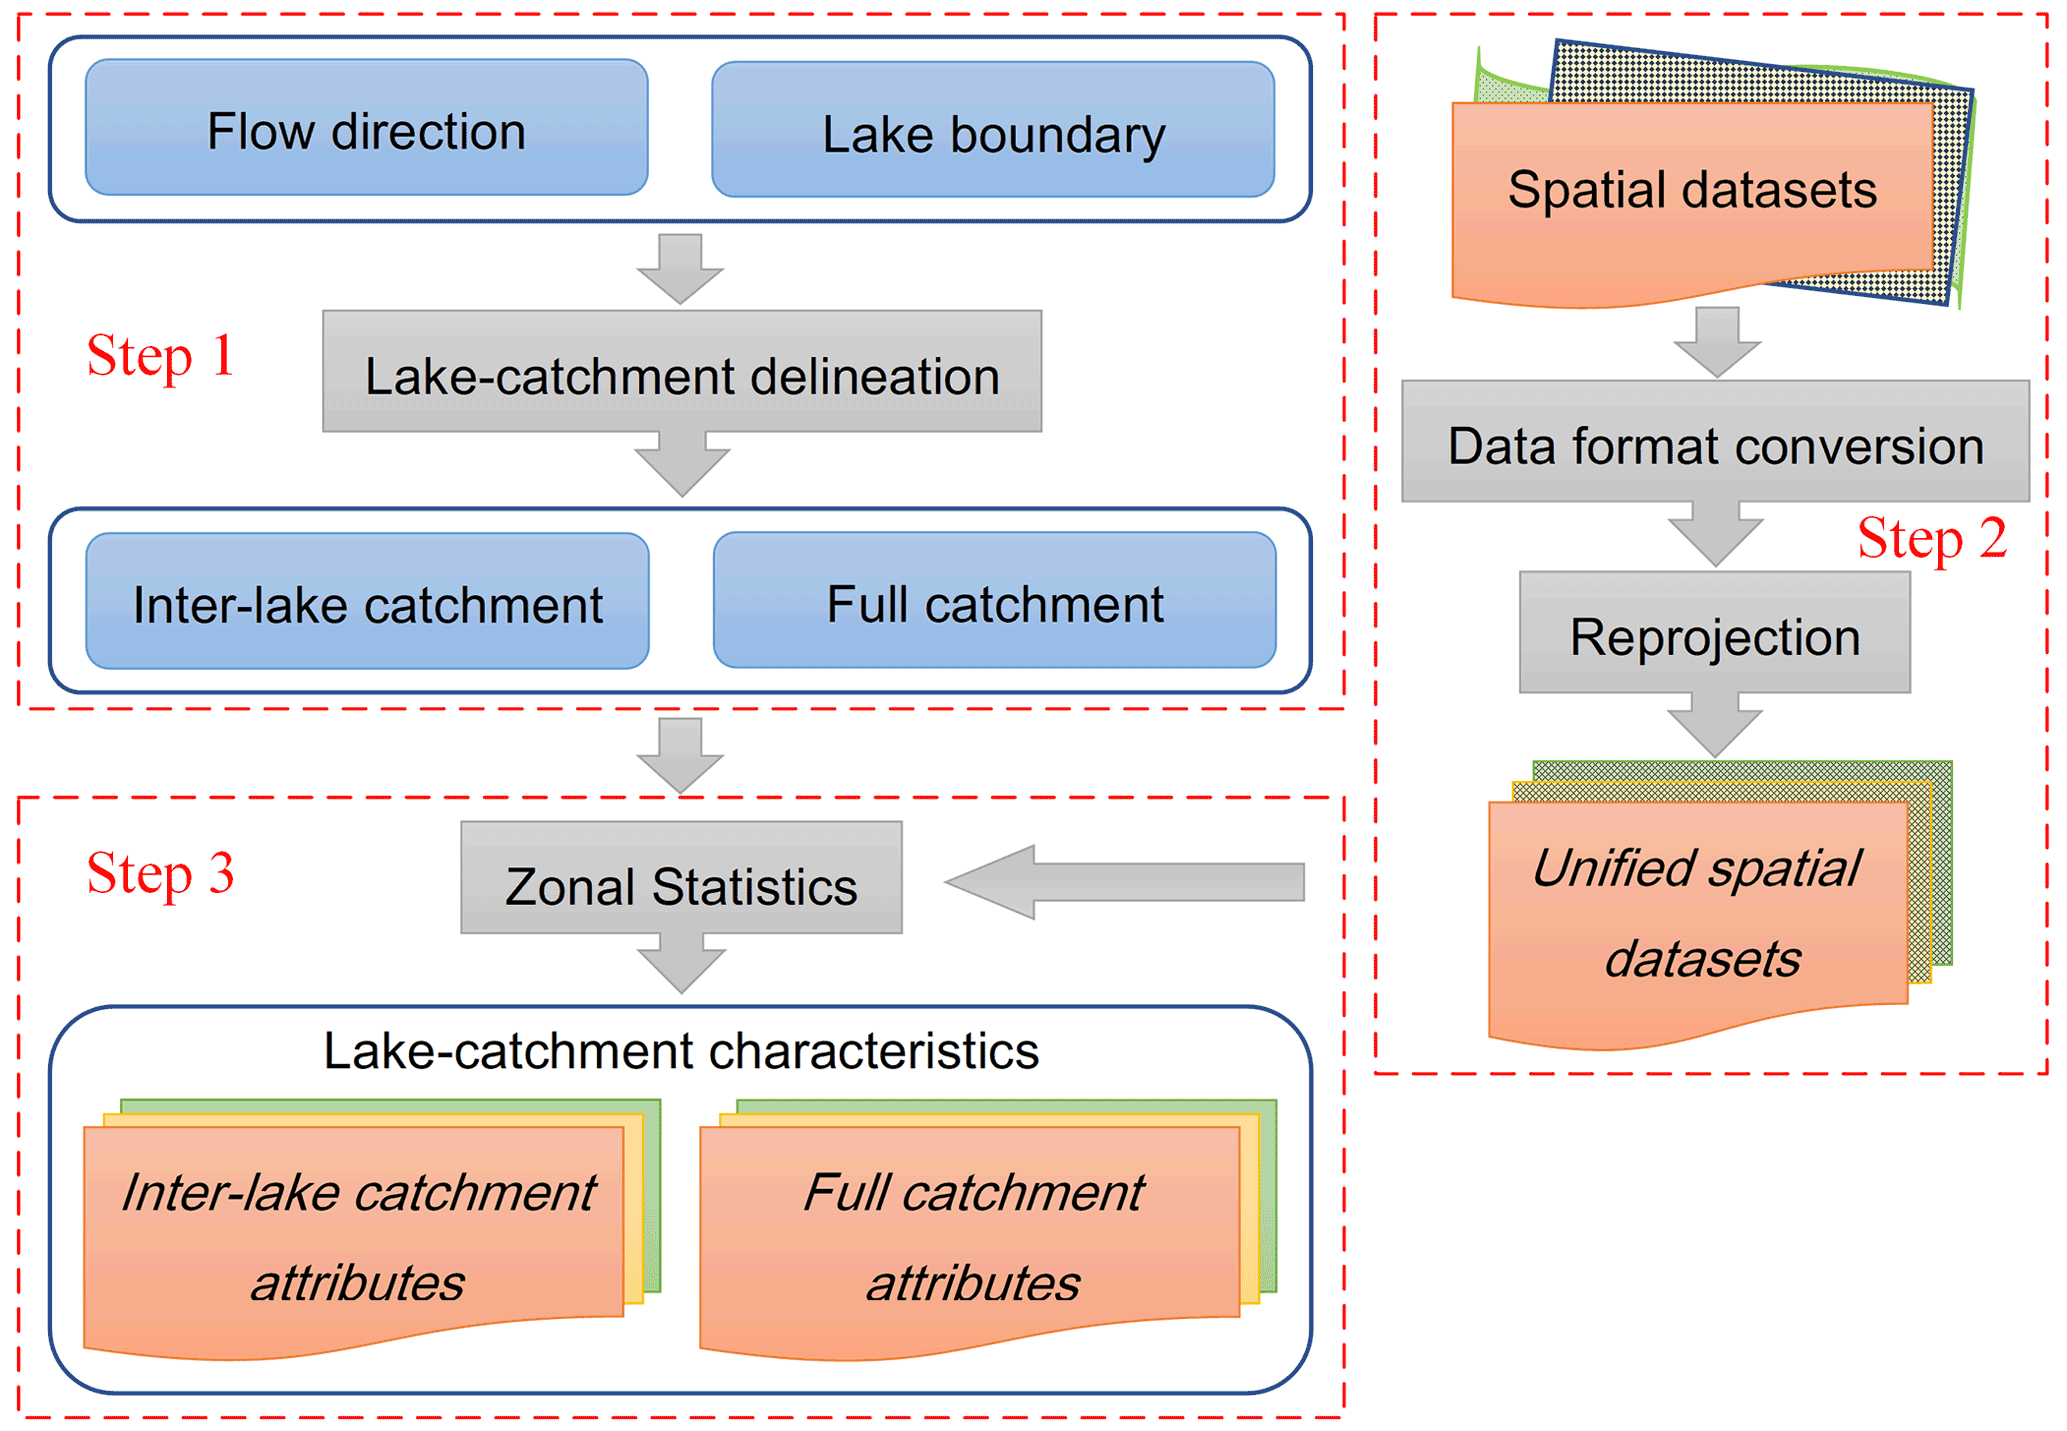
Figure 2Procedures to construct the dataset of lake-catchment characteristics for the TP (LCC-TP).
3.1 Catchment delineation
Considering that large lakes are likely to block the transport of materials from upstream to downstream, two types of catchments – full catchments and inter-lake catchments – are defined in this study. The full catchment refers to the full upstream-contributing area of each lake, while the inter-lake catchment is obtained by excluding the contributing areas of upstream lakes larger than 0.2 km2 from the full catchment following the definition by Soranno et al. (2017). For example, the green area in Fig. 3 is the full watershed of lake No. 1, and the stippled black area is its inter-lake catchment.
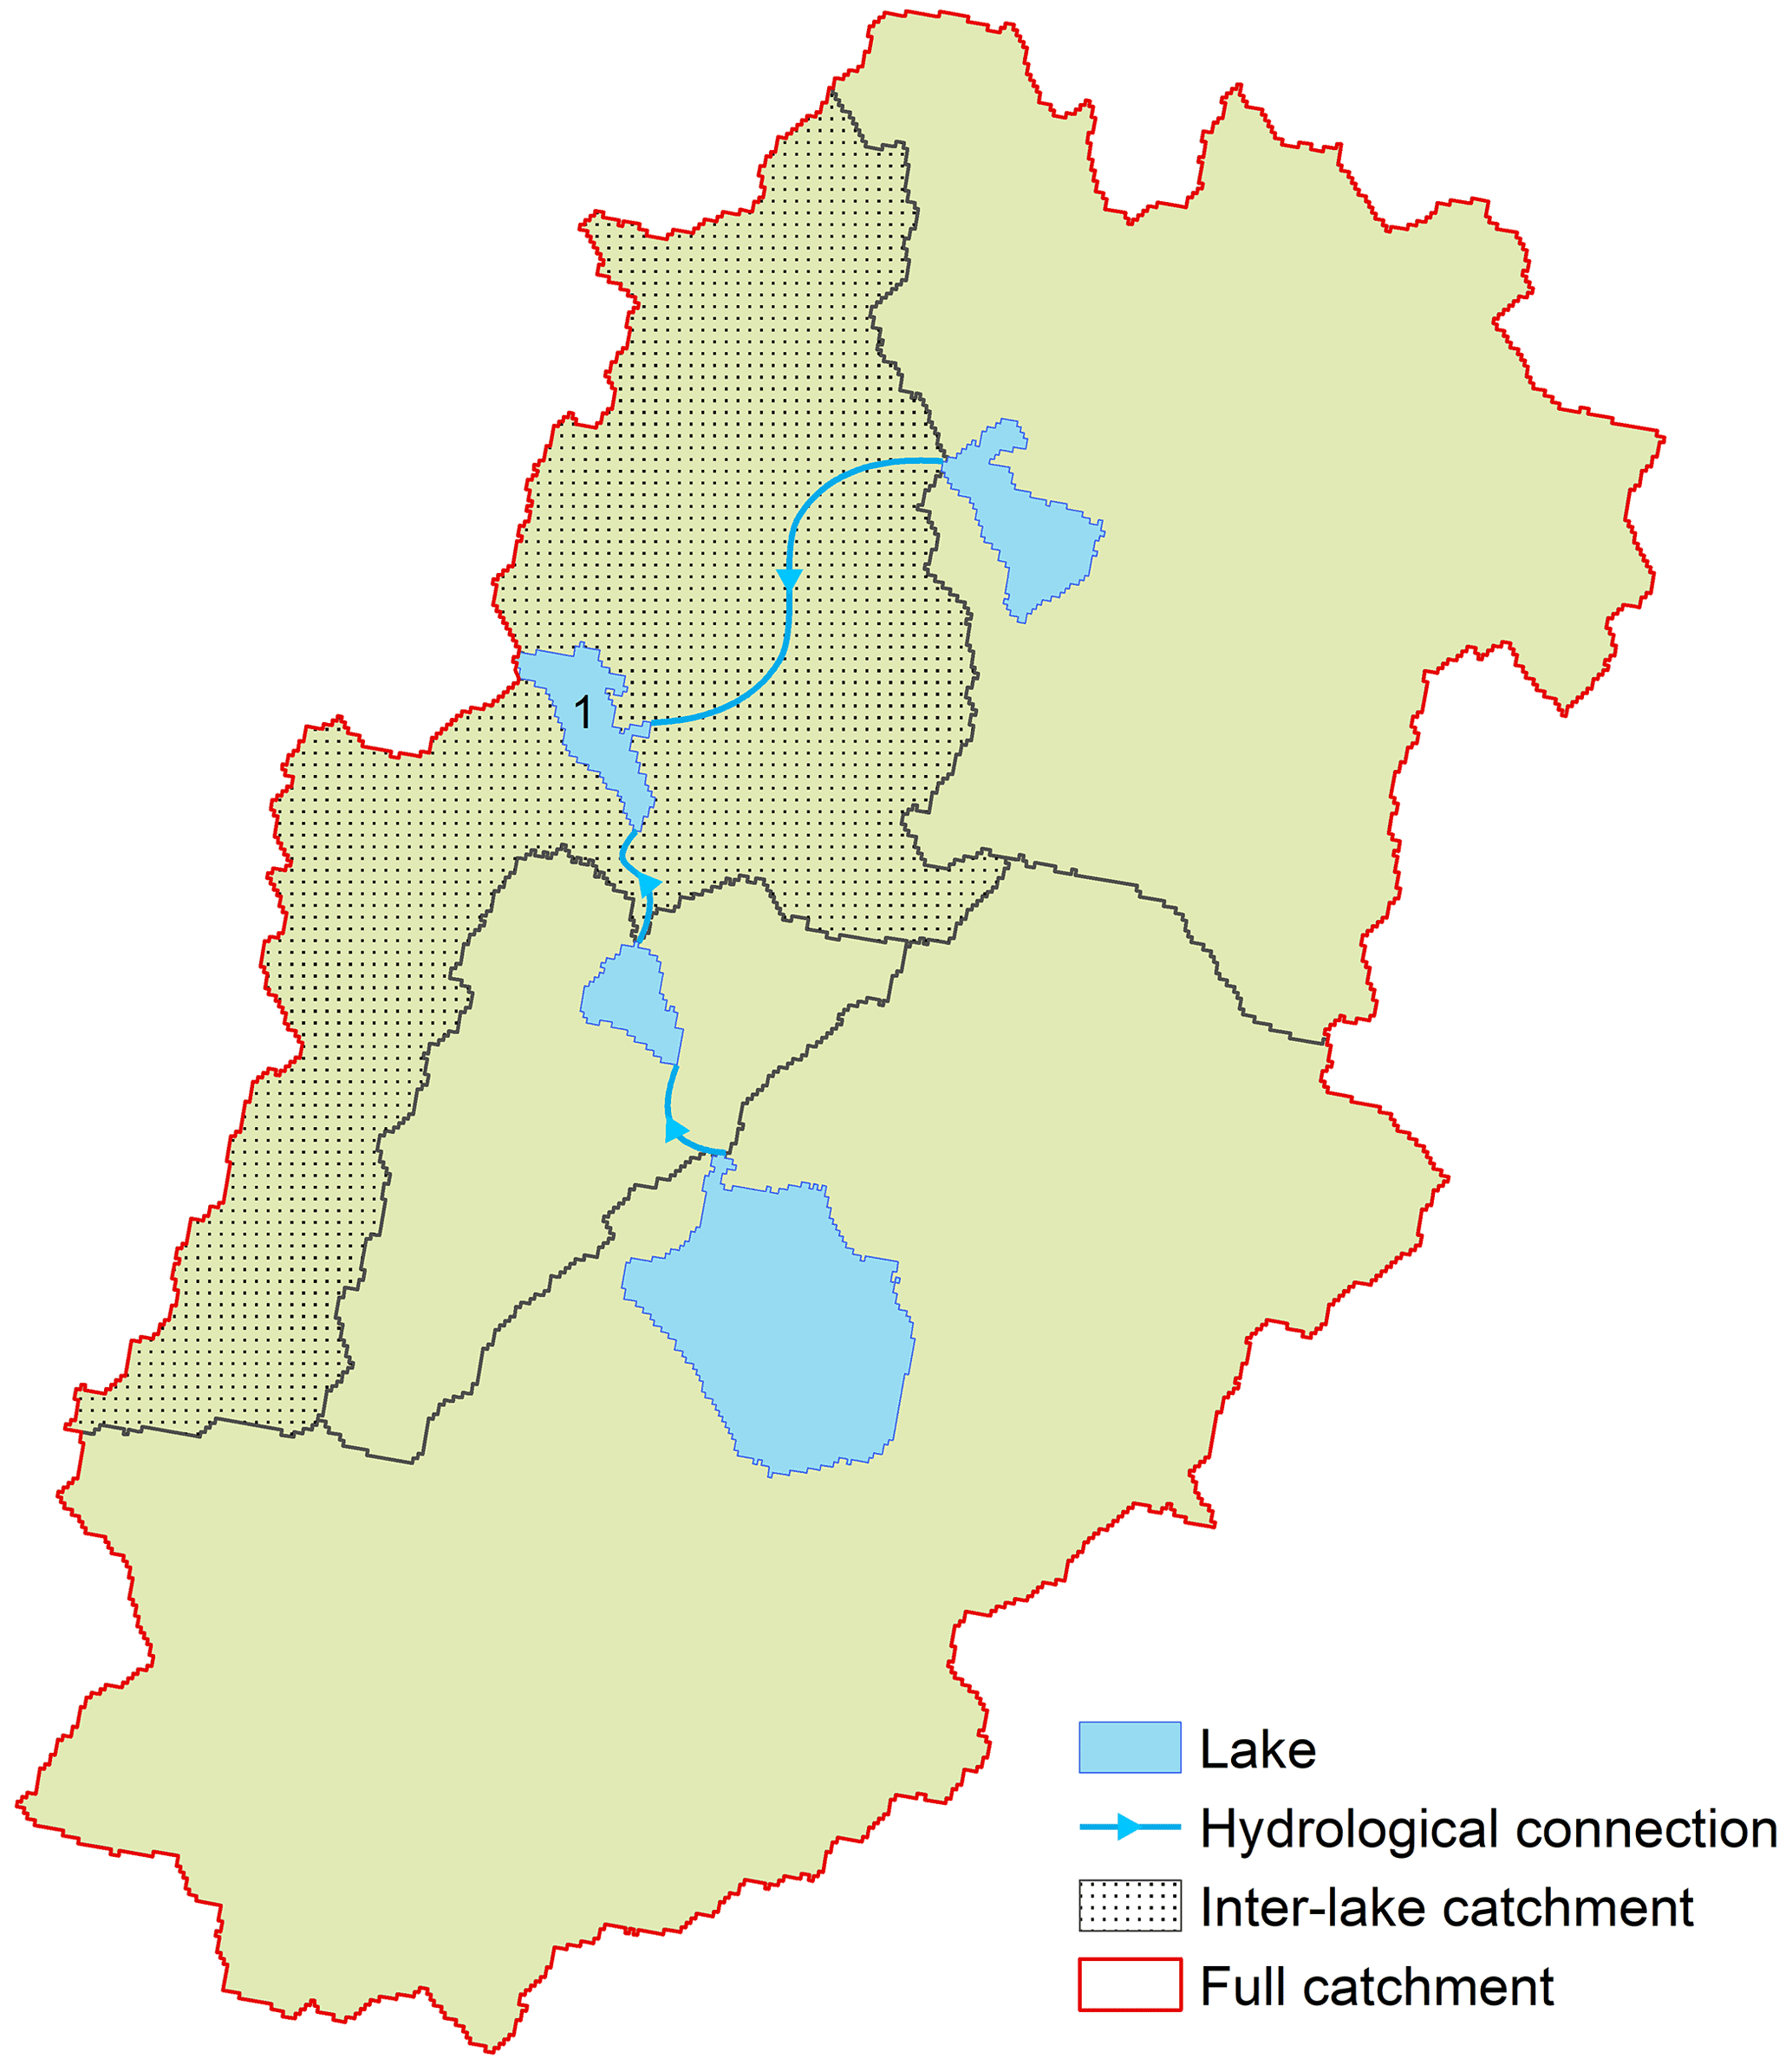
Figure 3Illustration of the inter-lake catchment (stippled black area) and full catchment (green area).
Traditional river-oriented catchment delineation methods are not suitable for the delineation of lake catchments. Liu et al. (2020) proposed a lake-oriented approach to delineating endorheic catchments, which can be used to delineate the full catchments of endorheic lakes in this study. But there are more tasks in this study, including the delineation of both full catchments and inter-lake catchments for endorheic lakes and upstream lakes, the construction of topological relationships among lakes/lake-catchments, and the tracing of flow paths among upstream and stream lakes. Therefore, we developed a software using the C and Python programming language to implement these tasks; the source code is open (https://github.com/LoserOne-ovo/basin_delineation, last access: 18 August 2022).
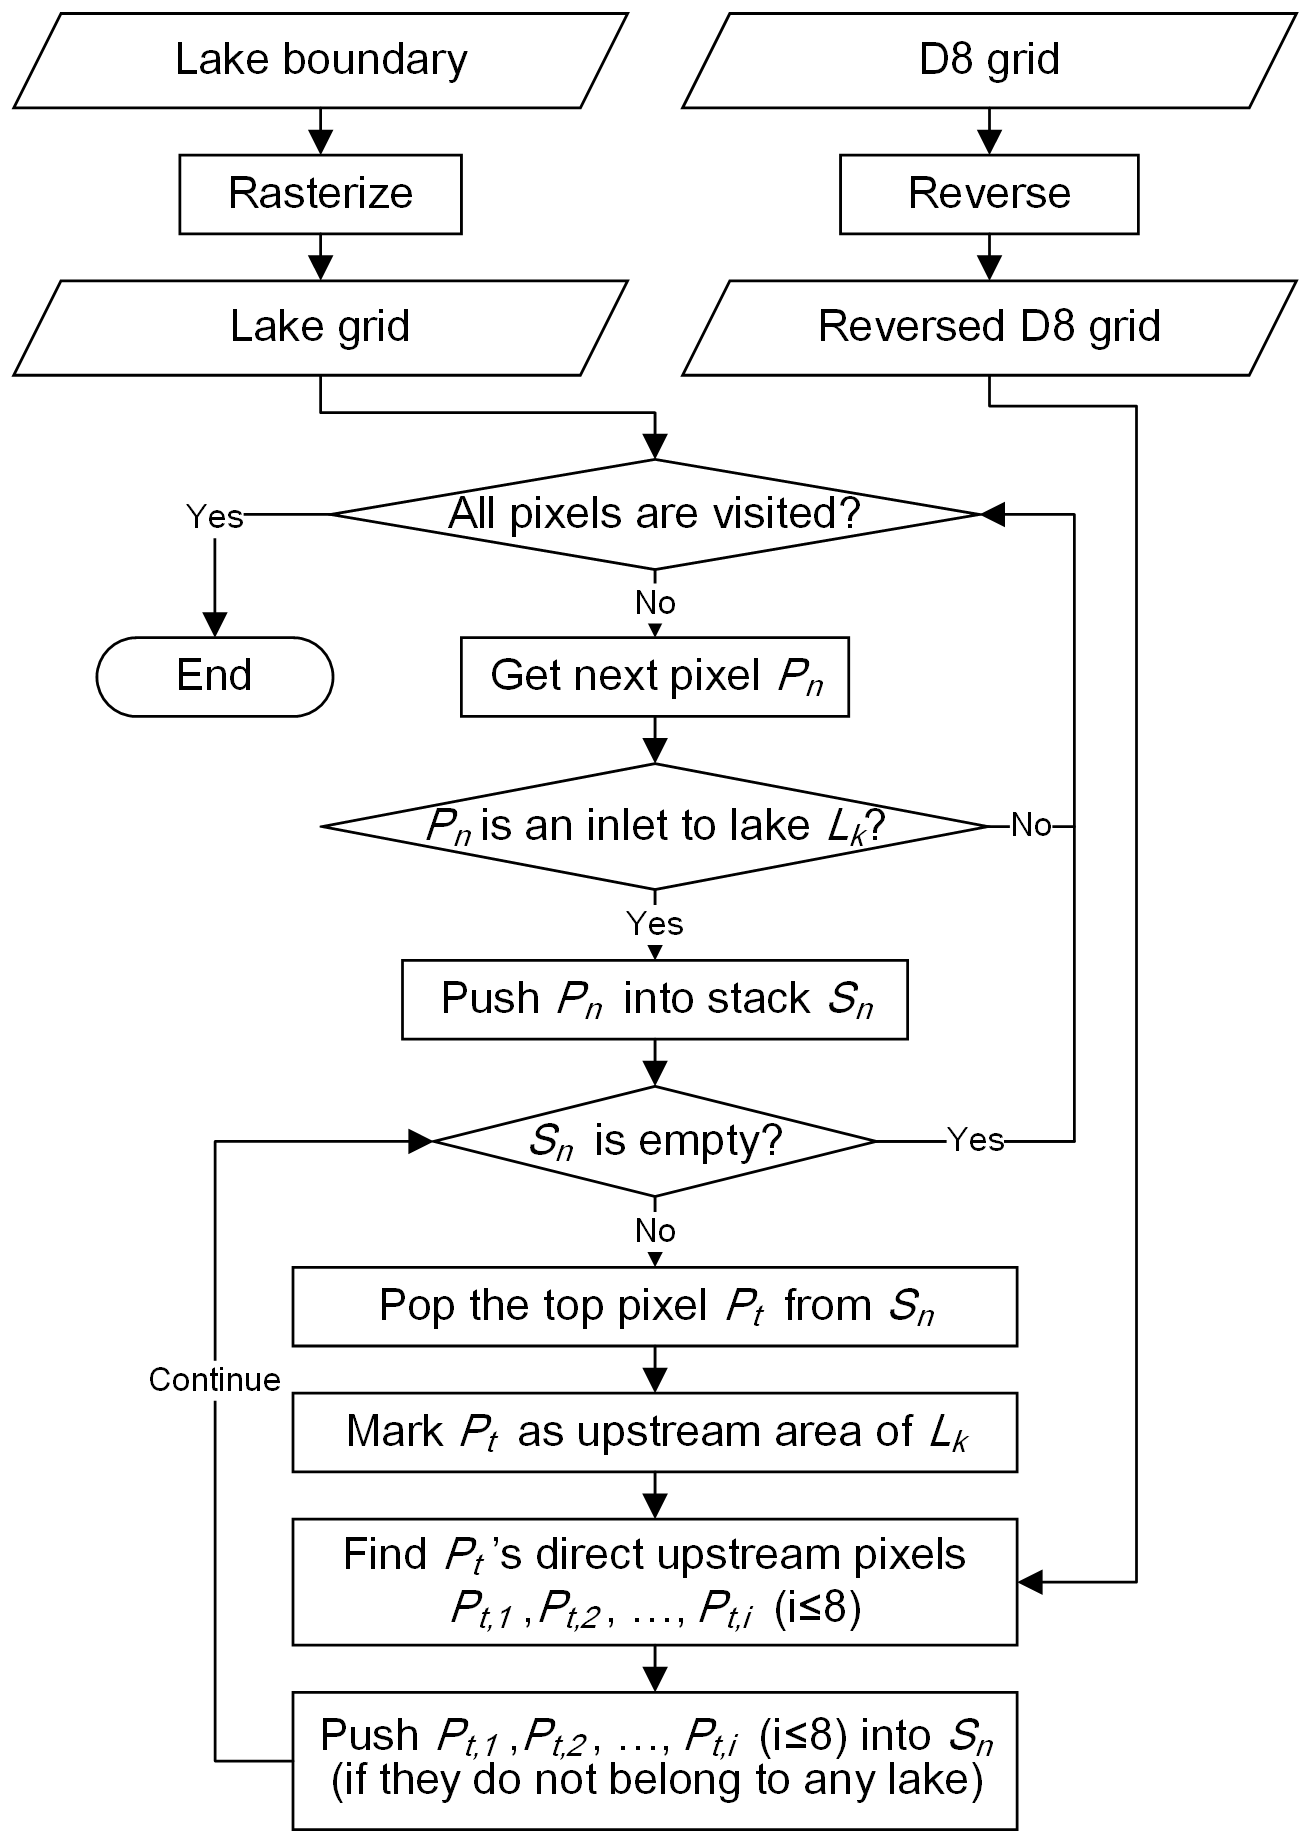
Flow direction and lake boundary data are needed for catchment delineation. Firstly, the vector lake data are rasterized using the same geospatial reference system and pixel size as the flow direction data (Yamazaki et al., 2019). Concurrently, the reverse-flow-direction data are calculated (recorded as 8 bits corresponding to 8 neighbors, e.g., 10000001 means the first and eighth neighbors flow into the current pixel) to assist the tracing of upstream contributing areas. Next, this is iterated over all the pixels to find the inlets to the lake, which are defined as the pixels flowing directly into a lake according to the flow direction. Then the inlet pixels are put into a stack. This is repeated by taking a pixel out and pushing its direct upstream pixels in until the stack is empty. Finally, we get the full upstream contributing area (i.e., full catchment) of the lake. Following the same procedures but adding a termination criterion that if a tracing branch meets an upstream lake pixel then return, the inter-lake catchments can be obtained.
In this study, flow direction data from the MERIT Hydro dataset (Yamazaki et al., 2019) were used, which have a resolution of 3 arcsec (∼ 90 m at the Equator). This dataset was verified to have high accuracy in terms of flow accumulation area and river basin shape. The lake boundaries in 2018 were used in the delineation of catchments, and the dataset from Zhang et al. (2019) (https://doi.org/10.11888/Hydro.tpdc.270303, Zhang, 2019) was adopted. Some additional operations such as merging adjacent lakes and filling holes were employed to remove topology errors.
3.2 Data collection and processing
The lake catchments are characterized through six aspects: lake body, topography, climate, land cover/use, soil and geology, and anthropogenic activities. The following standards were adopted for source dataset selection. Firstly, the corresponding environmental variables should have theoretical impacts on the attributes of lake water or sediment. Secondly, the dataset covers the whole TP and can be publicly available. Finally, the most reputable datasets with high resolution are preferred when multiple data sources are available. Following these standards, the vast majority of selected datasets were well validated and recognized in each field. For example, the SoilGrids dataset (Poggio et al., 2021) is the de facto standard of gridded soil property data, and the China meteorological forcing dataset (CMFD) (Yang and He, 2019) is the most widely used climatic dataset on the TP. The information of source datasets used in the LCC-TP dataset can be found in Table S1 in the Supplement. All the spatial datasets were converted to GDAL/OGR readable formats and projected to the Albers equal-area conic projection. Besides static attributes, the dynamic time series of hydrological and meteorological data are also provided. Version 1.0 of LCC-TP offers 57 different variables with a total of 721 individual attributes. The details of these attributes are described in Sect. 4.
3.3 Zonal statistics
For each lake, zonal statistical analyses are conducted to calculate catchment-level characteristics for inter-lake catchments and full catchments. Different methods are used for raster data and vector data. For raster data, the grid cells within each catchment are picked out and the statistics of their values are calculated. For continuous variables (e.g., elevation and precipitation amount), the average value or maximum/minimum value is calculated. For categorical variables (e.g., land use type), the mode is calculated, and the percentages of each category are also calculated for some variables. The rasterstats Python package (https://github.com/perrygeo/python-rasterstats, last access: 18 August 2022) and the Google Earth Engine cloud platform were adopted for implementation. Vector data, such as the spatial distribution of glaciers stored in the ESRI shapefile format, are first intersected with the catchment extent layer, then the ratio of the intersection's area within each catchment to the catchment's total area is calculated. The spatial distribution of the catchment-scale variables obtained was plotted and visually checked by the authors to ensure the correctness of the dataset. For numerical variables whose original data were in raster format, their ranges at the grid-cell scale (i.e., before zonal statistics) and the catchment scale (i.e., after zonal statistics) were calculated (Table S2), and we checked that the range at the catchment scale fell within that at the grid-cell scale for each variable.
4.1 Validation of the delineated catchments
The catchment delineation in this study was based on the flow-direction data from Yamazaki et al. (2019), which have been widely verified. To further validate the accuracy of the delineated catchments, the dataset from Liu et al. (2020) was used as a reference, which contains the boundaries of 421 lake catchments on the Inner TP. Figure 5 shows that the catchment areas in this study have a high correlation (r=0.988) with those of Liu et al. (2020), which proves the correctness of our results. The small differences between these two datasets may be related to the errors in the DEM and the different methods for depression filling and flow direction correction.
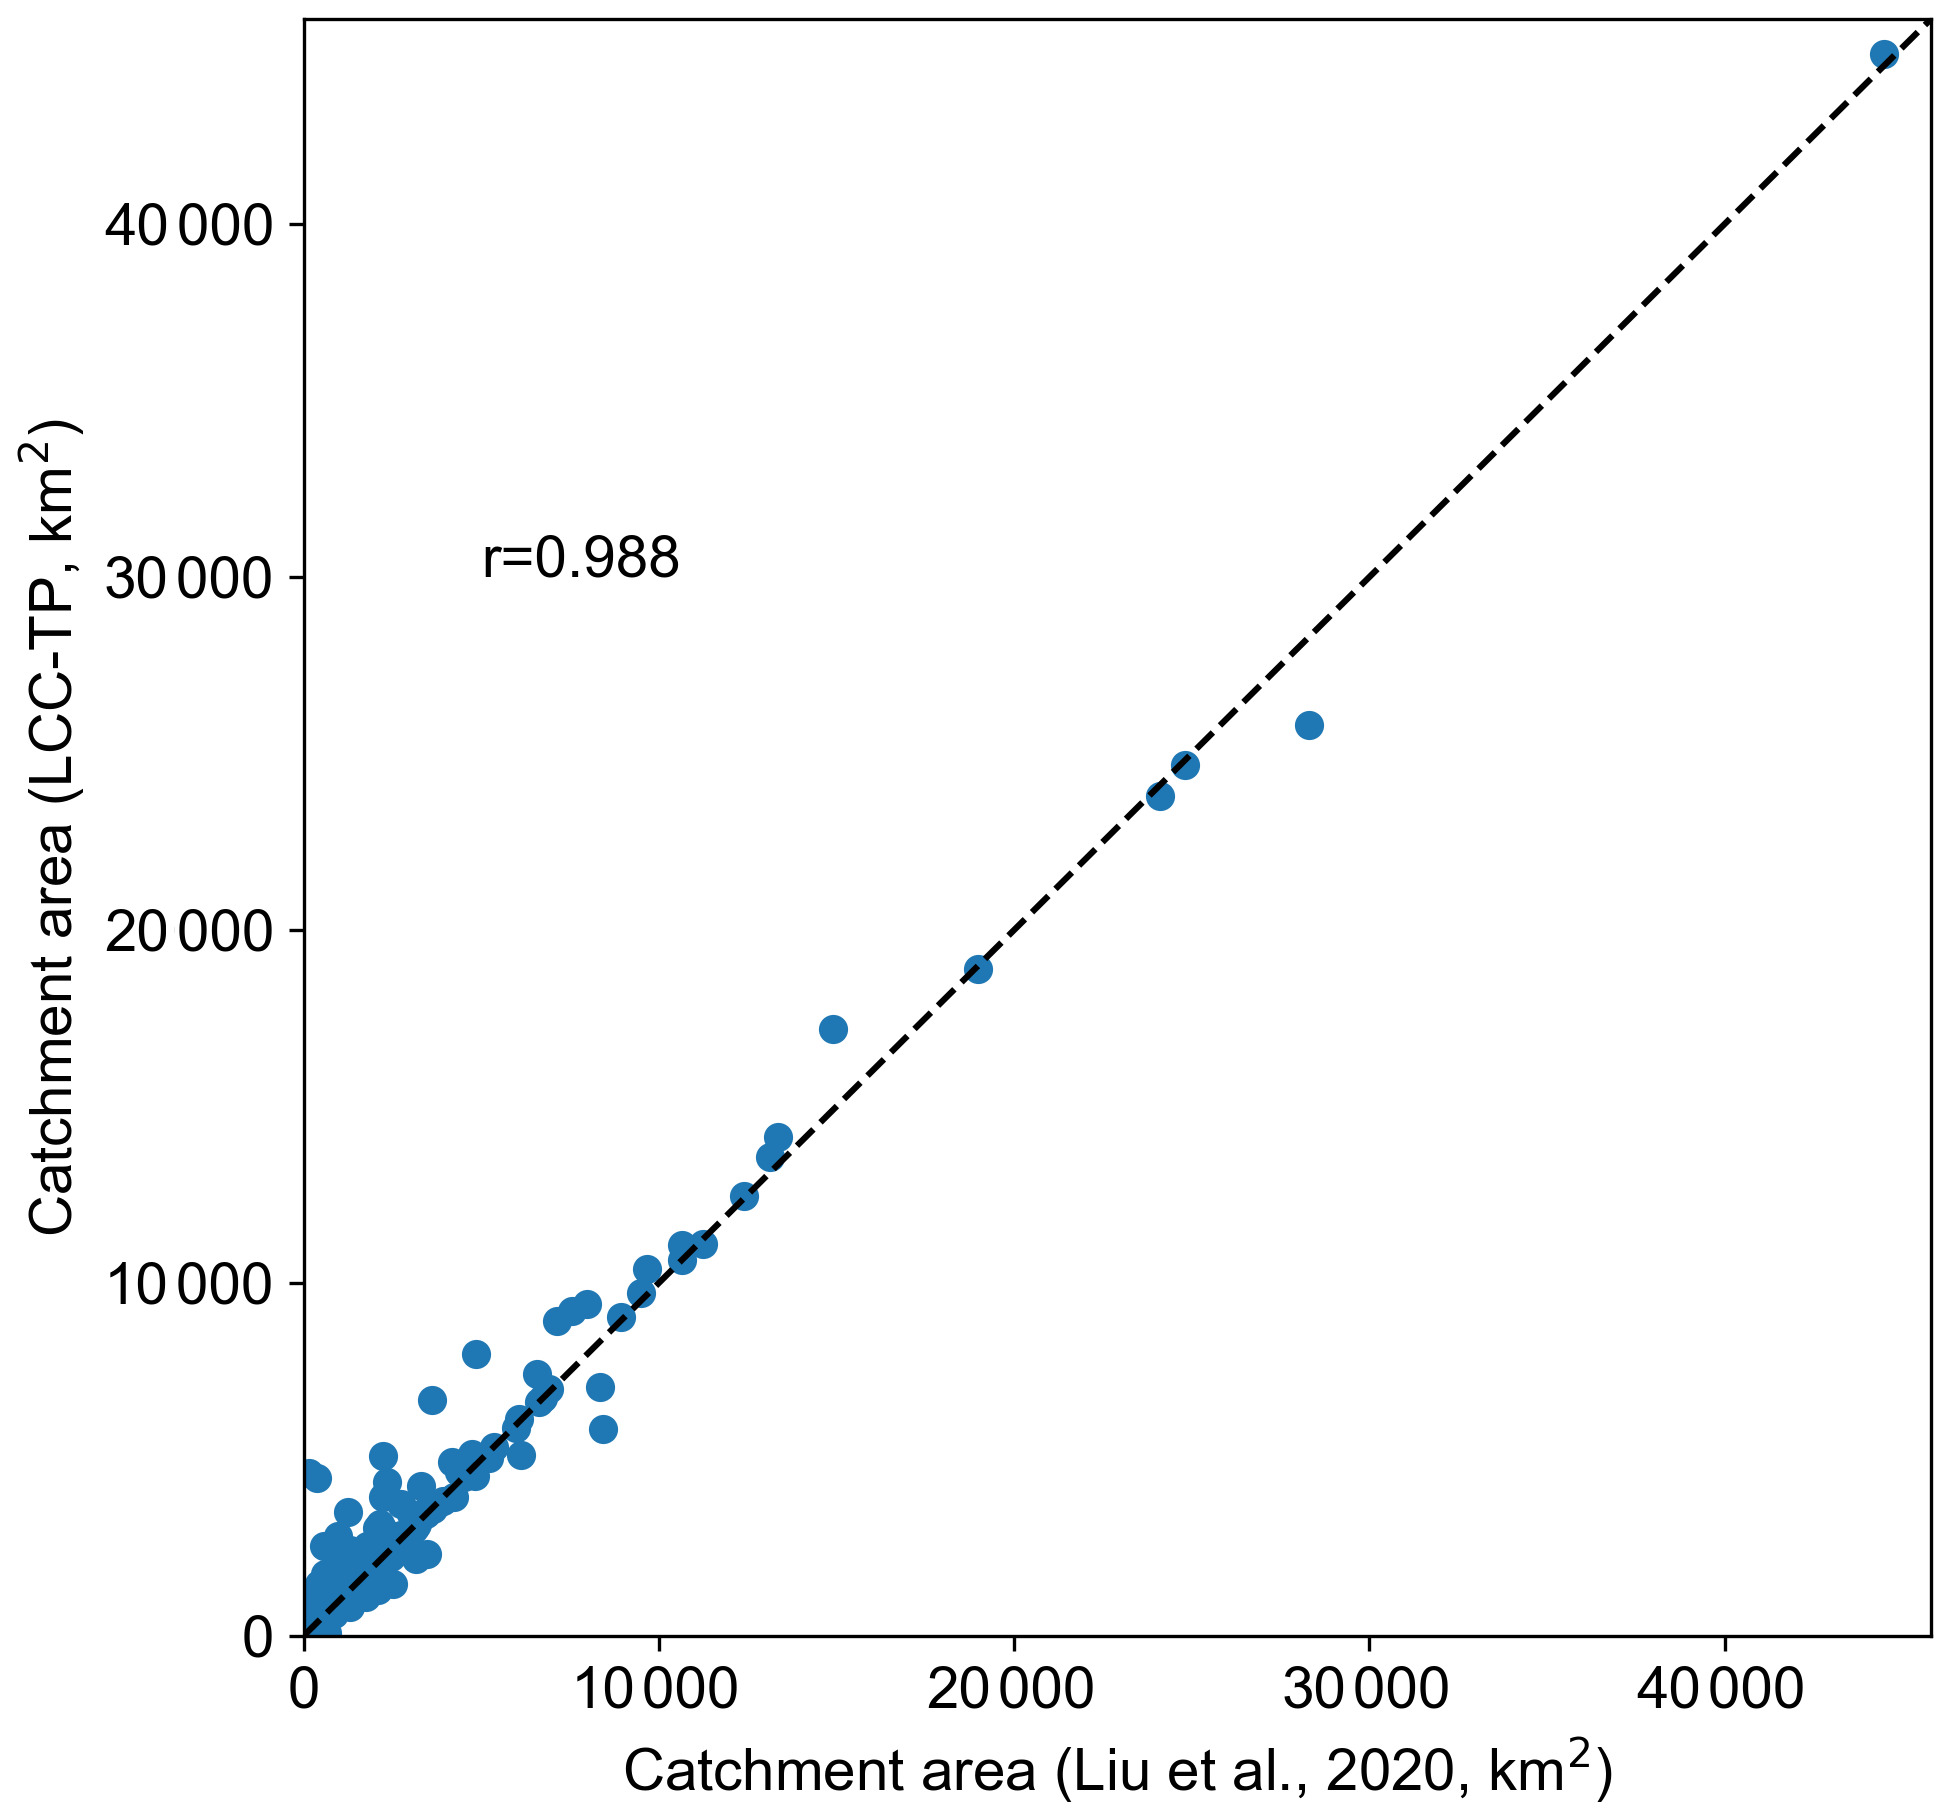
Figure 5Comparison of the areas of delineated catchments in this study with those of Liu et al. (2020).
4.2 Lake body characteristics
The area, perimeter, lake development index, and type of lake were calculated. The lake development index was used to characterize the complexity of the lake shoreline, which was defined in formula (1), where L represents the length of the lake shoreline and s represents lake area, i.e., the ratio of the shoreline length to the circumference of a circle with the same area as the lake. The value increases with increasing shoreline complexity, and the maximum value is 1 while the shape is a circle:
The type of lake herein refers to whether it is an upstream lake (i.e., a lake with outflow to a downstream river or lake) or a terminal lake (i.e., a lake without outflows).
The smallest lake has an area of 0.2 km2 and the largest lake (i.e., Qinghai Lake) has an area of 4503.5 km2. Overall, 72 % of the 1525 lakes have an area less than 10 km2. Figure 6 shows the spatial distribution of the lake development index and type on the TP. The average development index for lakes across the TP is 3.40, and there is a cluster of lakes with high development indices in the north of the Inner TP. Out of 1525 lakes, 364 (24 %) are terminal lakes, most of which are located in the Inner TP and the Qaidam Basin.
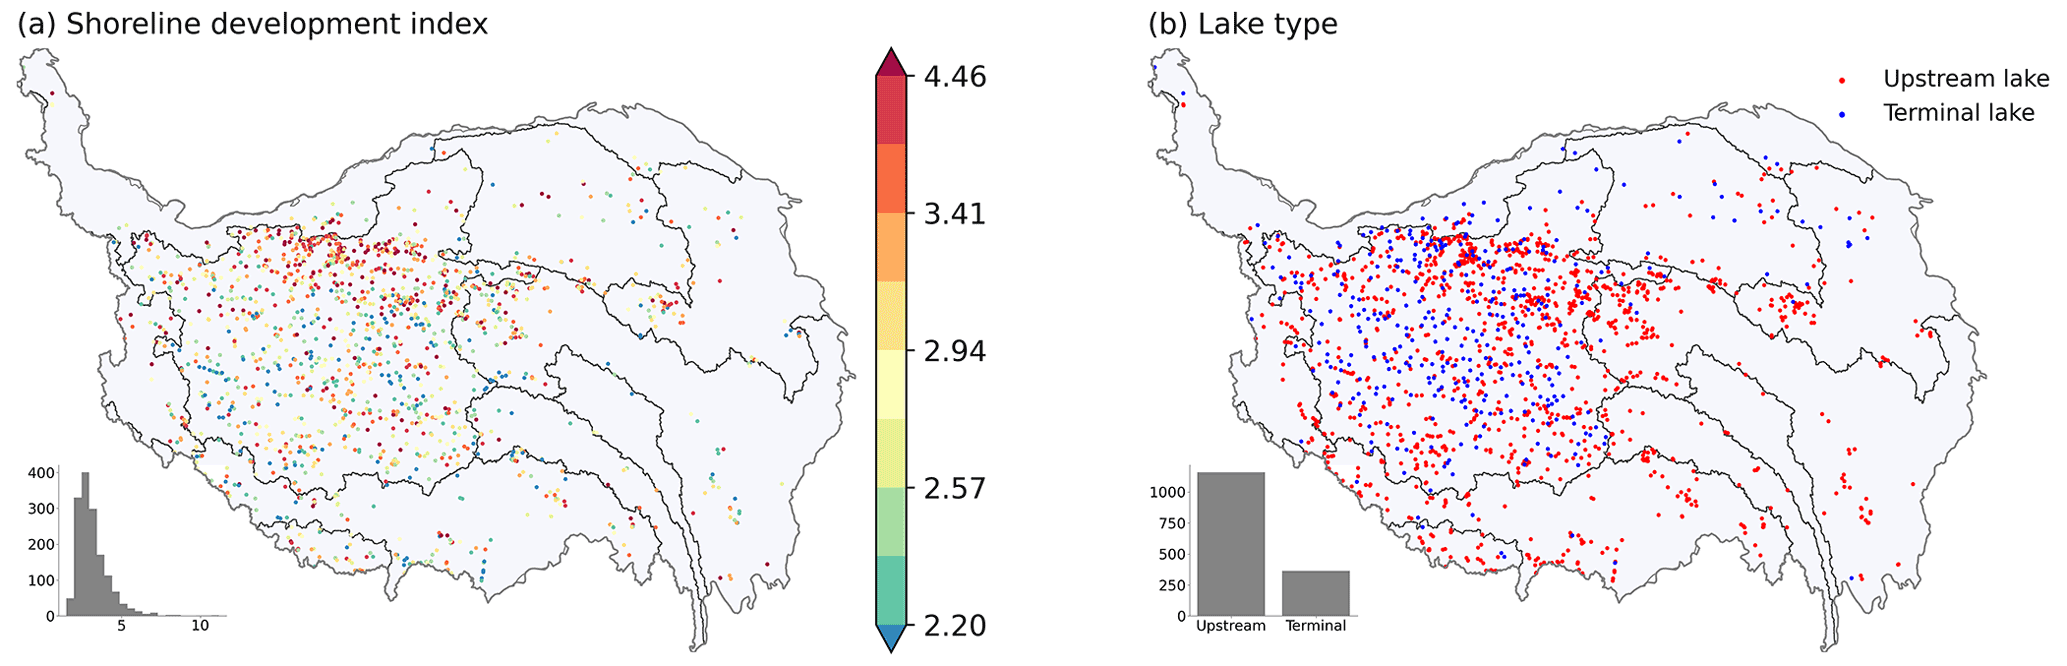
Figure 6Spatial distribution of shoreline development index (a) and type (b) on the TP.
4.3 Topographic characteristics
The catchment-level elevation (including average, maximum, and minimum value), relief, slope, catchment area, and lake-catchment area ratio were calculated based on the MERIT DEM (Yamazaki et al., 2017). These characteristics were calculated for both the full and inter-lake catchments. The slope values were calculated using ArcGIS 10.5. The relief values, defined as the difference between the maximum and minimum elevations in a neighborhood, were calculated using window sizes of 5×5, 11×11, 21×21, 31×31, 41×41, and 51×51 based on a DEM of 0.00833∘ resolution. The usage of different window sizes in the calculation of the relief value aims to meet the needs of different analysis scenarios: for the research focusing on small-scale terrain variation, a small window size is appropriate; when the focus is large-scale terrain variation, a larger window size is preferred. Figure 7 shows the spatial distribution of mean elevation, relief, slope (%), and lake-catchment area ratio for inter-lake catchments on the TP. The mean elevation is relatively low in the eastern TP and the valley between the Kunlun and Gangdise mountains in the south of the Inner TP. The relief and slope are relatively low in the north of the Inner TP, where the elevation is very high. The lake-catchment area ratio is high in the south and east parts of the Inner TP and the upper Yellow River basin.
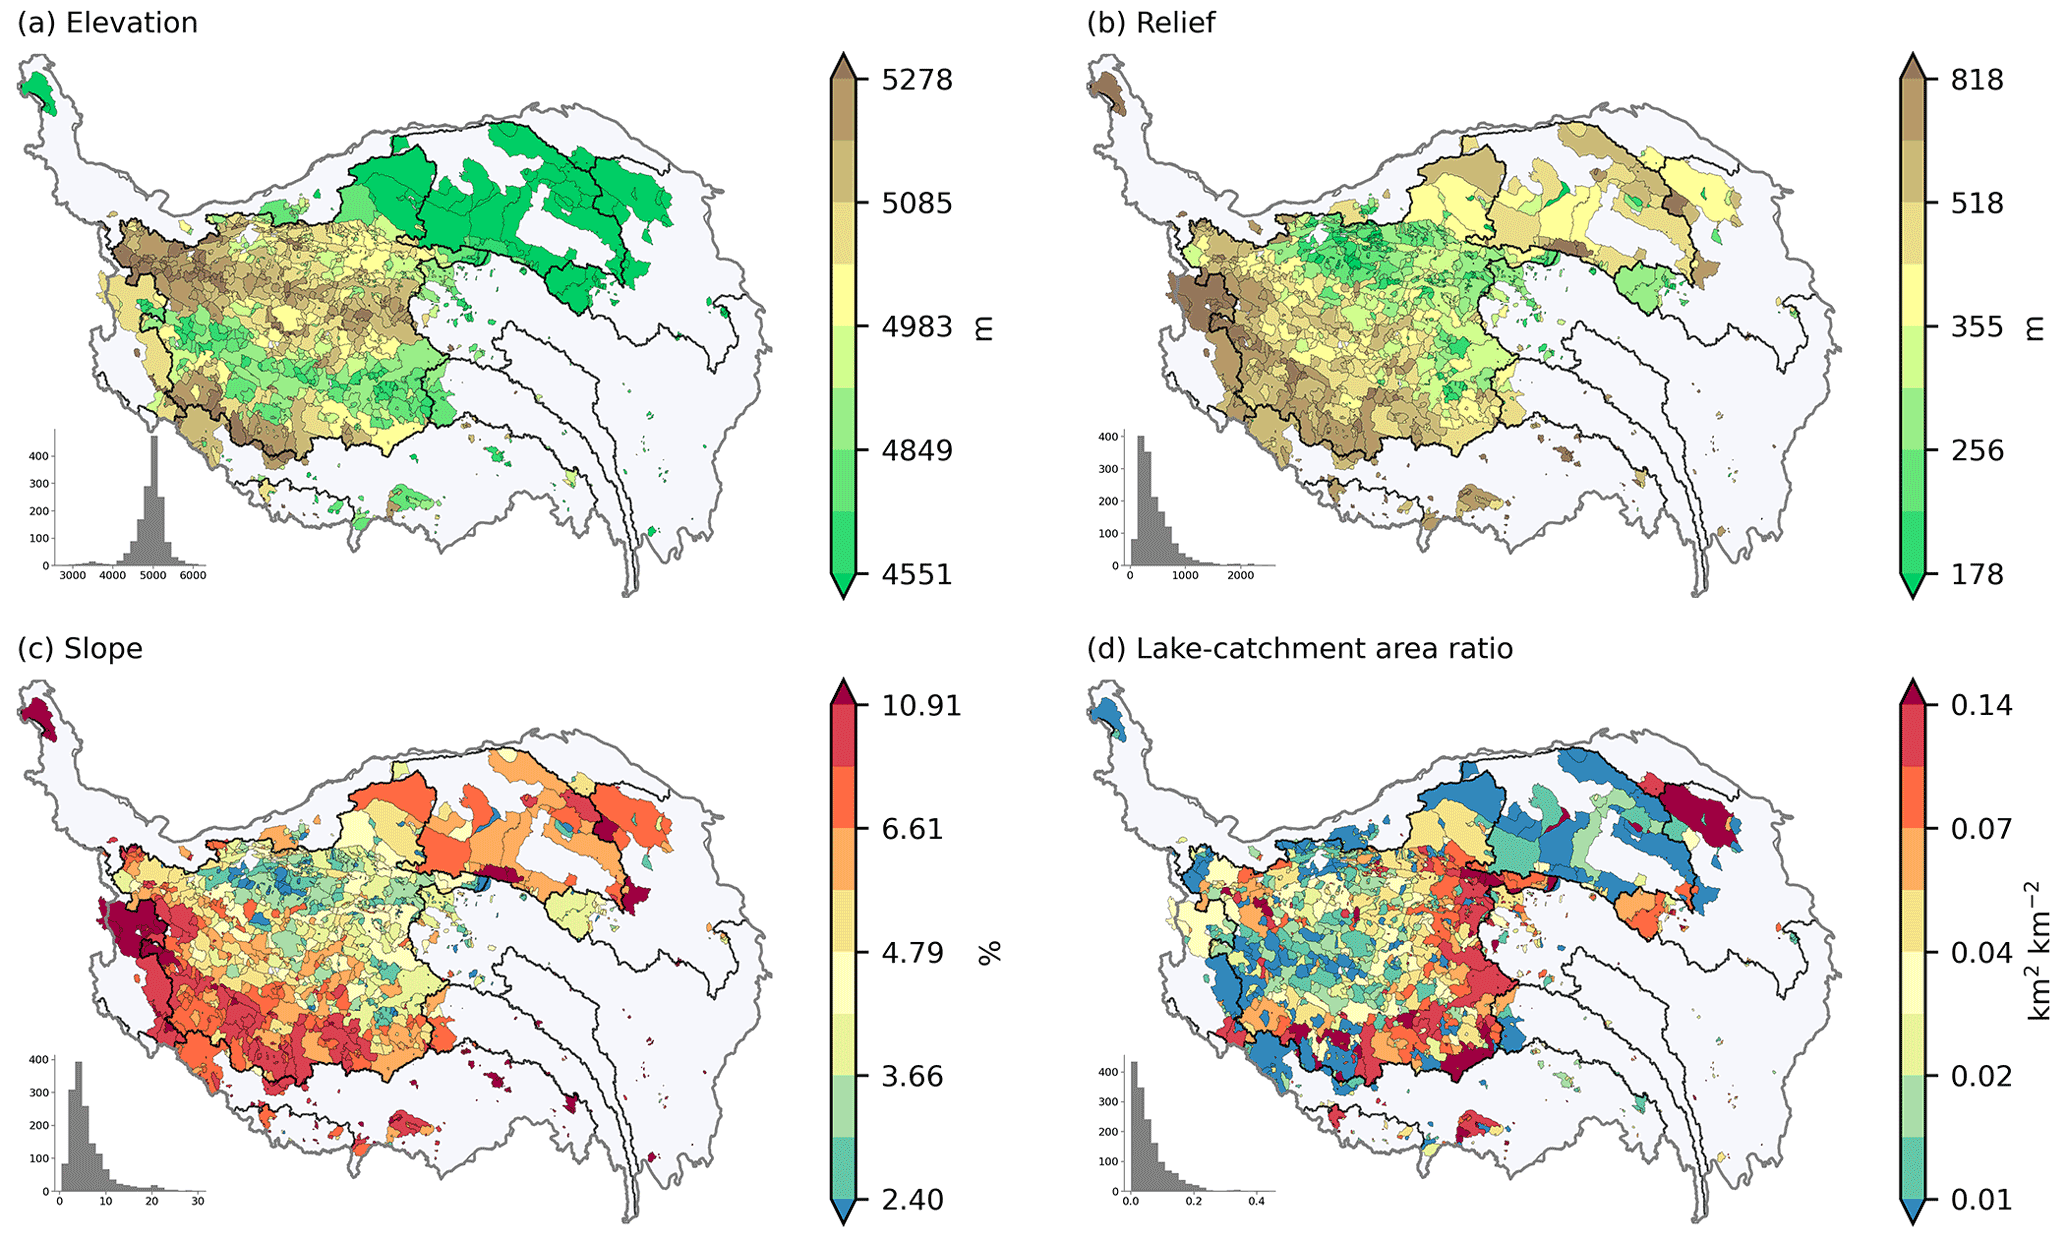
Figure 7Spatial distribution of mean elevation (a), relief (b), slope (%) (c), and lake-catchment area ratio (d) for inter-lake catchments on the TP. The relief was calculated using a window size of 11 × 11 based on a DEM of 0.00833∘ resolution.
4.4 Climatic characteristics
A total of 11 climatic variables were included in the constructed dataset, including 2 m air temperature, surface pressure, and specific humidity, 10 m wind speed, downward shortwave radiation, downward longwave radiation, precipitation amount, potential evapotranspiration (PET), actual evapotranspiration (AET), climate moisture index (CMI), and aridity index. The multi-year average values of all the variables were calculated at three levels (i.e., the lake body, inter-lake catchment, and full catchment level), and the monthly and growing-season (May–September) average values of all the variables except the aridity index were also calculated.
The grid-based CMFD dataset (Yang and He, 2019), ranging from 1979 to 2018, was used to calculate the catchment-level climatic characteristics. CMFD was constructed through the fusion of in situ observations from weather stations, remote-sensing products, and reanalysis datasets, which improved the data quality in western China where weather stations are sparse. It has a spatial resolution of 0.1∘ and a temporal resolution of 3 h. The background field data of air temperature came from GLDAS NOAH10SUBP 3H V001 and the precipitation data were the combination of GLDAS NOAH10SUBP 3H V001, GLDAS NOAH025 3H V2.1, and TRMM 3B42 V7.
PET was derived from the Global Potential Evapotranspiration (Global-PET) dataset (Zomer et al., 2008). In this dataset, monthly PET was estimated via the Hargreaves (1994) equation at a spatial resolution of 30 arcsec using precipitation and temperature inputs obtained from the WorldClim dataset (Hijmans et al., 2005). The aridity index was derived from the Global-Aridity dataset (Zomer et al., 2008), which quantifies precipitation availability over atmospheric water demand and was calculated as the ratio of long-term mean precipitation and PET. CMI was another metric to characterize the degree of humidity, which is defined via the following function: [ when P<PET] or [ when P≥PET] (Willmott and Feddema, 1992).
Figure 8 shows the spatial distribution of multi-year average climatic characteristics for inter-lake catchments on the TP. The air temperature and pressure are low in the north of the Inner TP where elevation is high. Radiation is high in the southwest of the TP and low in the north part. Wind speed is high in the east and southwest of the Inner TP. Precipitation and evapotranspiration have a decreasing trend from southeast to northwest, and accordingly it gets drier from southeast to the northwest as shown by the spatial distribution of air specific humidity, climate moisture index, and aridity index. It should be noted that aridity indices are higher under more humid conditions and lower under more arid conditions according to its formula.
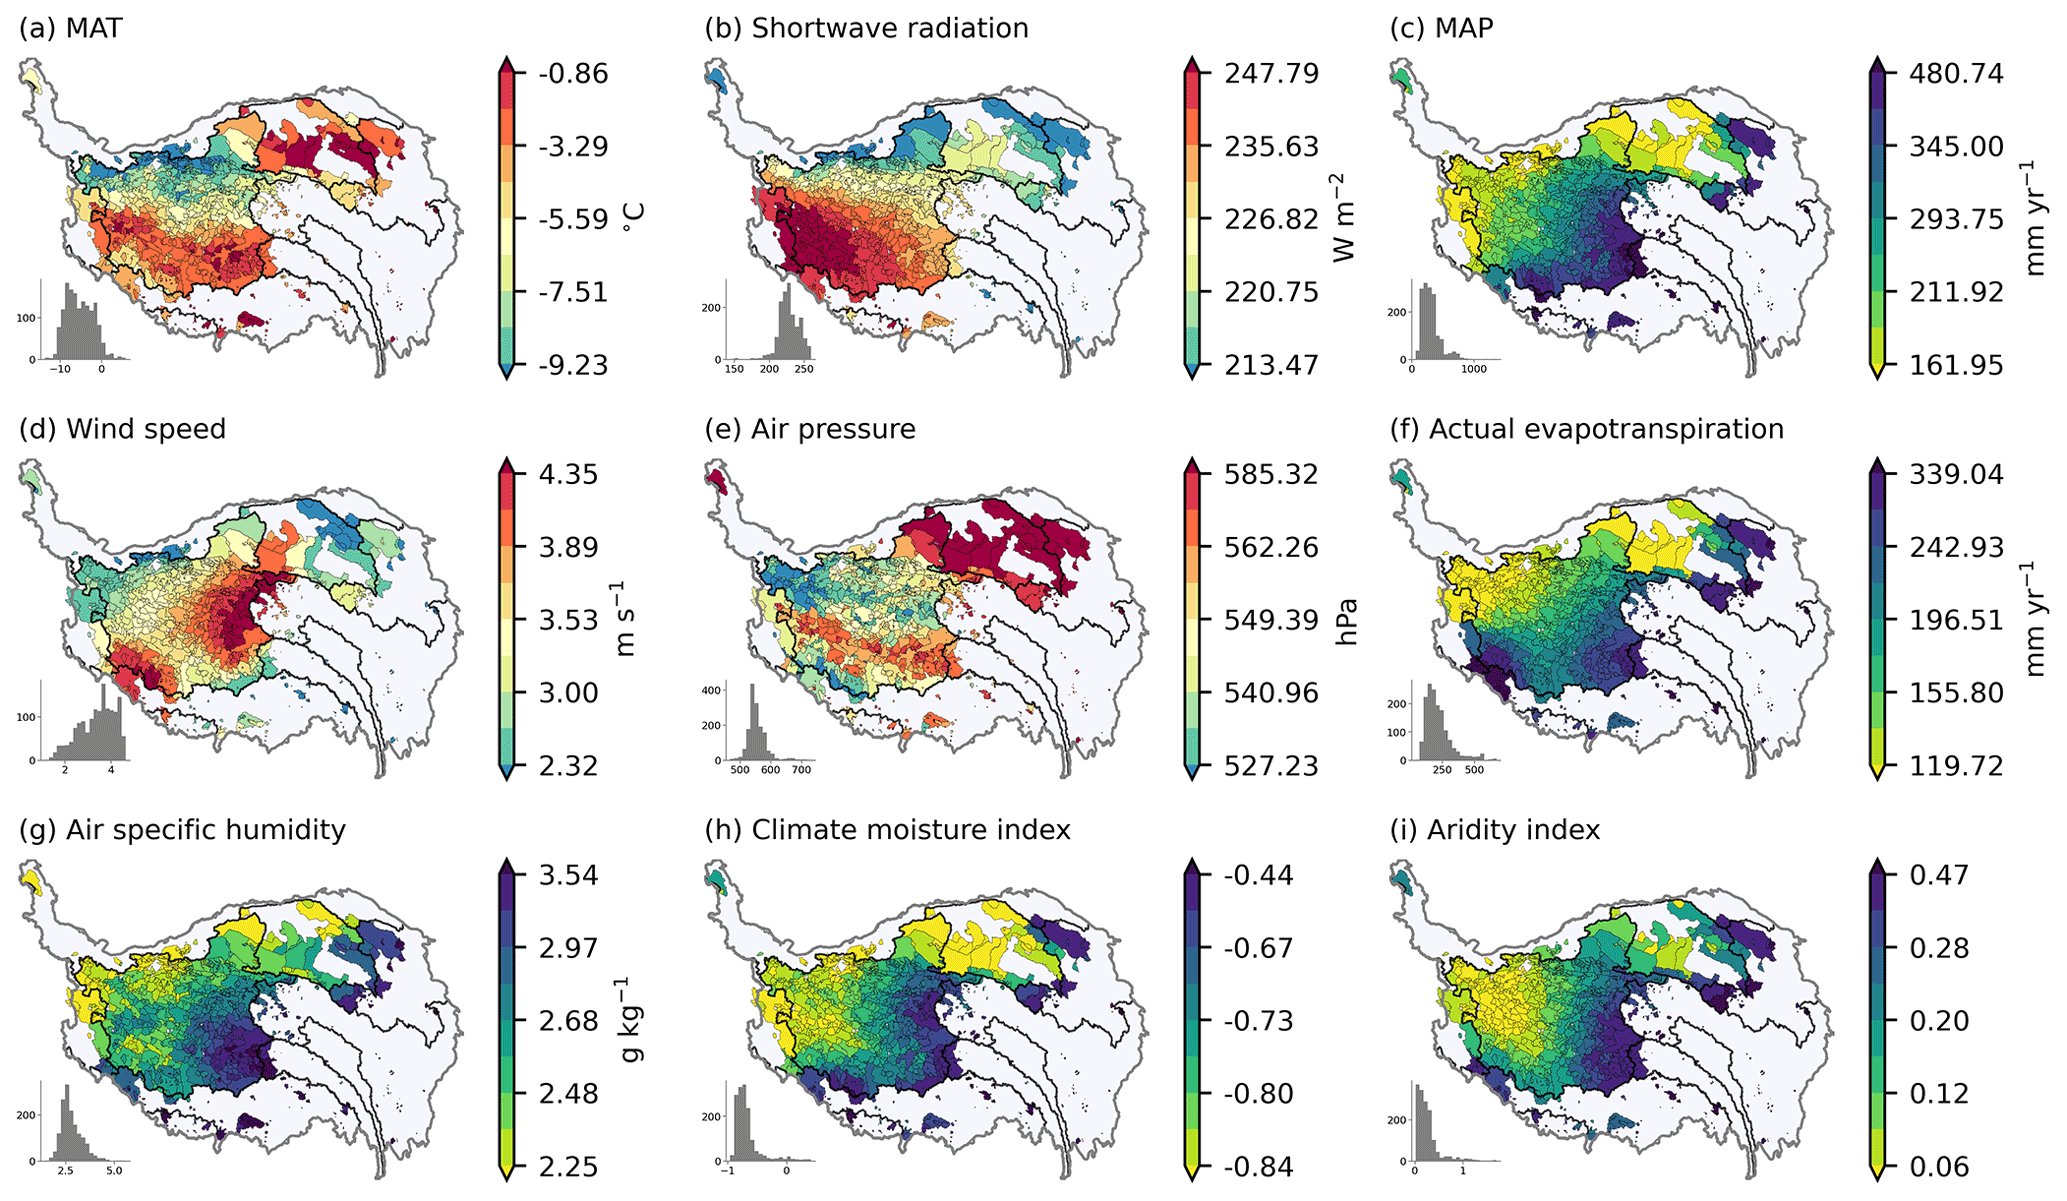
Figure 8Spatial distribution of multi-year average climatic characteristics for inter-lake catchments on the TP. MAT represents mean annual temperature, and MAP represents mean annual precipitation.
4.5 Land cover/use characteristics
The land cover/use characteristics include remote-sensed vegetation indices (i.e., EVI (enhanced vegetation index) and NDVI (normalized difference vegetation index)), gross primary productivity (GPP), net primary production (NPP), and dominant land cover/use type in each catchment as well as the fractions of each type, and the fractions of protected area. The average vegetation indices, GPP, and NPP across the whole year and in the growing season were calculated.
The land cover/use data came from the fusion land use product on the TP produced by Xu (2019), which was constructed based on six mainstream land use products, i.e., ESA GlobCover (Arino and Bicheron, 2010), NLCD-China (Liu et al., 2005), FROM-GLC (Gong et al., 2019), MODIS MCD12Q1 (Friedl and Sulla-Menashe, 2019), UMD GLCF GLCDS (Hansen et al., 1998), and USGS IGBP DISCover (Loveland et al., 2009). This dataset has a spatial resolution of 300 m and covers three historical periods (1992, 2005, and 2015). There are nine different land use types over the TP, including grassland, shrubland, forest, glacier, bare land, water body and wetland, desert, farmland, and urban land. In addition, the second glacier inventory dataset of China (version 1.0, 2006–2011) (Liu et al., 2012) and a wetland distribution dataset (the 1970s, 2000s) (Zhou, 2018) were used as independent datasets for glaciers and wetlands. For the protected area, the World Database on Protected Areas (WDPA) (UNEP-WCMC and IUCN, 2021) was used. The fractional snow cover data (i.e., the fraction of a pixel that is snow covered) was extracted from the MODIS daily cloud-free snow cover product over the TP (2002–2015) (Qiu, 2018a). Considering that cloud and snow have similar reflection signals, eight different methods were employed in this product to remove the influence of cloud on snow cover identification.
Figure 9 shows the spatial distribution of land use/cover characteristics for inter-lake catchments on the TP. EVI is generally low for catchments across the TP and there is a deceasing trend from southeast to northwest following the spatial pattern of precipitation. The fraction of grassland is higher in the south of the Inner TP and the source region of the Yellow River, and that of shrubland is higher in the middle of the Inner TP. Wetlands have higher coverage mainly in the south and east part of the Inner TP and the upper Yellow River basin. There is no cropland in most lake catchments, and the bare land and desert are mainly distributed in the north of the TP. The fraction of glaciers is relatively higher in the south and west of the TP.
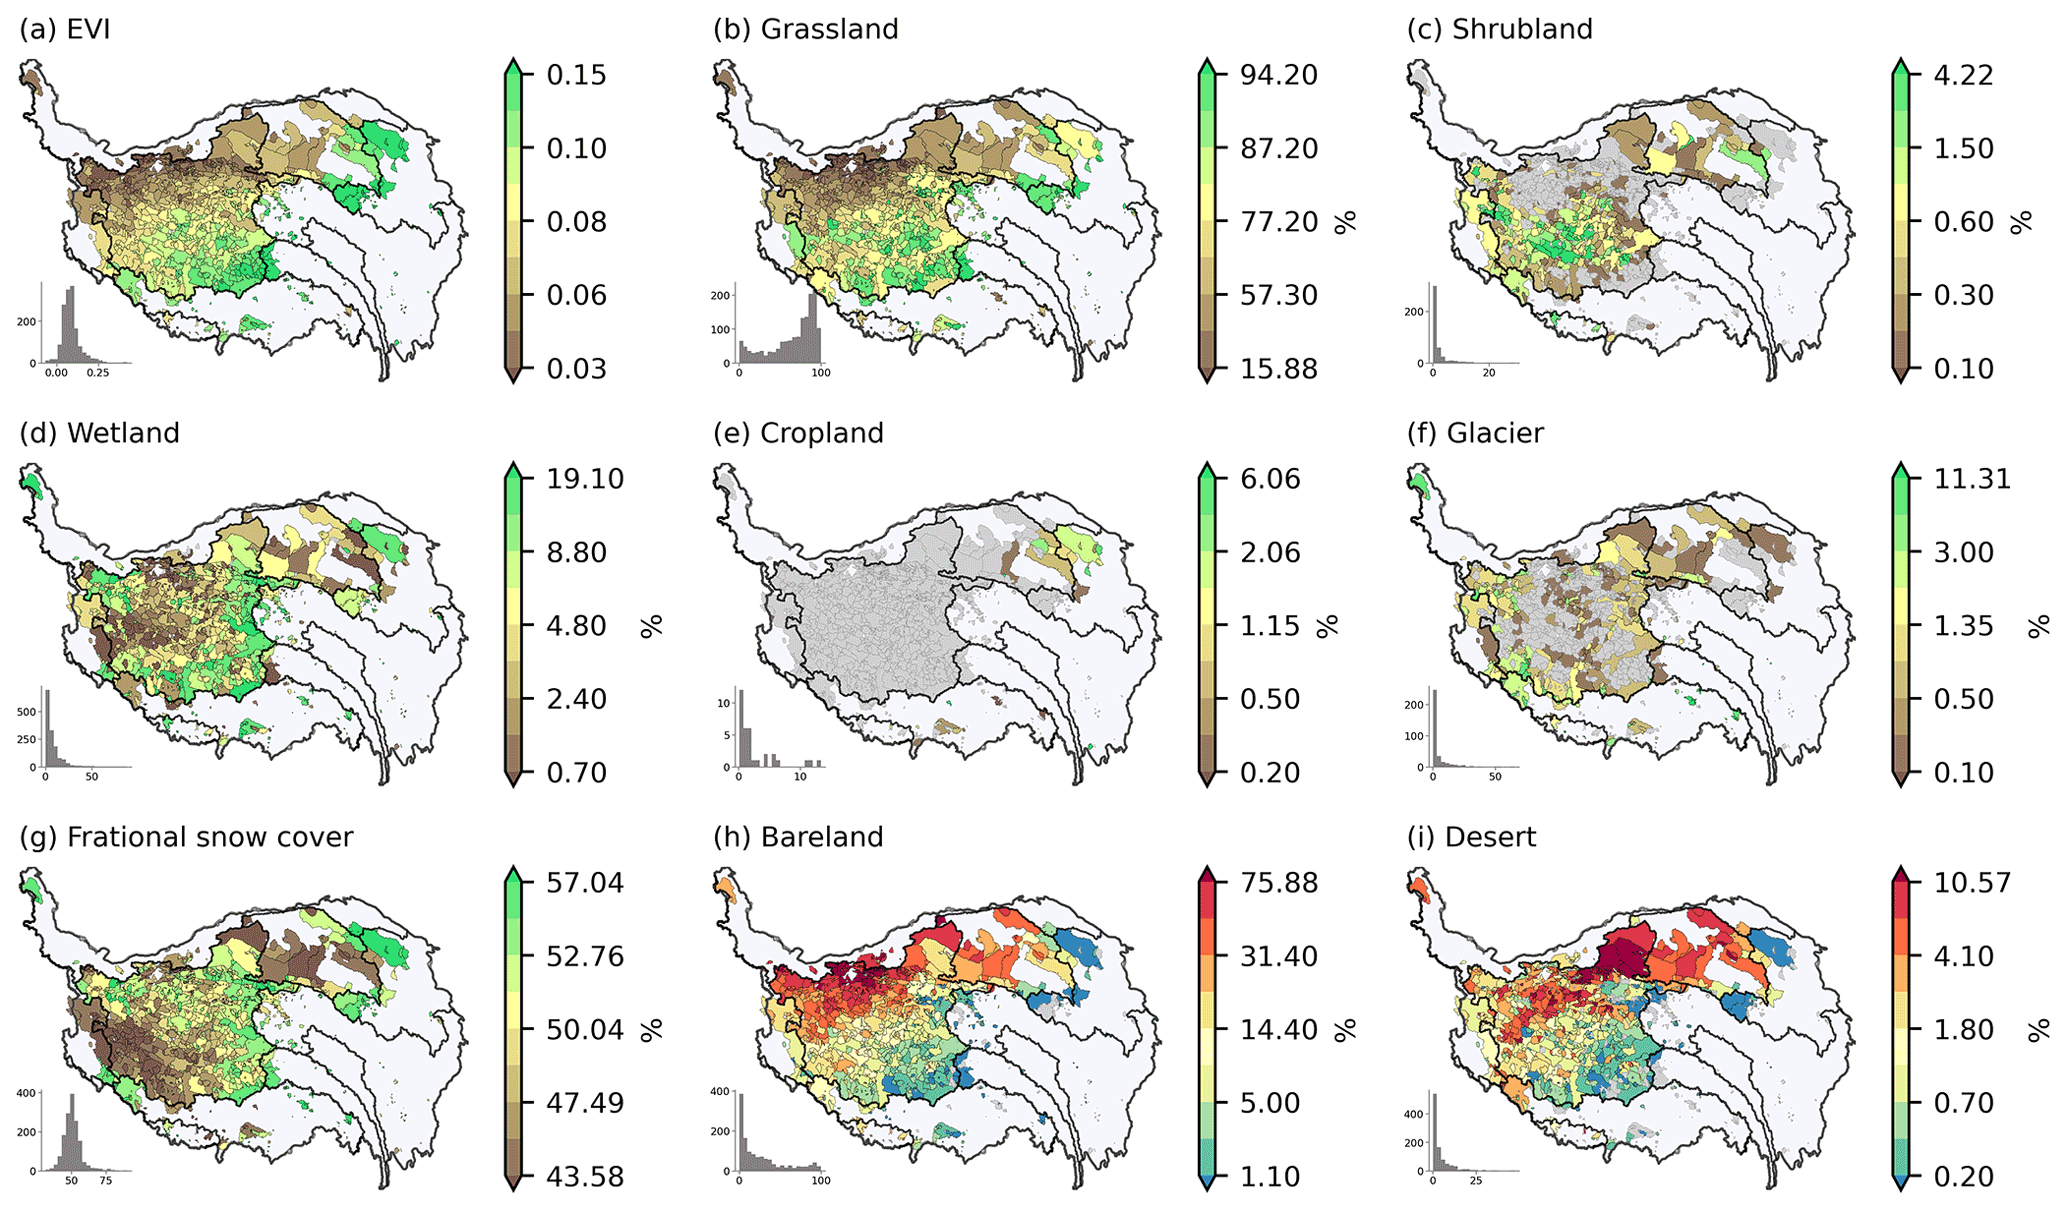
Figure 9Spatial distribution of land use/cover characteristics for inter-lake catchments on the TP. The multi-year average EVI from 2000 to 2021 and the land use/cover type and fraction in 2015 are shown in the figure.
4.6 Soil and geology characteristics
This study included 21 physical and chemical variables of soil. The proportions of sand, silt, clay, and coarse fragments, the bulk density, cation exchange capacity (CEC), pH, total nitrogen (TN), and soil organic carbon (SOC) content/density/stock were derived from the 250 m resolution SoilGrids 2.0 product (Poggio et al., 2021). These soil properties were predicted at six different depths (i.e., 0–5, 5–15, 15–30, 30–60, 60–100, and 100–200 cm) using machine learning models based on observations from over 230 000 soil profiles globally in the WoSIS database and over 400 environmental covariates. Data of all the six layers were aggregated at the inter-lake catchment and full catchment level. The grading standards of soil particle size are as follows: coarse fragments in the soil refer to particles larger than 2 mm and smaller than 25 cm in diameter, sand refers to particles >0.05 mm in the fine earth fraction (i.e., the particles less than 2 mm), silt refers to particles ≥0.002 and ≤0.05 mm in the fine earth fraction, and clay refers to the particles <0.002 mm. The CEC measures the ability of soil to hold onto exchangeable cations which can resist nutrient leaching and it is an important variable in soil fertility. The organic carbon content, density, and stock are the mass of organic carbon per unit mass, volume, and surface area, respectively. Besides SoilGrids, the dataset of SOC content at different depth intervals (i.e., 0–30, 0–50, 0–100, 0–200, and 0–300 cm) over the Third Pole produced by Wang et al. (2021) was also used.
Soil erosion data came from the dataset of soil erosion intensity with 300 m resolution over the TP (1992, 2005, 2015) (Zhang, 2019). It was calculated using the China soil loss equation (CSLE) considering precipitation, soil erodibility, slope length, slope, vegetation cover, management, and crop factors. Soil erodibility was also included in the dataset, and the Soil Erodibility Dataset of the Pan-Third Pole in 2020 (Yang and He, 2019) was used. The data on soil water content were derived from the Global High-Resolution Soil-Water Balance dataset (Trabucco and Zomer, 2010), which defines the fraction of soil water content available for evapotranspiration processes (as a percentage of the maximum soil water content) and is therefore a measure of soil water stress. We calculated catchment-level soil water content at monthly and annual scales. The mean annual ground temperature (MAGT) was derived from the MAGT and permafrost thermal stability dataset over the TP from 2005 to 2015 (Ran and Li, 2019).
The geological characteristics include lithological class, subsurface permeability, and porosity. The lithological classes came from the Global Lithological Map (GLiM) database V 1.0 (Hartmann and Moosdorf, 2012). GLiM consists of three classification levels, and the first level which contains 16 lithological classes was adopted. The subsurface permeability and porosity, two crucial parameters for groundwater modeling, were derived from the GLobal HYdrogeology MaPS 2.0 (GLHYMPS 2.0) dataset (Huscroft et al., 2018). Permeability measures how easy the rock permits the passage of fluids, and porosity measures how much water can be stored in the subsurface. These two parameters were estimated based on the GLiM lithological map, which can differentiate fine and coarse-grained sediments and sedimentary rocks. To calculate the catchment-level characteristics, the arithmetic mean was used for porosity, while the logarithmic scale geometric mean was used for permeability.
Figure 10 shows the spatial distribution of soil and geology characteristics for inter-lake catchments on the TP. The pH value is high in the west of the Inner TP, and the SOC and total nitrogen content are low in this region. The sand content is high in the south of the Inner TP and the northeast of the TP, while the clay content shows the opposite pattern. The fraction of permafrost extent is high in the north of the Inner TP. The lithological classes show a latitudinal distribution, and the main types include siliciclastic sedimentary rocks, mixed sedimentary rocks, and unconsolidated sediments. The subsurface permeability is higher in the south of the TP than in the north, and the subsurface porosity is higher in the north of the TP and the valley between the Kunlun and Gangdise mountains in the south of the Inner TP.
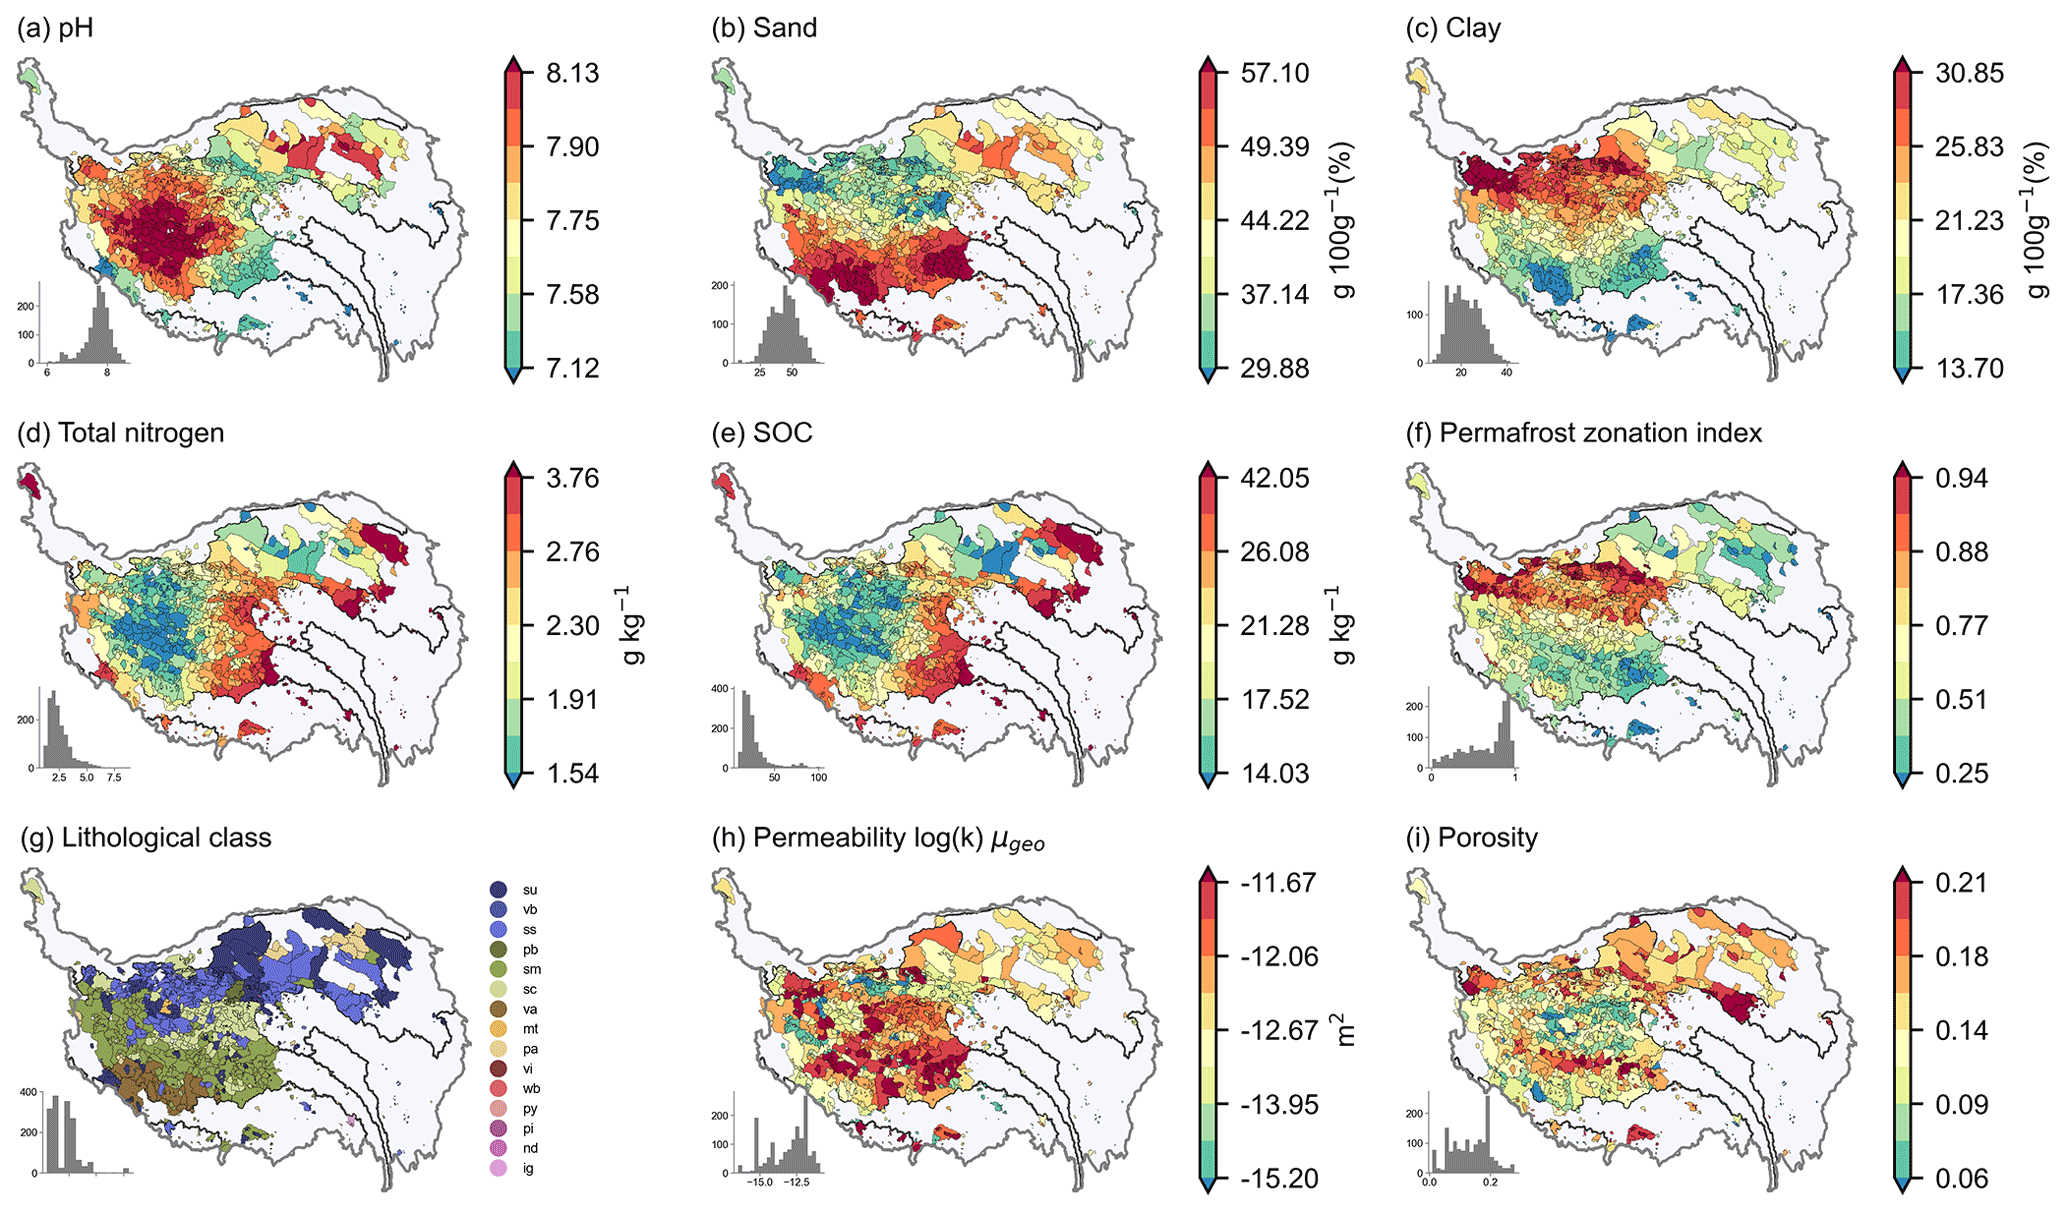
Figure 10Spatial distribution of soil and geology characteristics for inter-lake catchments on the TP.
4.7 Anthropogenic activity characteristics
Population count and density, man-made objects such as cities and roads, and nighttime lights were used to characterize human activities in a catchment. Human footprint, a comprehensive index for evaluating human activities, was also included in this dataset. The population count and density data were obtained from the Gridded Population of the World (GPW) database v4.11 (Center for International Earth Science Information Network – Columbia University, 2018). This database provides estimates of the human population (number of persons per pixel) at a spatial resolution of 30 arcsec for the years 2000, 2005, 2010, 2015, and 2020. Nighttime lights (NLI) are a useful proxy to characterize the intensity of human activity, and the DMSP-OLS Nighttime Lights v4 dataset (Doll, 2008) was used in this study. It was produced using cloud-free remote-sensing images from the Defense Meteorological Satellite Program (DMSP) Operational Linescan System (OLS) at a spatial resolution of 30 arcsec. The values in this dataset represent the product of the average visible band digital number of cloud-free light detections and the percent frequency of light detection.
Road density was derived from the Global Roads Inventory Project (GRIP) dataset (Meijer et al., 2018). Nearly 60 geospatial datasets on road infrastructure (from 1997 to the present) were gathered, harmonized and integrated into a global road dataset. The resulting dataset includes over 21 million km of roads, classified into five types. In this research, catchment-level road density was calculated from a simplified grid dataset at 5 arcmin spatial resolution. Human footprint is a measure of how much we are using the earth's natural resources, and the Global Human Footprint v2 dataset at a spatial resolution of 30 arcsec (Venter et al., 2016) was used. In this dataset, eight different factors, including built environments, population density, electric infrastructure, croplands, pasture lands, roads, railways, and navigable waterways, were combined to measure the direct and indirect human pressures on the environment globally in 1993 and 2009.
Figure 11 shows the spatial distribution of anthropogenic activity characteristics for inter-lake catchments on the TP. The population density, road density, and human footprint all suggest that human activities are relatively intense in the south and northeast of the TP and there is almost no human activity in the north of the Inner TP where elevation is high and environmental conditions are harsh.

Figure 11Spatial distribution of anthropogenic activity characteristics for inter-lake catchments on the TP.
4.8 Hydrological and meteorological time series
This dataset also provides the time series of several important hydrological and meteorological variables (Table S2), including the following: (1) daily meteorological variables (i.e., 2 m air temperature, surface pressure, and specific humidity, 10 m wind speed, downward shortwave radiation, downward longwave radiation, and precipitation amount) from the CMFD dataset covering the period 1979–2018 (Yang and He, 2019); (2) remote-sensed submonthly water level and volume data (2000–2017) extracted from Landsat images and altimetry data based on lake shoreline positions (Li et al., 2019), ∼ monthly water level data (2010–2020) extracted from multi-sensor altimetry data (Xu et al., 2022), lake area and mass change data at 5-year intervals (1976–2020) extracted from satellite stereo and multispectral images (Zhang et al., 2021); (3) remote-sensed daily fractional snow cover based on the MODIS surface reflectance product MO/YD09GA covering the period 2000–2022 (Jiang et al., 2022), daily snow depth data (1980–2019) produced through the fusion of five gridded snow depth datasets using machine learning methods (Che et al., 2021), and daily snow water equivalent data (2002–2011) based on AMSR-E brightness temperature (Qiu, 2018b); (4) yearly glacier mass change rates (2000–2019) extracted from large-scale and openly available satellite and airborne elevation datasets (Hugonnet et al., 2021); and (5) decadal maximum freezing depth data of seasonal frozen soil (1961–2020) produced by the support vector regression model based on in situ measurements from 2001 to 2010 and spatial environmental variables (Wang and Ran, 2021). These time series data facilitate the analysis of temporal variation at the catchment scale and can be used for hydrological modeling based on lumped hydrological models or machine learning methods.
Since the catchment-scale attributes in this dataset were mostly derived from existing datasets by calculating zonal statistics (such as sums, means, and medians), uncertainties of source datasets were propagated to the results and determined the uncertainties of this dataset. We did our best to collect the most reliable datasets to date and will regularly update the related datasets in the future to ensure their timeliness. Still, users of this dataset need to be aware of the uncertainties of the main source datasets, which are listed here.
5.1 Lake water level and volume
The RMSE of the Landsat-derived water levels from Li et al. (2019) was 0.11 m. The water level data from Xu et al. (2022) had R2>0.80 and RMSE <0.12 m in Qinghai Lake. The uncertainties for each value in the time series of Li et al. (2019), Zhang et al. (2021), and Xu et al. (2022) can be found in the corresponding uncertainty files (Table S2).
5.2 Topographic data
Most topographic attributes in this dataset were derived from MERIT DEM and MERIT Hydro (flow direction map) datasets. MERIT DEM was produced by eliminating main error components (e.g., absolute bias, stripe noise, speckle noise, and tree height bias) from existing DEMs (SRTM3 DEM, AW3D DEM, and VFP-DEM). It has a resolution of 3′′ (∼ 90 m at the Equator) and the land areas mapped with ±2 m or better vertical accuracy were 58 % (Yamazaki et al., 2017). MERIT Hydro was derived from MERIT DEM and water body datasets (G1WBM, Global Surface Water Occurrence, and OpenStreetMap). The relative error of MERIT Hydro in drainage area delineation was less than 0.05 for 90 % of Global Runoff Data Center (GRDC) gauges.
5.3 Climatic data
The CMFD meteorological dataset used in this study was produced through fusion of remote-sensing products, reanalysis datasets, and in situ observations from a larger number of stations. Its accuracy in western China was validated based on independent observations, and the results showed that CMFD had closer-to-zero mean bias error (MBE), lower RMSE, and higher R2 than the Global Land Data Assimilation System (GLDAS) for almost all meteorological variables (He et al., 2020).
5.4 Land cover/use data
The land cover/use data used in this study came from the fusion of six popular land use products, with an accuracy of 88.71 % (Xu, 2019). The GPP and NPP data came from the MODIS products (MOD17A2H.006 and MOD17A3HGF.006). The R2 between monthly MODIS GPP and eddy covariance measurements was reported to be 0.64 on average, and the RMSE was 2.55 g C m−2 d−1 in alpine grassland, which is the most widely distributed biome on the TP (Zhu et al., 2018); the R2 between MODIS NPP and in situ observations in 23 stations across China was reported to be 0.81, and the RMSE was 73.44 g C m−2 (Sun et al., 2021). The RMSE of fractional snow cover data from Jiang et al. (2022) was 0.14 taking the results from high-resolution Landsat images as reference. The R2 between snow depth data from Che et al. (2021) and in situ observations was 0.81, and the RMSE and mean absolute error (MAE) were 7.7 and 2.7 cm, respectively.
5.5 Soil data
The SoilGrids 2.0 dataset used in this study was generated by machine learning methods, using approximately 240 000 soil observations worldwide and over 400 environmental variables as inputs. It provides a spatial distribution map of data uncertainty generated by the quantile regression forest prediction model, which is the ratio of the interquartile range (i.e., the difference between 0.95 quantile and 0.05 quantile) over the median (Poggio et al., 2021). The catchment-level average uncertainty for each soil variable was calculated and included in this dataset. For the maximum freezing depth of seasonal frozen soil, the R2 in the four periods of 1980s, 1990s, 2000s, and 2010s were 0.77, 0.83, 0.73, and 0.71, respectively (Wang and Ran, 2021).
The dataset of lake-catchment characteristics for the Tibetan Plateau (LCC-TP v1.0) is accessible at the National Tibetan Plateau/Third Pole Environment Data Center (https://doi.org/10.11888/Terre.tpdc.272026, Liu, 2022) and the figshare website (https://figshare.com/articles/dataset/A_dataset_of_lake-catchment_characteristics_for_the_Tibetan_Plateau_v1_0_/20222178, last access: 18 August 2022). There are two types of data in this dataset: spatial data stored in shapefile format and attribution data stored in csv format. The spatial data are stored in the “spatial_data” folder, including the spatial distribution of lakes (lakes.shp), the spatial extent of full catchments (full_catchments.shp), the spatial extent of inter-lake catchments (inter-lake_catchments.shp), and the flow paths among upstream and downstream lakes (flowpath.shp). The attributes of lakes and their lake catchments are stored in LCC-TP_attributes.csv, which can be linked to the spatial data through the “LakeID” field. The time series of daily meteorological data from 1979 to 2018 are stored in the csv files in the “time_series” folder. Each column in the csv file, except for the first one, corresponds to the data of a lake, and the column name is the lake ID. The name of each file consists of two parts, connected by an underscore. The first part specifies the spatial extent, which can be lake body (LK), full catchments (FC), and inter-lake catchments (IC). The second part specifies the type of meteorological variable, which can be temp (temperature, K), prec (precipitation, mm), wind (wind speed, m s−1), pres (air pressure, Pa), LRAD (long-wave radiation, W m−2), SRAD (short-wave radiation, W m−2), and Shum (specific humidity, kg kg−1).
This study constructed the first dataset of lake-catchment characteristics for 1525 lakes with areas from 0.2 to 4503 km2 on the TP (LCC-TP v1.0). The catchment-level characteristics were extracted for both inter-lake catchments and full catchments of lakes, and there are six categories (i.e., lake body, topography, climate, land cover/use, soil and geology, and anthropogenic activity) and a total of 721 attributes in the dataset. Besides multi-year average attributes, the daily time series of climatic variables were also extracted, which can be used to drive lumped hydrological models or machine learning models to simulate hydrological processes. The LCC-TP dataset contains fundamental information for analyzing the impact of the catchment on lakes, which on the one hand can deepen our understanding of the drivers of lake environment change, and on the other hand can be used to predict the water and sediment properties in unsampled lakes based on limited samples and the catchment-level attributes provided by our dataset. This offers exciting opportunities for lake studies in a spatially explicit context and promotes the development of landscape limnology on the TP.
The supplement related to this article is available online at: https://doi.org/10.5194/essd-14-3791-2022-supplement.
JL and PF designed the study and wrote the manuscript. JL, PF, and YQ wrote related programs and constructed the dataset. LJZ, ZD, GT, PL, MJ, and YL performed the analysis based on the dataset. All authors contributed to the writing and editing of this paper.
The contact author has declared that none of the authors has any competing interests.
Publisher’s note: Copernicus Publications remains neutral with regard to jurisdictional claims in published maps and institutional affiliations.
This article is part of the special issue “Extreme environment datasets for the three poles”. It is not associated with a conference.
The authors would like to thank the editor and three anonymous reviewers for their helpful comments and suggestions.
This research has been supported by the National Key Research and Development Program of China (grant no. 2019YFC1509103), the National Natural Science Foundation of China (grant nos. 42171132 and 41930102), and the National Key Research and Development Program of China (grant no. 2019QZKK0503).
This paper was edited by Tao Che and reviewed by three anonymous referees.
Addor, N., Newman, A. J., Mizukami, N., and Clark, M. P.: The CAMELS data set: catchment attributes and meteorology for large-sample studies, Hydrol. Earth Syst. Sci., 21, 5293–5313, https://doi.org/10.5194/hess-21-5293-2017, 2017.
Alvarez-Garreton, C., Mendoza, P. A., Boisier, J. P., Addor, N., Galleguillos, M., Zambrano-Bigiarini, M., Lara, A., Puelma, C., Cortes, G., Garreaud, R., McPhee, J., and Ayala, A.: The CAMELS-CL dataset: catchment attributes and meteorology for large sample studies – Chile dataset, Hydrol. Earth Syst. Sci., 22, 5817–5846, https://doi.org/10.5194/hess-22-5817-2018, 2018.
Arino, O. and Bicheron, P.: Global Land Cover Map, European Space Agency [data set], http://due.esrin.esa.int/page_globcover.php (last access: 18 August 2022), 2010.
Center for International Earth Science Information Network – Columbia University: Gridded Population of the World, Version 4 (GPWv4): Population Count, Revision 11, NASA [data set], https://doi.org/10.7927/H4JW8BX5, 2018.
Chagas, V. B. P., Chaffe, P. L. B., Addor, N., Fan, F. M., Fleischmann, A. S., Paiva, R. C. D., and Siqueira, V. A.: CAMELS-BR: hydrometeorological time series and landscape attributes for 897 catchments in Brazil, Earth Syst. Sci. Data, 12, 2075–2096, https://doi.org/10.5194/essd-12-2075-2020, 2020.
Che, T., Hu, Y., Dai, L., and Xiao, L.: Long-term series of daily snow depth dataset over the Northern Hemisphere based on machine learning (1980–2019), National Tibetan Plateau Data Center [data set], https://doi.org/10.11888/Snow.tpdc.271701, 2021.
Cole, J. J., Prairie, Y. T., Caraco, N. F., McDowell, W. H., Tranvik, L. J., Striegl, R. G., Duarte, C. M., Kortelainen, P., Downing, J. A., Middelburg, J. J., and Melack, J.: Plumbing the global carbon cycle: Integrating inland waters into the terrestrial carbon budget, Ecosystems, 10, 171–184, https://doi.org/10.1007/s10021-006-9013-8, 2007.
Coxon, G., Addor, N., Bloomfield, J. P., Freer, J., Fry, M., Hannaford, J., Howden, N. J. K., Lane, R., Lewis, M., Robinson, E. L., Wagener, T., and Woods, R.: CAMELS-GB: hydrometeorological time series and landscape attributes for 671 catchments in Great Britain, Earth Syst. Sci. Data, 12, 2459–2483, https://doi.org/10.5194/essd-12-2459-2020, 2020.
Doll, C. N.: CIESIN Thematic Guide to Night-Time Light Remote Sensing and Its Applications, Center for International Earth Science Information Network, Palisades, NY, USA, 41 pp., 2008.
Friedl, M. and Sulla-Menashe, D.: MCD12Q1 MODIS/Terra+Aqua Land Cover Type Yearly L3 Global 500m SIN Grid V006, NASA EOSDIS Land Processes DAAC [data set], https://doi.org/10.5067/MODIS/MCD12Q1.006, 2019.
Gao, H., Feng, Z., Zhang, T., Wang, Y., He, X., Li, H., Pan, X., Ren, Z., Chen, X., Zhang, W., and Duan, Z.: Assessing glacier retreat and its impact on water resources in a headwater of Yangtze River based on CMIP6 projections, 765, 142774, https://doi.org/10.1016/j.scitotenv.2020.142774, 2021.
Gong, P., Liu, H., Zhang, M., Li, C., Wang, J., Huang, H., Clinton, N., Ji, L., Li, W., Bai, Y., Chen, B., Xu, B., Zhu, Z., Yuan, C., Ping Suen, H., Guo, J., Xu, N., Li, W., Zhao, Y., Yang, J., Yu, C., Wang, X., Fu, H., Yu, L., Dronova, I., Hui, F., Cheng, X., Shi, X., Xiao, F., Liu, Q., and Song, L.: Stable classification with limited sample: transferring a 30 m resolution sample set collected in 2015 to mapping 10 m resolution global land cover in 2017, Sci. Bull., 64, 370–373, https://doi.org/10.1016/j.scib.2019.03.002, 2019.
Hansen, M., DeFries, R., Townshend, J. R. G., and Sohlberg, R.: UMD Global Land Cover Classification, 1 Kilometer, 1.0, Department of Geography, University of Maryland [data set], https://geog.umd.edu/feature/global-land-cover-facility-(glcf) (last access: 18 August 2022), 1998.
Hao, Z., Jin, J., Xia, R., Tian, S., Yang, W., Liu, Q., Zhu, M., Ma, T., Jing, C., and Zhang, Y.: CCAM: China Catchment Attributes and Meteorology dataset, Earth Syst. Sci. Data, 13, 5591–5616, https://doi.org/10.5194/essd-13-5591-2021, 2021.
Hargreaves, G. H.: Defining and Using Reference Evapotranspiration, J. Irrig. Drain. Eng., 120, 1132–1139, https://doi.org/10.1061/(ASCE)0733-9437(1994)120:6(1132), 1994.
Hartmann, J. and Moosdorf, N.: The new global lithological map database GLiM: A representation of rock properties at the Earth surface, Geochemistry, Geophys. Geosystems, 13, Q12004, https://doi.org/10.1029/2012GC004370, 2012.
He, J., Yang, K., Tang, W., Lu, H., Qin, J., Chen, Y., and Li, X.: The first high-resolution meteorological forcing dataset for land process studies over China, Sci. Data, 7, 25, https://doi.org/10.1038/s41597-020-0369-y, 2020.
Hijmans, R. J., Cameron, S. E., Parra, J. L., Jones, P. G., and Jarvis, A.: Very high resolution interpolated climate surfaces for global land areas, Int. J. Climatol., 25, 1965–1978, https://doi.org/10.1002/joc.1276, 2005.
Hill, R. A., Weber, M. H., Debbout, R. M., Leibowitz, S. G., and Olsen, A. R.: The Lake-Catchment (LakeCat) Dataset: characterizing landscape features for lake basins within the conterminous USA, Freshw. Sci., 37, 208–221, https://doi.org/10.1086/697966, 2018.
Hugonnet, R., McNabb, R., Berthier, E., Menounos, B., Nuth, C., Girod, L., Farinotti, D., Huss, M., Dussaillant, I., Brun, F., and Kääb, A.: Accelerated global glacier mass loss in the early twenty-first century, Nature, 592, 726–731, https://doi.org/10.1038/s41586-021-03436-z, 2021.
Huscroft, J., Gleeson, T., Hartmann, J., and Börker, J.: Compiling and Mapping Global Permeability of the Unconsolidated and Consolidated Earth: GLobal HYdrogeology MaPS 2.0 (GLHYMPS 2.0), Geophys. Res. Lett., 45, 1897–1904, https://doi.org/10.1002/2017GL075860, 2018.
Immerzeel, W. W., Van Beek, L. P. H., and Bierkens, M. F. P.: Climate change will affect the asian water towers, Science, 328, 1382–1385, https://doi.org/10.1126/science.1183188, 2010.
Jiang, L., Pan, F., Wang, G., Pan, J., Shi, J., and Zhang, C.: MODIS daily cloud-free factional snow cover data set for Asian water tower area (2000–2022), National Tibetan Plateau Data Center [data set], https://doi.org/10.11888/Cryos.tpdc.272503, 2022.
Klingler, C., Schulz, K., and Herrnegger, M.: LamaH-CE: LArge-SaMple DAta for Hydrology and Environmental Sciences for Central Europe, Earth Syst. Sci. Data, 13, 4529–4565, https://doi.org/10.5194/essd-13-4529-2021, 2021.
Li, S., Li, W., Xia, W., Wu, J., Yin, Y., Loffler, H., and Guo, X.: The Scientific Expedition on the Modern Lake Evolution in the Qinghai-Tibet Plateau: A Preliminary Report, J. Lake Sci., 10, 95–96, 1998.
Li, X., Long, D., Huang, Q., Han, P., Zhao, F., and Wada, Y.: High-temporal-resolution water level and storage change data sets for lakes on the Tibetan Plateau during 2000–2017 using multiple altimetric missions and Landsat-derived lake shoreline positions, Earth Syst. Sci. Data, 11, 1603–1627, https://doi.org/10.5194/essd-11-1603-2019, 2019.
Liu, J.: A dataset of lake-catchment characteristics for the Tibetan Plateau (v1.0) (1979–2018), National Tibetan Plateau Data Center [data set], https://doi.org/10.11888/Terre.tpdc.272026, 2022.
Liu, J., Liu, M., Tian, H., Zhuang, D., Zhang, Z., Zhang, W., Tang, X., and Deng, X.: Spatial and temporal patterns of China's cropland during 1990–2000: An analysis based on Landsat TM data, Remote Sens. Environ., 98, 442–456, https://doi.org/10.1016/j.rse.2005.08.012, 2005.
Liu, K., Song, C., Ke, L., Jiang, L., and Ma, R.: Automatic watershed delineation in the Tibetan endorheic basin: A lake-oriented approach based on digital elevation models, Geomorphology, 358, 107127, https://doi.org/10.1016/j.geomorph.2020.107127, 2020.
Liu, S., Guo, W., and Xu, J.: The second glacier inventory dataset of China (version 1.0) (2006–2011), National Tibetan Plateau Data Center [data set], https://doi.org/10.3972/glacier.001.2013.db, 2012.
Loveland, T., Brown, J., Ohlen, D., Reed, B., Zhu, Z., Yang, L., and Howard, S.: ISLSCP II IGBP DISCover and SiB Land Cover, 1992–1993, ORNL DAAC [data set], https://doi.org/10.3334/ORNLDAAC/930, 2009.
Meijer, J., Huijbregts, M., Schotten, K., and Schipper, A.: Global patterns of current and future road infrastructure, Environ. Res. Lett., 13, 064006, https://doi.org/10.1088/1748-9326/aabd42, 2018.
Poggio, L., de Sousa, L. M., Batjes, N. H., Heuvelink, G. B. M., Kempen, B., Ribeiro, E., and Rossiter, D.: SoilGrids 2.0: producing soil information for the globe with quantified spatial uncertainty, SOIL, 7, 217–240, https://doi.org/10.5194/soil-7-217-2021, 2021.
Qiu, Y.: MODIS daily cloud-free snow cover product over the Tibetan Plateau (2002–2015), National Tibetan Plateau Data Center [data set], https://doi.org/10.11888/Hydrol.tpe.00000026.file, 2018a.
Qiu, Y.: Snow water equivalent dataset for the High Asia Region (2002–2011), National Tibetan Plateau Data Center [data set], https://doi.org/10.11922/sciencedb.660, 2018b.
Ran, Y. and Li, X.: The mean annual ground temperature (MAGT) and permafrost thermal stability dataset over Tibetan Plateau for 2005–2015, National Tibetan Plateau Data Center [data set], https://doi.org/10.11888/Geogra.tpdc.270672, 2019.
Read, E. K., Patil, V. P., Oliver, S. K., Hetherington, A. L., Brentrup, J. A., Zwart, J. A., Winters, K. M., Corman, J. R., Nodine, E. R., Woolway, R. I., Dugan, H. A., Jaimes, A., Santoso, A. B., Hong, G. S., Winslow, L. A., Hanson, P. C., and Weathers, K. C.: The importance of lake-specific characteristics for water quality across the continental United States, Ecol. Appl., 25, 943–955, 2015.
Soranno, P. A., Cheruvelil, K. S., Webster, K. E., Bremigan, M. T., Wagner, T., and Stow, C. A.: Using Landscape Limnology to Classify Freshwater Ecosystems for Multi-ecosystem Management and Conservation, Bioscience, 60, 440–454, https://doi.org/10.1525/bio.2010.60.6.8, 2010.
Soranno, P. A., Bacon, L. C., Beauchene, M., Bednar, K. E., Bissell, E. G., Boudreau, C. K., Boyer, M. G., Bremigan, M. T., Carpenter, S. R., Carr, J. W., Cheruvelil, K. S., Christel, S. T., Claucherty, M., Collins, S. M., Conroy, J. D., Downing, J. A., Dukett, J., Fergus, C. E., Filstrup, C. T., Funk, C., Gonzalez, M. J., Green, L. T., Gries, C., Halfman, J. D., Hamilton, S. K., Hanson, P. C., Henry, E. N., Herron, E. M., Hockings, C., Jackson, J. R., Jacobson-Hedin, K., Janus, L. L., Jones, W. W., Jones, J. R., Keson, C. M., King, K. B. S., Kishbaugh, S. A., Lapierre, J.-F., Lathrop, B., Latimore, J. A., Lee, Y., Lottig, N. R., Lynch, J. A., Matthews, L. J., McDowell, W. H., Moore, K. E. B., Neff, B. P., Nelson, S. J., Oliver, S. K., Pace, M. L., Pierson, D. C., Poisson, A. C., Pollard, A. I., Post, D. M., Reyes, P. O., Rosenberry, D. O., Roy, K. M., Rudstam, L. G., Sarnelle, O., Schuldt, N. J., Scott, C. E., Skaff, N. K., Smith, N. J., Spinelli, N. R., Stachelek, J. J., Stanley, E. H., Stoddard, J. L., Stopyak, S. B., Stow, C. A., Tallant, J. M., Tan, P.-N., Thorpe, A. P., Vanni, M. J., Wagner, T., Watkins, G., Weathers, K. C., Webster, K. E., White, J. D., Wilmes, M. K., and Yuan, S.: LAGOS-NE: a multi-scaled geospatial and temporal database of lake ecological context and water quality for thousands of US lakes, Gigascience, 6, gix101, https://doi.org/10.1093/gigascience/gix101, 2017.
Sun, J., Yue, Y., and Niu, H.: Evaluation of NPP using three models compared with MODIS-NPP data over China, PLoS One, 16, e0252149, https://doi.org/10.1371/journal.pone.0252149, 2021.
Trabucco, A. and Zomer, R. J.: Global Soil Water Balance Geospatial Database, CGIAR-CSI [data set], https://cgiarcsi.community (last access: 18 August 2022), 2010.
UNEP-WCMC and IUCN: Protected Planet: The World Database on Protected Areas (WDPA), Protected Planet [data set], http://www.protectedplanet.net (last access: 18 August 2022), 2021.
Venter, O., Sanderson, E. W., Magrach, A., Allan, J. R., Beher, J., Jones, K. R., Possingham, H. P., Laurance, W. F., Wood, P., Fekete, B. M., Levy, M. A., and Watson, J. E. M.: Global terrestrial Human Footprint maps for 1993 and 2009, Sci. Data, 3, 160067, https://doi.org/10.1038/sdata.2016.67, 2016.
Wang, B. and Ran, Y.: Diversity of Remote Sensing-Based Variable Inputs Improves the Estimation of Seasonal Maximum Freezing Depth, Remote Sens., 13, 4829, https://doi.org/10.3390/rs13234829, 2021.
Wang, D., Wu, T., Zhao, L., Mu, C., Li, R., Wei, X., Hu, G., Zou, D., Zhu, X., Chen, J., Hao, J., Ni, J., Li, X., Ma, W., Wen, A., Shang, C., La, Y., Ma, X., and Wu, X.: A 1 km resolution soil organic carbon dataset for frozen ground in the Third Pole, Earth Syst. Sci. Data, 13, 3453–3465, https://doi.org/10.5194/essd-13-3453-2021, 2021.
Willmott, C. and Feddema, J.: A more rational climatic moisture index, Prof. Geogr., 44, 84–88, https://doi.org/10.1111/j.0033-0124.1992.00084.x, 1992.
Xu, E.: Land use of the Tibet Plateau in 2015 (Version 1.0), National Tibetan Plateau Data Center [data set], https://doi.org/10.11888/Geogra.tpdc.270198, 2019.
Xu, F., Zhang, G., Yi, S., and Chen, W.: Seasonal trends and cycles of lake-level variations over the Tibetan Plateau using multi-sensor altimetry data, J. Hydrol., 604, 127251, https://doi.org/10.1016/j.jhydrol.2021.127251, 2022.
Yamazaki, D., Ikeshima, D., Tawatari, R., Yamaguchi, T., O'Loughlin, F., Neal, J. C., Sampson, C. C., Kanae, S., and Bates, P. D.: A high-accuracy map of global terrain elevations, Geophys. Res. Lett., 44, 5844–5853, https://doi.org/10.1002/2017GL072874, 2017.
Yamazaki, D., Ikeshima, D., Sosa, J., Bates, P. D., Allen, G. H., and Pavelsky, T. M.: MERIT Hydro: A High-Resolution Global Hydrography Map Based on Latest Topography Dataset, Water Resour. Res., 55, 5053–5073, https://doi.org/10.1029/2019WR024873, 2019.
Yang, K. and He, J.: China meteorological forcing dataset (1979–2018), National Tibetan Plateau Data Center [data set], https://doi.org/10.11888/AtmosphericPhysics.tpe.249369.file, 2019.
Zhang, G.: The lakes larger than 1 km2 in Tibetan Plateau (V3.0) (1970s–2021), National Tibetan Plateau Data Center [data set], https://doi.org/10.11888/Hydro.tpdc.270303, 2019.
Zhang, G., Luo, W., Chen, W., and Zheng, G.: A robust but variable lake expansion on the Tibetan Plateau, Sci. Bull., 64, 1306–1309, https://doi.org/10.1016/j.scib.2019.07.018, 2019.
Zhang, G., Bolch, T., Chen, W., and Crétaux, J.-F.: Comprehensive estimation of lake volume changes on the Tibetan Plateau during 1976–2019 and basin-wide glacier contribution, Sci. Total Environ., 772, 145463, https://doi.org/10.1016/j.scitotenv.2021.145463, 2021.
Zhang, T., Soranno, P. A., Cheruvelil, K. S., Kramer, D. B., Bremigan, M. T., and Ligmann-Zielinska, A.: Evaluating the effects of upstream lakes and wetlands on lake phosphorus concentrations using a spatially-explicit model, Landsc. Ecol., 27, 1015–1030, https://doi.org/10.1007/s10980-012-9762-z, 2012.
Zhang, W.: Dataset of soil erosion intensity with 300 m resoluton in Tibetan Plateau (1992, 2005, 2015), National Tibetan Plateau Data Center [data set], https://doi.org/10.11888/Disas.tpdc.270224, 2019.
Zhou, C.: The dataset of wetland pattern changes on the Tibet Plateau (1970s, 2000s), National Tibetan Plateau Data Center [data set], https://doi.org/10.11888/Ecology.tpe.51.file, 2018.
Zhu, X., Pei, Y., Zheng, Z., Dong, J., Zhang, Y., Wang, J., Chen, L., Doughty, R. B., Zhang, G., and Xiao, X.: Underestimates of Grassland Gross Primary Production in MODIS Standard Products, Remote Sens., 10, 1771, https://doi.org/10.3390/rs10111771, 2018.
Zomer, R. J., Trabucco, A., Bossio, D. A., and Verchot, L. V.: Climate change mitigation: A spatial analysis of global land suitability for clean development mechanism afforestation and reforestation, Agric. Ecosyst. Environ., 126, 67–80, https://doi.org/10.1016/j.agee.2008.01.014, 2008.