the Creative Commons Attribution 4.0 License.
the Creative Commons Attribution 4.0 License.
 | 25 Aug 2022
Stable water isotope monitoring network of different water bodies in Shiyang River basin, a typical arid river in China
Yuwei Liu
Peiji Shi
Wenxiong Jia
Junju Zhou
Yuanfeng Liu
Xinggang Ma
Hanxiong Pan
Yu Zhang
Zhiyuan Zhang
Zhigang Sun
Leilei Yong
Kailiang Zhao
Ecosystems in arid areas are fragile and are easily disturbed by various natural and human factors. As natural tracers widely exist in nature, stable isotopes can be valuable for studying environmental change and the water cycle. From 2015 to 2020, we took the Shiyang River basin, which has the highest utilization rate of water resources and the most prominent contradiction of water use, as a typical demonstration basin to establish and improve the isotope hydrology observation system. The data in the observation system are classified by water type (precipitation, river water, lake water, groundwater, soil water, and plant water). Six observation systems with stable isotopes as the main observation elements have been built. These include river source region, oasis region, reservoir channel system region, oasis farmland region, ecological engineering construction region, and salinization process region; meteorological and hydrological data have also been collected. We will gradually improve the various observation systems, increase the data of observation sites, and update the data set yearly. We can use these data to research the continental river basin ecological hydrology, such as surface water evaporation loss, landscape river water cycle impact of the dam, dam water retention time, oasis farmland irrigation methods, and the atmosphere, such as the contribution of inland water circulation to inland river precipitation, climate transformation, below-cloud evaporation effect, and extreme climate events, which provides a scientific basis for water resources utilization and ecological environment restoration in the arid area. The data sets are available at https://doi.org/10.17632/vhm44t74sy.1 (Zhu, 2022).
- Article
(6044 KB) - Full-text XML
- BibTeX
- EndNote


Arid areas account for 33 % of the world's total land area and are characterized by a lack of water vapour sources and fragile ecosystems, which are easily disturbed by various natural and human factors (Qin and Thomas, 2014; Arheimer et al., 2017; Alam et al., 2019). Global and regional climate change exacerbate the uncertainty of water resources (Chen et al., 2017; Thompson et al., 2000; Zhang et al., 2021). In addition, under the influence of human activities, rivers' hydrological and ecological processes in arid areas, especially in the middle and lower reaches, have changed, resulting in many ecological and environmental problems (Gibson et al., 2016; Grill et al., 2015; Shah et al., 2021). Clarifying the ecohydrological process of the arid inland river basin is of great significance to other arid regions in the world.
Although stable isotopes such as δ2H and δ18O account for a small proportion in natural water bodies, they respond quickly to historical records of environmental changes and water cycle evolution (Vandenschrick et al., 2002; Haig et al., 2020). Stable isotopes provide a useful means of studying regional and global water cycles (Craig, 1961; Vallet-Coulomb et al., 2008; Bowen et al., 2012; Gibson et al., 2016). However, isotopic fractionation runs through every link of the water cycle (Song et al., 2017; Dansgaard, 1964). The hydrogen and oxygen isotopic compositions of different water bodies are influenced by isotopic fractionation (Gu, 1995; Risi et al., 2010; Sun et al., 2012; Min et al., 2018). At the same time, isotope fractionation may occur in hydrogen and oxygen isotope experiments. For example, the physical and chemical properties of soil may lead to the fractionation of hydrogen and oxygen in soil water (Meissner et al., 2014). In addition, incomplete extraction of water during cryogenic distillation may lead to isotope fractionation (Orlowski et al., 2016). We have always known that these “problems” exist, but compared with traditional hydrological methods, the high accuracy of isotope measurement technology and its resistance to external factors have made it widely used in the fields of hydrology, water resources, and the water cycle, and it has become an effective tool for solving many major scientific problems (Gat, 1996; Kralik et al., 2004; Li and Garzione, 2017). In particular, precipitation–surface, water–soil, and water–groundwater can be regarded as a unified “system” to quantitatively study the hydraulic connection between different water bodies (Burns et al., 1998; Gudkov et al., 2021; Zannoni et al., 2019). Due to the limitations of sampling time, sampling space, and the experimental analysis, there has been a lack of comprehensive research on different water bodies in the same area over a long time, making it challenging to study the water cycle in a specific area by using stable isotope comparison.
There are many rivers and watersheds similar to the Shiyang River basin in the world. The Angerman, located in northern Sweden, is the third largest river in Sweden, with a total length of 450 km and a watershed area of 32 000 km2 (Mitrovica and Forte, 2004). Many hydropower stations are built along the Angerman due to the rapids (Melin, 1970). The Glomma is the longest river in Norway. With a total length of 598 km and a watershed area of 42 000 km2, 13 % of Norway's land area belongs to the Glomma (Petterson et al., 2016). The agricultural area accounts for 5.8 % of the catchment area, and the catchment area has about 675 000 residents (Helland, 2001). The Digul River in Indonesia, with a total length of 525 km, stretches over an area of 29 700 km2 and is covered with swamps and rainforests (Ploeg, 2013). Compared with the Shiyang River basin, these rivers and basins have little difference in basin area (the Shiyang River basin covers 41 600 km2) but significant difference in length (the Shiyang River is 250 km). The length of the Shiyang River is short, its basin area is large, and it has a large population, which makes it one of the inland river basins of the world with a high population density. Its per capita water resources are low, with a net utilization rate of over 95 %, far exceeding the internationally recognized reasonable utilization rate (Wei et al., 2013; Li et al., 2013). Compared with the Glomma, the Shiyang River basin has a large agricultural area and a dense population, but its length is short and its development time is early, so the contradiction between water resources and the ecological environment in the Shiyang River basin is the most prominent. Compared with the catchment area, a relatively short river, such as the Orinoco River in South America, has a length of 2740 km and a drainage area of 948 000 km2 (Lavelle et al., 2014). Its drainage area is similar to that of the Yangtze River, the longest river in Asia (with a drainage area of about 1×10⁶ km2), but its length is short (the length of the Yangtze River is 4504 km) (Wang et al., 2012). The Yangtze River and the Orinoco River in South America are rich in precipitation and water resources, while the Shiyang River lies deep in the hinterland of Asia and Europe, with little and irregular precipitation, large evaporation, and long drought periods, hence the Shiyang River basin has become the focus of public attention.
We have established an isotope hydrology observation system in the Shiyang River basin, collected stable water isotope data and meteorological and hydrological data from 2015 to 2020, and compiled them into a data set. We used the data to study the following:
-
The contribution of circulating water to precipitation – our research shows that plants' evapotranspiration water vapour contribution is always greater than the surface evaporative water vapour, and different landscapes and special underlying surfaces are important factors affecting the difference in water vapour contribution (Zhu et al., 2018).
-
Below-cloud evaporation of stable precipitation isotopes in mountainous areas, oases, and deserts in arid regions – our study shows that the below-cloud evaporation is the strongest in summer and the weakest in spring, and the humidification of the reservoir will weaken the below-cloud evaporation (Zhu et al., 2021d).
-
Evaporative losses of surface water were identified using stable isotopes. Our research shows that evaporation from surface water increases gradually from mountains to deserts, and increases in reservoir and irrigation water can lead to evaporation (Sun et al., 2021).
-
Impact of landscape dams on river water circulation in urban and rural areas – our research shows that the cumulative effect of multiple landscape dams leads to severe water shortages in arid regions (Zhu et al., 2021a).
-
The infiltration process of oasis farmland irrigation water and its enlightenment to optimizing irrigation methods – our study shows that irrigation water, as the primary source of recharge in this study, can reach soil layers below 1 m, effectively, replacing old water in farmland soil (Zhu et al., 2021b).
-
Effects of plastic film on soil water migration in arid oasis farmland – our research shows that mulching can effectively reduce the evaporative loss of topsoil water and improve water use efficiency during the whole maize growing season (Zhu et al., 2021c).
Our work will help to clarify the impact of the local water cycle and human activities on agricultural production in the Shiyang River basin, analyse the development trend of inland river basins under global climate change, promote ecological restoration, and provide some scientific reference for the ecohydrological research in other arid areas.
The Shiyang River basin (– N, – E) is located in the eastern Qilian Mountain and Hexi Corridor. The topography of the Shiyang River basin slopes sharply from southwest to northeast, with the Qilian Mountains in the south, alluvial plains and Gobi in the middle, and flood plains and deserts in the north (Zhu et al., 2020). The river is about 250 km long and covers an area of 4.16×10⁴ km2 (Wang and Gao, 2021). There are five hydrological stations in the Shiyang River basin: Miscellaneous Wood Temple, Jiu Tiaoling, Cai Qiqiao, Nanying Reservoir, and Huanyang River Reservoir, with average annual flows of 7.33, 10.07, 9.15, 3.92, and 3.86 m3 s−1, respectively. From south to north, the Shiyang River basin covers three different climatic regions: the southern Qilian Mountain area has a snow climate with dry winter, an annual average temperature below 6 ∘C, and precipitation of 300–600 mm; the central corridor plain has a arid steppe climate, the annual average temperature is between 6–8 ∘C, and the precipitation is 150–300 mm; the north has an arid desert climate, with an annual average temperature higher than 8 ∘C and precipitation less than 150 mm (Zhu et al., 2021a; Kottek et al., 2006). The precipitation in the Shiyang River basin is mainly concentrated in summer (71.54 mm), with the least precipitation in winter (4.22 mm); the average evaporation in summer (713.45 mm) is the largest, while the average evaporation in winter (164.4 mm) is the smallest (Appendix C, Fig. C1). The irrigation system for surface water and groundwater is complete in the Shiyang River basin, with irrigated 4.6×10⁶ ha of cultivated land.
From 2015 to 2020, we set up 16 meteorological observation stations, 53 hydrological observation stations, 19 soil and vegetation observation stations, and 20 mu of experimental observation plots in the Datan township. For the convenience of data recording, each monitoring point is recorded in short form. Appendix B Table B1 presents the complete names, abbreviations, and corresponding meteorological parameters of each sampling point so that readers can match the data set. A total of 6756 samples were collected, including 1206 precipitation samples, 1101 surface water samples, 161 groundwater samples, 3779 soil water samples, and 509 plant water samples. Figure 1 shows the distribution of six observation systems: river source region, oasis region, reservoir channel system region, oasis farmland region, ecological engineering construction region, and salinization process region. Based on the isotope data, we (i) studied the evaporation and the water vapour cycle in the Shiyang River Basin (Zhu et al., 2018); (ii) analysed the runoff source and material transport in the runoff-producing area of the arid area (Zhou et al., 2020; Ma et al., 2019), so as to clarify the sources of atmospheric and surface water; (iii) analysed the influence of the reservoir on the water cycle and studied the influence of the ecological water transfer project on the water cycle (Zhu et al., 2021a), so as to clarify the influence of reservoir and ecological water transfer on the hydrological process; and (iv) quantified the influence of climate change and human activities on hydrology and water resources of the basin.
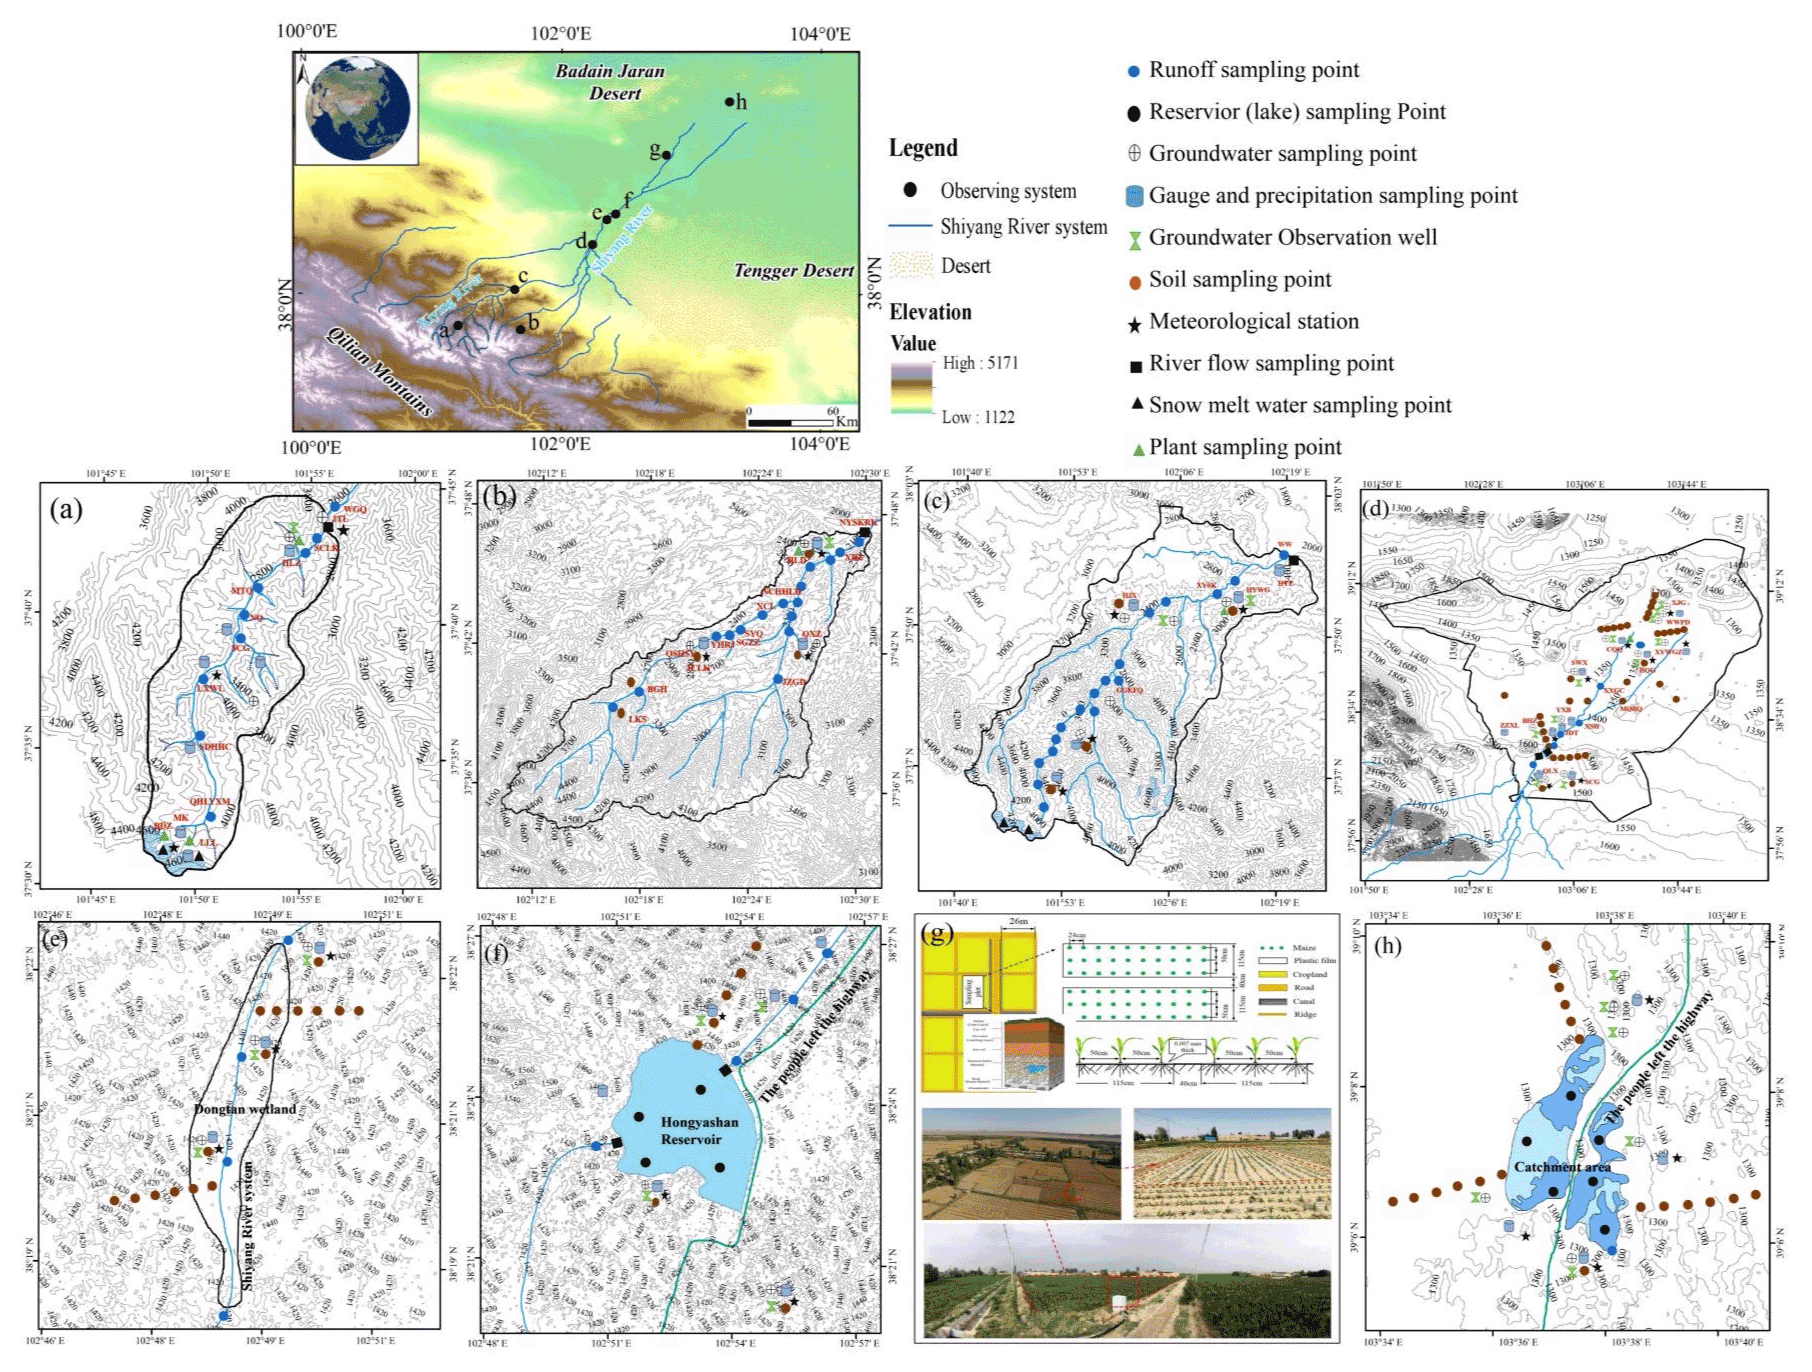
Figure 1Shiyang River basin monitoring network ((a) Ningchang River observation system, river source area; (b) Binggou River basin observation system, river source area; (c) Xiying River basin, river source observation system; (d) Minqin soil system, oasis area; (e) Dongtan wetlands observation system, ecological engineering construction region; (f) Hongyashan reservoir canal observation system, reservoir channel system region; (g) Datan farmland observation system, oasis farmland area; (h) Qingtu lake observation system, salinization process area).
4.1 Sample collection
4.1.1 Collection of precipitation
We use standard rain gauges to collect precipitation (Appendix C, Fig. C2). The rain gauge is placed in an open outdoor area and consists of rain gear: a funnel, water bottle, and rain cup. The diameter of the rain gear is 20 cm, and the port of the device is horizontal. The height of the rain opening of the instrument is set to be 70 cm above the ground level. We placed an anti-evaporation polythene ball at the funnel mouth and added a layer of paraffin oil to the bottom of the container to prevent isotope fractionation caused by evaporation. After each precipitation event, we immediately transfer the collected liquid precipitation to a 100 mL high-density sample bottle. For solid precipitation, we transfer it to a high-density polyethylene sample bottle after the solid precipitation becomes liquid water at room temperature (23 ∘C). We use Parafilm to seal the plastic bottle and at the same time affix a label on the bottle with the date of collection, the type of precipitation (rain, snow, hail), and the amount of precipitation. We store the collected samples in a freezer at a temperature of about 4 ∘C for experimental testing.
4.1.2 Collection of surface water and groundwater
We collect surface water (river water, lake water, reservoir water) in polyethylene bottles. We stratified samples at different depths (surface, middle, and bottom). We collected groundwater samples from groundwater monitoring wells of the Shiyang River Basin Administration Bureau, China Hydrology Bureau, and Gansu Hydrology Bureau. We seal polythene bottles with sealing film and label them with the date of sampling, depth of sampling, condition of tributaries, and mainstream.
4.1.3 Collection of soil and plant water
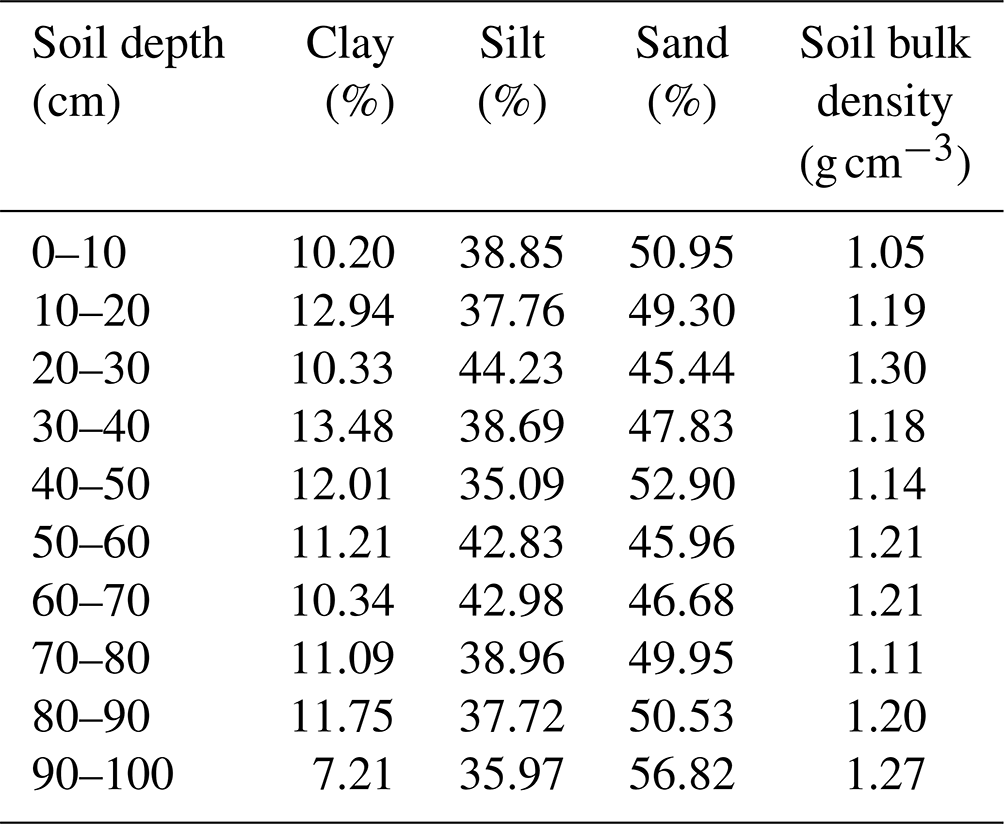
We collected soil at a depth of 100 cm and collected soil samples every 10 cm. The upper reaches of the Shiyang River basin are dominated by clay, while the middle and lower reaches are dominated by clay and sandy soil. Table 1 shows the soil characteristics of farmland areas in the Shiyang River basin. We divided the soil sample into two parts, one part into 50 mL glass bottles. The other samples were placed in 50 mL aluminum boxes, and soil water content was measured by the drying method since 2019.
Table 1Basic information of soil samples in DTX (Zhu et al., 2021d).
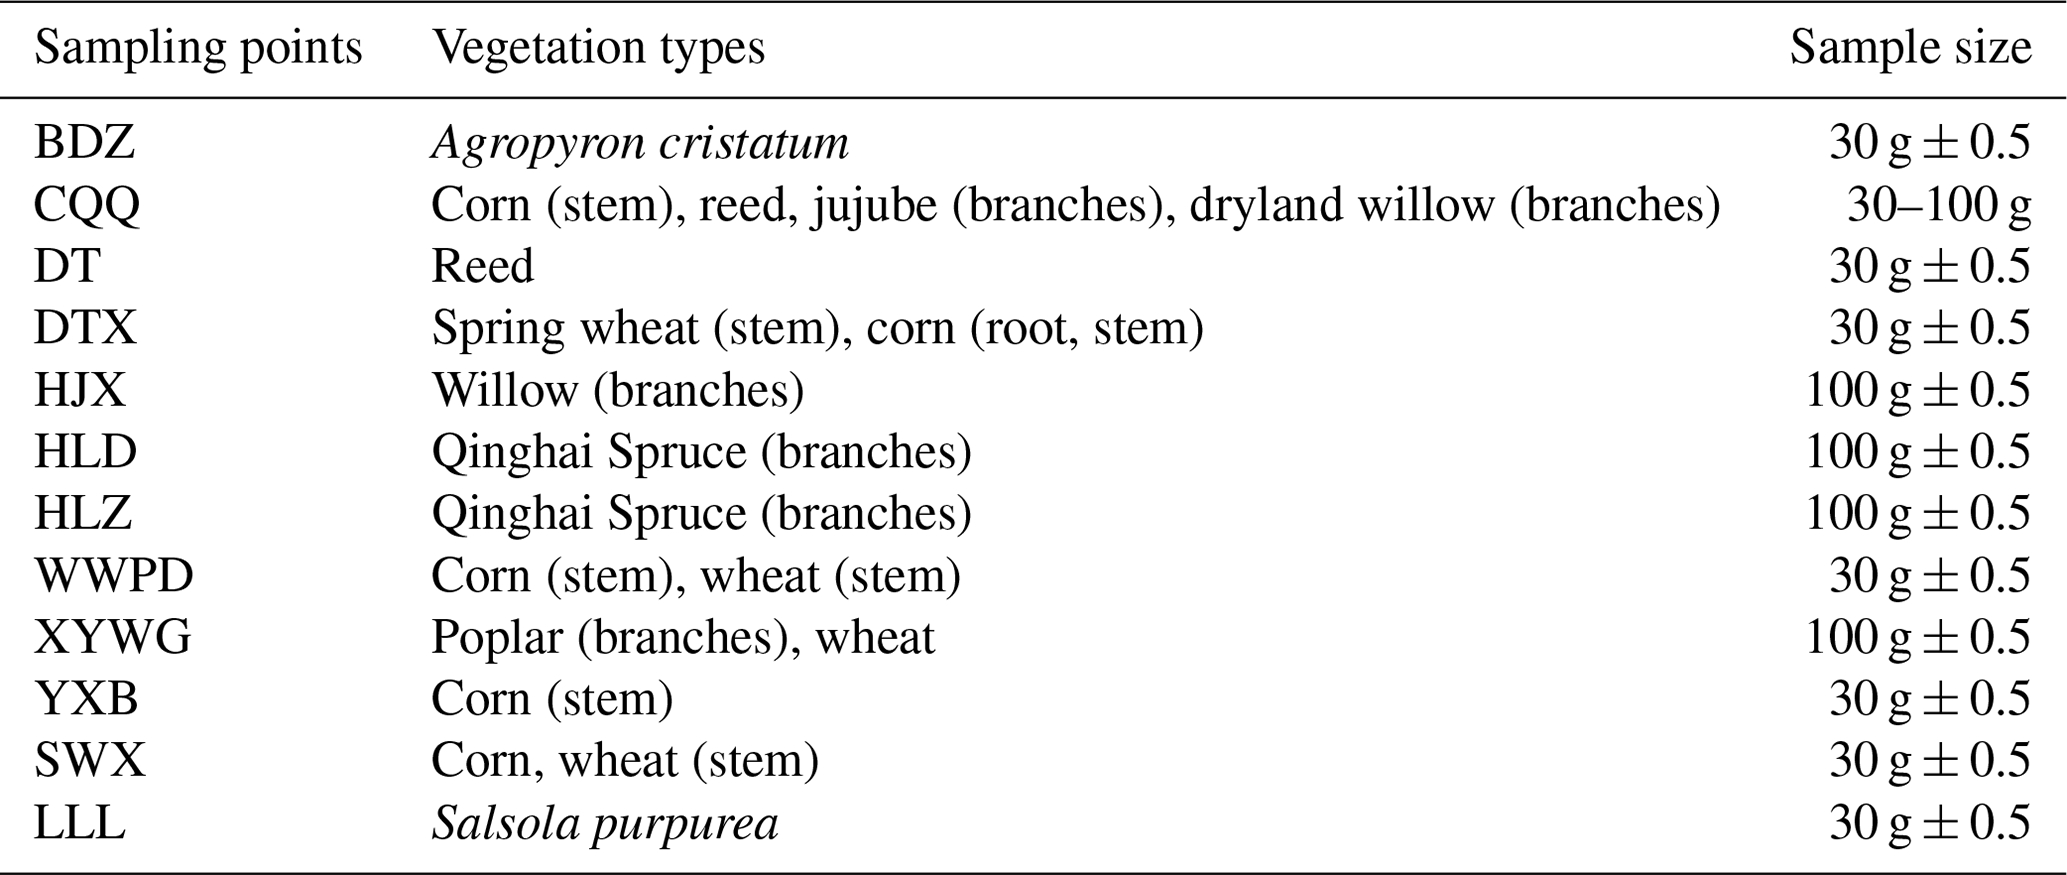
For trees and shrubs we collect stems, and for herbs we collect non-green parts at the junction of rhizomes. When sampling, we use scissors to collect vegetation stems, peel off the bark, put them in 50 mL glass bottles, and freeze them until experimental analysis. Table 2 shows the plant information.
4.1.4 Collection of meteorological data
The local meteorological data were obtained by the automatic weather stations (watchdog 2000 series weather stations) erected near the sampling plot. Meteorological data include temperature (∘C), relative humidity (%), atmospheric pressure (hPa), dew point temperature (∘C), and precipitation (mm).
4.2 Data quality
For meteorological and hydrological data, we use Mann–Kendall (MK) to test, eliminate outliers, and use interpolation to fill in the missing values. We use a liquid water isotope analyser (LWIA) post analysis to detect the original isotope data. The LWIA software can automatically check the instrument's fault prompts and provide a batch of optional data-filtering methods. Through LWIA, we can know which original data values of samples are wrong and need to be tested again, and we can see the cause of the data error. At the same time, we will also use SPSS software to check the normality of the obtained isotope data. At present, the impact on data quality mainly comes from the aspects discussed below.
4.2.1 Sample collection
When collecting precipitation samples, the precipitation was not transferred to the high-density sample bottle immediately, resulting in the enrichment of δ2H and δ18O.
For vegetation samples, the error is mainly from the samples' collection process. If the sampling time is too long, the contact time between vegetation and air becomes longer, which causes evaporation of vegetation water.
For soil samples, the error is that we collected soil samples that contained many microorganisms. The influence of soil microbial activities on the results of extracted water isotopes is poorly understood. When isotope values are measured by isotope mass spectrometry, the increased CO2 concentration released during bacterial growth leads to further errors.
4.2.2 Experiment
The experimental (Appendix A) error is mainly because we set the same water extraction parameters for samples with different soil characteristics. It is difficult to make post-mortem corrections for soil properties or the effects of extraction conditions because such information is rarely reported, and massive variability in method details is common (Walker et al., 1994). In addition, there are still measurement uncertainties in the process of water extraction, which also come from the loss of water vapour and the non-temperature heating temperature during the vacuum of the extraction system.
We only consider methanol and ethanol pollution in the calibration of plant sample data, but the plant and soil water extracts may contain various other pollutants. In addition, studies have shown that the mismatch between xylem and plant-water sources is due to the fractionation of isotopes in the process of water absorption (Poca et al., 2019), which questioned the fact that plants did not undergo fractionation during the process of water absorption (Porporato, 2001; Meissner et al., 2014) according to this traditional view. However, there is no better solution, so we still use traditional methods to collect samples and conduct experiments.
4.3 Data set
4.3.1 Meteorological and hydrological data set
The obtained meteorological data include temperature (∘C), relative humidity (%), air pressure (hPa), dew point temperature (∘C), and precipitation (mm). We store the obtained weather data in the corresponding weather station file. The obtained hydrological data include annual runoff (m3 s−1), daily average flow (m3 s−1), daily average water level (m), and the inflow of Qingtu lake and its change.
4.3.2 Stable water isotope data set
Firstly, we conducted field sampling to obtain samples of different water bodies. According to the samples' types, they can be divided into two categories: precipitation, river water, lake water, and groundwater can be directly tested after filtration, while soil and vegetation samples need to be condensed in a vacuum and extracted to separate the water in soil and vegetation for testing and analysis. The assembly of the data set relies mainly on the monitoring data and instrument-tested data. The extraction apparatus used is BJJL-2200 fully automatic vacuum condensation extraction system. The analysis instrument is LWIA-24D (Appendix C, Fig. C3). We use LIMA to test the original data produced by the analyser. If the data pass the detection of the software, they can be included in the data set. If the data do not pass the detection of the software, we need to reuse the analyser for analysis until the data pass the detection of the software. We use the MK test to eliminate abnormal meteorological and hydrological data. The stable isotope data set as well as the meteorological and hydrological data set are combined into one data set (Fig. 2).
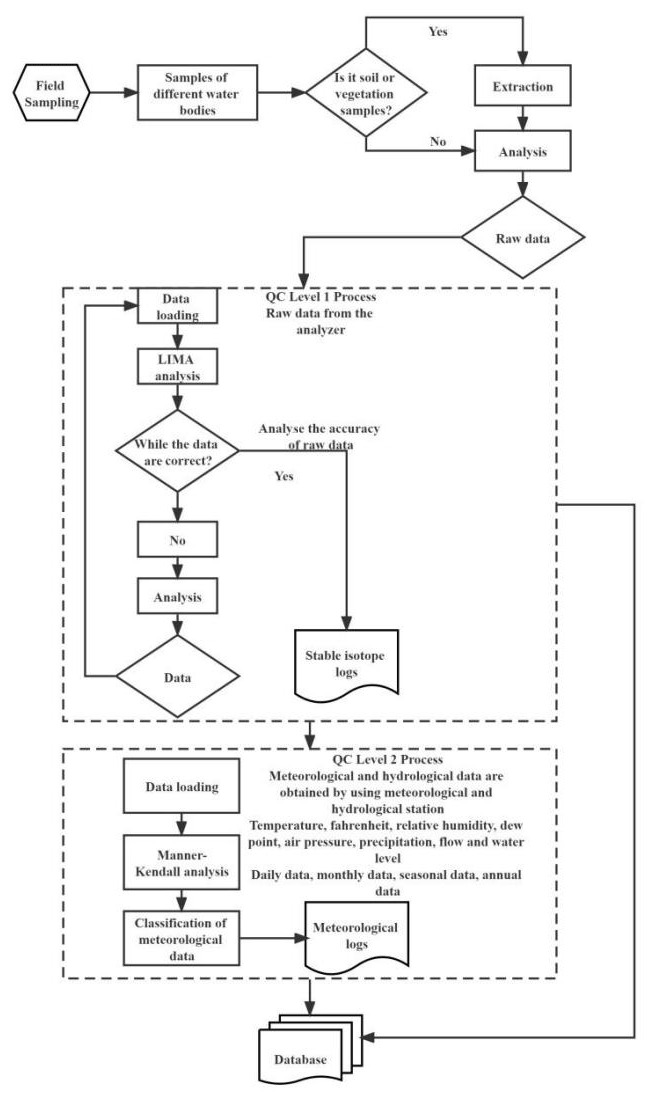
Figure 2Extraction, analysis of the instrument and data set production
process. Note the denotation of the following:
![]() – database,
– database,
![]() – data set,
– data set,
![]() – judgement,
– judgement,
![]() – action plan, and
– action plan, and
![]() – preparatory work.
– preparatory work.
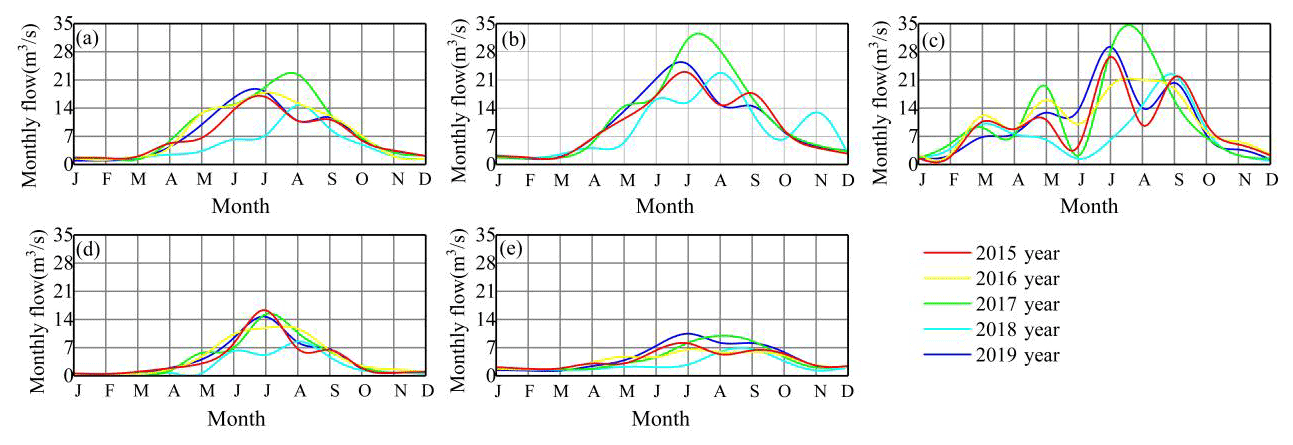
Figure 3Changes in the monthly average flow of five hydrological stations in the Shiyang River basin: (a) Miscellaneous Wood Temple, (b) JTL, (c) CQQ, (d) Nanying Reservoir, and (e) Huangyang River Reservoir.
5.1 Changes in runoff
Runoff is an essential part of the water cycle (Amorocho, 1968; Emori et al., 1996; Wang et al., 2009). The flow has obvious seasonal changes, with a large flow in summer and a small flow in winter (Fig. 3). However, CQQ's flow changes are more complicated. As the downstream marker station, the cross-section runoff changes of CQQ directly reflect the intensity of interference to human activities in the middle reaches. The flow of CQQ dropped sharply in June, followed by a sharp decline in April due to the agricultural water diversion for irrigation from April to June. According to Table 4, we can see that the average annual flow of JTL in the upper reaches of the Shiyang River basin is the largest (10.07 m3 s−1), while that of the Huangyang River Reservoir is the smallest (3.86 m3 s−1), reflecting the spatial characteristics that the average annual flow of hydrological stations in Shiyang River basin gradually decreases from west to east and from south to north.
The annual dispersion coefficient of flow can characterize the relative change trend between inter-annual changes in regional flow (Hernández-Carrasco et al., 2012). According to Table 3, we can see that the variation range of the dispersion coefficient of discharge at the five hydrological stations in the Shiyang River basin is 0.03–0.11, indicating that the inter-annual variation of the Shiyang River is relatively large. Among them, CQQ has the largest dispersion coefficient of 0.11, which is related to the strong interference of CQQ by human activities (Liu et al., 2013; Liang et al., 2017).
Table 3Inter-annual variation of flow in the Shiyang River basin.
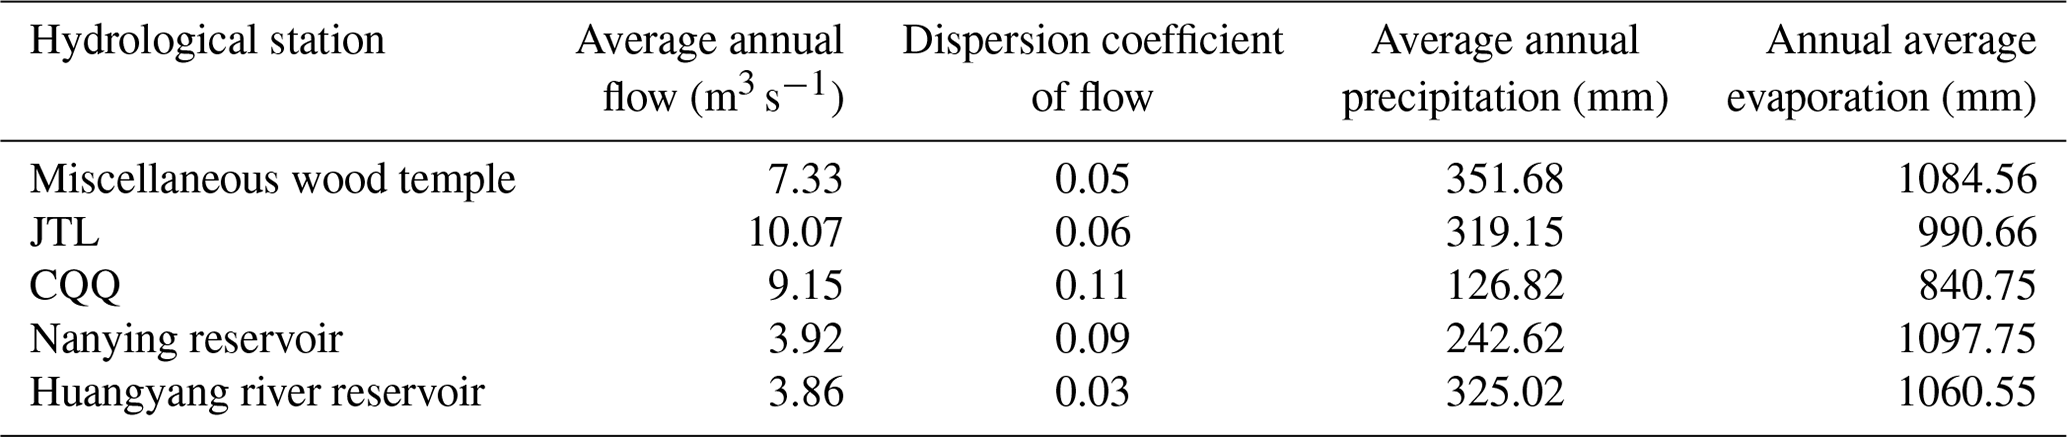
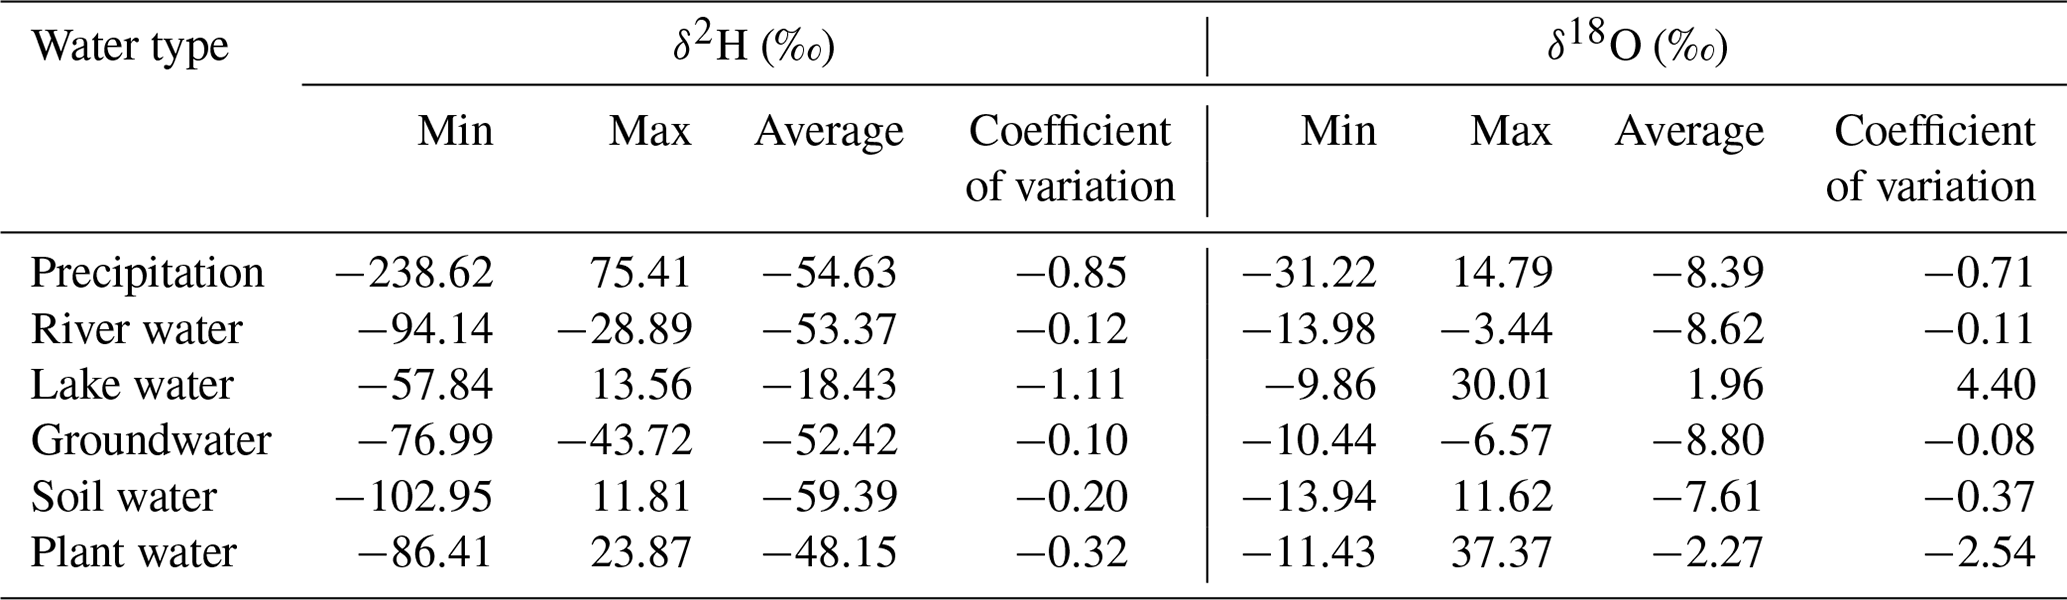
Table 4Comparison of δ2H and δ18O in different water bodies in the Shiyang River basin.
5.2 Stable isotopes characteristics of different water bodies
In the catchment dominated by precipitation, the seasonal difference between δ2H and δ18O values is large (Anderson, 2011).The changes of δ2H and δ18O in different water bodies are roughly the same, showing good consistency in all present seasonal changes (Fig. 4). The variation of isotopes of river water, lake water, and groundwater lags behind that of precipitation, which is related to the time difference between surface runoff and underground runoff formed by precipitation. Precipitation δ2H and δ18O change in a cosine shape with time. That is, they are depleted in winter and spring and enriched in summer and autumn. This is related to the dilution of precipitation in winter and spring and strong evaporation in summer and autumn (Florea and Mcgee, 2010). Precipitation δ2H and lake water δ2H have large variability (the absolute value of the coefficient of variation is 0.82 and 0.7, respectively), and the precipitation δ18O and plant water δ18O have large variability (the absolute value of the coefficient of variation is 0.69 and 0.91, respectively). The strong evaporation of lake water in summer and the weak evaporation in other seasons make the seasonal fluctuations of lake water isotopes large. The plant water also has strong seasonal fluctuations in the isotope of plant water due to the strong transpiration in summer.
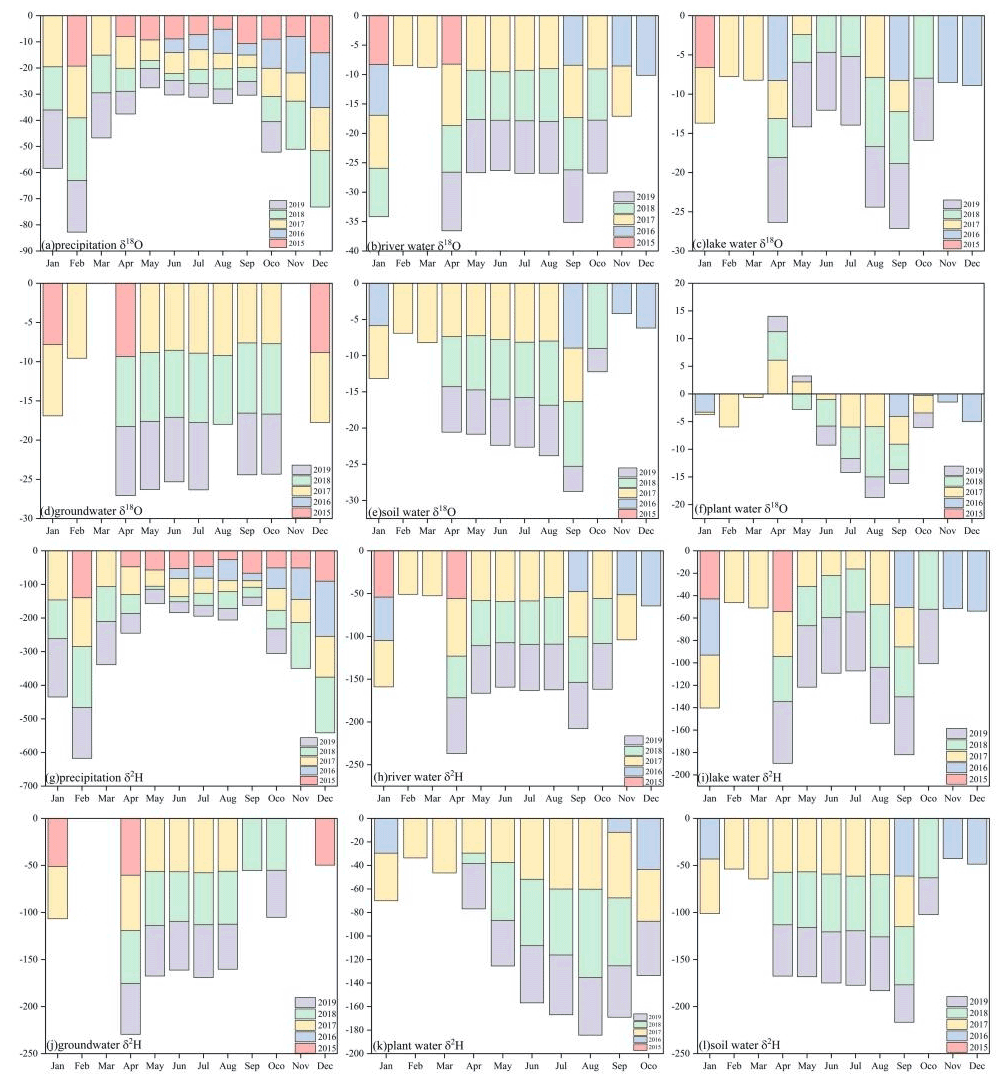
Figure 4Distribution of different hydrological compartments' δ2H and δ18O in the Shiyang River basin from 2015 to 2020.
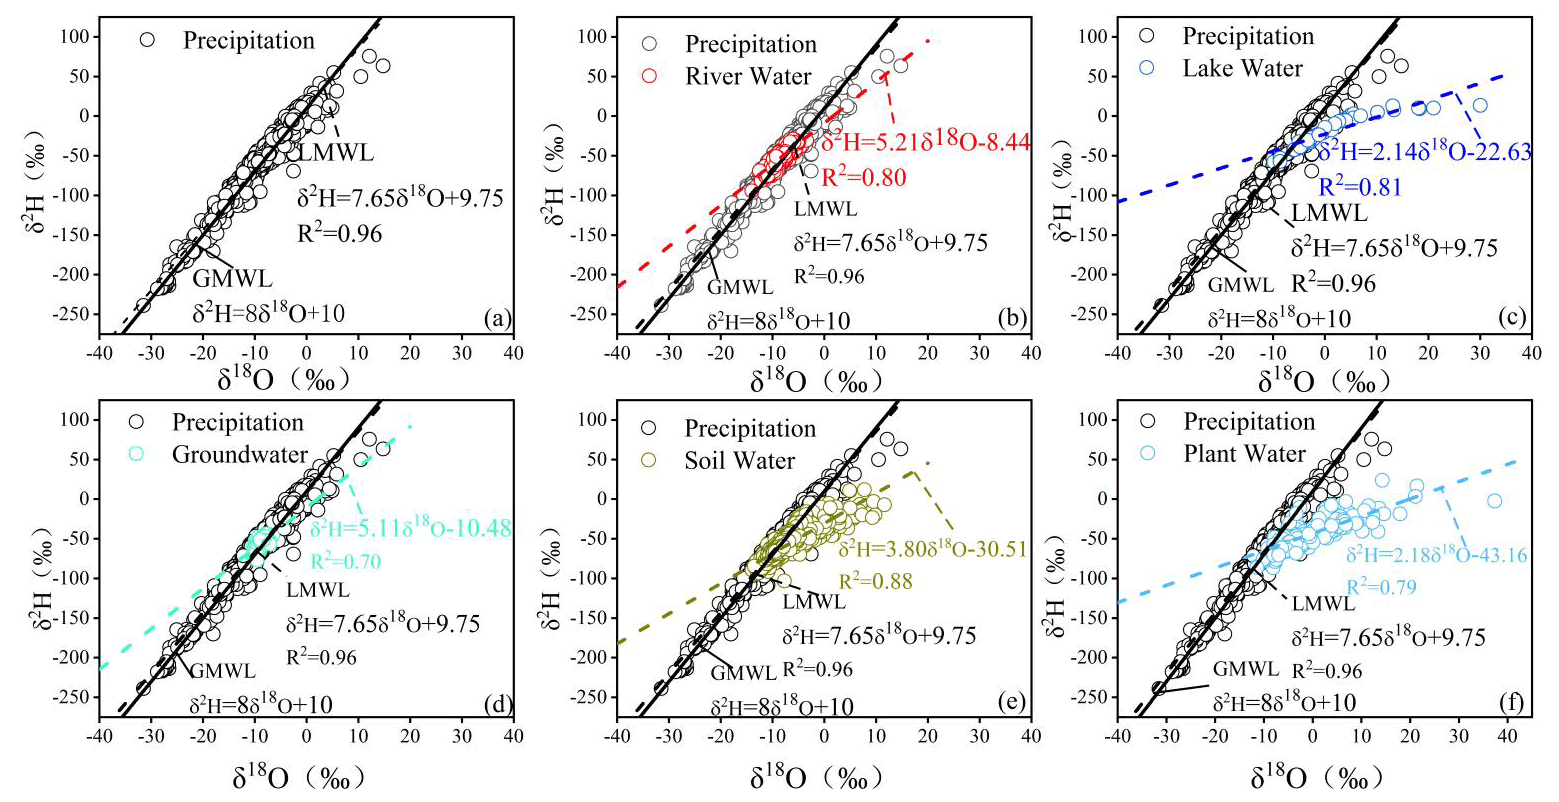
Figure 5The change of δ2H and δ18O in different hydrological compartments in the Shiyang River basin is (a) precipitation, (b) precipitation and river water, (c) precipitation and lake water, (d) precipitation and groundwater, (e) precipitation and soil water, and (f) precipitation and plant water.
5.3 Connections between different bodies of water
We used the least squares method to obtain the local meteoric water line equation (LMWL): , its slope and intercept are smaller than those of GMWL, but δ2H and δ18O maintain a good linear relationship (R2=0.96), which is related to the geographical location of the study area (Fig. 5). The Shiyang River basin is located inland of Northwest China, and it is subject to intense below-cloud evaporation, making the slope and intercept relatively small (Zhu et al., 2021d). Moreover, it reflects the existence of a stable isotope unbalanced fractionation effect under the arid climate background.
Precipitation, river water, lake water, groundwater, soil water, and plant water are distributed near GMWL, indicating that they share the same water source. The deviation of the lake from GMWL indicates that it experienced intense evaporation. By comparing the slope and intercept of the relation expressions δ2H and δ18O of GMWL and different water bodies, it can be seen that, as far as the slope is concerned, precipitation is the highest (7.65), followed by groundwater (5.11), and lake water is the lowest (2.14). There is little difference between the slope of precipitation and groundwater, which means there is a mutual recharge relationship. In terms of intercept (d), the precipitation was the highest (d=9.75), followed by the river (). The light isotopes evaporate preferentially when the water body evaporates in the unsaturated atmosphere (Worden et al., 2007). The combined effect of the dynamic fractionation effect of the river accelerates the ratio of the δ2H and δ18O fractionation effects in the evaporated water vapour, resulting in an increase in d in the water vapour and a decrease in d in the remaining water body. The average value of δ2H and δ18O of soil water is between plant water and precipitation, but closer to precipitation (Table 4), indicating that the soil is mainly recharged by precipitation. In the δ2H and δ18O equations of precipitation, lake water, soil water, river water, plant water, and groundwater, R2 decreases in turn, and the linear relationship between δ2H and δ18O becomes smaller and smaller. These phenomena indicate that different water bodies have different degrees of mutual complementarity. Among them, soil water is the most miscible and is supplied by multiple water sources.
The correlation coefficient between δ2H and δ18O of lake water, groundwater, and plant water is relatively low. The evaporation of lake water in summer is particularly intense (Salmaso and Decet, 1997), which leads to a great difference in winter and summer. The stable isotopic value of lake water varies significantly in different seasons, leading to a small correlation coefficient between them. The main recharge source of groundwater and plant water is precipitation. It takes a certain time for precipitation to converge into surface water and groundwater, leading to isotopic fraction, resulting in a small correlation coefficient between δ2H and δ18O of the two water bodies.
The data that support the findings of this study are openly available at https://doi.org/10.17632/vhm44t74sy.1 (Zhu, 2022).
From 2015 to 2020, we took the Shiyang River basin, which has the highest utilization rate of water resources and the most prominent contradiction of water use, as a typical demonstration basin to establish and improve the isotope hydrology observation system. We collected 6756 stable water isotope data, which were compiled into a data set along with meteorological and hydrological data. Through the analysis, we know the following:
-
The slope and intercept of LMWL in the Shiyang River basin are both smaller than GMWL, indicating that there is an obvious below-cloud evaporation effect in the Shiyang River Basin.
-
The main source of runoff recharge in the Shiyang River basin is precipitation, and the proportion of snowmelt water and groundwater is relatively low.
-
The accumulation degree of stable isotopes in the reservoir is greater than that in other surface waters, indicating that the reservoir construction has changed the original natural evaporation pattern of the basin.
This data set provides a new basis for studying the stable water isotopes of different water bodies in the inland river basins.
Due to systematic error, there are some errors in isotopic measurement results. However, the observation accuracy is affected by the operation characteristics of the instrument and the sensitivity difference of moisture to specific spectral absorption, and the observation results usually have obvious nonlinear response problems. Therefore, the data measured under the current level of technology are highly reliable, but a lot of experiments are still needed.
A1 Experiment analysis
A1.1 Water extraction experiment
We use vacuum condensation to extract the water from soil and plants. The extraction equipment is LI-2100 automatic vacuum condensation extraction equipment. Before water extraction, the soil and plant samples need to be taken out of the refrigerator to thaw, and each sample bottle should be stuffed with a small ball of cotton to prevent the water from evaporating. When extracting water, we set the extraction time to 150 min (180 min for plants), the temperature to 190 ∘C, the upper limit of the vacuum pressure to 800 Pa, and the leakage rate to 0. The water evaporates from the soil or plant sample by heating it for a specified time and then freezes it in a liquid nitrogen cold trap. After the extraction, the sample is thawed at room temperature, and then we use a 1 mL syringe to extract the water sample into a labelled sample bottle, seal it, and wait for the isotope experiment.
A1.2 Isotope analysis
All the water samples were analysed in the stable isotope laboratory of the Northwest Normal University using liquid water isotope analysis (DLT-100, Los Gatos Research, USA). Each water sample and isotope standard samples were injected six times in a row. To eliminate the instrument memory effect, we discarded the first two injections and used the average of the last four times as the final result. The result of the isotope measurement is expressed by the symbol “δ” and expressed in thousandths of the difference relative to the Vienna Standard Mean Ocean Water (VSMOW; Craig, 1961):
where Rsample is the ratio of or in the collected sample, Rv-smow is the ratio of or in the Vienna standard sample. The analytical accuracy of δ2H and δ18O are ±0.6 ‰ and ±0.2 ‰, respectively.
A2 Calibration of plant water isotope data
If the water sample contains compounds with the same wavelength absorption characteristics, it will lead to the measurement error of the laser liquid water analyser. The most error-causing contaminants are methanol and ethanol. Therefore, we used deionized water and different concentrations of pure methanol and ethanol, combined with Los Gatos LWIA-Spectral Contamination Identifier (SCI) V1.0 software, to measure the pollution degree of methanol (NB) and ethanol (BB). The δ2H and δ18O correction methods for pollution spectra were established (Brand et al., 2009; West et al., 2010). Correction results for methanol and its broadband measurements of NB logarithmic metric with Δδ2H and Δδ18O are significantly quadratic curve relationships, and the relationship is as follows:
For the broadband measurements of ethanol correction results in BB metric and Δδ2H and Δδ18O, a quadratic curve and linear relationship respectively, is
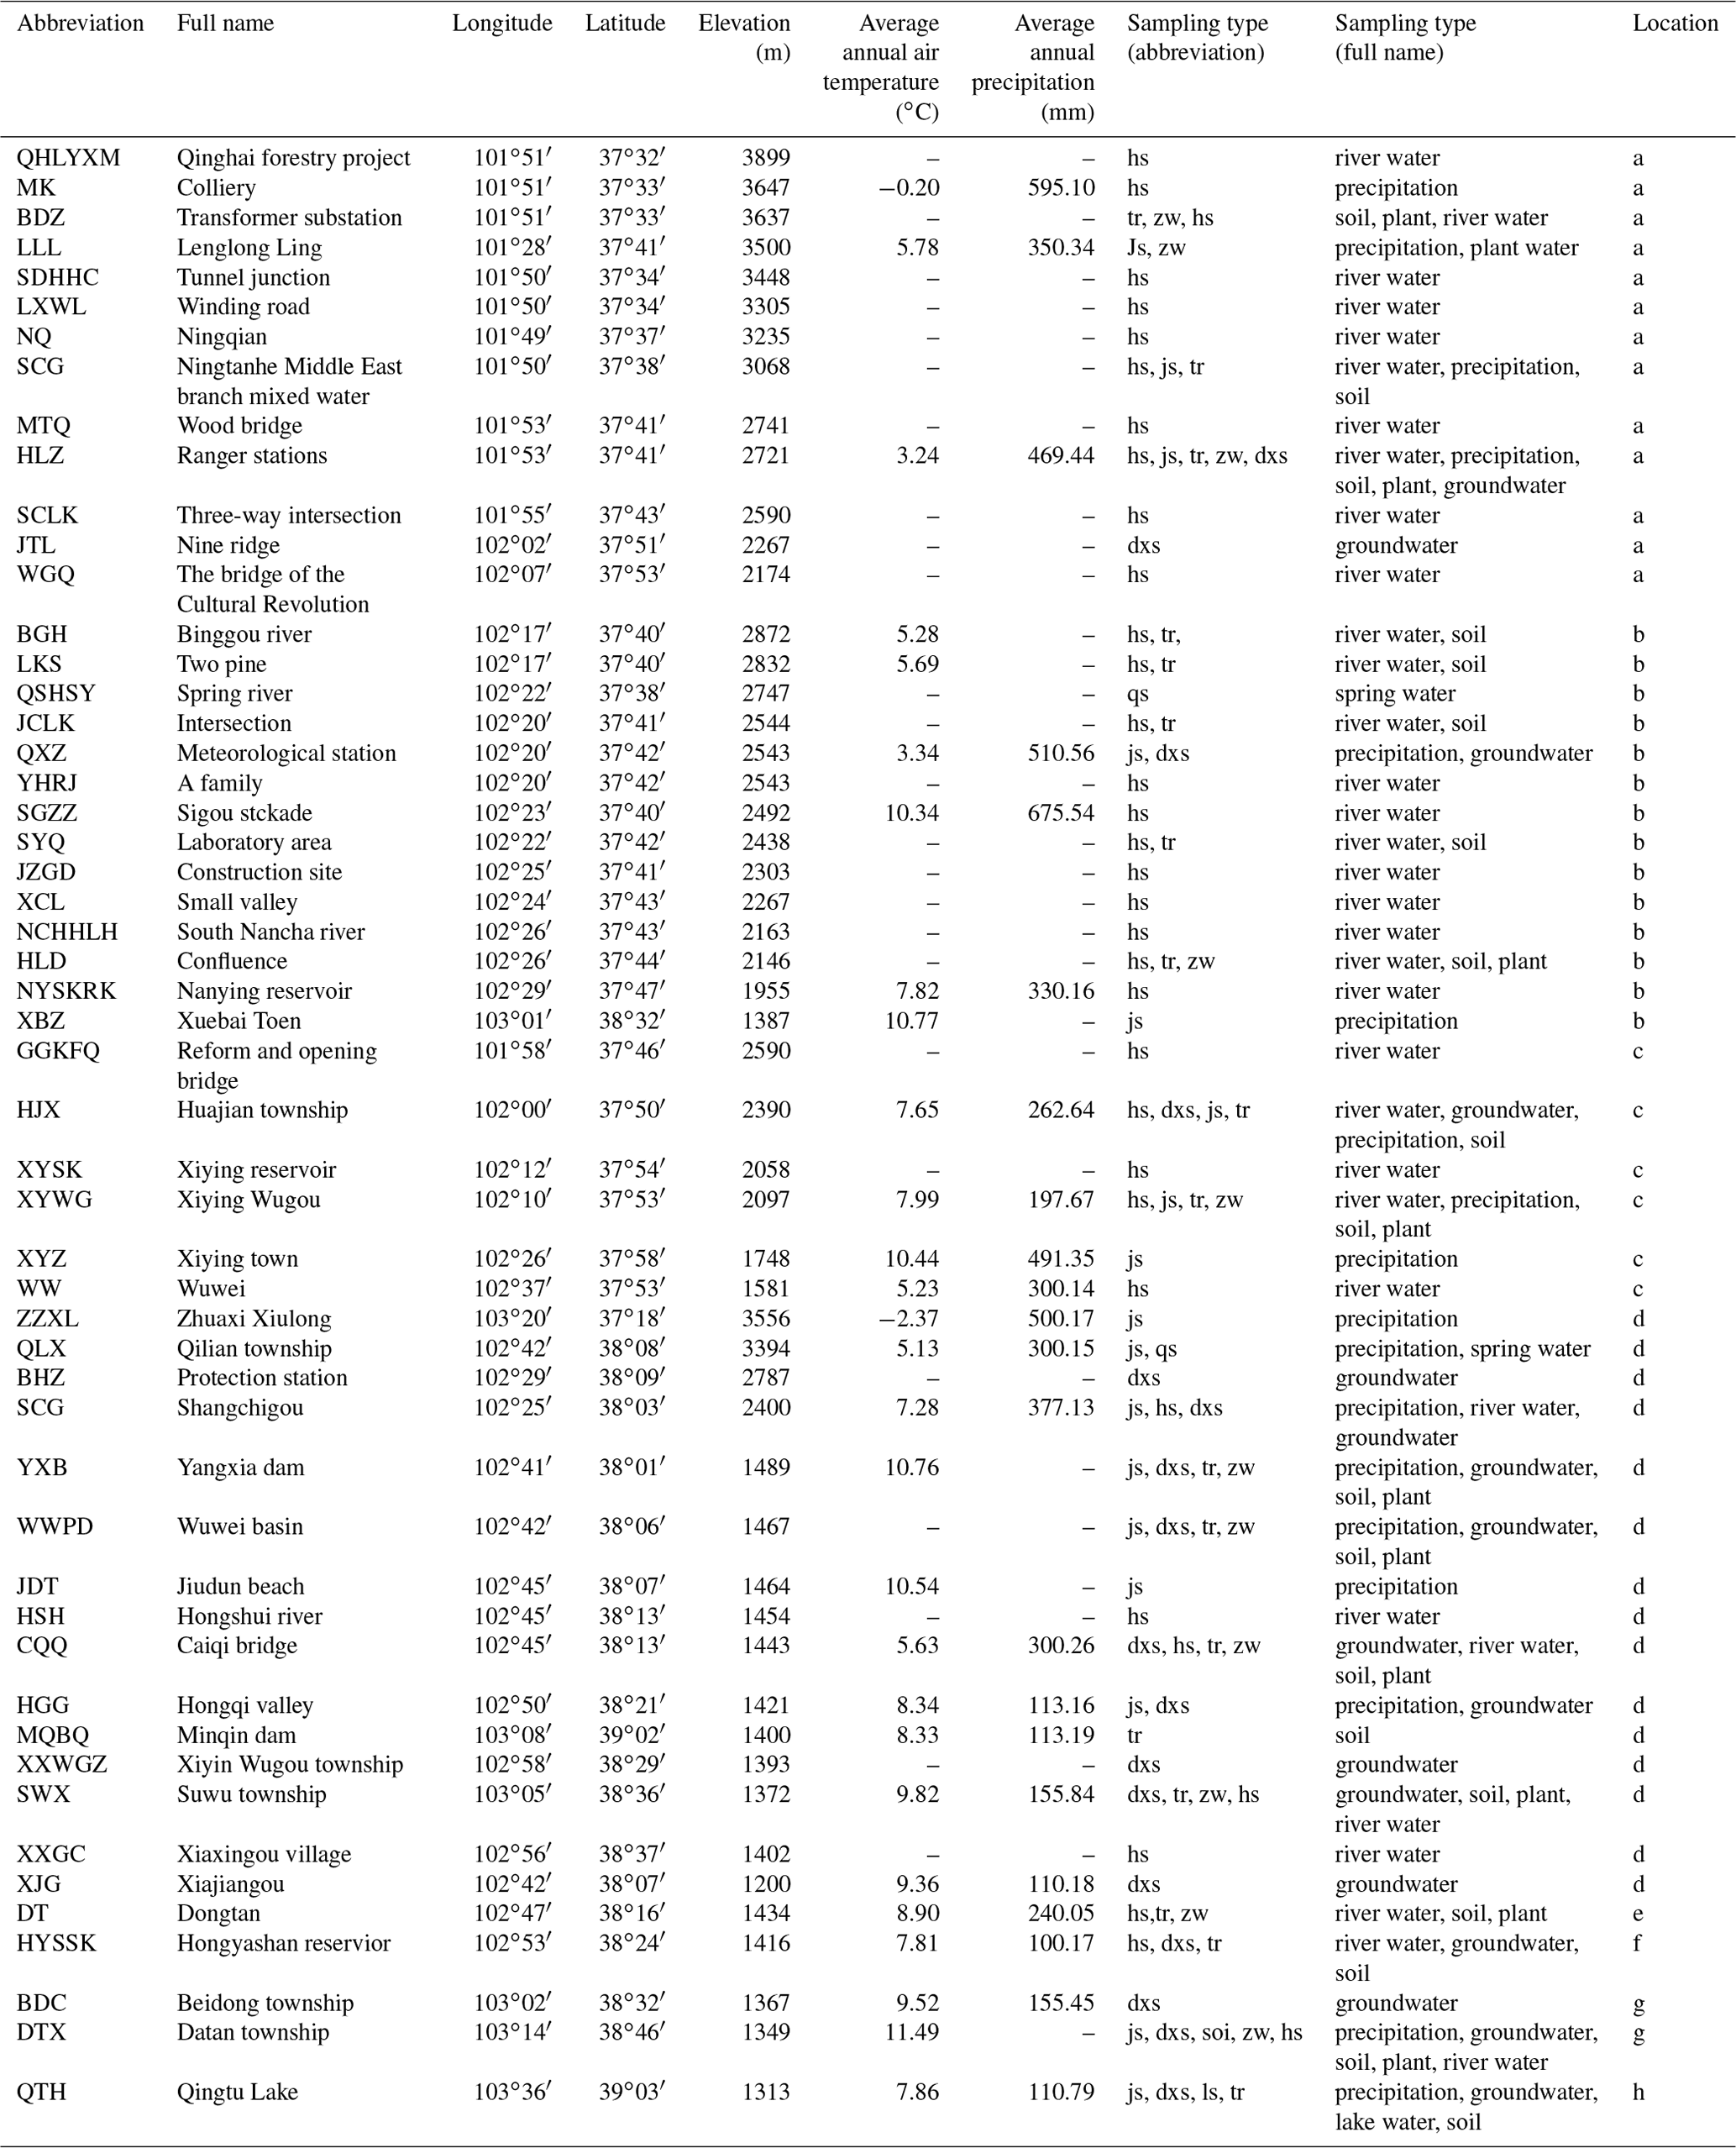
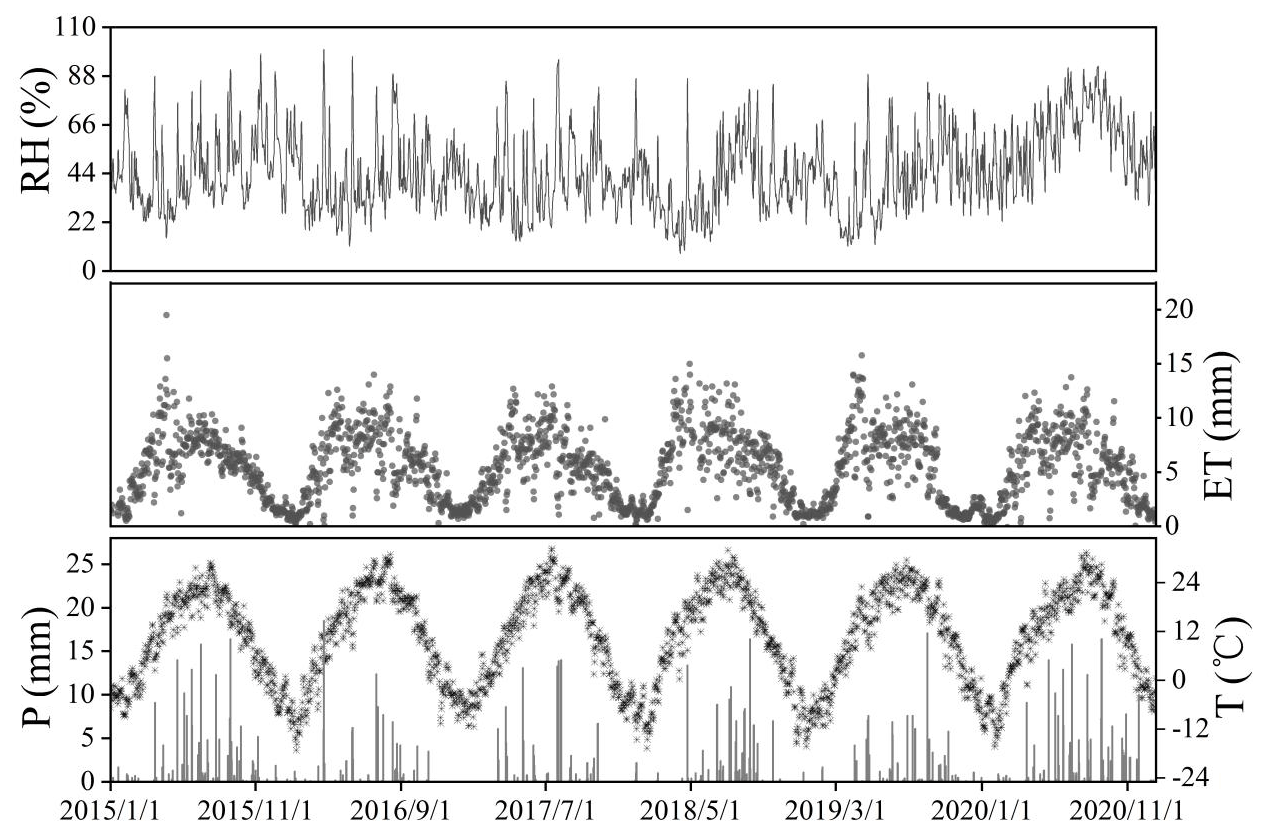
Figure C1Variation of meteorological parameters over time in the Shiyang River basin: relative humidity (RH), evapotranspiration (ET), precipitation (P), and temperature (T).
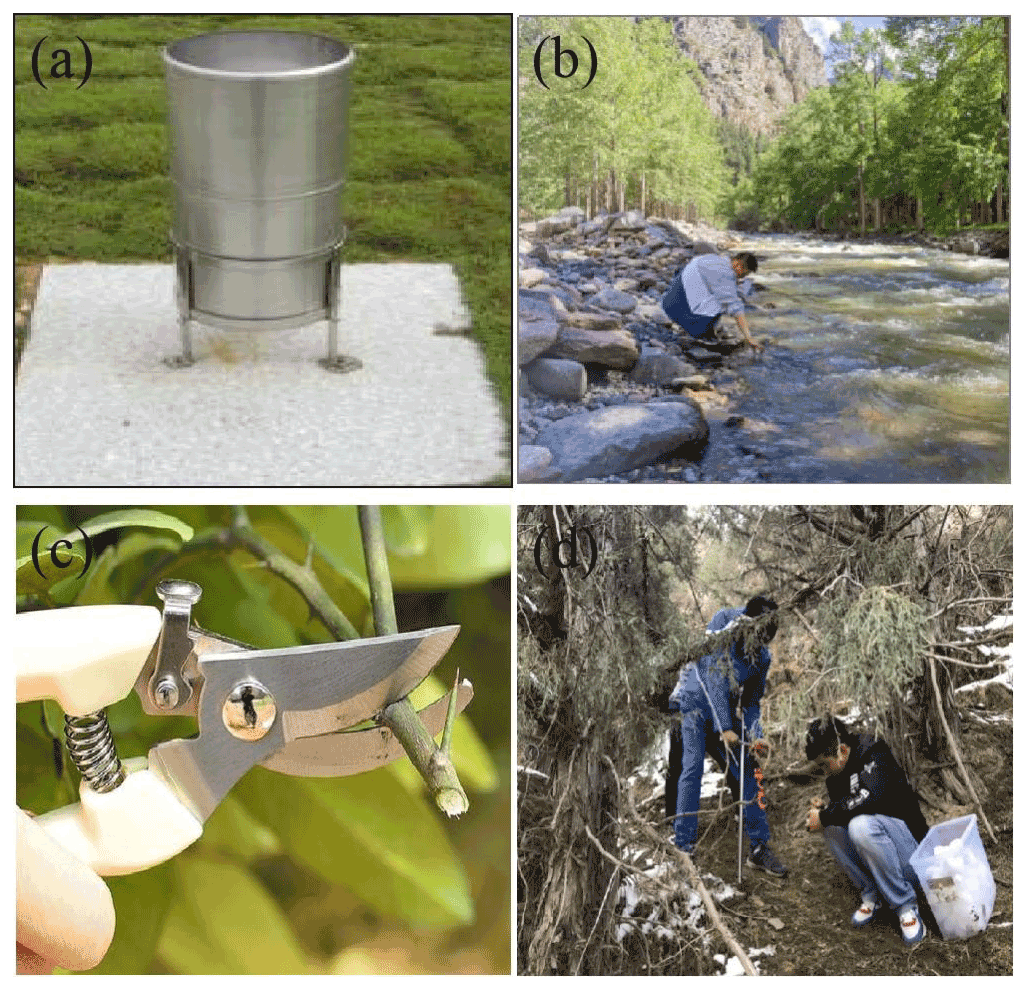
Figure C2Sampling instruments: (a) rain gauge collecting precipitation, (b) surface water sampling, (c) sampling shears collecting vegetation stems, and (d) earth drill collecting soil samples.
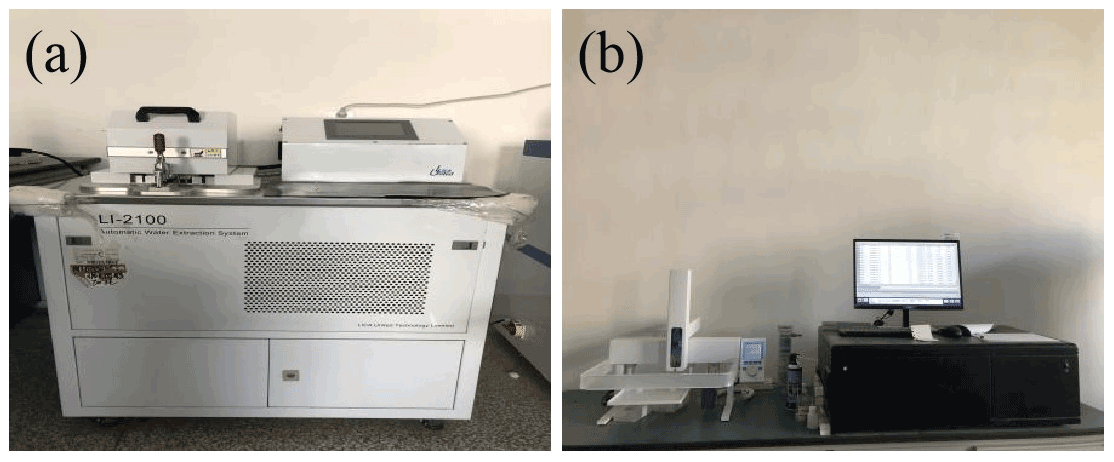
Figure C3Analytical instruments: (a) Li-2100 automatic vacuum condensation extraction instrument, (b) LWIA-24D liquid water isotope analyser.
GZ and YuwLiu conceived the idea of the study; GZ, PS, WJ, and JJZ set up the observation system; XM, HP, YZ, ZZ, and LY were responsible for field sampling; ZS participated in the experiment; KZ and YuaLiu participated in the drawing; YuaLiu wrote the paper. All authors discussed the results and revised the manuscript.
The contact author has declared that none of the authors has any competing interests.
Publisher's note: Copernicus Publications remains neutral with regard to jurisdictional claims in published maps and institutional affiliations.
The authors thank the colleagues in the Northwest Normal University for their help in fieldwork, laboratory analysis, and data processing.
This research has been supported by the National Natural Science Foundation of China (grant nos. 41867030, 41971036, 41661005).
This paper was edited by Attila Demény and reviewed by two anonymous referees.
Alam, S., Gebremichael, M., Li, R., Dozier, J., and Lettenmaier, D. P.: Climate change impacts on groundwater storage in the central valley, California, Climatic Change, 157, 387–406, https://doi.org/10.1007/s10584-019-02585-5, 2019.
Amorocho, J.: Reply to “Discussion on Paper by J. Amorocho, `The Nonlinear Prediction Problem in the Study of the Runoff Cycle' ”, Water Resour. Res., 4, 861–880, https://doi.org/10.1029/WR004i003p00686, 1968.
Anderson, L.: Holocene record of precipitation seasonality from lake calcite δ18O in the central Rocky Mountains, United States, Geology, 39, 211–214, https://doi.org/10.1130/G31575.1, 2011.
Arheimer, B., Donnelly, C., and Lindstrom, G.: Regulation of snow-fed rivers affects flow regimes more than climate change, Nat. Commun., 8, 62, https://doi.org/10.1038/s41467-017-00092-8, 2017.
Bowen, G. J., Kennedy, C. D., Henne, P. D., and Zhang, T. L.: Footprint of recycled water subsidies downwind of Lake Michigan, Ecosphere, 3, 1–16, https://doi.org/10.1890/ES12-00062.1, 2012.
Brand, W. A., Geilmann, H., Crosson, E. R., and Rella, C. W.: Cavity ring-down spectroscopy versus high-temperature conversion isotope ratio mass spectrometry; a case study on δ2H and δ18O of pure water samples and alcohol/water mixtures, Rapid Commun. Mass Sp., 23, 1879–1884, https://doi.org/10.1002/rcm.4083, 2009.
Burns, S. J., Matter, A., Frank, N., and Mangini, A.: Speleothem-based paleoclimate record from northern Oman, Geology, 26, 499–502, https://doi.org/10.1130/00917613(1998)026$<$0499:SBPRFN$>$, 1998.
Chen, Y. N., Li, Z., Fang, G. H., and Deng, H. J.: Research on the impact of climate change on water resources in Tianshan Mountains in Central Asia, Acta Geographica Sinica, 72, 9, 2017.
Craig, H.: Isotopic variation in meteoric waters, Science, 133, 1702–1703, https://doi.org/10.1126/science.133.3465.1702, 1961.
Dansgaard, W.: Stable isotopes in precipitation, Tellus, 16, 436–468, https://doi.org/10.1111/j.2153-3490.1964.tb00181.x, 1964.
Emori, S., Abe, K., Numaguti, A., and Mitsumoto, S.: Sensitivity of a Simulated Water Cycle to a Runoff Process with Atmospheric Feedback, J. Meteorol. Soc. Jpn., 74, 815–832, https://doi.org/10.2151/jmsj1965.74.6_815, 1996.
Florea, L. J. and Mcgee, R. K.: Stable isotopic and geochemical variability within shallow groundwater beneath a hardwood hammock and surface water in an adjoining slough (Everglades National Park, Florida, USA), Isotopes Environ. Health Stud., 46, 190–209, https://doi.org/10.1080/10256016.2010.494770, 2010.
Gat, J. R.: Oxygen and hydrogen isotopes in the hydrologic cycle, Annu. Rev. Earth Pl. Sc., 24, 255–262, https://doi.org/10.1146/ANNUREV.EARTH.24.1.225, 1996.
Gibson, J. J., Birks, S., and Yi, Y.: Stable isotope mass balance of lakes: a contemporary perspective, Quaternary Sci. Rev., 131, 316–328, https://doi.org/10.1016/j.quascirev.2015.04.013, 2016.
Grill, G., Lehner, B, Lumsdon, A. E., Macdonald, G. K., Zarfl, C., and Reidy, L. C.: An index-based framework for assessing patterns and trends in river fragmentation and flow regulation by global dams at multiple scales, Environ. Res. Lett., 10, 015001, https://doi.org/10.1088/1748-9326/10/1/015001, 2015.
Gu, W. Z.: Using environmental isotopes and hydrological experiments to study runoff generation methods in catchment areas, J. Hydraul. Eng., 5, 9–17, 1995.
Gudkov, A. V., Tokarev, I. V., and Tolstikhin, I. N.: The formation and balance of the atmospheric precipitations, surface water, and groundwater on the southern slopes of the khibiny massif (based on data on the isotopic composition of oxygen and hydrogen), Water Resour., 48, 124–132, https://doi.org/10.1134/S0097807821010164, 2021.
Haig, H. A., Hayes, N. M., Simpson, G. L., Yi, Y., Wissel, B., Hodderf, K. R., and Leavitt, P. R.: Effects of seasonal and interannual variability in water isotopes (δ2H, δ18O) on estimates of water balance in a chain of seven prairie lakes, J. Hydrol. X, 10, 100069, https://doi.org/10.1016/j.hydroa.2020.100069, 2020.
Helland, A.: The Importance of Selective Transport and Sedimentation in Trend Monitoring of Metals in Sediments. An Example from the Glomma Estuary, East Norway, Water Air Soil Poll., 126, 339–361, https://doi.org/10.1023/A:1005243728540, 2001.
Hernández-Carrasco, I., López, C., Hernández-García, E., and Turiel, A.: Seasonal and regional characterization of horizontal stirring in the global ocean, J. Geophys. Res.-Oceans, 117, C10007, https://doi.org/10.1029/2012JC008222, 2012.
Kottek, M., Grieser, J., Beck, C., Rudolf, B., and Rubel, F.: World map of the Köppen-Geiger climate classification updated, Hydrol. Earth Syst. Sc., 11, 259–263, https://doi.org/10.1127/0941-2948/2006/0130, 2006.
Kralik, M., Papesch, W., and Stichler, W.: Austrian Network of Isotopes in Precipitation (ANIP): Quality assurance and climatological phenomenon in one of the oldest and densest networks in the world, Isotope Hydrology and Integrated, Water Resour. Manag., 23, 146–149, 2004.
Lavelle, P., Rodríguez, N., Arguello, O., Bernal, J., Botero, C., Chaparro, P., Gómez, Y., Gutiérrez, A., del Pilar Hurtado, M., Loaizaa, S., Pullidoc, S. X., Rodríguez, E., Sanabriaa, C., Velásquez, E., and Fonte, S. J.: Soil ecosystem services and land use in the rapidly changing Orinoco River Basin of Colombia, Agr. Ecosyst. Environ., 185, 106–117, https://doi.org/10.1016/j.agee.2013.12.020, 2014.
Li, L. and Garzione, C. N.: Spatial distribution and controlling factors of stable isotopes in meteoric waters on the Tibetan Plateau: implications for paleoelevation reconstruction, Earth Planet. Sc. Lett., 460, 302–314, https://doi.org/10.1016/j.epsl.2016.11.046, 2017.
Li, Z., Li, X. Y., and Sun, J.: Impact of Climate Change on Water Resources in the Shiyang River Basin and the Adaptive Measures for Energy Conservation and Emission Reduction, Appl. Mech. Mater., 405–408, 2167–2171, https://doi.org/10.4028/www.scientific.net/AMM.405-408.2167, 2013.
Liang, B. B., Shi, P. J., Wang, W., Tang, X., Zhou, W. X., and Jing, Y.: Integrated assessment of ecosystem quality of arid inland river basin based on RS and GIS: A case study on Shiyang River Basin, Northwest China, J. Appl. Ecol., 28, 199–209, https://doi.org/10.13287/j.1001-9332.201701.019, 2017.
Liu, H. M., Shi, P. J., Zhou, J. J., Liu, H., and Sun, H.: Characteristics and influencing factors of runoff consumption in the midstream of Shiyang river, Prog. Geogr., 32, 87–94, https://doi.org/10.3724/SP.J.1033.2013.00087, 2013.
Ma, H. Y., Zhu, G. F., Zhang, Y., Pan, H. X., Guo, H. W., Jia, W. X., Zhou, J. J., Yong, L. L., and Wan, Q. Z.: The effects of runoff on Hydrochemistry in the Qilian Mountains: a case study of Xiying River Basin, Environ. Earth Sci., 78, 1–10, https://doi.org/10.1007/s12665-019-8384-z, 2019.
Meissner, M., Köhler, M., Schwendenmann, L., Hölscher, D., and Dyckmans, J.: Soil water uptake by trees using water stable isotopes (δ2H and δ18O) a method test regarding soil moisture, texture and carbonate, Plant Soil, 376, 327–335, https://doi.org/10.1007/s11104-013-1970-z, 2014.
Melin, R.: Hydrological regions in Scandinavia and Finland, Hydrol. Res., 1, 5–37, https://doi.org/10.2166/nh.1970.0001, 1970.
Min, Z., Hu, Y., Cheng, Z., Liu, Z., Rui, Y., and Bo, C.: Effects of land cover on variations in stable hydrogen and oxygen isotopes in karst groundwater: a comparative study of three karst catchments in guizhou province, southwest China, J. Hydrol., 565, 374–385, https://doi.org/10.1016/j.jhydrol.2018.08.037, 2018.
Mitrovica, J. X. and Forte, A. M.: A new inference of mantle viscosity based upon joint inversion of convection and glacial isostatic adjustment data, Earth Planet. Sc. Lett., 225, 177–189, https://doi.org/10.1016/j.epsl.2004.06.005, 2004.
Orlowski, N., Breuer, L., and McDonnell, J. J.: Critical issues with cryogenic extraction of soil water for stable isotope analysis, Ecohydrology, 9, 1–5, 2016.
Petterson, S. R., Stenström, T. A., and Ottoson, J.: A theoretical approach to using faecal indicator data to model norovirus concentration in surface water for QMRA: Glomma River, Norway, Water Res., 91, 31–37, https://doi.org/10.1016/j.watres.2015.12.037, 2016.
Ploeg, A.: Jan Pouwer's field research in the Star Mountains, west New Guinea, Oceania, 83, 49–56, https://doi.org/10.1002/ocea.5005, 2013.
Poca, M., Coomans, O., Urcelay, C., Zeballos, S. R., and Boeckx, P.: Isotope fractionation during root water uptake by acacia caven is enhanced by arbuscular mycorrhizas, Plant Soil, 441, 485–497, https://doi.org/10.1007/s11104-019-04139-1, 2019.
Porporato, L.: Plants in water-controlled ecosystems: active role in hydrologic processes and response to water stress, Adv. Water Resour., 24, 725–744, https://doi.org/10.1016/S0309-1708(01)00005-7, 2001.
Qin, D. H. and Thomas, S.: Highlights of the IPCC Fifth Assessment Report by Working Group I, Progress in Climate Change Research, 10, 1–6, 2014.
Risi, C., Bony, S., Vimeux, F., Chong, M., and Descroix, L.: Evolution of the stable water isotopic composition of the rain sampled along Sahelian squall lines, Q. J. Roy. Meteor. Soc., 136, 227–242, https://doi.org/10.1002/qj.485, 2010.
Salmaso, N. and Decet, F.: Seasonal and interannual changes of chemical characteristics and phytoplankton in a mountain lake of the eastern Italian Alps (Lake Calaita, Trentino), Internationale Revue der Gesamten Hydrobiologie und Hydrographie, 82, 15–31, https://doi.org/10.1002/iroh.19970820104, 1997.
Shah, D., Shah, H. L., Dave, H. M., and Mishra, V.: Contrasting influence of human activities on agricultural and hydrological droughts in India, Sci. Total Environ., 774, 144959, https://doi.org/10.1016/j.scitotenv.2021.144959, 2021.
Song, C., Wang, G., Liu, G., Mao, T., Sun, X., and Chen, X.: Stable isotope variations of precipitation and streamflow reveal the young water fraction of a permafrost watershed, Hydrol. Process., 31, 935–947, https://doi.org/10.1002/hyp.11077, 2017.
Sun, X., Chen, J., Shi, G., Tan, H., and Su, Z.: Hydrogen and oxygen isotopic variations of different water bodies in evaporation and rainfall infiltration processes, J. Agr. Eng., 28, 100–105, https://doi.org/10.3969/j.issn.1002-6819.2012.04.016, 2012.
Sun, Z. G., Zhu, G. F., Zhang, Z. X., Xu, Y. X., Yong, L. L., Wan, Q. Z., Ma, H. Y., Sang, L. L., and Liu, Y. Y.: Identifying surface water evaporation loss of inland river basin based on evaporation enrichment model, Hydrol. Process., 35, e14093, https://doi.org/10.1002/hyp.14093, 2021.
Thompson, L. G., Yao, T., Mosleythompson, E., Davis, M. E., Henderson, K. A., and Lin, P.: A high-resolution millennial record of the South Asian Monsoon from Himalayan Ice Cores, Science, 289, 1916–1920, https://doi.org/10.1126/science.289.5486.1916, 2000.
Vallet-Coulomb, C., Gasse, F., and Sonzogni, C.: Seasonal evolution of the isotopic composition of atmospheric water vapour above a tropical lake: deuterium excess and implication for water recyling, Geochim. Cosmochim. Ac., 72, 4661–4674, https://doi.org/10.1016/j.gca.2008.06.025, 2008.
Vandenschrick, G., Wesemael, B. V., Frot, E., Pulido-Bosch, A., Molina L. B., Stiévenard, M., and Souchez, R.: Using stable isotope analysis (δD–δ18O) to characterise the regional hydrology of the Sierra de Gador, south east Spain, J. Hydrol., 265, 43–55, https://doi.org/10.1016/S0022-1694(02)00097-5, 2002.
Walker, G. R., Woods, P. H., and Allison, G. B.: Interlaboratory comparison of methods to determine the stable isotope composition of soil water, Chem. Geol., 111, 297–306, https://doi.org/10.1016/0009-2541(94)90096-5, 1994.
Wang, B. and Gao, X.: Temporal and spatial variations of water resources constraint intensity on urbanization in the Shiyang River Basin, China, Environ. Dev. Sustain., 23, 1–18, https://doi.org/10.1007/s10668-020-01045-w, 2021.
Wang, G., Xia, J., and Chen, J.: Quantification of effects of climate variations and human activities on runoff by a monthly water balance model: A case study of the Chaobai River basin in northern China, Water Resour. Res., 45, W00A11, https://doi.org/10.1029/2007WR006768, 2009.
Wang, T., Wang, H. S., Sun, G. W., Huang, D., and Shen, J. H.: Length-weight and length-length relationships for some Yangtze River fishes in Tian-e-zhou Oxbow, China, J. Appl. Ichthyol., 28, 660–662, https://doi.org/10.1111/j.1439-0426.2012.01971.x, 2012.
Wei, W., Shi, P. J., Zhou, J. J., Feng, H. C., Wang, X. F., and Wang, X. P.: Environmental suitability evaluation for human settlements in an arid inland river basin: A case study of the Shiyang River Basin, J. Geogr. Sci., 23, 331–343, https://doi.org/10.4028/www.scientific.net/AMR.518-523.4874, 2013.
West, A. G., Goldsmith, G. R., Brooks, P. D., and Dawson, T. E.: Discrepancies between isotope ratio infrared spectroscopy and isotope ratio mass spectrometry for the stable isotope analysis of plant and soil waters, Rapid Commun. Mass Sp., 24, 2687–2688, https://doi.org/10.1002/rcm.4685, 2010.
Worden, J., Noone, D., and Bowman, K.: Importance of rain evaporation and continental convection in the tropical water cycle, Nature, 445, 528–532, https://doi.org/10.1038/nature05508, 2007.
Zannoni, D., Steen-Larsen, H. C., Rampazzo, G., Dreossi, G., Stenni, B., and Bergamasco, A.: The atmospheric water cycle of a coastal lagoon: an isotope study of the interactions between water vapor, precipitation and surface waters, J. Hydrol., 572, 630–644, https://doi.org/10.1016/j.jhydrol.2019.03.033, 2019.
Zhang, F., Jin, G., and Liu, G.: Evaluation of virtual water trade in the yellow river delta, China, Sci. Total Environ., 784, 147285, https://doi.org/10.1016/j.scitotenv.2021.147285, 2021.
Zhou, J. J., Zhao, Y. R., Huang, P., and Liu, C. F.: Impacts of ecological restoration projects on the ecosystem carbon storage of inland river basin in arid area, China, Ecol. Indic., 118, 106803, https://doi.org/10.1016/j.ecolind.2020.106803, 2020.
Zhu, G.: Data sets of Stable water isotope monitoring network of different water bodies in Shiyang River Basin, a typical arid river in China, V2, Mendeley Data [data set], https://doi.org/10.17632/vhm44t74sy.1, 2022.
Zhu, G. F., Guo, H. W., Qin, D. H., Pan, H. X., and Ma, X. G.: Contribution of recycled moisture to precipitation in the monsoon marginal zone: estimate based on stable isotope data, J. Hydrol., 569, 423–435, https://doi.org/10.1016/j.jhydrol.2018.12.014, 2018.
Zhu, G. F., Wan, Q. Z., Yong, L. L., Li, Q. Q., Zhang, Z. Y., Guo, H. W., Zhang, Y., Sun, Z. G., Zhang, Z. X., and Ma, H. Y.: Dissolved organic carbon transport in the Qilian mountainous areas of China, Hydrol. Process., 34, 4985–4995, https://doi.org/10.1002/hyp.13918, 2020.
Zhu, G. F., Sang, L. Y., Zhang, Z. X., Sun, Z. G., Ma, H. Y., Liu, Y. W., Zhao, K. L., Wang, L., and Guo, H. W.: Impact of landscape dams on river water cycle in urban and peri-urban areas in the Shiyang River Basin: Evidence obtained from hydrogen and oxygen isotopes, J. Hydrol., 602, 126779, https://doi.org/10.1016/J.JHYDROL.2021.126779, 2021a.
Zhu, G. F., Yong, L. L., Zhang, Z. X., Sun, Z. G., Sang, L. L., Liu, Y., Wang, L., and Guo, H. W.: Infiltration process of irrigation water in oasis farmland and its enlightenment to optimization of irrigation mode: based on stable isotope data, Agr. Water Manage., 258, 107173, https://doi.org/10.1016/j.agwat.2021.107173, 2021b.
Zhu, G. F., Yong, L. L., Zhang, Z. X., Sun, Z. G., Wan, Q. Z., Xu, Y. X., Ma, H. Y., Sang, L. Y., Liu, Y. W., Wang, L., Zhao, K. K., and Guo, H. W.: Effects of plastic mulch on soil water migration in arid oasis farmland: Evidence of stable isotopes, Catena, 207, 105580, https://doi.org/10.1016/J.CATENA.2021.105580, 2021c.
Zhu, G. F., Zhang, Z. X., Guo, H. W., Zhang, Y., Yong, L. L., Wan, Q. Z., Sun, Z. G., and Ma, H. Y.: Below-Cloud Evaporation of Precipitation Isotopes over Mountains, Oases, and Deserts in Arid Areas, J. Hydrometeorol., 22, 2533–2545, https://doi.org/10.1175/JHM-D-20-0170.1, 2021d.