the Creative Commons Attribution 4.0 License.
the Creative Commons Attribution 4.0 License.
 | 23 Aug 2022
Improved maps of surface water bodies, large dams, reservoirs, and lakes in China
Xinxin Wang
Xiangming Xiao
Yuanwei Qin
Jinwei Dong
Jihua Wu
Bo Li
Data and knowledge of surface water bodies (SWB), including large lakes and reservoirs (surface water areas > 1 km2), are critical for the management and sustainability of water resources. However, the existing global or national dam datasets have large georeferenced coordinate offsets for many reservoirs, and some datasets have not reported reservoirs and lakes separately. In this study, we generated China's surface water bodies, Large Dams, Reservoirs, and Lakes (China-LDRL) dataset by analyzing all available Landsat imagery in 2019 (19 338 images) in Google Earth Engine and very-high spatial resolution imagery in Google Earth Pro. There were ∼ 3.52 × 10⁶ yearlong SWB polygons in China for 2019, only 0.01 × 10⁶ of them (0.43 %) were of large size (> 1 km2). The areas of these large SWB polygons accounted for 83.54 % of the total 214.92 × 10³ km2 yearlong surface water area (SWA) in China. We identified 2418 large dams, including 624 off-stream dams and 1794 on-stream dams, 2194 large reservoirs (16.35 × 10³ km2), and 3051 large lakes (73.38 × 10³ km2). In general, most of the dams and reservoirs in China were distributed in South China, East China, and Northeast China, whereas most of lakes were located in West China, the lower Yangtze River basin, and Northeast China. The provision of the reliable, accurate China-LDRL dataset on large reservoirs/dams and lakes will enhance our understanding of water resources management and water security in China. The China-LDRL dataset is publicly available at https://doi.org/10.6084/m9.figshare.16964656.v3 (Wang et al., 2021b).
- Article
(12849 KB) - Full-text XML
-
Supplement
(1963 KB) - BibTeX
- EndNote


Surface water bodies (SWB), including large lakes and reservoirs (surface water areas > 1 km2), play an important role in the control and management of water resources (Yang and Lu, 2014, 2013; Feng et al., 2013, 2019). A reservoir is usually defined as artificial lake formed by constructing dams across rivers (on-stream reservoir) (Thornton et al., 1996; Hayes et al., 2017) or partially or completely formed by enclosed waterproof banks with concrete or clay (off-stream reservoir) (Xiang et al., 2019; Thornton et al., 1996) (Fig. S1 in the Supplement). Nearly 50 % of the global large dams were built primarily for agricultural irrigation through storing, regulating, and diverting water (Mulligan et al., 2020). Additionally, they are also used for hydropower generation, human and industrial uses, and flood peak attenuation (Lehner et al., 2011; Lehner and Döll, 2004; Wang et al., 2022a). Large lakes have been the subject of great interest not only because of their water resources but also as indicators of local climate change and anthropogenic activities (Zhang et al., 2019; Ma et al., 2011; Birkett and Mason, 1995), and they could provide vital ecosystem services for human beings, such as alteration of river flow, supplies of irrigation water, fisheries, and abundant valuable mineral deposits, and have disproportionate effects on the global carbon cycle (Ran et al., 2021; Armstrong, 2010; Ma et al., 2011). Improved datasets of the numbers, sizes, and spatial distributions of SWB, large dams, reservoirs, and lakes could substantially provide crucial inputs for the studies of water resources, environmental health, aquatic ecosystems, and agricultural sustainability (Lehner and Döll, 2004; Zhu et al., 2020).
China has the largest population, fastest-growing economy, increased expansion of irrigation, limited water resources, dated water infrastructure, and inadequate water governance (Liu and Yang, 2012; Wang et al., 2020a; Tao et al., 2020). China encompasses almost 20 % of the world's population but contains only 7 % of the world's fresh water, and as a result, it has much smaller fresh water resources per capital than do most other countries (Feng et al., 2019; Dalin et al., 2014). Since the 1980s, China has taken diverse measures to ensure long-term water security (Zhou et al., 2020). For example, China has a remarkable increase of reservoir construction across the country (Wang et al., 2022a; Zhu et al., 2020), and the total number of dams increased to ∼ 89 700 by 2008 in China (Yang and Lu, 2014). The Three Gorges reservoir, which is the world's largest hydroelectric dam (Three Gorges Dam), is fully operational for flood control, power generation, navigation, and water use (Wu et al., 2004; Zhang et al., 2012; Wang et al., 2013, 2020a). China also has a large number of lakes with tremendous cultural and economic importance (Ma et al., 2011; Zhang et al., 2019). A previous study reported that there were 2693 large lakes (area > 1 km2) in China during 2005–2006, covering 0.9 % of China's land area (Ma et al., 2011). However, due to intensive human activities and climate change over the last three decades, several natural lakes have been converted into reservoirs, dramatically accelerating shrinkage of lake areas (Yang and Lu, 2014; Ma et al., 2011). Therefore, the improved datasets on the number, size, and spatial distribution of large reservoirs and lakes in China is needed for assessing the impact of human activities and climate change on SWB, water management, and water security in China (Zhu et al., 2020; Yang and Lu, 2014).
Several published global dam and reservoir datasets include information from China (Table 1). The World Register of Dams (WRD), which was organized and released by the International Commission on Large Dams (ICOLD, 2011), is the largest and widely-used dataset (Mulligan et al., 2020; Paredes-Beltran et al., 2021; Wang et al., 2022a). It reports 23 841 dam entries for China; however, a large proportion of those entries are not georeferenced with latitude and longitude information, which limits its wide applications (Wang et al., 2022a). The GlObal GeOreferenced Database of Dams (GOODD) V1 dataset reported 9234 georeferenced dams in China (Mulligan et al., 2020); however, the information (e.g., area, volume capacity) of the corresponding reservoirs was not reported. The FAO's (Food and Agriculture Organization of the United Nations) global information system on water resources and agricultural water management (AQUASTAT) lists 14 000 dams in the world, in which only part of 722 dams in China were georeferenced, and has not been updated since 2015. The Global Reservoir and Dam database (GRanD), developed by the Global Water System Project (GWSP), compiled the available reservoir and dam information globally (Lehner et al., 2011) and has been updated for the year 2019. However, it only lists 922 geolocated dam entries for China. Recently, Wang et al. (2022a) released a global georeferenced global dam and reservoir (GeoDAR) dataset with 5283 georeferenced dams in China, and the reservoirs had more than 40 attributes acquired from the WRD dataset. In April 2022, the newest and fully peer-reviewed version of GeoDAR is available, and this newest version had high accuracy of dams in China (Fig. S2). There were also several published dam and reservoir maps at the national scale (Table 1), but these maps neither included georeferenced dams nor reported reservoir attributes (e.g., reservoir area).
Table 1Information on published dam and reservoir datasets for the globe and China.
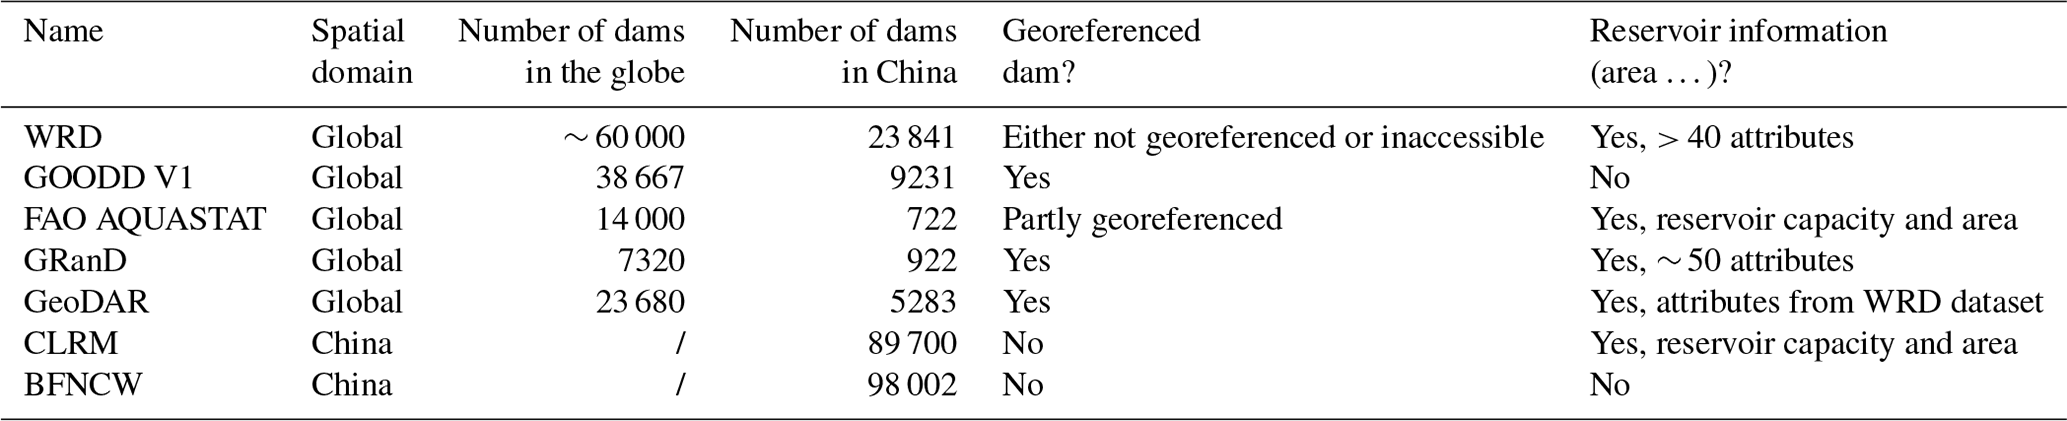
WRD: the World Register of Dams (https://www.icold-cigb.org, last access: 18 February 2022); GOODD: GlObal geOreferenced Database of Dams (Mulligan et al., 2020); FAO AQUASTAT: The Food and Agriculture Organization of the United Nations (FAO) global information system on water resources and agricultural water management (http://www.fao.org/aquastat/en/databases/dams/, last access: 18 February 2022); GRanD: the Global Reservoir and Dam database (Lehner et al., 2011); GeoDAR: Georeferenced global dam and reservoir dataset (Wang et al., 2022a); CLRM: China's Lakes and Reservoirs Map (Yang and Lu, 2014); BFNCW: Bulletin of First National Census for Water from Ministry of Water Resources the People's Republic of China (http://www.mwr.gov.cn/2013pcgb/index.html, last access: 18 February 2022). “/” means these data were published in China, but global dam information is unavailable.
In addition to the dam and reservoir datasets, several studies have reported the spatial distribution and multi-year dynamics of inland SWB (Tao et al., 2020; Ma et al., 2011; Wang et al., 2020a; Feng et al., 2019) and lakes (Gao, 2015; Gao et al., 2012; Ma et al., 2011; Zhang et al., 2019) in China; however, they did not explicitly explore the spatial distribution of large reservoirs and lakes in China, making it impossible to assess the impact of human activities on these two types of water resources. Thus, to date, the spatial distributions of SWB, large dams, reservoirs, and lakes in China have not yet been fully investigated and documented.
The objective of this study was to produce detailed and accurate maps of open SWB, large dams, reservoirs, and lakes (surface water area > 1 km2) in China in 2019, the latest year when this study started in late 2020, and those SWB with area ≤ 1 km2 were excluded. First, this study used time-series Landsat imagery in 2019 and Google Earth Engine (GEE) cloud computing platform and the simple and robust surface water mapping algorithm (Zou et al., 2018, 2017; Zhou et al., 2019b; Wang et al., 2020a) to generate raster maps of SWB in China at 30 m spatial resolution. Second, we converted the raster map of SWB to a vector map of SWB and identified those large SWB with area > 1 km2. Third, we combined the vector maps of SWB with the historical satellite images in 2019 within China in Google Earth Pro to identify dams and released China's surface water bodies, large dams, reservoirs, and lakes dataset, namely, China-LDRL. Fourth, we analyzed the spatial distribution of SWB, large dams, reservoirs, and lakes in China. Finally, we discussed the reliabilities, uncertainties, limitations, outlooks, and implications of the China-LDRL dataset for the study of water security.
2.1 Study area
The study area covered all the provincial-level administrative divisions in China (Fig. 1a), including 23 provinces, two special administrative regions (Hong Kong and Macao SAR), four municipalities (Beijing, Tianjin, Shanghai, and Chongqing), and five autonomous regions (Inner Mongolia, Guangxi, Tibet, Ningxia, and Xinjiang). Since Macao SAR and Hong Kong have relatively small areas and are very close to Guangdong Province, we combined them as one region (Guangdong) when we performed the statistical analysis in this study.
China has great altitude diversity as the eastern plains and southern coasts consist of lowlands and foothills, the southern areas of China consist of hilly and mountainous terrains, the west and north of the country are dominated by basins, plateaus, and massifs, and the southwestern China contains part of the highest tablelands on earth, the Tibetan Plateau (Fig. 1a). Due to substantial differences in latitude, longitude, and altitude, the climate of China is extremely diverse, ranging from tropical in the far south to subarctic in the far north and alpine in the higher elevations of the Tibetan Plateau, contributing to the much more surface water areas in southwest and southeast of China than other regions, especially North China (Wang et al., 2020a).
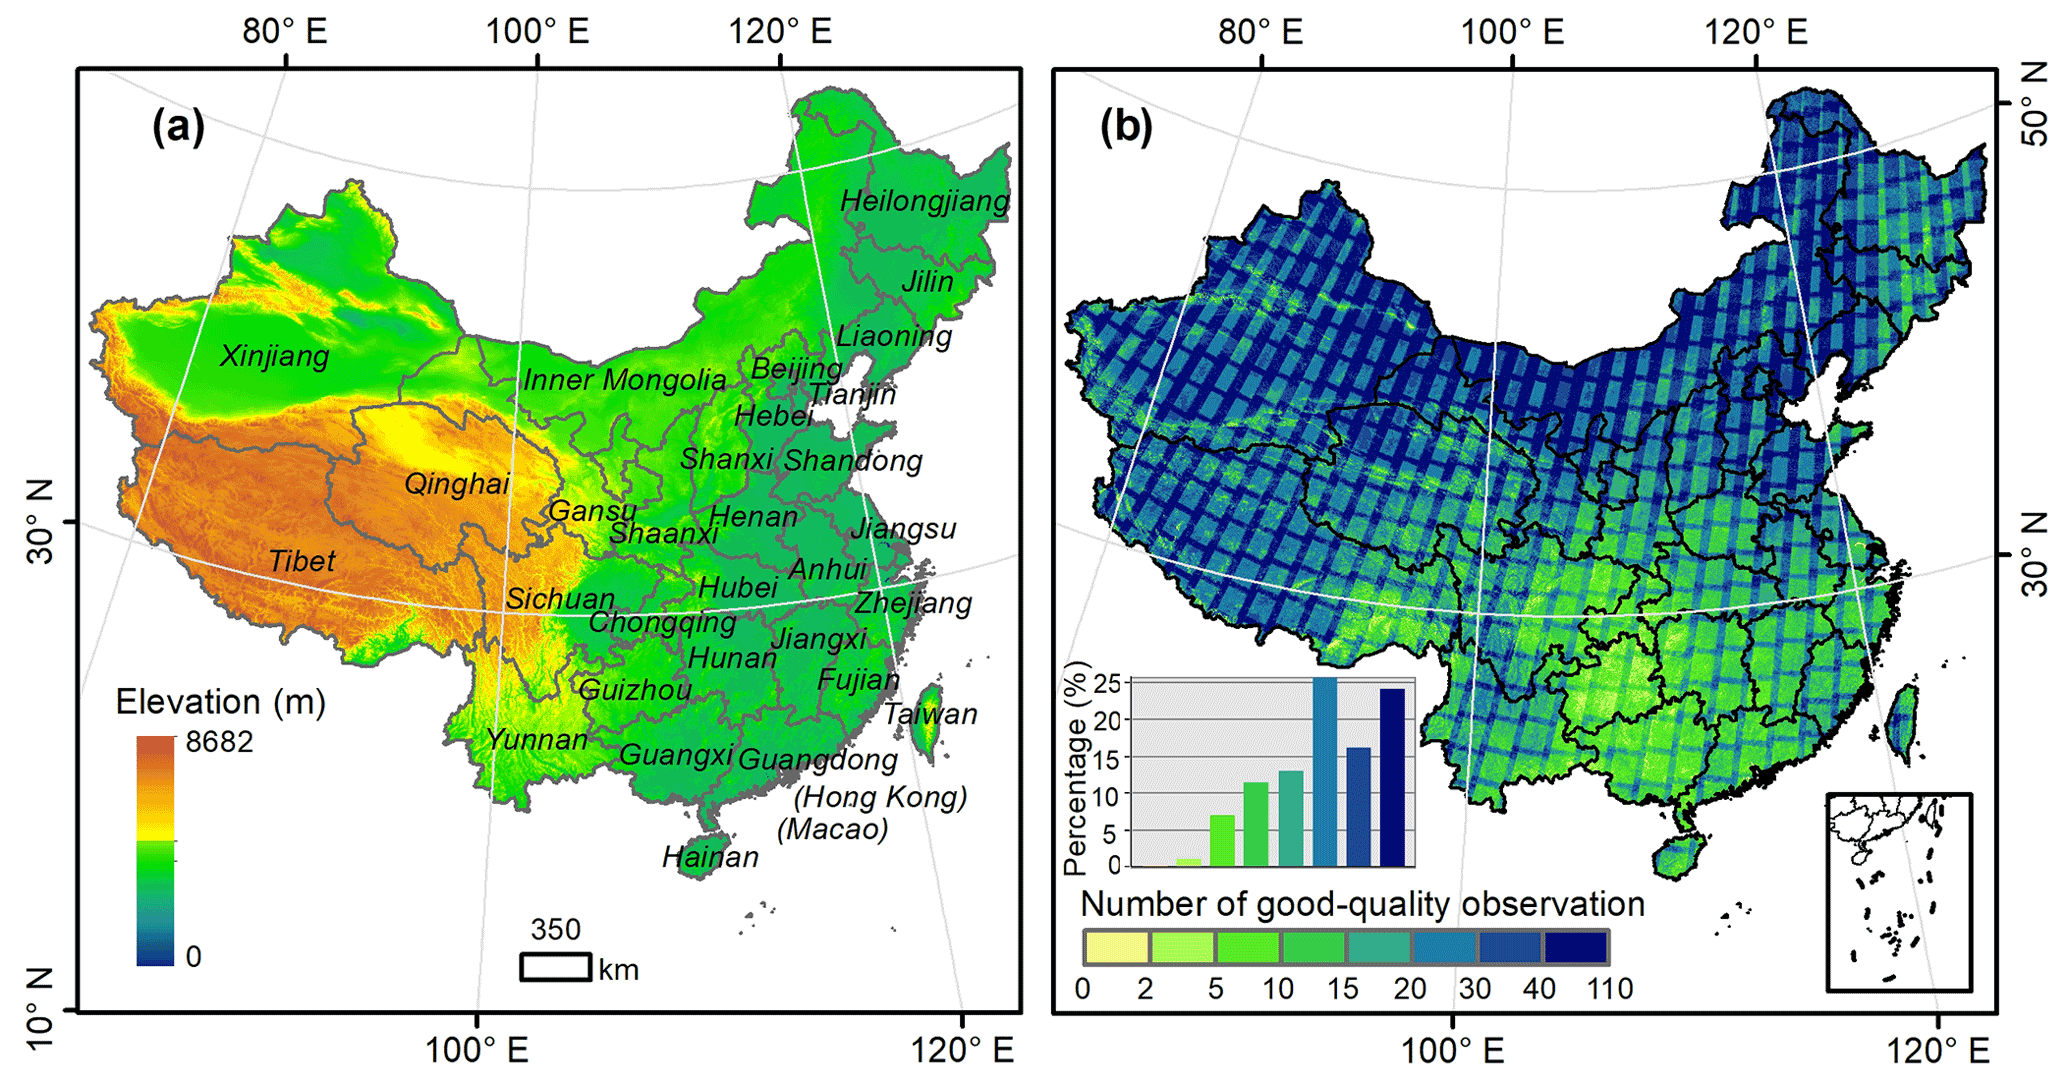
Figure 1Spatial distribution of provinces and elevation (a), and numbers of Landsat good-quality observations (b) in China for 2019.
2.2 Data
2.2.1 Landsat data
In this study, we used the available Landsat surface reflectance (SR) images in the GEE platform, and there was a total of 19 338 images in 2019 for China, including 9028 Landsat-7 Enhanced Thematic Mapper Plus (ETM+) images and 10 310 Landsat-8 Operational Land Imager (OLI) images (∼ 21.73 TB). The detailed information of Landsat SR products is available on the GEE platform (https://developers.google.com/earth-engine/datasets/catalog/landsat, last access: 18 February 2022). All these images had undergone necessary pre-processing in GEE, including radiometric calibration, atmospheric correction, and the removal of stripes in Landsat-7 imagery. We used the quality assurance (QA) band that was generated by the CFMask algorithm (Zhu et al., 2015) to identify bad-quality observations, including clouds and cloud shadows (Murray et al., 2019; Pekel et al., 2016). We also used the Shuttle Radar Topography Mission (SRTM) digital elevation model (DEM) data, the solar azimuth and zenith angle data of each image, and ee.Terrain.hillShadow algorithm in GEE to identify those pixels with terrain shadows (Zou et al., 2018; Wang et al., 2020a) (Fig. 1b), which were excluded from the data analysis. Out of ∼ 132.43 million pixels in China, approximately 98.36 % had more than 5 good-quality observations and 91.24 % had more than 10 good-quality observations in 2019. About 93.14 % of the 78.9 million pixels in North China had more than 20 good-quality observations due to the overlapping of Landsat images at the high latitudes and less cloud cover (Zhou et al., 2019a; Wang et al., 2020b). Note that the number of Landsat-7 ETM+ images in GEE may change in the future, as the United States Geological Survey (USGS) continues to work with the International Ground Stations (IGS) in the world to assemble and rescue some images from individual stations. For Landsat-8 OLI images, USGS does not rely on IGS for image downlink, as its data record is able to store all the images and then downlink them to the Landsat archive (Wulder et al., 2016).
We used three spectral indices – the Normalized Difference Vegetation Index (NDVI) the Enhanced Vegetation Index (EVI) the Modified Normalized Difference Water Index (mNDWI) – to identify SWB in this study. These indices are defined as:
where ρblue, ρgreen, ρred, ρnir, and ρswir are blue, green, red, near-infrared, and shortwave infrared bands of Landsat images, respectively.
2.2.2 Dam and reservoir datasets
The GlObal GeOreferenced Database of Dams (GOODD) dataset was released in 2020, and it lists ∼ 38 000 georeferenced dams and derived data on their associated catchments through one by one degree titles on the Google Earth geobrowser during 2007–2011 and the Shuttle Radar Topography Mission (SRTM) Water Body Dataset (SWBD) (Mulligan et al., 2020). It provides the raw digitized coordinates for the locations of dam walls, but it does not provide the detailed attribute data on the characteristics of each dam and reservoir (Fig. 2a, d). Both the large dams and medium-sized dams were captured in this dataset.

Figure 2Spatial distribution of dams from the GlObal GeOreferenced Database of Dams (GOODD) (a), the Global Reservoir and Dam (GRanD) v1.3 (b), and the Georeferenced global Dam And Reservoir (GeoDAR) v1.1 (c) datasets. The GOODD dataset reported the catchment of each dam (d), while the GRanD and GeoDAR datasets reported the reservoir information of each dam (e, f).
The Global Reservoir and Dam (GRanD) database v1.3 was recently updated in February 2019 by Lehner et al. (2011) (Fig. 2b, e). The spatial information of these dams was contributed by 11 participating institutions. Each dam was assigned to a polygon that depicted the reservoir surface, which was provided by SWBD (v1.1), and the surface water maps were produced by the Joint Research Center (JRC) of the European Commission from Landsat imagery at 30 m spatial resolution for the period 1984–2015 (Pekel et al., 2016) (v1.3). All reservoirs with a storage capacity of more than 0.1 km3 were included in this dataset, and some smaller reservoirs were also added when their data were available.
The Georeferenced global Dam And Reservoir dataset (GeoDAR) was produced by utilizing multi-source dam and reservoir inventories (ICOLD WRD and GRanD v1.3 datasets) and the Google Maps geocoding Application Programming Interface (API) (Wang et al., 2022a) (Fig. 2d, e). The GeoDAR product includes two successive versions. GeoDAR v1.0 is essentially a georeferenced subset of ICOLD WRD, and contains more than 20 000 dam entries, and each of which is indexed by an encrypted identifier (ID) that is associated with a WRD record, allowing for the potential retrieval of all its 40+ proprietary attributes from ICOLD. GeoDAR v1.1 consists of (1) dam entries as in v1.0 except those that further harmonized with GRanD for an improved inclusion of the largest dams, and (2) reservoir boundaries for most of the dam entries. The GeoDAR was just updated in April 2022 and is available at https://doi.org/10.5281/zenodo.6163413 (Wang et al., 2022b).
2.3 Methods
The workflow for producing the China-LDRL dataset included two major sections: (1) generation of yearlong SWB maps in China by analyzing time-series Landsat imagery in 2019 with GEE platform; and (2) identification of dams and classification of yearlong SWB into lakes, reservoirs, and rivers by analyzing the historical satellite images in 2019 within China in Google Earth Pro. A flowchart showing the methodology of this study is illustrated in Fig. 3.
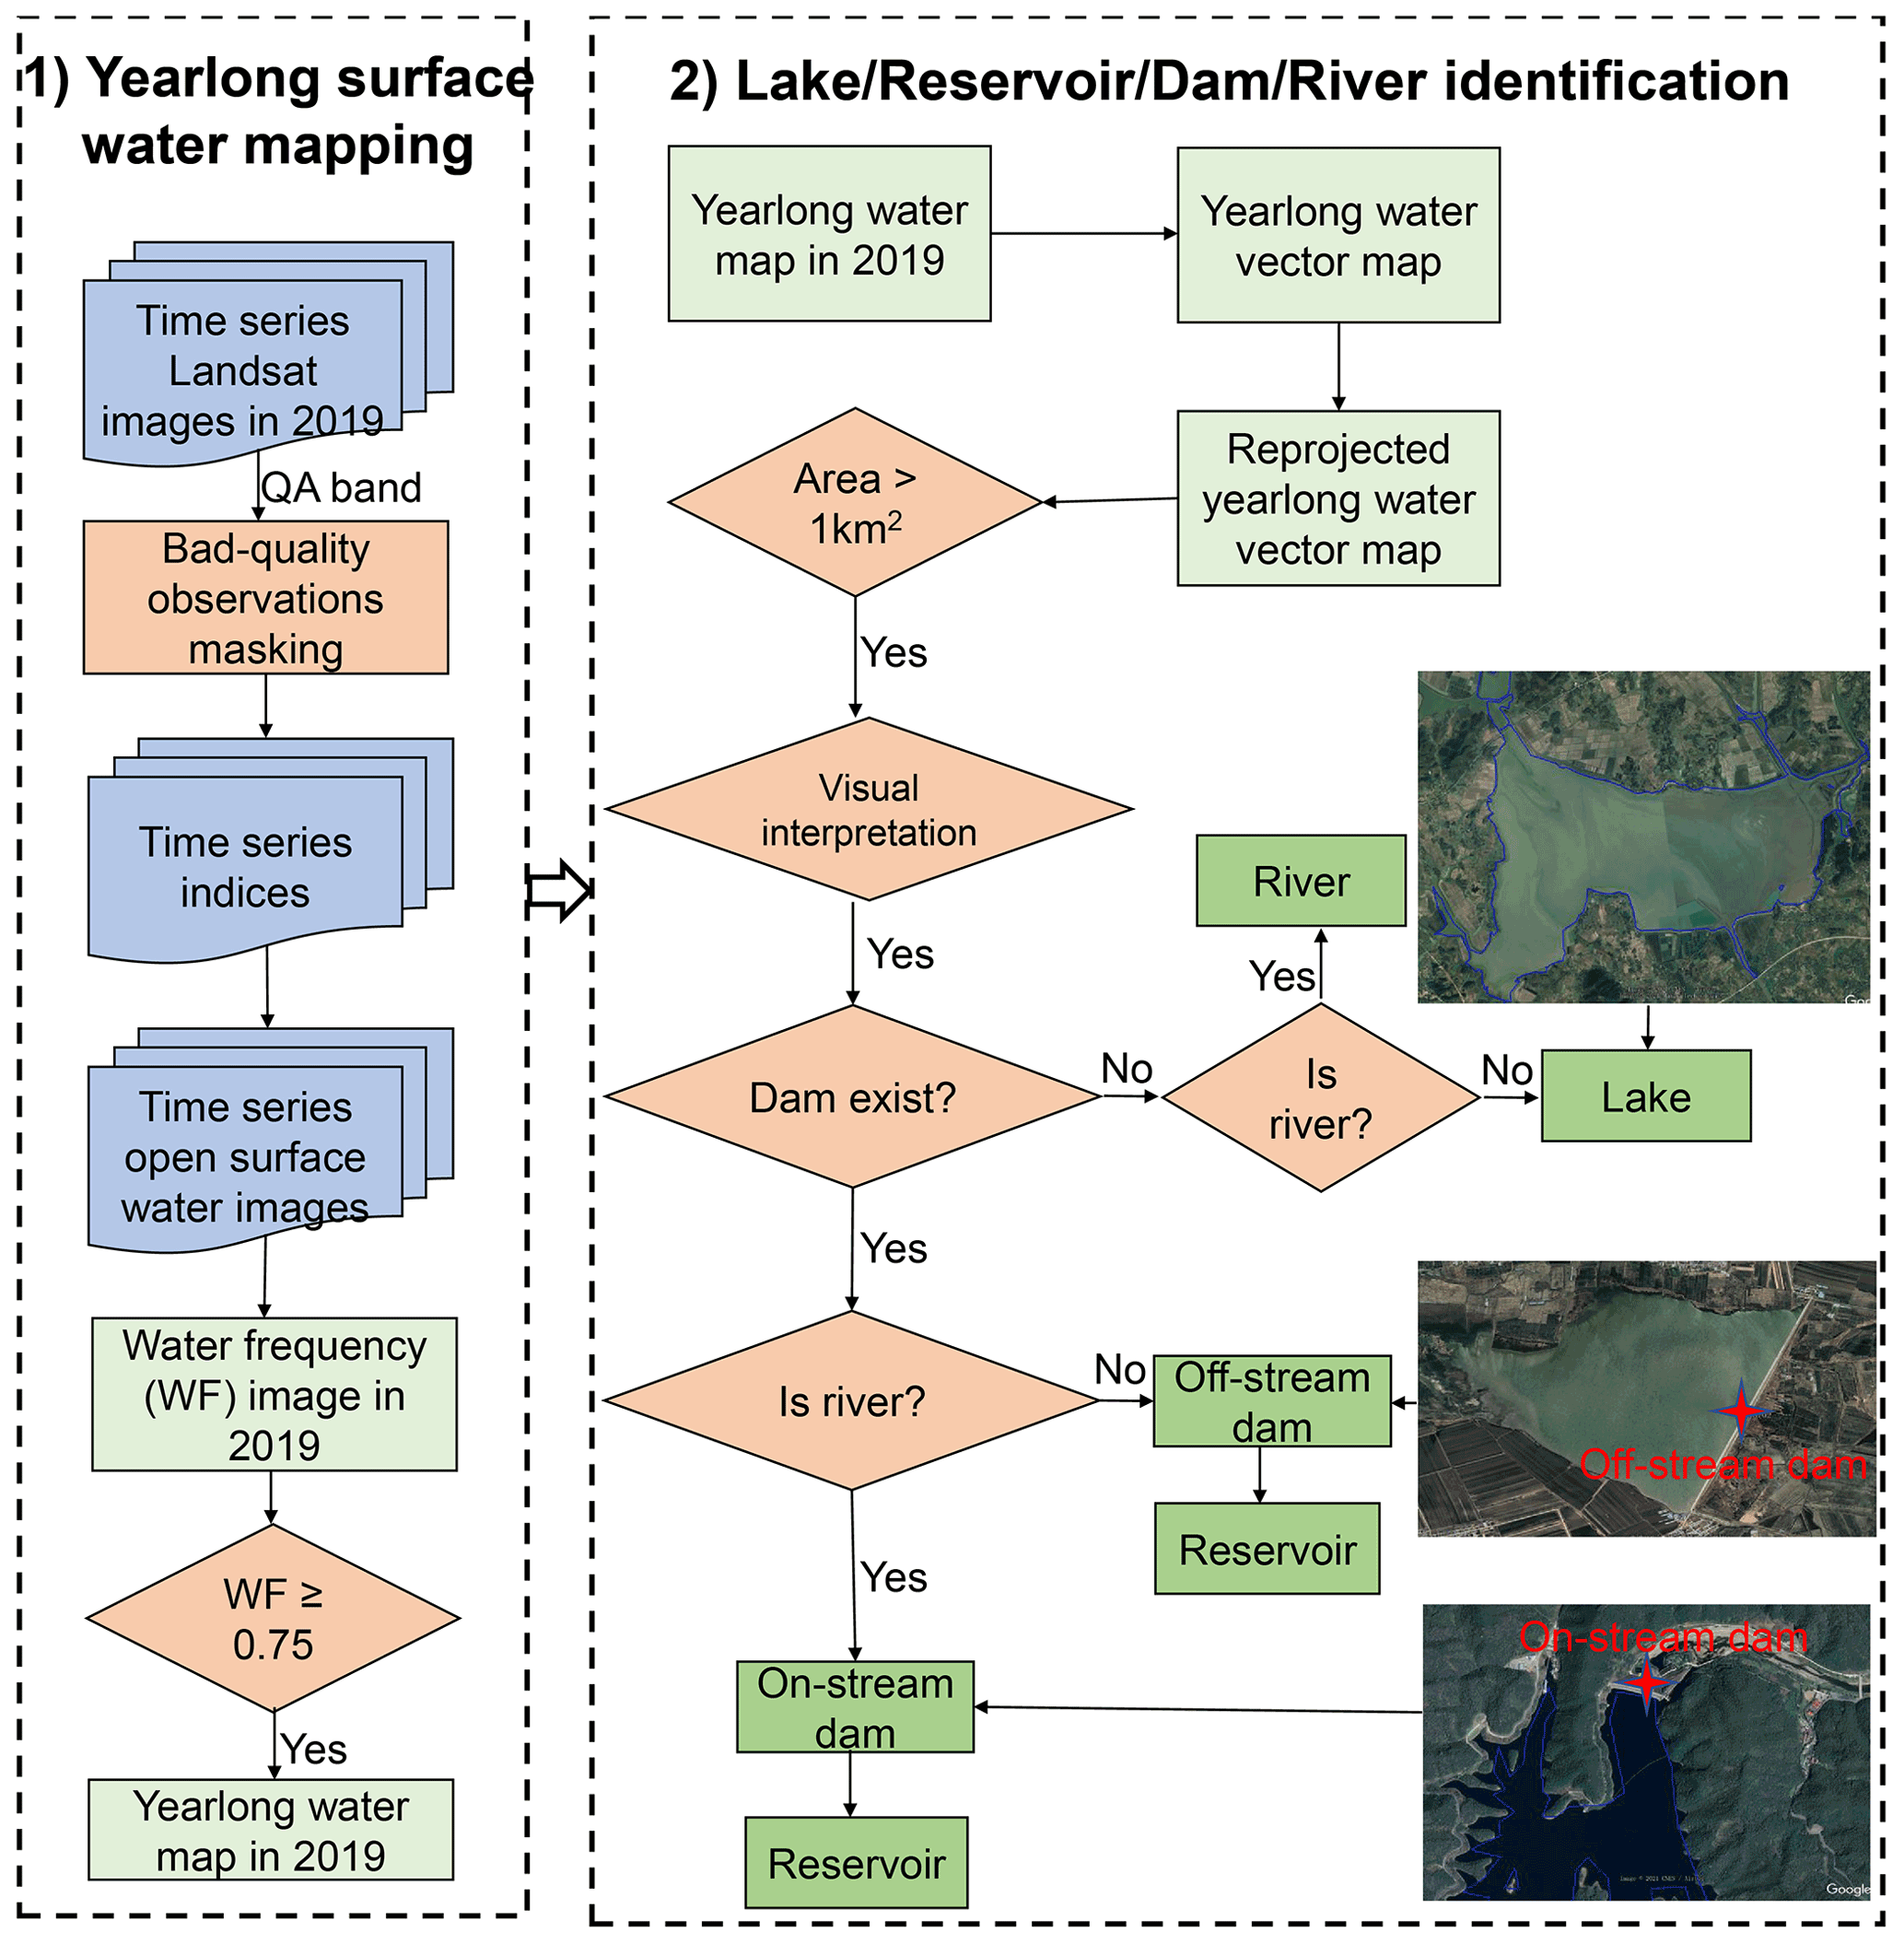
Figure 3Schematic flowchart of lakes, reservoirs, dams, and rivers identification in this study. The images were acquired from Google Earth Pro (© Google Earth Pro 2019).
2.3.1 Algorithm to generate annual maps of yearlong surface water bodies
In this study, we combined a surface water index (mNDWI) and two greenness-based vegetation indices (EVI and NDVI) to identify SWB through the algorithm of ((mNDWI > EVI or mNDWI > NDVI) and EVI < 0.1) (Eq. 4). This mNDWIVIs algorithm can reduce the effects of vegetation on identification of SWB, and has already been used to identify and map SWB at the regional and national scales with high accuracy (Zou et al., 2018, 2017; Zhou et al., 2019b; Wang et al., 2020a). Furthermore, this mNDWIVIs algorithm had been compared with other surface water body mapping algorithms (e.g., NDWI, mNDWI, TCW, and AWEI), and the results showed that the integration of mNDWIVIs algorithm and Landsat images could identify SWB with high producer's accuracy (98.1 %) and user's accuracy (91.0 %) (Zhou et al., 2017).
Surface water body frequency (FSWB) of a pixel in a year was calculated as the ratio of the number of observations identified as surface water body to the number of good-quality observations in a year, and ranged from 0 to 1.0 (or 100 %) (Zou et al., 2017), see Eq. (5). We generated the FSWB map of all the pixels in China for 2019 in the GEE platform (Fig. 5a).
where SWB is surface water body, FSWB is surface water body frequency, NSWB is the number of observations identified as SWB (see Eq. 4) in 2019, and Ngood is the number of good-quality observations in 2019.
Consistent with our previous studies (Zou et al., 2018; Wang et al., 2020a), a water pixel was defined as yearlong surface water body (FSWB ≥ 0.75), seasonal surface water body (0.05 .75), or ephemeral surface water body (FSWB<0.05). We generated the seasonal and yearlong SWB maps in China for 2019, respectively (Fig. 4b, c).
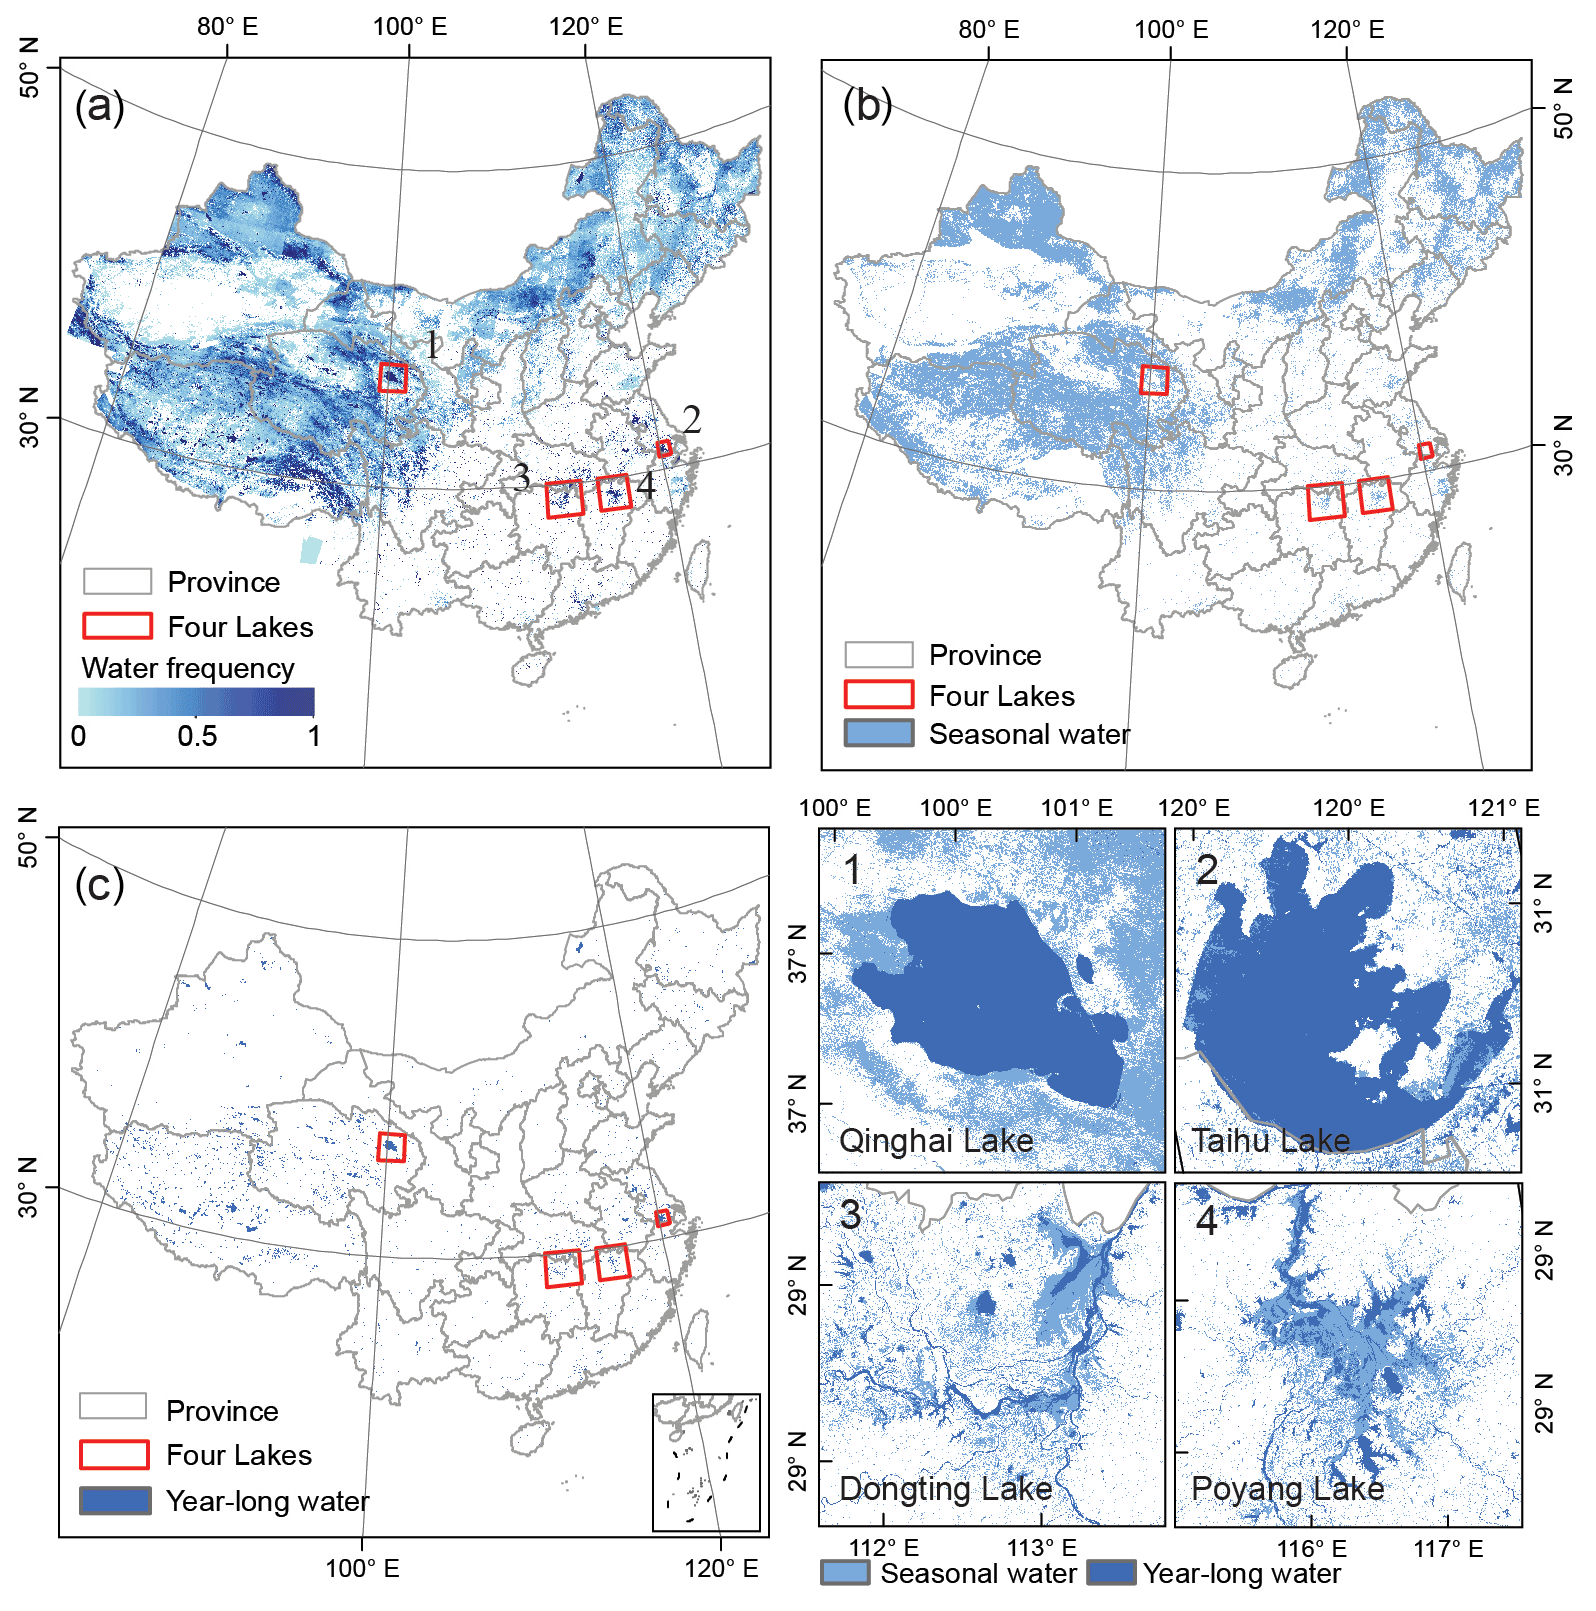
Figure 4Spatial distribution of surface water body (SWB) in China for 2019. (a) Water frequency, (b) seasonal SWB, and (c) yearlong SWB. Subfigures (1–4) are three zoom-in views of seasonal and yearlong SWB in Qinghai Lake, Taihu Lake, Dongting Lake, and Poyang Lake in China.
2.3.2 The procedure to identify dams, reservoirs, and lakes in Google Earth Pro
We first generated the yearlong SWB vector map in China for 2019 based on the yearlong SWB raster map, then reprojected it to the Krasovsky_1940_Albers equal area conic projection and calculated the area (km2) of each yearlong SWB polygon as its attribute (Python code is available in: https://drive.google.com/drive/folders/1B19VKbCIoDPmu-IcmiZcOIUF8wi1YnE?usp=sharing, last access: 17 August 2022). When we reported large reservoirs and lakes, only those polygons with area > 1 km2 were kept in this study (Fig. S3). In an effort to distinguish riverine or off-stream reservoirs from lakes, we uploaded the large SWB vector layers into Google Earth Pro, and checked whether a dam existed around each polygon through the historical satellite images in 2019 within China by visual image interpretation approach. If a dam did not exist, we classified the polygon as river or lake; if a dam does exist, we classified the polygon as on-stream reservoir (constructed on a river/stream regardless of impoundment) or off-stream reservoir (formed by partial or complete embankment around an off-stream lake) (Fig. S1 in the Supplement). Simultaneously, the corresponding dam would be classified as on-stream dam or off-stream dam. Finally, the SWB polygons were classified into lakes, reservoirs, and rivers, and the dams/reservoirs were classified into on-stream and off-stream dams/reservoirs (Fig. 3). This work was carried out and completed by the lead author (Xinxin Wang) over two months, and users could reproduce the dam dataset by uploading the SWB polygons in the historical satellite images in 2019 in Google Earth Pro and following the procedure described here. Note that satellite images in the Google Earth Pro may change over time, but such changes may have very limited impact on identification of dams, as dams have often stayed for many years after their construction.
2.4 Cross-comparison with other lake and reservoir datasets
To better understand the improvements and potential applications of our China-LDRL dataset, we compared it with other three available dam and reservoir datasets: the GOODD, GRanD V1.3, and GeoDAR datasets (Fig. 2). We first compared the dam quantity and areas of large reservoirs at the provincial and national scales. Then, we checked the spatial distribution of each dam from these datasets within Google Earth imagery, as all these datasets provide detailed georeferenced coordinates for some of dams, and the georeferenced information could be directly acquirable from the spatial longitude and latitude. Here we did not compare the reservoir area with the GOODD dataset, as it does not provide such attribute except for catchment area (Fig. 2d).
3.1 Annual map of surface water bodies in China for 2019
Surface water body frequency (FSWB) of individual pixels for 2019 varied substantially across China (Fig. 4). There were ∼ 3.38 million seasonal surface water pixels (30 m spatial resolution) in China, amounting to ∼ 3375.88 × 103 km2 seasonal surface water area (SWA) in 2019. Xinjiang Province had the largest seasonal SWA (751.14 × 10³ km2), followed by Tibet (600.70 × 10³ km2), Qinghai (564.57 × 10³ km2), Inner Mongolia (511.42 × 10³ km2), and Heilongjiang Province (343.33 × 10³ km2) (Fig. 5a). There were ∼ 0.21 million yearlong surface water pixels in China for 2019, amounting to ∼ 214.92 × 10³ km2 yearlong SWA, which were mainly located in Tibet (62.65 × 10³ km2), Qinghai (41.08 × 10³ km2), and Xinjiang (24.60 × 10³ km2) Provinces (Fig. 5b). Additionally, Heilongjiang, Jiangsu, Inner Mongolia, Hubei, and Anhui Provinces also had relatively larger yearlong SWA (> 5 × 10³ km2) than other provinces in China.

Figure 5Areas of seasonal (a) and yearlong (b) surface water bodies by province in China for 2019.
3.2 Numbers and areas of yearlong surface water bodies with different sizes in China
The numbers and areas of yearlong SWB polygons of different sizes in China differed considerably for 2019 (Fig. 6). In terms of yearlong SWB numbers, out of a total of 3.52 × 10⁶ yearlong SWB polygons in China in 2019, approximately 3.51 × 10⁶ polygons (99.57 %) had an area of ≤ 1 km2 and ∼ 2.16 × 10⁶ polygons (61.19 %) had an area of ≤ 0.0036 km2 (covering only 2×2 Landsat grid cells). Only 15 × 103 (0.43 %) yearlong SWB polygons had an area of > 1 km2 and 359 polygons had an area of > 100 km2. In terms of yearlong SWB areas, out of a total of 214.92 × 10³ km2 yearlong SWB in China in 2019, large SWB polygons (size > 1 km2) accounted for 83.54 % and very large SWB polygons (size > 100 km2) accounted for 52.48 %.
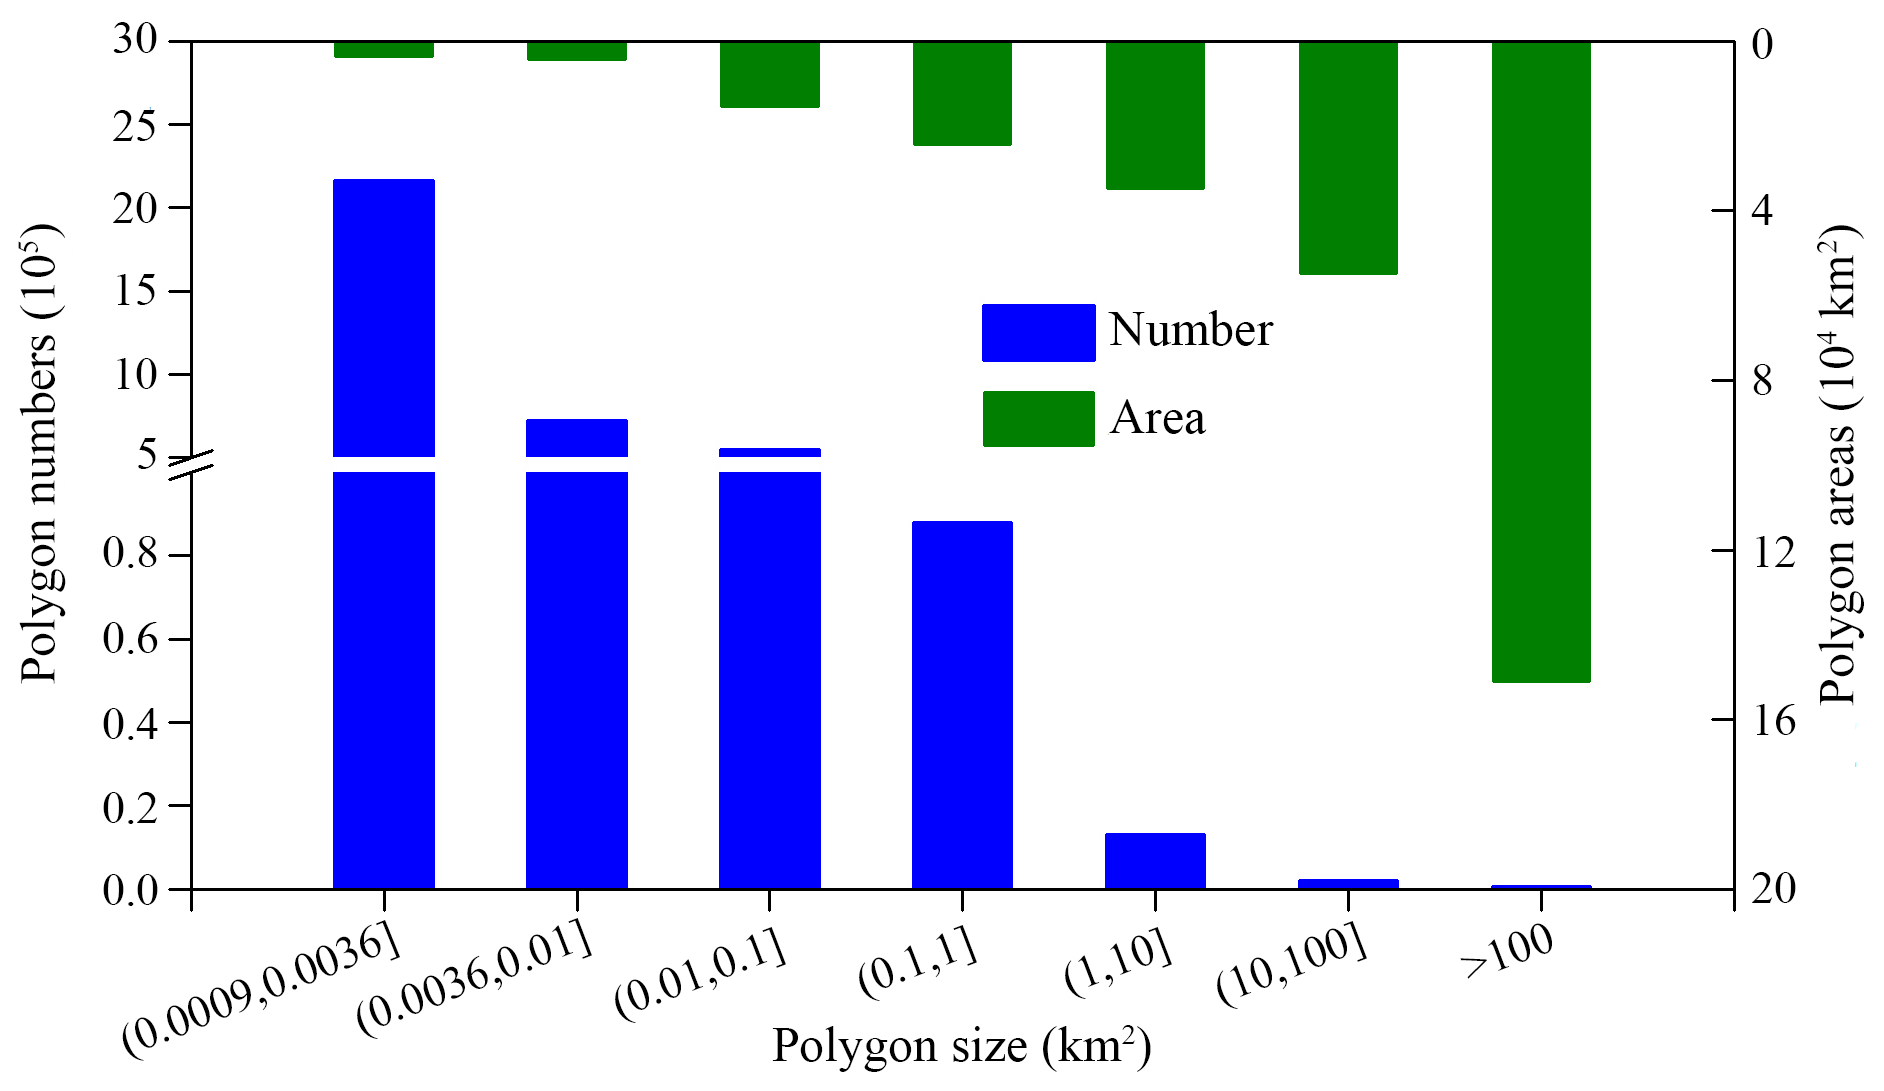
The numbers and areas of yearlong SWB polygons of different sizes at the provincial scale had similar distribution patterns with those at the national scale (Figs. S4, S5). Almost all the yearlong SWB polygons in individual provinces had an area of ≤ 1 km2 (Fig. S4); however, those SWB polygons with an area of > 1 km2 accounted for a large proportion of SWA in most provinces (Fig. S5). Those yearlong SWB polygons with an area of > 100 km2 were mostly very large lakes and rivers, which were mainly located in Tibet, Xinjiang, Qinghai, Jiangxi, and Heilongjiang Provinces (Fig. S5) (Feng et al., 2019). Some provinces also had very large-size reservoirs, such as Miyun Reservoir in Beijing, whose polygon size was greater than 100 km2.
3.3 Numbers, areas, and distribution of large dams, reservoirs, and lakes in China
We identified 2418 large dams in China, including 624 off-stream dams and 1794 on-stream dams, most of which were located in South, East, and Northeast China, and Xinjiang of Northwest China (Fig. 7a). At the provincial scale, Xinjiang had the largest number of off-stream dams (67), followed by Shandong (62), Heilongjiang (46), and Anhui (45) provinces. Three provinces (Hubei, Yunnan, and Guangdong) also had relatively larger off-stream dam numbers (≥ 40) than other provinces. Chongqing, Qinghai, and Tibet had no off-stream dams (Fig. 7b). Most of on-stream dams in China were distributed in those provinces with large rivers. Guangdong had the largest number of on-stream dams (172) in China, followed by Hubei (146), Heilongjiang (132), Shandong (112), Jilin (103), and Sichuan (103) provinces (Fig. 7c). However, there were no on-stream dams in Shanghai. In terms of the functions of two kinds of dams and the spatial patterns of climate (e.g., precipitation, temperature) and social–economic factors (e.g., population, GDP, irrigation area) in South and North China, the provinces in Northeast and East China had larger percentage of off-stream dams, whereas the provinces in Northeast and South China had larger percentage of on-stream dams (Fig. 7d).
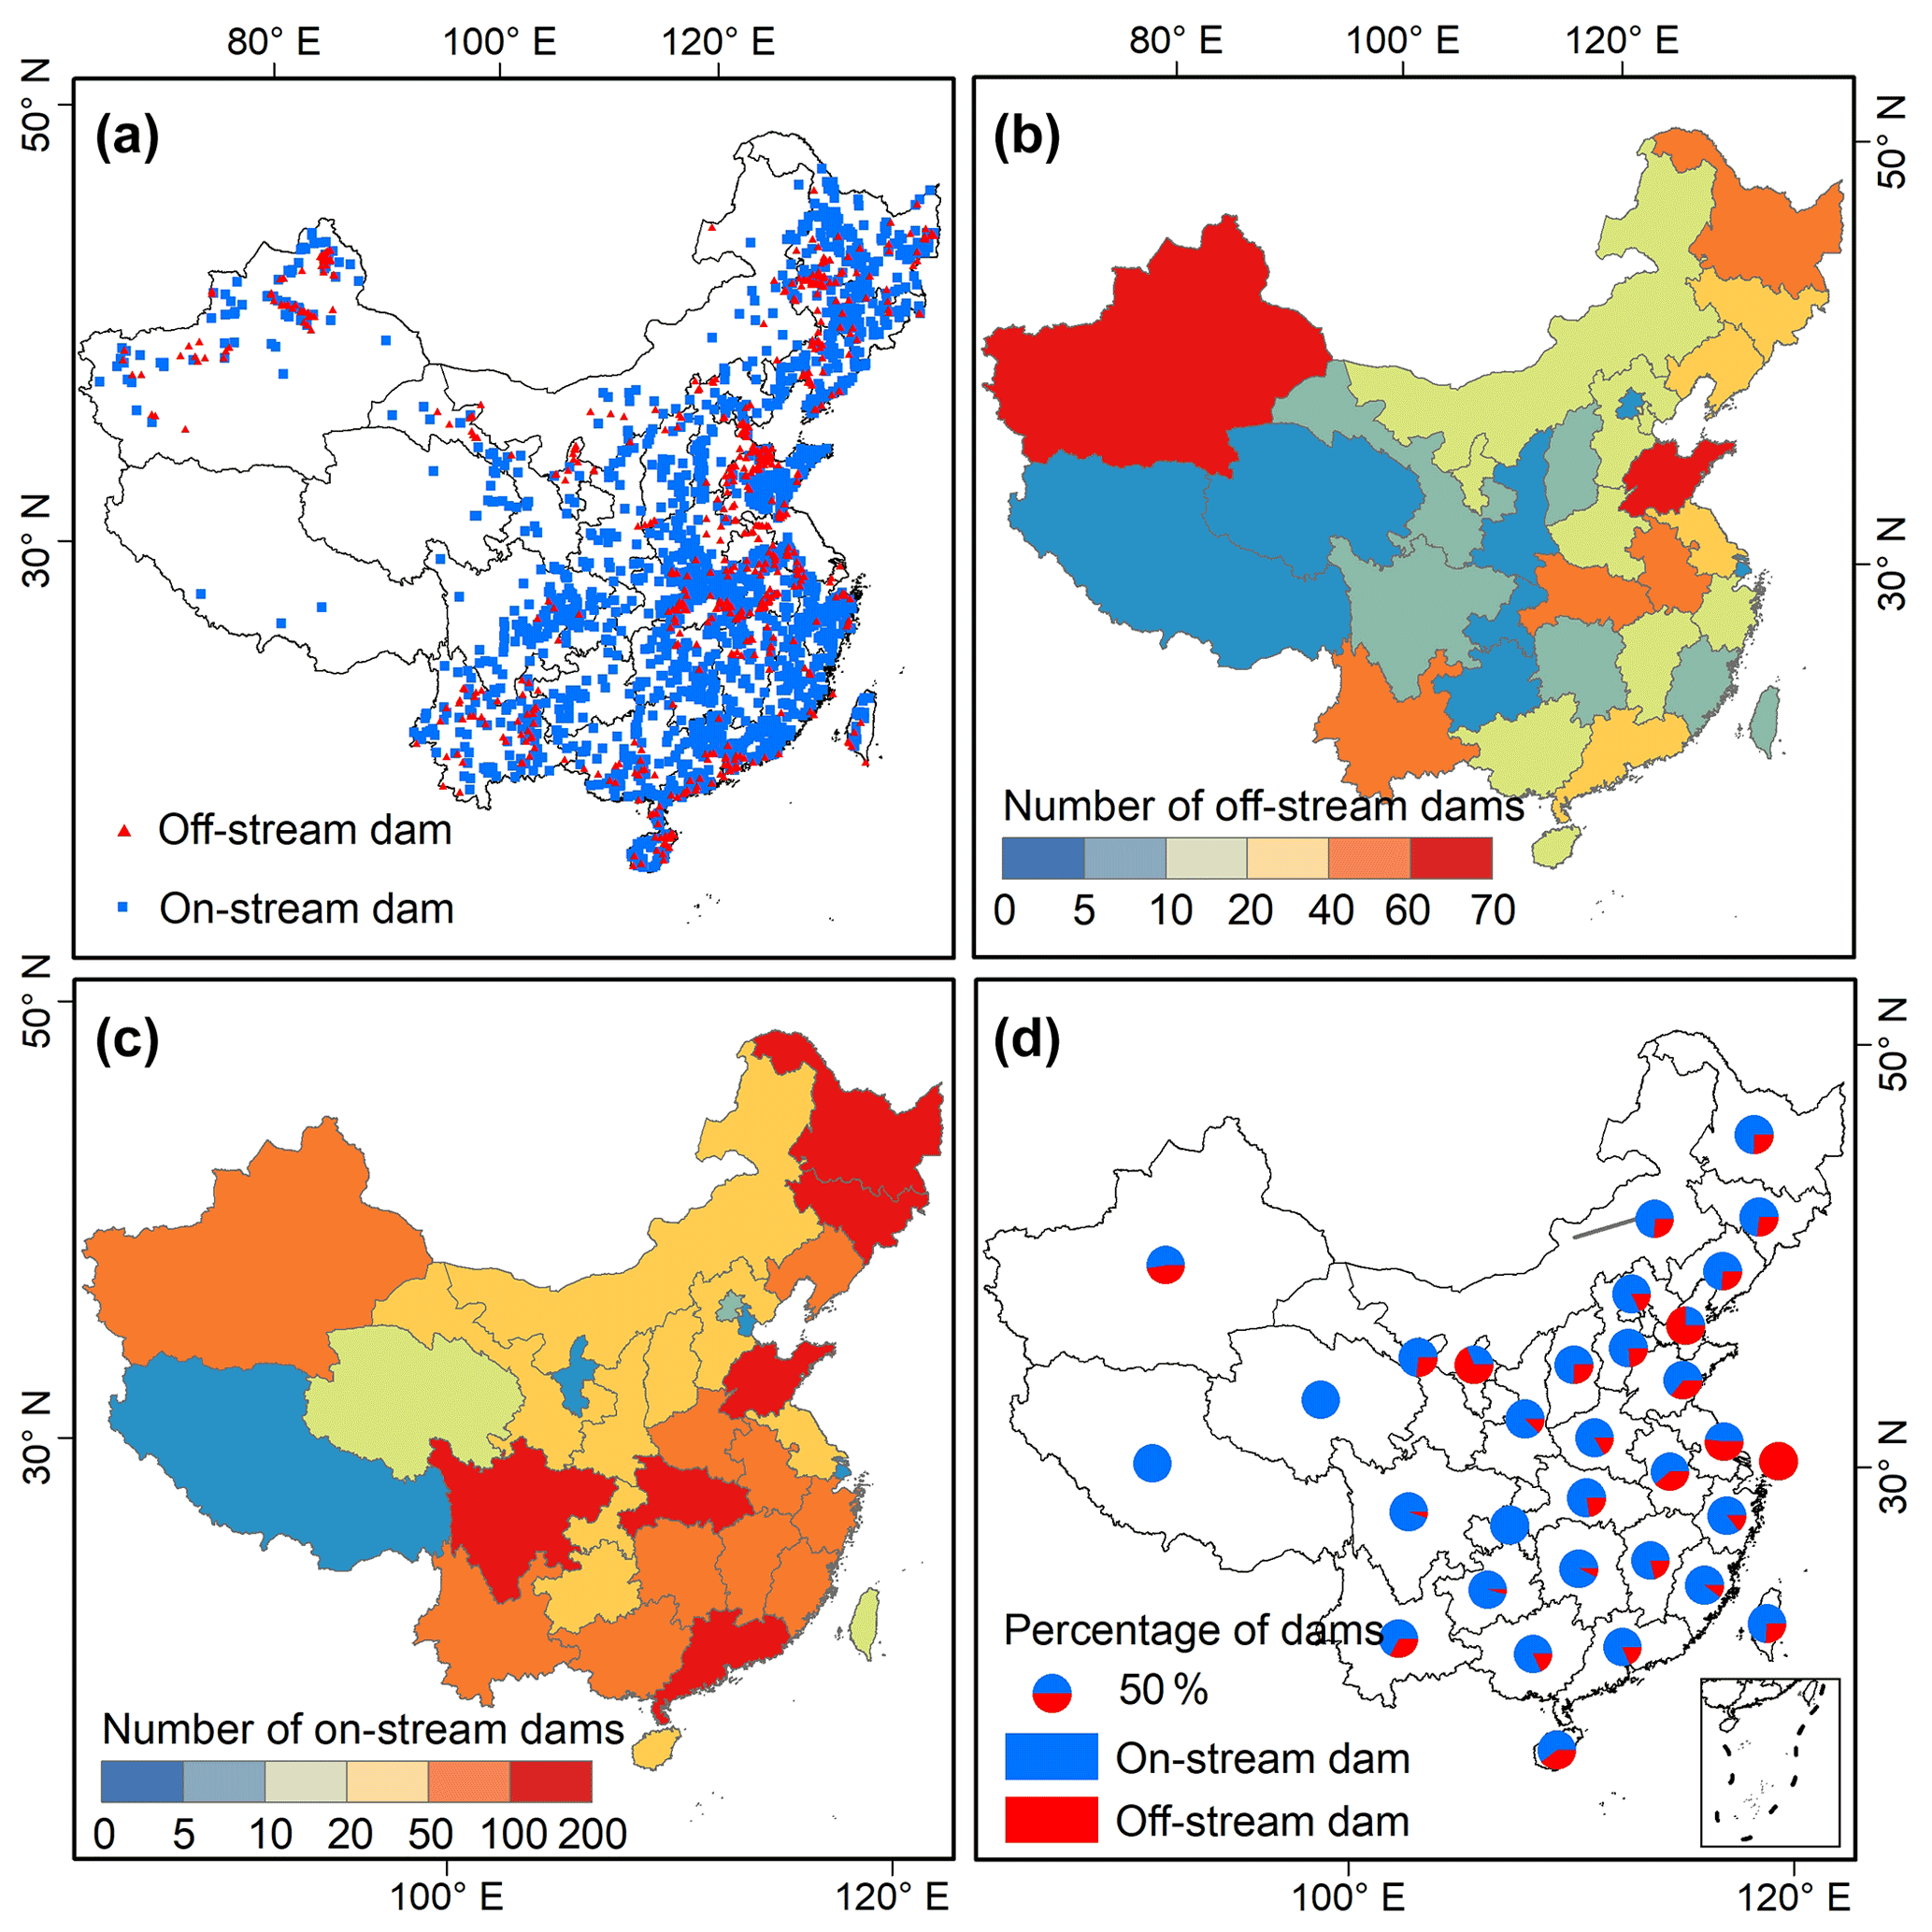
Figure 7Distribution of off-stream and on-stream dams in China for 2019. (a) Spatial distribution of dams; (b) number of off-stream dams by province; (c) number of on-stream dams by province; and (d) percentage of off-stream and on-stream dams by province.
China had 3051 large lakes with an area of > 1 km2 in 2019, most of which were distributed in West China, the lower Yangtze River basin, and Northeast China (Figs. 8a, S6), and they together amounted to ∼ 73.38 × 10³ km2. Tibet in West China had the largest number of lakes (966), followed by Qinghai (479), Xinjiang (350), Inner Mongolia (234), and Heilongjiang (174) provinces (Fig. 8b). The lake areas in China had similar spatial patterns with the lake numbers (Fig. 8c), and the western provinces in China had much larger lake areas than other provinces, especially Tibet and Qinghai provinces with 31.73 × 10³ and 15.78 × 10³ km2, respectively. As reservoirs and dams usually exist simultaneously, the spatial patterns of reservoir numbers and areas matched well with those of dam numbers (Figs. 7b, 8e–f). In total, China had 2194 large reservoirs in 2019, they together amounted to an area of ∼ 16.35 × 10³ km2. Xinjiang in Northwest China had the largest reservoir area (1923.11 km2), followed by Heilongjiang (1468.48 km2), Jiangsu (1309.95 km2), and Hubei (1190.75 km2) provinces. In contrast, Tibet (18.34 km2), Shanghai (36.61 km2), and Ningxia (45.40 km2) had much smaller reservoir areas than other provinces in China. In general, most of the dams and reservoirs in China were distributed in South China, East China, and Northeast China, whereas most of lakes were located in West China, the lower Yangtze River basin, and Northeast China.
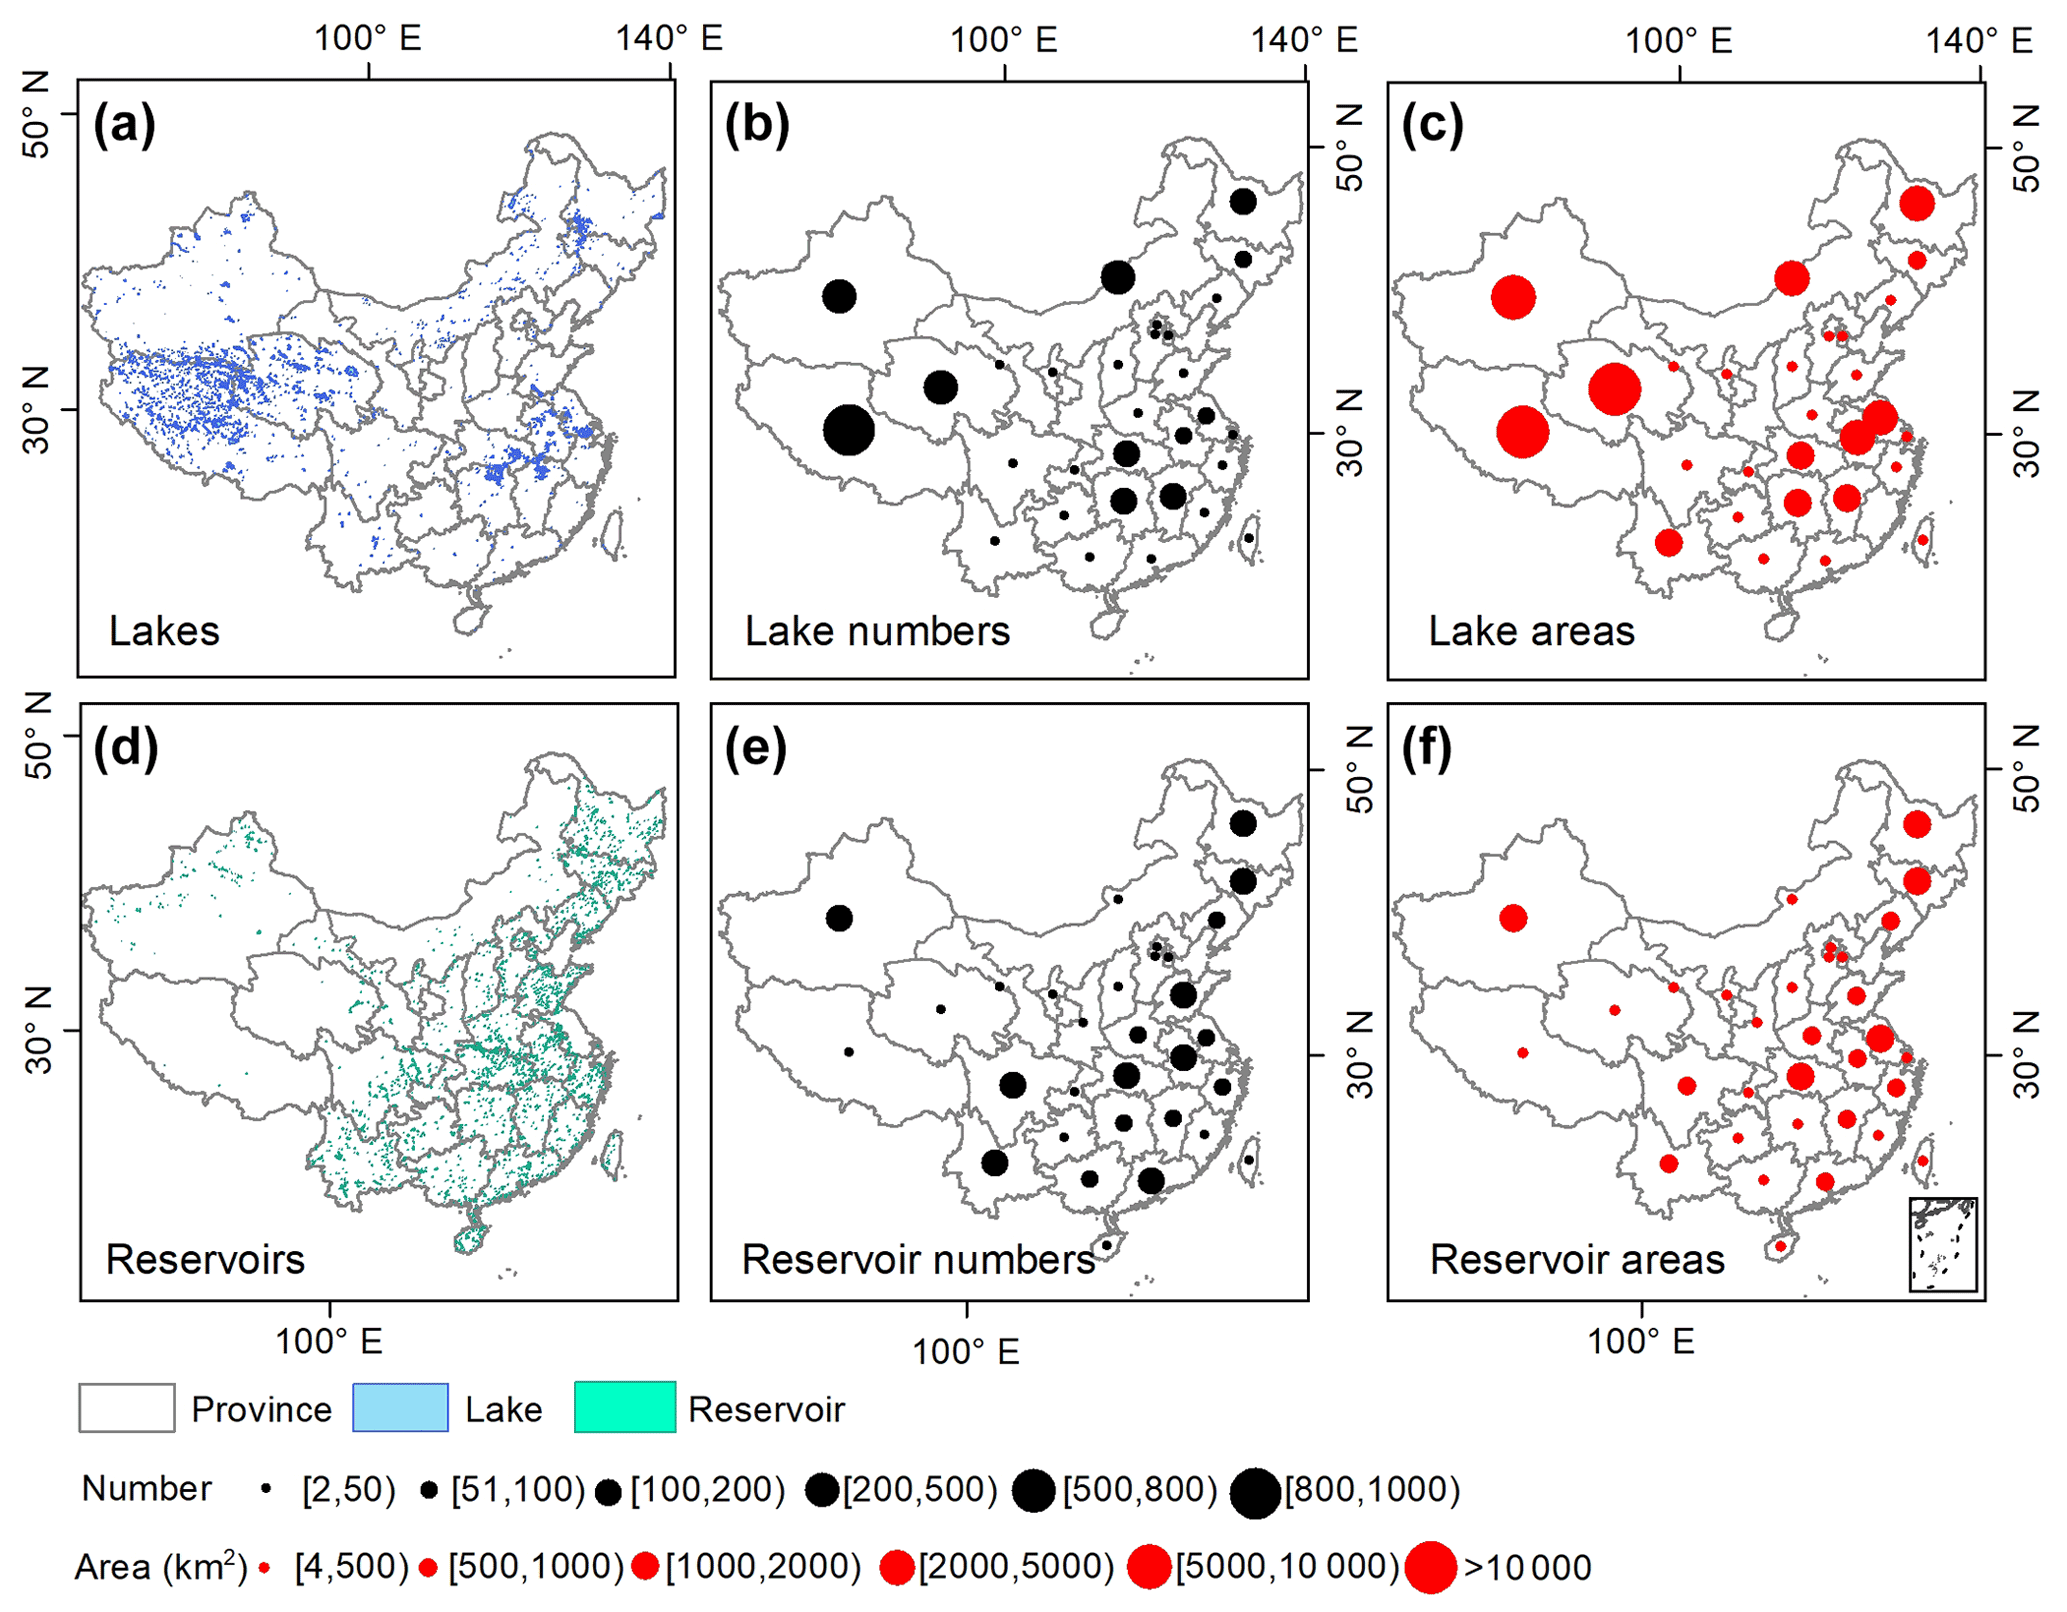
Figure 8Numbers and areas of lakes and reservoirs in China for 2019. (a) Spatial distribution of lakes; (b) lake numbers by province; (c) lake areas by province; (d) spatial distribution of reservoirs; (e) reservoir numbers by province; and (f) reservoir areas by province.
4.1 Improvements of the dataset of large dams, reservoirs, and lakes in China
In order to validate the reliability of our China-LDRL dataset, we first compared the numbers of large dams and areas of large reservoirs between our dataset and published datasets (GOODD, GRanD, and GeoDAR), then we checked the geographical coordinates of dams within the historical satellite images in 2019 in Google Earth Pro.
The GOODD dataset has the largest number of dams (9234) in China among these published global datasets (Fig. 2a). However, it includes both large, moderate, and small dams, and does not report the corresponding reservoir attributes (e.g., reservoir area), which limits its applications to water-related research (Paredes-Beltran et al., 2021). The GRanD dataset has the smallest number (814) of large dams with reservoir area > 1 km2 in China (Fig. 9b, e), as the dam information was provided by multiple institutions from the world (Lehner et al., 2011), which clearly underestimates the number of dams. The GeoDAR dataset has a larger number of large dams (1162) than the GRanD dataset because it was generated by combining the GRanD and ICOLD WRD datasets (Wang et al., 2022a). However, our China-LDRL dataset identified 2418 large dams and 2194 large reservoirs (Fig. 9d, e), making a substantial improvement of large dam and reservoir dataset in China.
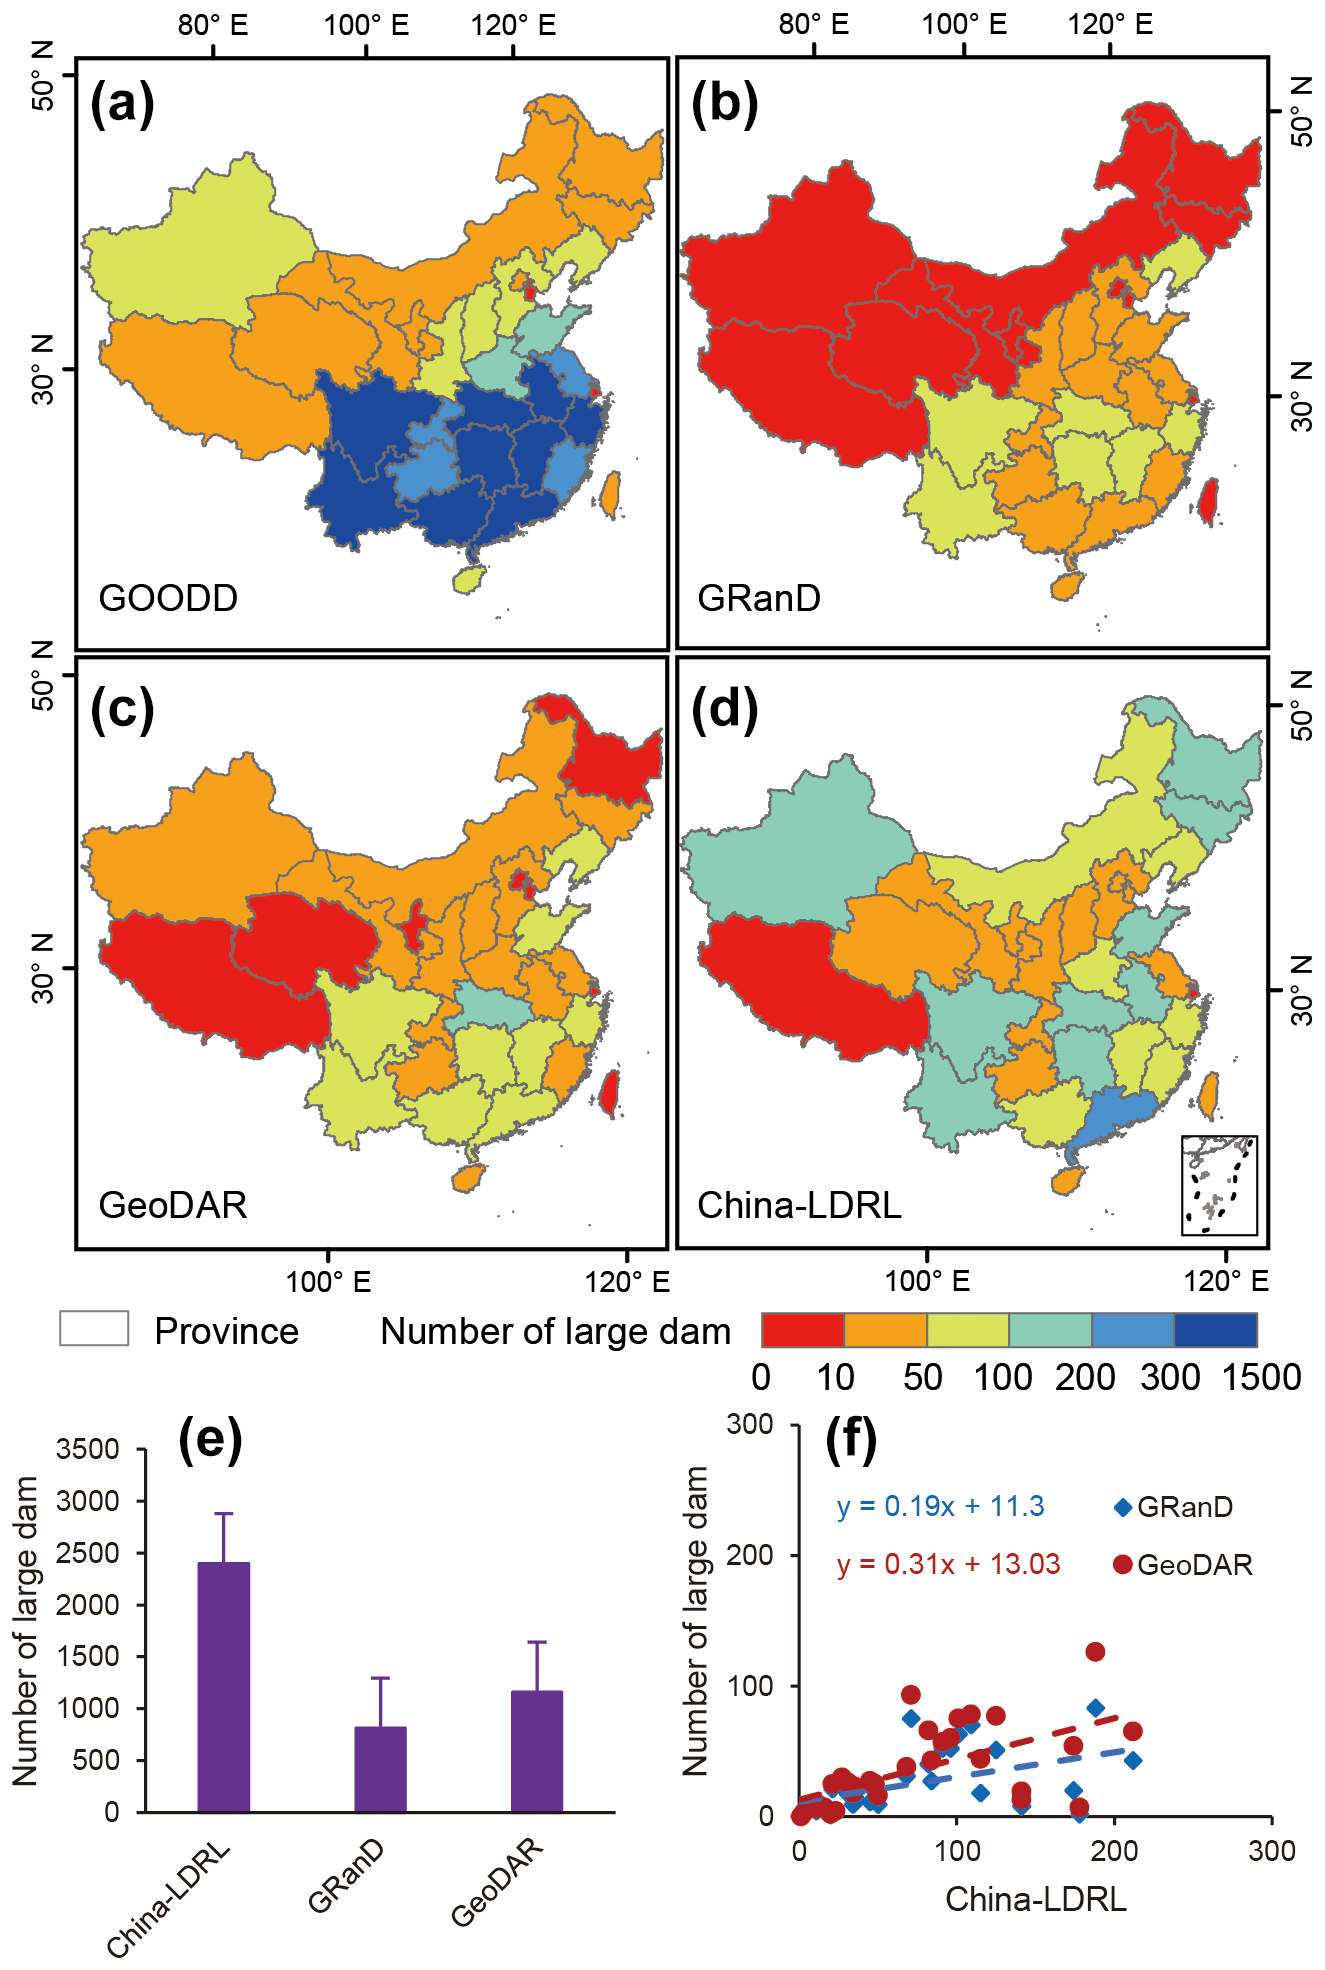
Figure 9Numbers of large dams (with reservoir area > 1 km2) of different datasets. (a) Large dam number in the GOODD dataset; (b) large dam number in the GRanD dataset; (c) large dam number in the GeoDAR dataset; (d) large dam number in the China-LDRL dataset; (e) total numbers of large dam from different datasets in China; and (f) the relationships of large dam numbers between China-LDRL, GRand, and GeoDAR datasets.
The number differences of large dams between our China-LDRL and the GRanD and GeoDAR datasets could be explained by several factors. First, our study used all the available Landsat images in 2019 and a more accurate SWB mapping algorithm to generate SWB maps in China; however, the GRanD and GeoDAR datasets used the SWBD map (produced in 2000) (Slater et al., 2006) and the surface water maps during 1984–2015 produced by the JRC (Pekel et al., 2016). We were able, therefore, to integrate more Landsat images and get more SWB polygons, and larger numbers of large dams and reservoirs than other datasets. In addition, the different strategies for identifying dams also caused the differences of dam numbers. The dam information from the GRanD dataset was contributed by 11 participating institutions, and the GeoDAR dataset combined two published dam datasets (WRD and GRanD), rechecked detailed dam information using the Google Maps geocoding API, and then reported the georeferenced information of dams. Unlike the GRanD and GeoDAR datasets, our study first generated SWB raster and vector maps using the mNDWIVIs SWB mapping algorithm, and then selected the large yearlong SWB polygons with area > 1 km2. After that, we visually checked the large SWB polygons one by one and identified each dam with accurate geographical coordinates (Fig. S3). In addition to the dam numbers, we also compared the reservoir areas between different datasets (Fig. S7). Our China-LDRL dataset reported ∼ 16.35 × 10³ km2 large reservoir area, which was smaller than those of the GRanD (20.98 × 10³ km2) and GeoDAR (21.84 × 10³ km2) datasets. The GRanD v1.3 dataset linked the “maximum surface water extent” from the JRC dataset to the corresponding dams as the reservoir regions; however, we used the “yearlong surface water body” to depict the reservoirs in the China-LDRL dataset, which might have made our reservoir areas smaller (Fig. S8).
In this study, we also checked the accuracy of geographical coordinates of dams from these dam datasets. Here we first uploaded above-mentioned three dam datasets and our China-LDRL dataset in the Google Earth Pro and visually checked the spatial distribution of each dam within the historical satellite images in 2019 (Fig. 10). We found that the dam locations of the GOODD dataset had substantial geographic offsets, some of which are larger than 500 m (Fig. S9). We further overlapped the GOODD dam layer with our yearlong SWB map (Sect. 2.3.1), and the results showed that only 12.52 ± 3.87 % of the GOODD dams were intersected with the SWB layer at the national scale (Fig. S10a). In the case that we applied a 100 and 500 m tolerance when intersecting the GOODD dams with our yearlong SWB map for 2019, the intersection rate increased to only 47.58 ± 9.70 % and 76.46 ± 7.11 %, respectively (Figs. S10b, S11). In addition, we applied different tolerances when the GRanD and GeoDAR datasets intersected with our yearlong SWB layer. About 65.57 ± 6.79 % of the dams in the GRanD dataset intersected with our yearlong SWB map, which increased to 87.52 ± 6.45 % and 95.94 ± 4.49 % when using a 100 and 500 m tolerance. Although the GeoDAR dataset is just updated and the newest version had much higher accuracy than the previous version, its geographical coordinates also had some offsets (Fig. 10f, g), and 58.49 ± 6.07 % of its dams intersected with the yearlong SWB layer, and 82.33 ± 3.98 % and 90.22 ± 3.18 % intersected when the tolerance was 100 and 500 m. Different methods and purposes caused the georeferenced offsets of these datasets. For example, the original digitized dam points in GOODD V1.0 were purposefully snapped to the 30 arcsec HydroSHEDS river networks, leading to the offset from the actual dam locations. On the other hand, GOODD v1.0 is directly compatible with HydroSHEDS and is therefore more convenient for modeling purposes. In GeoDAR v1.1, dam points in China were georeferenced using the Google Maps geocoding API, and many dam labels fell on the reservoir surface instead of the dams. Additionally, Google Maps in China have substantial misalignment (500 m to 1 km or so) between the satellite images and the map labels due to China's GPS shift problem, resulting in the geographic offsets even though the geocoding procedure is correct. In total, these comparisons suggested the improved accuracy of our China-LDRL dataset, which could provide important and reliable information for water resource management and water security in China.
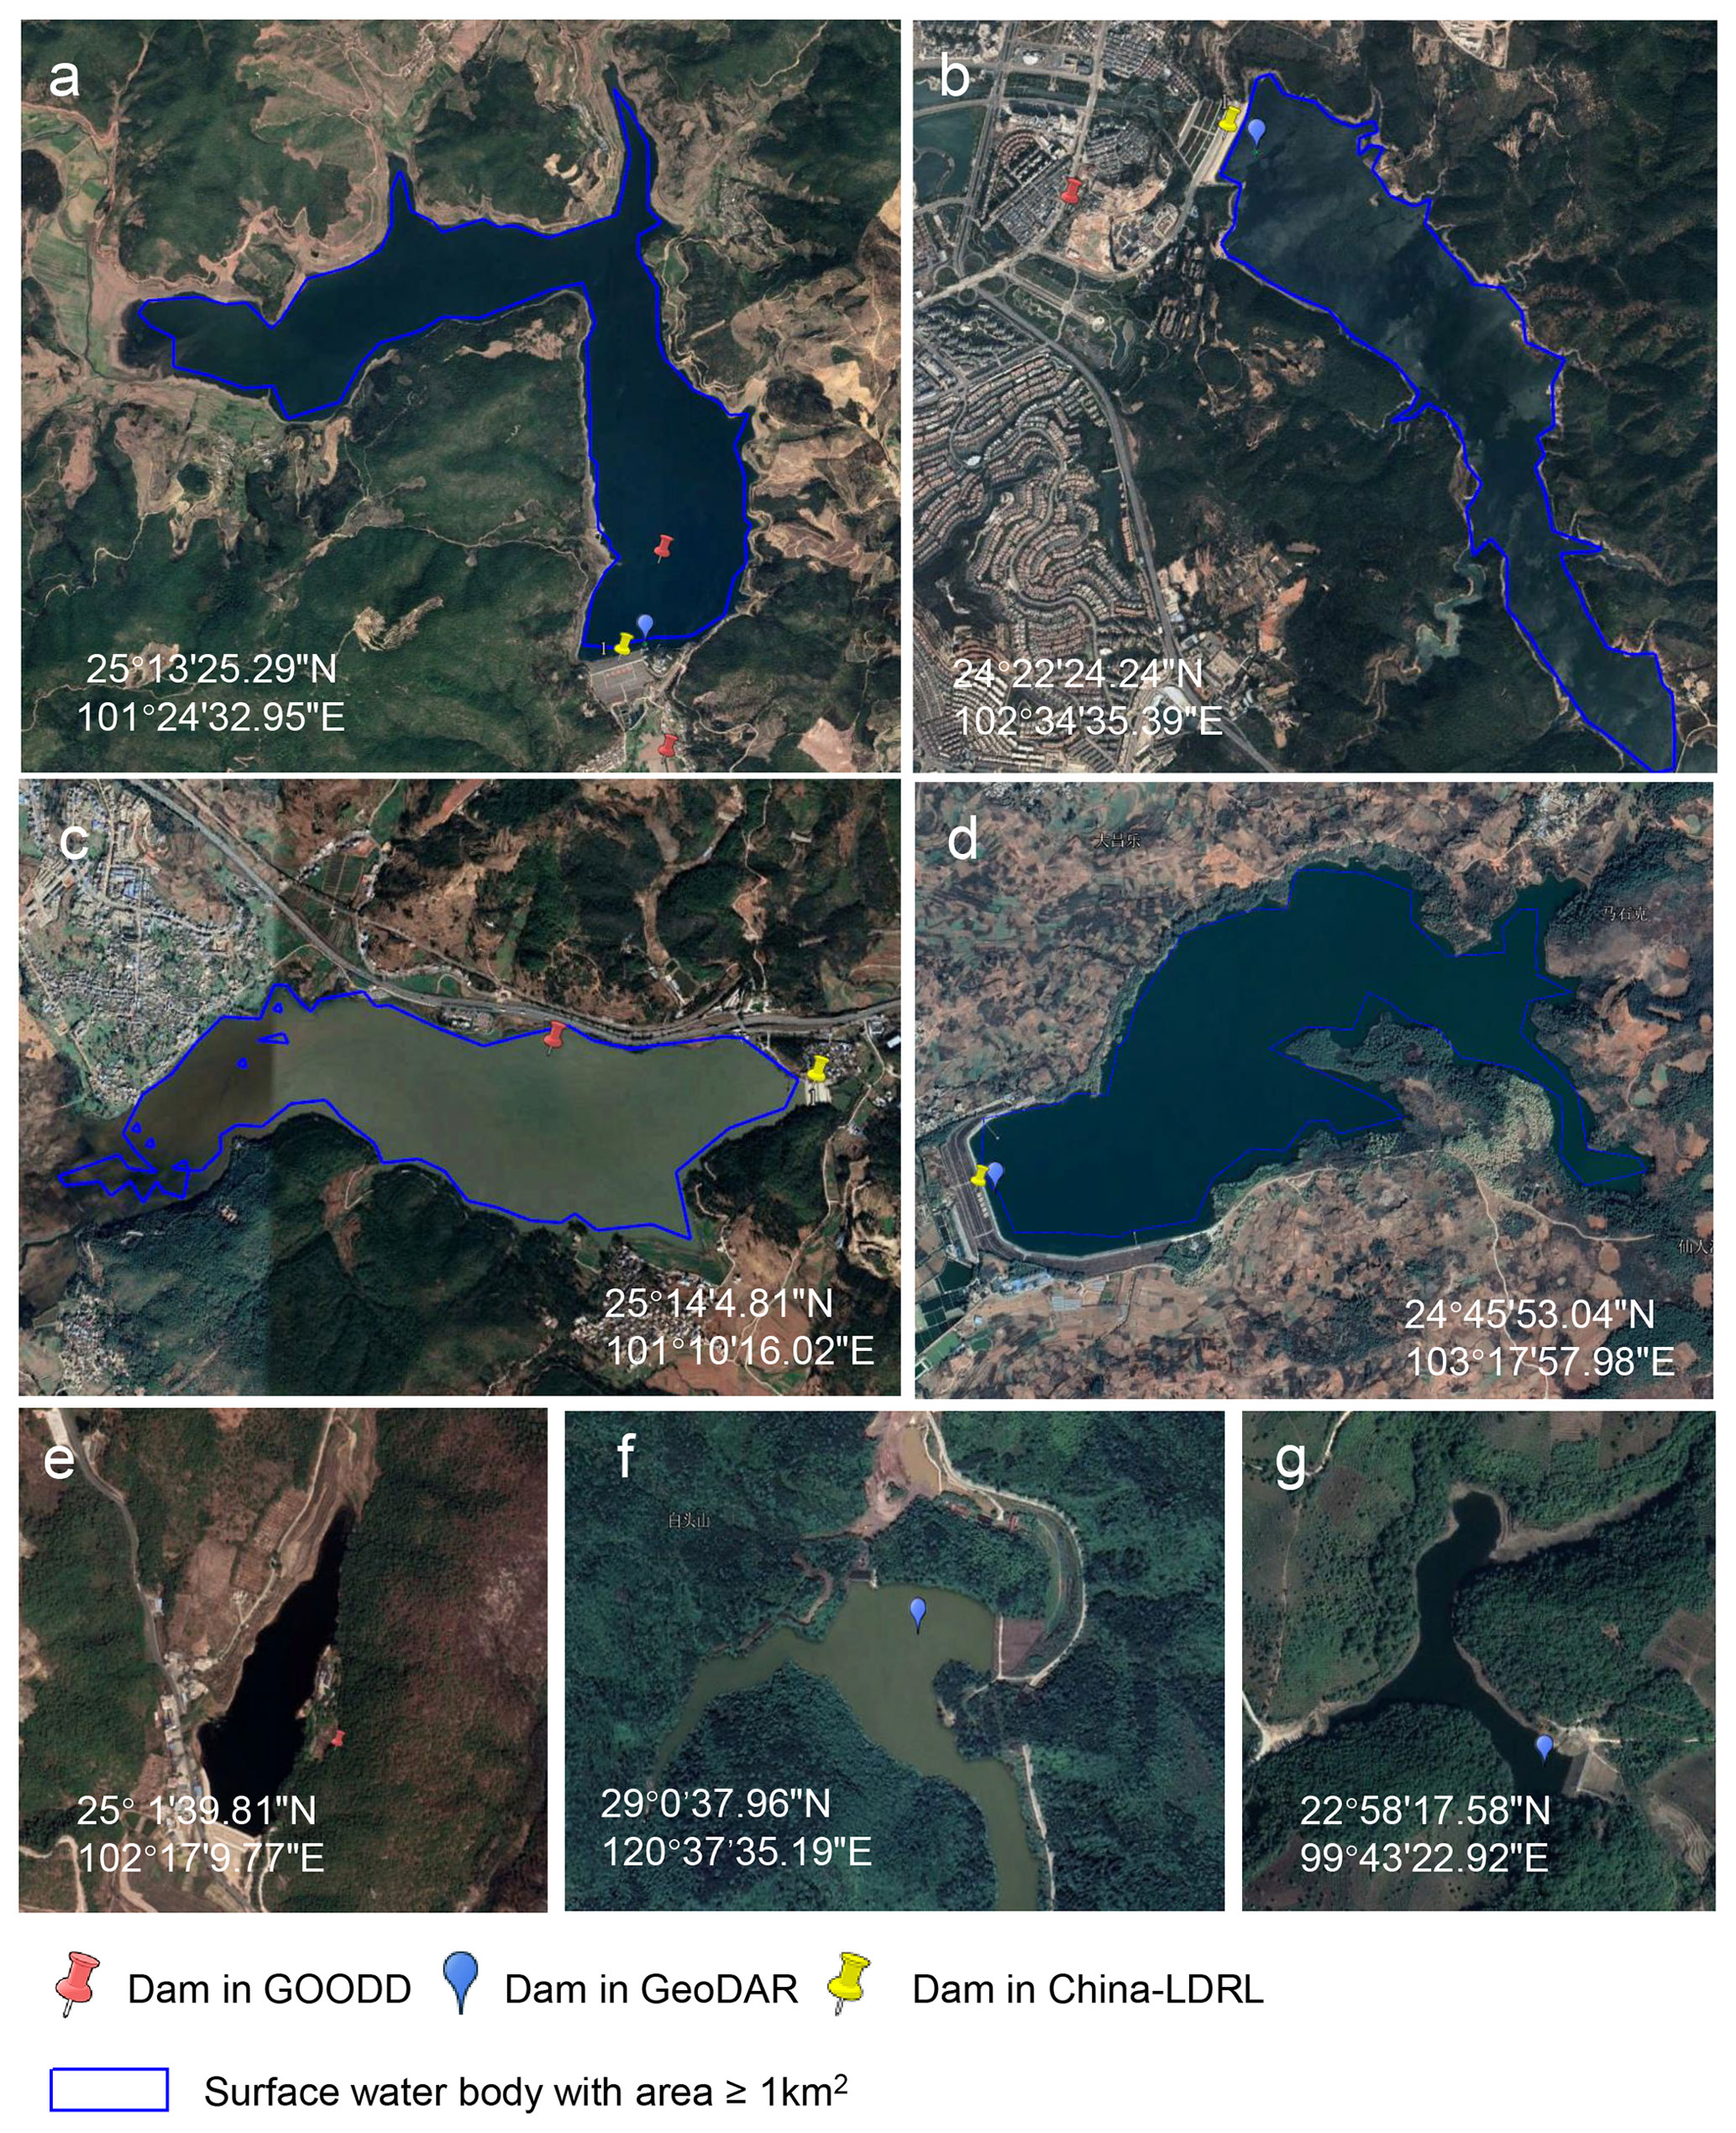
Figure 10Dams from the GOODD, GeoDAR, and China-LDRL datasets within Google Earth Pro (© Google Earth Pro 2019).
4.2 Uncertainties, limitations, outlooks, and implications
In this study, we produced a detailed and more accurate dataset for China's open surface water bodies, large dams, reservoirs, and lakes (China-LDRL) for 2019, and analyzed their spatial distribution patterns. This study benefited from the usage of time-series Landsat imagery and GEE cloud computing platform, and simple and robust SWB mapping algorithms. First, time series Landsat images at high spatial resolution (30 m) provide larger numbers of good-quality observations for identifying SWB. Second, GEE cloud computing platform enables us to acquire and analyze tens of thousands of Landsat images in hours. Third, the mNDWIVIs algorithm used in this study reduced the uncertainties induced by the bad-quality observations and provide accurate SWB maps. Finally, we visually checked the large SWB polygons (area > 1 km2) one by one by using the historical satellite images in 2019 within China in Google Earth Pro, and we recorded the georeferenced coordinates of individual dams in China for 2019.
We would also acknowledge that the data quality of input satellite images remains to be a concern for the identification of dams, reservoirs, and lakes. The spatial distribution of good-quality observations of Landsat data shows that more than 98.36 % of the total 30 m pixels in China had more than five good-quality observations and more than 91.24 % of the total pixels had more than 10 good-quality observations for 2019 (Fig. 1b), but the regions with complex topography and mountains, such as South and Southwest China, had much fewer good-quality observations than other regions, which might underestimate surface water areas, and dam and reservoir numbers and areas. In addition, it is impossible to remove all the bad-quality observations (e.g., clouds, terrain shadows) because of the limited quality of the QA band and digital elevation model data in GEE. Therefore, the remaining bad-quality observations could result in some inevitable uncertainties in the resultant maps. In the future, as more images from Landsat datasets and other high spatial resolution sensors (e.g., Sentinel-1, Sentinel-2) are added into GEE platform (Wulder et al., 2016), SWB mapping accuracy could be further improved, providing more detailed geospatial data of dams, reservoirs, and lakes in China. In addition, visual interpretation method for identifying dams and reservoirs in this study could also bring about some uncertainties to the classification of dams/reservoirs due to the limitations of knowledge and experience of interpreters, such as the misclassification of some reservoirs regulated by dams/gates as lakes (e.g., Hongze Lake in Jiangsu Province) and the misclassification between on-stream and off-stream dams/reservoirs.
In our China-LDRL dataset, we identified and reported those large SWB; however, the importance of monitoring small water bodies (area ≤ 1 km2) and dams is gradually recognized as they play critical roles in accurate assessments of their agricultural potential or their cumulative influence on watershed hydrology (Ogilvie et al., 2018). In the future, we can include these small SWB polygons into our dataset to enhance the spatial details and distributions of dams, reservoirs, and lakes in China.
The conversions between rivers, lakes, and reservoirs have critical effects on the ecosystem services. For example, the construction of the Three Gorges Dam contributed to the decrease of surface water area and biodiversity in its downstream areas (Fang et al., 2006; Feng et al., 2013; Wang et al., 2020a), and reduced the sediment loads in the Yangtze River, causing the decreased deposition rates of coastal wetlands in the Yangtze Delta (Feng et al., 2016; Wang et al., 2021a). Furthermore, the conversion from natural lakes and rivers to man-made reservoirs has disproportionate effects on the local, regional, and global carbon cycle (Howard Coker et al., 2009). For example, dam construction has reduced the areal extent of CO2 gas exchange in natural rivers (Ran et al., 2021). In the future, more detailed information (e.g., construction year of dam) needs to be included in our China-LDRL dataset, making it possible to analyze the effects of conversions from natural lakes and rivers to reservoirs on the biodiversity and carbon cycle.
The China-LDRL dataset is publicly available at https://doi.org/10.6084/m9.figshare.16964656.v3 (Wang et al., 2021b), and it includes three shapefiles. The “China_large_dams.shp” is the large dams in China with five attributes, including ID (dam_id), dam class (dam_class, “1” means on-stream dam and “-1” means off-stream dam), longitude, latitude, and corresponding reservoir ID (reser_id). The “China_large_lakes.shp” is the large lakes map in China with three attributes: ID, lake area (poly_area, km2), and lake perimeter (poly_len, km). The “China_large_reservoirs.shp” is the large reservoirs map in China with five attributes: ID, reservoir area (poly_area, km2), reservoir perimeter (poly_len, km), corresponding dam ID (dam_ID), and dam classes (dam_class).
Code used in calculations of surface water bodies is available upon request.
Several studies have published global or national dam, reservoir, and lake datasets based on satellite images (Table 1). However, these datasets usually have large georeferenced coordinate offsets, which poses some limitations to those studies that aim to address major issues in hydrology, ecology, and water resource management in China. In this study, we have generated the dataset of China's open surface water bodies, large dams, reservoirs, and lakes (China-LDRL) for 2019, and then analyzed their spatial distributions at the provincial and national scales. Satellite image data quality is still a major source of uncertainty that affects the accuracy of the surface water body maps. As more images from Landsat datasets and other high spatial resolution sensors (e.g., Sentinel-1, Sentinel-2) are added to GEE platform, the accuracy of SWB maps can be further improved, providing more detailed geospatial data of dams, reservoir, and lakes in China. The provision of the reliable, accurate China-LDRL dataset on dams, reservoirs, and lakes will contribute to the understanding of water resources management and water security in China.
The supplement related to this article is available online at: https://doi.org/10.5194/essd-14-3757-2022-supplement.
XX, XW, and BL designed the study. XW carried out image data processing, and led interpretation of the results and writing of the article. YQ and JD contributed to image data processing. XX, BL, YQ, JD, and JW contributed to the interpretation and discussion of the results.
The contact author has declared that none of the authors has any competing interests.
Publisher's note: Copernicus Publications remains neutral with regard to jurisdictional claims in published maps and institutional affiliations.
The authors greatly appreciate the free access to the Landsat data provided by USGS and the Google Earth Engine cloud computing platform. We also thank the editor, David Carlson, as well as two reviewers for their insightful comments and suggestions.
This study was jointly supported by research grants from the U.S. National Science Foundation (grant no. 1911955), the Natural Science Foundation of China (grant no. 81961128002), the China Postdoctoral Science Foundation (grant nos. 2021M700835 and 2021TQ0072), and the China Scholarship Council (grant no. 201906100124).
This paper was edited by David Carlson and reviewed by Jida Wang and one anonymous referee.
Armstrong, A.: Lake carbon, Nat. Geosci., 3, 151, https://doi.org/10.1038/ngeo816, 2010.
Birkett, C. M. and Mason, I. M.: A New Global Lakes Database for a Remote Sensing Program Studying Climatically Sensitive Large Lakes, J. Great Lakes Res., 21, 307–318, https://doi.org/10.1016/S0380-1330(95)71041-3, 1995.
Dalin, C., Hanasaki, N., Qiu, H., Mauzerall, D. L., and Rodriguez-Iturbe, I.: Water resources transfers through Chinese interprovincial and foreign food trade, P. Natl. Acad. Sci. USA, 111, 9774–9779, https://doi.org/10.1073/pnas.1404749111, 2014.
Fang, J., Wang, Z., Zhao, S., Li, Y., Tang, Z., Yu, D., Ni, L., Liu, H., Xie, P., Da, L., Li, Z., and Zheng, C.: Biodiversity changes in the lakes of the Central Yangtze, Ecol. Environ., 4, 369–377, https://doi.org/10.1890/1540-9295(2006)004[0369:BCITLO]2.0.CO;2, 2006.
Feng, L., Hu, C., Chen, X., and Zhao, X.: Dramatic inundation changes of China's two largest freshwater lakes linked to the Three Gorges Dam, Environ. Sci. Technol., 47, 9628–9634, https://doi.org/10.1021/es4009618, 2013.
Feng, L., Han, X., Hu, C., and Chen, X.: Four decades of wetland changes of the largest freshwater lake in China: Possible linkage to the Three Gorges Dam?, Remote Sens. Environ., 176, 43–55, https://doi.org/10.1016/j.rse.2016.01.011, 2016.
Feng, S., Liu, S., Huang, Z., Jing, L., Zhao, M., Peng, X., Yan, W., Wu, Y., Lv, Y., Smith, A. R., McDonald, M. A., Patil, S. D., Sarkissian, A. J., Shi, Z., Xia, J., and Ogbodo, U. S.: Inland water bodies in China: Features discovered in the long-term satellite data, P. Natl. Acad. Sci. USA, 116, 25491–25496, https://doi.org/10.1073/pnas.1910872116, 2019.
Gao, H.: Satellite remote sensing of large lakes and reservoirs: from elevation and area to storage, Wires Rev. Water, 2, 147–157, https://doi.org/10.1002/wat2.1065, 2015.
Gao, H., Birkett, C., and Lettenmaier, D. P.: Global monitoring of large reservoir storage from satellite remote sensing, Water Resour. Res., 48, W09504, https://doi.org/10.1029/2012WR012063, 2012.
Hayes, N. M., Deemer, B. R., Corman, J. R., Razavi, N. R., and Strock, K. E.: Key differences between lakes and reservoirs modify climate signals: A case for a new conceptual model, Limnol. Oceanogr. Lett., 2, 47–62, https://doi.org/10.1002/lol2.10036, 2017.
Howard Coker, E., Hotchkiss, R. H., and Johnson, D. A.: Conversion of a Missouri River Dam and Reservoir to a Sustainable System: Sediment Management1, J. Am. Water Resour. As., 45, 815–827, https://doi.org/10.1111/j.1752-1688.2009.00324.x, 2009.
ICOLD: World Register of Dams, Paris, International Commission on Large Dams, http://www.icold-cigb.org (last access: 18 February 2022), 2011.
Lehner, B. and Döll, P.: Development and validation of a global database of lakes, reservoirs and wetlands, J. Hydrol., 296, 1–22, https://doi.org/10.1016/j.jhydrol.2004.03.028, 2004.
Lehner, B., Liermann, C. R., Revenga, C., Vörömsmarty, C., Fekete, B., Crouzet, P., Döll, P., Endejan, M., Frenken, K., Magome, J., Nilsson, C., Robertson, J. C., Rödel, R., Sindorf, N., and Wisser, D.: High-resolution mapping of the world's reservoirs and dams for sustainable river-flow management, Front. Ecol. Environ., 9, 494–502, https://doi.org/10.1890/100125, 2011.
Liu, J. and Yang, W.: Water sustainability for China and beyond, Science, 337, 649–650, https://doi.org/10.1126/science.1219471, 2012.
Ma, R. H., Yang, G. S., Duan, H. T., Jiang, J. H., Wang, S. M., Feng, X. Z., Li, A. N., Kong, F. X., Xue, B., Wu, J. L., and Li, S. J.: China's lakes at present: Number, area and spatial distribution, Sci. China Earth Sci., 54, 283–289, https://doi.org/10.1007/s11430-010-4052-6, 2011.
Mulligan, M., van Soesbergen, A., and Sáenz, L.: GOODD, a global dataset of more than 38,000 georeferenced dams, Sci. Data, 7, 1–8, https://doi.org/10.1038/s41597-020-0362-5, 2020.
Murray, N. J., Phinn, S. R., DeWitt, M., Ferrari, R., Johnston, R., Lyons, M. B., Clinton, N., Thau, D., and Fuller, R. A.: The global distribution and trajectory of tidal flats, Nature, 565, 222, https://doi.org/10.1038/s41586-018-0805-8, 2019.
Ogilvie, A., Belaud, G., Massuel, S., Mulligan, M., Le Goulven, P., and Calvez, R.: Surface water monitoring in small water bodies: potential and limits of multi-sensor Landsat time series, Hydrol. Earth Syst. Sci., 22, 4349–4380, https://doi.org/10.5194/hess-22-4349-2018, 2018.
Paredes-Beltran, B., Sordo-Ward, A., and Garrote, L.: Dataset of Georeferenced Dams in South America (DDSA), Earth Syst. Sci. Data, 13, 213–229, https://doi.org/10.5194/essd-13-213-2021, 2021.
Pekel, J. F., Cottam, A., Gorelick, N., and Belward, A. S.: High-resolution mapping of global surface water and its long-term changes, Nature, 540, 418, https://doi.org/10.1038/nature20584, 2016.
Ran, L., Butman, D. E., Battin, T. J., Yang, X., Tian, M., Duvert, C., Hartmann, J., Geeraert, N., and Liu, S.: Substantial decrease in CO2 emissions from Chinese inland waters due to global change, Nat. Commun., 12, 1–9, https://doi.org/10.1038/s41467-021-21926-6, 2021.
Slater, J. A., Garvey, G., Johnston, C., Haase, J., Heady, B., Kroenung, G., and Little, J. K.: The SRTM Data Finishing Process and Products, Photogramm. Eng. Rem. S., 72, 237–247, 2006.
Tao, S., Zhang, H., Feng, Y., and Zhu, J.: Changes in China's water resources in the early 21st century, Front. Ecol. Environ., 18, 188–193, https://doi.org/10.1002/fee.2164, 2020.
Thornton, J., Steel, A., and Rast, W.: Chapter 8 – Reservoirs, in: Water quality assessments: a guide to the use of biota, sediments and water in environmental monitoring, edited by: Chapman, D. V., E&FN Spon, 2nd Edn., 2–3, ISBN 0419216006, 1996.
Wang, J., Sheng, Y., Gleason, C. J., and Wada, Y.: Downstream Yangtze River levels impacted by Three Gorges Dam, Environ. Res. Lett., 8, 044012, https://doi.org/10.1088/1748-9326/8/4/044012, 2013.
Wang, J., Walter, B. A., Yao, F., Song, C., Ding, M., Maroof, A. S., Zhu, J., Fan, C., McAlister, J. M., Sikder, S., Sheng, Y., Allen, G. H., Crétaux, J.-F., and Wada, Y.: GeoDAR: georeferenced global dams and reservoirs dataset for bridging attributes and geolocations, Earth Syst. Sci. Data, 14, 1869–1899, https://doi.org/10.5194/essd-14-1869-2022, 2022a.
Wang, J., Walter, B. A., Yao, F., Song, C., Ding, M., Maroof, A. S., Zhu, J., Fan, C., McAlister, J. M., Sikder, Md. S., Sheng, Y., Allen, G. H., Crétaux, J.-F., and Wada, Y.: GeoDAR: Georeferenced global Dams And Reservoirs dataset for bridging attributes and geolocations, Zenodo [data set], https://doi.org/10.5281/zenodo.6163413, 2022b.
Wang, X., Xiao, X., Zou, Z., Dong, J., Qin, Y., Doughty, R. B., Menarguez, M. A., Chen, B., Wang, J., Ye, H., Ma, J., Zhong, Q., Zhao, B., and Li, B.: Gainers and losers of surface and terrestrial water resources in China during 1989–2016, Nat. Commun., 11, 1–12, https://doi.org/10.1038/s41467-020-17103-w, 2020a.
Wang, X., Xiao, X., Zou, Z., Hou, L., Qin, Y., Dong, J., Doughty, R. B., Chen, B., Zhang, X., Chen, Y., Ma, J., Zhao, B., and Li, B.: Mapping coastal wetlands of China using time series Landsat images in 2018 and Google Earth Engine, ISPRS J. Photogramm., 163, 312–326, https://doi.org/10.1016/j.isprsjprs.2020.03.014, 2020b.
Wang, X., Xiao, X., Xu, X., Zou, Z., Chen, B., Qin, Y., Zhang, X., Dong, J., Liu, D., Pan, L., and Li, B.: Rebound in China's coastal wetlands following conservation and restoration, Nat. Sustain., 4, 1076–1083, https://doi.org/10.1038/s41893-021-00793-5, 2021a.
Wang, X., Xiao, X., Qin, X., Dong, J., Wu, J., and Li, B.: China-LDRL: China's surface water bodies, Large Dams, Reservoirs, and Lakes dataset, figshare [data set], https://doi.org/10.6084/m9.figshare.16964656.v3, 2021b.
Wu, J., Huang, J., Han, X., Gao, X., He, F., Jiang, M., Jiang, Z., Primack, R. B., and Shen, Z.: The Three Gorges Dam: An ecological perspective, Front. Ecol. Environ., 2, 241–248, https://doi.org/10.1890/1540-9295(2004)002[0241:TTGDAE]2.0.CO;2, 2004.
Wulder, M. A., White, J. C., Loveland, T. R., Woodcock, C. E., Belward, A. S., Cohen, W. B., Fosnight, E. A., Shaw, J., Masek, J. G., and Roy, D. P.: The global Landsat archive: Status, consolidation, and direction, Remote Sens. Environ., 185, 271–283, https://doi.org/10.1016/j.rse.2015.11.032, 2016.
Xiang, Y., Fu, Z., Meng, Y., Zhang, K., and Cheng, Z.: Analysis of wave clipping effects of plain reservoir artificial islands based on MIKE21 SW model, Water Sci. Eng., 12, 179–187, https://doi.org/10.1016/j.wse.2019.08.002, 2019.
Yang, X. and Lu, X.: Drastic change in China's lakes and reservoirs over the past decades, Sci. Rep., 4, 6041, https://doi.org/10.1038/srep06041, 2014.
Yang, X. and Lu, X. X.: Delineation of lakes and reservoirs in large river basins: An example of the Yangtze River Basin, China, Geomorphology, 190, 92–102, https://doi.org/10.1016/j.geomorph.2013.02.018, 2013.
Zhang, G., Yao, T., Chen, W., Zheng, G., Shum, C. K., Yang, K., Piao, S., Sheng, Y., Yi, S., Li, J., Oreilly, C., Qi, S., Shen, S., Zhang, H., and Jia, Y.: Regional differences of lake evolution across China during 1960s–2015 and its natural and anthropogenic causes, Remote Sens. Environ., 221, 386–404, https://doi.org/10.1016/j.rse.2018.11.038, 2019.
Zhang, Q., Li, L., Wang, Y. G., Werner, A. D., Xin, P., Jiang, T., and Barry, D. A.: Has the Three-Gorges Dam made the Poyang Lake wetlands wetter and drier?, Geophys. Res. Lett., 39, L20402, https://doi.org/10.1029/2012GL053431, 2012.
Zhou, F., Bo, Y., Ciais, P., Dumas, P., Tang, Q., Wang, X., Liu, J., Zheng, C., Polcher, J., Yin, Z., Guimberteau, M., Peng, S., Ottle, C., Zhao, X., Zhao, J., Tan, Q., Chen, L., Shen, H., Yang, H., Piao, S., Wang, H., and Wada, Y.: Deceleration of China's human water use and its key drivers, P. Natl. Acad. Sci. USA, 117, 7702–7711, https://doi.org/10.1073/pnas.1909902117, 2020.
Zhou, Y., Dong, J., Xiao, X., Xiao, T., Yang, Z., Zhao, G., Zou, Z., and Qin, Y.: Open surface water mapping algorithms: A comparison of water-related spectral indices and sensors, Water, 9, 256, https://doi.org/10.3390/w9040256, 2017.
Zhou, Y., Dong, J., Liu, J., Metternicht, G., Shen, W., You, N., Zhao, G., and Xiao, X.: Are there sufficient Landsat observations for retrospective and continuous monitoring of land cover changes in China?, Remote Sens., 11, 1808, https://doi.org/10.3390/rs11151808, 2019a.
Zhou, Y., Dong, J., Xiao, X., Liu, R., Zou, Z., Zhao, G., and Ge, Q.: Continuous monitoring of lake dynamics on the Mongolian Plateau using all available Landsat imagery and Google Earth Engine, Sci. Total Environ., 689, 366–380, https://doi.org/10.1016/J.SCITOTENV.2019.06.341, 2019b.
Zhu, J., Song, C., Wang, J., and Ke, L.: China's inland water dynamics: The significance of water body types, P. Natl. Acad. Sci. USA, 117, 13876–13878, https://doi.org/10.1073/pnas.2005584117, 2020.
Zhu, Z., Wang, S., and Woodcock, C. E.: Improvement and expansion of the Fmask algorithm: Cloud, cloud shadow, and snow detection for Landsats 4-7, 8, and Sentinel 2 images, Remote Sens. Environ., 159, 269–277, https://doi.org/10.1016/j.rse.2014.12.014, 2015.
Zou, Z. H., Dong, J. W., Menarguez, M. A., Xiao, X. M., Qin, Y. W., Doughty, R. B., Hooker, K. V., and Hambright, K. D.: Continued decrease of open surface water body area in Oklahoma during 1984–2015, Sci. Total Environ., 595, 451–460, https://doi.org/10.1016/j.scitotenv.2017.03.259, 2017.
Zou, Z. H., Xiao, X. M., Dong, J. W., Qin, Y. W., Doughty, R. B., Menarguez, M. A., Zhang, G. L., and Wang, J.: Divergent trends of open-surface water body area in the contiguous United States from 1984 to 2016, P. Natl. Acad. Sci. USA, 115, 3810–3815, https://doi.org/10.1073/pnas.1719275115, 2018.