the Creative Commons Attribution 4.0 License.
the Creative Commons Attribution 4.0 License.
 | 05 Aug 2022
A new snow depth data set over northern China derived using GNSS interferometric reflectometry from a continuously operating network (GSnow-CHINA v1.0, 2013–2022)
Wei Wan
Jie Zhang
Liyun Dai
Ting Yang
Baojian Liu
Zhizhou Guo
Heng Hu
Limin Zhao
The currently available long-term snow depth data sets are either from point-scale ground measurements or from gridded satellite/modeled/reanalysis data with coarse spatial resolution, which limits the applications in climate models, hydrological models, and regional snow disaster monitoring. Benefitting from its unique advantages of cost-effective and high spatiotemporal resolution (∼ 1000 m2, hourly in theory), snow depth retrieval using the Global Navigation Satellite System Interferometric Reflectometry (GNSS-IR) technique has become a popular topic in recent years. However, due to complex environmental and observation conditions, developing robust and operational technology to produce long-term snow depth data sets using observations from various GNSS station networks is still challenging. The two objectives of this study are (1) to propose a comprehensive framework using raw data of the complex GNSS station networks to retrieve snow depth and control its quality automatically; and (2) to produce a long-term snow depth data set over northern China (i.e., GSnow-CHINA v1.0, 12 h or 24 h, 2013–2022) using the proposed framework and historical data from 80 stations. The data set has high internal consistency with regards to different GNSS constellations (mean r=0.98, RMSD = 0.99 cm, and nRMSD (snow depth > 5 cm) = 0.11), different frequency bands (mean r = 0.97, RMSD = 1.46 cm, and nRMSD (snow depth > 5 cm) = 0.16), and different GNSS receivers (mean r = 0.62). The data set also has high external consistency with the in situ measurements and the passive microwave (PMW) product, with a consistent illustration of the interannual snow depth variability. Additionally, the result show the potential of GNSS to derive hourly snow depth observations for better monitoring of snow disasters. The proposed framework to develop the data set provides comprehensive and supportive information for users to process raw data of ground GNSS stations with complex environmental conditions and various observation conditions. The resulting GSnow-CHINA v1.0 data set is distinguished from the current point-scale in situ data or coarse-gridded data, which can be used as an independent data source for validation purposes. The data set is also useful for regional climate research and other meteorological and hydrological applications. The algorithm and data files will be maintained and updated as more data become available in the future. The GSnow-CHINA v1.0 data set is available at the National Tibetan Plateau/Third Pole Environment Data Center via https://doi.org/10.11888/Cryos.tpdc.271839 (Wan et al., 2021).
- Article
(7628 KB) - Full-text XML
- BibTeX
- EndNote


Snow cover is one of the most active elements in the cryosphere, and the maximum snow area during winter nearly occupies 50 % of the total land surface area of the Northern Hemisphere (Frei and Robinson, 1999; Armstrong and Brodzik, 2001; Robinson et al., 1993). The snow change plays a significant role in the hydrological, ecological, and climatic systems (Henderson et al., 2018). Therefore, accurately estimating snow cover and snow depth including their variations is essential for studies on climate and hydrology.
Currently, snow cover products derived from optical remote-sensing data present high accuracy (Hao et al., 2021), but snow depth products show significant uncertainties. Snow depth can be measured at point-scale using ground-based ultrasonic snow depth sensors or laser snow depth sensors, and mainly include observations from meteorological stations, snow surveys, and hydrological stations (Kinar and Pomeroy, 2015). Large-scale snow depth can be retrieved from optical, passive microwave (PMW), and active remote-sensing observations (Shi and Dozier, 2000; Guerreiro et al., 2016; Leinss et al., 2014; Che et al., 2016), yet currently operational observations have shortcomings. Optical remote sensing is affected by solar radiation and cloud (Dai et al., 2017). The PMW remote sensing has coarse spatial footprints (> 25 km), and the observations saturate in deep snow (> 0.8 m) (Lievens et al., 2019). Active microwave remote sensing has a long revisiting period (> 20 d) and high cost (Lievens et al., 2019).
The available global/hemispheric/regional snow depth data sets are mainly derived from ground observations, microwave remote sensing, model simulations, and reanalysis (Xiao et al., 2020). Representative snow depth data sets include (1) in situ measurements from ground networks such as SCAN and SNOTEL in the United States (point-scale, hourly/daily/weekly/monthly; http://www.wcc.nrcs.usda.gov, last access: 29 July 2022), (2) data sets derived from satellite PMW brightness temperatures, e.g., the Advanced Microwave Scanning Radiometer for the Earth Observing System (AMSR-E), its follow-on, the Advanced Microwave Scanning Radiometer-2 (AMSR2) (25 km, daily, global/regional, 2002–, https://nsidc.org/, last access: 29 July 2022), and the Global Snow Monitoring for Climate Research (GlobSnow) data set produced from the data assimilation of microwave radiometer data and meteorological station data (25 km, daily, hemispheric, 1979–, https://www.globsnow.info/, last access: 29 July 2022), (3) snow depth data set simulated using models such as snow modules in the Global Land Data Assimilation System (GLDAS-2.0, 1948, 0.25∘ × 0.67∘, 3-hourly and monthly; https://ldas.gsfc.nasa.gov/gldas), and (4) reanalysis of snow depth data sets from the ERA-Interim (1979–, 0.75∘, 6-hourly/daily/monthly; http://www.ecmwf.int/, last access: 29 July 2022) and the Modern-Era Retrospective Analysis for Research and Applications (MERRA) as well as their series data sets (MERRA-2/MERRA-Land, 1979, 0.5∘ × 0.67∘; https://gmao.gsfc.nasa.gov/reanalysis/, last access: 29 July 2022).
The aforementioned long-term snow depth data sets are either point-scale or gridded data with coarse spatial resolution. Previous studies also demonstrated that current snow depth data sets and snow water equivalent data sets show significant inconsistencies and uncertainties, which limit their applications in climate change projections and simulations of hydrological processes (Xiao et al., 2020; Zhang et al., 2021; Shao et al., 2022). Due to the complex spatiotemporal variability and the limitations of the current observation approaches, it is still challenging to derive long-term snow depth data sets with high spatiotemporal resolution. In particular, it lacks detailed observations of snow depth on a regional scale, which limits the applications in climate models, hydrological models, and snow disaster monitoring.
Estimating snow depth using the Global Navigation Satellite System Interferometric Reflectometry (GNSS-IR) technique has become a popular topic in recent years, ever since the principle was proposed by Larson et al. (2009). Snow depth is determined by calculating the relative change of the effective multipath reflector height (i.e., the snow surface) to the snow-free surface. This technique is cost-effective because it does not require an additional transmitter, and instead, it continuously receives L-band microwave signals transmitted by the GNSS satellites. The temporal resolution for snow sensing is expected to be hourly, along with the increasing number of GNSS satellites in orbit (Tabibi et al., 2017a). For typical GNSS-IR sites, the spatial footprint is ∼ 1000 m2, which is a scale between point-scale and satellite-scale (i.e., from tens of meters to tens of kilometers) (Larson and Nievinski, 2013). Therefore, GNSS-IR could provide new snow depth data sets which could be supplementary to the current in situ and satellite data sets. However, developing robust and operational technology to produce long-term snow depth data sets using data from various GNSS station networks is still challenging due to complex environmental and observation conditions.
This study, taking advantage of 80 sites from a continuously operating GNSS network over northern China, develops a comprehensive framework to process raw data from various stations, and subsequently develops a new GNSS-IR snow depth data set (GSnow-CHINA v1.0, 12 h or 24 h, 2013–2022). Northern China has a widely distributed snow cover from October to April of the following year. China's annual mean snow extent is greater than 9 000 000 km2, with a stable snow-covered area of ∼ 4 200 000 km2. This region is the main snow-covered area in China, which also plays a vital role in the climate research of the Northern Hemisphere and the cryosphere. The unique characteristics of GSnow-CHINA v1.0 and the framework to develop it are as follows.
-
GSnow-CHINA v1.0 is a snow depth data set developed using GNSS data source, independent of the current satellite, modeled, reanalysis, and in situ data sets. The spatial resolution of this data set is between the in situ point-scale and the coarse-gridded data, which makes it a new data set suitable for validation purposes.
-
GSnow-CHINA v1.0 is a long-term snow depth data set over China with high temporal and spatial resolution, providing a new data source for regional and global climate research. The data set is also helpful for monitoring local snow disasters and water resource management.
-
The proposed framework to develop the data set provides comprehensive and supportive information for users to process raw data of ground GNSS stations with complex environmental conditions and various observation conditions. The technique has the potential to provide a finer-resolution snow depth product (e.g., 1–2 h) with adequate observations from multiple GNSS systems.
2.1 Study area
Northern China lies between latitudes of 25 and 55∘ N and longitudes of 70 and 140∘ E, and includes humid, semi-humid, semi-arid, and arid zones. Snow is the primary freshwater resource in this area. Sudden snowstorms or long-lasting deep snow is one of the major natural disasters for pastoral areas because it affects livestock grazing. The study area includes the three main stable snow accumulation areas over China, i.e., Northeast China and Inner Mongolia (NCM), North Xinjiang and Tianshan mountain (NXT), and Qinghai-Tibet Plateau (QTP) (Fig. 1).
The NCM region has various geomorphic types. Mountains and hills surround the east, west and north of this region, and the middle of this region is plain. The mean minimum air temperature in January is below −30 ∘C. The annual mean snow depth is greater than 5 cm with a maximum value greater than 30 cm. The mean snow density of this area is ∼ 0.15 g cm−3. The NXT region has abundant seasonal snow water resources, vital to local irrigation and animal husbandry. The mean air temperature is −4–9 ∘C with a long winter period. The QTP region is the core region of “The Third Pole” with a mean altitude of ∼ 4378 m. Rainfall of the QTP is concentrated chiefly from May to September, while snowfall usually starts from September to April of the following year.
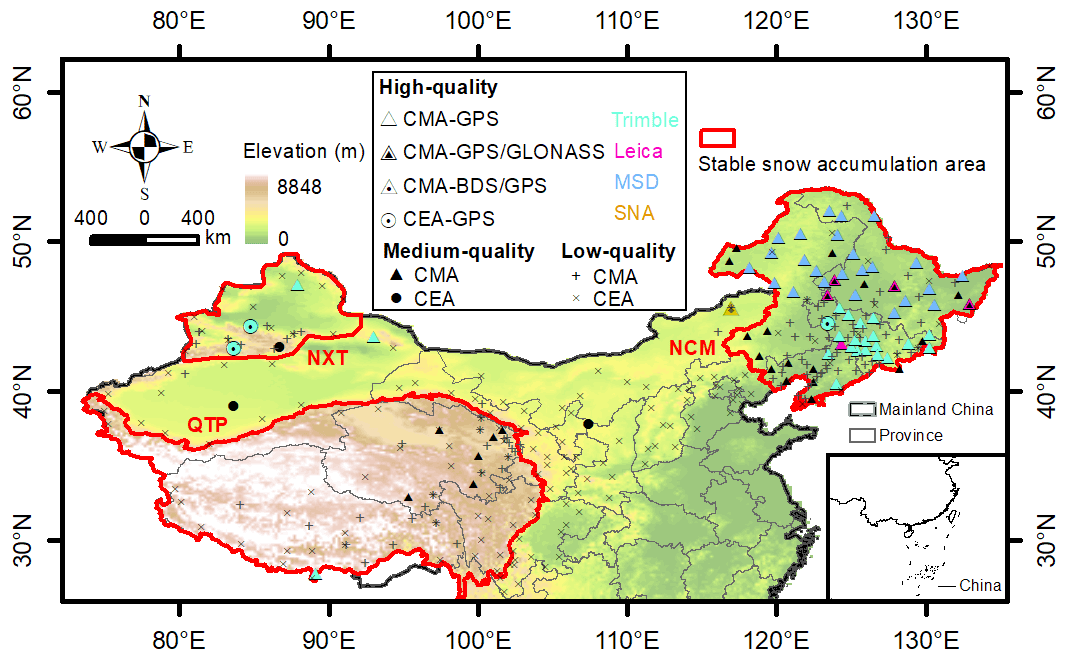
Figure 1Distributions of the GNSS sites over northern China. The symbols are colored by the GNSS receiver type, such as Trimble, Leica, MinShiDa (MSD), and SiNan (SNA).
2.2 Data
Observations from the GNSS station networks over northern China are the primary data source to produce the snow depth data set. The networks include two separate categories constructed by two organizations, i.e., the network constructed by the China Meteorological Administration (CMA) and the Crustal Movement Observation Network of China (CMONOC) constructed by the China Earthquake Administration (CEA). China started to construct ground GNSS stations in 2009, and the building phase was initially completed in 2012 with some regions later in 2015. The CMA stations were built to observe precipitable water vapor, while the CEA stations were built to monitor crustal deformation.
As shown in Fig. 1, raw data from all 174 CMA sites and 171 CEA sites are acquired from the CMA's Center of Meteorological Observation to initially evaluate the capability of retrieving snow depth site by site. The sites are divided into three categories, i.e., high quality, medium quality, and low quality, following the recognition rule used for site-quality determination. The rule will be introduced in Sect. 3. Overall, there are 55 high-quality sites (52 for CMA and 3 for CEA) and 25 medium-quality sites (22 for CMA and 3 for CEA). The high-quality CMA sites are composed of various types regarding the received data of different GNSS systems, i.e., 47 GPS-only, 4 GPS/GLONASS-compatible, and 1 GPS/BDS-compatible. The CEA sites are GPS-only sites. Most of the high-quality sites are located in the NCM region, while a few are located in the NXT and QTP regions.
Figure 2 shows the periods of the high-quality and medium-quality GNSS sites used for snow depth retrieval. For CMA, despite the possible raw data missing for some sites, the majority time spans for the high-quality sites are 2013–2022, 2015–2022, and 2016–2022, and those for the medium-quality sites are 2015–2022. For CEA, the three high-quality sites are from 2016/2018/2019–2022, with one medium-quality site having the earliest record from the year 2010. Each GNSS site has an irreplaceable value because of its unique natural environment and characteristic of snow. Therefore, regardless of the raw data incompleteness in some periods for some sites, we preserve the high-quality and medium-quality sites as much as possible during the production of the data set.

Figure 2Periods of the GNSS sites used for snow depth retrieval. HS: start year of the high-quality site; HE: end year of the high-quality site; MS: start year of the medium-quality site; ME: end year of the medium-quality site. CMA: China Meteorological Administration; CEA: China Earthquake Administration.
The broadcast ephemeris was used to calculate each GNSS satellite's position. For CMA and CEA sites, the minimum elevation angle of the GNSS satellite was set to be 10∘ when the sites were built.
The Soil Moisture Active Passive (SMAP) L3 36 km soil moisture data are used to estimate the penetration depth of GNSS signals to the soil layer (O'Neill et al., 2019). It is a quality-control step to derive a more accurate reflector height of the snow-free surface. The Moderate Resolution Imaging Spectroradiometer (MODIS) 1 km Normalized Difference Vegetation Index (NDVI) data are used to identify the vegetation effects on snow depth retrieval (Didan, 2021). Two independent snow depth data products are used to analyze the quality of the data set produced in this study. One is the 1979–2020 snow depth product using PMW remote sensing produced by Che and Dai (2015); Che et al. (2008); Dai et al. (2015) (daily, 25 km). The snow depth of this product is derived using the SMMR and SSMI/S microwave brightness temperature processed by the National Snow and Ice Data Center (NSIDC). The other is the daily in-situ snow depth measurements using laser snow depth sensors provided by the Meteorological Observation Center of CMA.
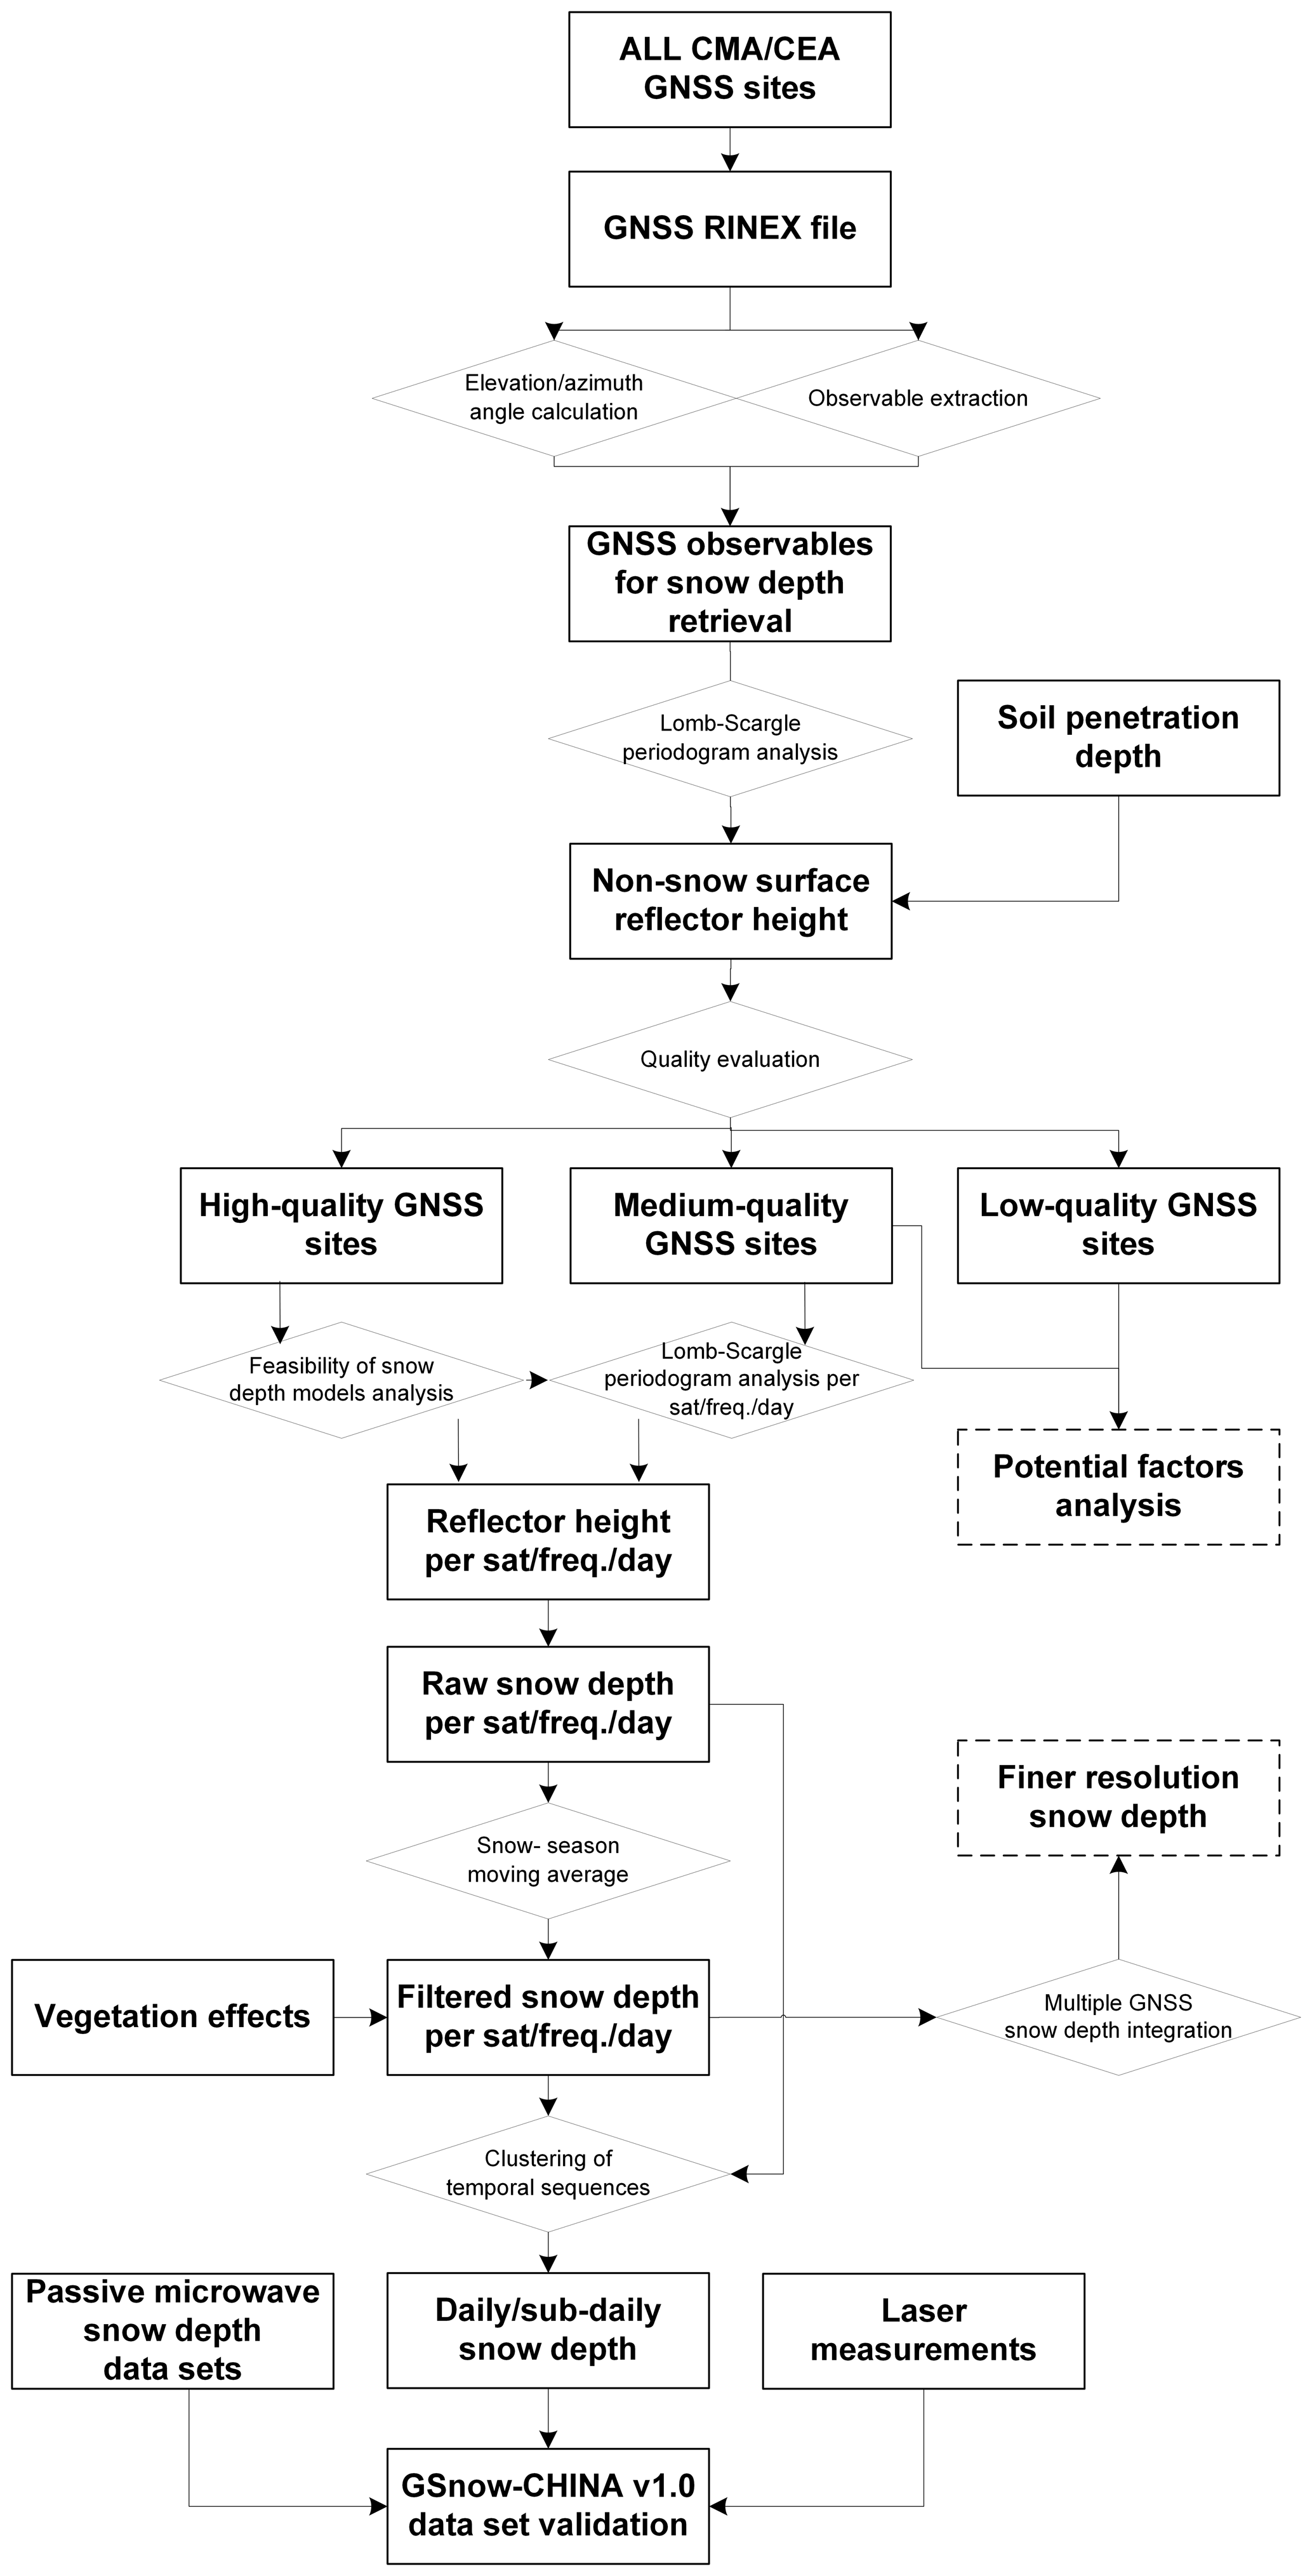
The flowchart to produce and validate the GSnow-CHINA v1.0 data set is shown in Fig. 3. The raw GNSS data used for snow depth retrieval are the daily Receiver Independent Exchange Format (RINEX) data derived directly from individual CMA/CEA GNSS sites. Significant steps to produce the data set are described as follows.
-
The observables for snow depth retrieval, i.e., satellite pseudorandom noise (PRN) numbers, observation time, satellite elevation angle, satellite azimuth angle, pseudorange, carrier phase (CP), and signal-to-noise ratio (SNR), are extracted or calculated from the raw data.
-
The Lomb–Scargle periodogram (LSP) analysis (Lomb, 1976) is executed on several snow-free days to determine the mean reflector heights for each GNSS satellite, each quadrant, and each GNSS frequency. For those high- and medium-quality sites which will be distinguished in step (3), the mean reflector heights are used as reference heights when calculating snow depth. Here, the reflector height refers to the vertical distance between the antenna phase center and the surface.
-
A comprehensive evaluation of the quality of all the GNSS sites is done based on the data quality of the snow-free surface reflector heights in step (2), and the sites are divided into high-, medium-, and low-quality accordingly.
-
For high- and medium-quality sites, the model for deriving daily reflector height is established, and the raw snow depth for each GNSS satellite, each quadrant, and each GNSS frequency is subsequently calculated as the difference value of the referenced height in step (2) and the height of this step.
-
Several quality-control strategies are used to further improve the quality of the raw snow depth during the previous step, such as considering the penetration depth of soil, considering the vegetation effects, filtering of outliers, adding valid flags such as the standard error (SE) of snow depth and the number of PRNs used to calculate a specific snow depth value.
-
Daily 24 h and sub-daily 12 h snow depths are derived for general high- and medium-quality GNSS sites, and snow depths of finer resolution are additionally derived for several GPS/GLONASS compatible sites.
-
The GSnow-CHINA v1.0 data set is evaluated using the PMW product and the in situ measurements. The advantages and limitations of the produced data set are further analyzed to provide supportive information for future method improvement or data set extension.
The following sections introduce detailed descriptions of the solutions of several key steps in the processing framework.
3.1 Snow depth retrieval model
The state-of-the-art GNSS-IR snow depth retrieving models can be divided into two categories according to the two types of observables (i.e., SNR and CP). The principle of the SNR model is to establish a linear relationship between the oscillation frequency of the SNR observation sequence of the reflected signal and the height of the reflection surface (Larson et al., 2009). This model was later derived into several variants: e.g., the triple-frequency SNR combination model (SNR_COM) (Zhou et al., 2019), the SNR model based on raw SNR sequences (Peng et al., 2016), the SNR model based on horizontal polarization antenna (Chen et al., 2014), the SNR model considering the influence of construction facilities (Vey et al., 2016), and the SNR model considering the influence of terrain (Zhang et al., 2017). The CP combination model was initially proposed to estimate snow depth when there were no SNR data in the raw GNSS observation file (Ozeki and Heki, 2012). The initial form of this model used the geometry-free linear combinations of the phase measurements (L4), and Yu et al. (2015, 2018) extended the model to use triple-frequency CP observations (F3) as well as the combination of pseudorange and CP of dual-frequency signals (F2C).
The main formulas and applicability of the five models mentioned above to the data of GNSS sites in this study are listed in Table 1, and Table 2 further shows the meanings of variables for the models in Table 1. The SNR, L4 and F2C models are suitable for all sites because the observables used as inputs for these models are available in the GNSS raw data. The SNR model has been verified to have higher accuracy than the L4 and F2C models (Liu et al., 2022). The applicability of the SNR_COM and F3 models is limited because most of the GNSS sites do not contain three SNR or CP observables in a single raw data file. Considering both the applicability and the accuracy, the SNR model is determined as the primary model used to produce the snow depth data set.
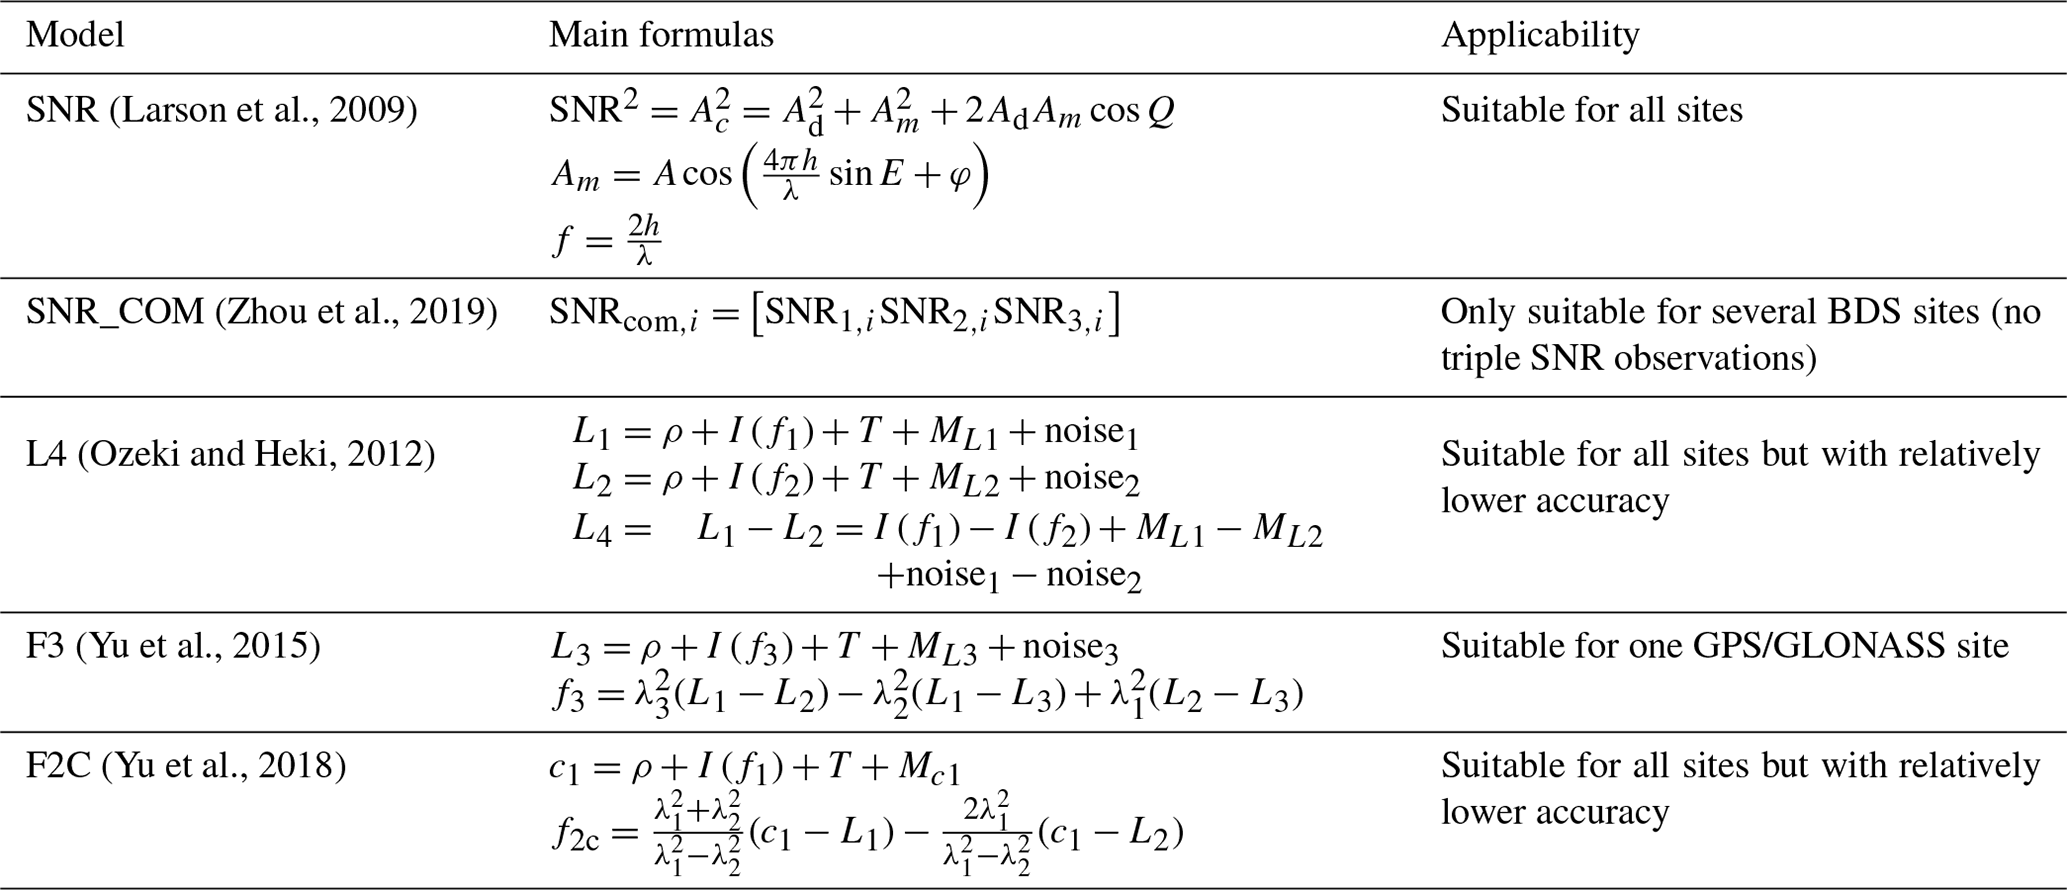
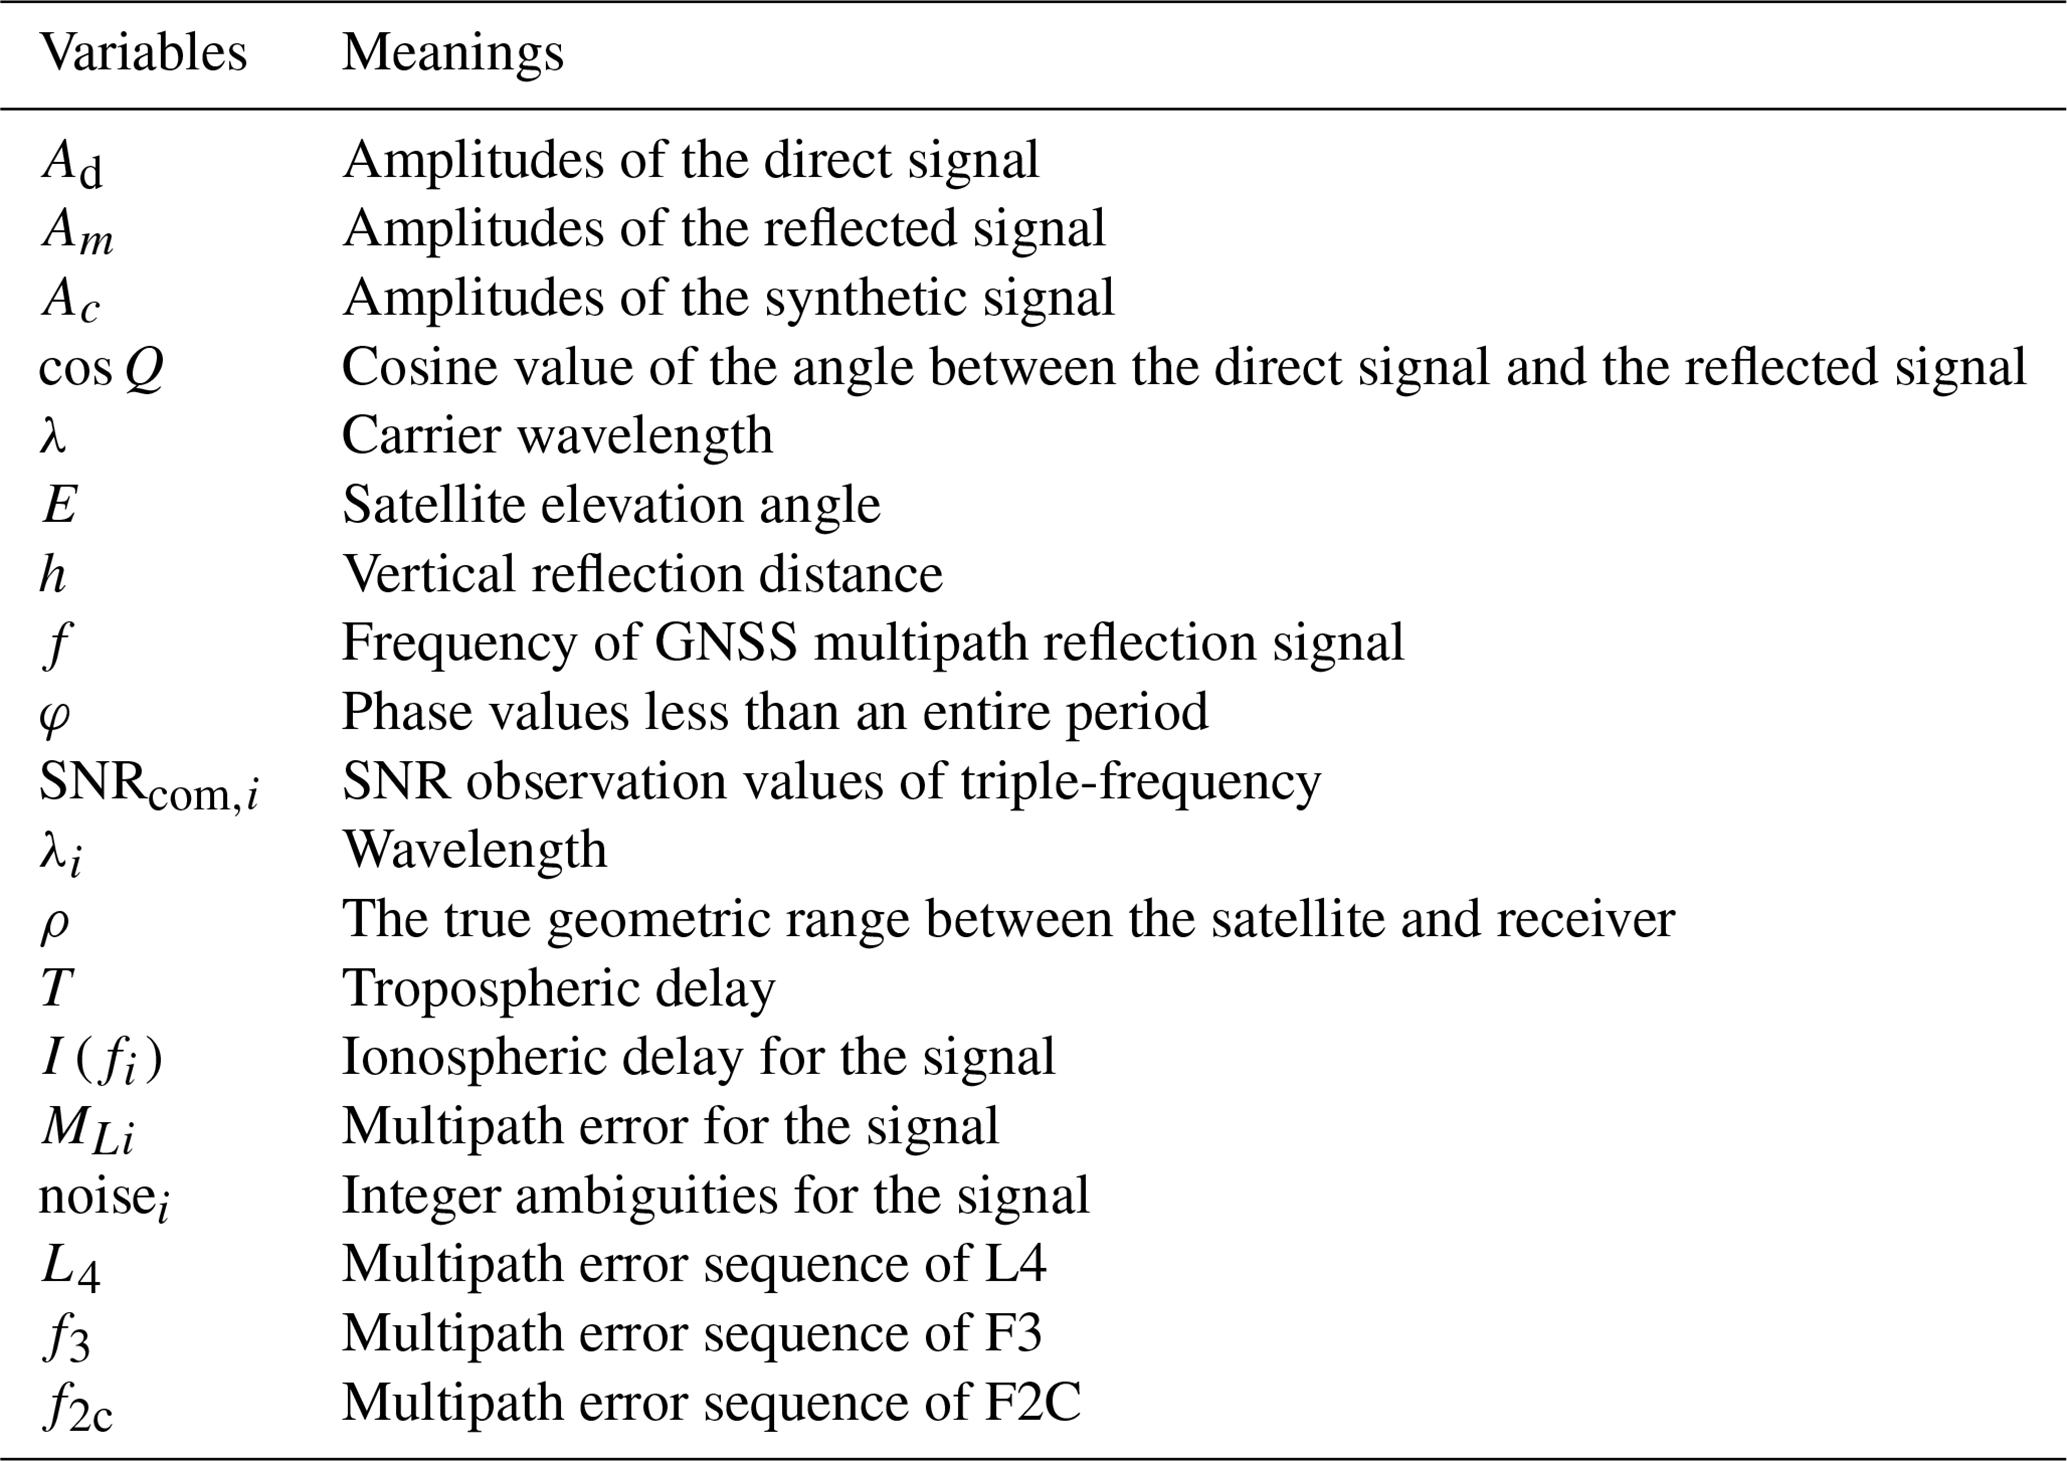
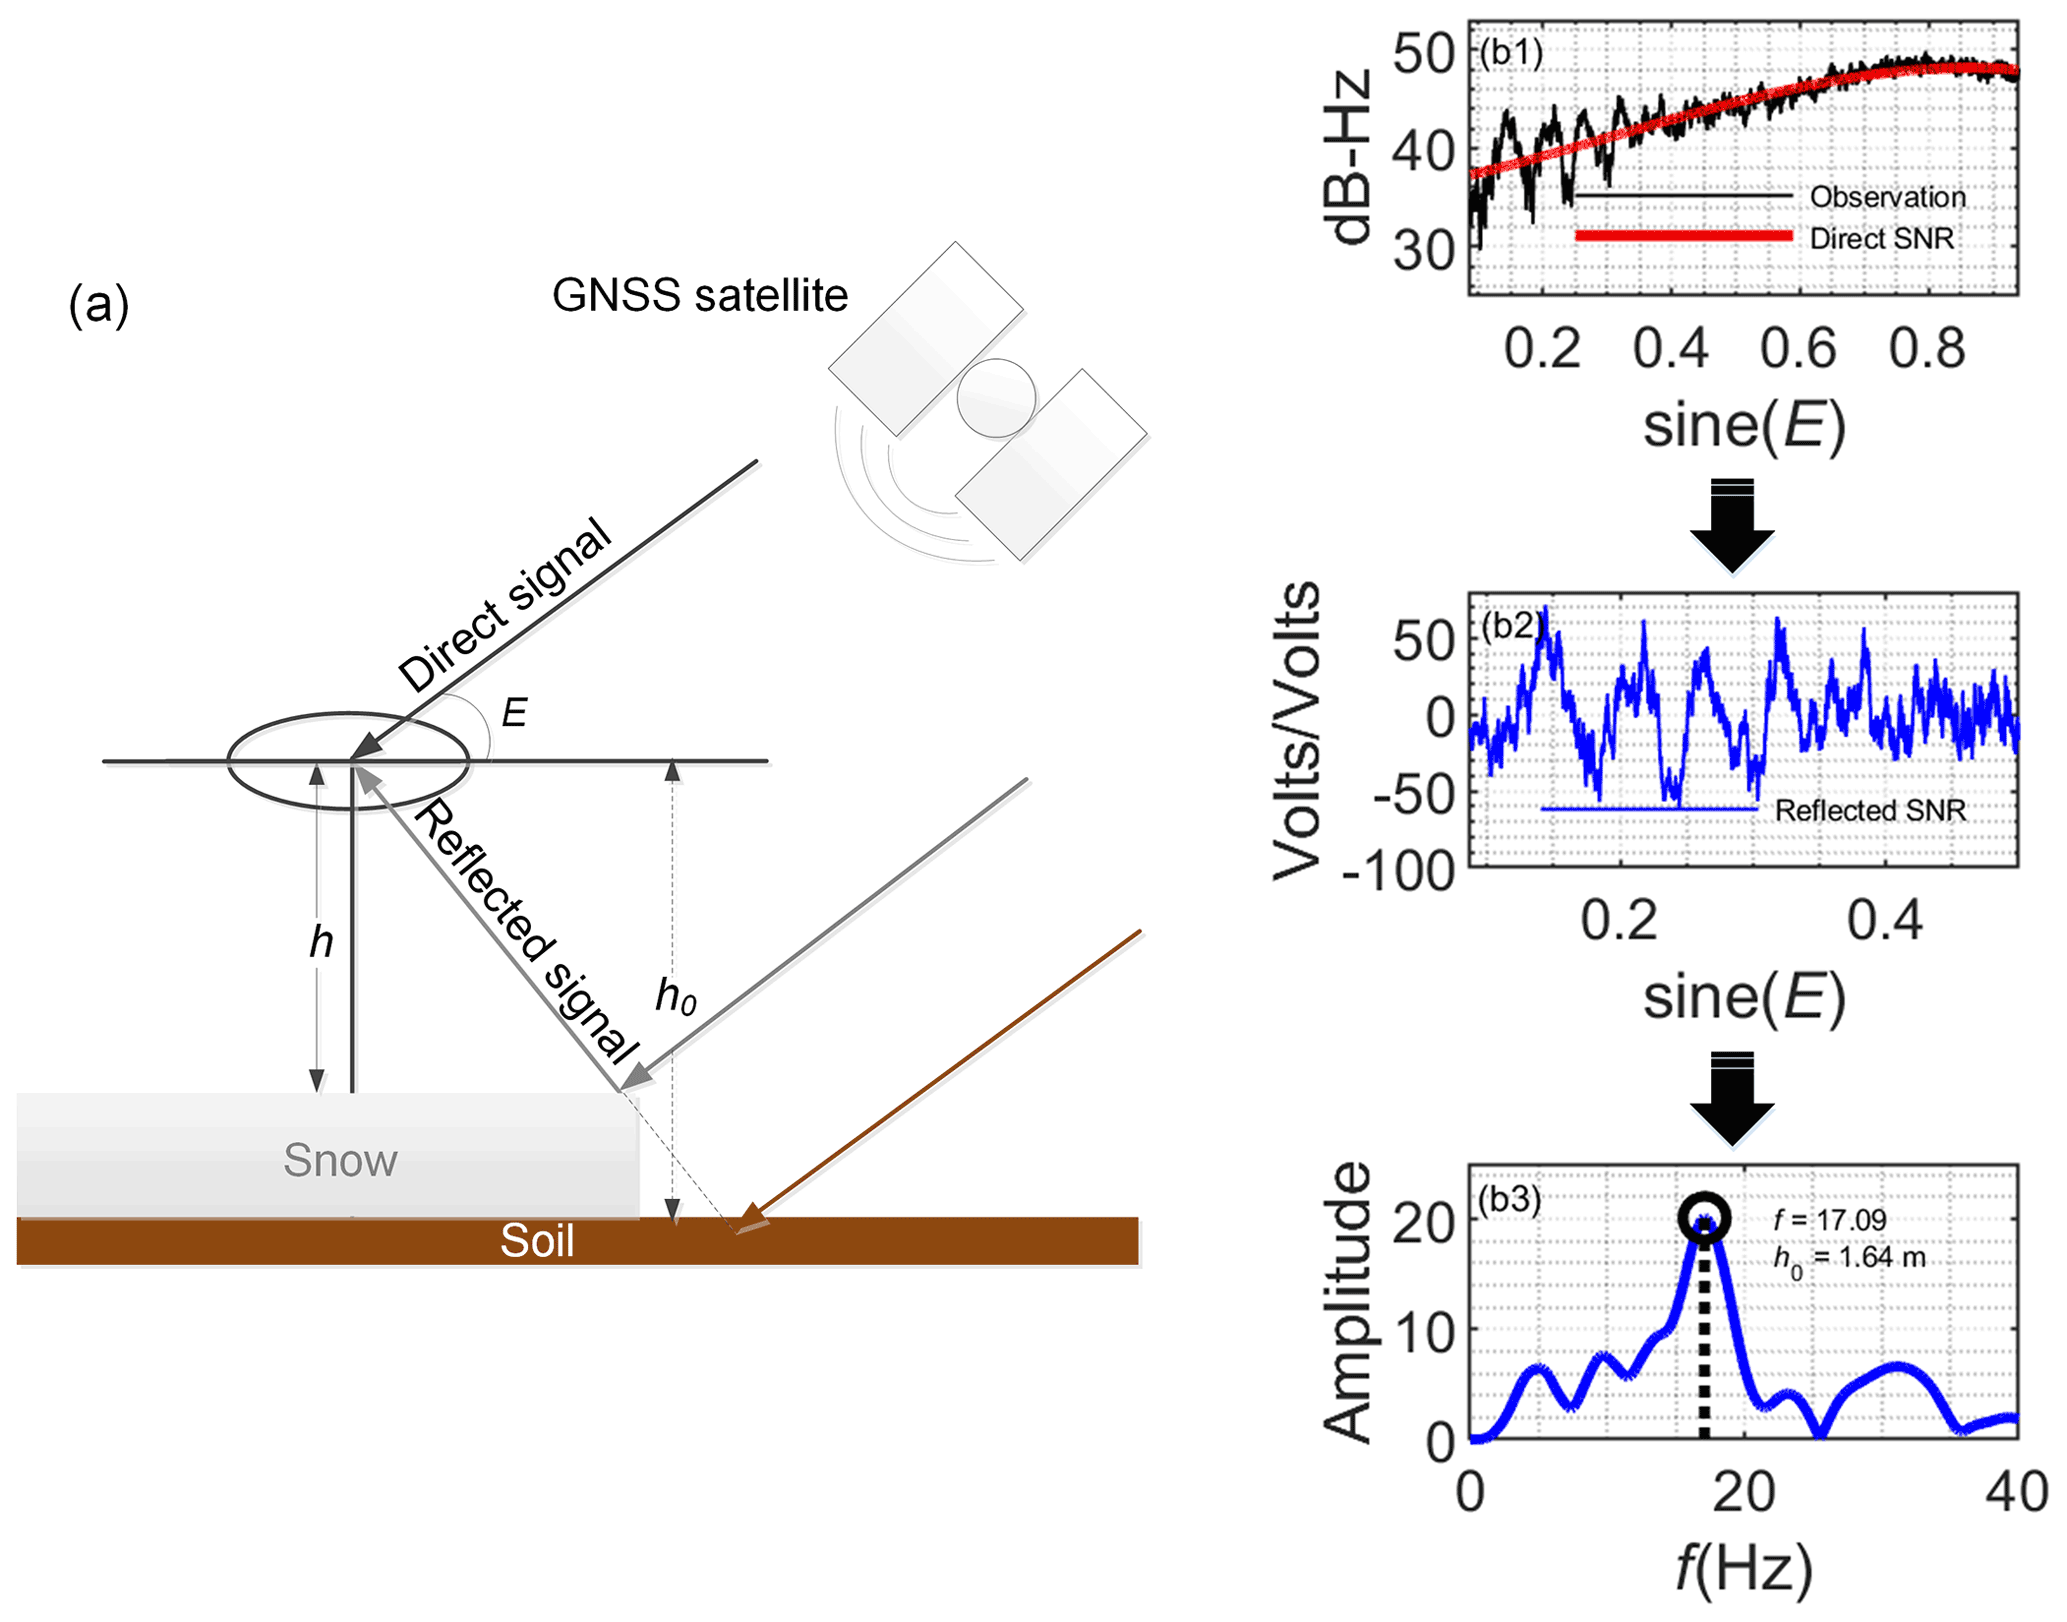
Figure 4Geometry and principle of the SNR model. (a) The geometry of the direct and reflected signal over the snow surface; (b1) example of the recorded GNSS SNR data and the removal of the direct signal with a second-order polynomial; (b2) residual of (b1) below elevation angle (E) of 30∘, converted from dB to linear units (for simplicity, Volts); (b3) Lomb–Scargle analysis of (b2) to find out the dominant frequency of the transformation and the resulting reflector height.
The geometry and principle of the SNR model are shown in Fig. 4. As shown in Fig. 4a, the snow depth (hsnow) is calculated using a simple equation:
where h0 is the reflector height of the snow-free surface, and h is the reflector height of the snow-covered surface. The approaches to derive h0 and h are similar, with Fig. 4b1–b3 showing the general technical process. Firstly, the time series of the GNSS SNR observation is shown as a function of sine (elevation angle), and the direct signal is removed using the polynomial fitting method. The residue is treated to be the contribution of the reflected signal from the land surface. Secondly, the reflected signal is converted from dB-Hz to Volts. Thirdly, the LSP analysis is applied to the reflected signal curve to establish the dominant frequency of the transformation. In this study, the peak-to-noise ratio (PNR) of LSP is set to be greater than 5 to filter out the quality-controlled satellite tracks. The h0 or h can be calculated by (Larson et al., 2009)
where λ is the wavelength of the GNSS signal and f is the dominant frequency.
3.2 Determination of the snow-free surface reflector height
For each site, ∼ 10 d of data with no snow on the ground are used to calculate the raw snow-free surface reflector height (h0). According to the data availability, days of the year (DOYs) 110–119 or DOYs 274–283 are generally selected since these days have no snow according to historical in situ data. Specifically, for GLONASS, to deal with the non-repeating tracks, 1 month of snow-free data (DOYs 105–135) are used to calculate the raw h0. The reflector height for each GNSS satellite, quadrant, and GNSS frequency band is calculated using the Lomb–Scargle periodogram, and it is only the initial height being used for the quality evaluation of the GNSS sites. Due to the complex natural environment of various sites, it is not clear whether one site is suitable for snow depth retrieval. The following section will define a rigorous rule to evaluate the quality of all the GNSS sites. For those high- and medium-quality sites determined in the following section, which are suitable for snow depth retrieval, the finalized snow-free surface reflector height will be determined as the mean value of heights for the 10 days.
It is worth mentioning that GPS ground tracks have sidereal repeatability and reappear at the same azimuth every day. In contrast, GLONASS satellite and BDS MEO satellite have non-repeating ground tracks. The GLONASS orbits repeat every 8 sidereal days, with the ground track shifted by 45∘ in longitude per day (Tabibi et al., 2017b). The BDS MEO satellites repeat approximately every 7 sidereal days (Ye et al., 2015). In this study, there are only four GLONASS sites (i.e., bfqe, bttl, hltl, and hlhl) and one BDS site (e.g., qxdw). The strategy for processing GLONASS data is slightly different from that of GPS, i.e., the snow-free surface reflector heights are given in 12 azimuths separated by 30∘ for all available GLONASS satellite tracks and frequency bands. While for the BDS satellite, due to the relatively low number of available satellites, the reflector height is given by quadrant only, without distinguishing tracks and frequency bands, to preserve as many observations as possible. Previous research developed a multistep clustering algorithm to handle the non-repeating ground tracks of GLONASS (Tabibi et al., 2017a). We are also developing a new algorithm in an upcoming study considering terrain effects, which will be particularly effective for non-repeating tracks.
3.3 Quality evaluation of the GNSS sites
The CMA and CEA sites are built under various natural and manual environmental conditions. Figure 5 shows several photos of typical CMA/CEA sites. The CMA sites are mainly built on the ground with antenna height ranging from 1.5 to 5 m. Some sites are located in relatively flat and open land, while others are in yards and surrounded by buildings or other artificial objects. The majority of the CEA antennas are set upon a rooftop (e.g., Site qhdl in Fig. 5), with the GNSS receivers being put in the accompanying housing. It explains why most of the CEA sites are not suitable for snow depth retrieval.
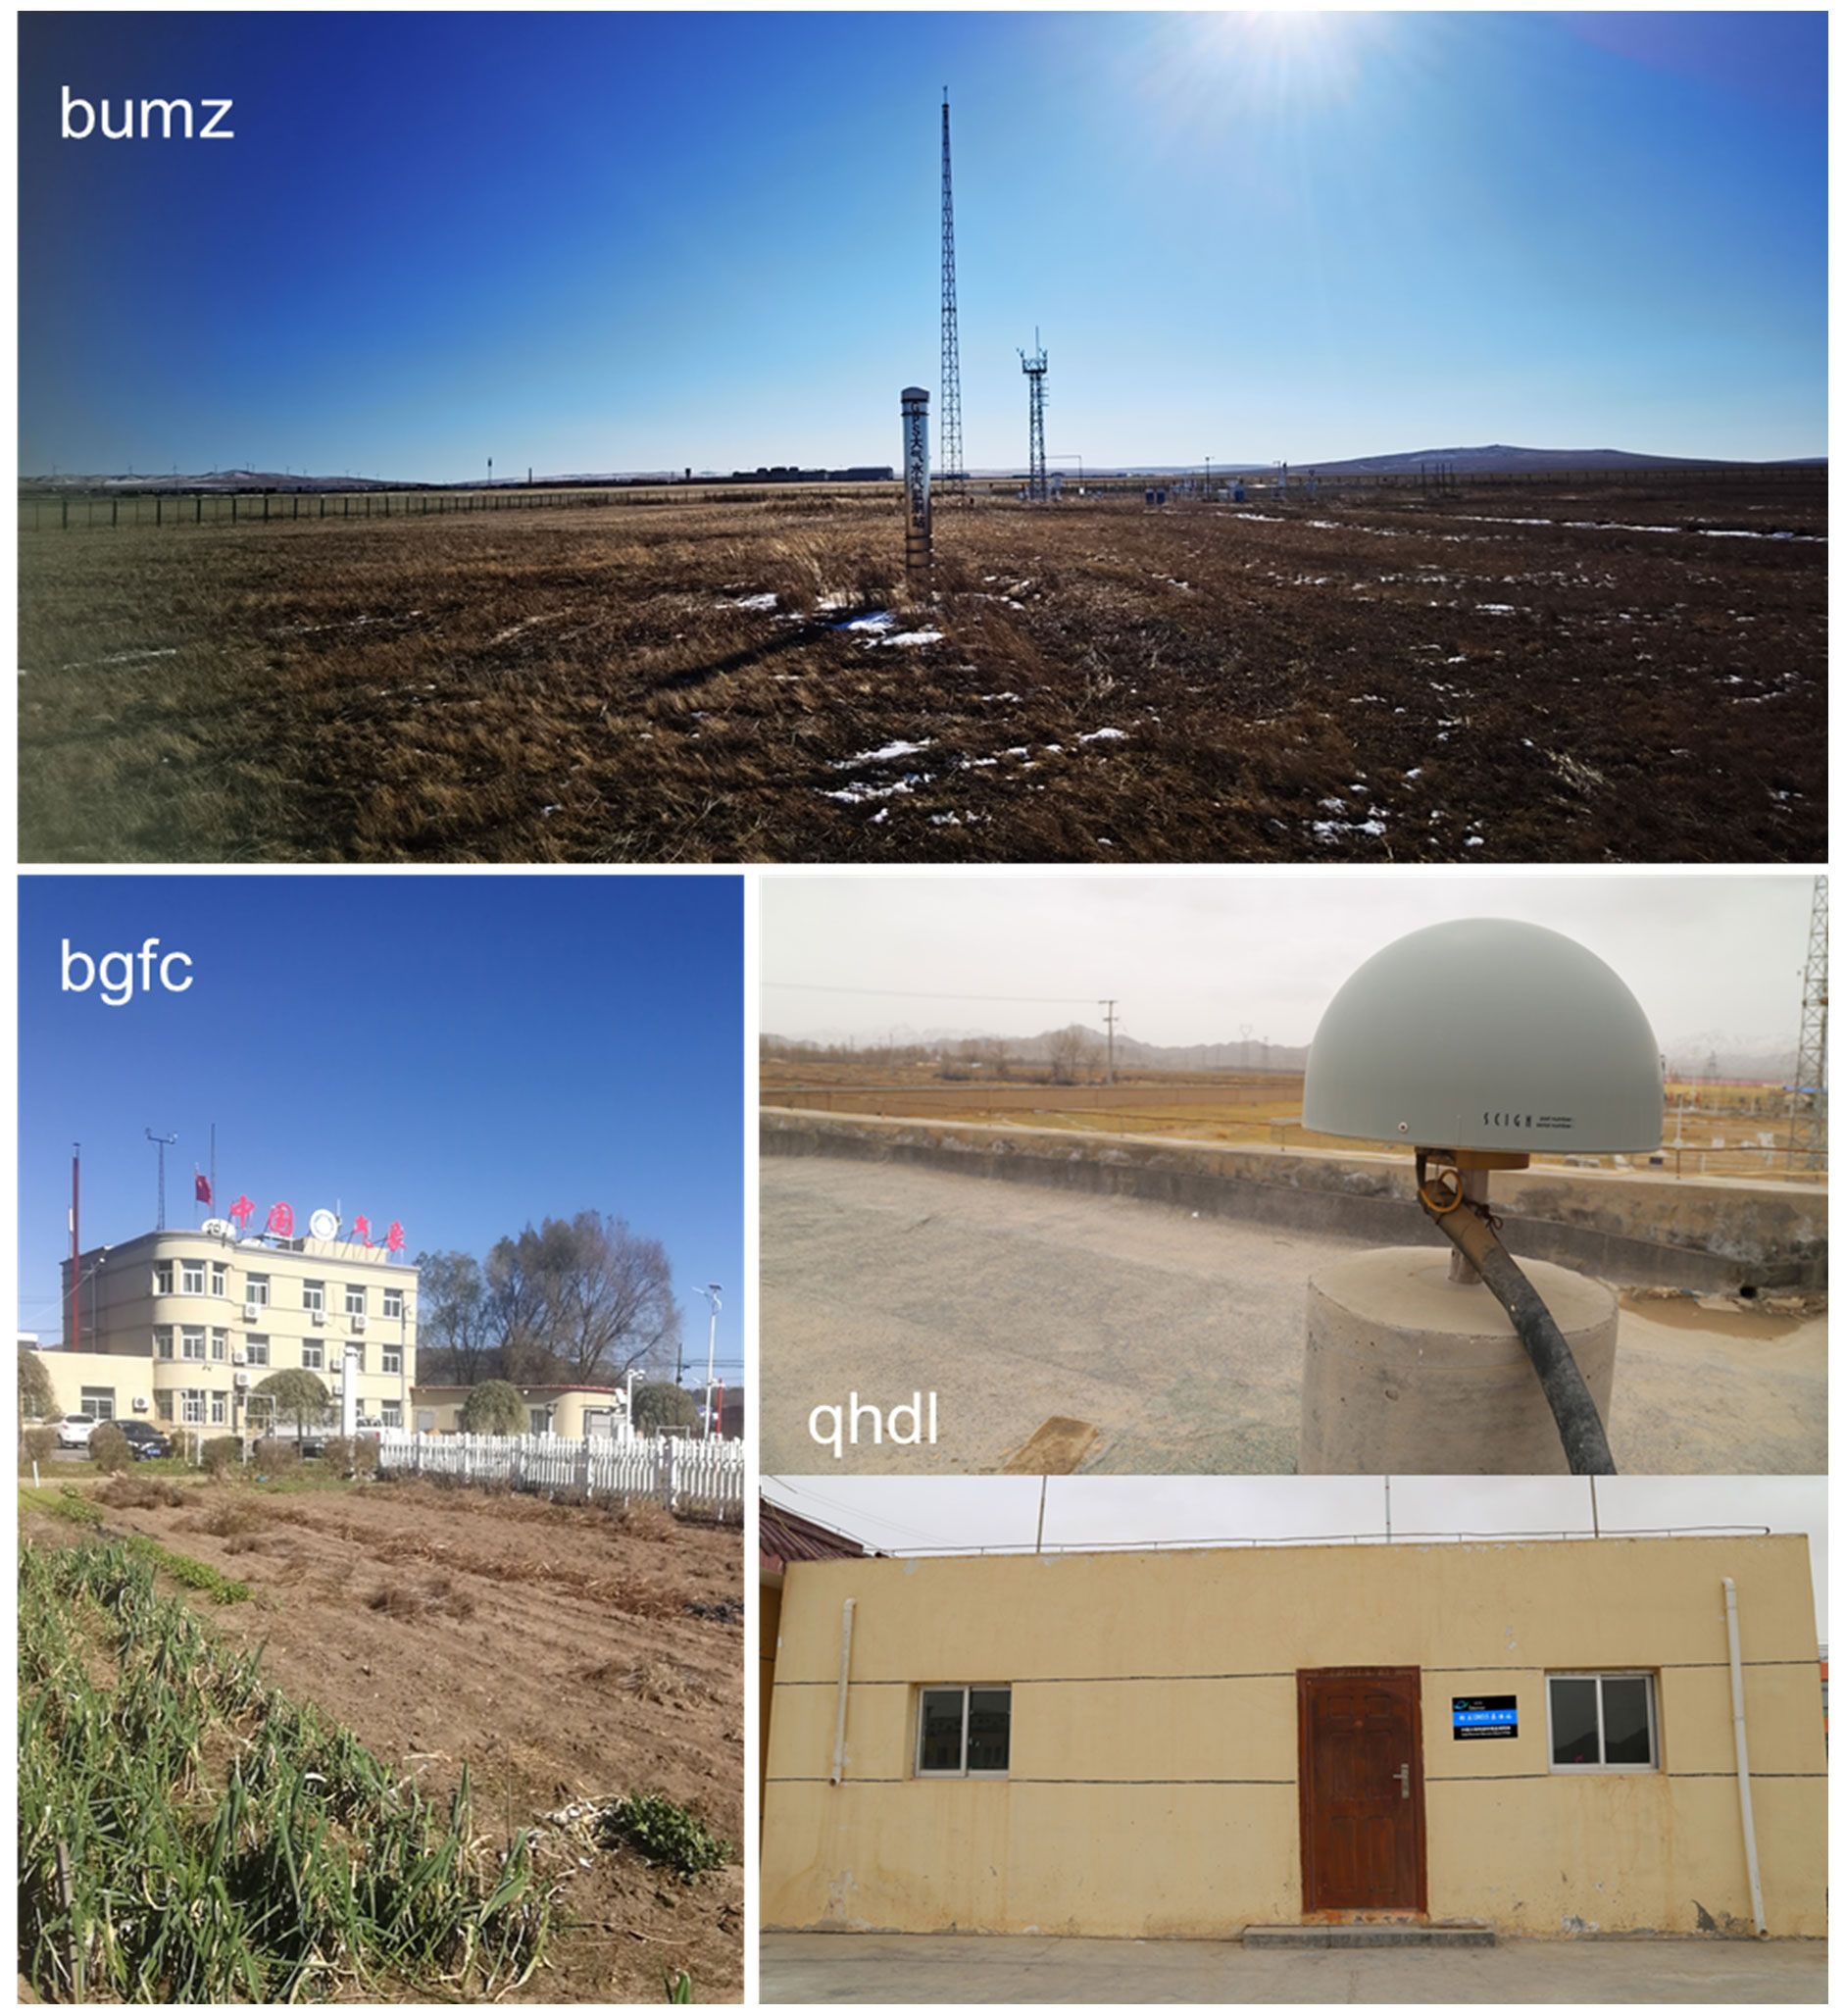
Figure 5Photos of typical GNSS sites: bumz and bgfc are two high-quality CMA sites, and qhdl is a low-quality CEA site that is not suitable for snow depth retrieval.
A rigorous rule is defined to evaluate the quality of all the GNSS sites. For each site, the 10 d reflector heights of snow-free surface (i.e., h0) are calculated, sorted, and colored by azimuths to make a “h0 plot”. Examples of the “h0 plot” are shown at the bottom of each subfigure in Fig. 6. The “h0 plot” is visually checked carefully and determines whether it is suitable for the retrieval of snow depth. If one site shows relatively long and stable h0 values during the entire observation period, the “h0 plot” has a relatively “flat” segment on the curve, which indicates that this site is qualified to determine the initial range of the snow-free surface reflector height. Afterward, a range of h0 is given manually to narrow the good h0 values. The difference of the minimum and maximum value of the range is set to be no more than 0.5 m. The finalized snow-free surface reflector height for each satellite, each quadrant, and each GNSS frequency are respectively determined as the mean value of the good heights of the 10 days. In contrast, if one site has no “flat” segment on the “h0 plot”, this site is determined as a low-quality site and will not be used for snow depth retrieval. It should be noted that during this processing step, it can only eliminate those sites with poor data quality for snow depth retrieval rather than distinguishing high- and medium-quality sites. There are no apparent differences for the high- and medium-quality sites regarding the natural environment. Instead, the medium-quality site is defined using two simple rules: (i) the site has good-quality data, but there is no snow for almost all the years; (ii) the site's lack of data for most of the years.
Figure 6 shows the defined rule applied to six individual sites with various surroundings, i.e., bumz, bfhr, bgfc, uqwl, qhdl and qhbm. The top panel of each subfigure shows the environmental conditions around the station on Google Map, with different colors indicating the footprints for elevation angles of 10, 15, 20, 25 and 30∘, respectively. The bottom panel of each subfigure shows the sorted 10 d reflector heights of snow-free surface (i.e., h0). The plots clearly show the differences in the heights for different sites. The first two sites, i.e., bumz and bfhr, show relatively long and stable h0 values for all the GNSS satellites, quadrants, and frequency bands during the entire observation period. It indicates that these sites are flat enough for all the orientations and are ideal for determining the initial range of the snow-free surface reflector height, i.e., 2.5–2.8 m for bumz and 2.8–3.1 m for bfhr. Unlike these two sites, the bgfc site has relatively stable h0 values only in specific orientation, with a natural condition that is open and flat. At the same time, it is impossible to derive correct h0 values for bgfc in other orientations that have buildings or trees. This phenomenon can be verified from the photo of the site in Fig. 5. This site is also good enough to determine the initial range of the snow-free surface reflector height, i.e., 3.6–4.1 m. On the contrary, the three sites at the bottom of Fig. 6, i.e., uqwl, qhdl and qhbm, show continuously changed h0 values because of the poorly defined peaks for most LSPs. It indicates that it is unreliable to determine a true h0 due to complex environmental conditions.
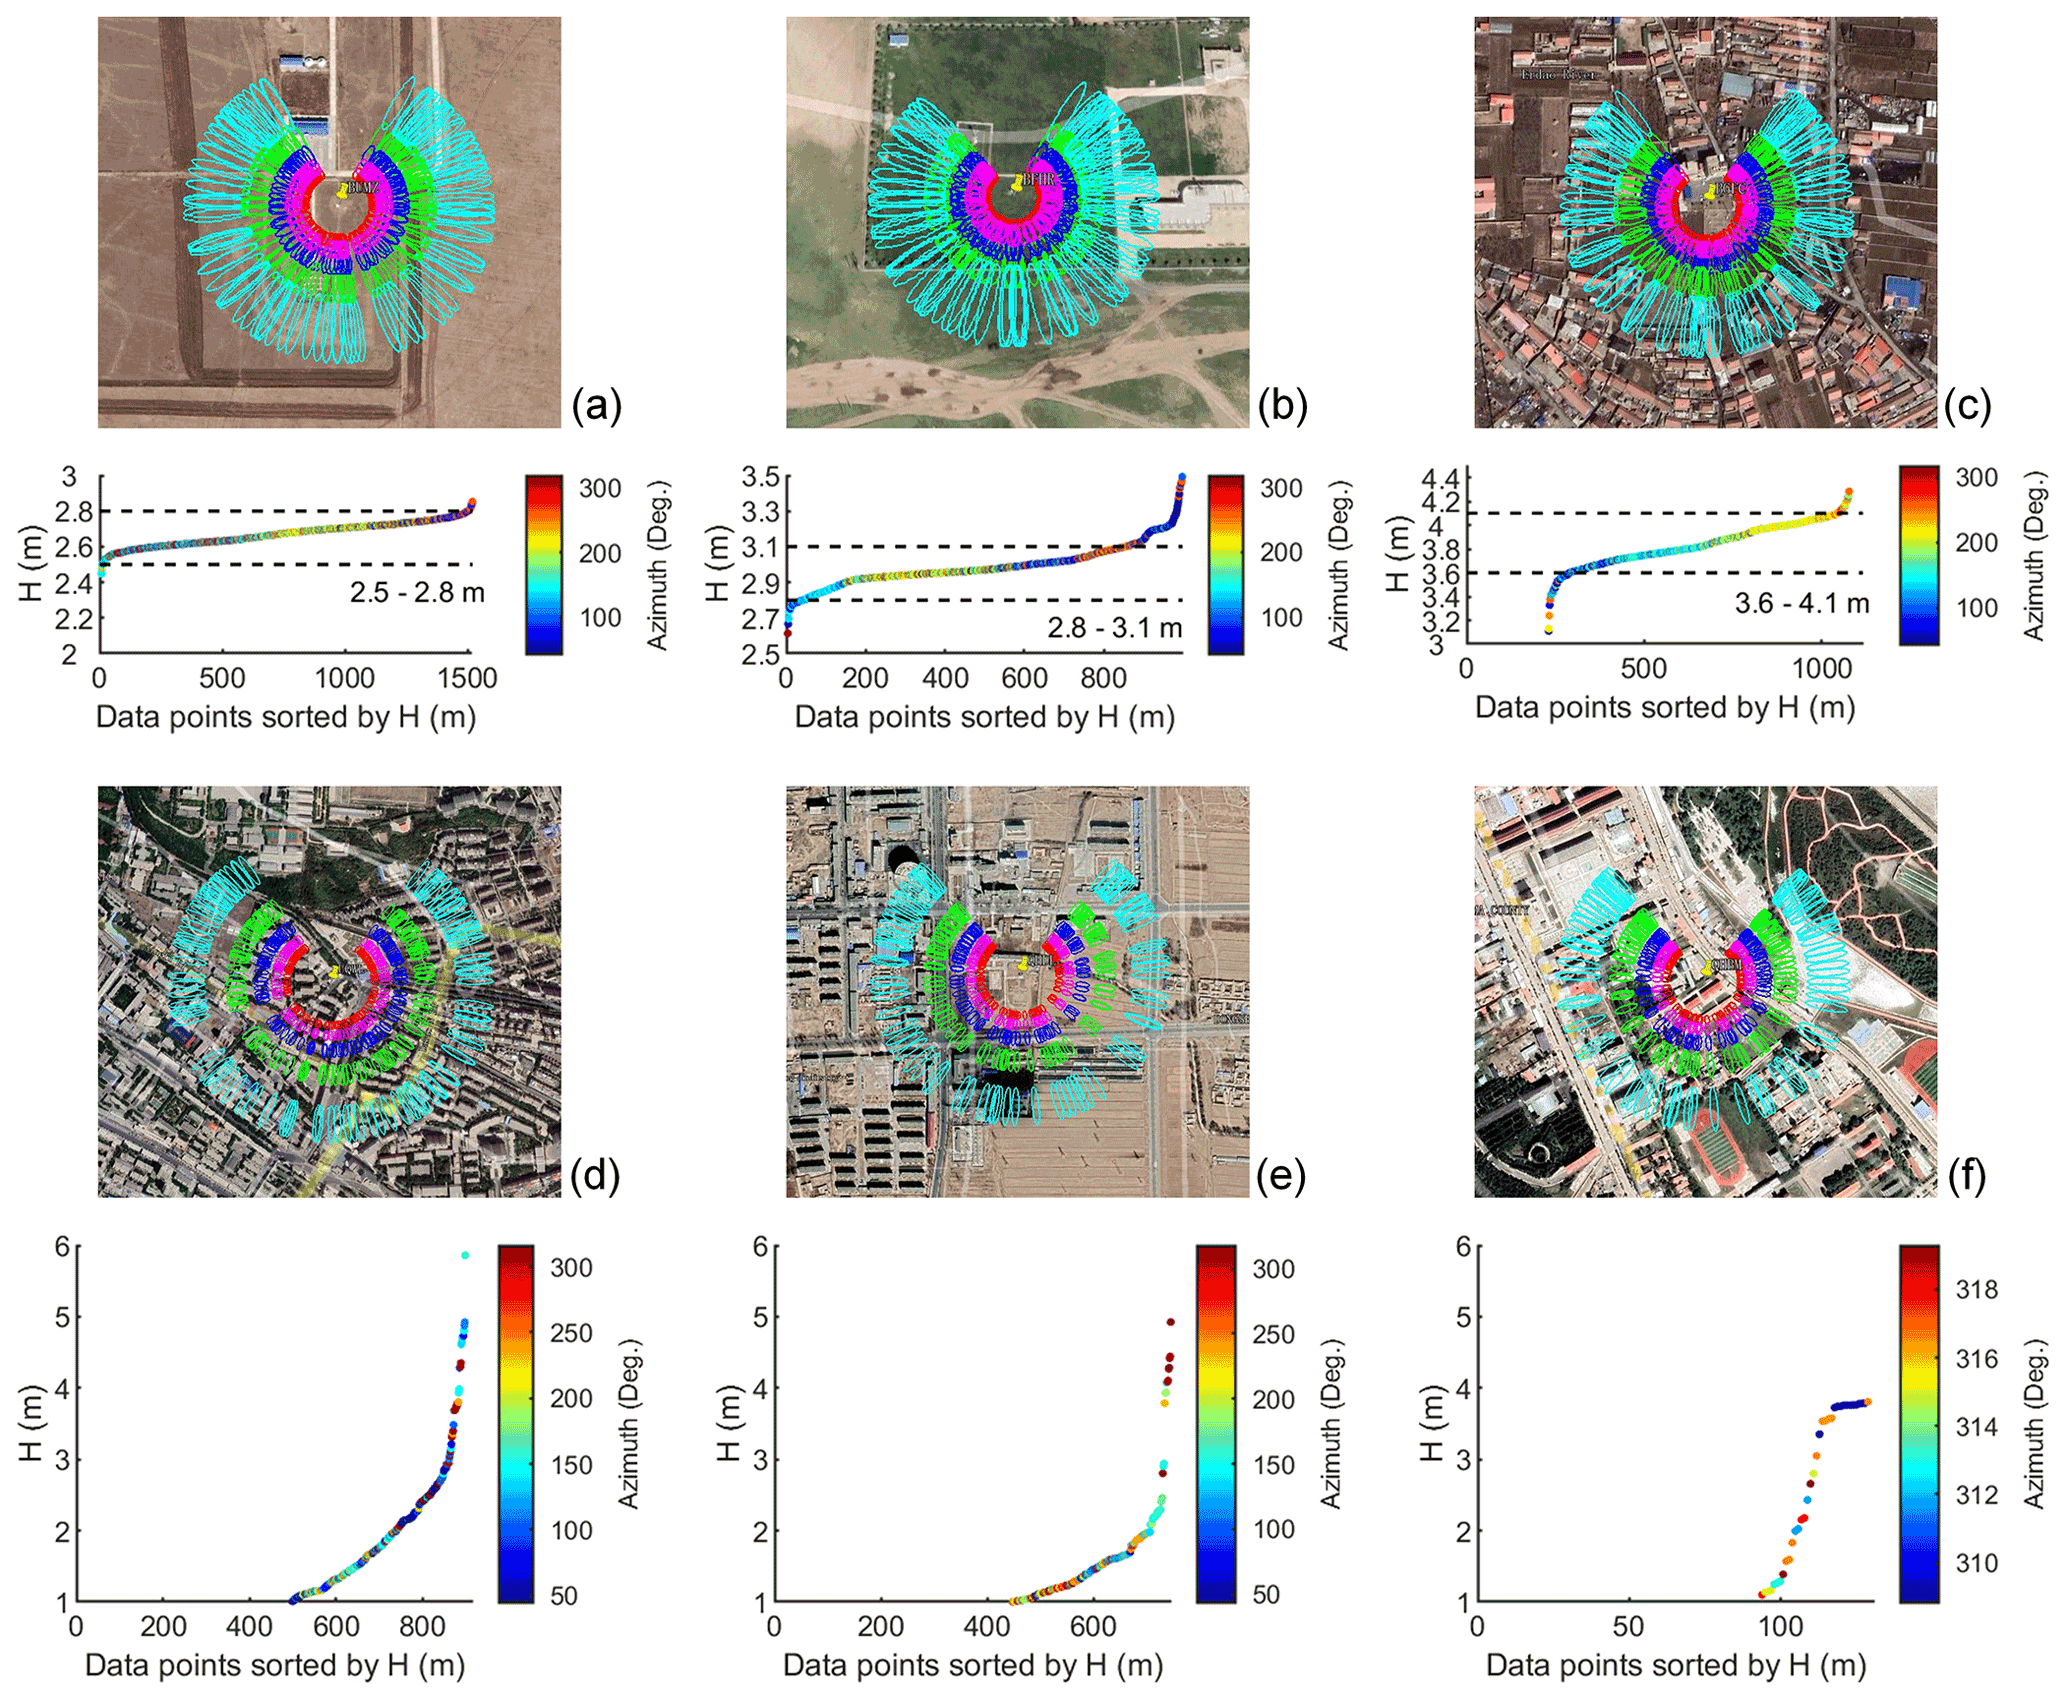
Figure 6Examples show the high-, medium- and low-quality sites. High-/medium-quality sites: (a) bumz, 2017; (b) bfhr, 2019; (c) bgfc, 2019. Low-quality sites: (d) uqwl, 2019; (e) qhdl, 2020; (f) qhbm, 2018. The top image in each subfigure shows the footprint of the observation for elevation angles of 10, 15, 20, 25 and 30∘, respectively. The bottom image in each subfigure shows the distribution of the reflector heights for snow-free surfaces calculated for 10 d of observations using the SNR model. The background of this figure is from Google Earth (https://earth.google.com/web/, last access: 29 July 2022) © Google Earth 2021.
3.4 Deriving snow depth of finer resolution
The default temporal resolution of the snow depth data set is 24 h. However, some sites have adequate satellite observations that make it possible to produce finer resolution snow depth data. We have two different solutions to produce snow depth of finer temporal resolution. For most sites with only GPS observations, we try to produce 12 h snow depths if there are no less than five valid observations from 00:00–12:00 UTC or 12:00–24:00 UTC within 1 specific day. The snow depth value for each 12 h is defined as the mean of all the observations during this time window. For a few sites with GPS/GLONASS compatible observations, we use the exact processing solutions like the previous GPS-only sites and combine all the observations from the GPS and GLONASS systems to derive finer temporal resolution snow depth. Unlike the previous 12 h maximum resolution, 2, 3 and 6 h resolutions can be achieved using compatible observations.

Figure 7Examples showing the moving-average filtering of the snow depth results over one snow season. The site presented in this figure is bfqe which is a CMA site. The day of year is abbreviated as DOY.
3.5 Quality control of the snow depth data set
Several postprocessing steps are executed to accomplish the quality control of the raw snow depth data set. This section gives detailed information on these steps as follows:
-
Moving average filtering
For each site, as shown in Fig. 7, the raw snow depth values over a snow season, i.e., from 1 October this year to 30 April the following year, are gathered together. The moving average algorithm is executed to filter out the snow depth outliers, probably due to the incorrect recognition of the peak frequencies on the Lomb–Scargle periodograms. This moving average method is a traditional way to reject outliers (Wang et al., 2020; Tabibi et al., 2017a; Nievinski and Larson, 2014a). Snow depth values out of the 95 % confidence interval are smoothed over a sliding window across neighboring elements. The length of the moving window is set to be 12 h in this study. In the finalized GSnow-CHINA v1.0 data set, we also provide the original data set without filtering to allow users to check the initial form of the data. The following analyses in Sects. 4 and 5 are based on the filtered data.
-
Modifying the system errors caused by the penetration depth of soil
The penetration depth of the GNSS signal through bare soil (hp) directly influences the determination of the reflector height of the snow-free surface. The hp is dependent on the soil permittivity and the GNSS wavelength. The soil permittivity is related to soil moisture and soil components. Figure 8a shows the relationship between penetration depth of GPS L1 band and soil moisture/soil components calculated using parameters provided in Hallikainen et al. (1985). The penetration depth is deeper than 10 cm when soil is very dry (i.e., volumetric soil moisture (VSM) < 0.1 cm3 cm−3). The penetration depth is around or shallower than 5 cm under normal soil moisture conditions. In this study, the data of soil components for each site, i.e., the percentages of sand and clay, are approximatively derived from the China Soil Science Database (http://vdb3.soil.csdb.cn/, last access: 29 July 2022) by the soil attributes of the specific city and province that the site is located in. The average VSM of each site is calculated as the multiyear mean value of the SMAP VSM. The penetration depths of each site for GPS L1/L2, GLONASS B1/B2, and BDS B1/B2/B3 are subsequently calculated using the prepared soil components and VSM parameters. Figure 8b shows the number of GNSS sites categorized by the soil penetration depths (hp). The majority has a shallow penetration depth of 4–8 cm, with only a few being 10 cm or deeper. The h0 is modified as for the final production of the snow depth data set. The C is an empirical constant set at 3 cm in this study to represent the offset of the complicated land surface conditions.
-
Eliminating the vegetation effects
For densely vegetated surfaces, particularly in autumn, vegetation height is usually calculated as “fake snow depth” due to similar responses on the Lomb–Scargle periodogram. However, it is difficult to identify whether it is vegetation or snow. As for northern China, this phenomenon occurs mainly in October and early November. In this study, for each site from 1 October to 15 November, if there are snow depth records from the GNSS data, we use the NDVI from MODIS data and the historical weather report to determine whether it is actual snow or not. After this round of checking, to ensure the reliability of the snow depth for 15 sites that probably have “fake snow depth” records, DOYs 270–300 are masked out from the data set.
-
Quality flags
The number of GNSS satellites used for this calculation is used as a quality flag for each snow depth data record. In this study, we set the threshold at 5 to preserve as much data as possible. According to this quality flag, the users can decide whether to use a snow depth data record with a low number of observations. For each snow depth data record, the SE of the snow depths for different satellite tracks is treated as another qualifying flag. The users can also determine their own rules for filtering the data according to this quality flag. The 8 d MODIS NDVI is also included as a quality flag in the data set to show the vegetation conditions of the site initially. The 8 d values are combinations of the MODIS MOD13Q1 and MYD13Q1 products. The NDVI flag can provide supplementary information for the users to identify the possible error due to vegetation. However, due to the coarse resolution of MODIS data, it is not possible to use this flag to represent the actual vegetation cover around the GNSS station.
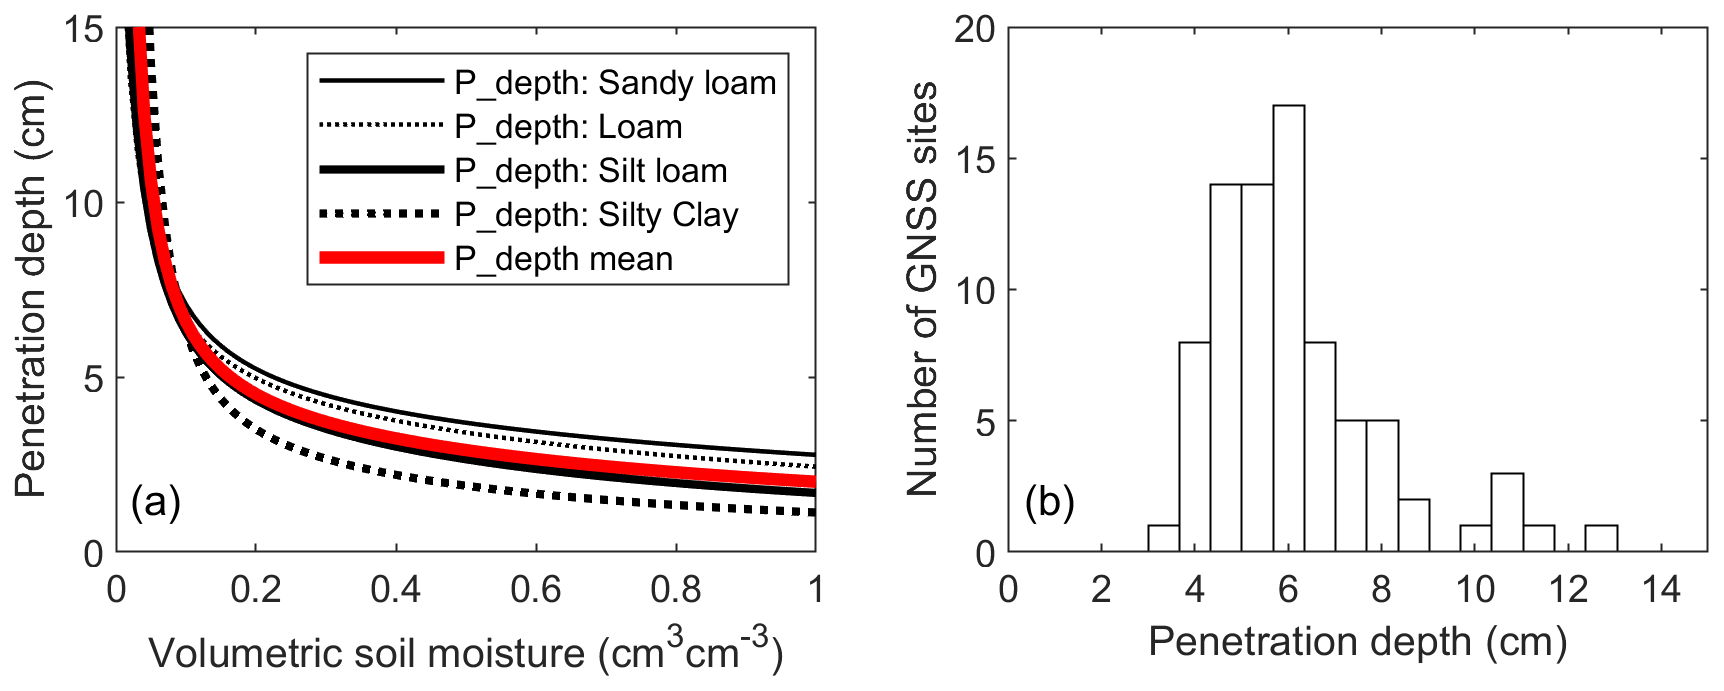
Figure 8(a) The penetration depth of GNSS signals over the soil layer, taking GPS L1 band (wavelength = 19 cm) as an example. The red line indicates the mean penetration depth for various soil types. (b) Statistics of the number of GNSS sites categorized by the soil penetration depths (also taking GPS L1 band as an example).
3.6 Error indicators used in this study
The root mean square difference (RMSD), normalized RMSD (nRMSD), SE and normalized SE (nSE) are four error indicators used in this study. The RMSD of two data (X and Y) are given by , where N is the number of elements in the sample. The nRMSD is given by . The SE of one data (Z) is given by , where σZ is the standard deviation of the data Z, and NZ is the number of elements in Z. The nSE is given by , where is the mean of the sample.
4.1 Intra-comparisons of GNSS snow depth results
The intra-comparisons of the snow depths are executed from three aspects, i.e., comparison of different GNSS constellations, frequency bands, and receivers. If we compare one of the three factors, we should prevent the other two and other random errors from cross-influence. In other words, we should ensure a snow depth value is “accurate” under the defined condition. Therefore, in this section, we use a rigorous threshold of SE = 1 cm to filter out the outliers. We show the correlation coefficient (r), RMSD and nRMSD values for each comparison. It should be noted that the nRMSD (snow depth > 5 cm) is significantly lower than the nRMSD (all). This is because the reference value (i.e., the mean snow depth) was used to normalize the RMSD. A large portion of snow depths in the study area is lower than 5 cm, yielding a lower mean value when involving all the data than when only using the > 5 cm data. The same principle applies to Figs. 9, 10 and 11. Nevertheless, the metrics only represent the comparison during the intermediate process of the data set production. Users can define their own rules to use the data according to the quality flags in the published data set.
Figure 9a and b show correlations of the snow depths between GPS and GLONASS for 24 and 12 h respectively, using data from the four GPS/GLONASS compatible sites. Both show good agreement, with the correlation coefficient r = 0.98 and RMSD = 1.01 cm for the 24 h result and RMSD = 0.97 cm for the 12 h results. Figure 9 also shows the RMSD and nRMSD values of snow depths greater than 5 cm, which is within the accuracy of the current GNSS-IR technology. The RMSD (nRMSD) of the 24 and 12 h results are respectively 1.65 cm (0.11) and 1.51 cm (0.10). The BDS results are not used for comparison due to the limited number of observations.

Figure 9Correlations of 24 h (a) and 12 h (a) snow depths from GPS and GLONASS observations. The error bar of each point is the standard error (SE) of the snow depths for all the available tracks of this point. Four available sites, i.e., hltl, hlhl, bfqe and bttl, during the GPS/GLONASS overlapped periods (i.e., 2014 and 2015) are used to plot this figure. For each point in the figure, the number of valid observations is more than five. To prevent other possible effects besides the GNSS constellation, the SE of snow depths is less than 1 cm (90 % for the 24 h data and 76 % for the 12 h data). Blue points are with the retrieved GPS and GLONASS snow depths greater than 5 cm. Root mean square difference is abbreviated as RMSD and normalized RMSD as nRMSD.
Figure 10a1, a2 and b1, b2 show correlations of the snow depths between GPS L1 and L2 and between GLONASS L1 and L2, respectively, using data from the same four GPS/GLONASS compatible sites as in Fig. 9. The results from different frequency bands show good consistency with each other, where r = 0.94 (RMSD = 1.64 cm) for GPS, and r = 0.99 (RMSD = 1.28 cm) for GLONASS (Fig. 10a1 and b1). The RMSD (nRMSD) values of snow depths greater than 5 cm are 2.68 cm (0.22) for GPS and 1.86 cm (0.10) for GLONASS. It should be noted that a small part of the difference between L1 and L2 is because the antenna phase centers are not in the same place. The initial bias occurs on the raw L1 and L2 reflector heights. However, the final bias becomes negligible because, during snow depth calculation, the reflector height value of bare soil is subtracted. The BDS results are still not used for comparison due to the limited number of observations.
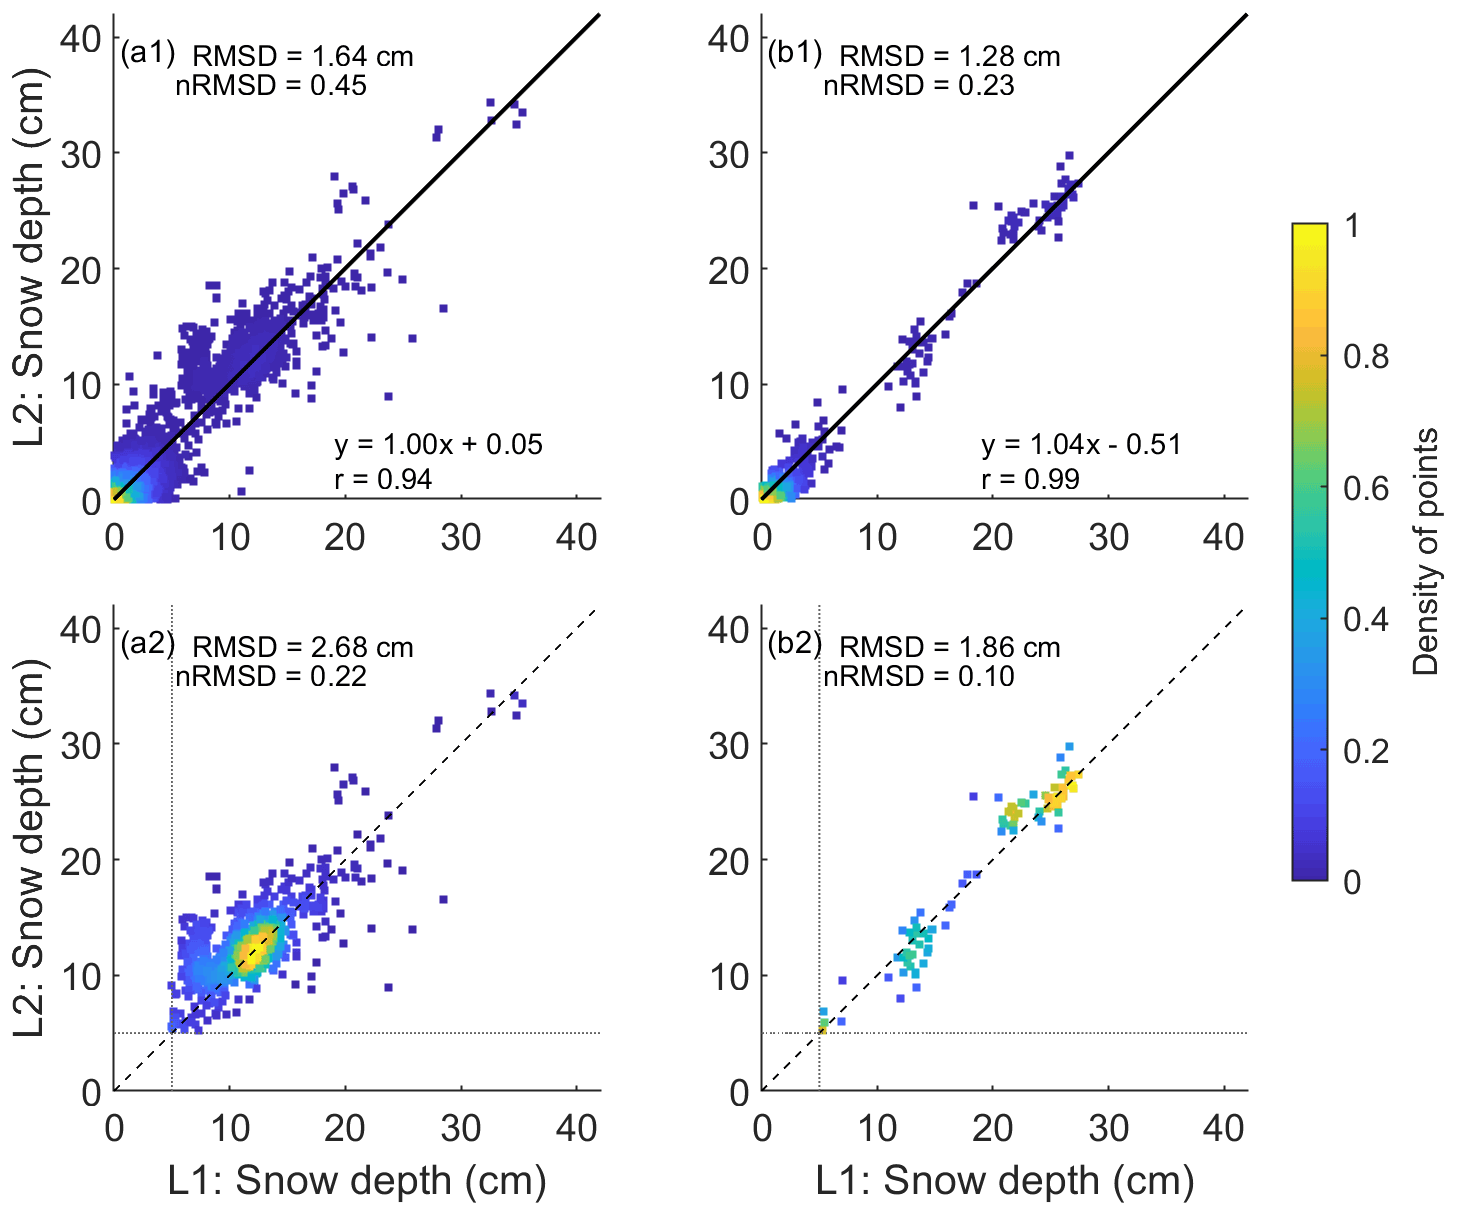
Figure 10Correlations of snow depth from different GNSS frequencies. (a1) GPS L1 vs. GPS L2; (b1) GLONASS L1 vs. GLONASS L2. The color bar represents the density of points; (a2) same as (a1) but with snow depths greater than 5 cm; (b2) same as (b1) but with snow depths greater than 5 cm. Fifty-one high-quality GPS sites of CMA and four GPS/GLONASS compatible sites are respectively used to plot (a1, a2) and (b1, b2). For each point in the figure, the number of valid observations is more than five. To prevent other possible effects besides the GNSS frequency, the SE of each snow depth is less than 1 cm in all the subfigures (61 % for the GPS data and 70 % for the GLONASS data). Root mean square difference is abbreviated as RMSD and normalized RMSD as nRMSD.
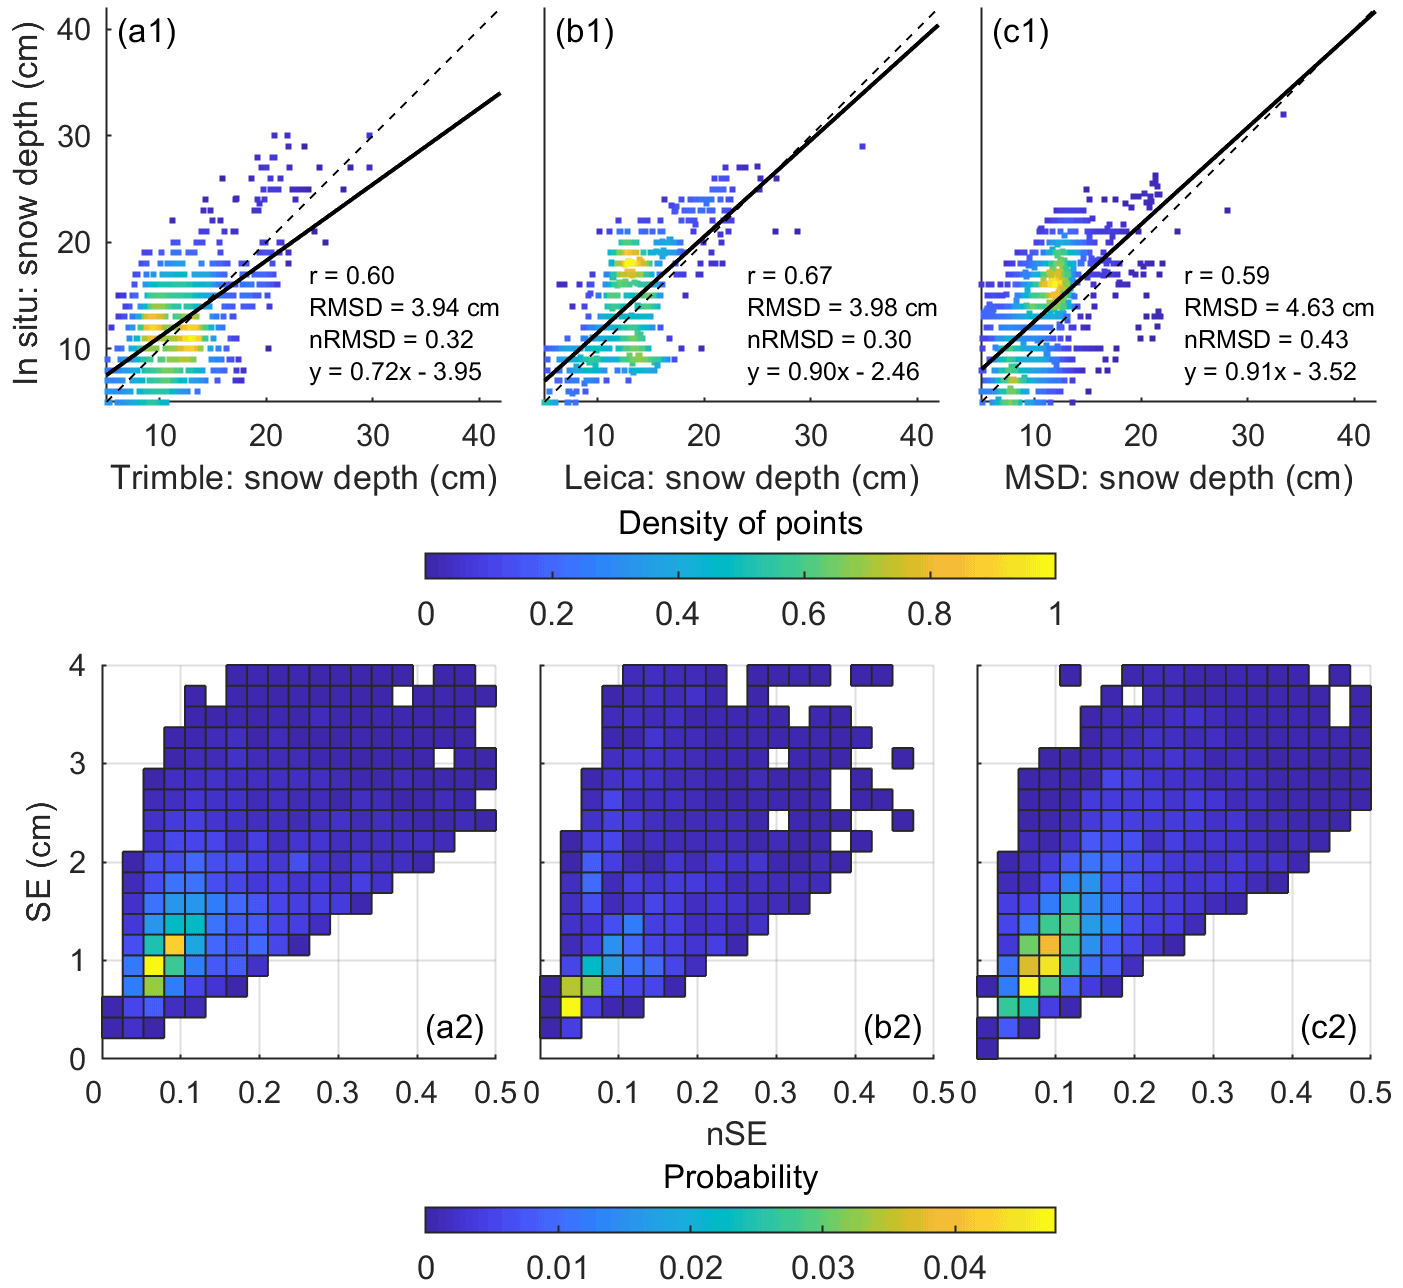
Figure 11Comparisons of the GNSS-derived snow depth and the in situ measurements from different types of GNSS receivers: (a1) Trimble; (b1) Leica; (c1) Minshida (MSD), and the histogram of the standard error (SE) and nSE of snow depths for different types of GNSS receivers: (a2) Trimble; (b2) Leica; (c2) MSD. The number of sites representing Trimble, Leica and MSD is 20, 5, and 24, respectively. The GNSS snow depth values are greater than 5 cm in this figure. To prevent other possible effects besides the receiver type, the SE of snow depths is less than 1 cm (63 % of the entire data) in (a1), (b1) and (c1). Root mean square difference is abbreviated as RMSD and normalized RMSD as nRMSD.
The CMA and CEA sites are set up with various brands of GNSS receivers. Most of these receivers are from three brands, i.e., Trimble, Leica and MinShiDa (MSD). In order to evaluate the snow depth results from these three brands, Fig. 11a1, b1 and c1 respectively show the differences of the snow depths derived from the three brands, using the in situ measurements as benchmarks. The results from the three brands show good consistency with r = 0.60, 0.67 and 0.59, and RMSD = 3.94, 3.98 and 4.63 cm, respectively. Figure 11a2, b2 and c3 further show the histogram of the SEs and nSEs of the snow depths from the three brands, and good consistency is also shown in these subfigures. The nSTE for Trimble, Leica and MSD is respectively around 1 cm (0.07), 0.6 cm (0.04) and 1 cm (0.07). Due to the inconsistent footprint between the GNSS and in situ measurements, the error metrics presented in Fig. 11 are for reference only and do not represent factual accuracies.
From the comprehensive intra-comparisons shown in Figs. 9–11, we conclude that the snow depths derived from different GNSS constellations, frequency bands, and receivers have overall good agreement. The average values of the metrics shown in Figs. 9–11 are summarized as follows: mean r = 0.98, mean RMSD = 0.99 cm, and mean nRMSD (snow depth > 5 cm) = 0.11 for different GNSS constellations; mean r = 0.97, mean RMSD = 1.46 cm, and mean nRMSD (snow depth > 5 cm) = 0.16 for different frequency bands; and mean r = 0.62 for different GNSS receivers. Therefore, it is feasible to combine all these results to produce the snow depth data set in this study.
4.2 Comparison with in situ measurements and the PMW products
The GNSS snow depth data set, the PMW data set, and the in situ measurements are not consistent in terms of the spatial footprint. The GNSS and in situ data have a closer footprint than the 25 km PMW data. The footprint of GNSS is approximately ∼ 30 m × 30 m, as illustrated in Fig. 17. Due to the discrepancy in footprint, it is impractical to give factual accuracies when comparing these three data sets. Instead, we present the performance of the three data sets at daily scale, multiyear scale, and interannual variabilities. The RMSD and nRMSD values presented in Figs. 13 and 14 are for reference only and do not represent factual accuracies.
Figure 12 shows an example of the comparisons of daily snow depth derived from GNSS, in situ, and PMW data sets. The data used in this figure are from 16 GNSS sites in 2016–2022, with the least missing daily snow depth values. The comparison period is from 2016 to 2022 due to the data discontinuity in other periods. The three data sets have similar variation trends but with apparent differences in absolute snow depth values. The GNSS-derived snow depths are closer to the in situ values than the PMW values for most sites because GNSS and in situ data have a closer footprint. However, for some sites (e.g., Site jldg in Fig. 12), the in situ measurements are much higher than the GNSS and PMW, which need further in-depth analysis. Figure 12 presents all the GNSS snow depth values of the 16 GNSS sites, regardless of its quality, to give a comprehensive illustration of the data. It is recommended that the users define their own rules to determine whether to use those snow depth values with low numbers of GNSS tracks or high SEs.

Figure 12Comparisons of daily snow depth derived from GNSS, in situ, and PMW data sets. The data used in this figure are from 16 GNSS sites in 2016–2022, with the least missing daily snow depth values.
Figure 13 shows an example of the comparisons of daily mean snow depth derived from GNSS, in situ, and PMW data sets. The data used in this figure are from 17 GNSS sites with the most extended temporal coverage (i.e., from 2013 to 2022). As expected, the GNSS and in situ data have similar performance compared to the PMW data, with RMSD = 2.37 cm and nRMSD = 0.23 for GNSS vs. in situ, and RMSD = 3.55 cm and nRMSD = 0.35 for GNSS vs. PMW. In addition, the peak of the PMW snow trend for each snow season is later in the season, which is due to the change of snow grain size (Dai et al., 2012).
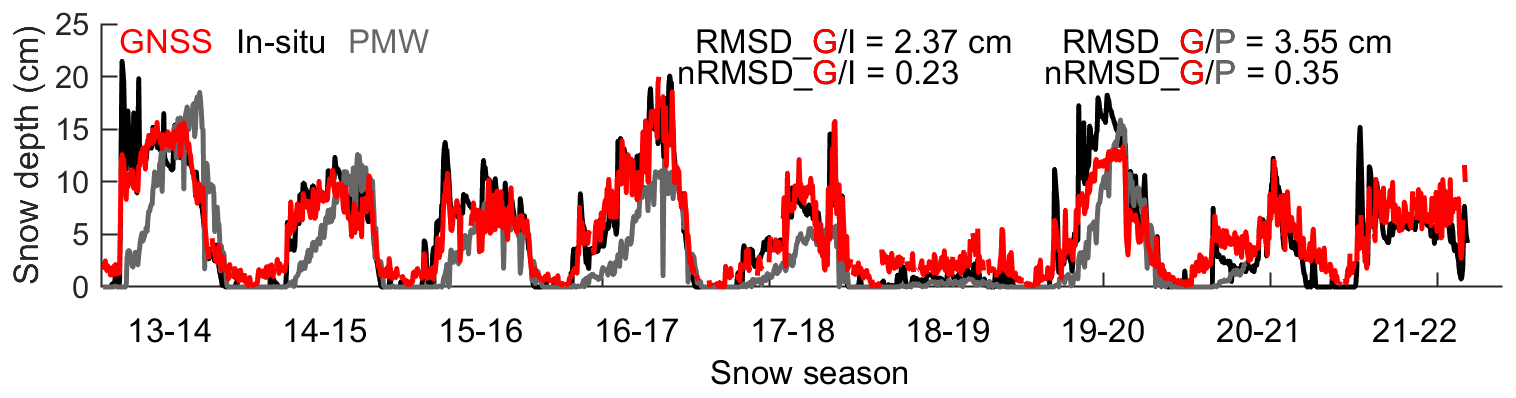
Figure 13Comparisons of daily mean snow depth derived from GNSS, in situ, and PMW data sets for 17 GNSS sites with the most extended temporal coverage (i.e., from 2013 to 2022). Root mean square difference is abbreviated as RMSD and normalized RMSD as nRMSD.
The annual mean and maximum snow depths are significant indicators that can reflect the overall data quality and the variation trend over multiple years. Sixteen sites with the least missing daily snow depth values (the same as data used in Fig. 12) are used to compare the multiyear averages of the annual maximum/mean snow depths derived from GNSS, in situ, and PMW. Coincidentally, all these 16 sites are located in the NCM region, making it possible to further analyze the interannual variability of the multiyear maximum or mean snow depth. Figure 14 shows a site-by-site comparison of the 5-year average of the annual maximum/mean snow depth derived from GNSS, in situ, and PMW, respectively. Figure 14a1 and b1 respectively show the spatial distribution of 16 sites marked by their corresponding values of the average annual (a1) maximum and (b1) mean snow depth. The snow depth values are classified into five categories to show consistency and discrepancy better. It shows high consistency for the three data sets in general but with discrepancies for some sites. Figure 14a2 and b2 respectively show the site-by-site comparison of the average annual (a2) maximum and (b2) mean snow depth.
The maximum values are consistent for the three data sets without regard for the in situ data that have one outlier at Site jldg. This data point is an outlier because the historical weather reports showed no significant snowfall events before or after these dates. This result is a reminder that operational laser measurements of snow depth are not always reliable. For the mean values shown in (b2), the GNSS and in situ have a better agreement than the PMW because of the significant difference in their spatial footprint. Most sites are located in the region with evergreen coniferous forest, which prevents the PMW data from acquiring reliable snow depth values due to its wider observation extent of 25 km. Figure 14a3 and b3 further show the correlation between the GNSS and in situ or PMW data. Accordingly, higher consistencies are achieved from GNSS vs. in situ than GNSS vs. PMW, with r = 0.75 (RMSD = 4.08 cm) vs. r = 0.57 (RMSD = 6.10 cm) for the maximum and r = 0.90 (RMSD = 1.22 cm) vs. r = 0.75 (RMSD = 3.59 cm) for the mean. The outliers are not involved during the correlations.

Figure 14Site-by-site comparison of the 5-year average annual maximum/mean snow depth derived from GNSS, in situ, and PMW data sets, respectively. (a1) The spatial distribution of the sites marked by their corresponding values of the 5-year average annual maximum snow depth; (b1) same as (a1) but the annual mean. (a2) The site-by-site comparison of the 5-year average annual maximum snow depth; (b2) same as (a2) but the annual mean. (a3) The correlation between the GNSS and in situ/PMW data sets for the 5-year average annual maximum; (b3) Same as (a3) but the annual mean. Sixteen sites with the least missing daily snow depth values from 2016 to 2022 are used to draw this figure. The site names are shown in (b2).Root mean square difference is abbreviated as RMSD.
The interannual variability of the multiyear average annual maximum (mean) snow depth using the same data in Fig. 14 is further shown in Fig. 15. The snow depth values in this figure are the mean values of all 16 sites. The maximum and mean achieve consistent interannual variabilities for all three data sets, with the absolute maximums of PMW being relatively higher than the other two. This result generally indicates that the GNSS data set in this study can be used as a new data source to monitor the interannual variability of snow depth.

Figure 15Interannual variability of the multiyear average annual maximum (mean) snow depth derived from GNSS, in situ, and PMW data sets. Sixteen sites with the least missing daily snow depth values from 2016 to 2022 are used to draw this figure. The site names are shown in Fig. 14b2. The PMW data were only available for the period 2016–2020.
4.3 Reflection on extreme snow event
Real-time and accurate monitoring of extreme snow events is of vital practical value. To test whether the new GNSS data set can provide supportive information for this application, we use the extreme snow event that happened on 21–22 February in the year 2015 to analyze the performance of the GNSS, in situ, and PMW data sets. This event is selected because we have overlapped GNSS data from two GPS/GLONASS compatible sites, i.e., bfqe and bttl, which can provide finer resolution snow depth observations. Figure 16a shows the daily snow depth variations before and after the snow event. As expected, the GNSS and in situ data have similar responses to the event, while the PMW data have a weak response. As indicated previously, these two sites are located in the evergreen coniferous forest region, which prevents the PMW data from acquiring reliable snow depth values due to its much larger footprint of 25 km. Figure 16b further shows the response of the 6 h GNSS snow depth data during the week of the event. It captures the evolution of the event in a more detailed way from DOY 51 than that of the other two data sets. However, due to the lack of reference data at the same rate, it is impossible to evaluate the quality of the 6 h GNSS data set. There are several discontinuities in the GNSS-derived snow depth (i.e., sharp decrease or increase) that are typically not seen in snowstorm data. The common feature of these abnormal values is that they all have high SEs (as shown in the bottom panel of Fig. 16b). As shown in the top panel of Fig. 16b, it is possibly due to the relatively low number of tracks used for producing the data set. The 2 and 3 h data are not shown in the figure due to severe data missing for some periods. Regardless of the limitations mentioned above, the GNSS data provide the potential to increase the monitoring frequency of extreme weather in a cheap and effective way in the future, even with a higher resolution of 6 h or better, particularly for those sites that have compatible observations from more GNSS satellite systems such as GPS, GLONASS, BDS and Galileo.
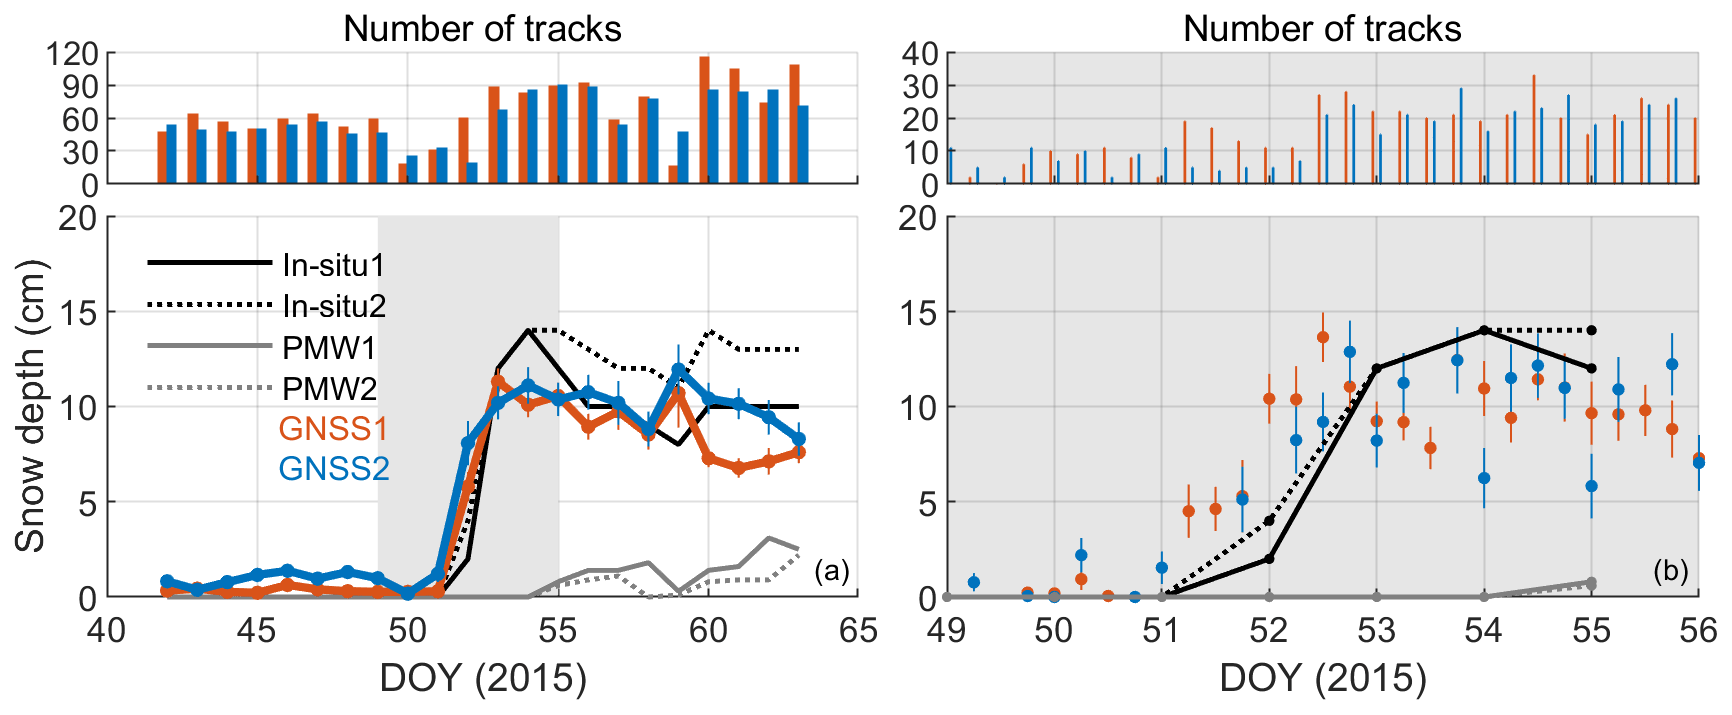
Figure 16Performance of the GNSS snow depth on a snow event. (a) Daily data; (b) 2 h data. Two GPS/GLONASS compatible sites, i.e., bfqe (in red) and bttl (in blue), are used to draw this figure. The error bar of each point in the figure is the standard error (SE) of the snow depths for all the available tracks of this point.
The GSnow-CHINA v1.0 data set is developed using observations from the two GNSS networks constructed by CMA and CEA. The data set is available at National Tibetan Plateau/Third Pole Environment Data Center via https://doi.org/10.11888/Cryos.tpdc.271839 (Wan et al., 2021). It is called version 1.0 because we produce the data set using historical observations till the year 2022, and there is room for improvement of the algorithm (e.g., how to properly consider the effects of vegetation and terrain). We will continue to maintain and update the algorithm and the data set as more years of data become available in the future. The data set includes snow depths of 24, 12, and 6/3/2 h temporal resolutions if possible, for 80 sites from 2013–2022 over northern China (25–55∘ N, 70–140∘ E). The sites over southern China are not included because there is most probably no snow in that region. The high and medium sites are all preserved in the data set with multiple quality flags for users to apply to the data.
There are two folders in the data set, i.e., the SITE_INFO and the SNOW_DEPTH. The SITE_INFO folder includes the general information of the 80 GNSS sites, with four separate sheets in one .XLS file corresponding to CMA high-quality, CMA medium-quality, CEA high-quality, and CEA medium-quality, respectively. The items in the file are listed as SITE_NAME, LAT (latitude), LON (longitude), ALT (altitude), RECEIVER_TYPE, GNSS_TYPE, ANTENNA_HEIGHT (in meter), and MEAN_VSM (volumetric soil moisture in cm3 cm−3; mean value derived using SMAP soil moisture data of 2015–2020). The SNOW_DEPTH folder includes the snow depth values for all available sites. The folder is structured by ∼/site/. For example, ∼/hltl/ stores the snow depth data of Site hltl. There are four sub-folders in the folder of each site, i.e., raw0, filtered0, raw, and filtered. The “raw0” and “filtered0” folders store raw data and raw-but-filtered data for individual satellite/quadrant/frequency/time. The “raw” and “filtered” folders store 24 h/12 h data produced using raw data in the corresponding “raw0” and “filtered0” folders. The file names including *_24h.csv, *_12h.csv, and *_02h.csv represent the 24, 12, and 2 h resolution data. Each CSV file gathers this specific snow season (e.g., the 2019 file stores values from 1 October 2019, to 30 April 2020). We recommend using the snow depth data in the “filtered” folder for validation/application purposes while using the snow depth data in the “raw” folder for algorithm testing purposes.
Three quality flags are included in each snow depth file, i.e., the SE, NUM_OF_PRNs, and NDVI, denoting the SE of snow estimations, the number of GNSS sites, and the MODIS NDVI value, respectively. These flags should be used to filter the data to balance the data volume and the snow depth accuracy. In addition, we do not recommend using the snow depth values of less than 5 cm in the data set, which is beyond the accuracy of the current GNSS-IR technology.
Figure 17 shows an example of the snow sensing footprint for a specific satellite track. For a 3 m antenna height under regular 10–30∘ elevation angles, the footprint of a specific satellite track is defined as ellipses characterized by the First Fresnel Zone (Larson and Nievinski, 2013), with the maximum length of ∼ 30 m for one direction. The GNSS footprint can be recognized as a ∼ 30 m × 30 m circle for all orientations. This footprint is between the point-scale of the in situ measurements and the coarse 25 km resolution of PMW, which makes it an effective supplement data source for research, validation and application purposes.
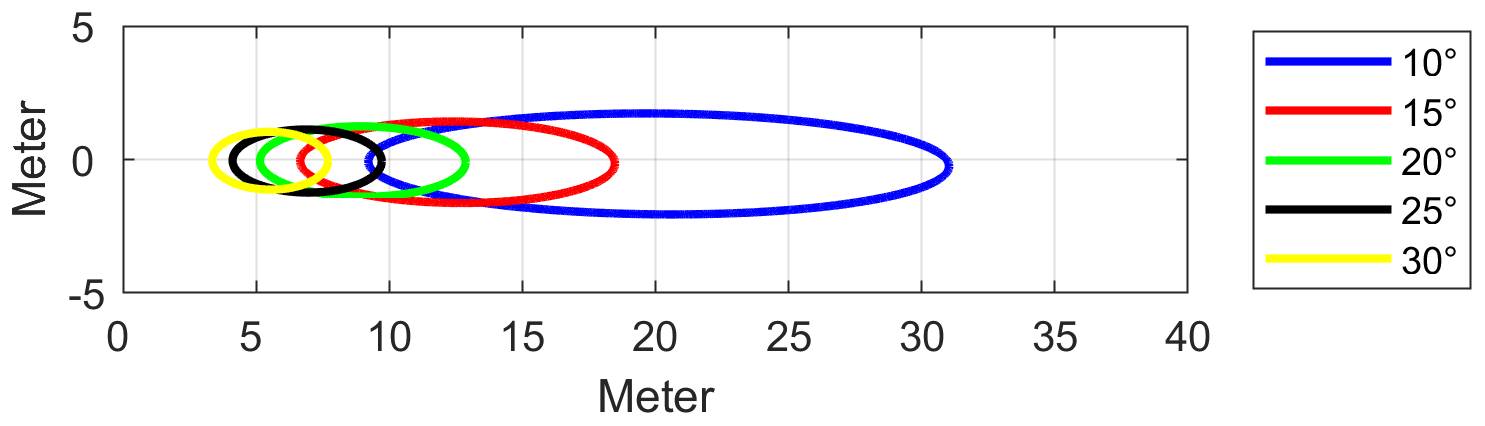
Figure 17The footprint of the GNSS snow depth observation for a specific satellite track with different satellite elevation angles.
Although this study releases a data set using the current GNSS sites, which are suitable for snow depth retrieval, those sites that are not suitable for this purpose still deserve an extended analysis to promote this research domain's development further. Furthermore, although the method to retrieve snow depth used in this data set is determined as the SNR model due to data availability, it deserves an extended discussion of the selection of the method for interested readers who are dedicated to developing their own data set. Section 6.1 and 6.2 give an extended analysis of the two issues mentioned above.
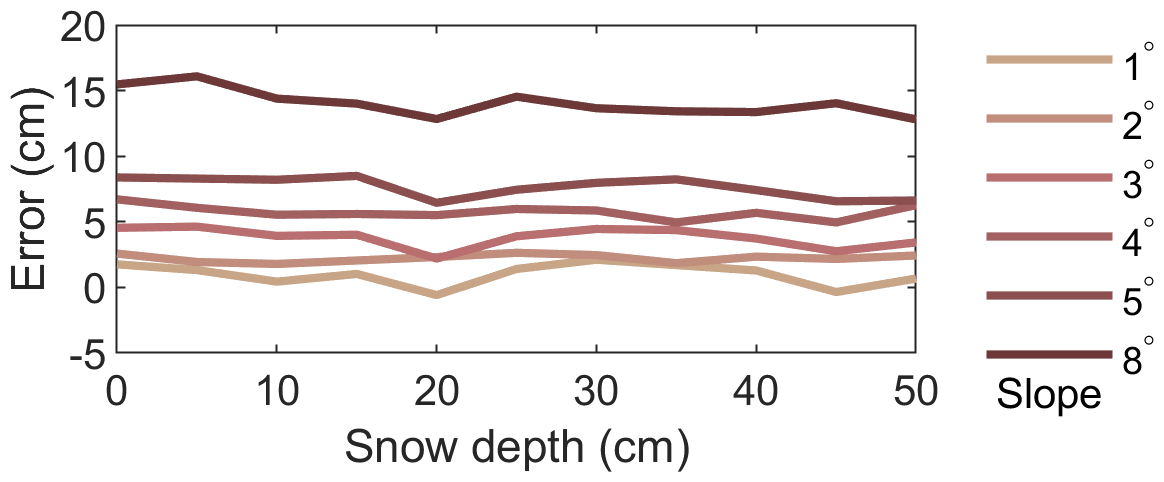
Figure 18Simulations of the effects of terrain slopes on snow depth retrievals for a 2 m antenna height of GPS L1 (wavelength = 19 cm).
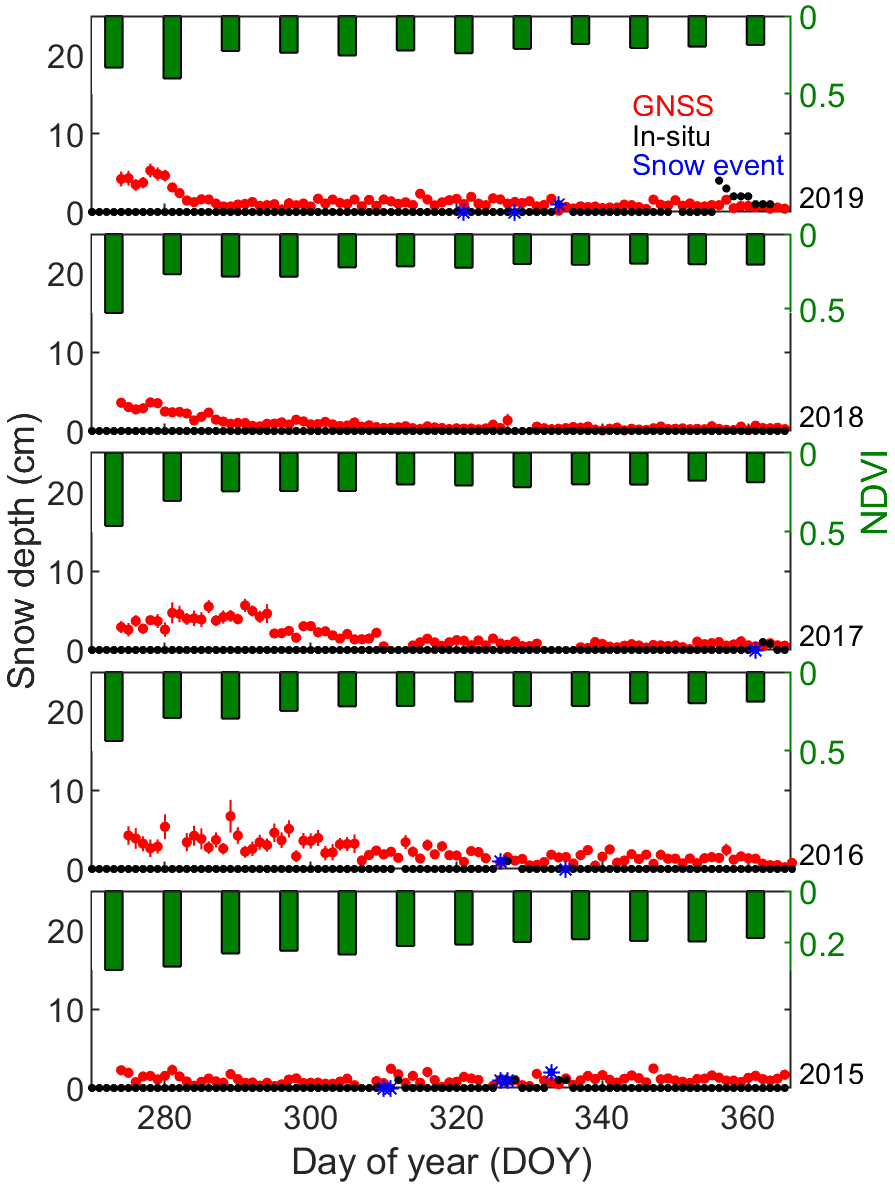
Figure 19Examples showing the vegetation effects on snow depth retrieval. The site presented here is bfxc (2015–2020). The error bar of each point in the figure is the standard error (SE) of the snow depths for all the available tracks of this point.
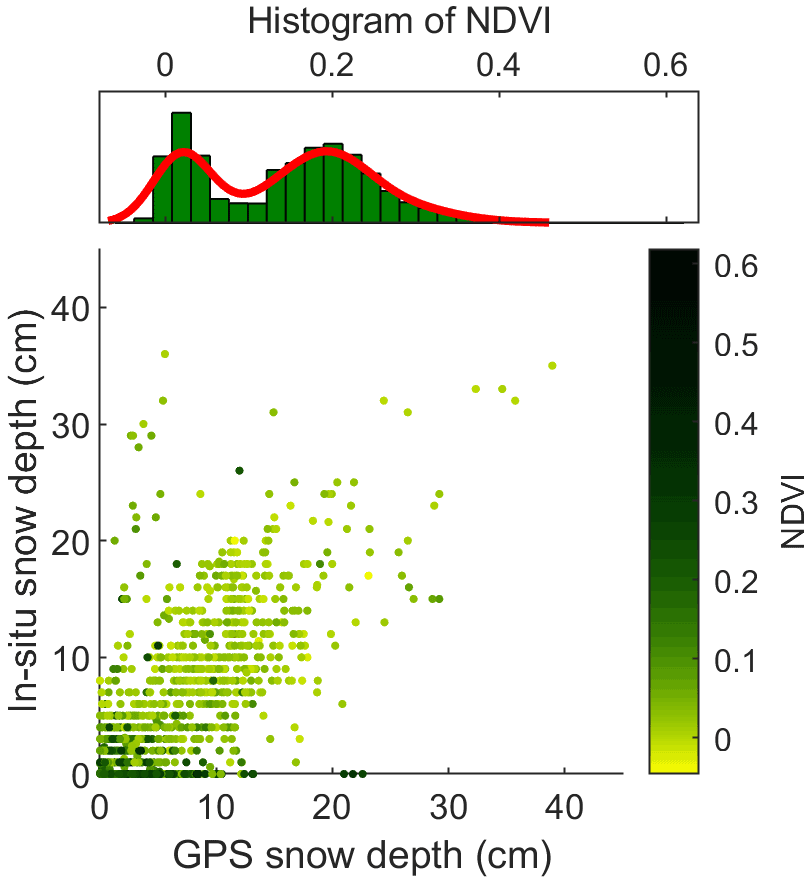
Figure 20Correlation between the GNSS snow depth and the in-situ measurement colored by NDVI. The top panel shows the statistics of the GNSS snow depth when the corresponding in situ = 0. Three-month data from 74 high- and medium-quality CMA sites are used to draw this figure. For each point in the figure, the number of valid observations is more than five, and the SE of snow depths is less than 2 cm.
6.1 Factors that affect the site quality for snow depth retrieval
-
Natural surroundings. The natural environment within the footprint of the observations is the most significant factor that determines whether a specific GNSS site is suitable for snow depth retrieval or not. Open and flat ground with no vegetation is the ideal environment to set up a snow site. In other words, terrain and vegetation are the two significant issues that affect snow depth retrieval.
In practical applications, none of the planar surfaces is entirely horizontal. Small ground tilting angles translate into several tens of centimeters of bias due to the large horizontal distances involved (Larson and Nievinski, 2013). Figure 18 shows simulations for a 2 m antenna height with a variety of snow depth levels and positive terrain slopes using the open-source GPS multipath simulator provided by Nievinski and Larson (2014b). For slopes of 5∘ and less, the error in snow depth retrieval is below 10 cm, while for larger slopes (e.g., 8∘ in the figure), the residual effects are ∼ 15 cm and higher. Fortunately, for GPS satellites with repeatable ground tracks, such a topographic bias remains stable over time. It thus could be canceled out when using Eq. (1) to estimate snow depth, most of which is the case in this study. While the ground tracks are non-repeatable for GNSS satellites like GLONASS and BDS, the terrain effect should be considered. Some previous studies investigated methods to eliminate the influence of terrain (Zhang et al., 2017, 2020). We are also developing a new approach to consider the terrain effects, which will be demonstrated in a future study.
Vegetation is another factor that needs to be considered for accurate retrieval of snow depth. Figure 19 shows an example of Site bfxc, which has vegetation effects on snow depth retrieval before DOY 300 for 2015 ∼ 2019. The vegetation information is presented by the MODIS 1 km 8 d NDVI data. The period of the vegetation effects for different years are different, e.g., the years 2016 and 2017 have the most extended period of ∼ 30 d from DOYs 270 to 300, while the years 2018 and 2019 only have ∼ 10 d around DOY 270. The effect of vegetation is not strictly consistent with the variation of NDVI, which makes it impossible to build a model to qualify the vegetation effect using NDVI data.
Figure 20 shows a correlation between the GNSS snow depth and the in situ measurement colored by NDVI. Note that for those points on the x axis with in situ values equal to 0, but with various GNSS snow depth values, the NDVI values are generally higher than other data points. It illustrates that GNSS measures vegetation rather than snow for these data points. A previous study suggested that it is practical to use the amplitude of the GNSS SNR data to retrieve vegetation height for observations of 1 s sampling (Wan et al., 2015). Therefore, for GNSS observations at the sampling intervals, it may be possible to use the SNR amplitude to build a model to qualify the vegetation effect on snow depth retrieval. However, this is not practical for the CMA or CEA sites used in this study because the sampling interval is 30 s, making it impossible to model the SNR data series to derive the amplitude. Future research will consider using other vegetation indicators to identify this issue.
-
Quality of the observation data. The data quality is another critical factor that determines whether a site is suitable for snow depth retrieval or not. Firstly, the minimum elevation angle of GNSS satellites should be set to a single number like 5∘ or 10∘ to preserve the multipath effect as much as possible, because only data with low elevation angles can show the surface reflection. Secondly, the observables used as inputs for the corresponding snow depth models should be stored in the raw RINEX file. If the stored observables satisfy conditions for multiple models, one can choose the model according to its accuracy or combine them to use all the models during the calculation. This issue will be discussed further in Sect. 6.2. Thirdly, the GNSS tracks may miss data in some epochs during the ascending or descending sequences, although they satisfy the condition of minimum to maximum elevation angles. These data are removed in this study to ensure the accurate acquisition of the reflector heights. Finally, random errors, e.g., human activities at some point, may exist during the observations.
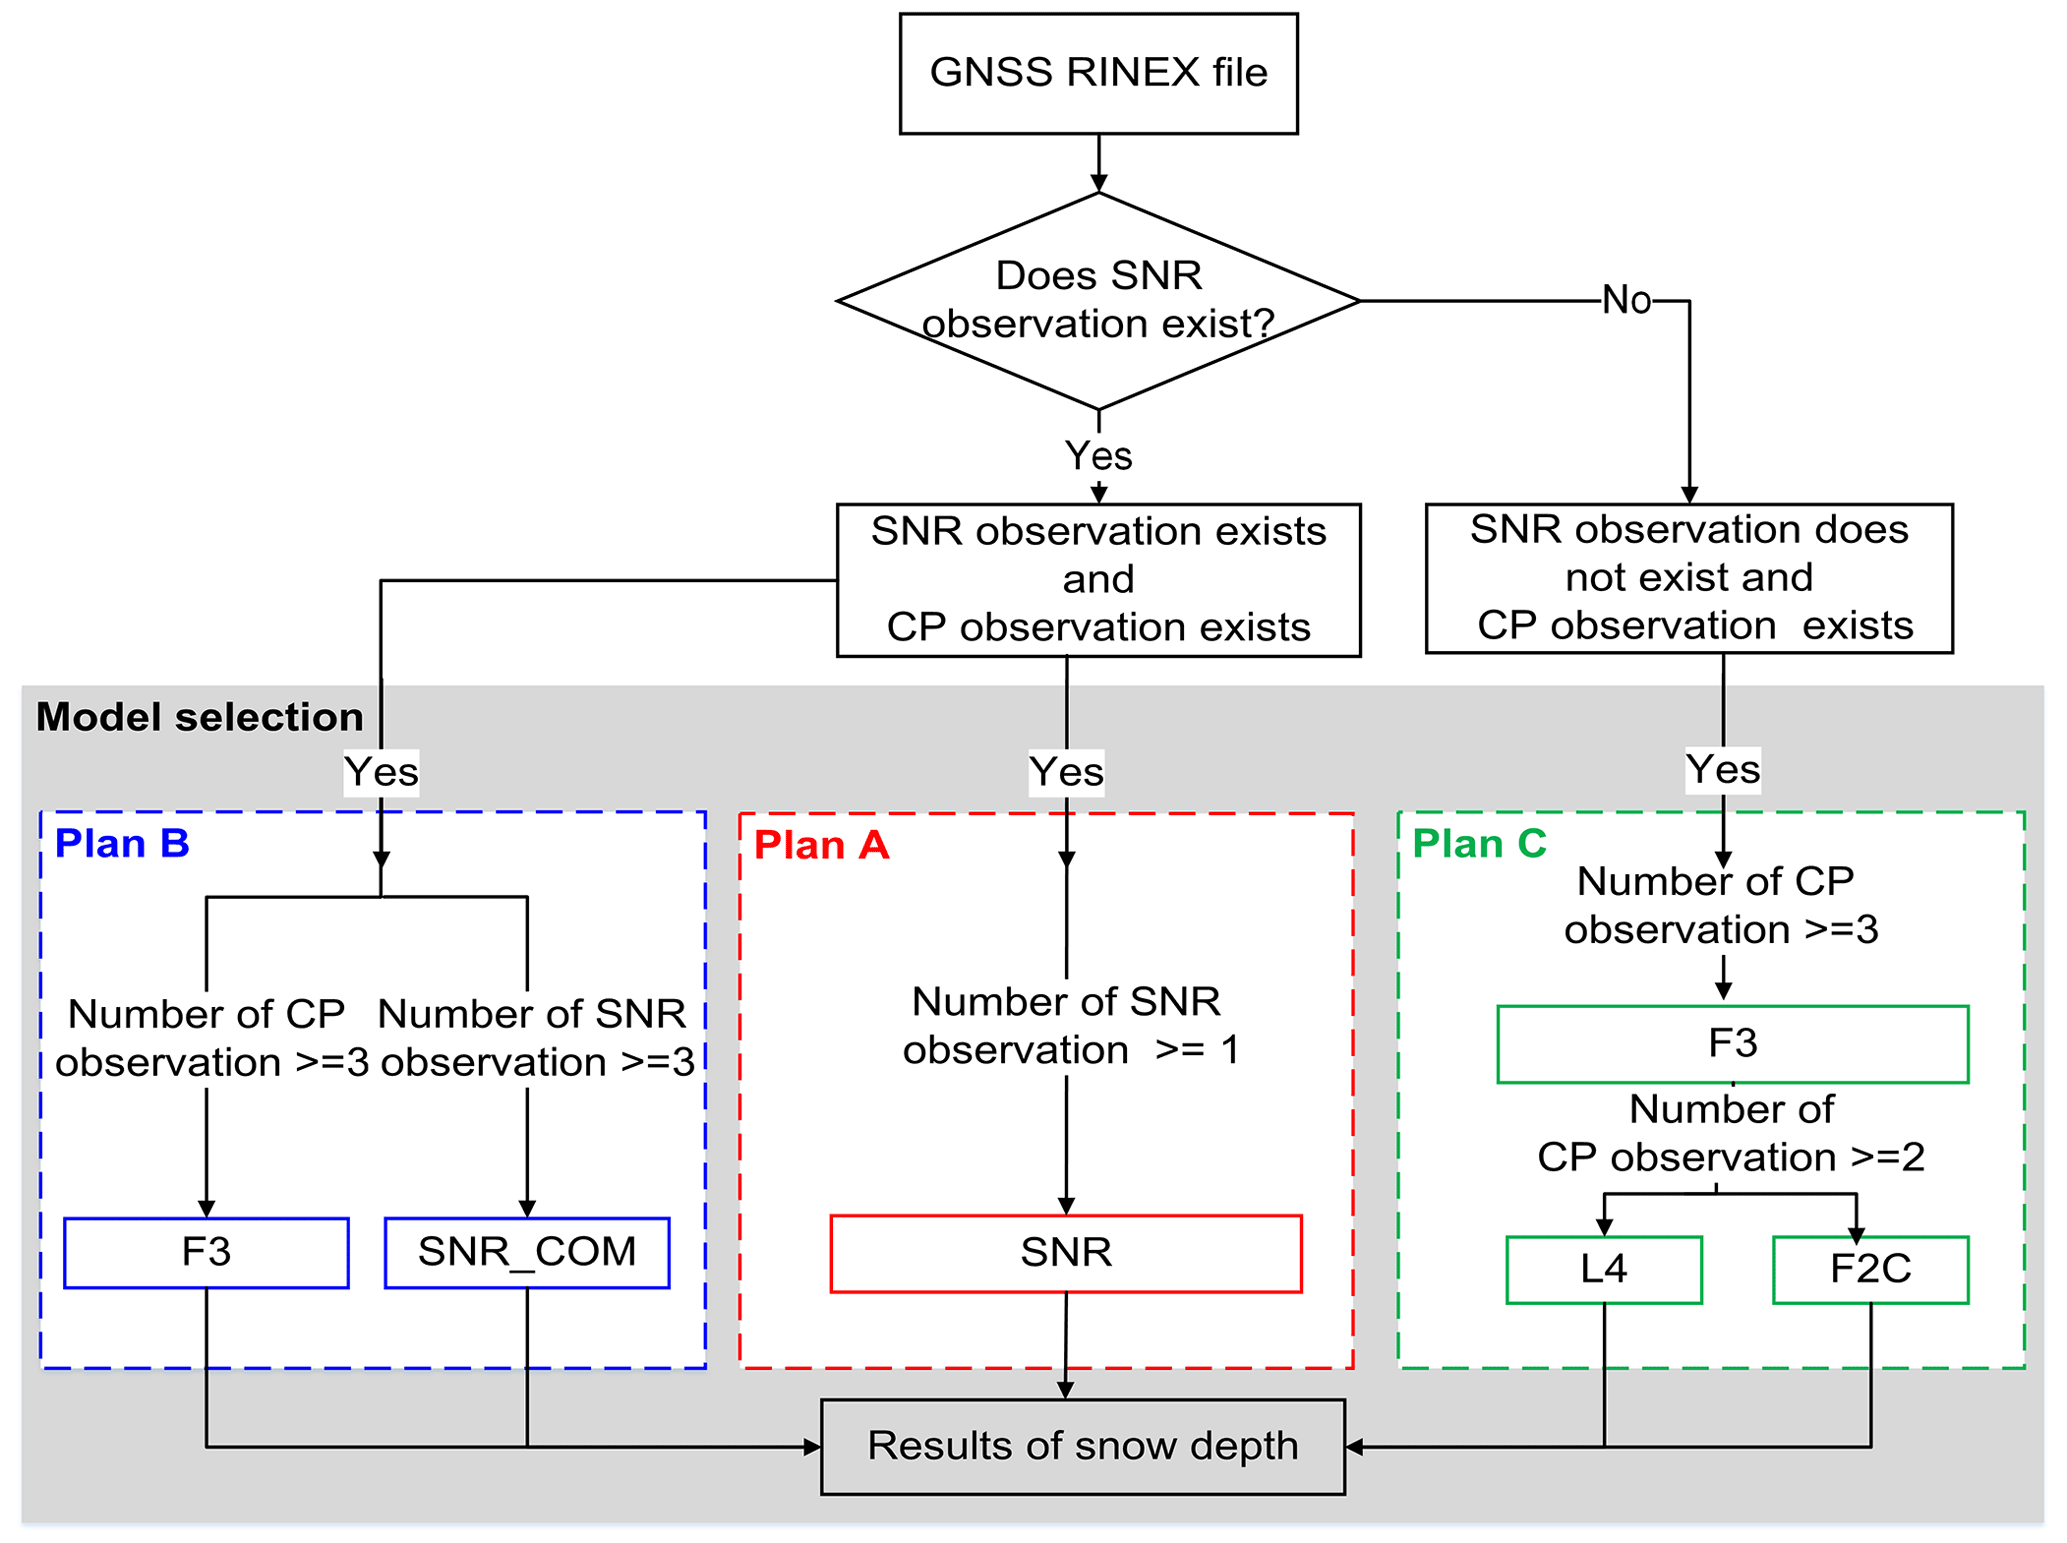
Figure 21The strategy of model selection for using GNSS data to retrieve snow depth. Carrier phase is abbreviated as CP. Different solutions are represented as Plan A, B and C.
6.2 Selection of snow depth models
Although there are many models to retrieve snow depth, as illustrated in Table 1, considering the availability of the observables and the accuracy of the models, not all models are applicable or optimal in practical application. Figure 21 shows an overall strategy of model determination for using GNSS data to retrieve snow depth. One should first consider whether the SNR observable exists in the RINEX file since CP and pseudorange are observations that generally exist for positioning. If the observables satisfy all the snow depth models, the optimal model is selected according to the number of frequencies in the RINEX file. If the frequencies received by the receiver are less than 3, the SNR model is the best choice since it is simple and has reliable accuracy (Plan A in the figure). If the received frequencies are equal to or are greater than 3, the SNR_COM and F3 models can be used (Plan B in the figure). However, one can still use Plan A to replace Plan B in practical applications. If the SNR observable does not exist (Plan C), the F3 model is preferred when the number of CP is greater than 3, while the L4 or F2C model is selected when the number of CP is less than 3. Nevertheless, the effects of the ionosphere delay on the L4 and F2C models are difficult to remove, which leads to the relatively low accuracy of these two models (Liu et al., 2022).
The GSnow-CHINA v1.0 data set is archived and available at the National Tibetan Plateau/Third Pole Environment Data Center (Li et al., 2020; Pan et al., 2021) via https://doi.org/10.11888/Cryos.tpdc.271839 (Wan et al., 2021).
This study proposes a comprehensive framework using raw data of the complex GNSS station networks to automatically retrieve snow depth and control its quality. Based on this, the study further produces a long-term snow depth data set over northern China (i.e., GSnow-CHINA v1.0, 12 h or 24 h, 2013–2022) using the proposed framework and historical data from 80 stations.
The data set has high internal consistency with regards to different GNSS constellations (mean r = 0.98, RMSD = 0.99 cm, and nRMSD (snow depth > 5 cm) = 0.11), different frequency bands (mean r = 0.97, RMSD = 1.46 cm, and nRMSD (snow depth > 5 cm) = 0.16), and different GNSS receivers (mean r = 0.62). The data set also has high external consistency with the in situ measurements and the PMW products, with a consistent illustration of the interannual snow depth variability. Results from the 17 GNSS sites with the most extended temporal coverage (i.e., from 2013 to 2022) show better performance between GNSS and in situ that between GNSS and PMW, with RMSD = 2.37 cm and nRMSD = 0.23 for the former, and RMSD = 3.55 cm and nRMSD = 0.35 for the latter. The results also show the good potential of GNSS to derive hourly snow depth observations for better monitoring of snow disasters. The proposed framework to develop the data set provides comprehensive and supportive information for users to process raw data of ground GNSS stations with complex environmental conditions and various observation conditions. The resulting GSnow-CHINA v1.0 data set is distinguished from the current point-scale in situ data or coarse-gridded data, and can be used as an independent data source for validation purposes. The data set is also useful for regional and global climate research and other meteorological and hydrological applications.
Finally, it should be noted that, although we tried our best to reuse the data from the current GNSS networks, there are still limitations concerning the raw data (e.g., limited site numbers and GNSS data types). We look forward to having more sites and data from more GNSS systems (such as from China's Beidou) from CMA or other organizations to use in the future. Both the algorithm and data set will be maintained and updated as more years of data become available.
WW designed the study and wrote the manuscript. HL provided the GNSS raw data for the production of this data set and co-designed the study. LD provided supportive information for the validation using the PMW snow depth product. LZ provided supportive information for the data filtering. JZ, TY, BL, ZG and HH contributed to the data/codes accumulation. All authors contributed to the writing and editing of this paper.
The contact author has declared that none of the authors has any competing interests.
Publisher's note: Copernicus Publications remains neutral with regard to jurisdictional claims in published maps and institutional affiliations.
This article is part of the special issue “Extreme environment datasets for the three poles”. It is not associated with a conference.
The first author would like to thank team members from the Meteorological Observation Center, China Meteorological Administration (CMA) for producing, maintaining and providing the raw GNSS RINEX data and the in situ data. The first author would also like to thank team members Lei Xiao and Yuan Gao from Peking University for their contributions to data preparation. The authors would like to thank the SMAP team, the MODIS team, and the PMW team for archiving and providing the data used in this study. The first author would like to give special thanks to Waner Zhao for her collaboration during the preparation and writing of this manuscript.
This study is jointly supported by the National Key Research and Development Program of China (grant no. 2019YFE0126600), the National Natural Science Foundation of China (NSFC) projects (grant no. 41971377 and no. 41501360), The open fund of the National Earth Observation Data Center (no. NODAOP2021002), the observing experiment project of Meteorological Observation Center of China Meteorological Administration (no. SY2020005), and the ESA-MOST China Dragon 5 Programme (ID.58070).
This paper was edited by Xin Li and reviewed by Kristine Larson, Achille Capelli and one anonymous referee.
Armstrong, R. L. and Brodzik, M. J.: Recent northern hemisphere snow extent: A comparison of data derived from visible and microwave satellite sensors, Geophys. Res. Lett., 28, 3673–3676, https://doi.org/10.1029/2000GL012556, 2001.
Che, T. and Dai, L.: Long-term series of daily snow depth dataset in China (1979–2020), National Tibetan Plateau Data Center [data set], https://doi.org/10.11888/Geogra.tpdc.270194, 2015.
Che, T., Li, X., Jin, R., Armstrong, R., and Zhang, T. J.: Snow depth derived from passive microwave remote-sensing data in China, Ann. Glaciol., 49, 145–154, https://doi.org/10.3189/172756408787814690, 2008.
Che, T., Dai, L., Zheng, X., Li, X., and Zhao, K.: Estimation of snow depth from passive microwave brightness temperature data in forest regions of northeast China, Remote Sens. Environ., 183, 334–349, https://doi.org/10.1016/j.rse.2016.06.005, 2016.
Chen, Q., Won, D., and Akos, D. M.: Snow depth sensing using the GPS L2C signal with a dipole antenna, EURASIP J. Adv. Signal Process., 2014, 1–10, https://doi.org/10.1186/1687-6180-2014-106, 2014.
Dai, L., Che, T., Wang, J., and Zhang, P.: Snow depth and snow water equivalent estimation from AMSR-E data based on a priori snow characteristics in Xinjiang, China, Remote Sens. Environ., 127, 14–29, https://doi.org/10.1016/j.rse.2011.08.029, 2012.
Dai, L., Che, T., and Ding, Y.: Inter-calibrating SMMR, SSM/I and SSMI/S data to improve the consistency of snow-depth products in China, Remote Sensing, 7, 7212–7230, https://doi.org/10.3390/rs70607212, 2015.
Dai, L., Che, T., Ding, Y., and Hao, X.: Evaluation of snow cover and snow depth on the Qinghai–Tibetan Plateau derived from passive microwave remote sensing, The Cryosphere, 11, 1933–1948, https://doi.org/10.5194/tc-11-1933-2017, 2017.
Didan, K.: MODIS/Terra Vegetation Indices 16-Day L3 Global 1km SIN Grid (V061), NASA EOSDIS Land Processes Distributed Active Archive Center (LP DAAC) [data set], https://doi.org/10.5067/MODIS/MOD13A2.061, 2021.
Frei, A. and Robinson, D. A.: Northern Hemisphere snow extent: regional variability 1972–1994, Int. J. Climatol., 19, 1535–1560, https://doi.org/10.1002/(SICI)1097-0088(19991130)19:14<1535::AID-JOC438>3.0.CO;2-J, 1999.
Guerreiro, K., Fleury, S., Zakharova, E., Rémy, F., and Kouraev, A.: Potential for estimation of snow depth on Arctic sea ice from CryoSat-2 and SARAL/AltiKa missions, Remote Sens. Environ., 186, 339–349, https://doi.org/10.1016/j.rse.2016.07.013, 2016.
Hallikainen, M. T., Ulaby, F. T., Dobson, M. C., El-Rayes, M. A., and Lil-Kun, W.: Microwave Dielectric Behavior of Wet Soil-Part 1: Empirical Models and Experimental Observations, IEEE T. Geosci. Remote, GE-23, 25–34, https://doi.org/10.1109/TGRS.1985.289497, 1985.
Hao, X., Huang, G., Che, T., Ji, W., Sun, X., Zhao, Q., Zhao, H., Wang, J., Li, H., and Yang, Q.: The NIEER AVHRR snow cover extent product over China – a long-term daily snow record for regional climate research, Earth Syst. Sci. Data, 13, 4711–4726, https://doi.org/10.5194/essd-13-4711-2021, 2021.
Henderson, G. R., Peings, Y., Furtado, J. C., and Kushner, P. J.: Snow–atmosphere coupling in the Northern Hemisphere, Nat. Clim. Change, 8, 954–963, https://doi.org/10.1038/s41558-018-0295-6, 2018.
Kinar, N. J. and Pomeroy, J. W.: Measurement of the physical properties of the snowpack, Rev. Geophys., 53, 481–544, https://doi.org/10.1002/2015RG000481, 2015.
Larson, K. M. and Nievinski, F. G.: GPS snow sensing: results from the EarthScope Plate Boundary Observatory, GPS Solutions, 17, 41–52, https://doi.org/10.1007/s10291-012-0259-7, 2013.
Larson, K. M., Gutmann, E. D., Zavorotny, V., Braun, A., Williams, M. W., and Nievinski, F. G.: Can we measure snow depth with GPS receivers, Geograph. Res. Lett., 36, L17502, https://doi.org/10.1029/2009GL039430, 2009.
Leinss, S., Parrella, G., and Hajnsek, I.: Snow Height Determination by Polarimetric Phase Differences in X-Band SAR Data, IEEE J. Sel. Top. Appl., 7, 3794–3810, https://doi.org/10.1109/JSTARS.2014.2323199, 2014.
Li, X., Che, T., Li, X., Wang, L., Duan, A., Shangguan, D., Pan, X., Fang, M., and Bao, Q.: CASEarth Poles: Big Data for the Three Poles, B. Am. Meteorol. Soc., 101, E1475–E1491, https://doi.org/10.1175/BAMS-D-19-0280.1, 2020.
Lievens, H., Demuzere, M., Marshall, H.-P., Reichle, R. H., Brucker, L., Brangers, I., de Rosnay, P., Dumont, M., Girotto, M., Immerzeel, W. W., Jonas, T., Kim, E. J., Koch, I., Marty, C., Saloranta, T., Schöber, J., and De Lannoy, G. J. M.: Snow depth variability in the Northern Hemisphere mountains observed from space, Nat. Commun., 10, 4629, https://doi.org/10.1038/s41467-019-12566-y, 2019.
Liu, S., Zhang, J., Wan, W., Liang, H., Liu, B., and Guo, Z.: A comprehensive evaluation of utilizing BeiDou data to estimate snow depth from two ground-based stations, GPS Solutions, in press, 2022.
Lomb, N. R.: Least-squares frequency analysis of unequally spaced data, Astrophys. Space Sci., 39, 447–462, https://doi.org/10.1007/BF00648343, 1976.
Nievinski, F. G. and Larson, K. M.: Inverse Modeling of GPS Multipath for Snow Depth Estimation – Part II: Application and Validation, IEEE T. Geosci. Remote., 52, 6564–6573, https://doi.org/10.1109/TGRS.2013.2297688, 2014a.
Nievinski, F. G. and Larson, K. M.: An open source GPS multipath simulator in Matlab/Octave, GPS Solutions, 18, 473–481, https://doi.org/10.1007/s10291-014-0370-z, 2014b.
O'Neill, P. E., Chan, S., Njoku, E. G., Jackson, T., Bindlish, R., and Chaubell, J.: SMAP L3 Radiometer Global Daily 36 km EASE-Grid Soil Moisture (Version 6), NASA National Snow and Ice Data Center Distributed Active Archive Center [data set], https://doi.org/10.5067/EVYDQ32FNWTH, 2019.
Ozeki, M. and Heki, K.: GPS snow depth meter with geometry-free linear combinations of carrier phases, J. Geodesy, 86, 209–219, https://doi.org/10.1007/s00190-011-0511-x, 2012.
Pan, X., Guo, X., Li, X., Niu, X., Yang, X., Feng, M., Che, T., Jin, R., Ran, Y., Guo, J., Hu, X., and Wu, A.: National Tibetan Plateau Data Center: Promoting Earth System Science on the Third Pole, B. Am. Meteorol. Soc., 102, E2062–E2078, https://doi.org/10.1175/BAMS-D-21-0004.1, 2021.
Peng, X., Wan, W., and Chen, X.: Using GPS SNR data to estimate Soil Moisture variations: Proposing a new interference model, 2016 IEEE Int. Geosci. Remote, 4819–4822, https://doi.org/10.1109/IGARSS.2016.7730257, 10–15 July 2016,
Robinson, D. A., Dewey, K. F., and Heim, R. R.: Global Snow Cover Monitoring: An Update, B. Am. Meteorol. Soc., 74, 1689–1696, https://doi.org/10.1175/1520-0477, 1993.
Shao, D., Li, H., Wang, J., Hao, X., Che, T., and Ji, W.: Reconstruction of a daily gridded snow water equivalent product for the land region above 45° N based on a ridge regression machine learning approach, Earth Syst. Sci. Data, 14, 795–809, https://doi.org/10.5194/essd-14-795-2022, 2022.
Shi, J. and Dozier, J.: Estimation of snow water equivalence using SIR-C/X-SAR. II. Inferring snow depth and particle size, IEEE T. Geosci. Remote, 38, 2475–2488, https://doi.org/10.1109/36.885196, 2000.
Tabibi, S., Geremia-Nievinski, F., and Dam, T. v.: Statistical Comparison and Combination of GPS, GLONASS, and Multi-GNSS Multipath Reflectometry Applied to Snow Depth Retrieval, IEEE T. Geosci. Remote, 55, 3773–3785, https://doi.org/10.1109/TGRS.2017.2679899, 2017a.
Tabibi, S., Nievinski, F., and Van Dam, T.: Statistical Comparison and Combination of GPS, GLONASS, and Multi-GNSS Multipath Reflectometry Applied to Snow Depth Retrieval, IEEE T. Geosci. Remote, 55, 3773–3785, https://doi.org/10.1109/TGRS.2017.2679899, 2017b.
Vey, S., Güntner, A., Wickert, J., Blume, T., Thoss, H., and Ramatschi, M.: Monitoring Snow Depth by GNSS Reflectometry in Built-up Areas: A Case Study for Wettzell, Germany, IEEE J. Sel. Top. Appl., 9, 4809–4816, https://doi.org/10.1109/JSTARS.2016.2516041, 2016.
Wan, W., Larson, K. M., Small, E. E., Chew, C. C., and Braun, J. J.: Using geodetic GPS receivers to measure vegetation water content, GPS Solutions, 19, 237–248, https://doi.org/10.1007/s10291-014-0383-7, 2015.
Wan, W., Zhang, J., Dai, L., Liang, H., Liu, B., Guo, Z., Hu, H., Yang, T., Zhao, L.: A GNSS-based snow depth data set over northern China (GSnow-CHINA v1.0, 12h/24h, 2013–2022), National Tibetan Plateau Data Center [data set], https://doi.org/10.11888/Cryos.tpdc.271839, 2021.
Wang, X., Zhang, S., Wang, L., He, X., and Zhang, Q.: Analysis and combination of multi-GNSS snow depth retrievals in multipath reflectometry, GPS Solutions, 24, 1–13, https://doi.org/10.1007/s10291-020-00990-3, 2020.
Xiao, L., Che, T., and Dai, L.: Evaluation of Remote Sensing and Reanalysis Snow Depth Datasets over the Northern Hemisphere during 1980–2016, Remote Sensing, 12, 3253, https://doi.org/10.3390/rs12193253, 2020.
Ye, S., Chen, D., Liu, Y., Jiang, P., Tang, W., and Xia, P.: Carrier phase multipath mitigation for BeiDou navigation satellite system, GPS Solutions, 19, 545–557, https://doi.org/10.1007/s10291-014-0409-1, 2015.
Yu, K., Ban, W., Zhang, X., and Yu, X.: Snow Depth Estimation Based on Multipath Phase Combination of GPS Triple-Frequency Signals, IEEE T. Geoscience Remote, 53, 5100–5109, https://doi.org/10.1109/TGRS.2015.2417214, 2015.
Yu, K., Li, Y., and Chang, X.: Snow Depth Estimation Based on Combination of Pseudorange and Carrier Phase of GNSS Dual-Frequency Signals, IEEE T. Geosci. Remote, 57, 1817–1828, https://doi.org/10.1109/TGRS.2018.2869284, 2018.
Zhang, H., Zhang, F., Che, T., Yan, W., and Ye, M.: Investigating the ability of multiple reanalysis datasets to simulate snow depth variability over mainland China from 1981 to 2018, J. Climate, 34, 9957–9972, https://doi.org/10.1175/JCLI-D-20-0804.1, 2021.
Zhang, S., Wang, X., and Zhang, Q.: Avoiding errors attributable to topography in GPS-IR snow depth retrievals, Adv. Space Res., 59, 1663–1669, https://doi.org/10.1016/j.asr.2016.12.031, 2017.
Zhang, Z., Guo, F., and Zhang, X.: Triple-frequency multi-GNSS reflectometry snow depth retrieval by using clustering and normalization algorithm to compensate terrain variation, GPS Solutions, 24, 52, https://doi.org/10.1007/s10291-020-0966-4, 2020.
Zhou, W., Liu, L., Huang, L., Yao, Y., Chen, J., and Li, S.: A New GPS SNR-based Combination Approach for Land Surface Snow Depth Monitoring, Sci. Rep., 9, 3814, https://doi.org/10.1038/s41598-019-40456-2, 2019.
- Abstract
- Introduction
- Study area and data
- Methods
- Validation of the data quality
- Data set descriptions
- Extended analysis of the data set and method
- Data availability
- Conclusions
- Author contributions
- Competing interests
- Disclaimer
- Special issue statement
- Acknowledgements
- Financial support
- Review statement
- References