the Creative Commons Attribution 4.0 License.
the Creative Commons Attribution 4.0 License.
 | 03 Aug 2022
Microwave radiometry experiment for snow in Altay, China: time series of in situ data for electromagnetic and physical features of snowpack
Liyun Dai
Yang Zhang
Zhiguo Ren
Junlei Tan
Meerzhan Akynbekkyzy
Lin Xiao
Shengnan Zhou
Yuna Yan
Hongyi Li
Lifu Wang
In this paper, we present a comprehensive experiment, namely, an Integrated Microwave Radiometry Campaign for snow (IMCS), in Xinjiang, China, during the snow season of 2015–2016. The campaign hosted a dual-polarized microwave radiometer operating at L, K, and Ka bands to provide minutely passive microwave observations of snow cover at a fixed site, along with daily manual snow pit observations of snow physical parameters, automatic observations of 10 min four-component radiation and layered snow temperatures, and meteorological observations of hourly weather data and soil data. To the best of our knowledge, our dataset is unique in providing continuous daily snow pit data and coincident microwave brightness temperatures, radiation and meteorological data, at a fixed site over a full season, which can be straightforwardly used for evaluation and development of microwave radiative transfer models and snow process models, along with land surface process and hydrology models. The consolidated data are available at (https://doi.org/10.11888/Snow.tpdc.270886) (Dai, 2020).
- Article
(22466 KB) - Full-text XML
- BibTeX
- EndNote


Field experiments/campaigns, as the main and most important approach for snow studies, have been conducted to obtain the electromagnetic and physical characteristics of snow cover. The main experiments/campaigns are summarized in Table 1. The Cold Land Processes Field Experiment (CLPX) (https://nsidc.org/data/clpx/index.html, last access: 21 December 2021), one of the most well-known experiments, was carried out from winter of 2002 to spring of 2003 in Colorado, USA (Cline et al., 2003). During the campaign, snow pits were collected to coincide with airborne and ground remote-sensing observations. In 2017, NASA's SnowEx campaign (https://nsidc.org/data/snowex, last access: 21 December 2021) was conducted in Colorado to test and develop algorithms for measurement of the snow water equivalent (SWE) in forested and non-forested areas by providing multi-sensor observations of seasonally snow-covered landscapes (Brucker et al., 2017). The campaign is still ongoing and will be conducted in other areas with different snow conditions. In northern Canada, mobile sled-mounted microwave radiometers were deployed in forest, open, and lake environments from November 2009 to April 2010, and snow characteristics within the footprints of radiometers were measured to improve the understanding of the influence of snow characteristics on brightness temperatures (Derksen et al., 2012; Roy et al., 2013). The aforementioned microwave experiments were conducted at different sites for different land cover, resulting in good representativity for evaluating snow microwave emission models (Tedesco and Kim, 2006; Royer et al., 2017), however, with a relatively short temporal range, while dense temporal resolution is important to reveal the evolution of snow characteristics.
In the Arctic region, the Nordic Snow Radar Experiment (NoSREx) campaign was conducted at a fixed field of the Arctic boreal forest area in Sodankylä, Finland, during 2009–2013 (Lemmetyinen et al., 2016). The experiment provided a continuous time series of active and passive microwave observations of snow cover spanning an entire winter season, with synchronous observations of snow pits weekly. In Asia, an experiment of radiation budget over snow cover (JERBS) was conducted in Japan. In the experiment, snow pit work at 3 or 4 d intervals was conducted simultaneously with radiation budget observations during winter of 1999–2000 and 2000–2001 to analyze the effects of snow physical parameters on albedo (Aoki et al., 2003). The NoSREx and JERBS experiments, for fixed field observation, provided more improved time series of data than CLPX and SnowEx. Weekly observations could reflect the general evolution process of snow characteristics, but might miss some key details that occur at sub-weekly scales. In the Tibetan Plateau with shallow snow cover, multiple years of microwave radiometry observations at L band were conducted to study passive microwave remote sensing of frozen soil (Zheng et al., 2019, 2021; Zhang et al., 2021). However, in the long-term experiment, no snow pit was measured and the microwave radiometry observation was only performed at L band, which is insensitive to snowpack.
Table 1Summary of existing experiments for microwave and optical radiation and physical features of snowpack.
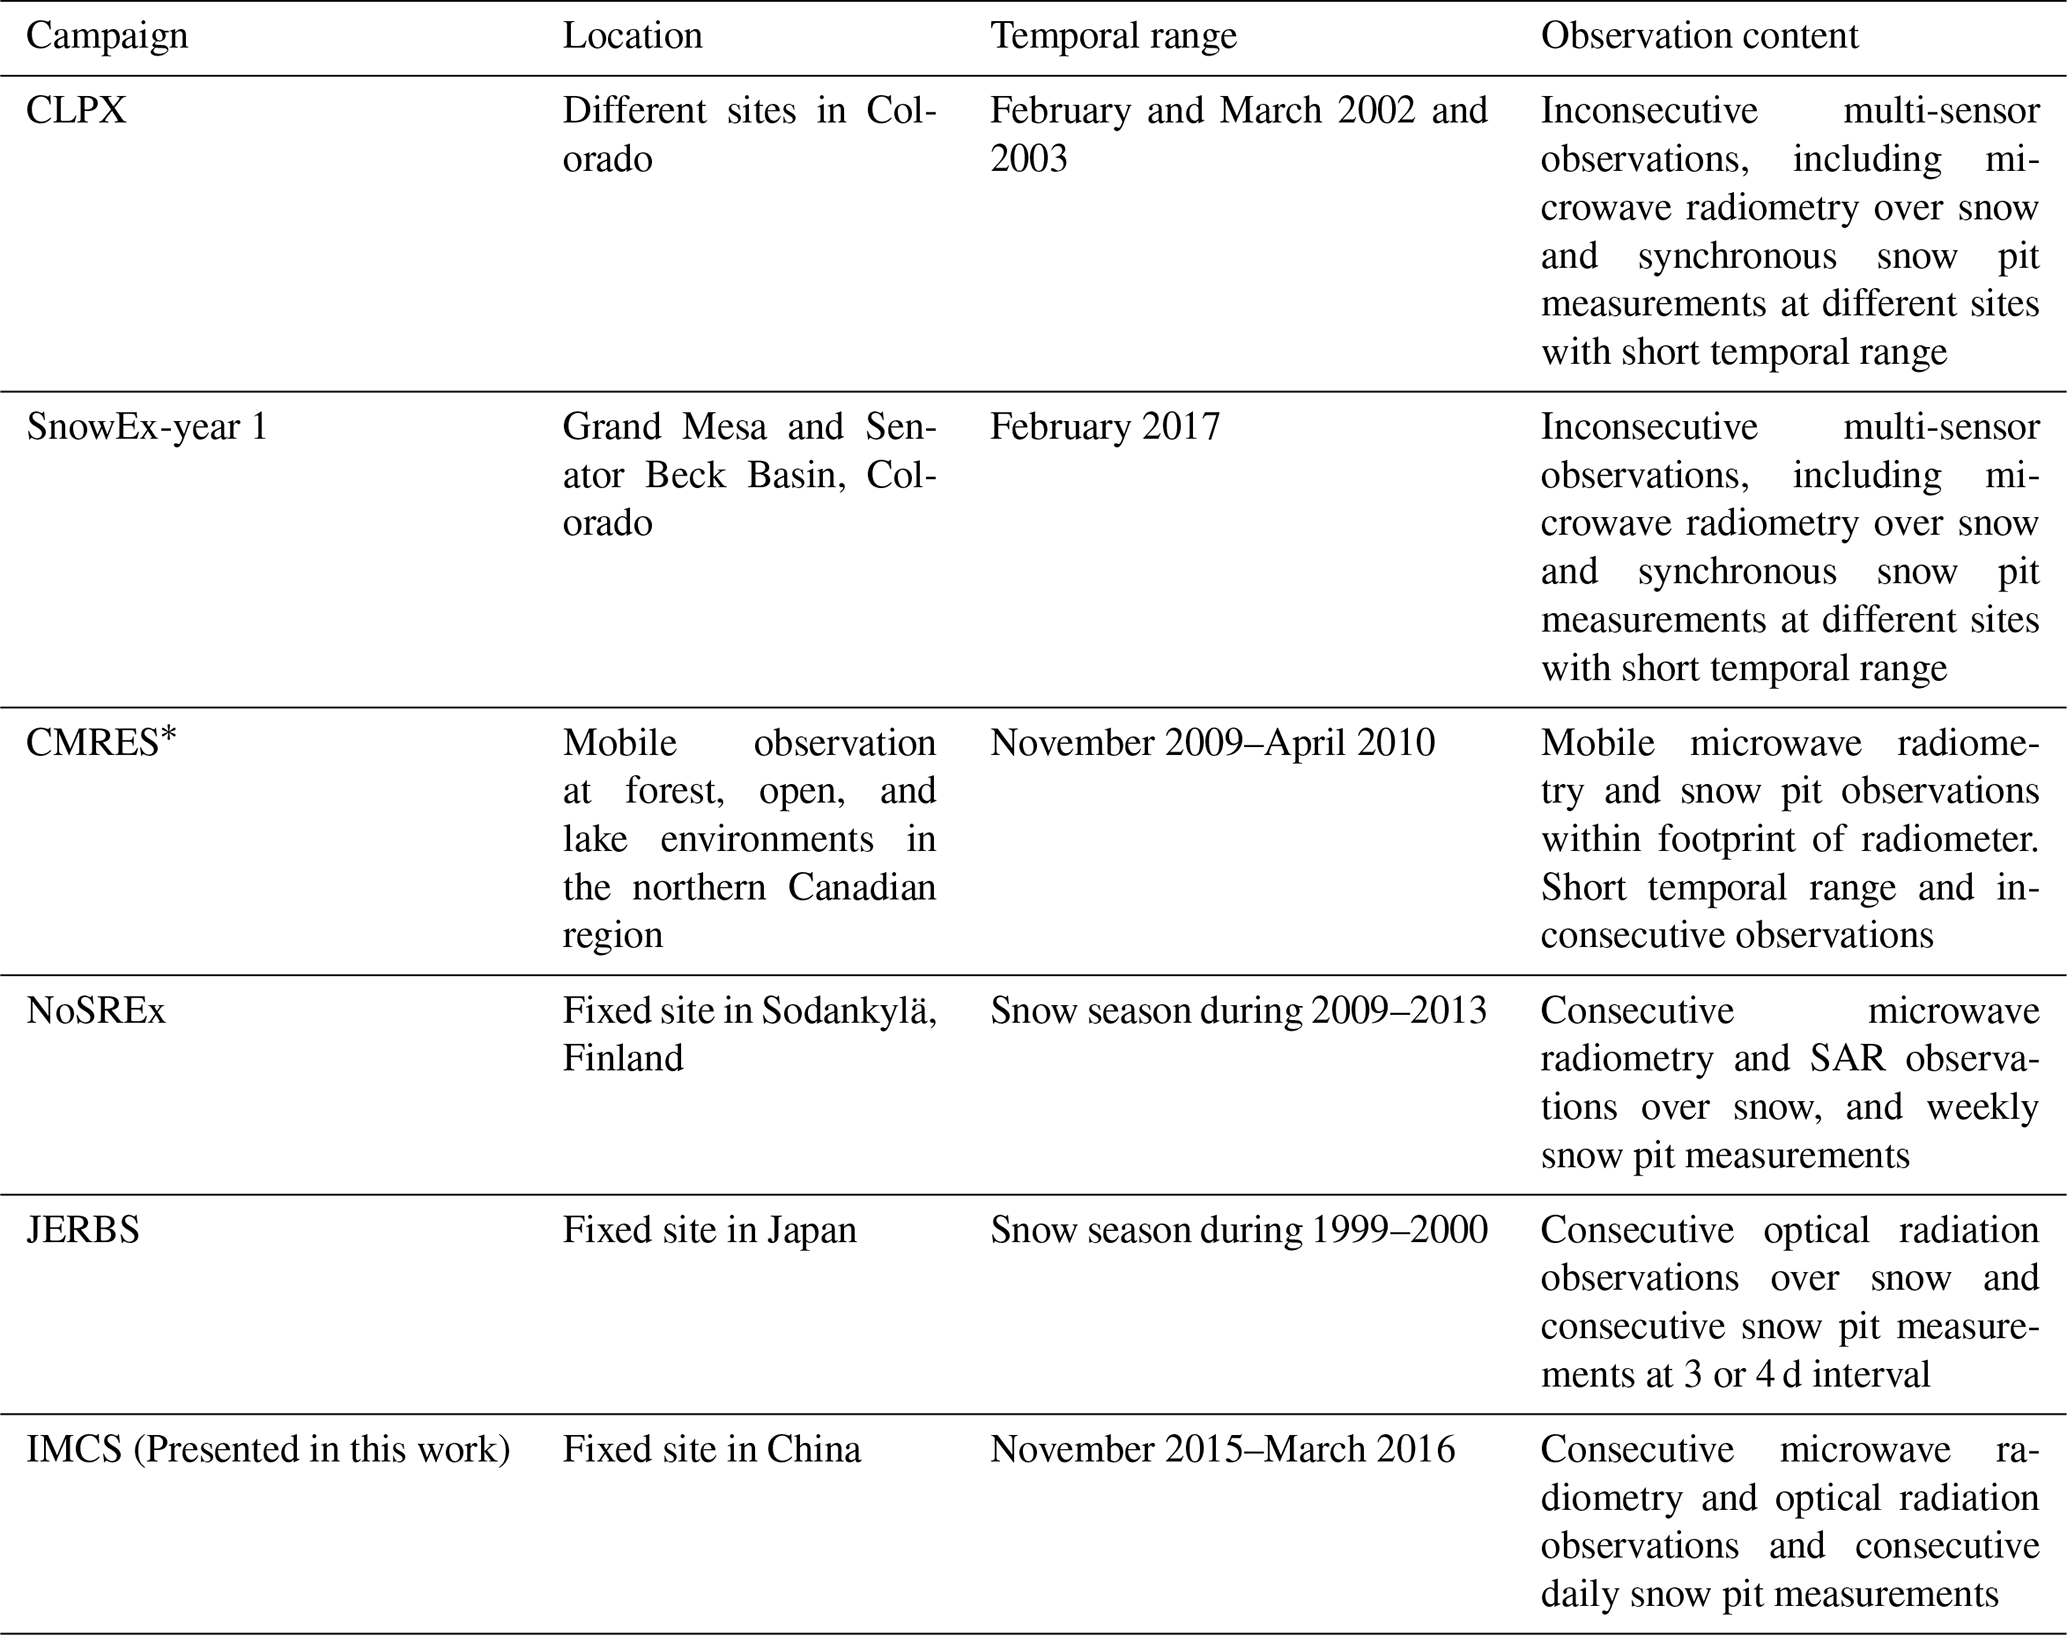
Note: ∗ CMRES: microwave radiometry experiment on snow cover conducted in northern Canada
To understand the evolution of snow characteristics and their influence on passive microwave brightness temperatures and radiation budget, an integrated field experiment on snowpack was conducted in Altay, China, during a full snow season. The experiment was designed to cover periods from snow-free conditions to eventual snow melt-off during 2015–2016. The microwave radiometry measurements at L, K, and Ka bands for multiple angles were complemented by a dual-polarized microwave radiometer with four-component radiation and daily in situ observations of snow, soil, and atmospheric properties, using both manual and automated methods. To the best of our knowledge, our dataset is unique in providing continuous daily snow pit observations over a full snow season at a fixed site, along with synchronous microwave brightness temperatures, radiation and meteorological data. The dataset is consolidated and organized, which can be easily used for other researchers with interests.
In the next section, the experiment location, parameters, and parameter measurement protocols are described. Section 3 introduces the consolidated data that were released at the National Tibetan Plateau Data Center, China, which provides data support for international science programs (Li et al., 2020; Pan et al., 2021). Section 4 presents content of brightness temperature, four-component radiation, snow pit data, soil temperature and moisture, and meteorological data. Section 5 discusses the possible applications and uncertainties. Finally, the conclusions are summarized in Sect. 6.
2.1 Measurement location
The Integrated Microwave Radiometry Campaign for snow (IMCS) was performed during the 2015–2016 snow season (from 27 November 2015 to 25 March 2016) at the Altay National Reference Meteorological station (ANRMS) (47∘44′26.58′′ N, 88∘4′21.55′′ E), which is approximately 6 km from the foot of the Altay Mountains in Northwest China (Fig. 1). The Altay Mountains, with elevation up to 3000 m, running northwest and southeast, is at the junction of China, Russia, Mongolia, and Kazakhstan, providing snow water resources for these four countries. The average annual maximum snow depth measured in this station is approximately 40 cm, with a maximum over 70 cm. In the southwest of the Altay Mountains, cropland and desert with flat terrain are the dominant land covers. Snow cover is critical fresh water for the irrigation in this area. In this experiment, measurements included microwave radiometry, four-component radiation, snow pit and soil parameters. The test sites of this experiment were four neighboring bare rectangle fields in the ANRMS with areas of 2000 m2 (Field1 (F1) in Fig. 1), 3000 m2 (Field2 (F2) in Fig. 1), 400 m2 (Field3 (F3) in Fig. 1), and 300 m2 (Field4 (F4) in Fig. 1), respectively.
In F2, the ground-based microwave radiometer was set up in the middle of the field, facing south to collect brightness temperatures over snow cover. For manual snow pit data collection, F1 behind the microwave radiometers (north of the radiometers) was used. The microwave radiometer observations and snow pit data collections were conducted by the Northwest Institute of Eco-Environment and Resources (NIEER), Chinese Academy of Science (CAS), from 27 November 2015 to 25 March 2016 (snow free after 25 March 2016).
Field3 was for meteorological measurements including wind speed, wind direction, air temperature, air wetness, air pressure, precipitation, soil temperature, and soil moisture, among others. These parameters were automatically obtained from instruments, and the instrument setup and data collection were operated by ANRMS. In this experiment, we requested the wind, air temperature, air wetness, air pressure, soil temperature and moisture data from ANRMS. Field4 was designed for automatic measurement of layered snow temperatures, snow density, SWE, snow depth, and albedo, with instruments operated by NIEER since 2013. However, during the experiment, the instruments for snow density and SWE were not functional, and we only collected layered snow temperatures and four-component radiation.
Because the four observation fields, located within the domain of the station, are within distances less than 100 m, it is reasonable to assume that the snow characteristics and soil and weather conditions are consistent among these four fields.
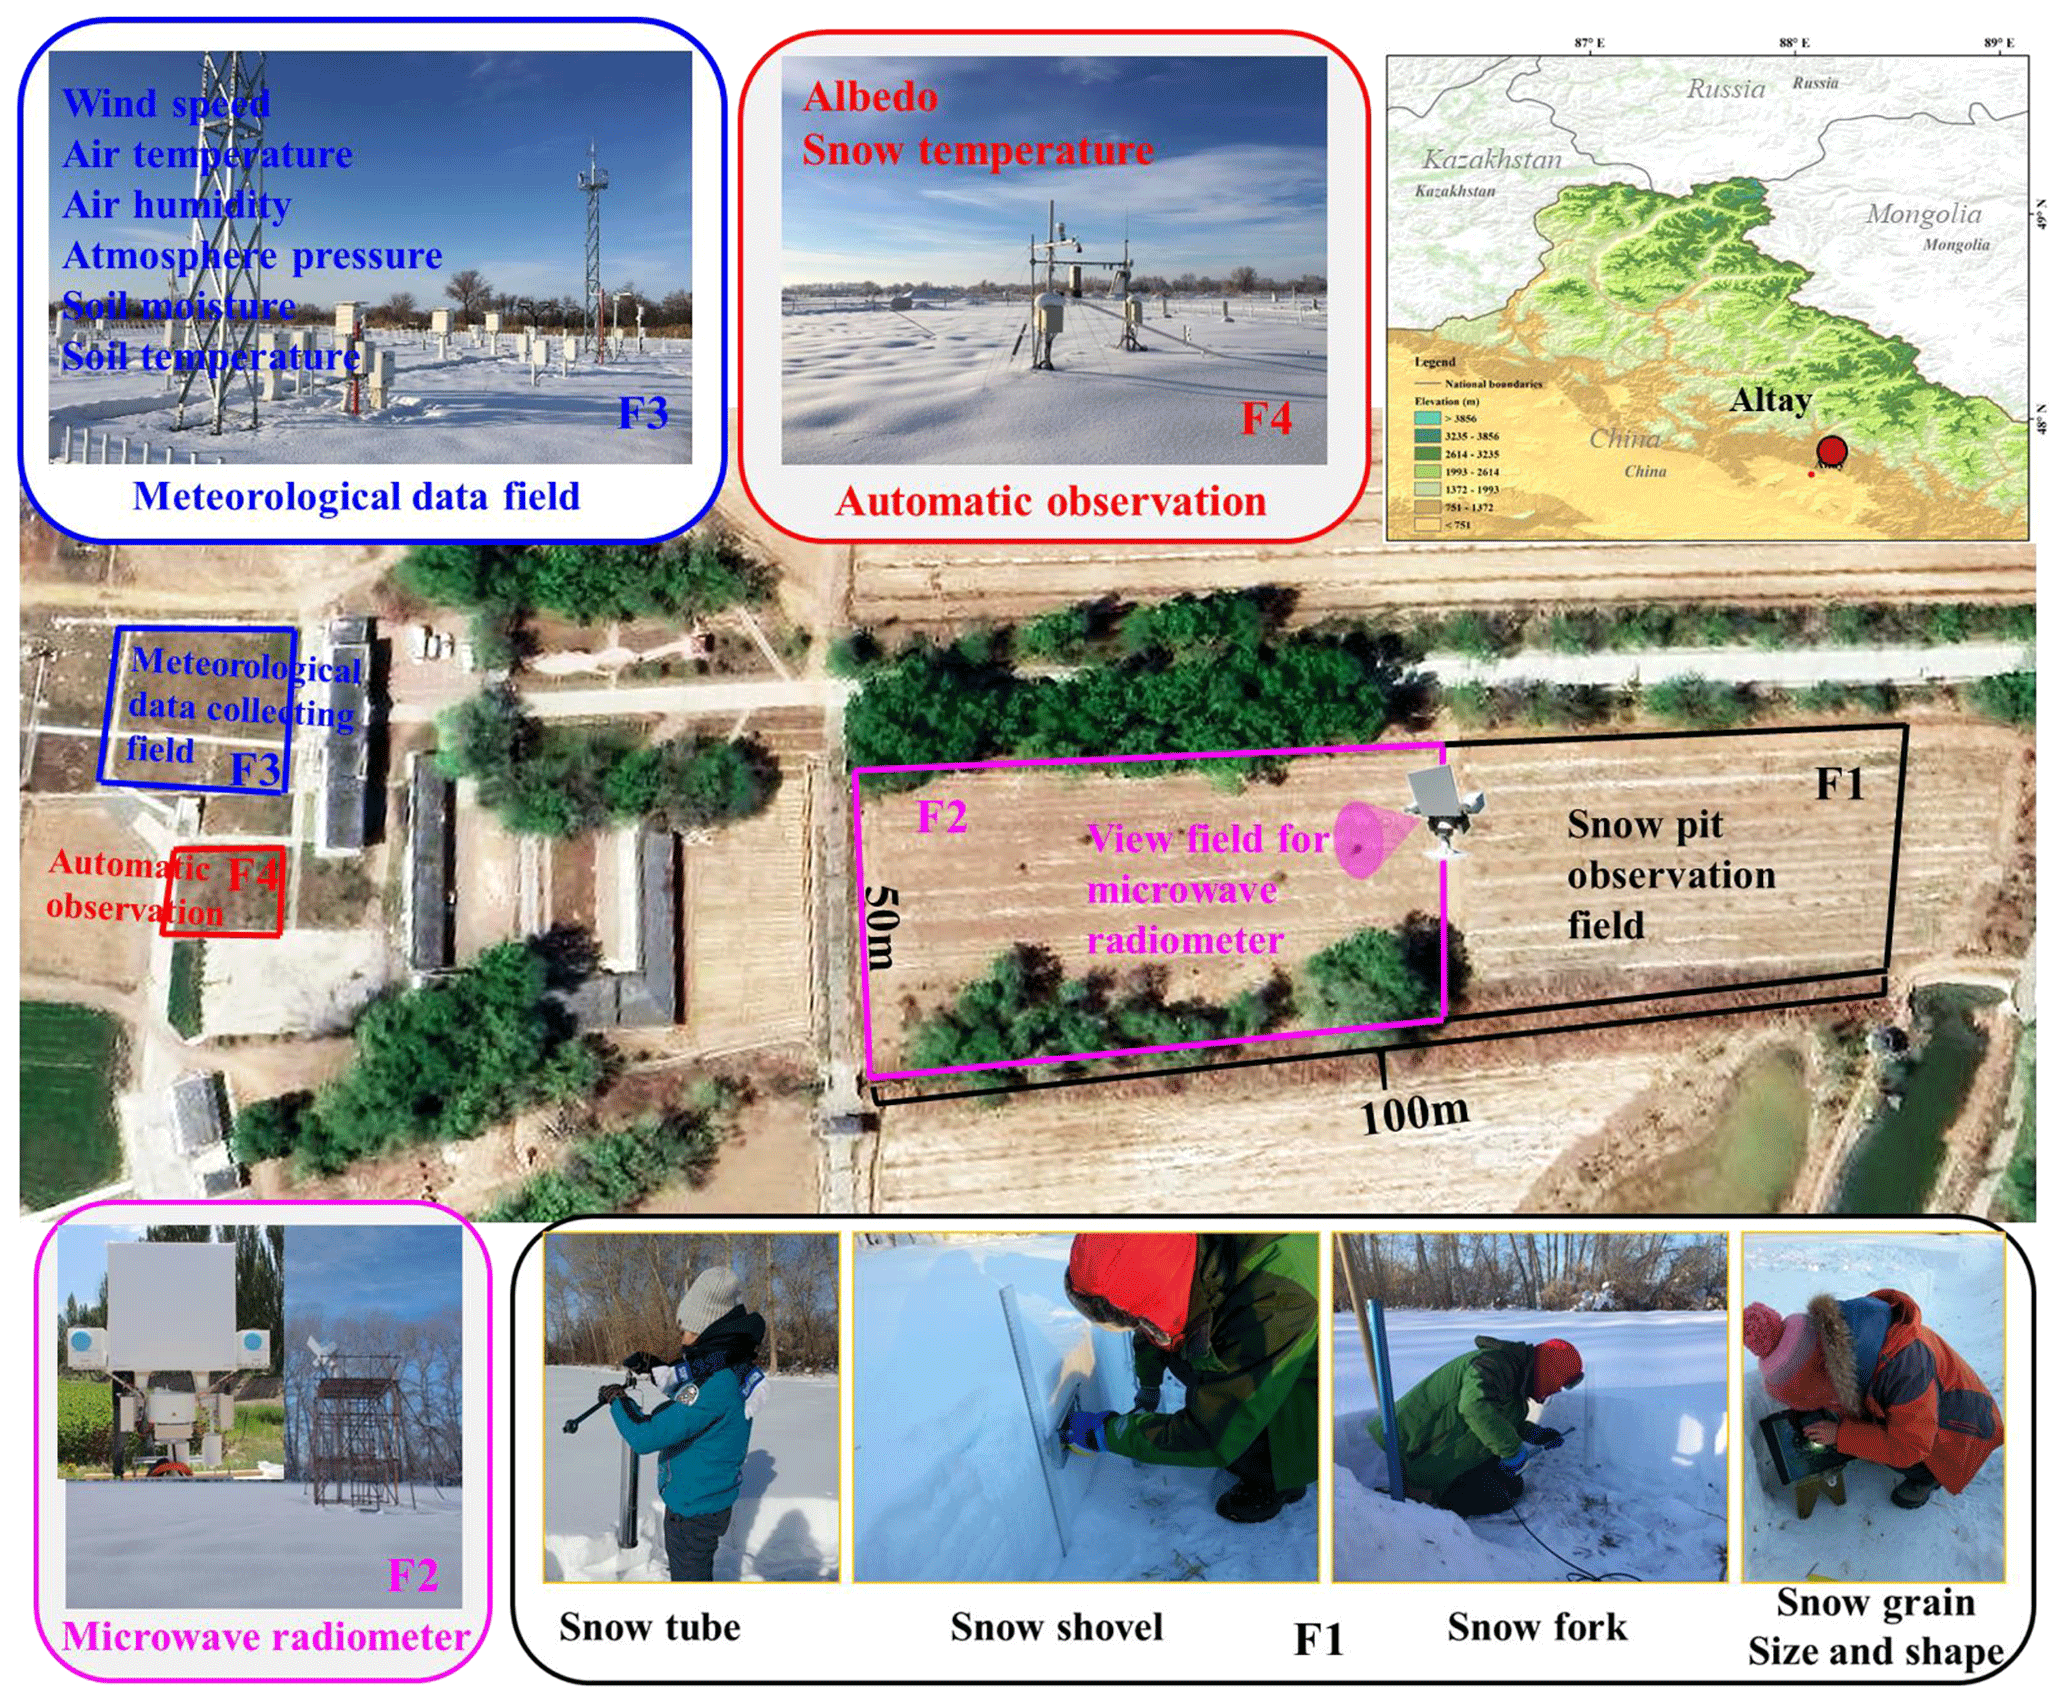
Figure 1Location of the Altay National Reference Meteorological station (ANRMS) in Asia, along with the four test sites in ANRMS. F1 (approximately 40 m × 50 m) was for snow layering, layer thickness, snow density, snow grain size and shape of each layer. F2 (approximately 60 m × 50 m) was for microwave radiometer observations. F3 was for meteorological and soil data collection operated by ANRMS. F4 was for the automatic observations of the snow temperature, and four-component radiation, designed by the Northwest Institute of Eco-Environment and Resources (NIEER) under the Chinese Academy of Science (CAS).
2.2 Measurement methods
The microwave signatures from snowpack vary with snow characteristics, soil, and weather conditions. In this experiment, the measurements include microwave radiometry observations to collect brightness temperatures, manual snow pit observations to collect snow physical parameters, automatic observations to collect four-component radiation and snow temperatures, and meteorological observations containing weather data and soil data.
2.2.1 Microwave radiometry
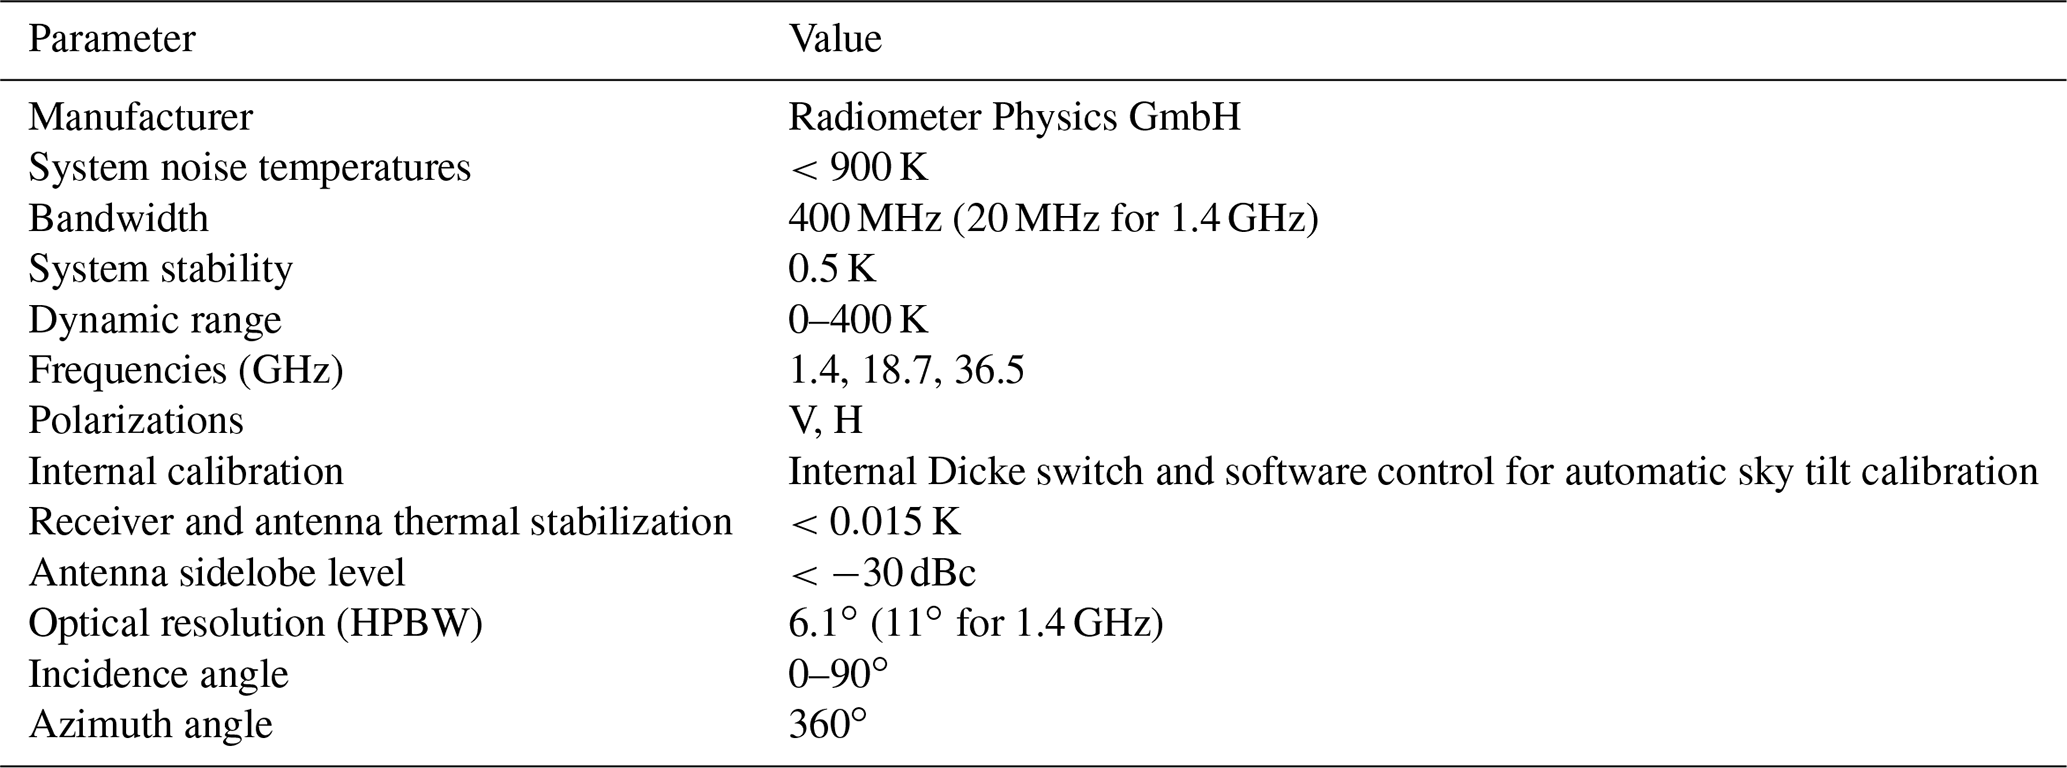
The brightness temperatures at 1.4, 18.6, and 36.5 GHz for both polarizations (Tb1h, Tb1v, Tb18h, Tb18v, Tb36h, Tb36v) were automatically collected using a six-channel dual-polarized microwave radiometer RPG-6CH-DP (Radiometer Physics GmbH, Germany, https://www.radiometerphysics.de/products/microwave-remote-sensing-instruments/radiometers/, last access: 31 May 2020). The technical specifications of RPG-6CH-DP are described in Table 2. The RPG-6CH-DP contains a built-in temperature sensor used for measuring air temperature. The frequency of automated data collection was set to 1 min.
Table 2Technical specifications of the RPG-6CH-DP microwave radiometer.
Before the snow season, a platform with height of 5 m, length of 4 m, and width of 2 m was constructed in the experiment field (Fig. 2). A 4 m orbit was fixed on the platform. The RPG-6CH-DP was set up on the orbit and could be moved along the orbit. The microwave radiometers at the K and Ka bands began working from 27 November 2015, while the L-band radiometer began working from 30 January 2016. These radiometers were calibrated using the sky tipping calibrated technique with an accuracy of 1 K. In clear-sky conditions, the sky brightness temperatures were approximately 29.7±0.3 K at 18.7 GHz and 29.3±0.9 K at 36.5 GHz for both polarizations, while the sky brightness temperatures at L band showed large fluctuation. They ranged from −1 to 8 K for horizontal polarization, and 1 to 16 K for vertical polarization.
Generally, the radiometers were fixed in the middle of the orbit to observe snow cover with an incidence angle of 50∘. Multi-angle observations were conducted after every big snowfall, or every 5 d in the stable period. During the melt period, observation frequency increased. There are a total 17 multi-angle observations: 3, 19, and 30 December; 3, 8, 13, 18, 3, and 28 January; 3 February; and 3, 10, 15, 22, 26, 28, and 31 March, when the radiometer was set to scan the ground at different incidence angles to the left, middle, and right of the orbit, respectively. Although the view fields of the antennas for 1.4, 18.7, and 36.5 GHz did not overlap completely, the measured results showed that the brightness temperatures observed to the left, middle, and right of the orbit varied within 1 K. Therefore, the snow and soil conditions were considered homogeneous within the view fields of the three antennas.
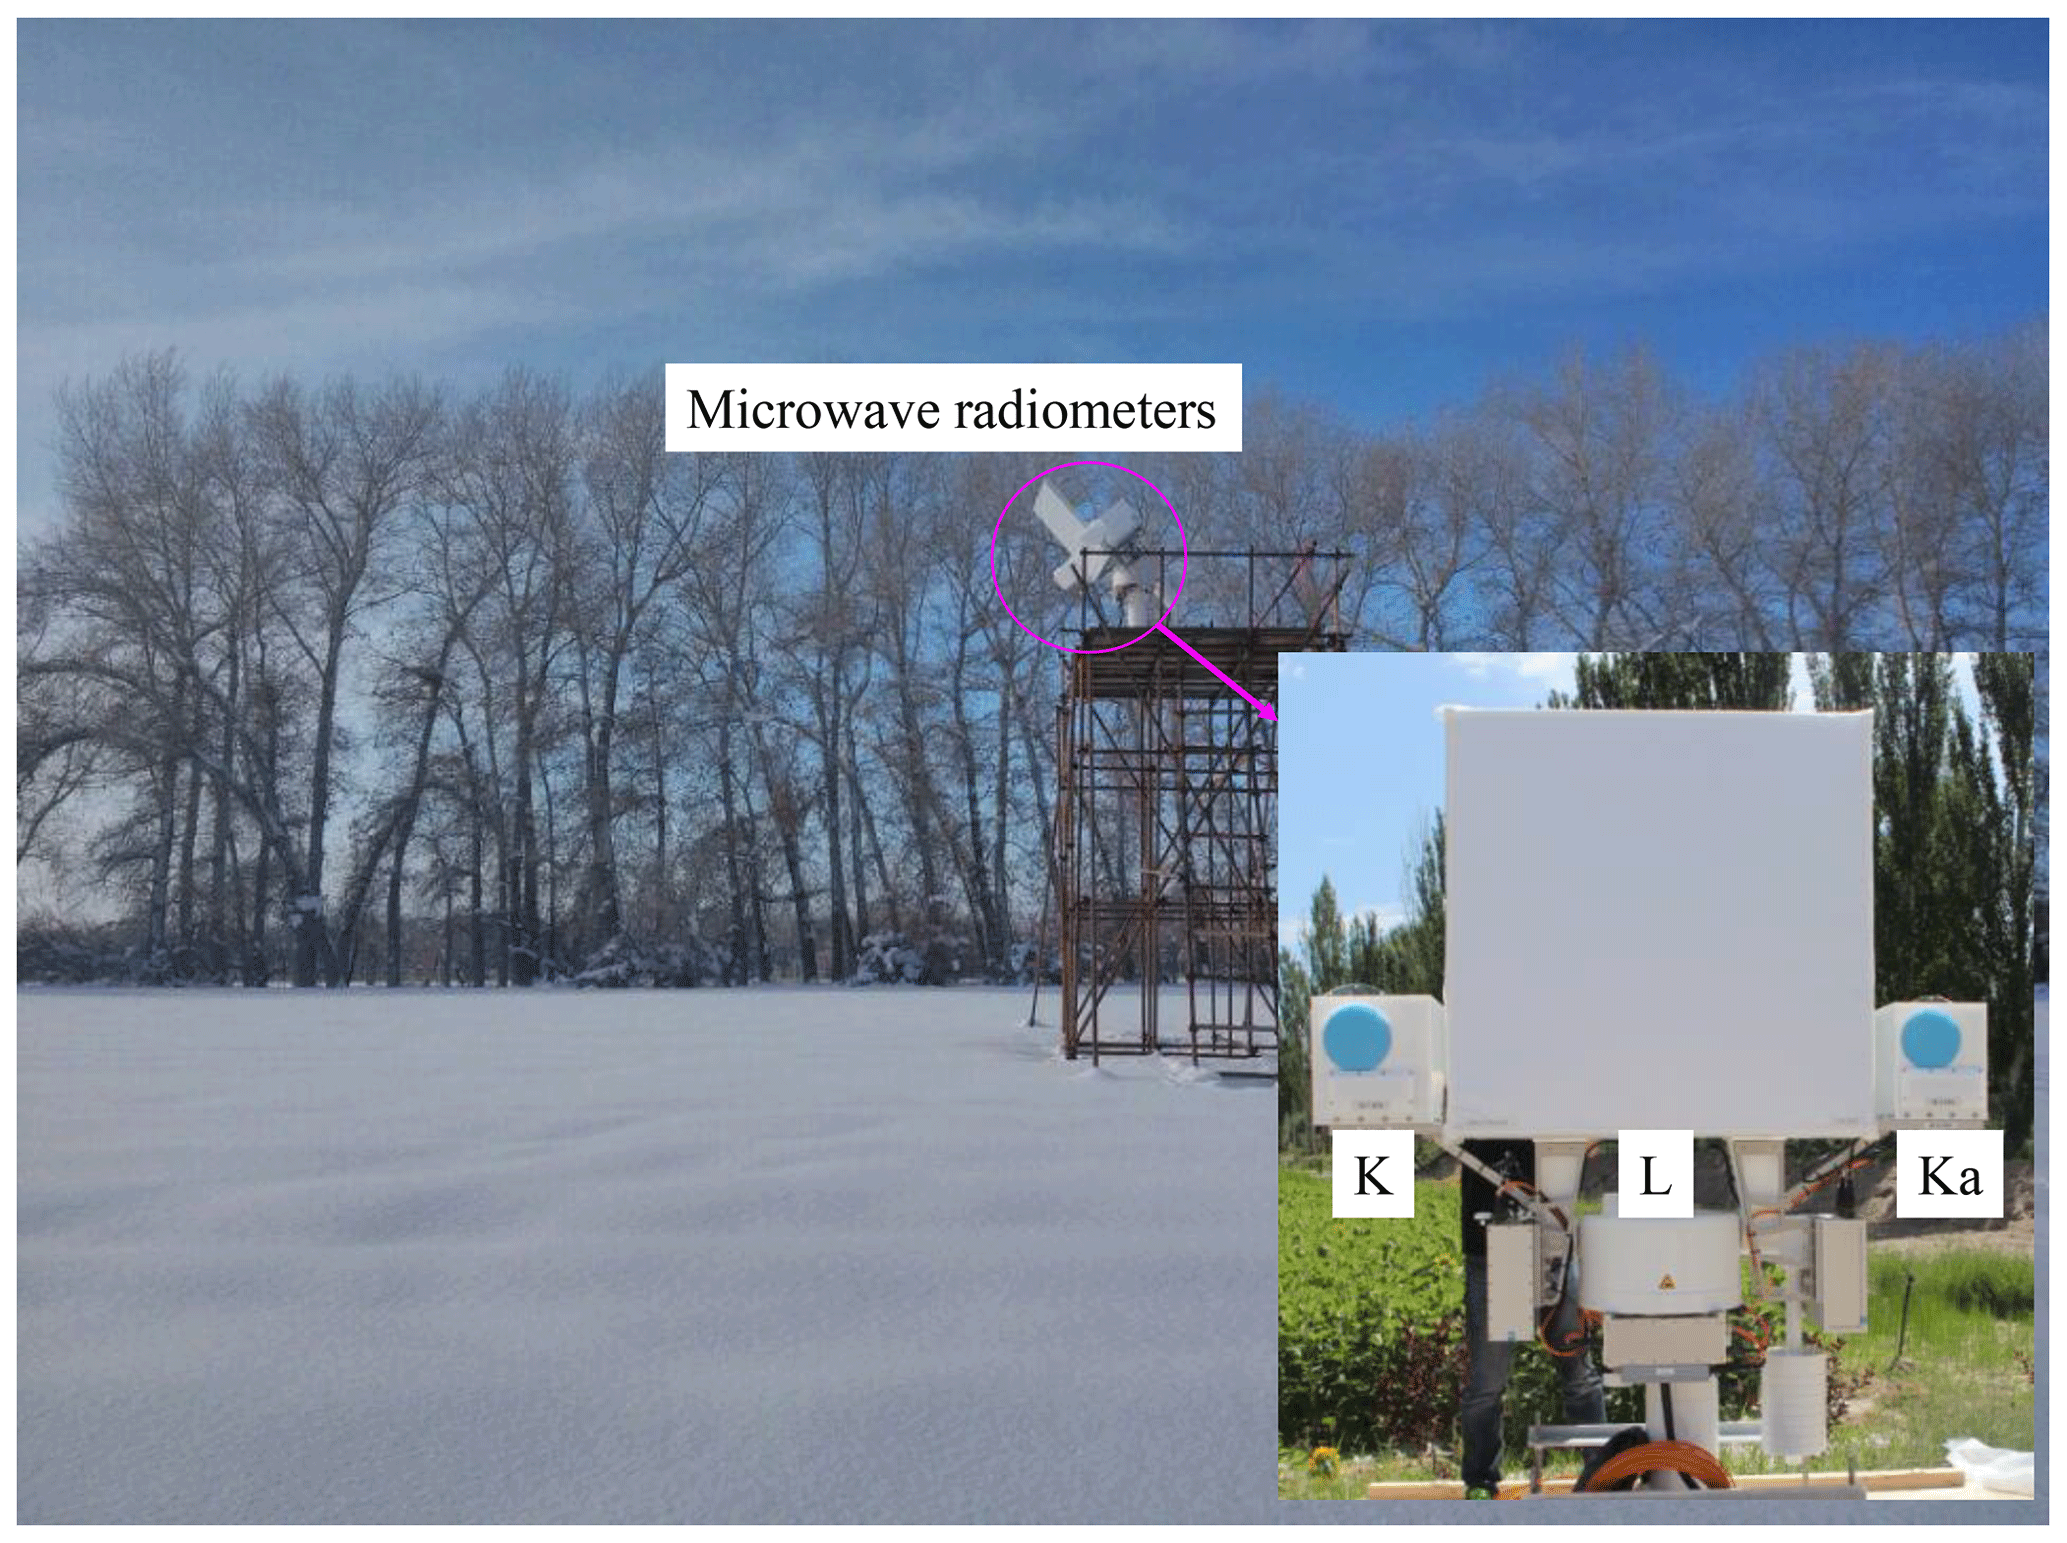
Figure 2Ground-based microwave radiometer observation system.
2.2.2 Snow pit measurements
The snow characteristics, including snow layering, snow-layer thickness, grain size, snow density, and snow temperature, were collected by manual snow pit measurements in Field 1. These data were collected daily at 08:00–10:00 LT, from 27 November 2015 to 25 March 2016, excluding 7 d (please see Table 3). Although the snow temperatures were manually measured at snow pits, the automatically collected snow temperatures in Field 4 were utilized in this study because the temperature measured at snow pits could not reflect the natural temperature profile when the snow pits were exposed to air.
Table 3Variables collected by manual daily snow pit measurement in Field 1 in Fig. 1, along with their observation instruments and observation time or frequencies.
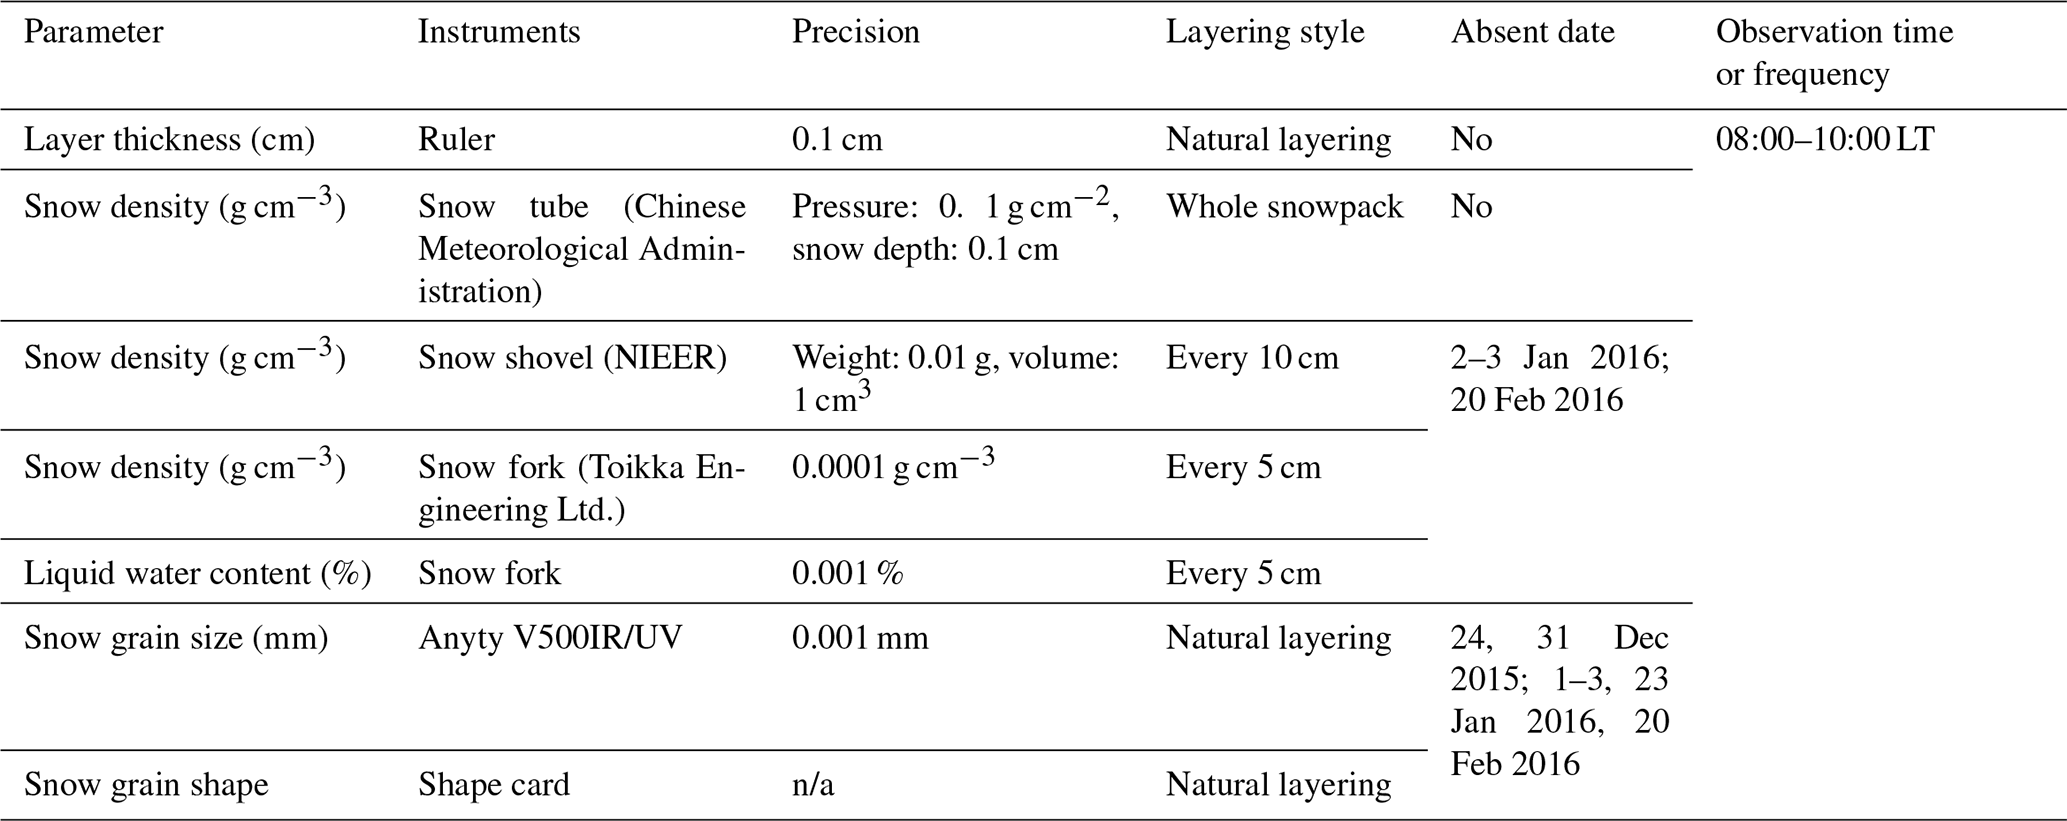
n/a: not applicable
The first step of snow pit measurement is making a snow pit. In Field 1, a new snow pit was dug daily using a spade. The snow pit was approximately 2 m × 1 m to ensure that all parameters could be measured from unbroken snowpack. The snow pit section was made as flat as possible using a flat shovel or ruler. When the snow profile is exposed to air for a long time, the snow characteristics will be influenced by environment and will be different from the natural snow characteristics. To ensure that every observation was conducted on natural snow pit, the snow pit was backfilled with the shoveled snow after finishing all observations, and the following day, the new snow pit was made at least 1 m distance away from the previous snow pit. After finishing a snow pit, the natural snowpack stratification was then visually determined, and the thickness of each layer was recorded against a ruler.
The next step was measuring grain size and shape type in each layer. The grain size and type within each natural layer were estimated visually using a microscope with an “Anyty V500IR/UV” camera (Fig. 3a). The software “VIEWTER Plus”, matched with the microscope, was used to measure grain size. The grain type was determined based on Fierz et al. (2009). In this experiment, we utilized the lengths of the longest and shortest axes to describe grain size (Fig. 3b). When using the software to measure the grain size, a reference is needed. In this experiment, a ruler marked 0.5 mm was used as a reference (Fig. 3c). We adjusted the focus of the camera to make sure the grains were at the clearest status in camera to take photos, and the photo of the ruler scale was taken at the same focus. If the thickness of one layer was less than 10 cm, measurements were performed at the top and bottom of the layer, respectively. If the thickness was greater than 10 cm, measurements were performed at the top, middle, and bottom of the layer, respectively. For each layer, at least five photos were taken, and the lengths of the longest and shortest axes of at least 10 typical grains were recorded. The final grain size was the average of the 10 recorded values. Figure A1 presents an example of the original photos of grains in each layer, and Table A1 shows the matched record of the lengths of the longest and shortest axes.
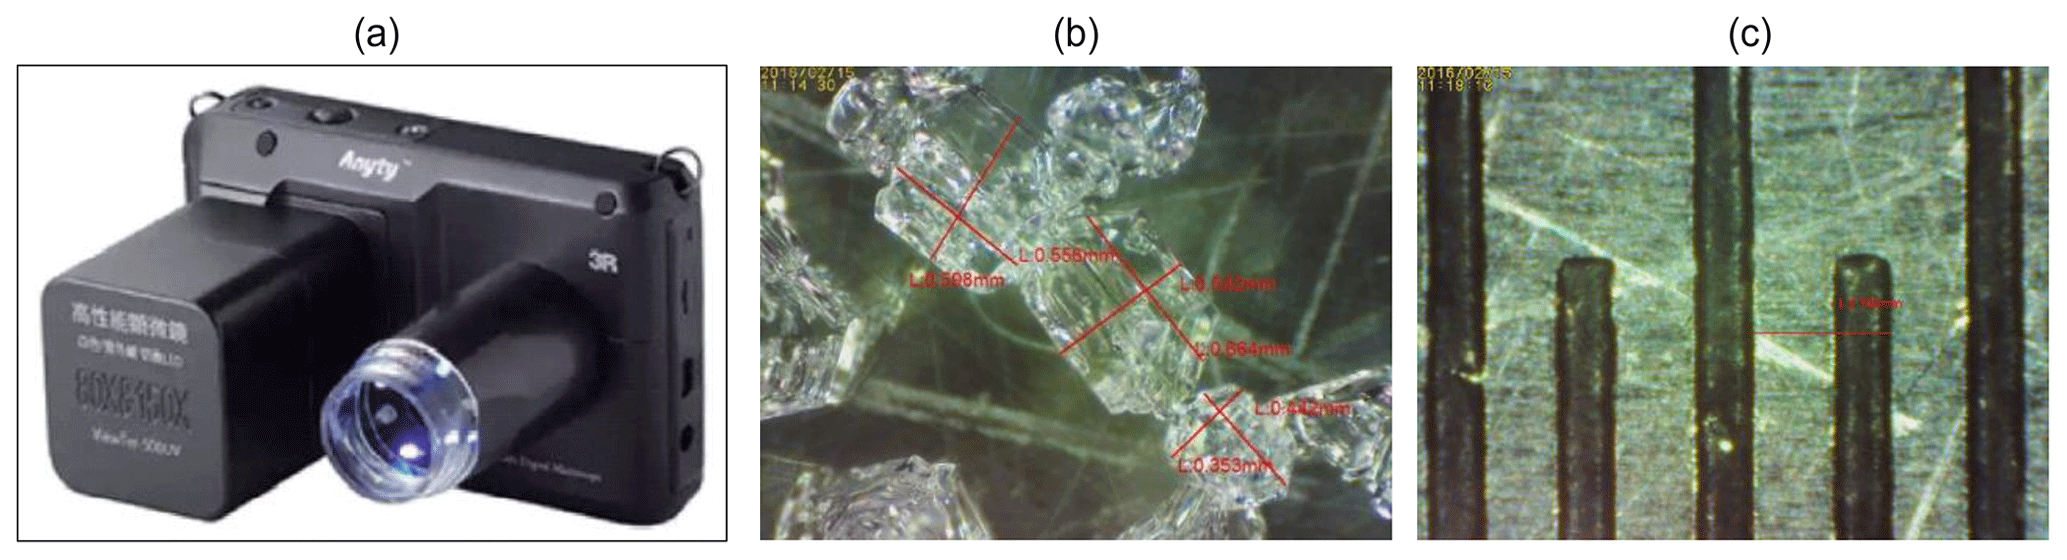
Figure 3(a) Picture of microscope “Anyty V500IR/UV”, (b) the measured lengths of the longest and shortest axes of particles, and (c) the reference ruler scale.
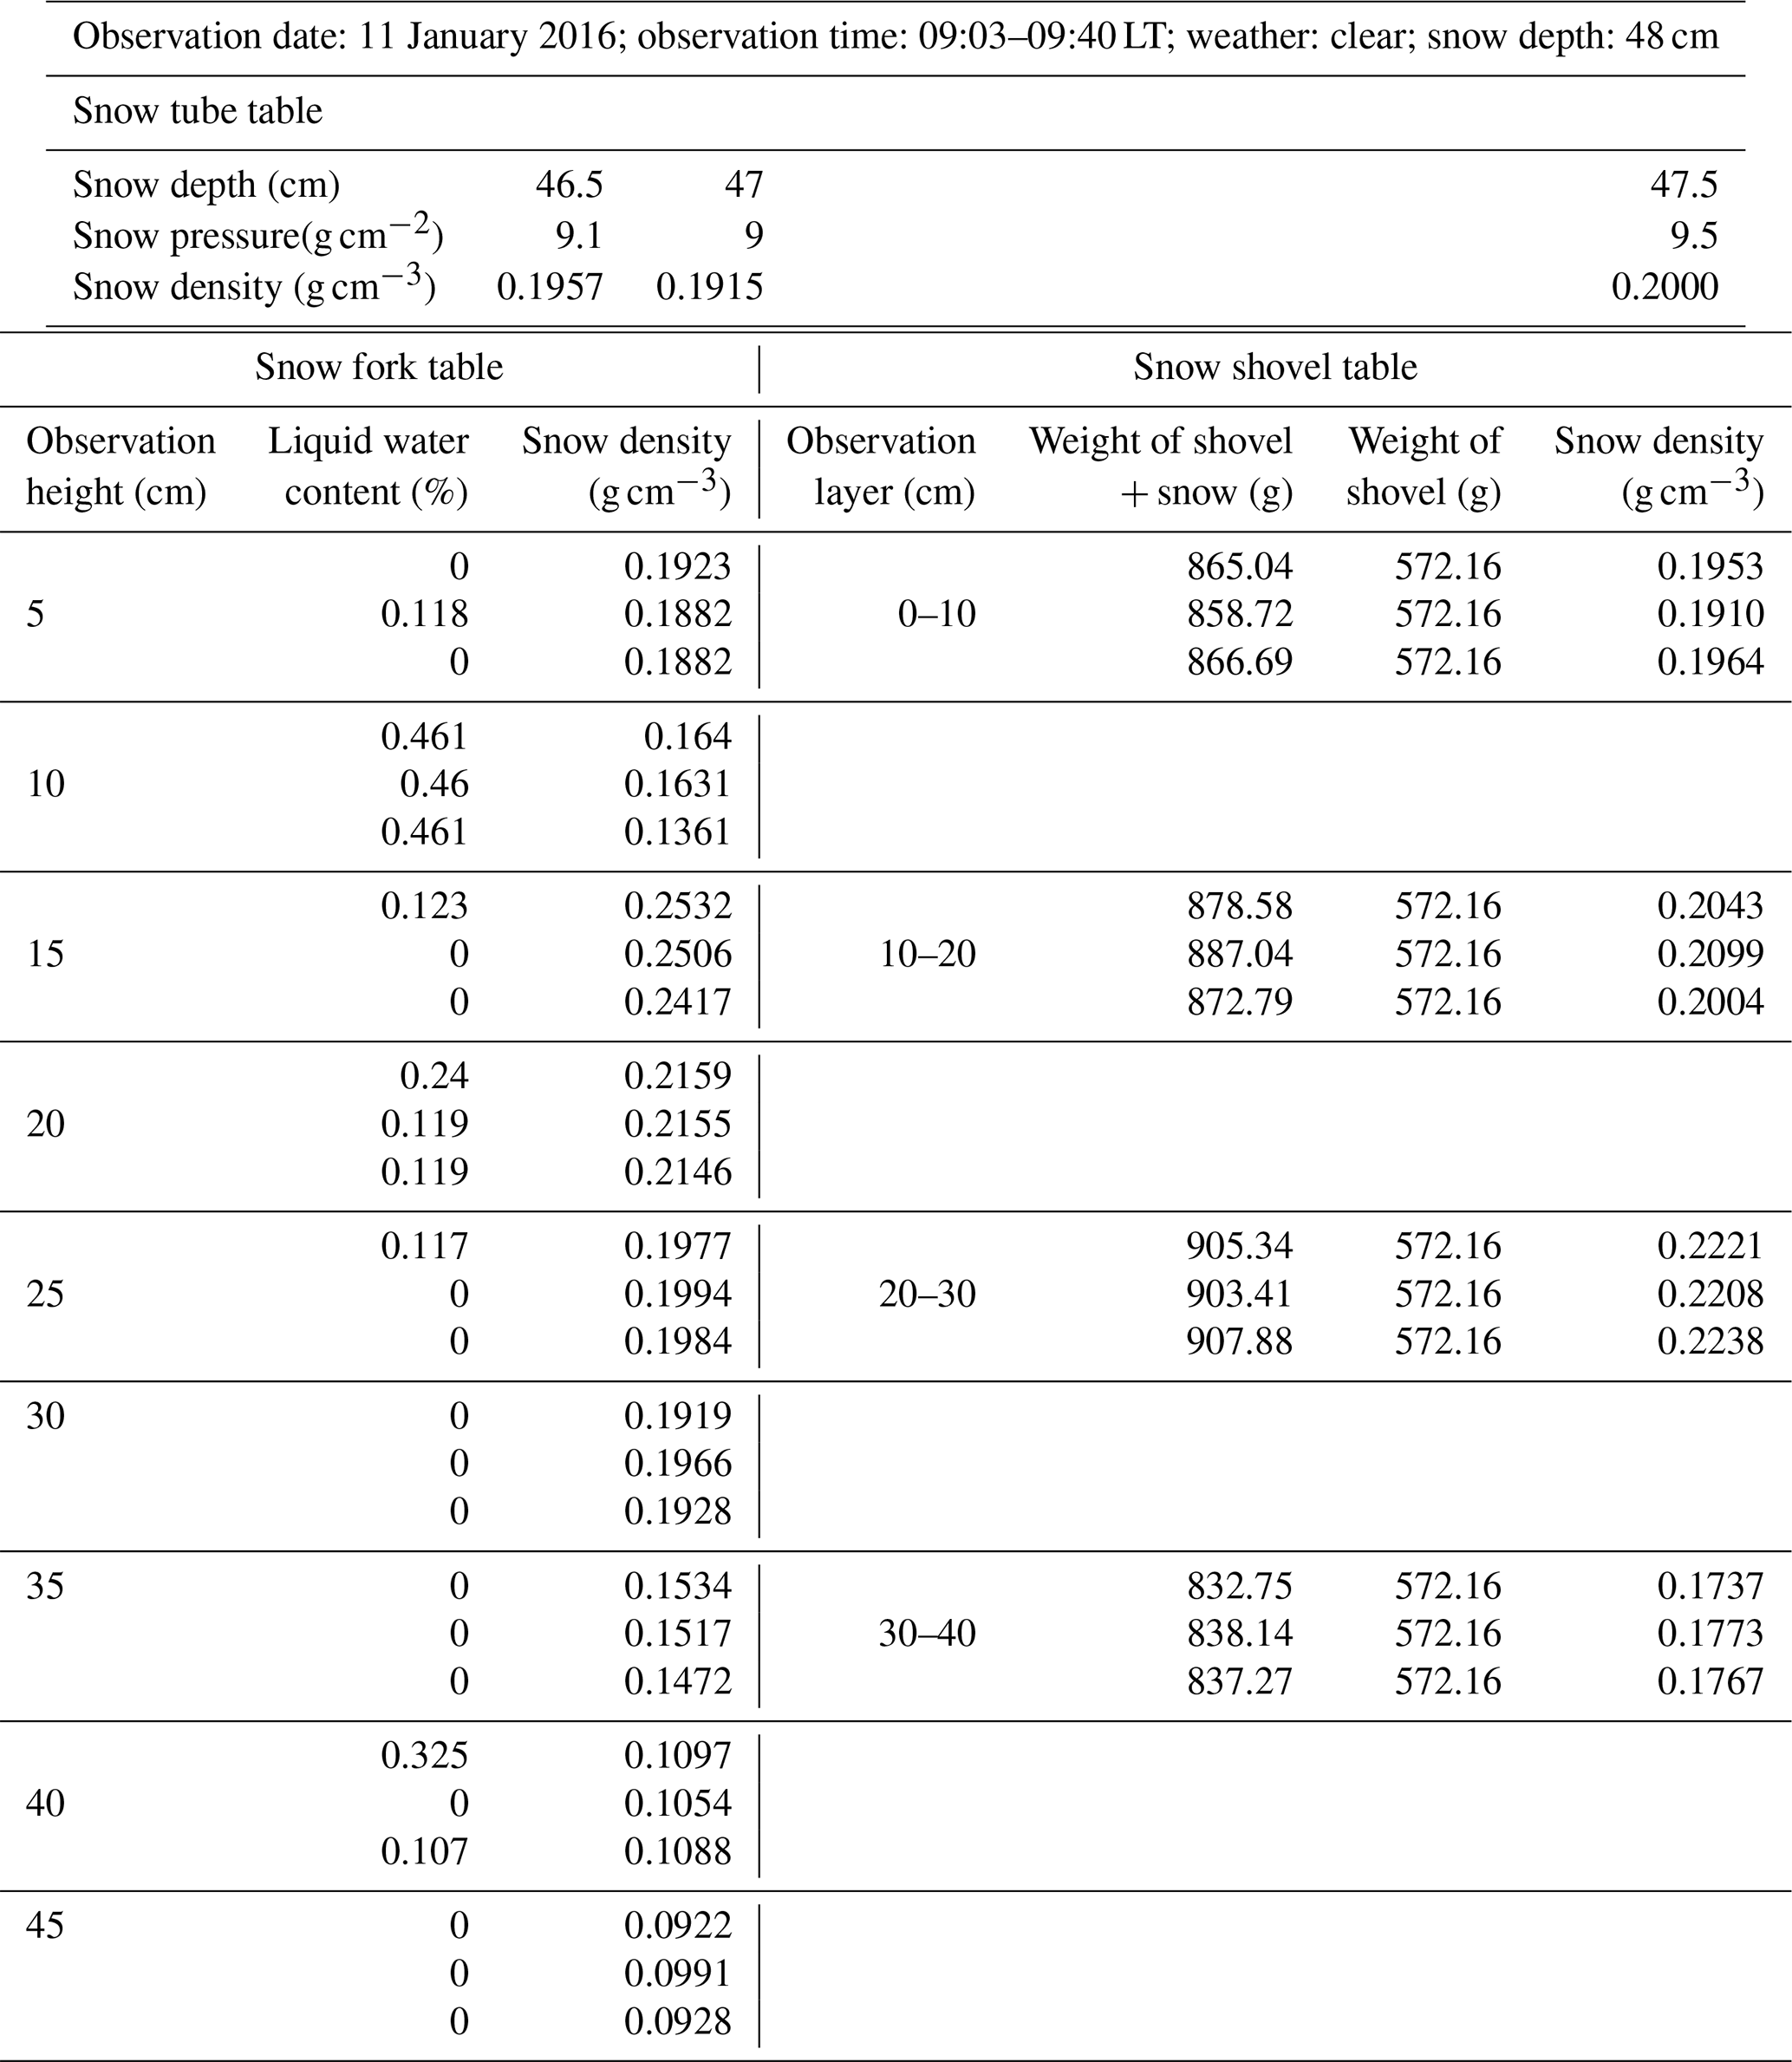
Snow density was measured using three instruments: snow tube, snow shovel, and snow fork (Fig. 4). The snow tube instrument, designed by the Chinese Meteorological Administration, contains a metal tube with a base area of 100 cm2, a length of 60 cm, and a balance (Fig. 4a). It was utilized to measure the snow density of a whole snowpack by weighing the snow sample. The snow shovel is a 1500 cm3 wedge-type sampler, and its length, width, and height are 20, 15, and 10 cm, respectively (Fig. 4b). It was utilized to measure snow density every 10 cm (0–10, 10–20, 20–30 cm, etc.). The snow fork (Fig. 4c) is a microwave resonator hat measures the complex dielectric constant of snow, and adopts a semi-empirical equation to estimate snow density and liquid water content based on the complex dielectric. It was utilized to measure snow density and liquid water content at 5 cm intervals starting 5 cm above the snow/soil interface (5, 10, 15, 20 cm …). In order to decrease the observation error, every measurement was repeated three times. If there was an abnormal value, a fourth measurement would be performed to ensure the accuracy. Table A2 is an example record table for snow density. The average value of the three-time observation was the final value.
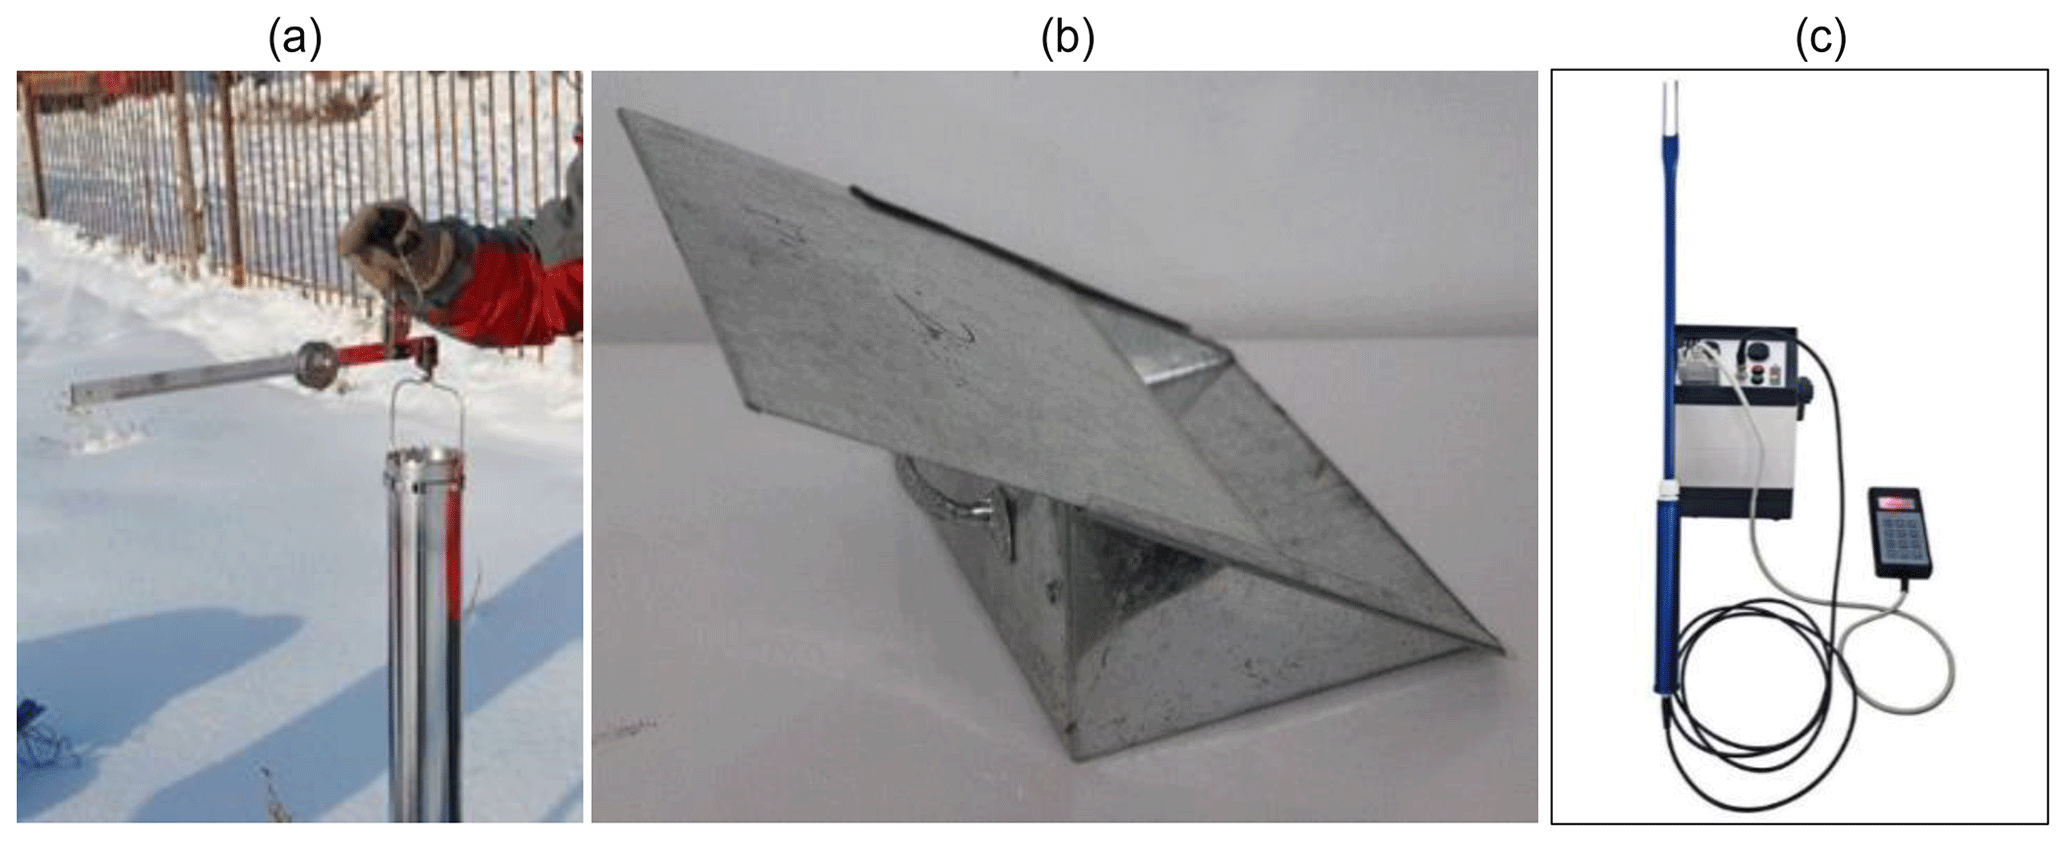
Figure 4Three instruments for snow density: (a) snow tube, (b) snow shovel, and (c) snow fork.
2.2.3 Automatic radiation and temperature measurements
In Field 4, the four-component radiation was automatically measured by a component net radiometer (NR01) manufactured by Hukseflux, and layered snow temperatures were measured by Campbell Scientific 109S temperature sensors, respectively. The temperature sensors were set up on a vertical pole inserted in soil (Fig. 5). The sensors' heights are 0, 5, 10, 15, 25, 35, 45, and 55 cm above the soil/snow interface, and temperatures were collected every 10 min.
The NR01 net radiometer was set up to measure the energy balance between incoming short-wave and long-wave far-infrared radiation versus surface-reflected short-wave and outgoing long-wave radiation. The range of short wave radiation is 285–3000 nm, and the range of long wave radiation is 4.5–40 µm. The four-component radiation was automatically recorded every 10 min. In addition, the sensor was equipped with a Pt100 temperature sensor for parallel recording of the sensor temperature.
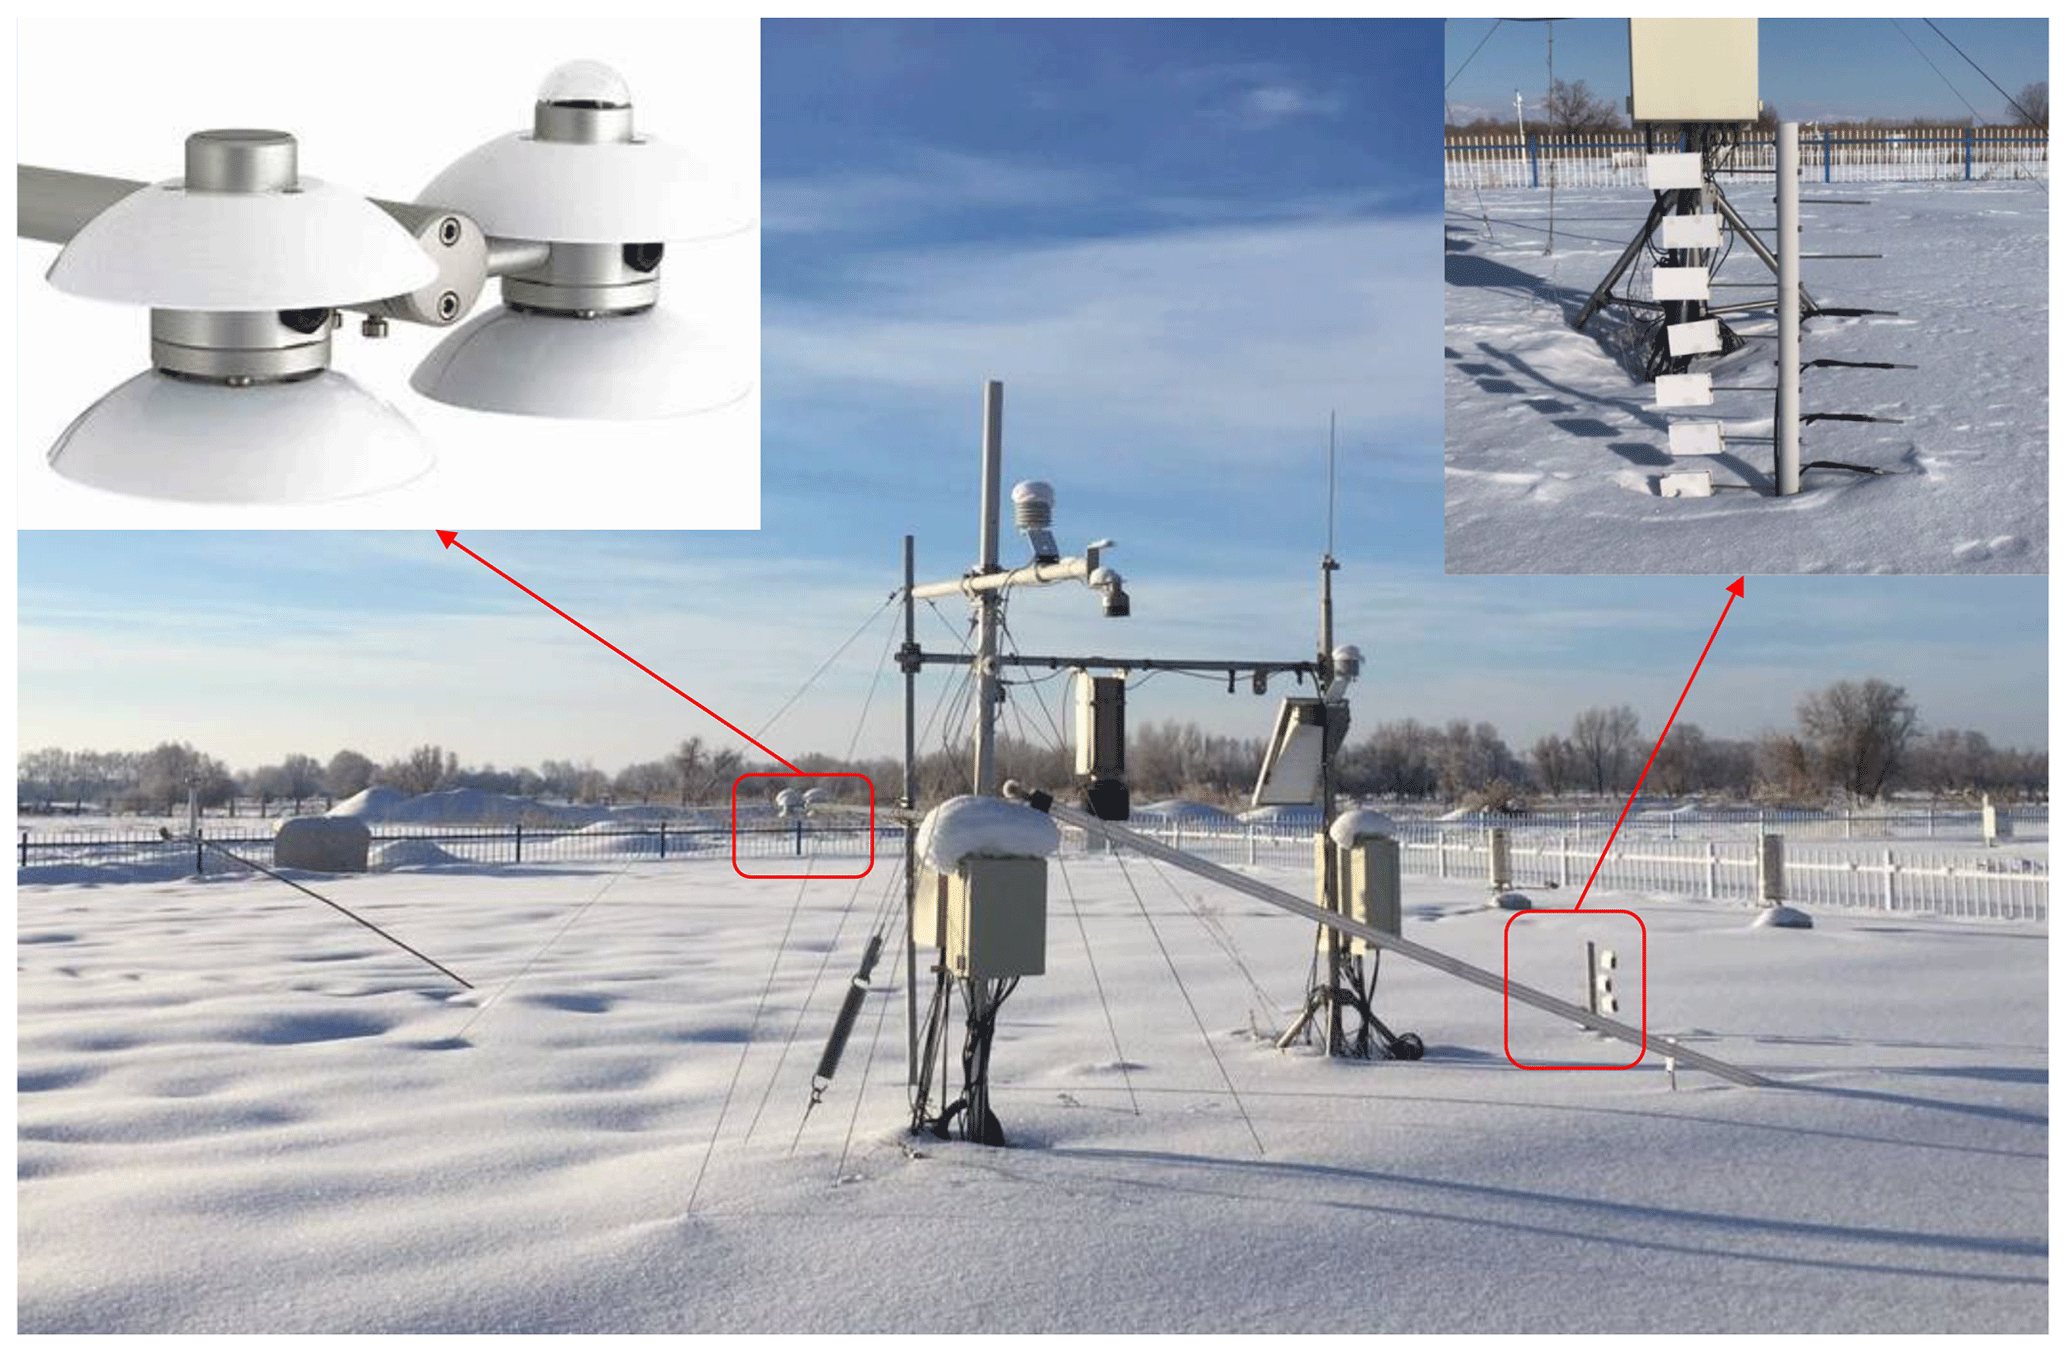
Figure 5Setup of temperature sensors and NR01 in Field 4.
2.2.4 Meteorological observations
The meteorological data include air temperature, air pressure and humidity, wind speed, soil temperature (at −5, −10, −15, and −20 cm), and soil moisture (at −10 and −20 cm). These parameters are routine observations conducted at ANRMS. The instruments used for soil and weather parameter observations are produced by the China Huayun Meteorological Technology Group Corporation. The measurement parameters and their measurement instruments are listed in Table 4.
Table 4Automatically observed variables and the observation instruments, observation time and frequencies.
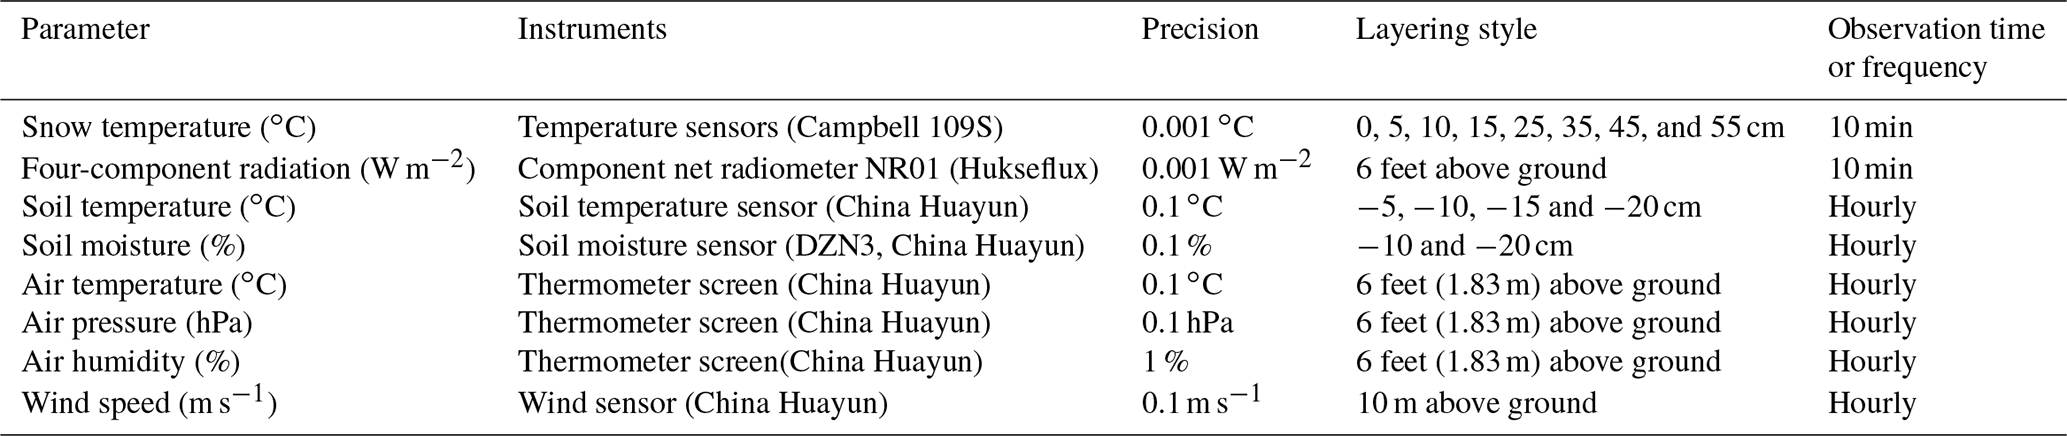
The air temperature, pressure, and humidity were collected using a temperature and wetness sensor in the thermometer screen. The wind speed and direction were measured using a wind sensor set up at 10 m on a tower. Soil moisture and temperature were automatically measured using a moisture sensor and temperature sensor, respectively. Figure 6 depicts the instruments for these observations.
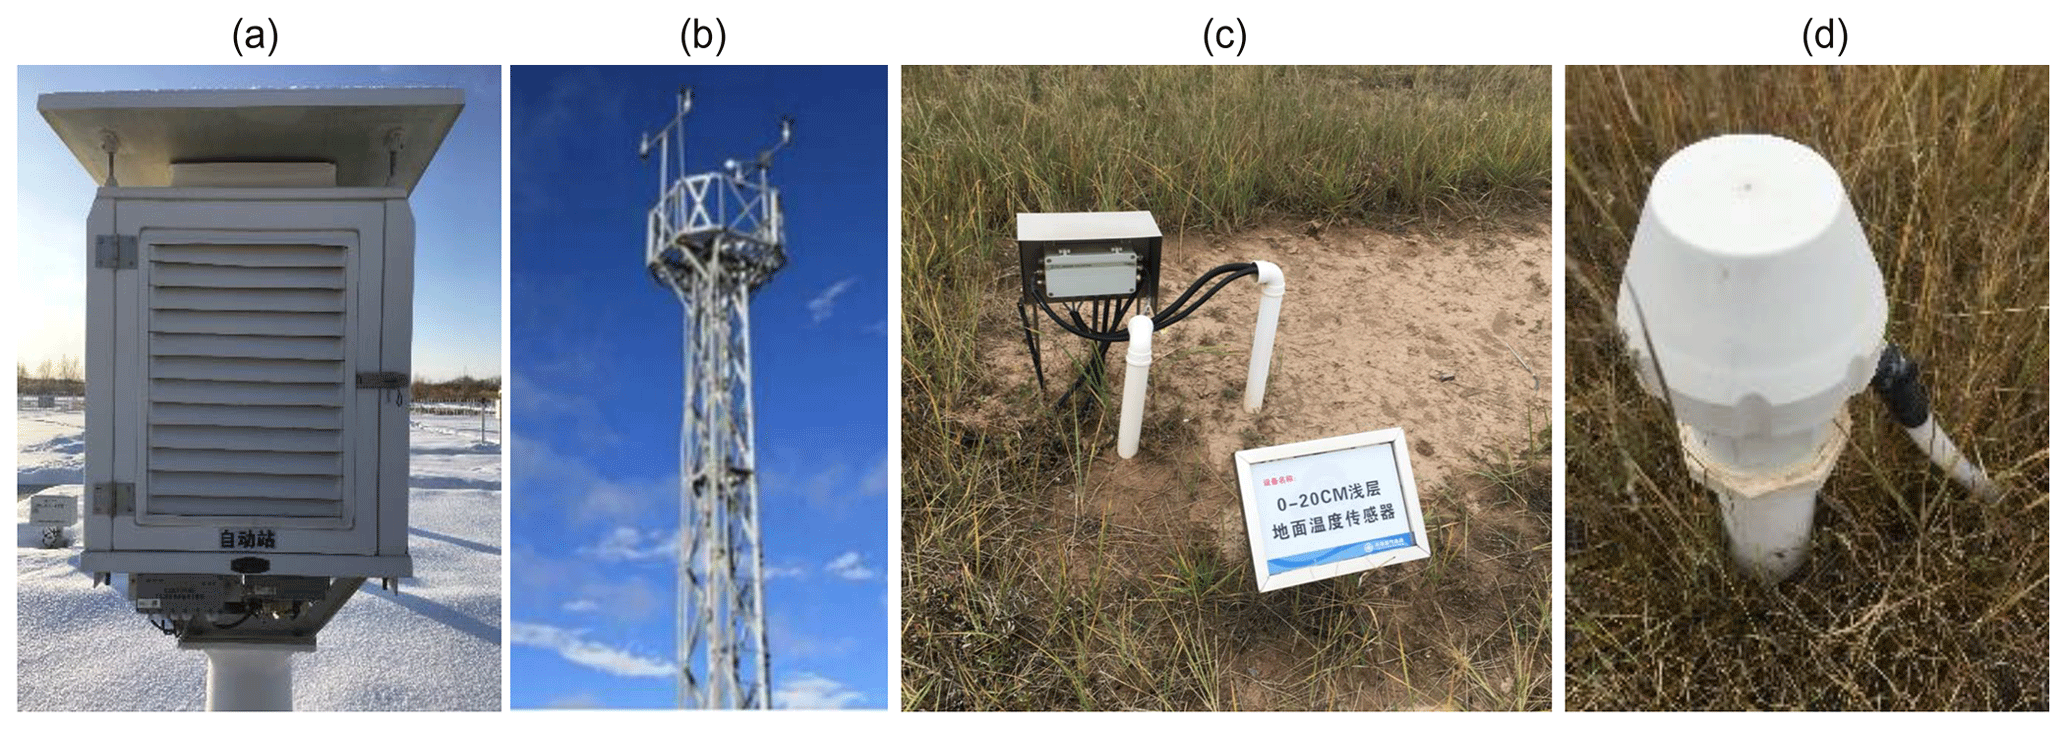
Figure 6Instruments for observation of (a) air temperature and wetness, (b) wind speed, (c) soil temperature, and (d) soil moisture.
The microwave brightness temperature, snow parameters, and meteorological data were recorded in different formats, and their observation frequencies and times were different. These data must be reorganized and consolidated for ease of use. The values from the three-time measurements for snow density in each layer were averaged to obtain the final snow density. The length of the longest and shortest axes of particles in each photo were measured using the software. The average lengths of the longest and shortest axes from all photos in each layer were obtained as the final grain size. The daily snow pit data were finally consolidated into a NetCDF file “snow pit data.nc”.
The time series of automated layered snow temperature and four-component radiation data were first processed by the removal of abnormal values and gap fill, and then consolidated into a NetCDF file “ten-minute 4 component radiation and snow temperature.nc”. The ground-based brightness temperatures and the formatted weather and soil data requested from ANRMS were provided “as is”. Brightness temperature data were divided into time series of brightness temperature and multi-angle brightness temperature. These were stored separately in two NetCDF files. The weather and soil data were consolidated into a NetCDF file “hourly meteorological and soil data.nc”. Table 5 describes the contents of the provided dataset.
-
Brightness temperature data.
Minutely brightness temperatures at 1.4, 18, and 36 GHz for both polarizations at an incidence angle of 50∘. These data include time, incidence angle, azimuth angle, and brightness temperatures at the three bands for both polarizations.
Seventeen groups of calibrated brightness temperature at 1.4, 18.7 and 36.5 GHz for both polarizations at different incidence angles (30, 35, 40, 45, 50, 55, 60∘). This data include time, incidence angles, azimuth angle, and brightness temperatures at the three bands for both polarizations.
-
Manual snow pit data.
Daily snow pit data include date, snow depth, layered snow thickness, average longest axis, average shortest axis, grain shapes of each layer, layered snow density using snow fork (snow density at different heights, such as SF_5 cm, SF_10 cm, SF_15 cm), snow density using snow tube, and layered snow density using snow shovel (such as SS_0–10 cm, SS_10–20 cm, SS_20–30 cm, SS_30–40 cm).
-
Automated snow temperature and radiation data.
The 10 min four-component radiation and snow temperature data include time, short-wave incident radiation, short-wave reflected radiation, long-wave infrared incident radiation, long-wave infrared reflected radiation, sensor temperature, and snow temperatures at different heights (such as ST_0 cm, ST_5 cm).
-
Meteorological and soil data.
Hourly weather data include time, air temperature, pressure, humidity, wind speed, soil temperature (at 5, 10, 15, and 20 cm), and soil moisture (at 10 and 20 cm).
Table 5Description of consolidated data.
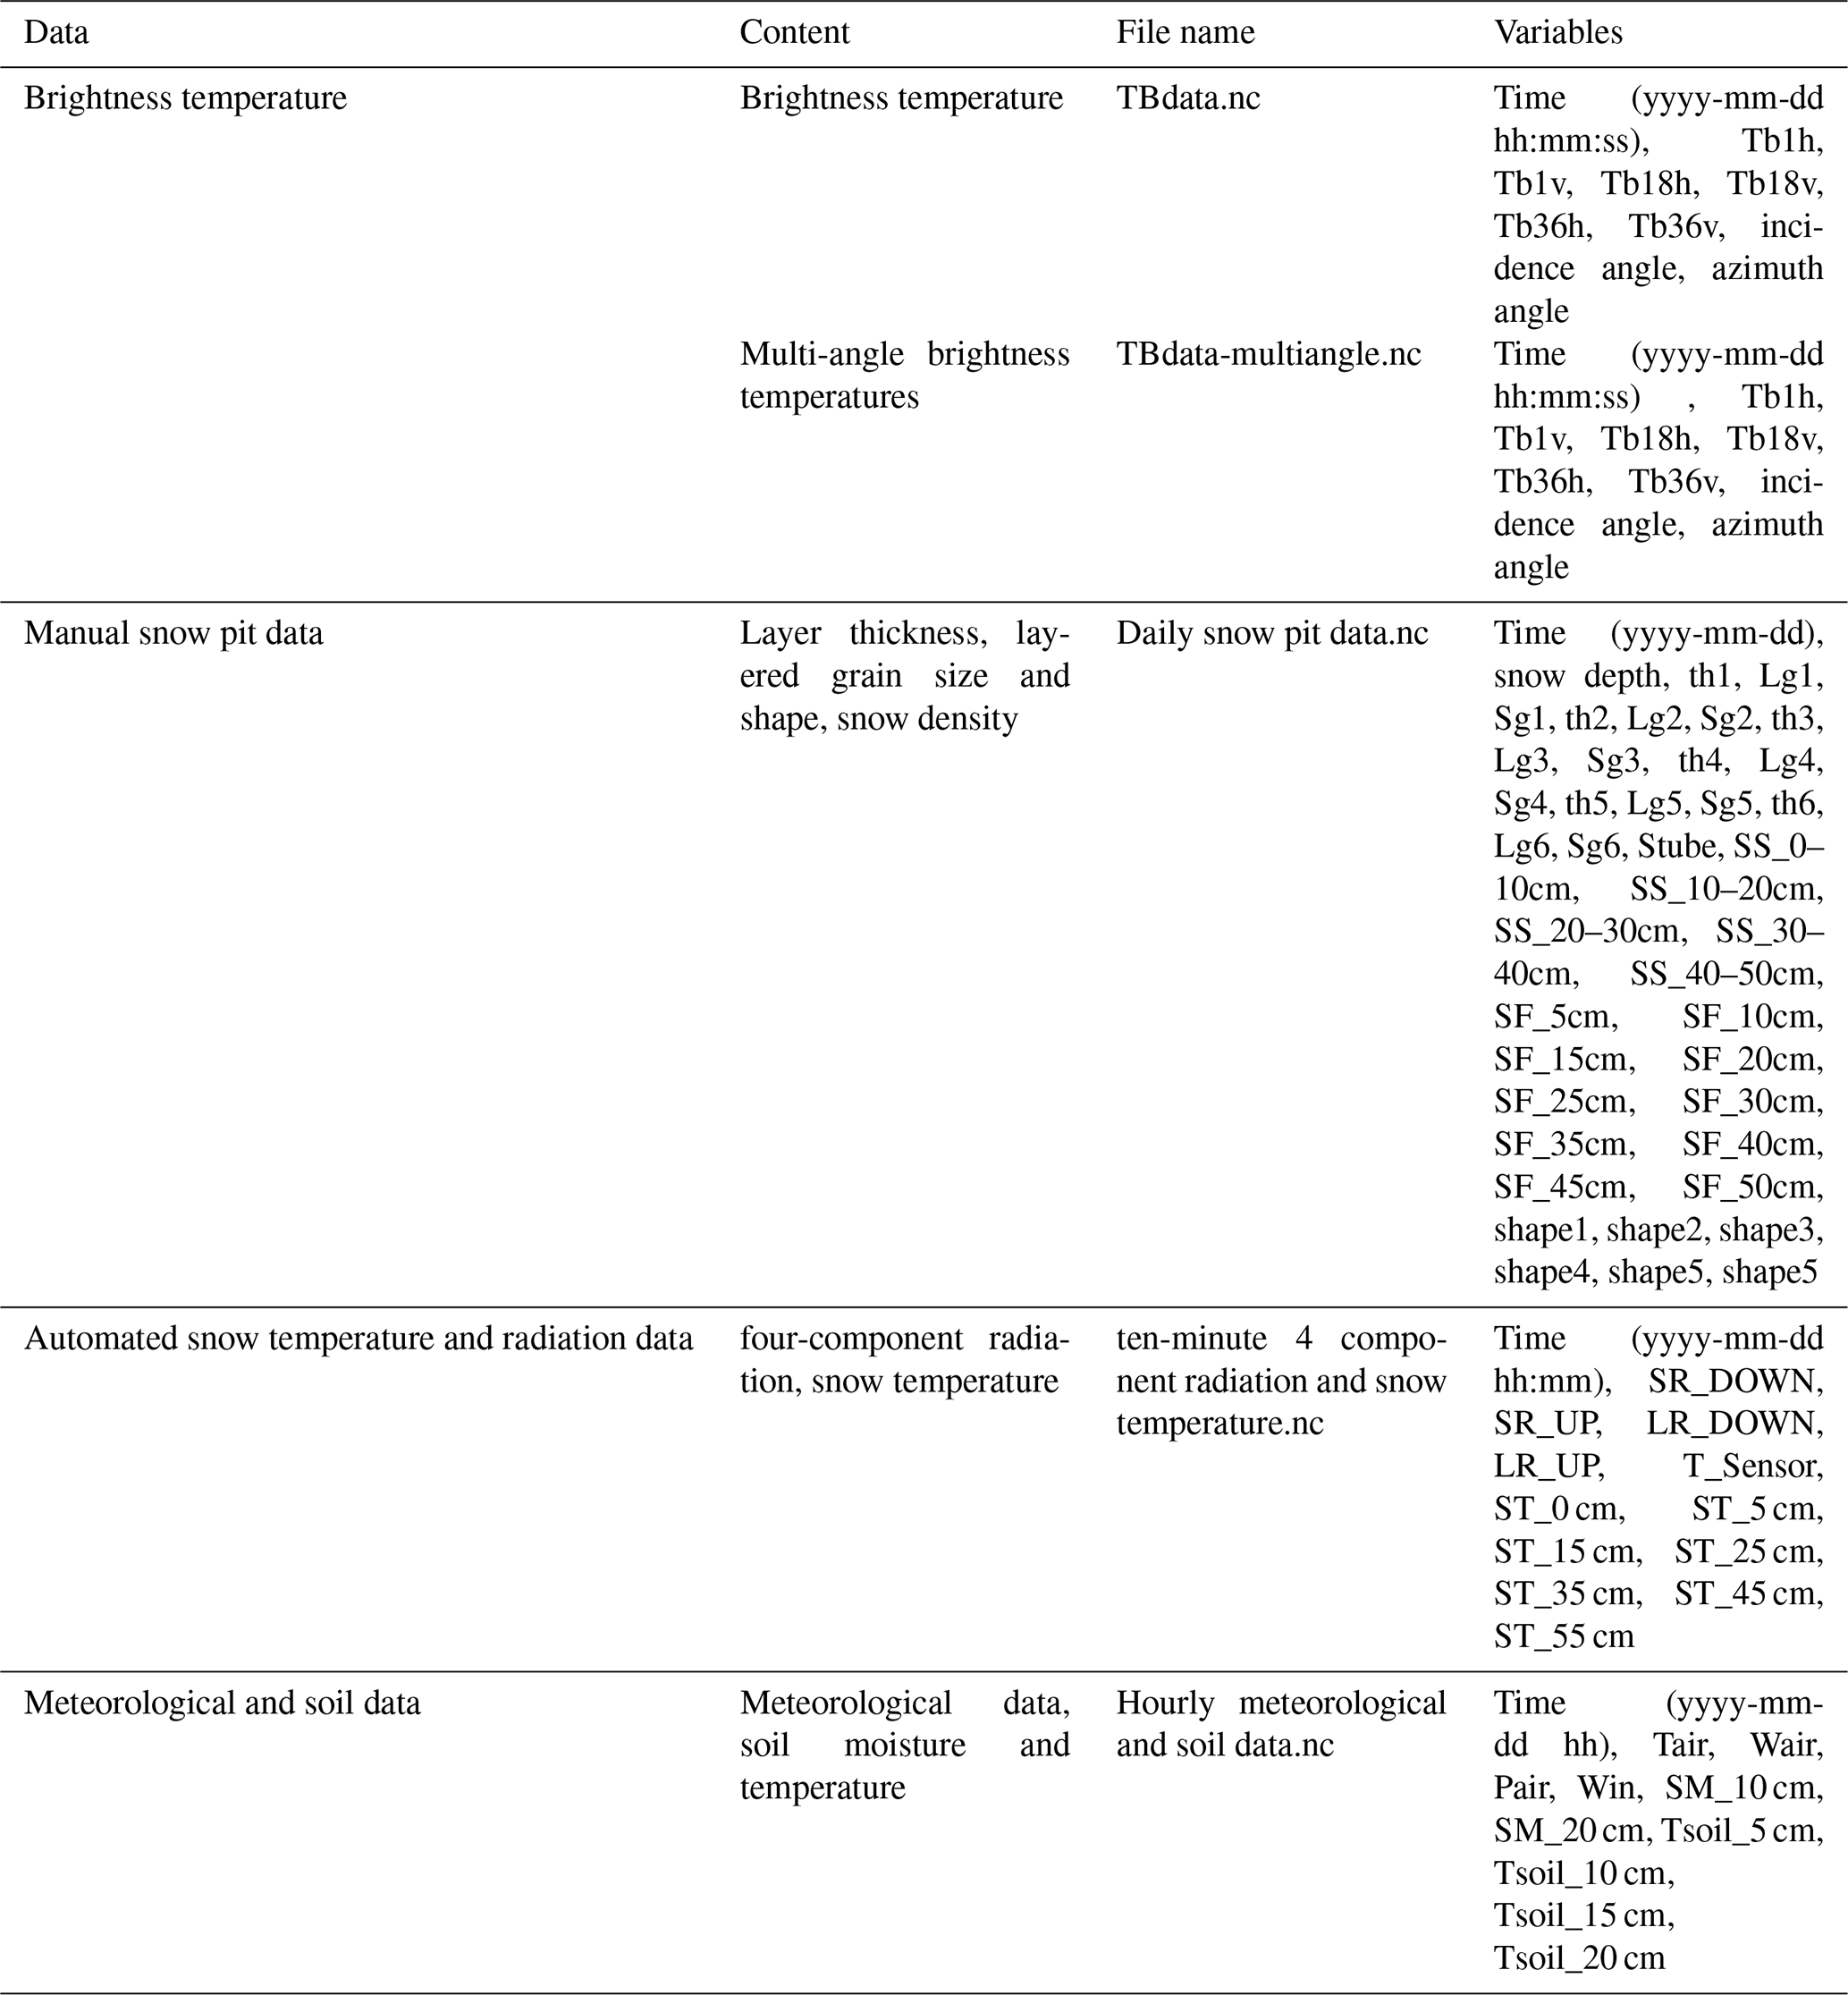
Note: th: snow thickness, Lg: long axis, Sg: short axis, shape: grain shape; Stube: snow density observed using snow tube, SS: snow density observed using snow shovel, SF: snow density observed using snow fork; ST: snow temperature; SR_DOWN: downward short-wave radiation, SR_UP: upward short-wave radiation, LR_DOWN, downward long-wave radiation, LR_UP: upward long-wave radiation, T_sensor: sensor temperature; Tair: air temperature, Wair: air wetness, Pair: air pressure, Win: wind speed, SM: soil moisture, Tsoil: soil temperature.
4.1 Snow characteristics
4.1.1 Layering grain size and grain shape
During 2015–2016, snow cover began on 27 November 2015 and ended on 25 March 2016. During this snow season, there were seven snowfall events and each formed a distinct snow layer, except for the third event whose layering was indistinguishable from the second layer (Fig. 7, gray). The fourth event was the biggest. After the snow depth started to decrease and the snow density increased, snow cover started to melt on 14 March and ended within 10 d.
Grain sizes within all layers increased during the snow season, except in the bottom layer where the grain size experienced a decrease from 28 December to 20 January (Fig. 8). In the vertical profile, the grain size increased from top to bottom with the snow age. The grain size of the fresh snow was approximately 0.3 mm during the experiment. The longest long and short axes, occurring in Layer 1 during the melt period, were up to 6 and 4 cm, respectively. The length of short axes is approximately 0.7 % of the length of long axes. The grain shape generally developed from rounded grains to facet crystals, and then to depth hoar. After 13 March 2016, the minimum air temperature increased to above 0 ∘C, snowmelt accelerated, and the grain shape developed into melted forms (Fig. 7).
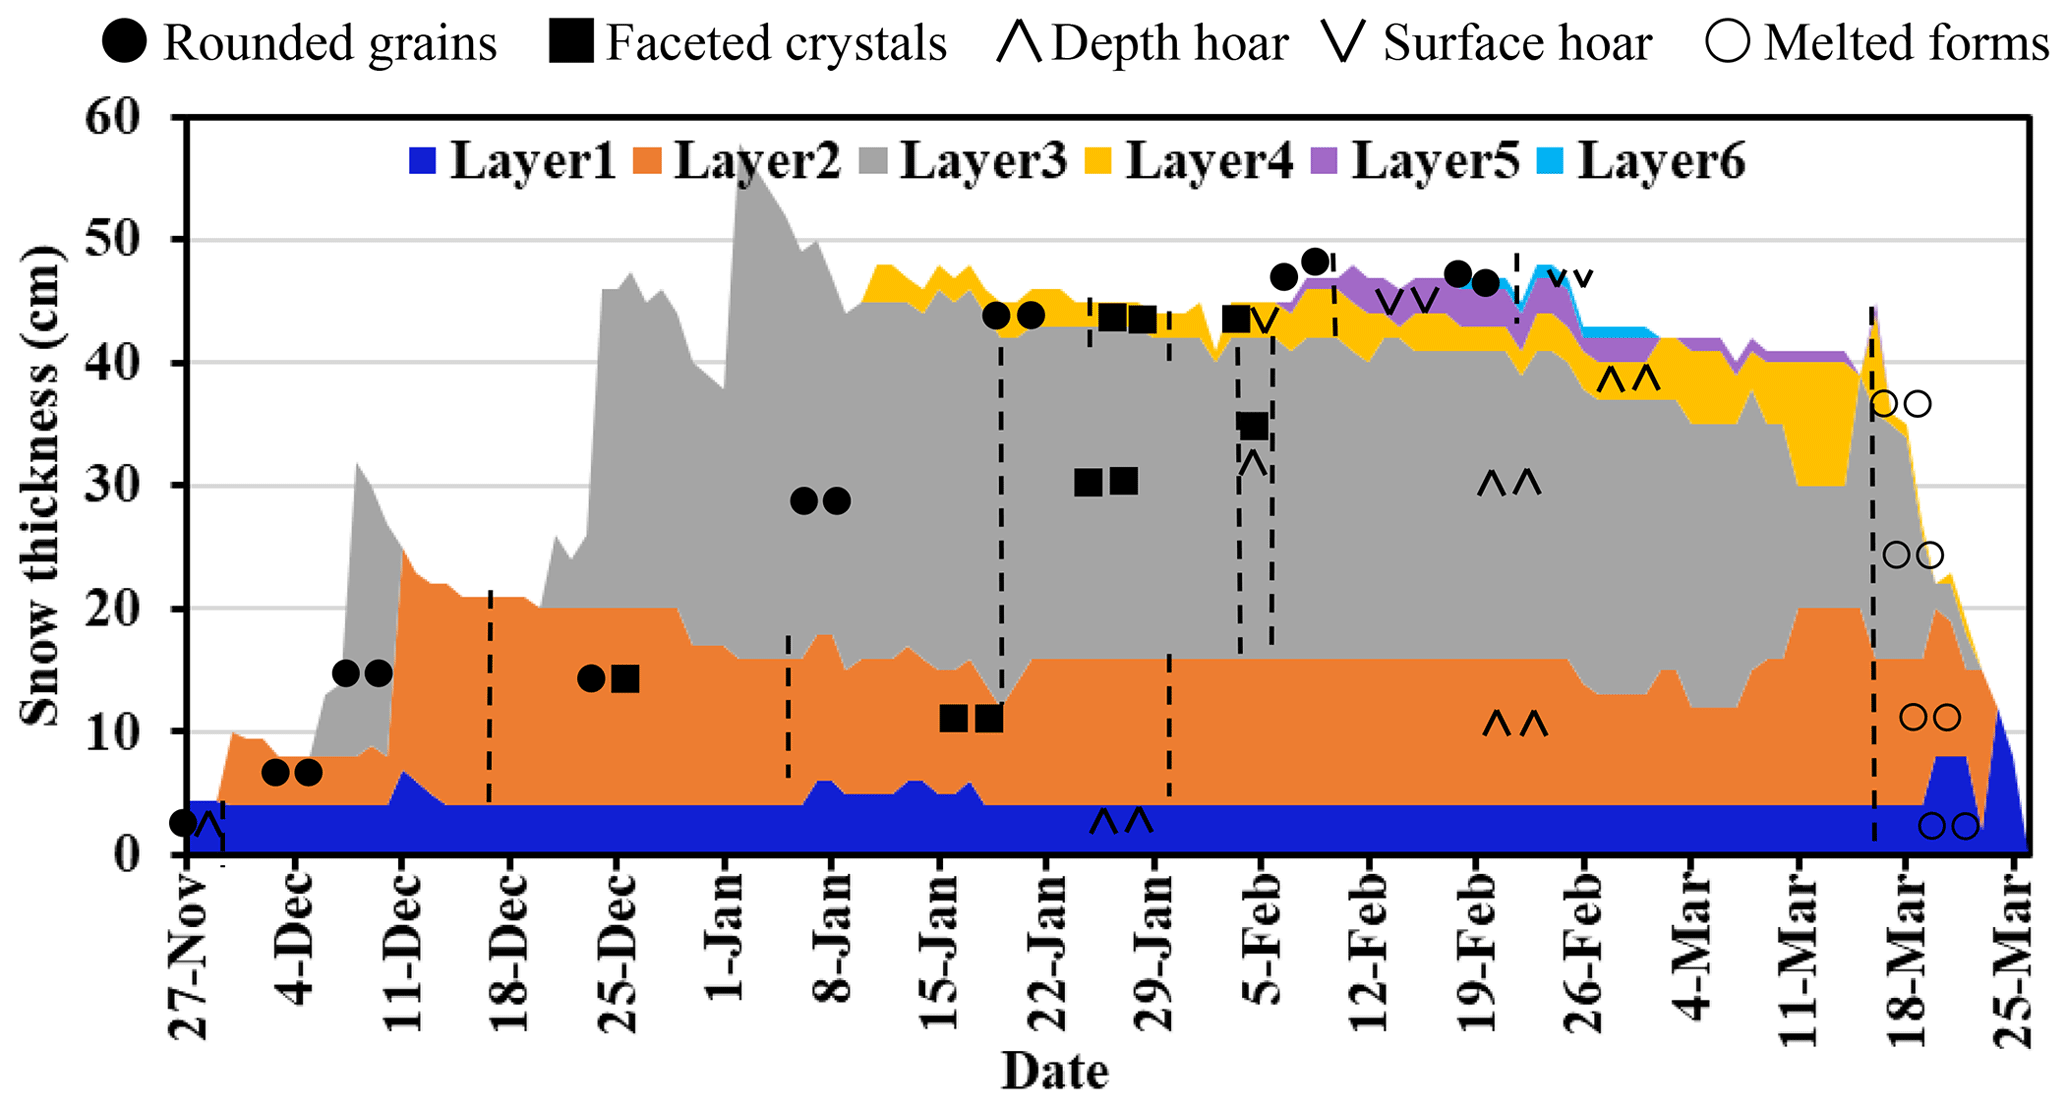
Figure 7Daily variation in snow layers and grain shape in each layer from 27 November 2015 to 25 March 2016.
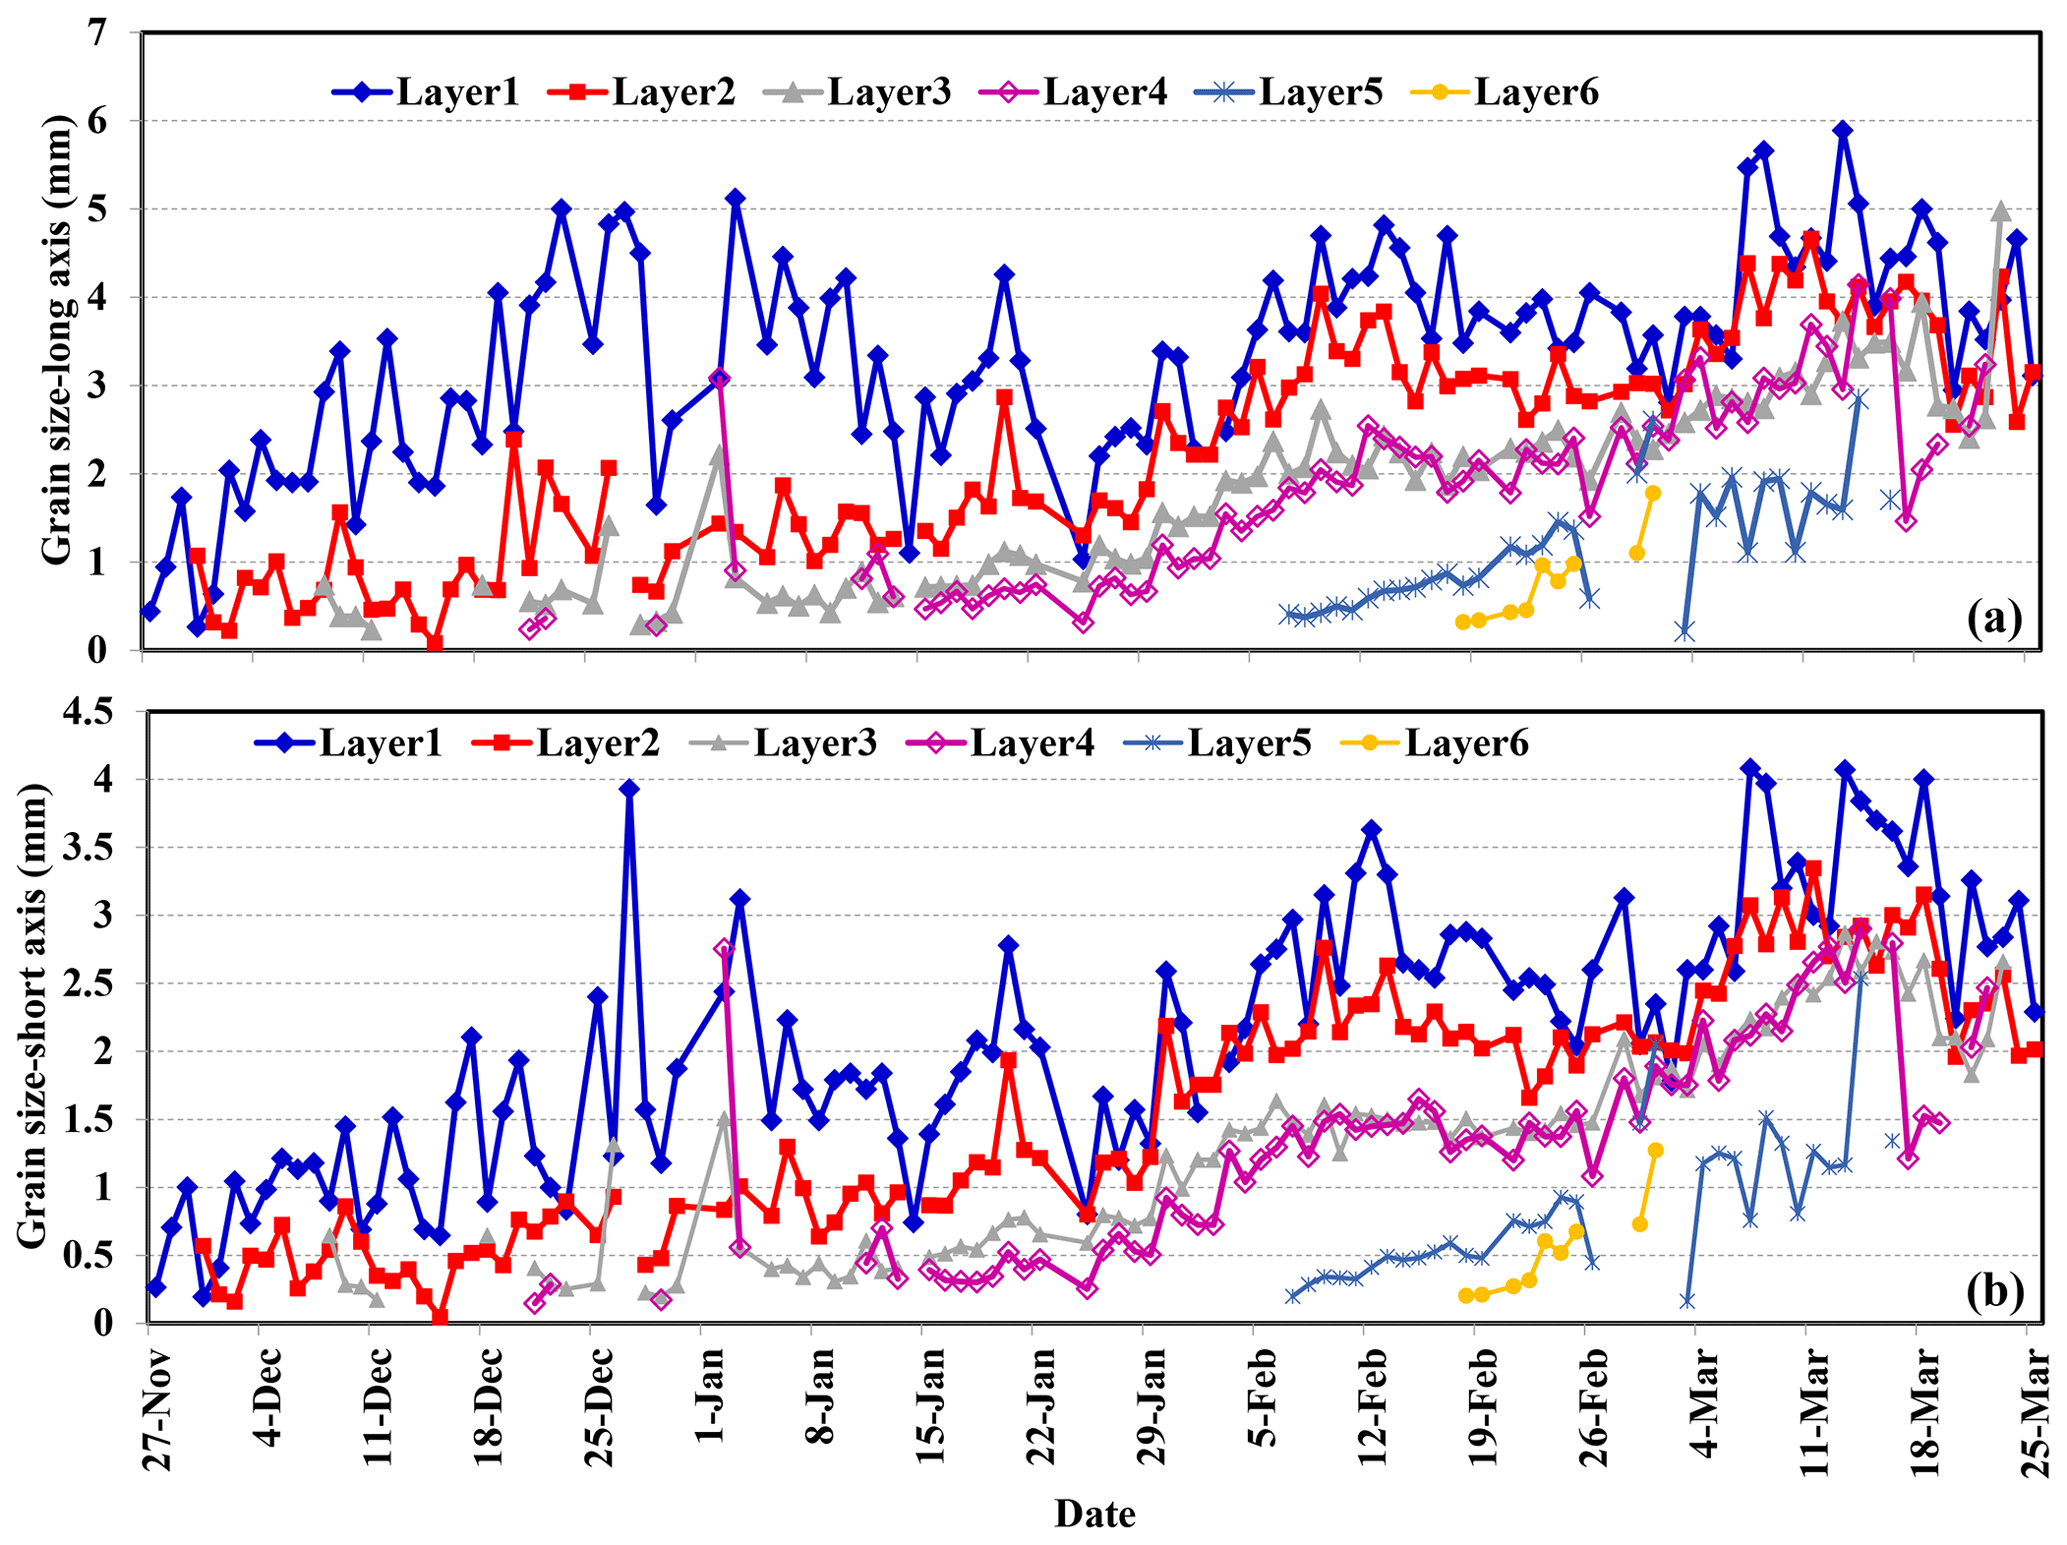
Figure 8Daily variation in grain size within each layer from 27 November 2015 to 25 March 2016. The layer thicknesses are presented in Fig. 7.
4.1.2 Snow density
Snow density measured by three different instruments shows that the density of fresh snow ranged between 0.05–1.0 g cm−3 (Fig. 9). The snow densities increased with snow age and remained stable after reaching ∼0.2–0.25 g cm−3. As of 14 March, snow densities increased abruptly, with the maximum value over 0.45 g cm−3. In the vertical profile, snow density increased from top to bottom in the accumulation phase. However, after 3 January 2016, snow densities in the middle layers were larger than those in the bottom and upper layers due to the well-developed depth hoar of the bottom layer. In the melting phase, there were no significant differences for the snow densities in all layers. Snow fork provided most of the detail for the snow density profile, but systematically underestimated snow density compared to snow tube and snow shovel by 24 % (Dai et al., 2022).
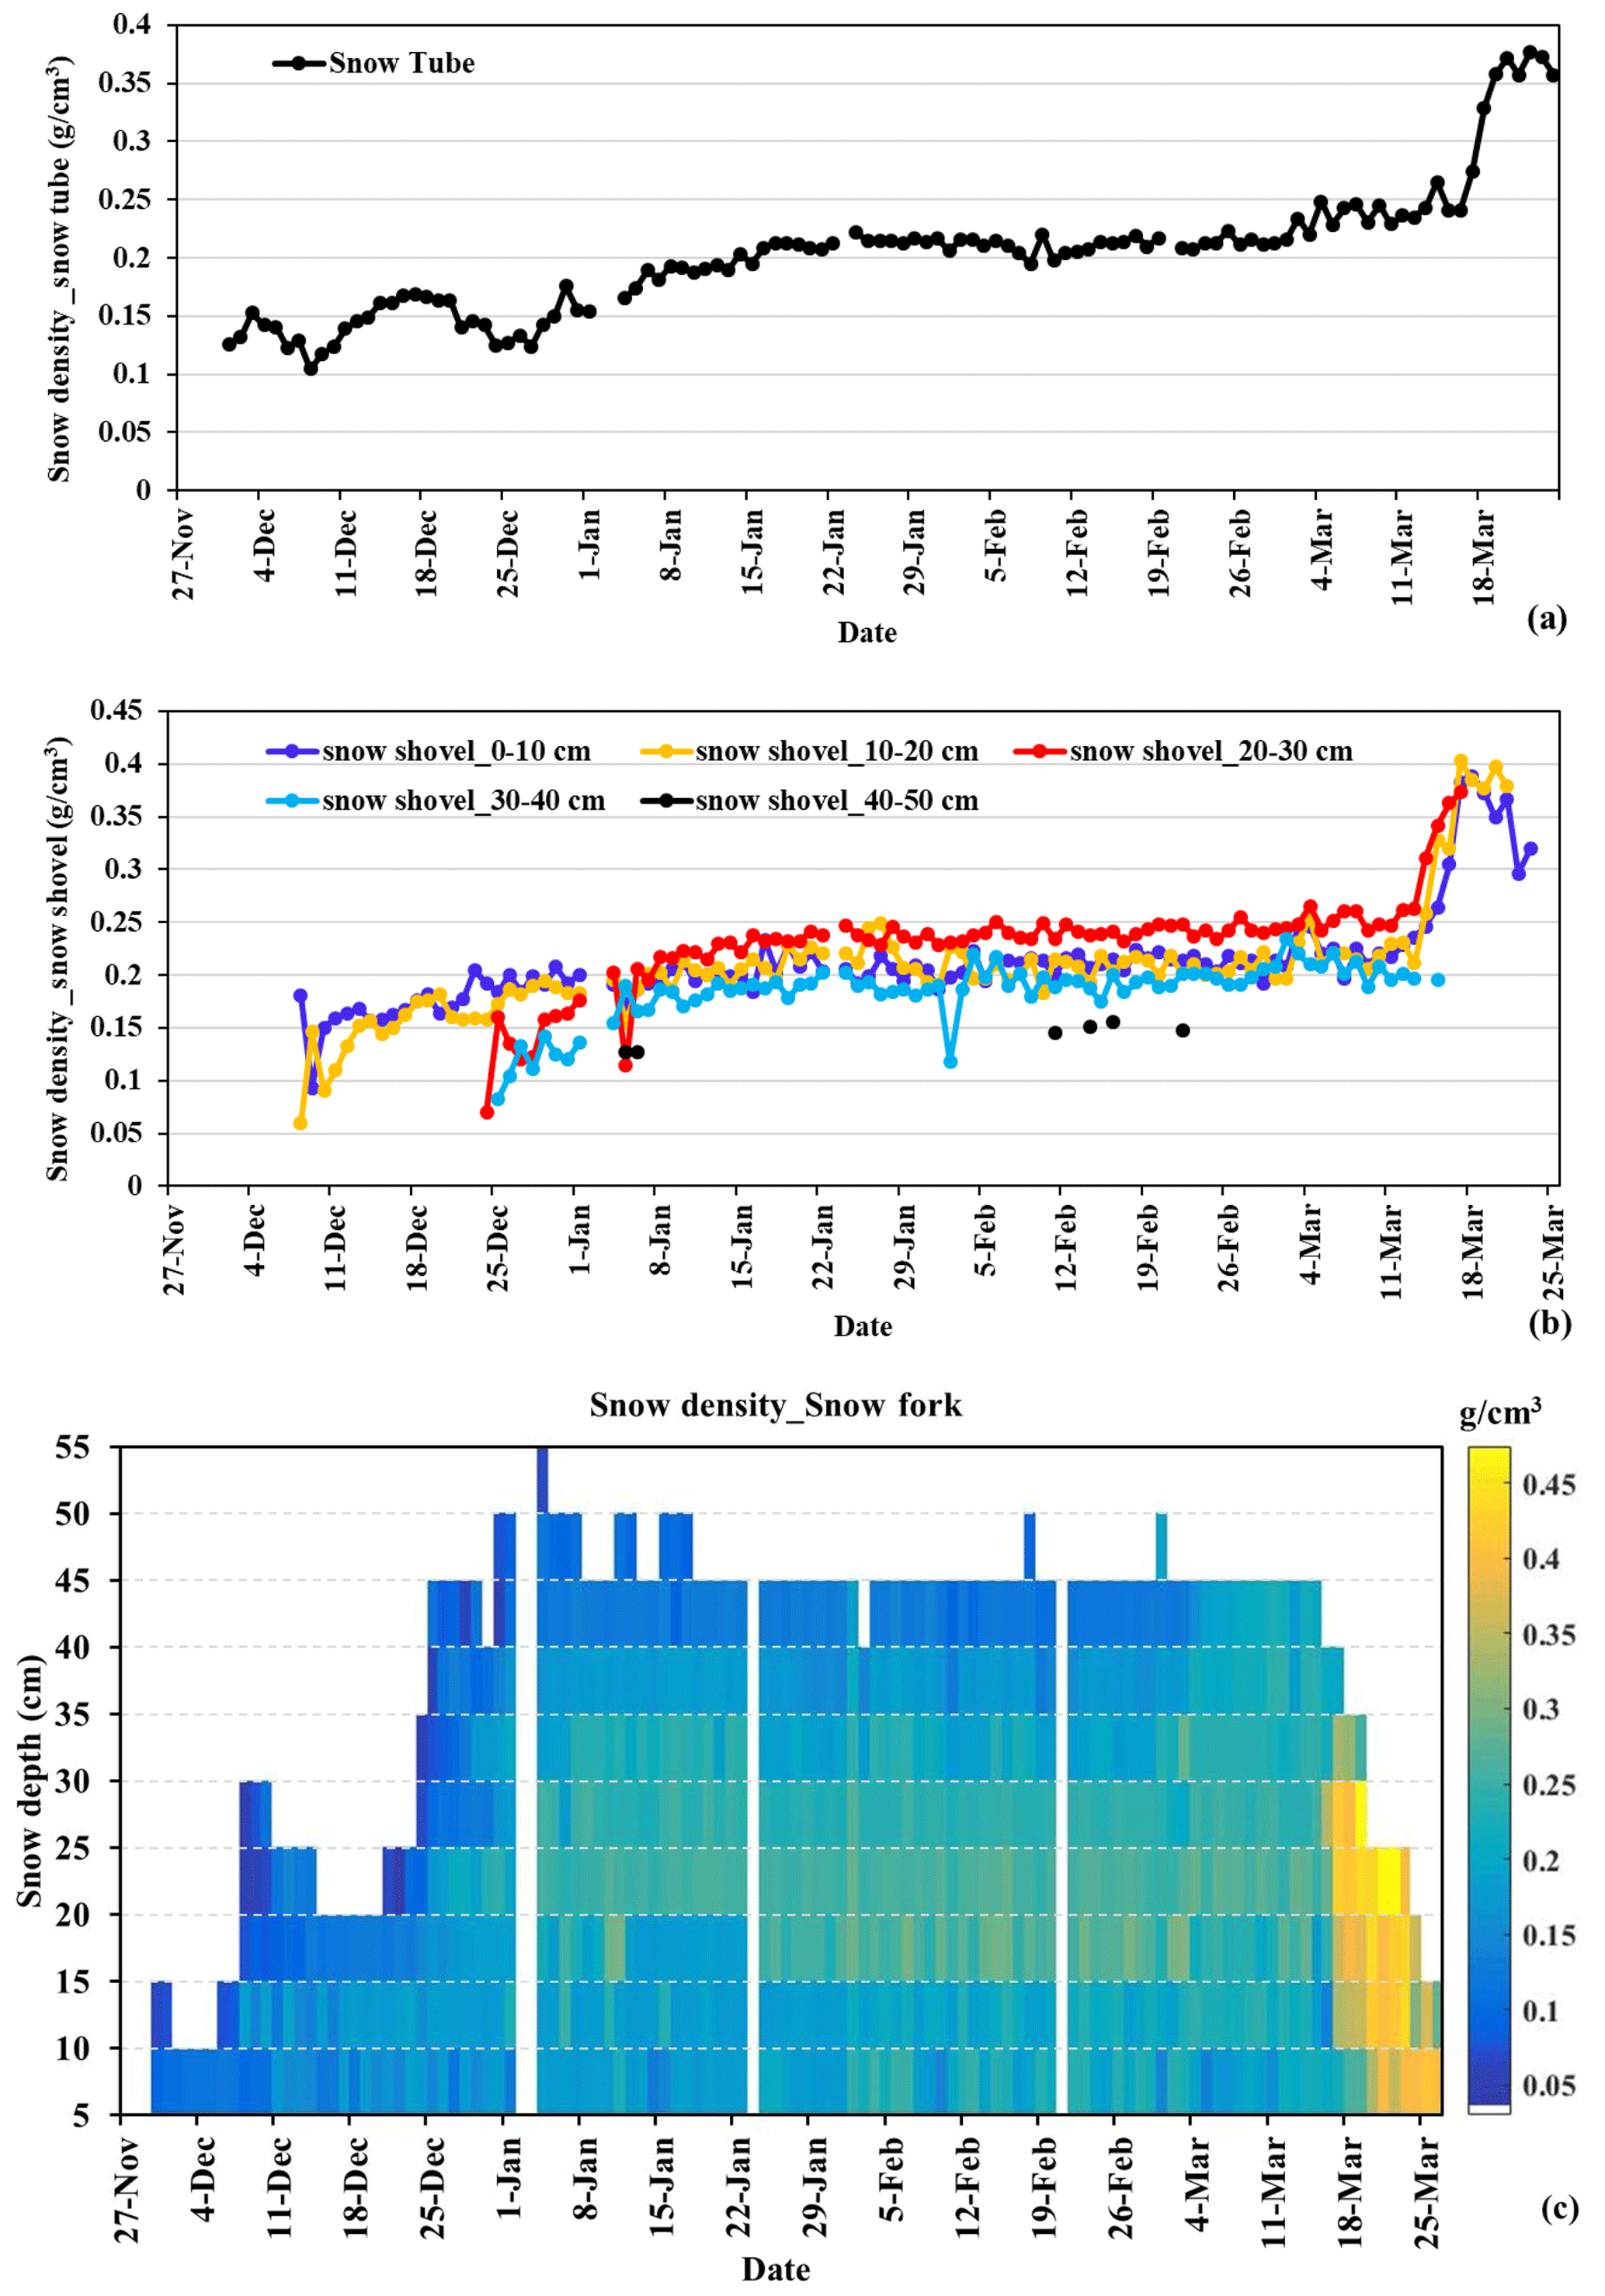
Figure 9Daily variation in snow densities measured using three different measurement methods from 27 November 2015 to 25 March 2016, (a) overall snow density measured using snow tube, (b) snow density at 10 cm interval using snow shovel, and (c) snow density at 5 cm interval using snow fork.
4.1.3 Snow temperature
The diurnal range of snow temperature decreased from top to bottom layers. As the snow depth increased, there were more layers with small diurnal variations (Fig. 10). Snow temperature at 0 cm (snow/soil interface temperature) showed no significant diurnal variation, remaining at approximately −2.0 to 0.7 ∘C. Snow temperature in the top layer had the largest diurnal variation. After 17 March 2016, the snow temperature of all layers were above 0 ∘C, implying that snow cover did not refreeze anymore.
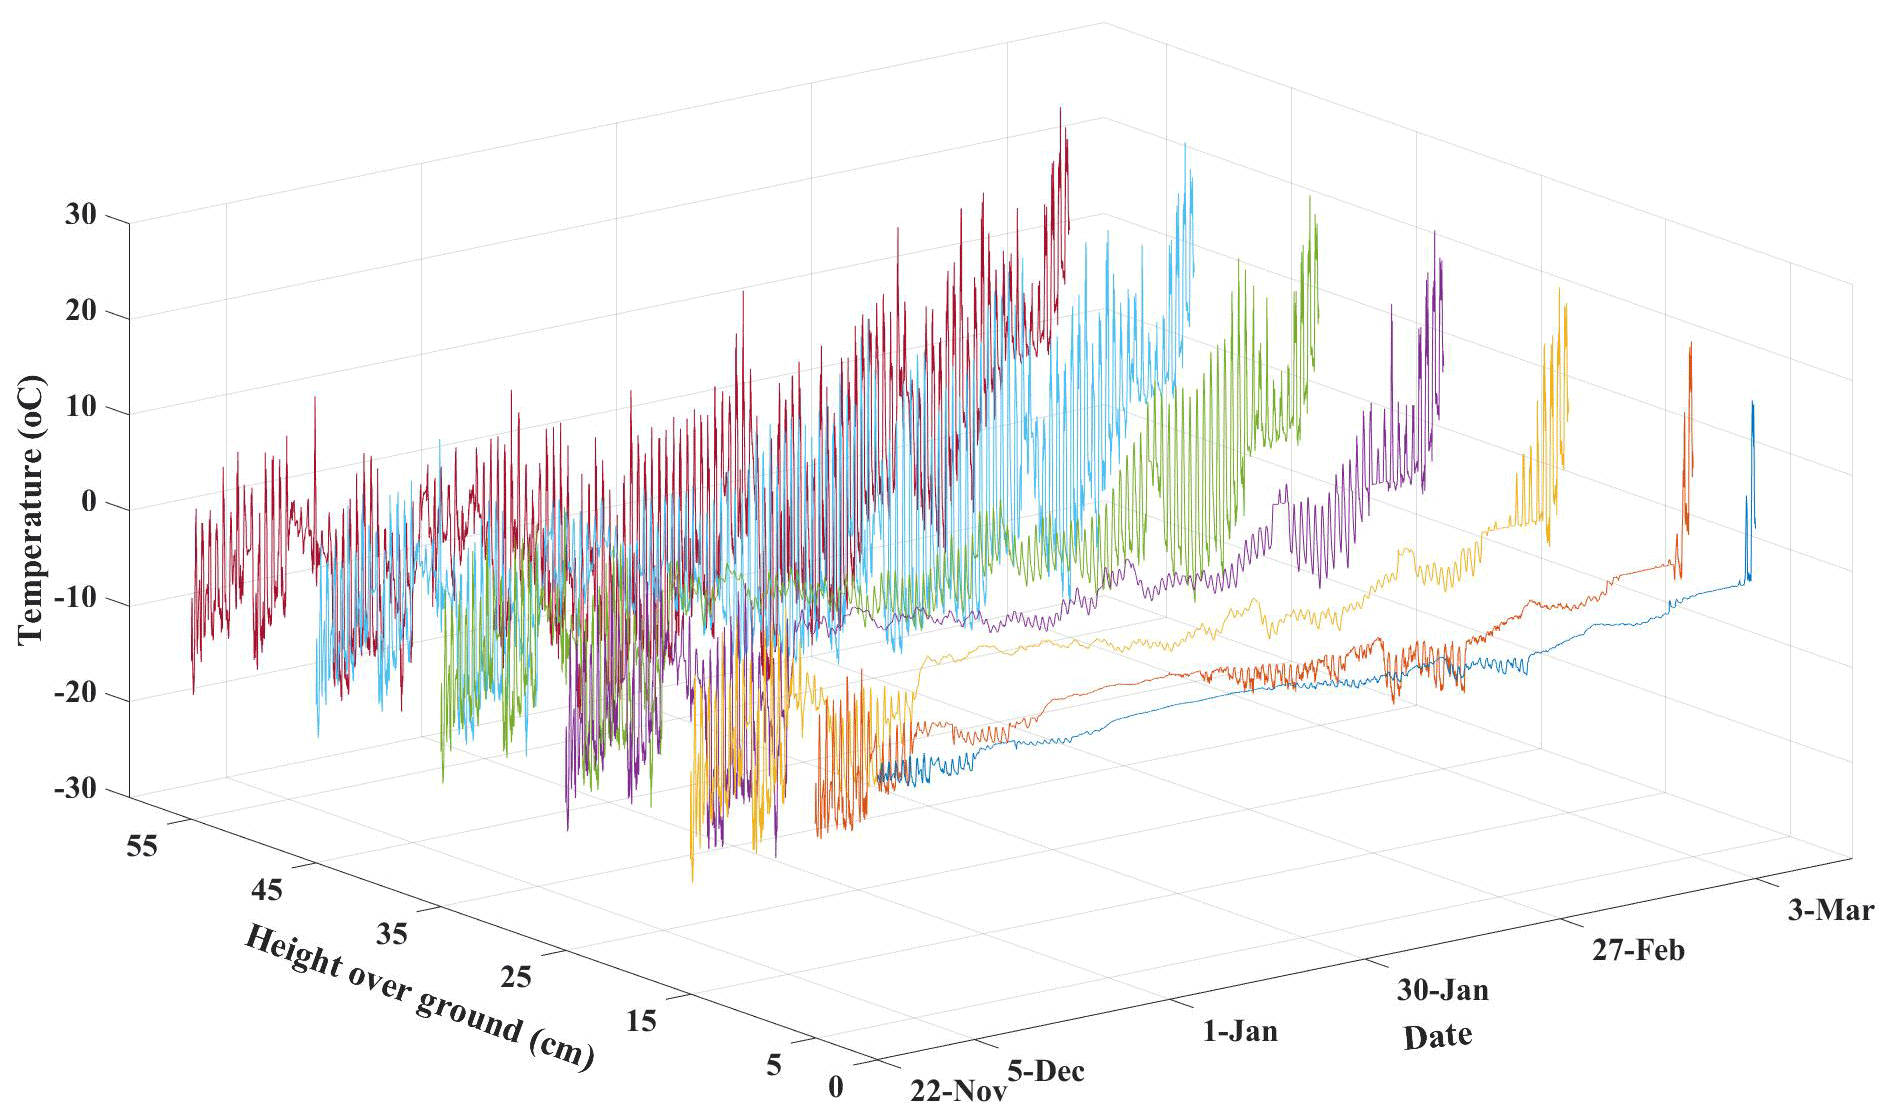
Figure 10Minutely variation in snow temperatures at 0 cm (snow/soil interface), 5, 15, 25, 35, 45, and 55 cm above ground during the experiment period.
4.2 Soil temperature and moisture
The soil temperature at 5 and 10 cm remained stable and below 0 ∘C during the snow season but presented large fluctuation before (after) snow on (off) (Fig. 11). The temperature difference between 5 and 10 cm was much larger before snow cover onset than during snow cover period. The soil moisture at 10 cm was more than 10 % before snow cover onset and after snow off. There were two soil moisture peaks within the snow cover period, one from 12–14 December and the other from 1–20 January.
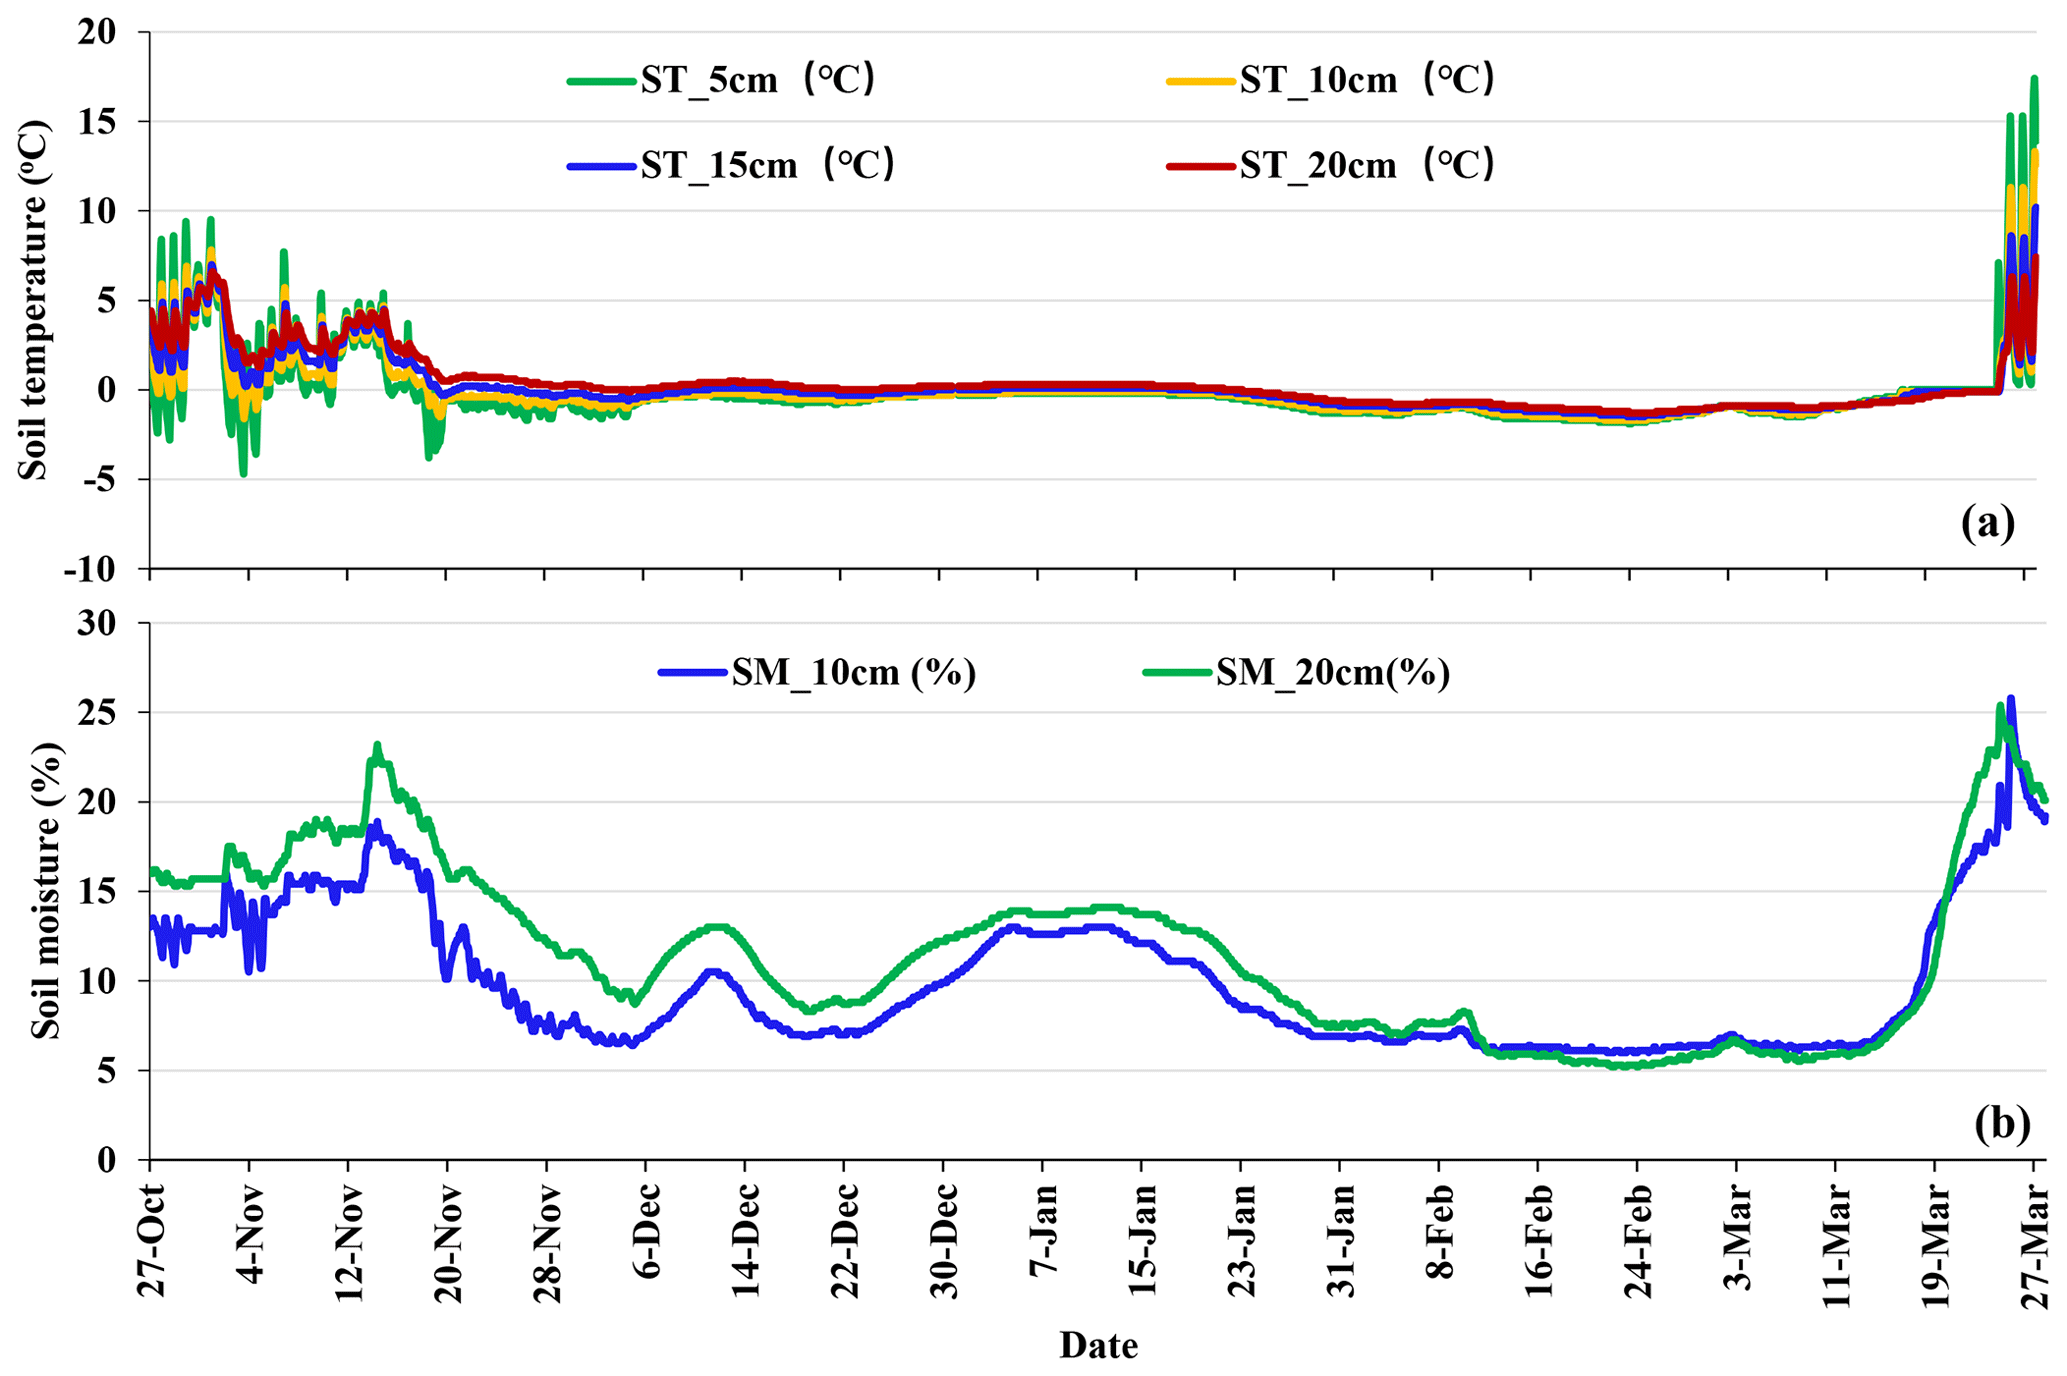
Figure 11(a) Hourly soil temperature at 5, 10, 15, and 20 cm below the snow/soil interface, and (b) soil moisture at 10 and 20 cm below the snow/soil interface.
4.3 Brightness temperature
The microwave brightness temperatures varied with snow, soil, and weather conditions. Figure 12 shows the daily brightness temperatures, brightness temperature difference between 18 and 36 GHz, and snow depth at 01:00 LT. Figure 13 shows the hourly variation in brightness temperatures at 1.4, 18.7, and 36.5 GHz and air temperature after 1 February. Data show that Tb36h and Tb36v decreased during the full snow season, Tb18h exhibited an obvious decline after 18 February, and Tb18v after 3 March (Fig. 12). After 4 January, though snow depth stopped increasing, the brightness temperature continued to decrease and brightness temperature difference increased. Based on Fig. 8, snow density became stable after 15 January. Therefore, after 4 January, the decreasing brightness temperatures were mainly caused by the growing grain size. The variation of L band mainly relies on soil moisture and soil temperature changes. We have soil temperatures at 0, 5, and 10 cm and soil moisture at 10 cm. However, the L band reflects the soil moisture within 5 cm which was absent in this experiment.
After 25 February, the brightness temperature exhibited a distinct cycle of daytime increase and nighttime decrease (Fig. 13), resulting from large liquid water content caused by high daytime air temperature (above 0 ∘C) and nighttime refreezing of the melted snowpack. After 14 March there was another big rise in air temperature and even the nighttime air temperatures were above 0 ∘C. During this period of accelerated snowmelt, since the liquid water within the snowpack did not completely refreeze at night, both brightness temperatures at the three bands and the brightness temperature difference exhibited irregular behavior.
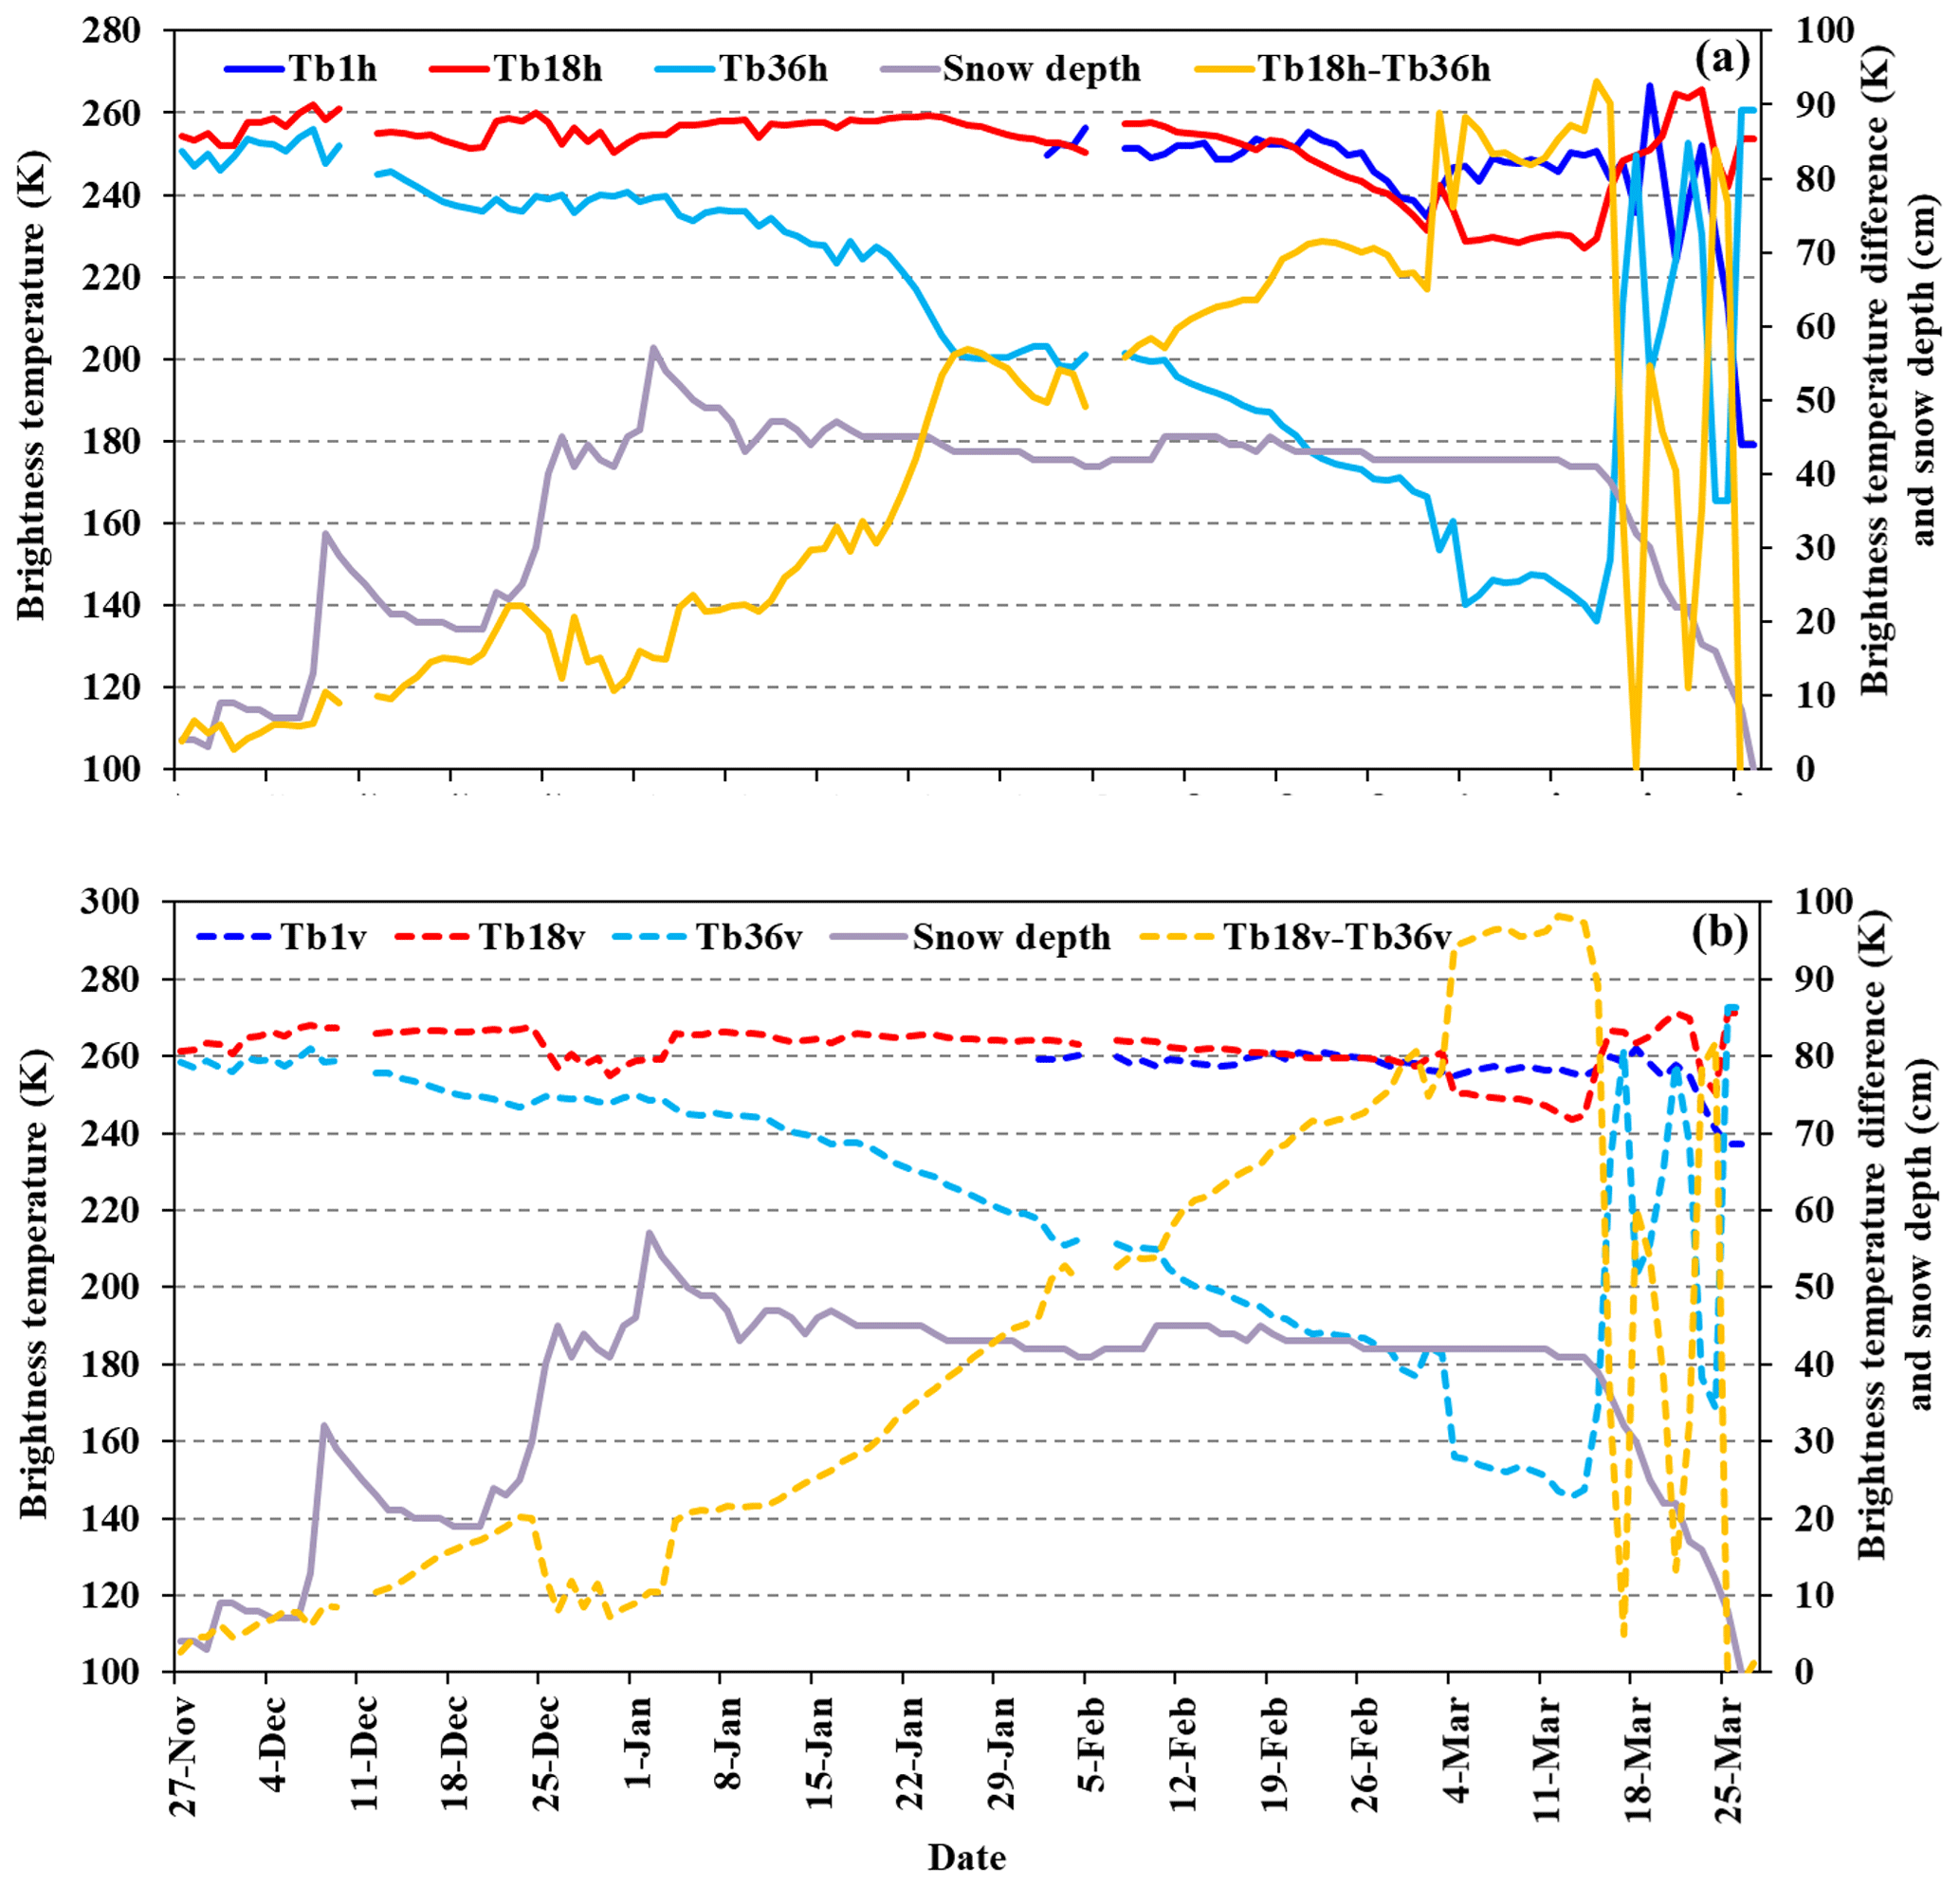
Figure 12Daily variations in brightness temperatures at 1.4, 18, and 36 GHz, for horizontal (Tb1h, Tb18h, Tb36h) and vertical (Tb1v, Tb18v, Tb36v) polarizations, the differences between Tb18h and Tb36h (Tb18h − Tb36h), and between Tb18v and Tb36v (Tb18v − Tb36v), at 01:00 LT, from 27 November 2015 to 26 March 2016 (a) for horizontal polarization, and (b) for vertical polarization.
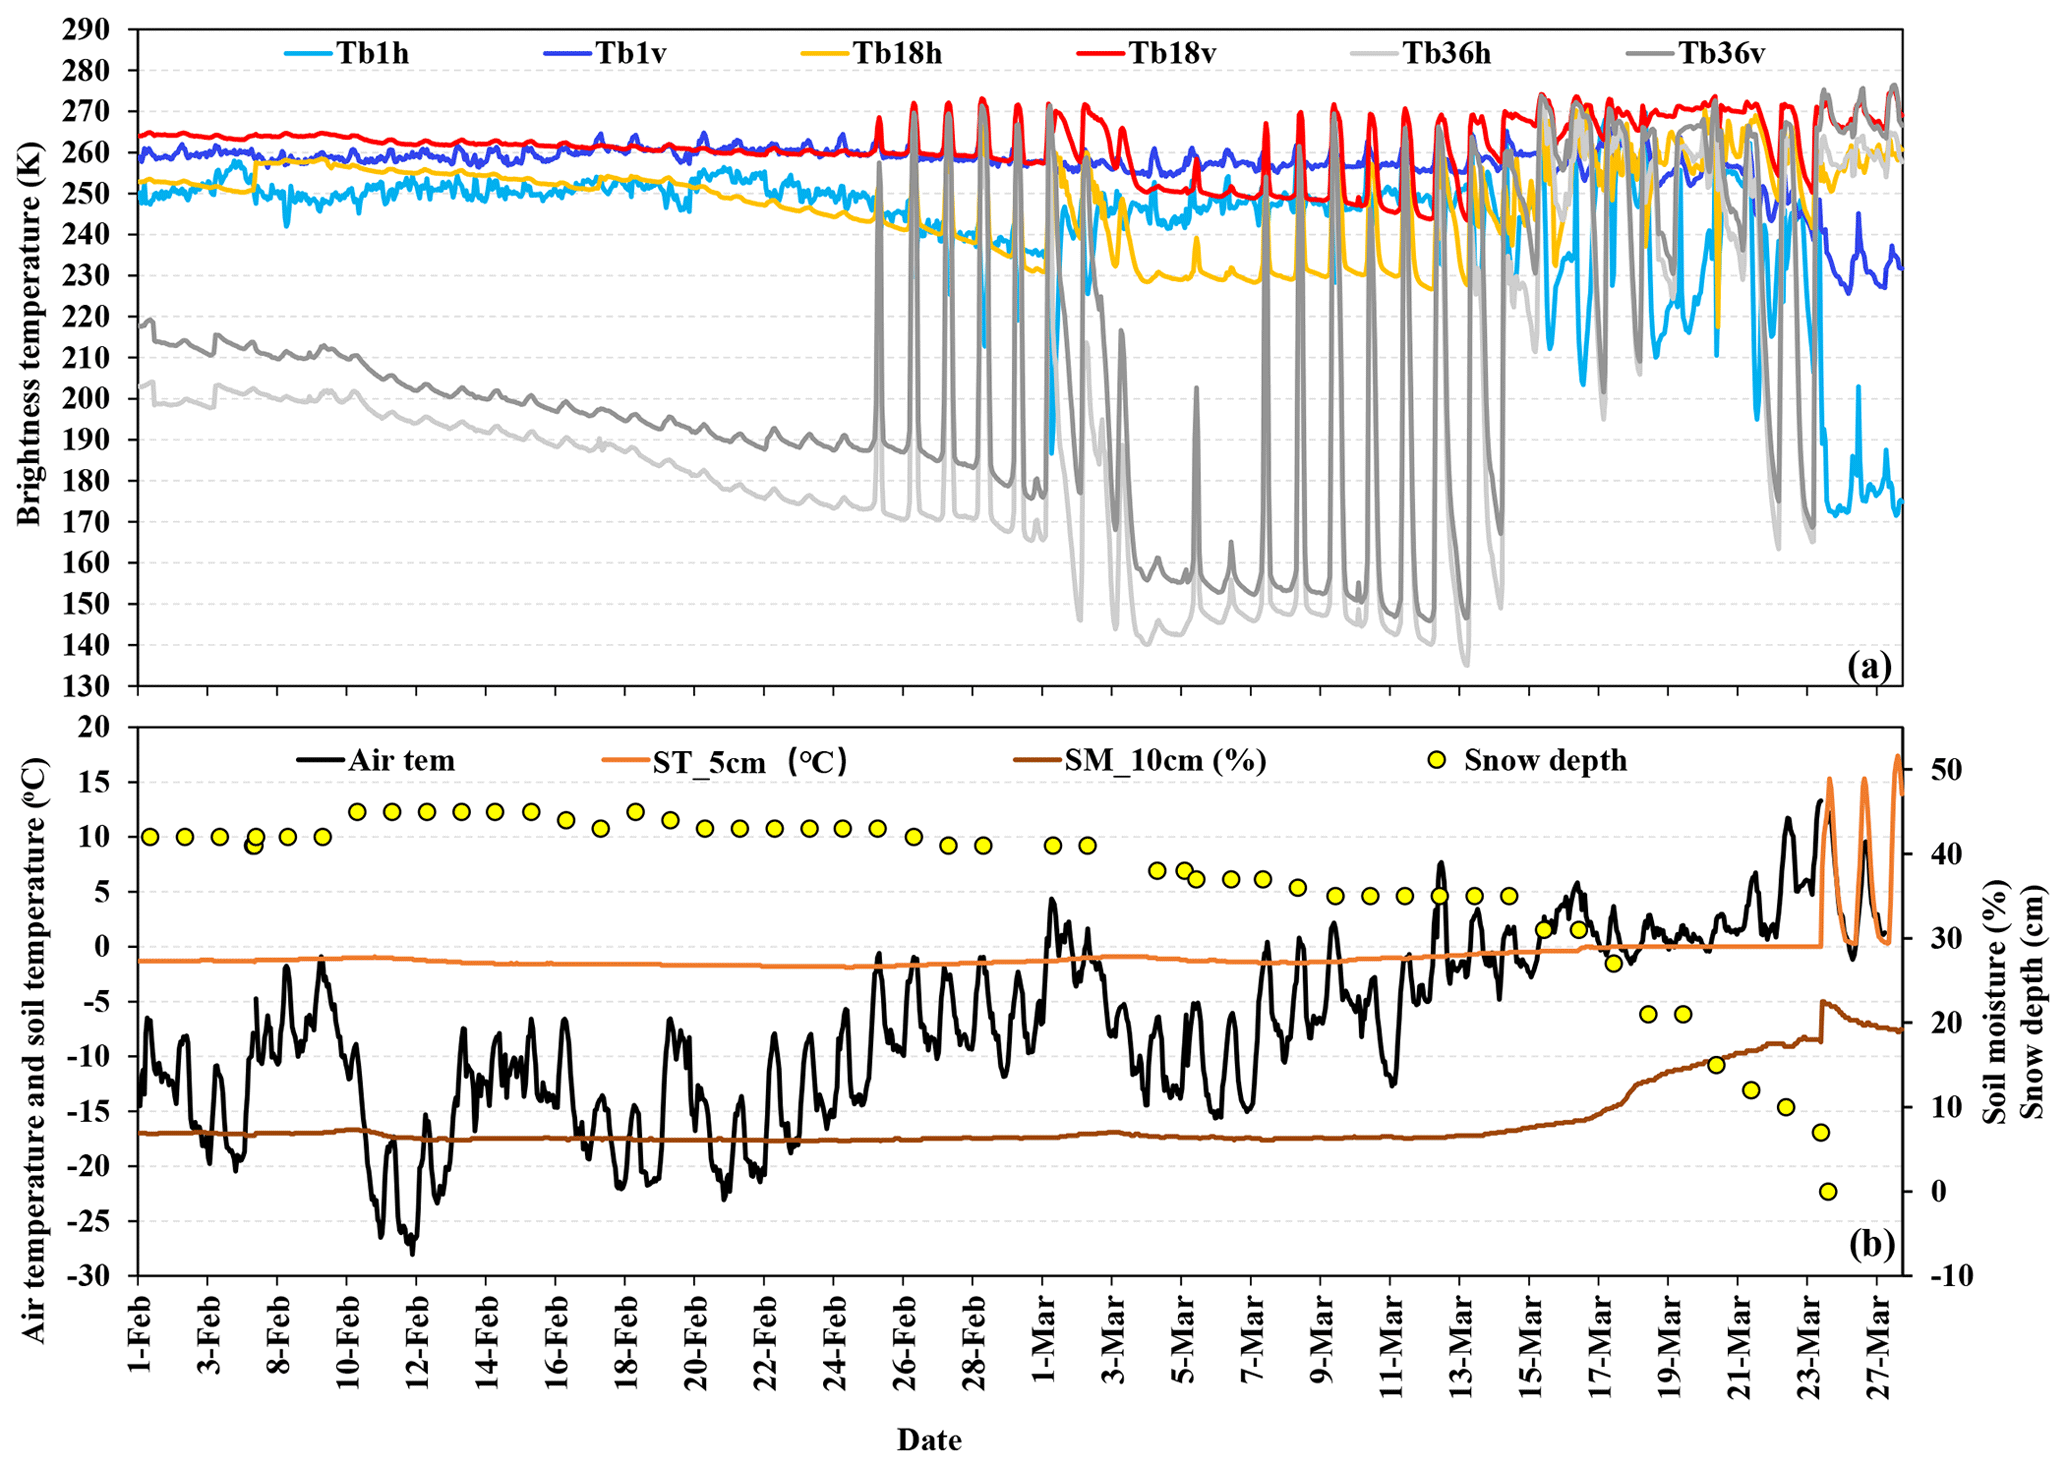
Figure 13Hourly variation in (a) Tb1h, Tb18h, Tb36h, Tb1v, Tb18v, and Tb36v, and (b) air temperature, soil moisture at 10 cm, soil temperature at 5 cm, and daily variation in snow depth, from 1 February to 28 March 2016.
The brightness temperatures at 18.7 and 36.5 GHz from the Advanced Microwave Scanning Radiometer 2 (AMSR-2) and at 1.4 GHz from Soil Moisture Active Passive (SMAP) were compared with the ground-based observations at the overpass time (Fig. 14). Although there were large differences between satellite and ground-based observations, the general temporal patterns were the same. Specifically, the abrupt changes at 18.7 and 36.5 GHz on 3 and 16 March were captured by both satellites and ground-based sensors. Brightness temperatures at 1.4 GHz from both SMAP and ground-based microwave radiometer held stable before 16 March. After this date, however, brightness temperature rapidly decreased because of the increase in soil moisture. The correlation coefficients at both polarizations were approximately 0.96, 0.7, and 0.88 for 36.5, 18.7, and 1.4 GHz, respectively. Satellite-observed brightness temperatures presented less of a decrease trend than ground-based observations. The difference at 36.5 GHz is larger than those at 18.7 and 1.4 GHz. The difference between ground-based and satellite observations might be attributed to the different fields of view.

Figure 14Comparison of brightness temperature between ground-based (o) and satellite-based (s) observations (a) for 36 GHz, (b) for 18 GHz, and (c) for 1.4 GHz.
4.4 Four-component radiation
The land surface albedo is strongly related to the land cover. In this experiment, the downward short-wave radiation presented a general increase after January, while the trend became distinctive after February (Fig. 15). The upward short-wave radiation abruptly increased when the ground was covered by snow (after 21 November), and sharply declined on the snow-off day (25 March). From the first snowfall by the end of January, the ratios between upward and downward short-wave radiation were approximately 95 %. The ratio decreased with snow age, and by the end of snow season, the ratios decreased to approximately 25 % on the snow-off day.
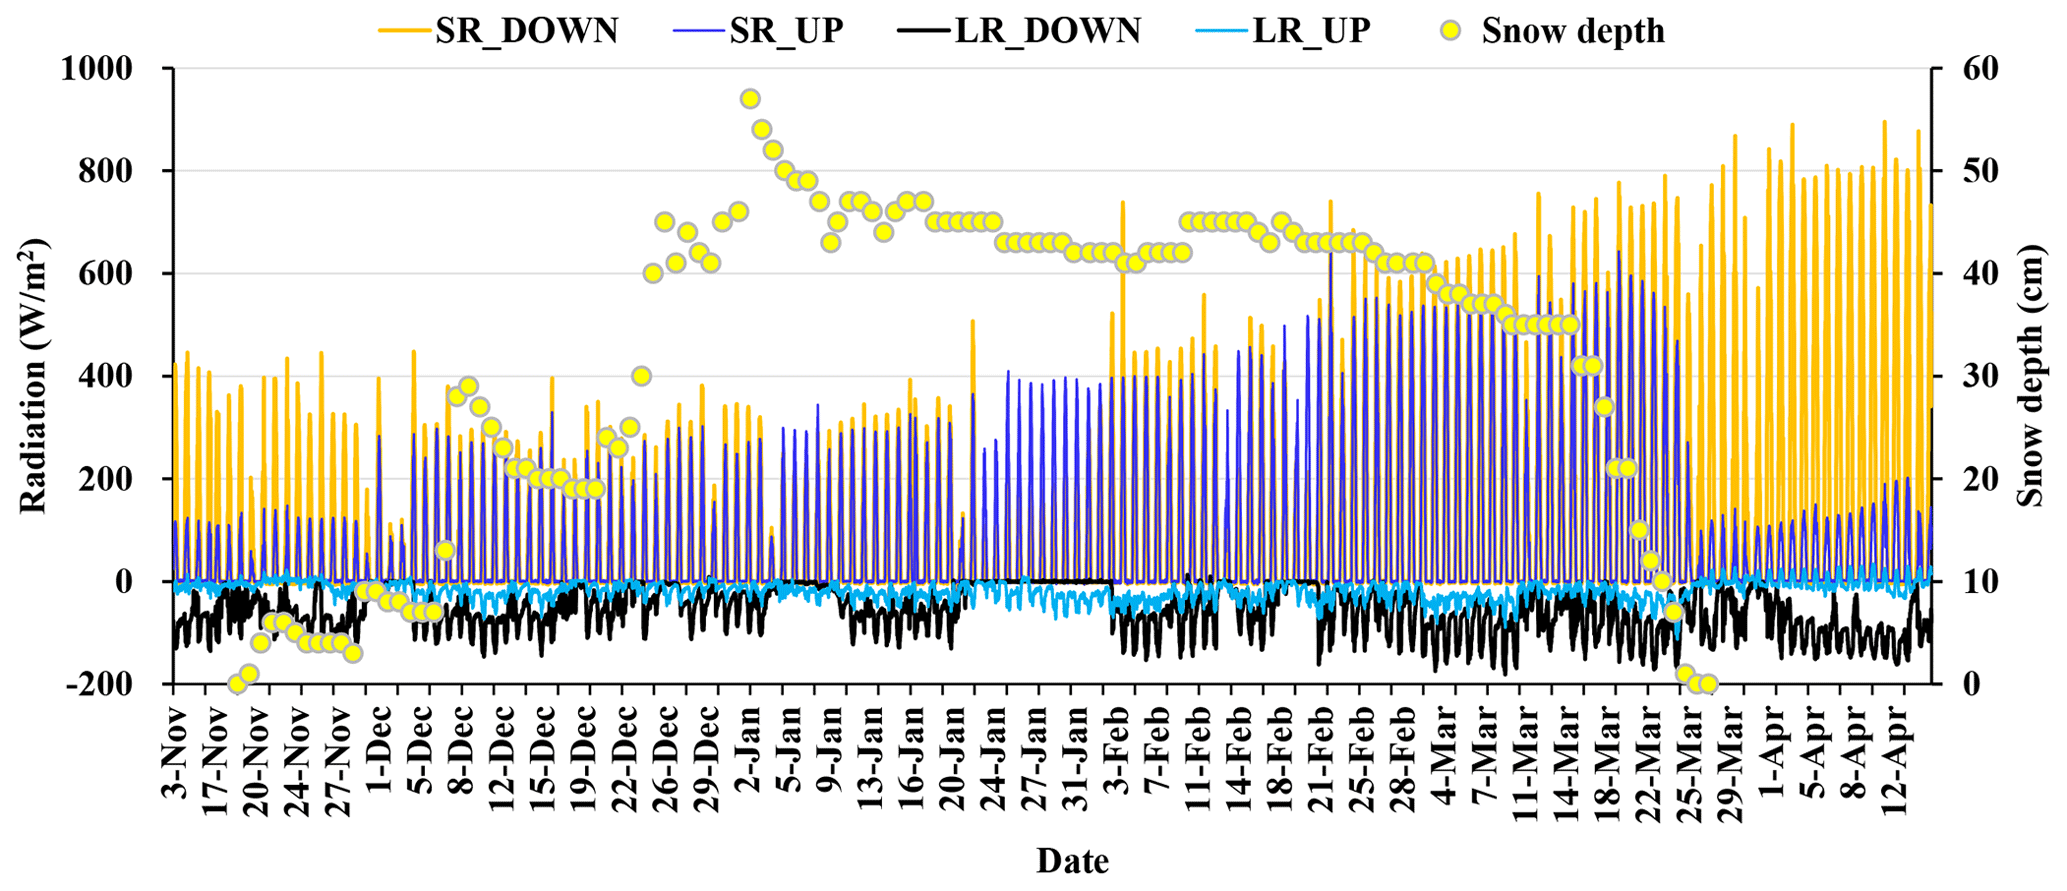
Figure 15Minutely variation in four-component radiation and daily variation in snow depth at the Altay station from 3 November 2015 to 15 April 2016.
5.1 Applications
Our dataset, though for one snow season, provides daily snow pit observations with coincident microwave and optical radiation data, including comprehensive and detailed snow parameters, allowing researchers to find more details in snow characteristics and their relationship with remote-sensing signatures. The dataset also fills the snow observation gap in mid-low snow-depth areas with a relatively short snow-cover duration.
The snow pit data and microwave brightness temperatures have proven to be useful for evaluating and updating a microwave emission transfer model of snowpack (Dai et al., 2022). This dataset reflected a general fact that brightness temperatures at higher frequencies presented stronger volume scattering of snow grains, and were more sensitive to snow characteristics. This experiment revealed that the dominant control for the variation of brightness temperature was the variation of grain size and not snow depth or SWE. In the stable period, the brightness temperature difference between 18.7 and 36.5 GHz increased with growing grain size under the condition of dry snowpack. Therefore, the daily snow depth variations derived from passive microwave remote-sensing datasets tend to exhibit a temporal offset from those of in situ observations.
During the snow season, brightness temperatures for both polarizations presented similar variation trends, though behaving differently in fluctuation. The horizontal polarization was more sensitive to environment and was less stable than the vertical polarization. Furthermore, the polarization difference at 18.7 and 36.5 GHz showed increase and decrease trends, respectively, during the experimental period. This phenomenon was different from the simulation results (Dai et al., 2022). The different polarization behaviors at 18.7 and 36.5 GHz might be related to the environmental conditions, snow characteristics, and soil conditions. However, as the subsurface soil moisture was not observed, the dynamic ground emissivity could not be estimated. As it is known, since the L band has strong penetrability, the brightness temperature variations were predominantly related to subsurface soil conditions, except for the situations in which the liquid water content within snowpack was high. Therefore, under the condition of soil moisture data absence, the L band brightness temperatures were expected to reflect soil moisture variation that influences the soil transmissivity (Babaeian et al., 2019; Naderpour et al., 2017; Hirahara et al., 2020).
Snow surface albedo significantly influences the incoming solar radiation, playing an important role in the climate system. The factors altering snow surface albedo contain the snow characteristics (grain size, SWE, liquid water content, impurities, surface temperature, etc.), external atmospheric conditions and solar zenith angle (Aoki et al., 2003). Snow surface albedo was estimated based on snow surface temperatures in some models (Roesch et al., 1999), while others considered that snow surface albedo was mainly related to snow age (Mabuchi et al., 1997). In this experiment, we obtained the four-component radiation, snow pit and meteorological data, providing nearly all observations of possible influencing factors that could therefore be utilized to analyze the short-wave radiation process of snowpack, and validate or improve multiple-snow-layer albedo models.
Snow grain sizes and snow densities within different layers presented different growth rates during different periods. Generally, the growth rates are related to the air temperature, pressure, and snow depth (Chen et al., 2020; Essery, 2015; Vionnet et al., 2012; Lehning et al., 2002). Therefore, this dataset can be used to analyze the evolution process of snow characteristics, as well as validation data for snow models.
5.2 Uncertainties
During the experiment, some uncertainties were produced due to irresistible factors. It was reported that the sampling depth of the L-band microwave emission under frozen and thawed soil conditions is determined at 2.5 cm (Zheng et al., 2019). We did not collect subsurface soil moisture, and the L-band radiometer observation began on 30 January 2016. Therefore, it is difficult to obtain the ground emissivity in the full snow season based on the data. The soil moisture data at 10 and 20 cm under soil/snow interface cannot directly be used to validate and develop soil moisture retrieval from L-band brightness temperature. In the future, detailed soil moisture profiles will be observed to estimate the subsurface soil moisture.
The grain size data were collected by taking photos. When measuring the length of grains, the grain selection has subjectivity, and the released data are statistic results based on the recorded grain sizes. Although the general variation trend can be reflected by the time series of average grain size, some details might be missed. Therefore, for those who are interested, the original grain photos could be provided by requesting it from the authors. During the snowmelt period, large liquid water content would influence the measurement results of snow fork. Therefore, it is suggested to use a small-sized snow shovel or cutter to observe layered snow density in future experiments.
One seasonal observation is quite valuable for developing and validating a remote-sensing snow retrieval method or snow model, although the representativeness of this observation requires further analysis. Nevertheless, more years of observations should be considered to increase the statistical significance of the evolution of snow characteristics.
The IMCS consolidated datasets are available on the National Tibetan Plateau Data Center and available online at https://doi.org/10.11888/Snow.tpdc.270886 (Dai, 2020). Microwave radiometry raw data are available for scientific use on request from the Northwest Institute of Eco-Environment and Resources (NIEER), Chinese Academy of Sciences (CAS).
In summary, the IMCS campaign provides snow pit observations, meteorological parameters, optical radiation, and passive microwave brightness temperatures in the snow season of 2015–2016. The dataset is unique in providing microwave brightness temperatures and coincident daily snow pit data over a full snow season at a fixed site. The first use of our dataset is for the validation of snow microwave emission models, improving its simulation accuracy.
The daily snow pit data provide snow grain size, grain shape, snow density, and snow temperature profiles. Generally, grain size grew with snow age, and increased from top to bottom. Snow grains have a rounded shape with small grain size in the top layer, and depth hoar with large grain size in the bottom layer. Snow density experienced increase-stable-increase variation, and the densities of the middle layers were greater than those of the bottom layer due to the well-developed depth hoar in the stable period. The data can be used to analyze the evolution process of snow characteristics, combined with weather data, also for the validation and improvement of the snow process models, such as SNOWPACK (Lehning et al., 2002), SNTHERM (Chen et al., 2020), etc. The improvement of these snow process models can further enhance the prediction accuracy of land surface process and hydrology models.
Microwave radiometer data and snow pit data have been utilized to analyze the volume scattering features of snowpack at different frequencies (Dai et al., 2022). Results showed that grain size was the most important factor to influence snow volume scattering. The data can also be used for the analysis of snowpack polarization characteristics, combined with soil and weather data.
The microwave and optical radiations were simultaneously observed. Existing studies reported that the optical equivalent diameter must be used with caution in microwave emission models (Löwe and Picard, 2015; Roy et al., 2013). These data provide a new opportunity to analyze the difference between the influence of grain size on microwave and optical radiation, establishing the bridge between effective optical grain size and microwave grain size.
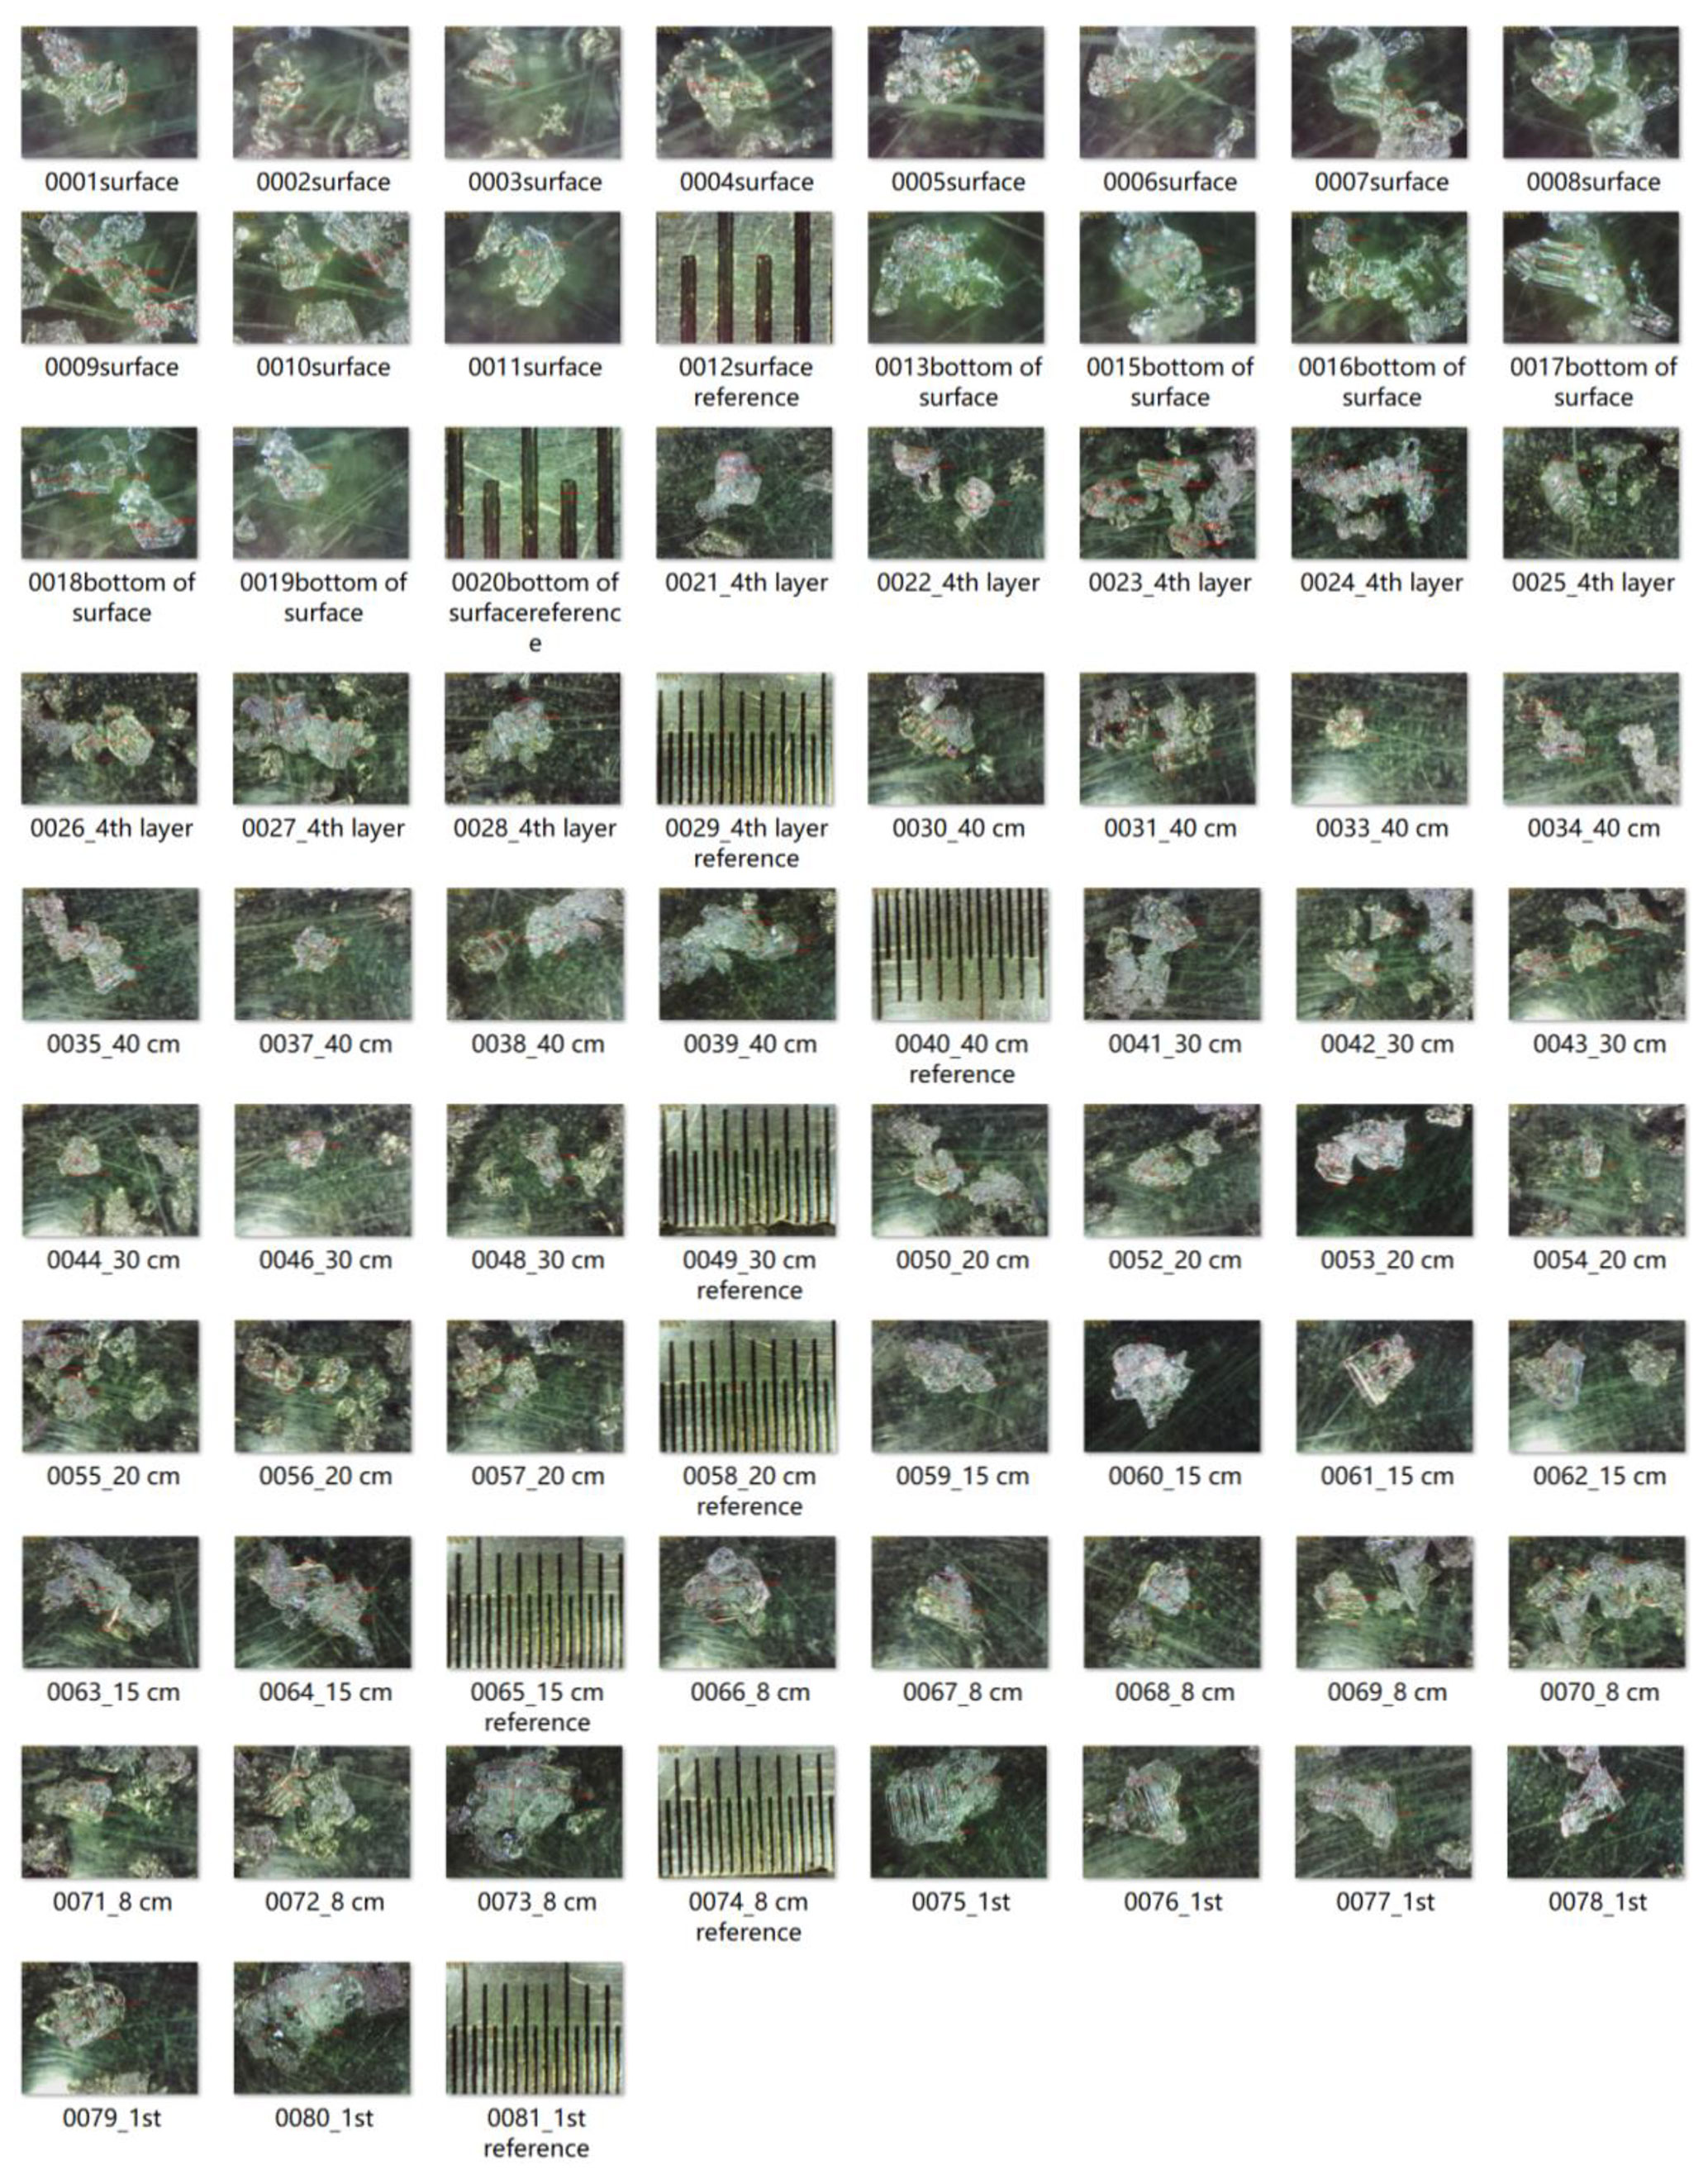
Figure A1Photos of grains and reference ruler in each layer on 15 February 2016. In each photo the lengths of the longest and shortest axes of the chosen grains are labeled. Original photos are in URL: http://arcticroute.tpdc.ac.cn/navigate/bmp (last access: 8 June 2022).
Table A1Recorded lengths of the longest and shortest axes in Fig. A1.
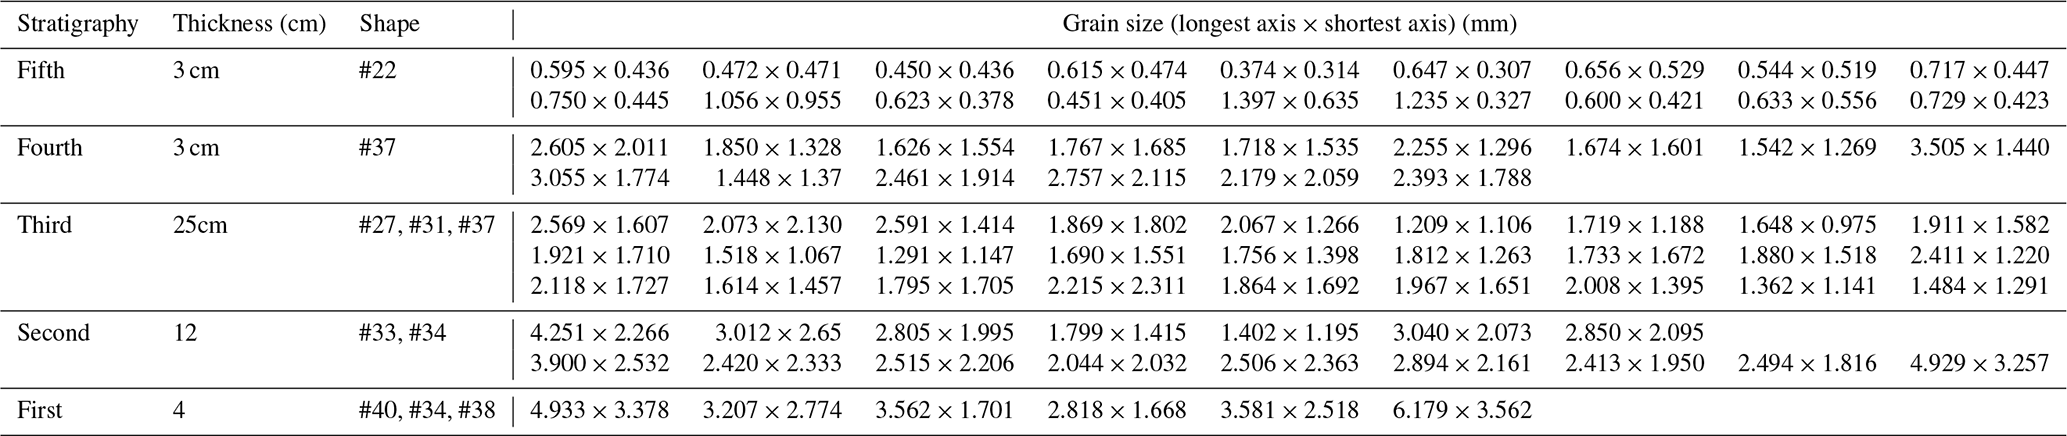
Table A2An example of record table for snow density observation.
LD and TC designed the experiment. LD, YZ, ZR, JT, MA, LX, SZ, YY, YL and LX collected the passive microwave and snow pit data. HL provided the four-component radiation and snow temperature data. LW provided meteorological data. LD wrote the manuscript, and TC made revisions. All the authors contributed to the data consolidation.
The contact author has declared that none of the authors has any competing interests.
Publisher's note: Copernicus Publications remains neutral with regard to jurisdictional claims in published maps and institutional affiliations.
This article is part of the special issue “Extreme environment datasets for the three poles”. It is not associated with a conference.
The authors would like to thank the Altay meteorological station for providing logistics services and meteorological data.
This research was funded by the National Science Fund for Distinguished Young Scholars (grant no. 42125604), National Natural Science Foundation of China (grant no. 42171143), and the “Light of West China” Program from the Chinese Academy of Science (CAS).
This paper was edited by Xin Li and reviewed by four anonymous referees.
Aoki, T., Hachikubo, A., and Hori, M.: Effects of snow physical parameters on shortwave broadband albedos, J. Geophys. Res-Atmos., 108, 4616, https://doi.org/10.1029/2003JD003506, 2003.
Babaeian, E., Sadeghi, M., Jones, S. B., Montzka, C., Vereecken, H., and Tuller, M.: Ground, Proximal, and Satellite Remote Sensing of Soil Moisture, Rev. Geophys., 57, 530–616, https://doi.org/10.1029/2018RG000618, 2019.
Brucker, L., Hiemstra, C., Marshall, H.-P., Elder, K., De Roo, R., Mousavi, M., Bliven, F., Peterson, W., Deems, J., Gadomski, P., Gelvin, A., Spaete, L., Barnhart, T., Brandt, T., Burkhart, J., Crawford, C., Datta, T., Erikstrod, H., Glenn, N., Hale, K., Holben, B., Houser, P., Jennings, K., Kelly, R., Kraft, J., Langlois, A., McGrath, D., Merriman, C., Molotch, N., Nolin, A., Polashenski, C., Raleigh, M., Rittger, K., Rodriguez, C., Roy, A., Skiles, M., Small, E., Tedesco, M., Tennant, C., Thompson, A., Tian, L., Uhlmann, Z., Webb, R., and Wingo, M.: A first overview of snowex ground-based remote sensing activities during the winter 2016–2017, Int. Geosci. Remote Sen., 1391–1394, https://doi.org/10.1109/IGARSS.2017.8127223, 2017.
Chen, T., Pan, J. M., Chang, S. L., Xiong, C., Shi, J. C., Liu, M. Y., Che, T., Wang, L. F., and Liu, H. R.: Validation of the SNTHERM Model Applied for snow depth, grain size, and brightness temperature simulation at meteorological stations in China, Remote Sens., 12, 507, https://doi.org/10.3390/Rs12030507, 2020.
Cline, D., Elder, K., Davis, B., Hardy, J., Liston, G., Imel, D., Yueh, S., Gasiewski, A., Koh, G., Amstrong, R., and Parsons, M.: An overview of the NASA Cold Land Processes Field Experiment (CLPX-2002), P. Soc. Photo-Opt. Ins., 4894, 361–372, https://doi.org/10.1117/12.467766, 2003.
Dai, L.: Microwave radiometry experiment data in Altay (2015/2016), National Tibetan Plateau Data Center [data set], https://doi.org/10.11888/Snow.tpdc.270886, 2020.
Dai, L. Y., Che, T., Xiao, L., Akynbekkyzy, M., Zhao, K., and Leppänen, L.: Improving the Snow Volume Scattering Algorithm in a Microwave Forward Model by Using Ground-Based Remote Sensing Snow Observations, IEEE T. Geosci. Remote., 60, 4300617, https://doi.org/10.1109/TGRS.2021.3064309, 2022.
Derksen, C., Toose, P., Lemmetyinen, J., Pulliainen, J., Langlois, A., Rutter, N., and Fuller, M. C.: Evaluation of passive microwave brightness temperature simulations and snow water equivalent retrievals through a winter season, Remote Sens. Environ., 117, 236–248, https://doi.org/10.1016/j.rse.2011.09.021, 2012.
Essery, R.: A factorial snowpack model (FSM 1.0), Geosci. Model Dev., 8, 3867–3876, https://doi.org/10.5194/gmd-8-3867-2015, 2015.
Fierz, C., Armstrong, R. L., Durand, Y., Etchevers, P., Greene, E., McClung, D. M., Nishimura, K., Satyawali, P. K., and Sokratov, S. A.: The International Classification for Seasonal Snow on the Ground, IHP-VII Technical Documents in Hydrology No. 83, IACS Contribution No. 1, UNESCO-IHP, Paris, 2009.
Hirahara, Y., de Rosnay, P., and Arduini, G.: Evaluation of a microwave emissivity module for snow covered area with CMEM in the ECMWF Integrated Forecasting System, Remote Sens., 12, https://doi.org/10.3390/rs12182946, 2020.
Lehning, M., Bartelt, P., Brown, B., Fierz, C., and Satyawali, P.: A physical SNOWPACK model for the Swiss avalanche warning Part II: Snow microstructure, Cold Reg. Sci. Technol., 35, 147–167, https://doi.org/10.1016/S0165-232x(02)00073-3, 2002.
Lemmetyinen, J., Kontu, A., Pulliainen, J., Vehviläinen, J., Rautiainen, K., Wiesmann, A., Mätzler, C., Werner, C., Rott, H., Nagler, T., Schneebeli, M., Proksch, M., Schüttemeyer, D., Kern, M., and Davidson, M. W. J.: Nordic Snow Radar Experiment, Geosci. Instrum. Method. Data Syst., 5, 403–415, https://doi.org/10.5194/gi-5-403-2016, 2016.
Li, X., Che, T., Li, X. W., Wang, L., Duan, A. M., Shangguan, D. H., Pan, X. D., Fang, M., and Bao, Q.: CASEarth Poles Big Data for the Three Poles, B. Am. Meteorol. Soc., 101, E1475–E1491, https://doi.org/10.1175/Bams-D-19-0280.1, 2020.
Löwe, H. and Picard, G.: Microwave scattering coefficient of snow in MEMLS and DMRT-ML revisited: the relevance of sticky hard spheres and tomography-based estimates of stickiness, The Cryosphere, 9, 2101–2117, https://doi.org/10.5194/tc-9-2101-2015, 2015.
Mabuchi, K., Sato, Y., Kida, H., Saigusa, N., and Oikawa, T.: A biosphere-atmosphere interaction model (BAIM) and its primary verification using grassland data, Pap. Meteorol. Geophys., 47, 115–140, https://doi.org/10.2467/mripapers.47.115, 1997.
Naderpour, R., Schwank, M., Matzler, C., Lemmetyinen, J., and Steffen, K.: Snow Density and Ground Permittivity Retrieved From L-Band Radiometry: A Retrieval Sensitivity Analysis, IEEE J-Stars., 10, 3148–3161, https://doi.org/10.1109/Jstars.2017.2669336, 2017.
Pan, X. D., Guo, X. J., Li, X., Niu, X. L., Yang, X. J., Feng, M., Che, T., Jin, R., Ran, Y. H., Guo, J. W., Hu, X. L., and Wu, A. D.: National Tibetan Plateau Data Center Promoting Earth System Science on the Third Pole, B. Am. Meteorol. Soc., 102, E2062–E78, 2021.
Roesch, A., Gilgen, H., Wild, M., and Ohmura, A.: Assessment of GCM simulated snow albedo using direct observations, Clim. Dynam., 15, 405–418, https://doi.org/10.1007/s003820050290, 1999.
Roy, A., Picard, G., Royer, A., Montpetit, B., Dupont, F., Langlois, A., Derksen, C., and Champollion, N.: Brightness Temperature Simulations of the Canadian seasonal snowpack driven by measurements of the snow specific surface area, IEEE T. Geosci. Remote., 51, 4692–4704, https://doi.org/10.1109/Tgrs.2012.2235842, 2013.
Royer, A., Roy, A., Montpetit, B., Saint-Jean-Rondeau, O., Picard, G., Brucker, L., and Langlois, A.: Comparison of commonly-used microwave radiative transfer models for snow remote sensing, Remote Sens. Environ., 190, 247–259, https://doi.org/10.1016/j.rse.2016.12.020, 2017.
Tedesco, M. and Kim, E. J.: Intercomparison of electromagnetic models for passive microwave remote sensing of snow, IEEE T. Geosci. Remote, 44, 2654–2666, https://doi.org/10.1109/TGRS.2006.873182, 2006.
Vionnet, V., Brun, E., Morin, S., Boone, A., Faroux, S., Le Moigne, P., Martin, E., and Willemet, J.-M.: The detailed snowpack scheme Crocus and its implementation in SURFEX v7.2, Geosci. Model Dev., 5, 773–791, https://doi.org/10.5194/gmd-5-773-2012, 2012.
Zhang, P., Zheng, D., van der Velde, R., Wen, J., Zeng, Y., Wang, X., Wang, Z., Chen, J., and Su, Z.: Status of the Tibetan Plateau observatory (Tibet-Obs) and a 10-year (2009–2019) surface soil moisture dataset, Earth Syst. Sci. Data, 13, 3075–3102, https://doi.org/10.5194/essd-13-3075-2021, 2021.
Zheng, D., Li, X., Wang, X., Wang, Z., Wen, J., van der Velde, R., Schwank, M., and Su, Z.: Sampling depth of L-band radiometer measurements of soil moisture and freeze-thaw dynamics on the Tibetan Plateau, Remote Sens. Environ., 226, 16–25, https://doi.org/10.1016/j.rse.2019.03.029, 2019.
Zheng, D., Li, X., Zhao, T., Wen, J., van der Velde, R., Schwank, M., Wang, X., Wang, Z., and Su, Z.: Impact of soil permittivity and temperature profile on L-Band microwave emission of frozen soil, IEEE T. Geosci. Remote., 59, 4080–4093, https://doi.org/10.1109/TGRS.2020.3024971, 2021.
- Abstract
- Introduction
- Description of experiment setup
- Description of consolidated IMCS dataset
- Overview and preliminary analysis of collected data from IMCS
- Discussion
- Data availability
- Conclusions
- Appendix A
- Author contributions
- Competing interests
- Disclaimer
- Special issue statement
- Acknowledgements
- Financial support
- Review statement
- References