the Creative Commons Attribution 4.0 License.
the Creative Commons Attribution 4.0 License.
 | 20 Jul 2022
A repository of measured soil freezing characteristic curves: 1921 to 2021
Stephan Gruber
Jeffrey M. McKenzie
Soil freeze–thaw processes play a fundamental role in the hydrology, geomorphology, ecology, thermodynamics, and soil chemistry of cold regions' landscapes. In understanding these processes, the temperature of the soil is used as a proxy to represent the partitioning of soil ice and water content via a soil freezing characteristic curve (SFCC). This mathematical construct relates the soil ice content to a specific temperature for a particular soil. SFCCs depend on many factors, including soil properties (e.g., porosity and composition), soil pore water pressure, dissolved salts, (hysteresis in) freezing/thawing point depression, and the degree of saturation, all of which can be site-specific and time-varying characteristics. SFCCs have been measured using various methods for diverse soils since 1921, but, to date, these data have not been broadly compared. This is in part because they had not previously been compiled in a single dataset. The dataset presented in this publication includes SFCC data digitized or received from authors, and it includes both historic and modern studies. The data are stored in an open-source repository, and an R package is available to facilitate their use. Aggregating the data has pointed out some data gaps, namely that there are few studies on coarse soils and comparably few in situ measurements of SFCCs in mountainous environments. It is hoped that this dataset (https://doi.org/10.5281/zenodo.5592825; Devoie et al., 2022a) will aid in the development of SFCC theory and improve SFCC approximations in soil freeze–thaw modelling activities.
- Article
(912 KB) - Full-text XML
- BibTeX
- EndNote


Soil freeze–thaw processes play a fundamental role in the hydrology, geomorphology, ecology, thermodynamics, and soil chemistry of cold regions' landscapes. Due to a changing climate, changes in the timing and magnitude of freeze–thaw events are altering cold regions' systems (Meredith et al., 2019). Modelling tools are needed to predict, understand, and develop adaptive strategies for these changes. Many models of soil freeze–thaw exist (e.g., CAst3M; SUTRA-ICE; SMOKER; FEFLOW-FTM; GeoTop; the model outlined in Endrizzi et al., 2008; and GeoSlope), but all physically based models, including partially frozen soils, rely on a soil freezing characteristic curve (SFCC) to describe the relationship between the unfrozen water content and the temperature in freezing soils (Rühaak et al., 2015; Grenier et al., 2018; McKenzie et al., 2007; Anbergen et al., 2015).
The first SFCC reported in literature was measured in 1921 using the difference in volume between water and ice to measure the ice content of samples below the melting point (Bouyoucos, 1921). Since this first publication, SFCCs have been measured using various techniques in both lab and field settings. Koopmans and Miller (1966), Spaans and Baker (1995), Bittelli et al. (2004), and Azmatch et al. (2012) have extended SFCC data to extrapolate the relationship between water content and matric potential (pressure). This method has the benefit of extending the soil moisture curves to very negative pressures, but it also has some limitations, as presented by Ren and Vanapalli (2019), including the assumption that the liquid and solid phases are in thermodynamic equilibrium, limiting the freeze/thaw rates to very slow speeds (Liu and Si, 2011). The near-zero temperatures where much of the phase change occurs at pressures near the air entry pressure are difficult to accurately resolve, and there are mechanistic differences in the processes, including the formation of air bubbles in drying (which has no analogous behaviour in freezing) and ice nucleation (which has no analogous behaviour in drying). Solutes further complicate this process (Ren and Vanapalli, 2019).
Much of the existing SFCC data have been collected in a lab setting on fine-textured soils, although it is known that the sample history and number of freeze–thaw cycles affect the measured curve (Buehrer and Rose, 1943; Kozlowski, 2004). Few data concerning coarse sands or gravels exist, as they are challenging to measure, and there are few comparisons between data collected on similar soils in different settings or using different techniques. The studies that have been performed show the following: sample preparation is critical in defining outcomes (Kozlowski, 2004); the choice of measurement method may impact outcomes depending on soil texture (Smith and Tice, 1988; Yoshikawa and Overduin, 2005); and there are strong hysteretic effects between freezing and thawing, especially in fine-grained soils (Tian et al., 2014; Lara et al., 2020). Many other patterns and comparisons may be made concerning soil texture, uncertainty and error in measurement, partially saturated soils, and other factors, but they have not been possible due to the inability to compare the wealth of measured data in the literature. Thus, this repository aims not only to support modelling exercises with data-driven SFCC estimates but also to construct more robust comparisons between SFCCs and to improve our understanding of freeze–thaw processes in soils.
2.1 Understanding an SFCC
An example SFCC is shown in Fig. 1. The unfrozen water content is reported on the y axis measured in units of cubic metres unfrozen water per cubic metre of soil, but it is equally valid as a mass fraction or saturation. Theoretically, the unfrozen water content is a smooth, monotonic function of temperature. There are three key features in an SFCC: the initial water content, the bulk melting point, and the residual water content. The total water content is the liquid water in the sample when it is completely thawed, and it encompasses the pore water and water bound to soil particles, independent of solute presence. The bulk melting temperature is the temperature at which phase change is complete when thawing the soil. This temperature is generally depressed below the melting point of pure water (0 ∘C) due to pore geometry and solutes. Many studies have reported a freezing point depression, which describes the initiation of phase change on the freezing limb of the SFCC, generally colder than the bulk melting temperature (Gharedaghloo et al., 2020; Liu and Si, 2011). This hysteresis persists through the SFCC because pore shape affects ice nucleation, as is widely reported in the SFCC literature (Kruse et al., 2018; Chai et al., 2018; Tian et al., 2014; Koopmans and Miller, 1966; Kozlowski, 2009; Hu et al., 2020). Finally, the residual water content is the “unfreezable” water content in the soil: water that is so tightly bound to the soil particles that it remains energetically favourable to remain in liquid form even at temperatures tens of degrees below 0 ∘C (Wettlaufer and Worster, 2006). These features define the shape of the SFCC and vary between soil type, saturation, measurement technique, and sample preparation.
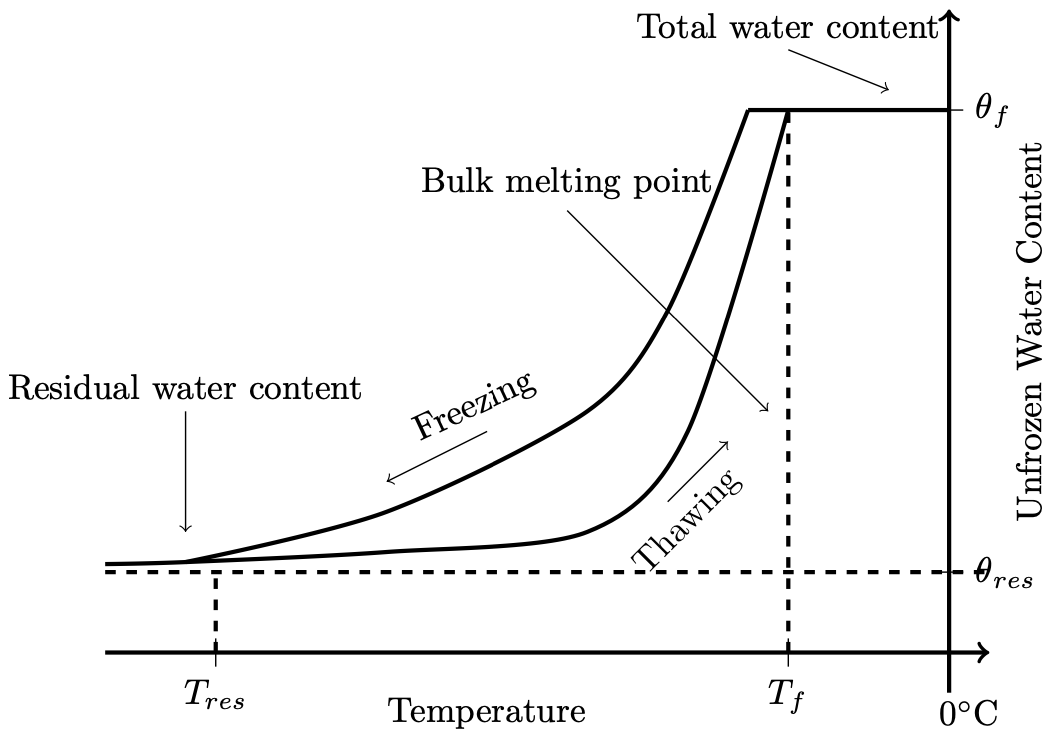
Figure 1A typical soil freezing characteristic curve, composed of separate freezing and thawing limbs to form a hysteretic loop. Steepness, shape, and residual water content depend on soil properties.
2.2 Constructing an SFCC
The SFCC parameterizes the effects of several physical processes that control the unfrozen water content of soils. Along the freezing limb of the SFCC (top curve in Fig. 1), the first water to change from liquid to solid is the pore water. Neglecting the solute content and considering the pore size alone, this water freezes according to the Gibbs–Thomson equation:
where Tm is the melting point temperature of water in soil (K), T0 is the melting point temperature of pure liquid water (273.15 K), γsl is the free energy coefficient of the ice–water interface (0.029 J m−2), ρi is the ice-phase density (917 kg m−3), Lf is the latent heat of phase transformation (3.35×10⁵ J kg−1), and R′ is the pore radius (m). The Gibbs–Thomson equation implies that water in large pores freezes first (Teng et al., 2021; Sliwinska-Bartkowiak et al., 1999; Koopmans and Miller, 1966). This effect contributes to the steepest part of the curve shown in Fig. 1 (Tian et al., 2014). As the curve flattens, the unfrozen water content is progressively composed of more adsorbed water (Tian et al., 2014) that is tightly bound to the soil particles and, depending on the soil type, may form a film that completely separates the ice in the pore space from the soil grains (Jin et al., 2020). Soils in which this liquid water film occurs are termed “solid–liquid–solid” (SLS) soils and are predominantly clays, where soil particles often carry a negative electrical charge (Koopmans and Miller, 1966). Alternatively, “solid-to-solid” (SS) soils have pore ice that is in contact with soil particles, which occurs in, for example, sandy soils (Koopmans and Miller, 1966). The soil type (SLS or SS) defines the residual water content – the liquid water left that does not freeze (or freezes extremely slowly) – as temperature continues to decrease (Jin et al., 2020). For example, studies on clays have found substantial liquid water fractions on the order of 20 m3 m−3 at temperatures as low as −25 ∘C (Bittelli et al., 2004; Kong et al., 2022). The freeze/thaw temperature is further complicated by the presence of solutes that depress the melting point and can play a dominant role in determining the residual water content and shape of the SFCC in saline soils (Amankwah et al., 2021). A detailed study of solute effects is left for future work, and the data presented herein are focused on non-saline systems.
As a result of the complex relationships between soil texture, pore geometry, solute content, melting point depression, soil saturation, and other physical properties of freezing soils, there is a wide range of SFCCs. The above-mentioned physical factors make SFCCs difficult to predict accurately using empirical models that are limited to specific reference or measured soils (Mu et al., 2018; Amiri et al., 2018). Physical models are intended to be more transferable, but they rely on detailed soil parameters (such as the specific surface area of the soil, grain size analysis, and the polarity of soil particles) and other hard-to-collect data (Wang et al., 2017; Bai et al., 2018). It is impractical to obtain this type of distributed information for soils that are generally heterogeneous and spatially variable. Although some research has improved the fitting of models to SFCCs (e.g., Hu et al., 2020), the SFCC data for comparison are generally limited, and no compilation that reports SFCC data such that they might be compared in similar units based on common metadata information currently exists.
2.3 Objective
The aim of this article is to present a repository of the SFCC data found in the literature. This repository is aimed at improving estimates of SFCCs for use in modelling applications for cold regions and to provide potential SFCCs for sites where local data are not available. We provide a compilation of the data, including the relevant metadata, alongside an R package for convenient data extraction and processing.
The literature reporting SFCCs from 1921 to August 2021 is reviewed, and measured SFCCs are either digitized from the figures in publications using the digitizer tool in OriginPro 2021 (OriginLab) or the data are requested from the authors. In total, 254 publications with relevant topics are identified; from these publications, 416 SFCCs are extracted. For each curve, metadata are also captured, including soil data, the measurement technique, and the experimental conditions, when available. The digitized curves along with their metadata are stored in .csv format in an open-source archive for future use, and an R package containing the data and data tools is discussed in Sect. 5. The repository currently contains 30 MB of data, corresponding to approximately 870 000 data points.
The metadata captured alongside the SFCCs identify the measurement procedure (e.g., measurement technique and sample preparation) and the characteristics of the sample to be measured. These characteristics include soil textural data, specific surface area, porosity, and density, when available. The metadata allow potential users to extract the SFCC data relevant to a particular soil in order to estimate the SFCC more accurately. Additional metadata describing measurements made on the warming (thawing) or cooling (freezing) of samples, the units of the original measurement, and the degree of saturation of the sample are included to improve our understanding of the physical freeze–thaw process as well as to better interpret the data reported. In the following subsections, each metadata field is described.
4.1 Measurement methods
Many methods are used to measure SFCCs. The most common methods use the electrical properties of the soil to infer the liquid and frozen water content (capacitance, resistivity, and permittivity), as they are fairly easy to use in laboratory and field settings (Bittelli et al., 2004; Romanovsky and Osterkamp, 2000; Fabbri et al., 2006; Wu et al., 2017; Hu et al., 2020). Some methods focus on measuring the unfrozen water content based on the density or physical properties of the soil, including dilatometry and ultrasound (Koopmans and Miller, 1966; Da-yan et al., 2006), whereas others rely on the atomic structure and energy of the water molecules, including nuclear magnetic resonance (NMR), gamma spectroscopy, X-ray diffraction (XRD), and neutron scattering (Watanabe and Wake, 2009a; Jame and Norum, 1980; Christenson, 2001). These atomic-level methods can distinguish between the types of unfrozen water content, as tightly bound water has different polarization (Watanabe and Wake, 2009a; Chen et al., 2021). Finally the thermal properties of the soil water can be used to establish the unfrozen portion using thermal conductivity, calorimetry (isothermal or adiabatic, differential thermal analysis (DTA), or differential scanning calorimetry (DSC) (Anderson and Tice, 1972; Kozlowski and Nartowska, 2013b). The different measurement techniques are classified according to the physical quantity that they measure in Fig. 2, where it is apparent that most recent measurements are based on the electrical properties of freezing soils, whereas older methods rely on measurements of the thermal or physical properties of the soil. Table A1 in Appendix A presents all of the measurement techniques found in the literature, their key characteristics, and the publications that used this method to determine the SFCC. Readers are directed to an accompanying paper, Devoie et al. (2022b), for a detailed description of each measurement technique and the associated error.

Figure 2Organization of measurement methods according to measurement principle. The size of nodes represents the relative number of SFCCs collected using each method.
4.2 Sample preparation
Although it is possible to use some measurement techniques to measure SFCCs in situ, over 75 % of reported SFCCs were measured in a lab setting. As noted by Buehrer and Rose (1943), when a thawed soil is packed in the lab (reconstituted), its response to freeze–thaw cycling is dependent on the number of freeze–thaw cycles that it has undergone. Kozlowski and Nartowska (2013a) found that the freeze–thaw behaviour of the soils was not yet stabilized after five cycles. This is a major concern when applying lab-measured results to modelling field scenarios, and it should be considered when measuring and using measured SFCCs if the lab measurements are performed on a sample that has not undergone prior freeze–thaw cycling.
Aside from thermal cycling, repacked samples in the lab are often sieved, homogenized, compacted to known densities, and desalinated, making the results difficult to compare to field measurements. They do not include the effects of soil heterogeneity in the small sample volumes tested (Veraart et al., 2016), and they represent simplified systems compared with the processes which occur in the field. Many studies use silica beads of uniform size and shape with distilled water to simplify the measurement process, leading to results that are not easily transferable to field conditions. The presented data repository includes information on the lab or field measurement site as well as whether the soil sample has been disturbed (repacked) before measurement.
4.3 Soil properties
Most measurements of SFCCs in the literature report some soil characteristics – the name of the soil, its grain size distribution, and/or a textural description. Although these metrics are important, they are not systematically reported, and it is difficult to undertake comparisons between studies. For the purpose of the data repository, data regarding the sand, silt, clay, and organic fractions of the soil are reported when possible. If no quantitative soil textural data were provided, the name of the soil, for example, “Walla Walla silt” (Bittelli et al., 2004), is used to classify the soil – in this case as a silt. In this manner, a range of data can be drawn from the repository based on the nature and accuracy of the soil properties required.
Not only is soil texture important in determining the SFCC, but other soil properties play an important role as well. The soil specific surface area (SSA) partially determines the quantity of adsorbed water, which generally correlates with a greater residual unfrozen water content (Dillon and Andersland, 1966). The soil porosity determines the maximal water content of the soil. The soil density helps identify and categorize soils when other properties are not reported. The organic fraction is related to the porous structure of the soil and its capacity to hold water – for example, in closed pores present in peat (Rezanezhad et al., 2012). Although few publications have reported all of these parameters, the parameters that are provided are included in the metadata associated with each entry in the repository.
4.4 Hysteresis
Many studies have reported a difference between the freezing (cooling) and thawing (warming) limb of the SFCC (e.g., Kruse et al., 2018; Chai et al., 2018; Tian et al., 2014; Koopmans and Miller, 1966; Kozlowski, 2009; Hu et al., 2020), but few have reported data for both the freezing and thawing limb. Hysteresis is soil dependent and is most apparent in fine-grained silt and clay soils (Zhang et al., 2020). The freezing process tends to lag behind the thawing process (as seen in Fig. 1) due to ice nucleation that depresses the initiation of freezing (Zhang et al., 2020; Wu et al., 2017), heterogeneity in the thermal conductivity and melting point (Amiri et al., 2018), and the Gibbs–Thomson equation describing the effect of wetting angle and pore geometry on the melting point (Gharedaghloo et al., 2020), where highly wetted soils (hydrophilic) have a larger melting point depression. Ice penetration into small soil pores has a higher interface curvature between the liquid and solid phases than melting and, thus, occurs at colder temperatures than thawing, contributing to the difference in observed rates (Tian et al., 2014; Chai et al., 2018).

Figure 3(a) Freezing (cooling) or thawing (warming) limb prevalence in SFCC data as well as (b) the initial water content prevalence.
The metadata of each SFCC report whether the data were collected along the freezing or thawing limb, if included in the original publication. If no data were provided on the direction of phase change, it is most likely that studies in the lab were performed on the freezing limb, as this is the case for most lab measurements, and these studies make up more than half of the data collected, as seen in Fig. 3a.
4.5 Saturation
Many measurements of SFCCs are performed on a saturated sample (Fig. 3b) to avoid the measurement error associated with dry or partially wet samples – for instance, the reduced dielectric permittivity in time-domain reflectometry (TDR; Watanabe and Wake, 2009a). This simplifies the measurements, as there is only liquid water or ice in the pore spaces. The total saturation of the sample must be presented when reporting an SFCC so that they are comparable. Many authors report the last water to freeze in a soil, i.e., the water that is most tightly bound to the soil particles is also the last water present in a drying soil (Kurylyk and Watanabe, 2013; Teng et al., 2020; Zhou et al., 2020; Dall'Amico et al., 2011). This assumption means that saturated SFCCs can be used as an adequate approximation of unsaturated SFCCs at temperatures where the residual unfrozen water content is less than the water content of the unsaturated soil. The same relation between the unfrozen water content, pressure (saturation), and temperature can be used for both saturated and unsaturated soils at low temperatures (Dall'Amico et al., 2011).
An R package is available to facilitate data exploration (Devoie and Brown, 2022). This package contains the repository as well as some key functions needed to manage the SFCC data. Details on downloading the open-source package and instructions on how to contribute to the dataset are included in the “Data availability” statement. Contributions to this repository are welcome. This section describes the tools available in this package to manage SFCC data.
5.1 Add an SFCC to the repository
The first data tool is a function that takes SFCC data alongside their associated metadata and adds them to a local copy of the existing repository. This file contains the SFCC data and is linked to an index in the metadata file. The metadata file stores all of the information associated with the SFCC. In order to be appropriately interpreted, the SFCC data to be ingested must be prepared according to the data template in Appendix B. The script first verifies that all required data are present and that the data to be ingested do not already exist in the archive before adding them. Users are encouraged to contact the authors in order to contribute their datasets to the larger repository, making them available to the wider cryosphere community. This will also ensure that the accompanying data tools can be applied to the dataset. The Zenodo archive will be updated periodically by the authors (with new user contributions) after detailed assessment of the quality of the data and accuracy of the metadata.
5.2 Retrieve an SFCC from the archive
This function returns the SFCC associated with a specified index from the repository. The units associated with this SFCC are temperature (in ∘C) and the volumetric water content (in m3 m−3 dry soil). In soils that expand during wetting, for example, some clays (Chai et al., 2018), or in samples with excess ice, the volumetric water content may exceed the porosity of the dry soil.
5.3 Find all SFCCs matching specified criteria
This function takes user-specified search terms – for example, soil textural limits, saturation, and specification of field or lab measurement – and combines them to return the indices of the SFCCs that match all (or any) of the specified criteria. This list of indices can then be used with the function described above to return the SFCCs' corresponding data. Figure 4 shows an example of the application of this function used to extract all data from the repository describing sandy soils.
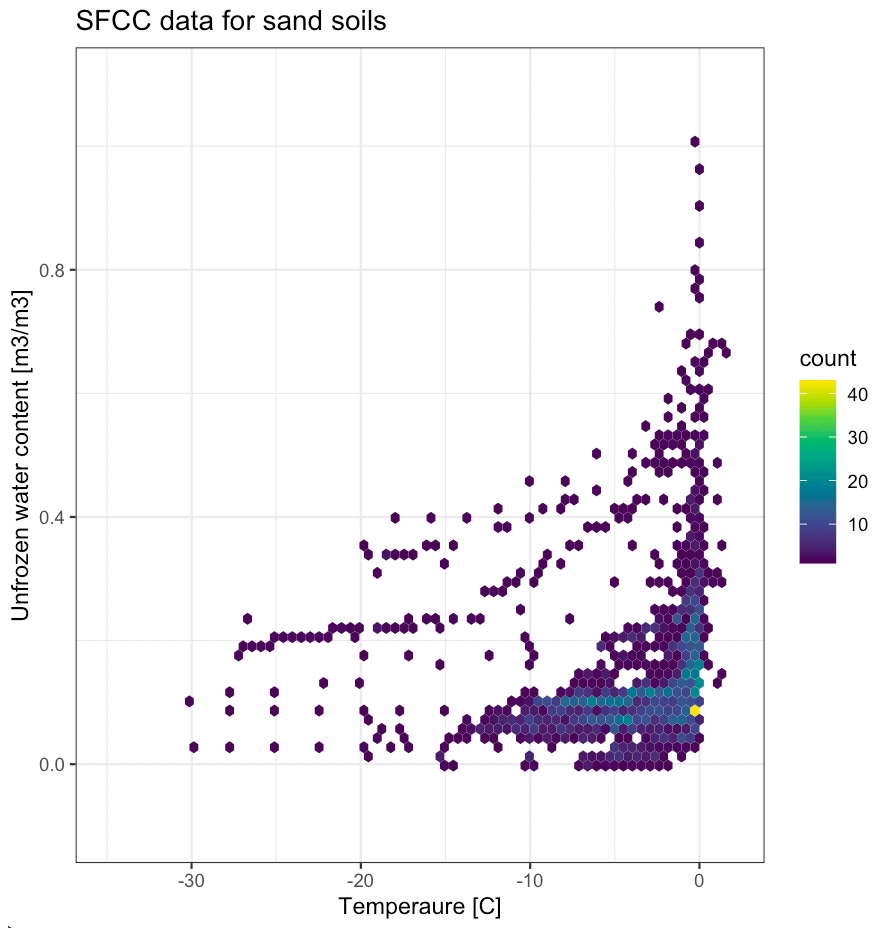
Figure 4Example SFCC data pulled from a repository describing sandy soils. The colour of the grid cells represents data density.
5.4 Error estimation
A current limitation of the repository is the challenge associated with estimating uncertainty in each measurement. This is critical when using the data in modelling applications, but it is seldom reported in the original publications providing SFCC data. The R package will be accompanied by error estimation tools which take all of the information known about the uncertainty in each measurement, including the measurement technique, interactions with various soil types, and hysteretic effects, among others. The error tool provides the main classes of SFCC fitting functions present in the literature and allows the user to obtain uncertainty ranges associated with the data that they extract. More detail is provided in the accompanying paper (Devoie et al., 2022b). The SFCC type curves or generalized estimates for common soil textures are also provided.
The SFCC data in support of this publication are openly available as a Zenodo archive: https://doi.org/10.5281/zenodo.5592825 (Devoie et al., 2022a). This archive will be regularly updated as users contribute to the database. Users are encouraged to cite the original source of the data that they extract from the repository, and a citation is provided with each dataset. The R package, including these data and data tools, is available from the author's GitHub (https://github.com/egdevoie/SFCCRepository; Devoie and Brown, 2022), and work is underway to publish this as a CRAN package.
The data repository presented includes soil freezing characteristic curves collected from literature dating between 1921 and 2021. These data are presented as a Zenodo archive, but they can also be accessed alongside metadata describing each SFCC in an open-source repository designed as an R package (Devoie et al., 2022a; Devoie and Brown, 2022). This package facilitates SFCC data usage, including adding new SFCCs, retrieving SFCC data matching user-specified characteristics, and estimating the error associated with SFCC data. This repository will be useful in modelling soils, as it allows one to estimate not only SFCCs but also to identify the uncertainty associated with these estimates.
Table A1Summary of measurements included in the data repository, organized by the property measured and the measurement method.
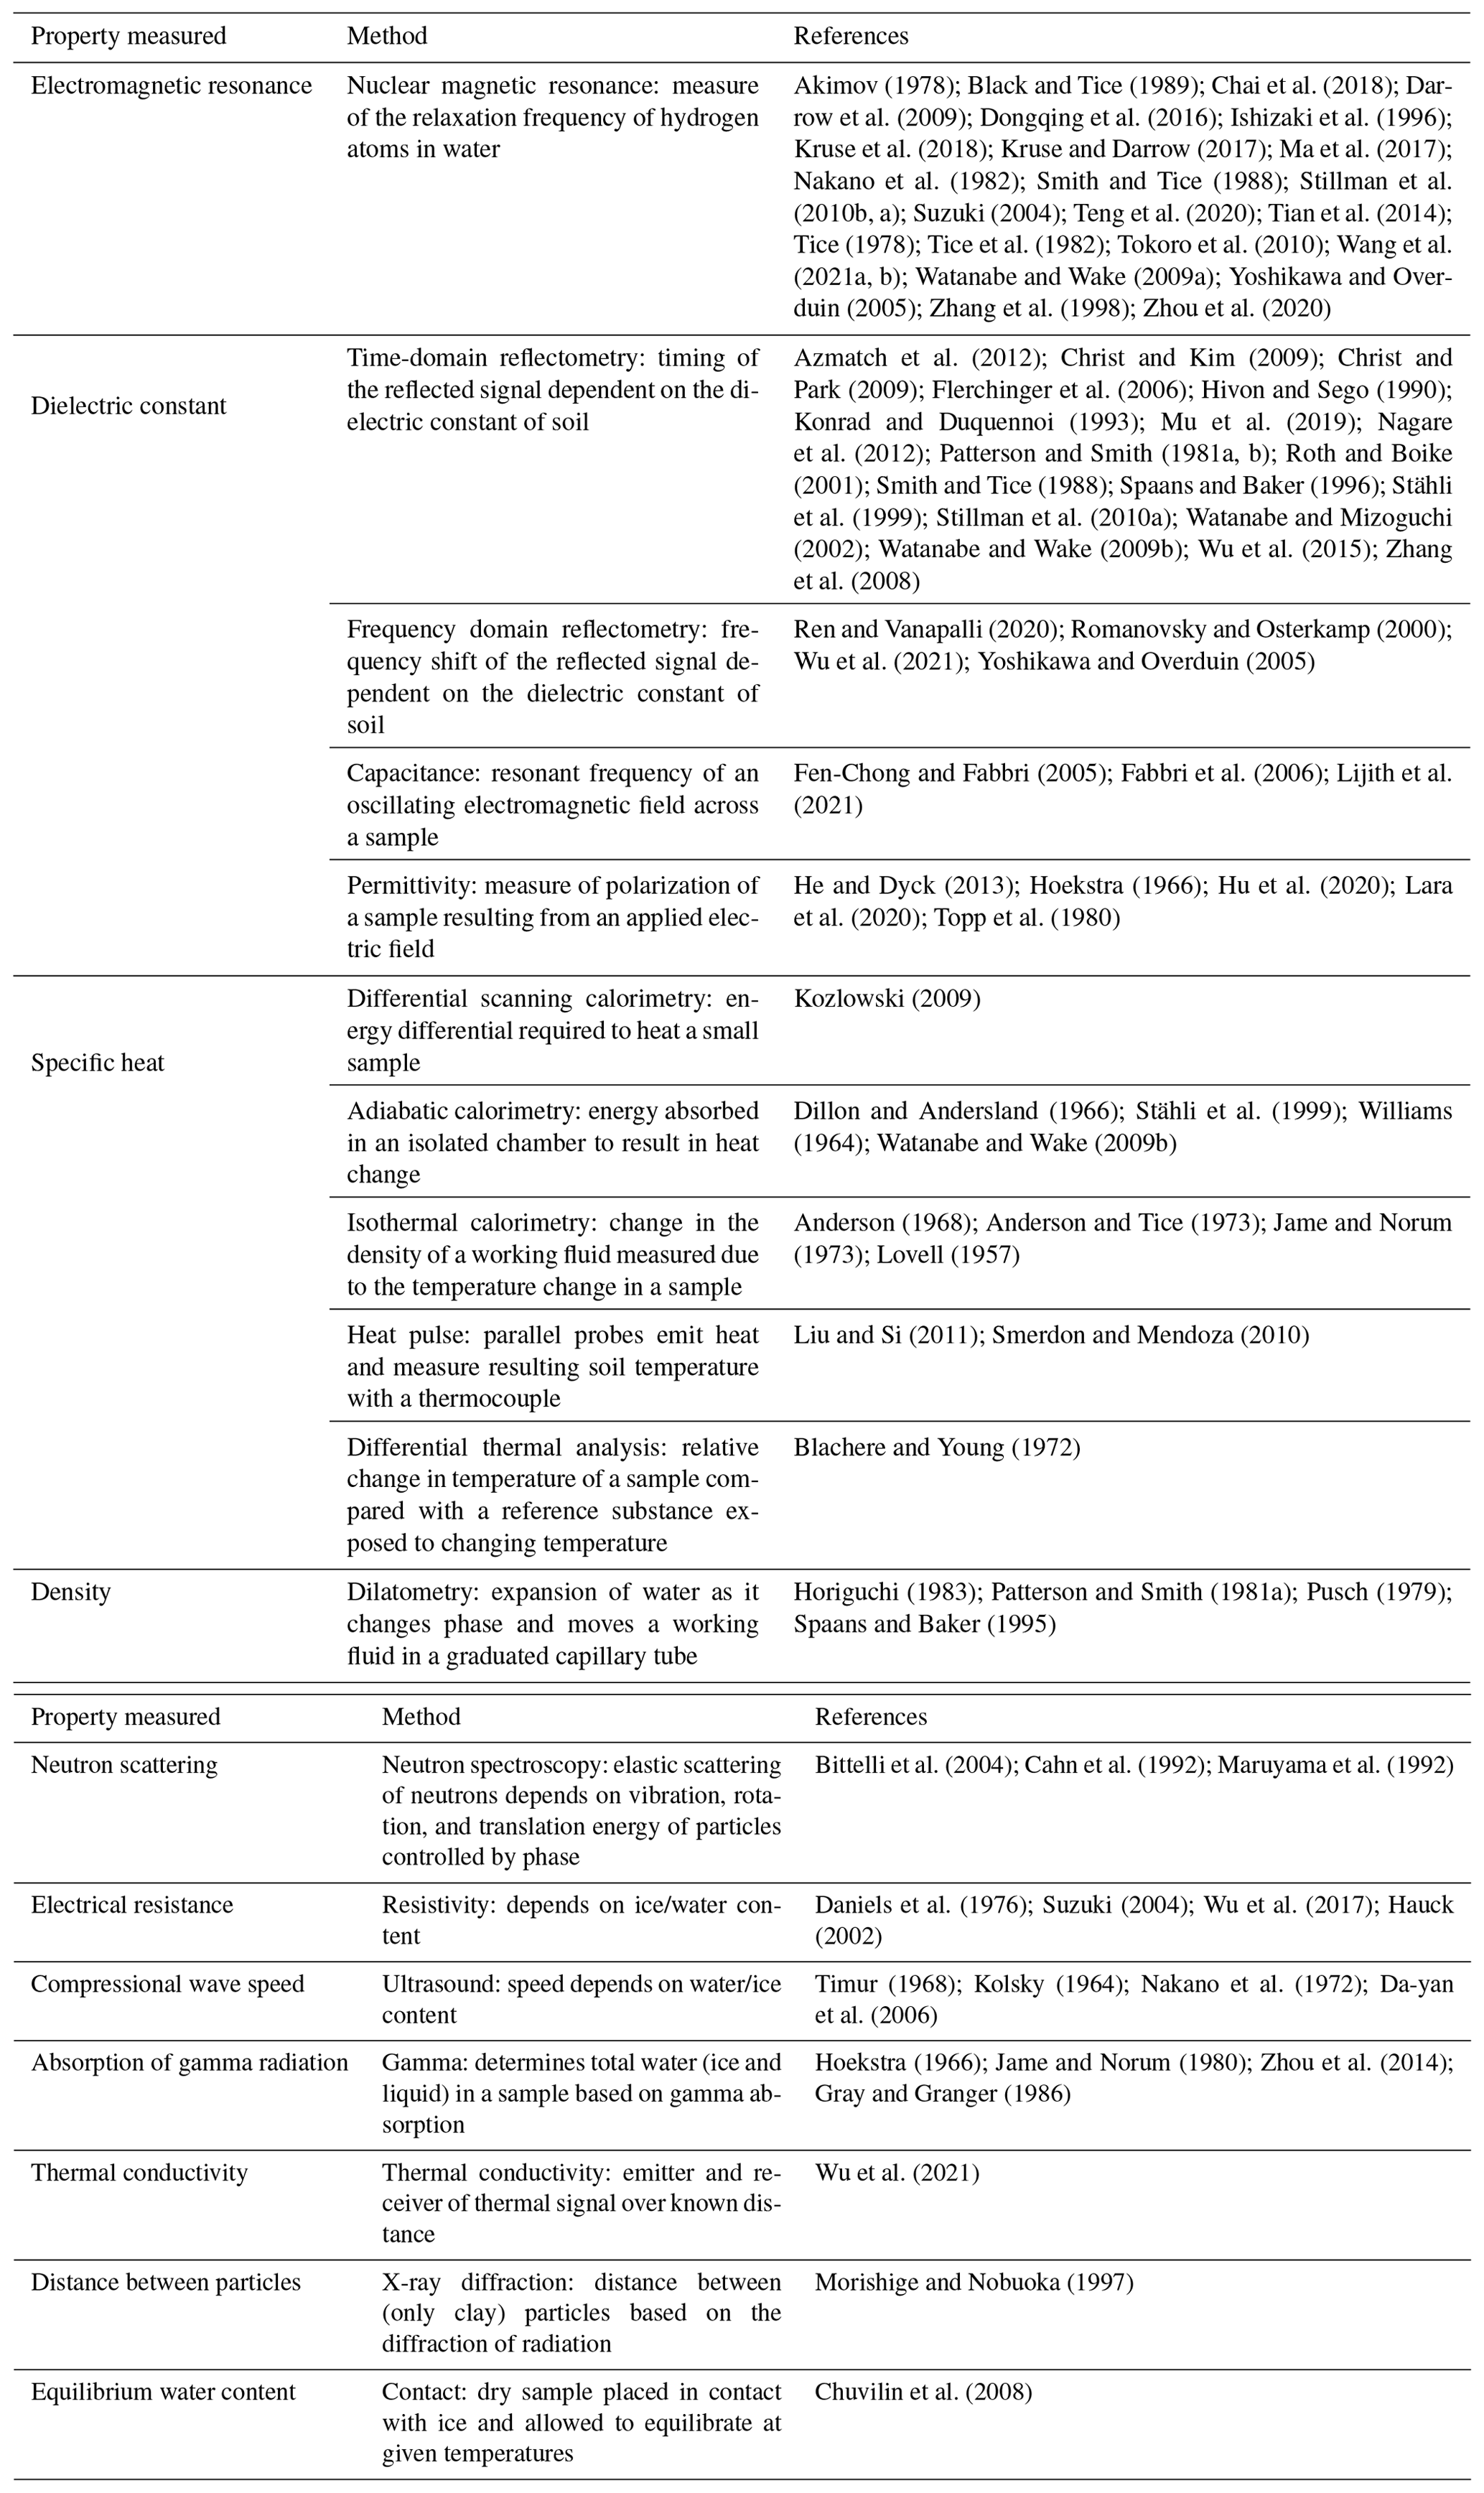
Table B1SFCC data template. Note that if data are reported in different units, the original data are provided alongside the converted data.

Table B2SFCC metadata template. Note that if data are not available, fields should be left empty. n/a – not applicable.
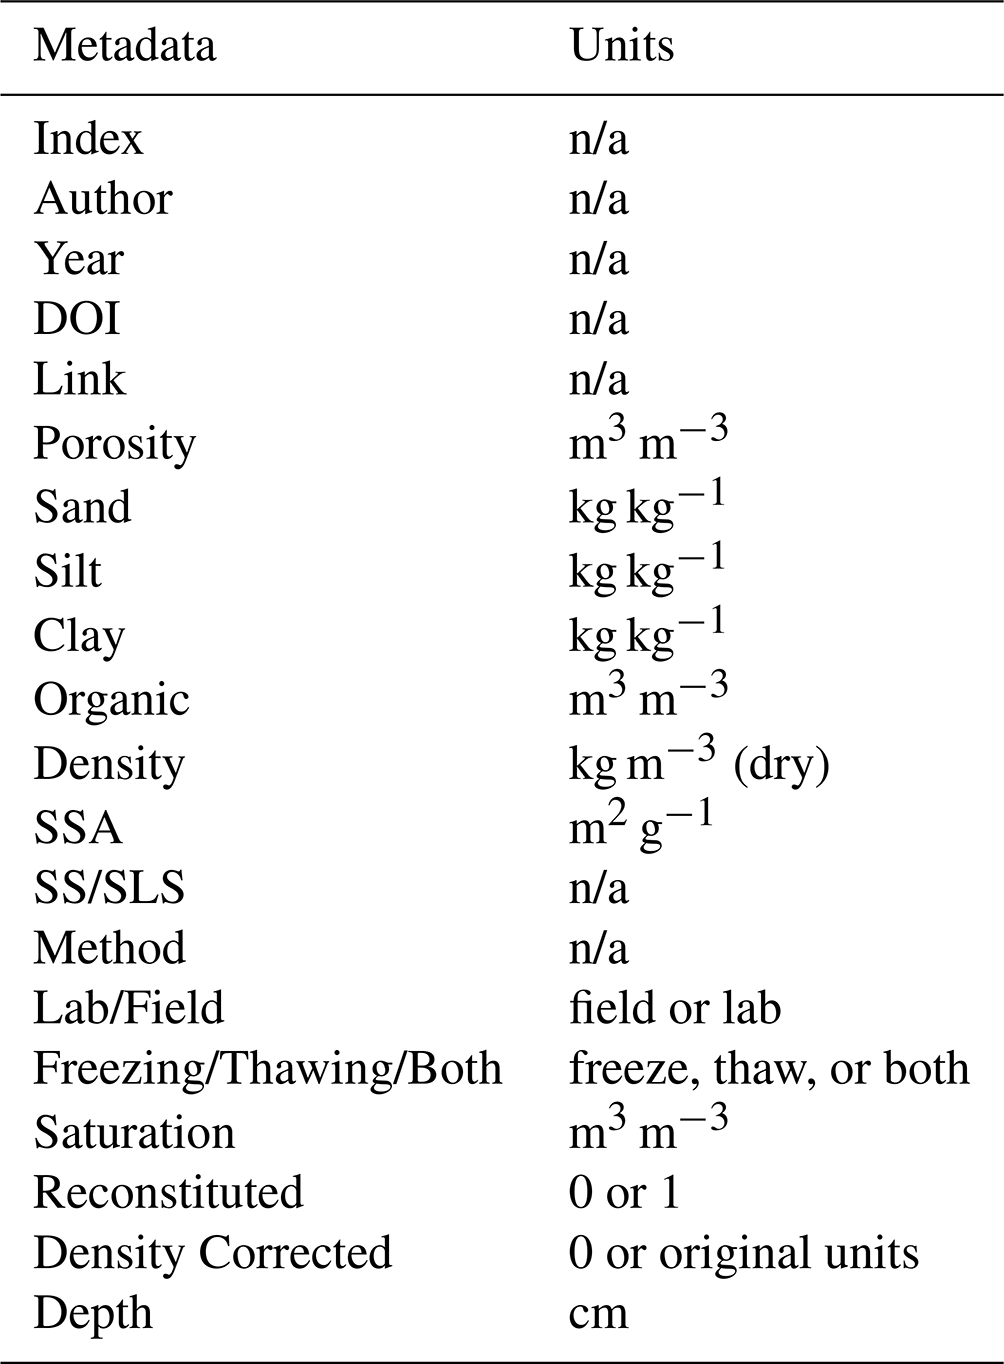
Note that the index field in the SFCC data and metadata templates is a unique value assigned to each data series, and it is used to link the data and the metadata. This field is added by the R package once the submitted data are accepted and added to the repository. In the metadata template (Table B2), the fields should be interpreted as follows: the “Author” field indicates the first author of the publication, “Year” is the year of publication, and “Link” is the DOI leading to the publication. The soil properties then follow, including soil “Porosity”, texture (“Sand”, “Silt”, “Clay”), and “Density”. These are reported either as mass or volume fractions, as is the practice when measuring them. “SSA” refers to the specific surface area of the sample, while “SS” or “SLS” indicates whether the soil grains interact directly with each other (SS) or include a liquid boundary layer between soil grains (SLS). These data are frequently unavailable. Finally, there are data regarding the sample collection technique that indicate if the data are collected in the “Lab” or in the “Field”, which limb (“Freezing/Thawing/Both”) of the SFCC is measured, the degree of “Saturation” of the sample, and whether the sample is undisturbed or “Reconstituted” from a dried, packed, soil sample. Finally there is a flag (“Density Corrected”) to indicate if the measurement units were different from cubic metres per metre ( m3 m−3) and if unit conversion was necessary. If the units were converted, the original units are included in this field, and if the data are reported in cubic metres per metre ( m3 m−3), the value is zero. If the measurement was made in the field or if there are data regarding the soil sampling “Depth”, these are also included.
ÉGD gathered data, constructed the repository, developed the R package, and drafted the manuscript. SG and JMM provided recommendations, revised the manuscript, and assisted with structuring data.
The contact author has declared that none of the authors has any competing interests.
Publisher's note: Copernicus Publications remains neutral with regard to jurisdictional claims in published maps and institutional affiliations.
The authors would like to acknowledge Nick Borwn for significant contributions to the R package development, Julia Boike and Gerald Flershinger for providing data, and Oleksii Sherepenko for assistance with digitizing the data.
This research has been supported by the Natural Sciences and Engineering Research Council of Canada (grant no. PDF - 557503 - 2021).
This paper was edited by Hanqin Tian and reviewed by two anonymous referees.
Akimov, Y. P.: Sravnitelnaya ocenka metodov opredelenya soderzanya niezamierzszey vody v merzlyh gruntah (Assessment of methods to determine the unfrozen water content in frozen soils, in Russian), Merzlotnye Issledovania, 17, 190–195, 1978. a
Amankwah, S., Ireson, A., Maulé, C., Brannen, R., and Mathias, S.: A Model for the Soil Freezing Characteristic Curve That Represents the Dominant Role of Salt Exclusion, Water Resour. Res., 57, e2021WR030070, https://doi.org/10.1029/2021WR030070, 2021. a
Amiri, E. A., Craig, J. R., and Kurylyk, B. L.: A theoretical extension of the soil freezing curve paradigm, Adv. Water Resour., 111, 319–328, https://doi.org/10.1016/j.advwatres.2017.11.021, 2018. a, b
Anbergen, H., Rühaak, W., Frank, J., and Sass, I.: Numerical simulation of a freeze–thaw testing procedure for borehole heat exchanger grouts, Can. Geotech. J., 52, 1087–1100, https://doi.org/10.1139/cgj-2014-0177, 2015. a
Anderson, D. M.: Undercooling, freezing point depression, and ice nucleation of soil water, Israel J. Chem., 6, 349–355, 1968. a
Anderson, D. M. and Tice, A. R.: Predicting unfrozen water contents in frozen soils from surface area measurements, Highway Res. Record, 393, 12–18, 1972. a
Anderson, D. M. and Tice, A. R.: The Unfrozen Interfacial Phase in Frozen Soil Water Systems, in: Ecological Studies, Springer Berlin Heidelberg, 107–124, https://doi.org/10.1007/978-3-642-65523-4_12, 1973. a
Azmatch, T. F., Sego, D. C., Arenson, L. U., and Biggar, K. W.: New ice lens initiation condition for frost heave in fine-grained soils, Cold Reg. Sci. Technol., 82, 8–13, https://doi.org/10.1016/j.coldregions.2012.05.003, 2012. a, b
Bai, R., Lai, Y., Zhang, M., and Yu, F.: Theory and application of a novel soil freezing characteristic curve, Appl. Therm. Eng., 129, 1106–1114, 2018. a
Bittelli, M., Flury, M., and Roth, K.: Use of dielectric spectroscopy to estimate ice content in frozen porous media, Water Resour. Res., 40, W04212, https://doi.org/10.1029/2003wr002343, 2004. a, b, c, d, e
Blachere, J. R. and Young, J. E.: The Freezing Point of Water in Porous Glass, J. Am. Ceram. Soc., 55, 306–308, https://doi.org/10.1111/j.1151-2916.1972.tb11291.x, 1972. a
Black, P. B. and Tice, A. R.: Comparison of soil freezing curve and soil water curve data for Windsor sandy loam, Water Resour. Res., 25, 2205–2210, https://doi.org/10.1029/wr025i010p02205, 1989. a
Bouyoucos, G.: A new classification of the soil moisture, Soil Sci., 11, 33–48, https://doi.org/10.1097/00010694-192101000-00002, 1921. a
Buehrer, T. F. and Rose, M.: Studies in soil structure V. Bound water in normal and puddled soils, College of Agriculture, University of Arizona (Tucson, AZ), 1943. a, b
Cahn, J., Dash, J., and Fu, H.: Theory of ice premelting in monosized powders, J. Cryst. Growth, 123, 101–108, https://doi.org/10.1016/0022-0248(92)90014-a, 1992. a
Chai, M., Zhang, J., Zhang, H., Mu, Y., Sun, G., and Yin, Z.: A method for calculating unfrozen water content of silty clay with consideration of freezing point, Appl. Clay Sci., 161, 474–481, 2018. a, b, c, d, e
Chen, Y., Zhou, Z., Wang, J., Zhao, Y., and Dou, Z.: Quantification and division of unfrozen water content during the freezing process and the influence of soil properties by low-field nuclear magnetic resonance, J. Hydrol., 602, 126719, https://doi.org/10.1016/j.jhydrol.2021.126719, 2021. a
Christ, M. and Kim, Y.-C.: Experimental study on the physical-mechanical properties of frozen silt, KSCE J. Civ. Eng., 13, 317–324, https://doi.org/10.1007/s12205-009-0317-z, 2009. a
Christ, M. and Park, J.-B.: Ultrasonic technique as tool for determining physical and mechanical properties of frozen soils, Cold Reg. Sci. Technol., 58, 136–142, https://doi.org/10.1016/j.coldregions.2009.05.008, 2009. a
Christenson, H. K.: Confinement effects on freezing and melting, J. Phys., 13, R95, https://doi.org/10.1088/0953-8984/13/11/201, 2001. a
Chuvilin, E., Guryeva, O., Istomin, V., and Safonov, S.: Experimental method for determination of the residual equilibrium water content in hydrate-saturated natural sediments, in: Proceedings of the 6th International Conference on Gas Hydrates (ICGH 2008), Vancouver, British Columbia, Canada, vol. 8, 2008. a
Dall'Amico, M., Endrizzi, S., Gruber, S., and Rigon, R.: A robust and energy-conserving model of freezing variably-saturated soil, The Cryosphere, 5, 469–484, https://doi.org/10.5194/tc-5-469-2011, 2011. a, b
Daniels, J. J., Keller, G. V., and Jacobson, J.: Computer-assisted interpretation of electromagnetic soundings over a permafrost section, Geophysics, 41, 752–765, 1976. a
Darrow, M. M., Huang, S. L., and Akagawa, S.: Adsorbed cation effects on the frost susceptibility of natural soils, Cold Reg. Sci. Technol., 55, 263–277, https://doi.org/10.1016/j.coldregions.2008.08.002, 2009. a
Da-yan, W., Yuan-lin, Z., Wei, M., and Yong-hong, N.: Application of ultrasonic technology for physical‚Äìmechanical properties of frozen soils, Cold Reg. Sci. Technol., 44, 12–19, https://doi.org/10.1016/j.coldregions.2005.06.003, 2006. a, b
Devoie, E. and Brown, N.: SFCC Repository, https://github.com/egdevoie/SFCCRepository, last access: 14 July 2022. a, b, c
Devoie, É. G., Gruber, S., and McKenzie, J.: A Repository of 100+ Years of Measured Soil Freezing Characteristic Curves, Zenodo [data set], https://doi.org/10.5281/zenodo.5592825, 2022a. a, b, c
Devoie, É. G., Gruber, S., and McKenzie, J.: A Synthesis of Measured Soil Freezing Characteristic Curves: Sources of Error and Guidelines for Estimation, in preparation, 2022b. a, b
Dillon, H. B. and Andersland, O.: Predicting unfrozen water contents in frozen soils, Can. Geotech. J., 3, 53–60, 1966. a, b
Dongqing, L., Xing, H., Feng, M., and Yu, Z.: The Impact of Unfrozen Water Content on Ultrasonic Wave Velocity in Frozen Soils, Proc. Eng., 143, 1210–1217, https://doi.org/10.1016/j.proeng.2016.06.114, 2016. a
Endrizzi, S., Rigon, R., and DallAmico, M.: A soil freeze/thaw model through the soil water characteristic curve, in: Extended Abstracts, Ninth International Conference on Permafrost, Fairbanks, Alaska, vol. 3, p. 2008, 2008. a
Fabbri, A., Fen-Chong, T., and Coussy, O.: Dielectric capacity, liquid water content, and pore structure of thawing‚Äìfreezing materials, Cold Reg. Sci. Technol., 44, 52–66, https://doi.org/10.1016/j.coldregions.2005.07.001, 2006. a, b
Fen-Chong, T. and Fabbri, A.: Freezing and thawing porous media: experimental study with a dielectric capacitive method, C. R. Mecanique, 333, 425–430, 2005. a
Flerchinger, G., Seyfried, M., and Hardegree, S.: Using soil freezing characteristics to model multi-season soil water dynamics, Vadose Zone J., 5, 1143–1153, 2006. a
Gharedaghloo, B., Berg, S. J., and Sudicky, E. A.: Water freezing characteristics in granular soils: Insights from pore-scale simulations, Adv. Water Resour., 143, 103681, https://doi.org/10.1016/j.advwatres.2020.103681, 2020. a, b
Gray, D. and Granger, R.: In situ measurements of moisture and salt movement in freezing soils, Can. J. Earth Sci., 23, 696–704, 1986. a
Grenier, C., Anbergen, H., Bense, V., Chanzy, Q., Coon, E., Collier, N., Costard, F., Ferry, M., Frampton, A., Frederick, J., Goncalves, J., Holem, J., Jost, A., Kokh, S., Kurylyk, B., McKenzie, J., Molson, J., Mouche, E., Orgogozo, L., Pannetier, R., Riviere, A., Roux, N., Ruhaak, W., Scheidegger, J., Selroos, J.-O., Therriern, R., Vidstrand, P., and Voss, C.: Groundwater flow and heat transport for systems undergoing freeze-thaw: Intercomparison of numerical simulators for 2D test cases, Adv. Water Resour., 114, 196–218, https://doi.org/10.1016/j.advwatres.2018.02.001, 2018. a
Hauck, C.: Frozen ground monitoring using DC resistivity tomography, Geophys. Res. Lett., 29, 2016, https://doi.org/10.1029/2002GL014995, 2002. a
He, H. and Dyck, M.: Application of multiphase dielectric mixing models for understanding the effective dielectric permittivity of frozen soils, Vadose Zone J., 12, 1–22, https://doi.org/10.2136/vzj2012.0060, 2013. a
Hivon, E. and Sego, D.: Determination of the unfrozen water content of saline permafrost using time-domain reflectometry (TDR), in: Proceedings of the 5th Canadian Permafrost Conference, Univ. Laval Quebec City, Quebec, Canada, 257–262, 1990. a
Hoekstra, P.: Moisture movement in soils under temperature gradients with the cold-side temperature below freezing, Water Resour. Res., 2, 241–250, 1966. a, b
Horiguchi, K.: Hydraulic conductivity of frozen earth materials, in: Proc. 4th Intl. Conf. Permafrost, Natl. Acad. Press, 504–509, 1983. a
Hu, G., Zhao, L., Zhu, X., Wu, X., Wu, T., Li, R., Xie, C., and Hao, J.: Review of algorithms and parameterizations to determine unfrozen water content in frozen soil, Geoderma, 368, 114277, https://doi.org/10.1016/j.geoderma.2020.114277, 2020. a, b, c, d, e
Ishizaki, T., Maruyama, M., Furukawa, Y., and Dash, J.: Premelting of ice in porous silica glass, J. Cryst. Growth, 163, 455–460, https://doi.org/10.1016/0022-0248(95)00990-6, 1996. a
Jame, Y.-W. and Norum, D.: Phase composition of a partially frozen soil, Agricultural Engineering Department, University of Saskatchewan, 1973. a
Jame, Y.-W. and Norum, D. I.: Heat and mass transfer in a freezing unsaturated porous medium, Water Resour. Res., 16, 811–819, 1980. a, b
Jin, X., Yang, W., Gao, X., Zhao, J.-Q., Li, Z., and Jiang, J.: Modeling the unfrozen water content of frozen soil based on the absorption effects of clay surfaces, Water Resour. Res., 56, e2020WR027482, https://doi.org/10.1029/2020WR027482, 2020. a, b
Kolsky, H.: Stress waves in solids, J. Sound Vib., 1, 88–110, 1964. a
Kong, L., Yu, A., Liang, K., and Qi, J.: Influence of bimodal structure on the soil freezing characteristic curve in expansive soils, Cold Reg. Sci. Technol., 194, 103437, https://doi.org/10.1016/j.coldregions.2021.103437, 2022. a
Konrad, J.-M. and Duquennoi, C.: A model for water transport and ice lensing in freezing soils, Water Resour. Res., 29, 3109–3124, https://doi.org/10.1029/93wr00773, 1993. a
Koopmans, R. W. R. and Miller, R. D.: Soil Freezing and Soil Water Characteristic Curves, Soil Sci. Soc. Am. J., 30, 680–685, https://doi.org/10.2136/sssaj1966.03615995003000060011x, 1966. a, b, c, d, e, f, g
Kozlowski, T.: Soil freezing point as obtained on melting, Cold Reg. Sci. Technol., 38, 93–101, 2004. a, b
Kozlowski, T.: Some factors affecting supercooling and the equilibrium freezing point in soil–water systems, Cold Reg. Sci. Technol., 59, 25–33, 2009. a, b, c
Kozlowski, T. and Nartowska, E.: Unfrozen Water Content in Representative Bentonites of Different Origin Subjected to Cyclic Freezing and Thawing, Vadose Zone J., 12, vzj2012.0057, https://doi.org/10.2136/vzj2012.0057, 2013a. a
Kozlowski, T. and Nartowska, E.: Unfrozen water content in representative bentonites of different origin subjected to cyclic freezing and thawing, Vadose Zone J., 12, vzj2012.0057, https://doi.org/10.2136/vzj2012.0057, 2013b. a
Kruse, A. M. and Darrow, M. M.: Adsorbed cation effects on unfrozen water in fine-grained frozen soil measured using pulsed nuclear magnetic resonance, Cold Reg. Sci. Technol., 142, 42–54, https://doi.org/10.1016/j.coldregions.2017.07.006, 2017. a
Kruse, A. M., Darrow, M. M., and Akagawa, S.: Improvements in Measuring Unfrozen Water in Frozen Soils Using the Pulsed Nuclear Magnetic Resonance Method, J. Cold Reg. Eng., 32, 04017016, https://doi.org/10.1061/(asce)cr.1943-5495.0000141, 2018. a, b, c
Kurylyk, B. L. and Watanabe, K.: The mathematical representation of freezing and thawing processes in variably-saturated, non-deformable soils, Adv. Water Resour., 60, 160–177, 2013. a
Lara, R. P., Berg, A. A., Warland, J., and Tetlock, E.: In Situ Estimates of Freezing/Melting Point Depression in Agricultural Soils Using Permittivity and Temperature Measurements, Water Resour. Res., 56, https://doi.org/10.1029/2019wr026020, 2020. a, b
Lijith, K., Sharma, V., and Singh, D. N.: A methodology to establish freezing characteristics of partially saturated sands, Cold Reg. Sci. Technol., 189, 103333, https://doi.org/10.1016/j.coldregions.2021.103333, 2021. a
Liu, G. and Si, C. B.: Soil ice content measurement using a heat pulse probe method, Can. J. Soil Sci., 91, 235–246, 2011. a, b, c
Lovell Jr., C.: Temperature effects on phase composition and strength of partially-frozen soil, Highway Research Board Bulletin, http://onlinepubs.trb.org/Onlinepubs/hrbbulletin/168/168-005.pdf (last access: 14 July 2022), 1957. a
Ma, T., Wei, C., Xia, X., Zhou, J., and Chen, P.: Soil Freezing and Soil Water Retention Characteristics: Connection and Solute Effects, J. Perform. Constr. Fac., 31, https://doi.org/10.1061/(asce)cf.1943-5509.0000851, 2017. a
Maruyama, M., Bienfait, M., Dash, J., and Coddens, G.: Interfacial melting of ice in graphite and talc powders, J. Cryst. Growth, 118, 33–40, https://doi.org/10.1016/0022-0248(92)90046-l, 1992. a
McKenzie, J. M., Voss, C. I., and Siegel, D. I.: Groundwater flow with energy transport and water–ice phase change: Numerical simulations, benchmarks, and application to freezing in peat bogs, Adv. Water Resour., 30, 966–983, https://doi.org/10.1016/j.advwatres.2006.08.008, 2007. a
Meredith, M., Sommerkorn, M., Cassotta, S., Derksen, C., Ekaykin, A., Hollowed, A., Kofinas, G., Mackintosh, A., Melbourne-Thomas, J., Muelbert, M., Ottersen, G., Pritchard, H., and Schuur, E. A. G.: Polar Regions, chap. 3, IPCC Special Report on the Ocean and Cryosphere in a Changing Climate, https://repository.library.noaa.gov/view/noaa/27411/noaa_27411_DS1.pdf (last access: 14 July 2022), 2019. a
Morishige, K. and Nobuoka, K.: X-ray diffraction studies of freezing and melting of water confined in a mesoporous adsorbent (MCM-41), J. Chem. Phys., 107, 6965–6969, https://doi.org/10.1063/1.474936, 1997. a
Mu, Q., Ng, C., Zhou, C., Zhou, G., and Liao, H.: A new model for capturing void ratio-dependent unfrozen water characteristics curves, Comput. Geotech., 101, 95–99, https://doi.org/10.1016/j.compgeo.2018.04.019, 2018. a
Mu, Q., Zhou, C., Ng, C. W. W., and Zhou, G.: Stress effects on soil freezing characteristic curve: Equipment development and experimental results, Vadose Zone J., 18, 1–10, 2019. a
Nagare, R. M., Schincariol, R. A., Quinton, W. L., and Hayashi, M.: Effects of freezing on soil temperature, freezing front propagation and moisture redistribution in peat: laboratory investigations, Hydrol. Earth Syst. Sci., 16, 501–515, https://doi.org/10.5194/hess-16-501-2012, 2012. a
Nakano, Y., Martin III, R. J., and Smith, M.: Ultrasonic velocities of the dilatational and shear waves in frozen soils, Water Resour. Res., 8, 1024–1030, 1972. a
Nakano, Y., Tice, A., Oliphant, J., and Jenkins, T.: Transport of water in frozen soil: I: Experimental determination of soil-water diffusivity under isothermal conditions, Adv. Water Resour., 5, 221–226, https://doi.org/10.1016/0309-1708(82)90004-5, 1982. a
Patterson, D. and Smith, M.: The measurement of unfrozen water content by time domain reflectometry: Results from laboratory tests, Can. Geotech. J., 18, 131–144, 1981a. a, b
Patterson, D. E. and Smith, M. W.: The measurement of unfrozen water content by time domain reflectometry: results from laboratory tests, Can. Geotech. J., 18, 131–144, https://doi.org/10.1139/t81-012, 1981b. a
Pusch, R.: Unfrozen water as a function of clay microstructure, Eng. Geol., 13, 157–162, 1979. a
Ren, J. and Vanapalli, S. K.: Comparison of soil-freezing and soil-water characteristic curves of two Canadian soils, Vadose Zone J., 18, 1–14, 2019. a, b
Ren, J. and Vanapalli, S. K.: Effect of freeze–thaw cycling on the soil-freezing characteristic curve of five Canadian soils, Vadose Zone J., 19, e20039, https://doi.org/10.1002/vzj2.20039, 2020. a
Rezanezhad, F., Price, J. S., and Craig, J. R.: The effects of dual porosity on transport and retardation in peat: A laboratory experiment, Can. J. Soil Sci., 92, 723–732, https://doi.org/10.4141/cjss2011-050, 2012. a
Romanovsky, V. E. and Osterkamp, T.: Effects of unfrozen water on heat and mass transport processes in the active layer and permafrost, Permafr. Periglac., 11, 219–239, 2000. a, b
Roth, K. and Boike, J.: Quantifying the thermal dynamics of a permafrost site near Ny-Ålesund, Svalbard, Water Resour. Res., 37, 2901–2914, https://doi.org/10.1029/2000WR000163, 2001. a
Rühaak, W., Anbergen, H., Grenier, C., McKenzie, J., Kurylyk, B. L., Molson, J., Roux, N., and Sass, I.: Benchmarking Numerical Freeze/Thaw Models, Enrgy. Proced., 76, 301–310, https://doi.org/10.1016/j.egypro.2015.07.866, 2015. a
Sliwinska-Bartkowiak, M., Gras, J., Sikorski, R., Radhakrishnan, R., Gelb, L., and Gubbins, K. E.: Phase transitions in pores: Experimental and simulation studies of melting and freezing, Langmuir, 15, 6060–6069, https://doi.org/10.1021/la9814642, 1999. a
Smerdon, B. D. and Mendoza, C.: Hysteretic freezing characteristics of riparian peatlands in the Western Boreal Forest of Canada, Hydrol. Process., 24, 1027–1038, https://doi.org/10.1002/hyp.7544, 2010. a
Smith, M. W. and Tice, A. R.: Measurement of the unfrozen water content of soils, Comparison of NMR (nuclear magnetic resonance) and TDR (time domain reflectometry) methods, Tech. rep., Cold Regions Research And Engineering Lab Hanover Nh, http://hdl.handle.net/11681/9074, 1988. a, b, c
Spaans, E. J. and Baker, J. M.: Examining the use of time domain reflectometry for measuring liquid water content in frozen soil, Water Resour. Res., 31, 2917–2925, 1995. a, b
Spaans, E. J. A. and Baker, J. M.: The Soil Freezing Characteristic: Its Measurement and Similarity to the Soil Moisture Characteristic, Soil Sci. Soc. Am. J., 60, 13–19, https://doi.org/10.2136/sssaj1996.03615995006000010005x, 1996. a
Stähli, M., Jansson, P.-E., and Lundin, L.-C.: Soil moisture redistribution and infiltration in frozen sandy soils, Water Resour. Res., 35, 95–103, https://doi.org/10.1029/1998wr900045, 1999. a, b
Stillman, D. E., Grimm, R. E., and Dec, S. F.: Low-Frequency Electrical Properties of Ice-Silicate Mixtures, J. Phys. Chem. B, 114, 6065–6073, https://doi.org/10.1021/jp9070778, 2010a. a, b
Stillman, D. E., Grimm, R. E., and Dec, S. F.: Low-Frequency Electrical Properties of Ice-Silicate Mixtures, J. Phys. Chem. B, 114, 6065–6073, 2010b. a
Suzuki, S.: Dependence of unfrozen water content in unsaturated frozen clay soil on initial soil moisture content, Soil Sci. Plant Nutr., 50, 603–606, https://doi.org/10.1080/00380768.2004.10408518, 2004. a, b
Teng, J., Kou, J., Yan, X., Zhang, S., and Sheng, D.: Parameterization of soil freezing characteristic curve for unsaturated soils, Cold Reg. Sci. Technol., 170, 102928, https://doi.org/10.1016/j.coldregions.2019.102928, 2020. a, b
Teng, J., Zhong, Y., Zhang, S., and Sheng, D.: A mathematic model for the soil freezing characteristic curve: the roles of adsorption and capillarity, Cold Reg. Sci. Technol., 181, 103178, https://doi.org/10.1016/j.coldregions.2020.103178, 2021. a
Tian, H., Wei, C., Wei, H., and Zhou, J.: Freezing and thawing characteristics of frozen soils: Bound water content and hysteresis phenomenon, Cold Reg. Sci. Technol., 103, 74–81, https://doi.org/10.1016/j.coldregions.2014.03.007, 2014. a, b, c, d, e, f, g
Tice, A.: Determination of unfrozen water in frozen soil by pulsed nuclear magnetic resonance, in: Proc. 3rd Internat. Conf. Permafrost, 1978, 149–155, 1978. a
Tice, A. R., Oliphant, J. L., Nakano, Y., and Jenkins, T. F.: Relationship between the ice and unfrozen water phases in frozen soil as determined by pulsed nuclear magnetic resonance and physical desorption data, Tech. rep., Cold Regions Research And Engineering Lab Hanover NH, https://apps.dtic.mil/sti/citations/ADA118486 (last access: 14 July 2022), 1982. a
Timur, A.: Velocity of compressional waves in porous media at permafrost temperatures, Geophysics, 33, 584–595, 1968. a
Tokoro, T., Ishikawa, T., and Akagawa, S.: A method for permeability measurement of frozen soil using an ice lens inhibition technique, Jiban Kogaku Janaru (Japanese Geotechnical Journal), 5, 603–613, https://doi.org/10.3208/jgs.5.603, 2010. a
Topp, G. C., Davis, J., and Annan, A. P.: Electromagnetic determination of soil water content: Measurements in coaxial transmission lines, Water Resour. Res., 16, 574–582, https://doi.org/10.1029/WR016i003p00574, 1980. a
Veraart, J., Fieremans, E., Jelescu, I. O., Knoll, F., and Novikov, D. S.: Gibbs ringing in diffusion MRI, Magn. Reson. Med., 76, 301–314, 2016. a
Wang, C., Lai, Y., and Zhang, M.: Estimating soil freezing characteristic curve based on pore-size distribution, Appl. Therm. Eng., 124, 1049–1060, https://doi.org/10.1016/j.applthermaleng.2017.06.006, 2017. a
Wang, M., Li, X., and Xu, X.: An implicit Heat-Pulse-Probe method for measuring the soil ice content, Appl. Therm. Eng., 196, 117186, https://doi.org/10.1016/j.applthermaleng.2021.117186, 2021a. a
Wang, M., Li, X., and Xu, X.: An implicit Heat-Pulse-Probe method for measuring the soil ice content, Appl. Therm. Eng., 196, 117186, https://doi.org/10.1016/j.applthermaleng.2021.117186, 2021b. a
Watanabe, K. and Mizoguchi, M.: Amount of unfrozen water in frozen porous media saturated with solution, Cold Reg. Sci. Technol., 34, 103–110, https://doi.org/10.1016/s0165-232x(01)00063-5, 2002. a
Watanabe, K. and Wake, T.: Measurement of unfrozen water content and relative permittivity of frozen unsaturated soil using NMR and TDR, Cold Reg. Sci. Technol., 59, 34–41, https://doi.org/10.1016/j.coldregions.2009.05.011, 2009a. a, b, c, d
Watanabe, K. and Wake, T.: Measurement of unfrozen water content and relative permittivity of frozen unsaturated soil using NMR and TDR, Cold Reg. Sci. Technol., 59, 34–41, https://doi.org/10.1016/j.coldregions.2009.05.011, 2009b. a, b
Wettlaufer, J. and Worster, M. G.: Premelting Dynamics, Annu. Rev. Fluid Mech., 38, 427–452, https://doi.org/10.1146/annurev.fluid.37.061903.175758, 2006. a
Williams, P. J.: Unfrozen water content of frozen soils and soil moisture suction, Geotechnique, 14, 231–246, https://doi.org/10.1680/geot.1964.14.3.231, 1964. a
Wu, B., Zhu, H.-H., Cao, D., Xu, L., and Shi, B.: Feasibility study on ice content measurement of frozen soil using actively heated FBG sensors, Cold Reg. Sci. Technol., 189, 103332, https://doi.org/10.1016/j.coldregions.2021.103332, 2021. a, b
Wu, M., Tan, X., Huang, J., Wu, J., and Jansson, P.-E.: Solute and water effects on soil freezing characteristics based on laboratory experiments, Cold Reg. Sci. Technol., 115, 22–29, 2015. a
Wu, Y., Nakagawa, S., Kneafsey, T. J., Dafflon, B., and Hubbard, S.: Electrical and seismic response of saline permafrost soil during freeze – Thaw transition, J. Appl. Geophys., 146, 16–26, https://doi.org/10.1016/j.jappgeo.2017.08.008, 2017. a, b, c
Yoshikawa, K. and Overduin, P. P.: Comparing unfrozen water content measurements of frozen soil using recently developed commercial sensors, Cold Reg. Sci. Technol., 42, 250–256, https://doi.org/10.1016/j.coldregions.2005.03.001, 2005. a, b, c
Zhang, L., Xu, X., Deng, Y., and Zhang, Z.: Study of the relationship between the unfrozen water content of frozen soil and pressure, in: Proceedings of the Seventh International Conference on Permafrost, vol. 1223, https://www.arlis.org/docs/vol1/ICOP/40770716/CD-ROM/Proceedings/PDF001189/187380.pdf (last access: 14 July 2022), 1998. a
Zhang, M., Zhang, X., Lai, Y., Lu, J., and Wang, C.: Variations of the temperatures and volumetric unfrozen water contents of fine-grained soils during a freezing–thawing process, Acta Geotech., 15, 595–601, 2020. a, b
Zhang, Y., Chen, W., and Riseborough, D. W.: Transient projections of permafrost distribution in Canada during the 21st century under scenarios of climate change, Global Planet. Change, 60, 443–456, 2008. a
Zhou, J., Meng, X., Wei, C., and Pei, W.: Unified soil freezing characteristic for variably-saturated saline soils, Water Resour. Res., 56, e2019WR026648, https://doi.org/10.1029/2019WR026648, 2020. a, b
Zhou, X., Zhou, J., Kinzelbach, W., and Stauffer, F.: Simultaneous measurement of unfrozen water content and ice content in frozen soil using gamma ray attenuation and TDR, Water Resour. Res., 50, 9630–9655, 2014. a