the Creative Commons Attribution 4.0 License.
the Creative Commons Attribution 4.0 License.
 | 08 Jul 2022
A Central Asia hydrologic monitoring dataset for food and water security applications in Afghanistan
Amy McNally
Jossy Jacob
Kristi Arsenault
Kimberly Slinski
Daniel P. Sarmiento
Andrew Hoell
Shahriar Pervez
James Rowland
Mike Budde
Sujay Kumar
Christa Peters-Lidard
James P. Verdin
From the Hindu Kush mountains to the Registan Desert, Afghanistan is a diverse landscape where droughts, floods, conflict, and economic market accessibility pose challenges for agricultural livelihoods and food security. The ability to remotely monitor environmental conditions is critical to support decision making for humanitarian assistance. The Famine Early Warning Systems Network (FEWS NET) Land Data Assimilation System (FLDAS) global and Central Asia data streams provide information on hydrologic states for routine integrated food security analysis. While developed for a specific project, these data are publicly available and useful for other applications that require hydrologic estimates of the water and energy balance. These two data streams are unique because of their suitability for routine monitoring, as well as for being a historical record for computing relative indicators of water availability. The global stream is available at ∼ 1-month latency, and monthly average outputs are on a 10 km grid from 1982–present. The second data stream, Central Asia (21–56∘ N, 30–100∘ E), at ∼ 1 d latency, provides daily average outputs on a 1 km grid from 2000–present. This paper describes the configuration of the two FLDAS data streams, background on the software modeling framework, selected meteorological inputs and parameters, and results from previous evaluation studies. We also provide additional analysis of precipitation and snow cover over Afghanistan. We conclude with an example of how these data are used in integrated food security analysis. For use in new and innovative studies that will improve understanding of this region, these data are hosted by U.S. Geological Survey data portals and the National Aeronautics and Space Administration (NASA). The Central Asia data described in this paper can be accessed via the NASA repository at https://doi.org/10.5067/VQ4CD3Y9YC0R (Jacob and Slinski, 2021), and the global data described in this paper can be accessed via the NASA repository at https://doi.org/10.5067/5NHC22T9375G (McNally, 2018).
- Article
(4993 KB) - Full-text XML
- BibTeX
- EndNote


From the Hindu Kush mountains to the Registan Desert, Afghanistan is a diverse landscape where droughts, floods, conflict, and economic market accessibility pose challenges for agricultural livelihoods and food security. The ability to remotely monitor environmental conditions is critical to support decision making for economic development, humanitarian assistance, water resource management, agriculture, and more. Environmental datasets can be combined with socioeconomic variables and transformed into customized products to support decision making. This is the definition of a “climate service” (Hewitt et al., 2012).
Hydrologic and land surface datasets are particularly relevant for agriculture and water resource decision making. When these datasets are credible, updated routinely, and made publicly available, the influences of climate variability and climate change can be incorporated into specialized analyses by intermediary users1. One example of an intermediary user central to this data descriptor is the food security analysts of the Famine Early Warning Systems Network (FEWS NET). FEWS NET analysts combine environmental information, largely from remote sensing and earth system models, with information on nutrition, livelihoods, markets, and trade to provide decision support to the U.S. Agency for International Development (USAID) Bureau of Humanitarian Assistance. Additional examples and discussion of the production of climate service inputs can be found in the literature (e.g., Vincent et al., 2018; McNally et al., 2019).
While these data are tailored to specific needs, they are also applicable to other climate services and research, e.g., desert locust movement forecasting (Tabar et al., 2021). To that end, this paper describes the FEWS NET Land Data Assimilation System (FLDAS) global and Central Asia data streams. The inputs (e.g., precipitation) and resulting hydrologic estimates (a) provide a 40+ year historical record for contextualizing estimates in terms of departures from average (i.e., anomalies), (b) are low latency (<1 month) for timely decision support, and (c) are familiar to the food and water security user community.
The purpose of this data descriptor is four-fold:
-
to describe the development of the moderate-resolution, low-latency FLDAS hydrologic monitoring system for Central Asia, specifically Afghanistan,
-
to increase awareness of these data resources, which are intended to be a public good,
-
to demonstrate how our methods inform critical investigations that ultimately improve general understanding of water resources in this important region of the world, and
-
to describe a “convergence of evidence” approach to hydrologic monitoring in locations where all sources of information contain some level of uncertainty.
An outline of this data descriptor is as follows. Section 1.1 provides background on Afghanistan's weather and climate. Section 1.2 reviews previous studies that have conducted evaluations of the meteorological inputs and hydrologic outputs of land data assimilation systems in the Central Asia region. Section 2 (“Methods”) describes the hydrologic modeling system, parameters and meteorological inputs, and model outputs. Section 3 (“Results”) presents comparisons of precipitation inputs and comparisons of modeled snow estimates to remotely sensed snow observations. Finally, Sect. 4 describes an application of these data to the Afghanistan drought of 2018.
1.1 Afghanistan weather and climate
Central Asia, a region that includes Afghanistan, is water-scarce, receiving roughly 75 % of its annual precipitation during November–April (Oki and Kanae, 2006). In Afghanistan, rainfall is highest in the northeast Hindu Kush mountains and decreases toward the arid southwest Registan Desert (Fig. 1a). Temperature follows a similar pattern with cooler temperatures in the high-elevation, wetter northeast and warmer temperatures in the south and southwest (Fig. 1b). Regional precipitation is strongly influenced by the El Niño–Southern Oscillation (ENSO). La Niña conditions are associated with below-average precipitation (FEWS NET, 2020b), and El Niño conditions are associated with above-average precipitation (Barlow et al., 2016; Hoell et al., 2017; Rana et al., 2018; Hoell et al., 2018, 2020; FEWS NET, 2020a). Other factors with an important influence on precipitation include orography, storm tracks, and the Madden–Julian oscillation (Barlow et al., 2005; Nazemosadat and Ghaedamini, 2010; Hoell et al., 2018). The last several years have experienced several ENSO events, with recent La Niña events in 2016–2017, 2017–2018, and 2020–2022 (NOAA CPC, 2021) that corresponded to droughts (FEWS NET, 2017b, 2018c, 2021).
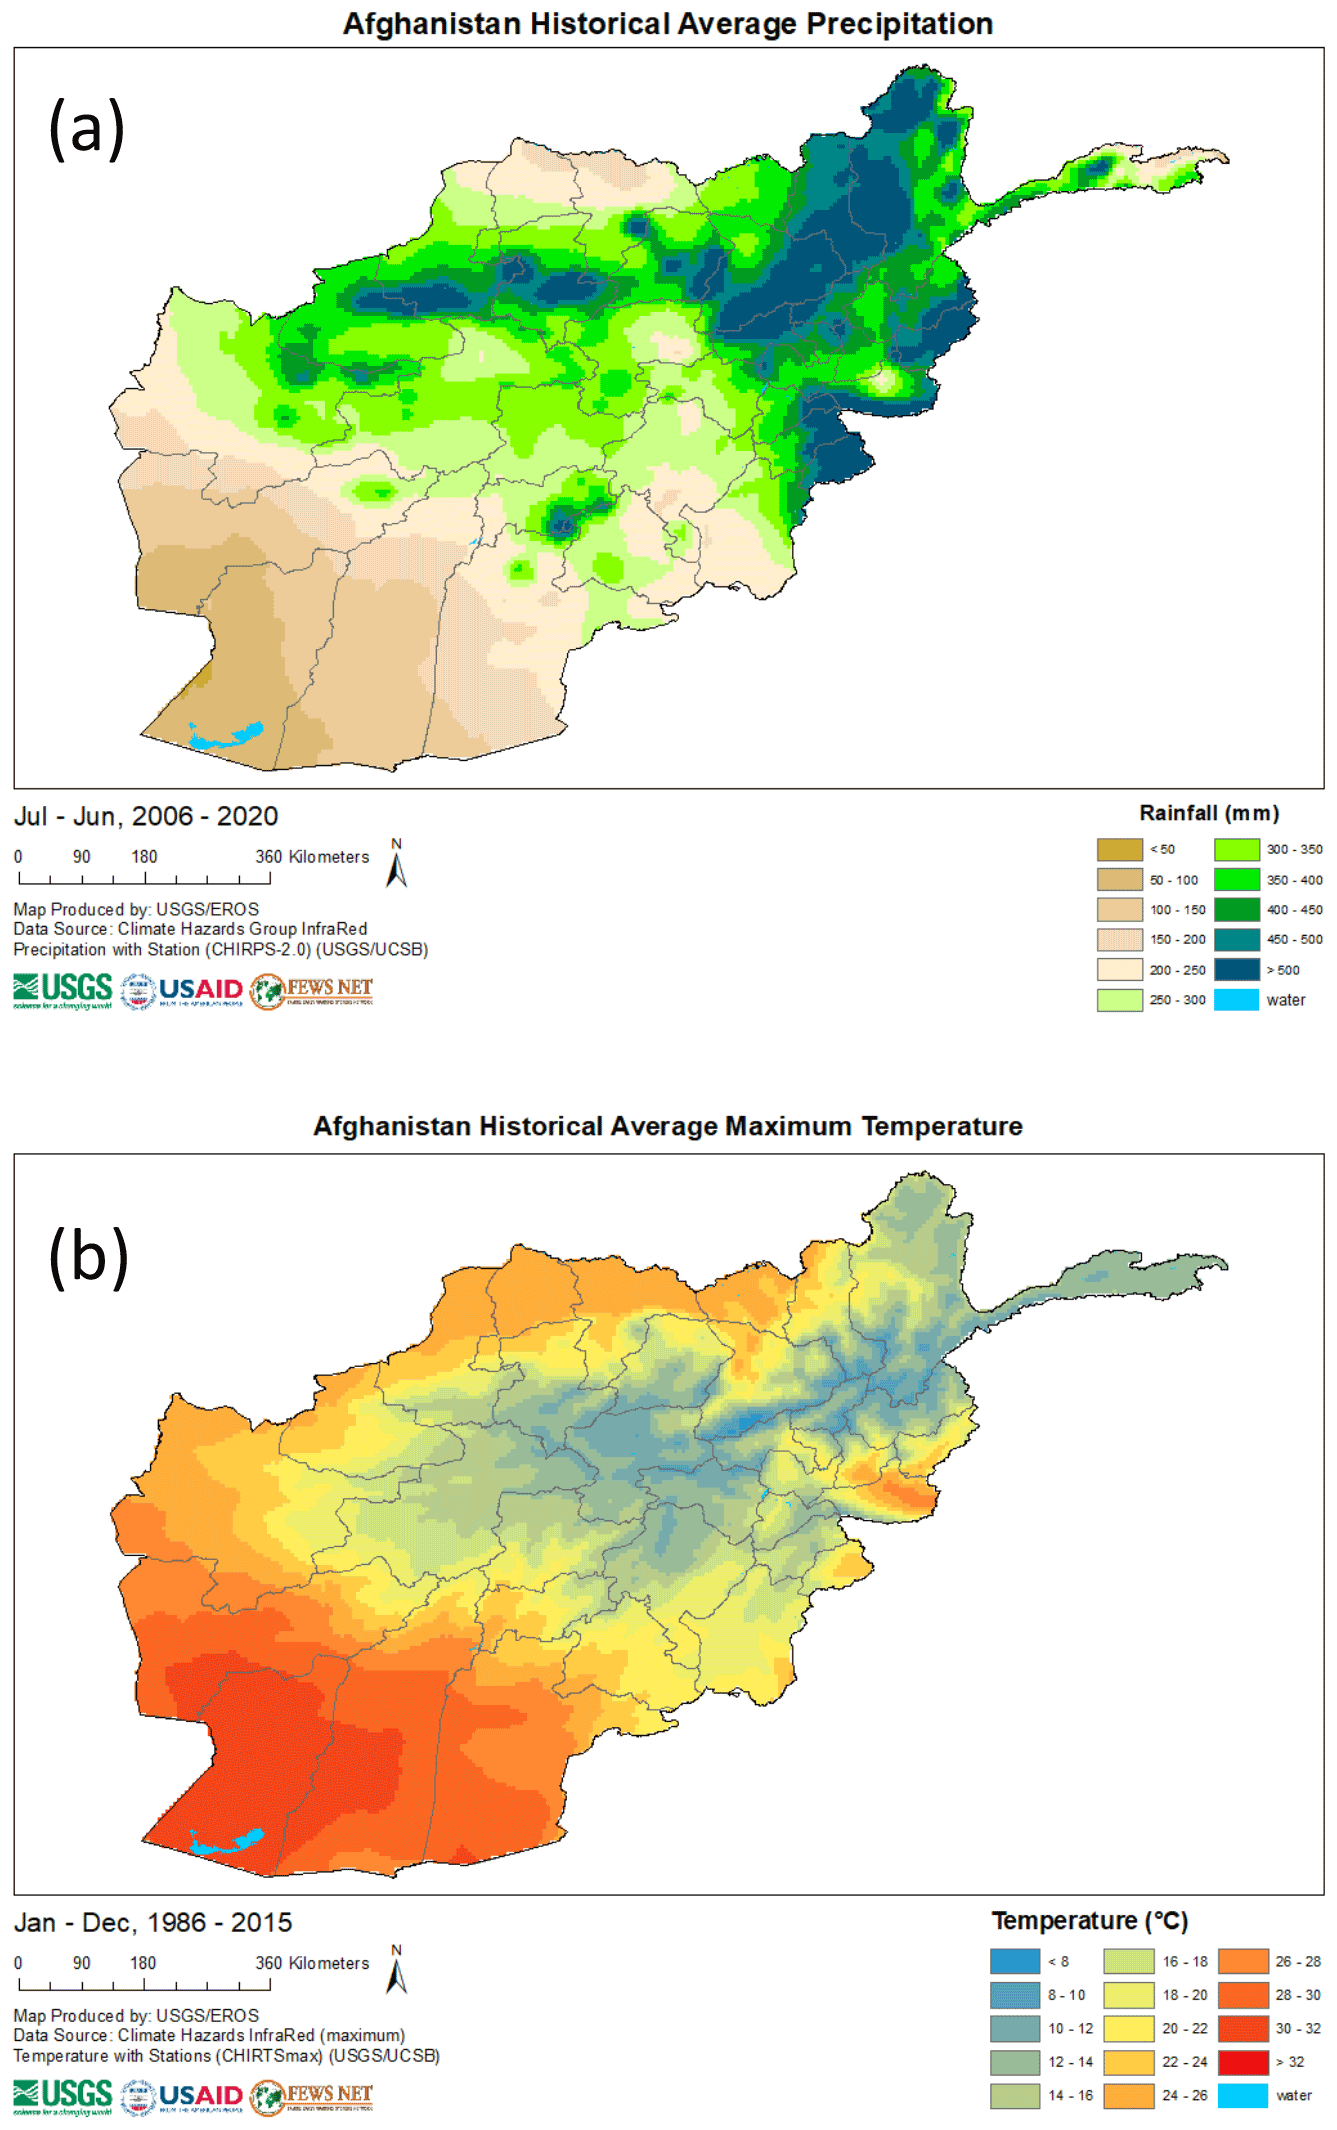
Figure 1(a) Average annual precipitation in Afghanistan from 1991–2020, with overlaid province boundaries. (b) Average maximum monthly temperature from 1986–2015, overlaid with province boundaries. Map source USGS Knowledge Base (2021).
Despite Afghanistan's semi-arid climate, agriculture is an important sector, contributing 23 % of its gross domestic product and employing 44 % of the national labor force (CIA World Factbook, 2022). High mountain snowpack and snowmelt runoff are important for agricultural water supply. According to FEWS NET (2018b) snowmelt runoff is responsible for “providing over 80 % of irrigation water used. The timing and duration of the snowmelt is a key factor in determining the volume of irrigation water and the length of time that it is available, as well as its availability for use in marginal areas that experience [variable] rainfall.” Therefore, routine hydrologic monitoring, with a particular emphasis on snow, is critical for tracking agricultural conditions and provides early warning for food insecurity.
1.2 Hydrologic data availability and uncertainty
Remote sensing and models are important inputs to climate services (Qamer et al., 2019). In the Central Asia region, and especially Afghanistan, estimates of meteorological inputs and model parameters have considerable uncertainty due to sparse in situ environmental observations. To address these challenges, the NASA High Mountain Asia project (https://www.himat.org/, last access: 24 June 2022) has broadly aimed to explore the driving changes in hydrology, as well as model validation and data assimilation, and water budget processes from the Himalayas in the south and east to the Hindu Kush in the west. These efforts and other studies of satellite-derived rainfall informed the configuration and interpretation of the FLDAS Central Asia and global data streams.
The primary challenge to producing and evaluating hydrologic estimates is that sparse in situ precipitation observations lead to uncertainty in gridded, satellite-based precipitation estimates. Precipitation station observations are used for (a) bias correction of satellite estimates and (b) validation of gridded products. In terms of gridded dataset development, Hoell et al. (2015) describe how the lack of station observations and complex topography in Afghanistan, Iraq, and Pakistan makes this issue particularly problematic. Barlow et al. (2016) also highlight the station availability across the region and how that influences uncertainties in the Global Precipitation Climatology Center (GPCC) version 6 (Schneider et al., 2017) dataset over Central Asia (Fig. 2a) and specifically Afghanistan over time (Fig. 2b).
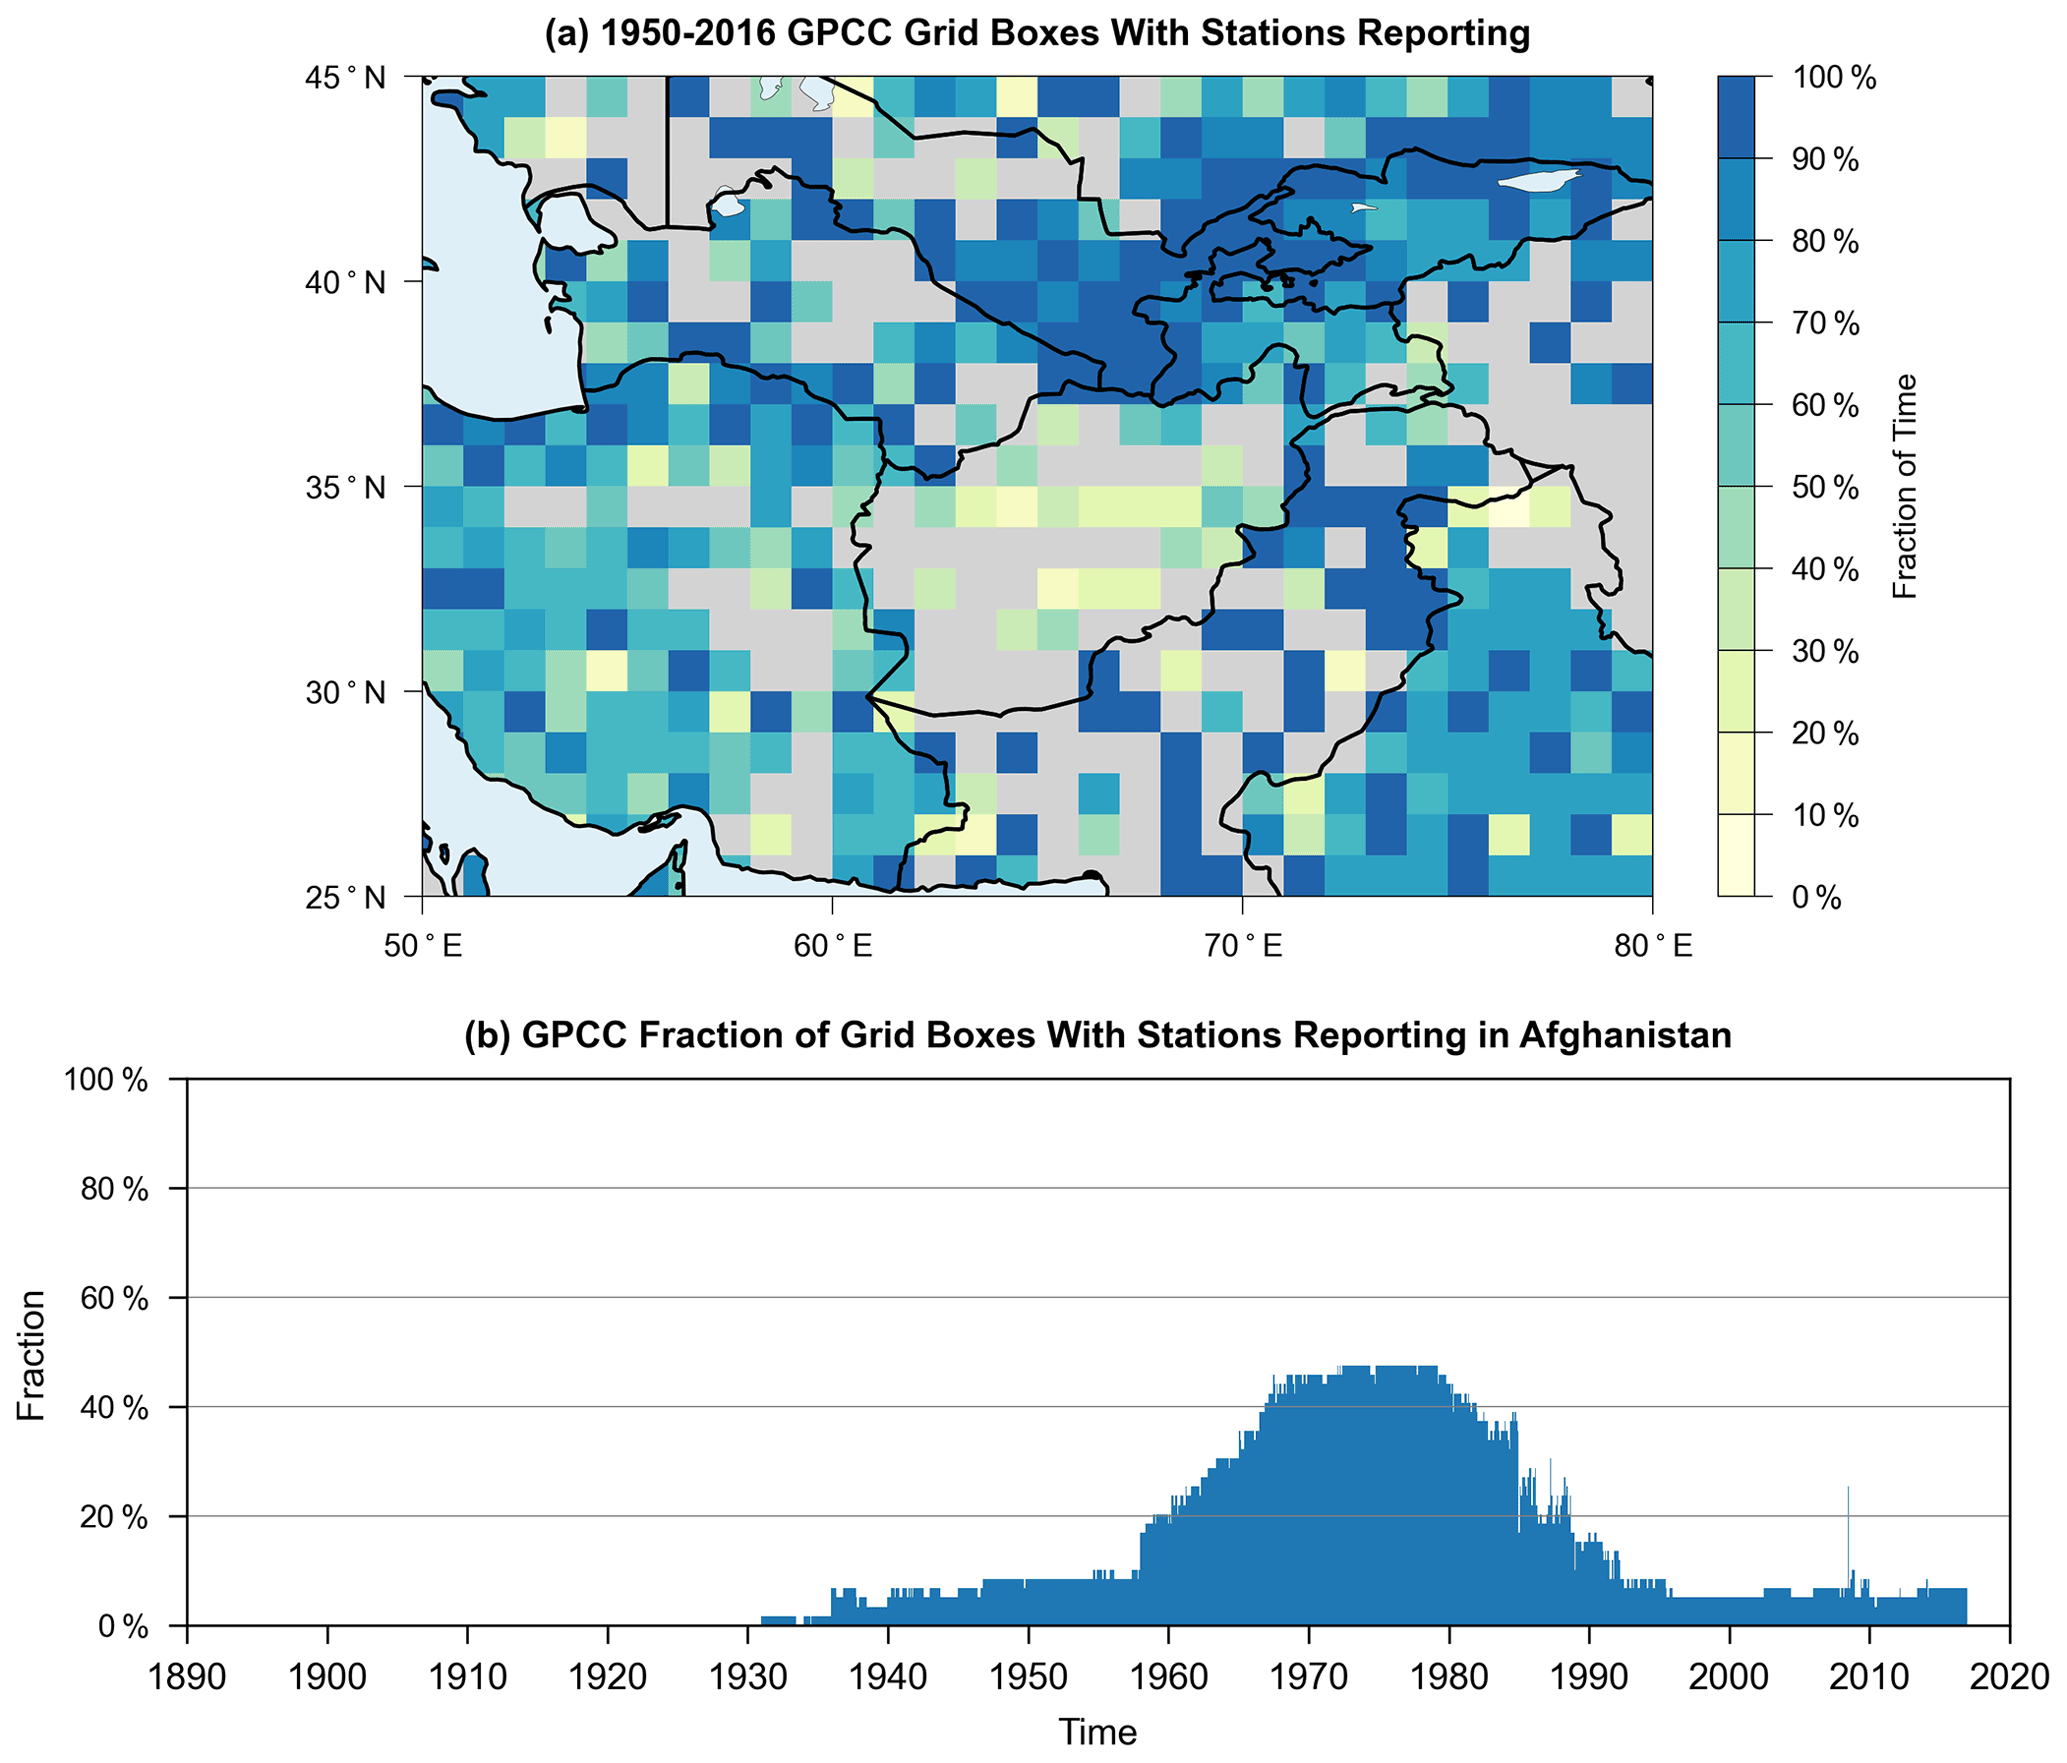
Figure 2(a) Station data availability underlying the GPCC version 6 dataset, for the 1950–2016 period, on the 0.5∘ resolution grid over Central Asia. (b) Fraction of grid cells with number of stations used as input to the GPCC rainfall dataset in Afghanistan from 1932–2016.
In the absence of abundant in situ observations, one approach for remote sensing and model evaluation is to compare multiple input datasets and evaluate the water balance. Independent observations from the different components of the water balance (e.g., evapotranspiration, soil moisture, streamflow) help constrain estimates. We provide some background here and refer readers and data users to literature from the NASA High Mountain Asia project, specifically Yoon et al. (2019) and Ghatak et al. (2018), who explored similar configurations to the FLDAS system. This background allows the reader to appreciate the uncertainties in inputs, outputs, and derived products and climate services over Afghanistan and the broader Central Asia region.
Meteorological forcing is known to be the primary source of uncertainty in land surface model simulations (Kato and Rodell, 2007). Thus, its evaluation is important to understand the quality of model inputs and outputs. For this reason, Ghatak et al. (2018) compare four unique precipitation data sources: daily Climate Hazards center Infrared Precipitation with Stations (CHIRPS) (Funk et al., 2015), NOAA's Global Data Assimilation System (GDAS) (Derber et al., 1991), and two estimates from NASA's Modern Era Reanalysis for Research and Applications version 2 (MERRA-2) (Gelaro et al., 2017). They find that annual CHIRPS and GDAS precipitation estimates had a similar bias and root mean squared error over Afghanistan with respect to the APHRODITE (Asian Precipitation Highly Resolved Observational Data Integration Toward Evaluation) rain-gauge-derived product (Yatagai et al., 2012). CHIRPS had a higher correlation with APHRODITE. Ghatak et al. (2018) further evaluated the quality of rainfall inputs based on the performance of evapotranspiration and other derived outputs. The authors caution that gridded precipitation estimates that have in situ inputs, like CHIRPS, may systematically underestimate precipitation in mountainous regions. We keep this consideration in mind when interpreting differences between FLDAS global and Central Asia data streams.
Yoon et al. (2019) compare precipitation estimates from 10 different products, including APHRODITE, CHIRPS, GDAS, and MERRA-2, across a broad region of High Asia, including a portion of Afghanistan. They find that all datasets generally capture the spatial pattern of rainfall and that the products tend to agree more at high elevations, where it is unlikely there are station observations. Like Ghatak et al. (2018), they found CHIRPS and APHRODITE to have a lower average precipitation than GDAS, attributable to the incorporation of sparse gauge data.
In addition to precipitation, other meteorological inputs are important for accurate hydrologic estimates. Yoon et al. (2019) conducted an intercomparison of near-surface air temperature estimates from three model analysis products (European Centre for Medium-Range Weather Forecasts (ECMWF; Molteni et al., 1996), GDAS, and MERRA-2). They noted a statistically significant upward trends in GDAS and ECMWF temperature, as well as consistently higher temperatures in MERRA-2. We see the same pattern when averaging across Afghanistan. Yoon et al. (2019) conclude that improvements in the meteorological boundary conditions would be needed to reduce the uncertainty in the terrestrial budget estimates. These sentiments are echoed in Qamer et al. (2019).
Despite known uncertainties, Schiemann et al. (2008) find that gridded precipitation estimates can qualitatively identify large-scale spatial distribution of precipitation, seasonal cycles, and interannual variability (i.e., wet and dry years) across Central Asia. Long-term estimates of rainfall from satellite-derived products, as well as derived historical time series from hydrologic modeling, can be used as a baseline of “observations”, from which we can have a sense of relative conditions, i.e., anomalies and variability. When this historical record is harmonized with a routine monitoring system, current conditions can be placed in historical context. Anomaly-based representation of hydrologic extremes can provide confidence in modeled estimates that have the potential to influence agricultural, water resource, and food security outcomes. For these reasons one of the requirements for FLDAS input is that there is a sufficiently long historical record for contextualizing estimates in terms of anomalies.
From a climate services perspective, the reliance on the representation of relatively wet and dry conditions, as well as a convergence of evidence approach, provides useable information despite the above-mentioned uncertainties. A convergence of evidence approach that draws on (quasi-)independent sources of information is useful to understand actual conditions. For the convergence of Earth observations, hydrologic models can generate ensembles of historical, current, or future estimates of snow, streamflow, soil moisture, and evapotranspiration, which can then be compared to satellite-derived estimates of surface water (e.g., McNally et al., 2019), soil moisture (e.g., McNally et al., 2016), vegetation conditions and evapotranspiration (e.g., Jung et al., 2019; Pervez et al., 2021), snow cover (e.g., Arsenault et al., 2014), in situ streamflow (e.g., Jung et al., 2017), and others. Hydrologic estimates can also be compared to outcomes in crop production (e.g., McNally et al., 2015; Davenport et al., 2019; Shukla et al., 2020) and nutrition, health, and food security (e.g., Grace and Davenport, 2021) to provide a qualitative understanding of both hydrologic model performance and conditions on the ground. In this paper we provide an example for 2018 when drought conditions were associated with crisis levels of acute food insecurity over most of Afghanistan (FEWS NET, 2018c).
To summarize, our experience and the literature have characterized uncertainties in available meteorological forcing for the region. GDAS, CHIRPS, and MERRA-2 were chosen for the FLDAS system based on our project requirements of (a) a sufficiently long historical record for contextualizing estimates in terms of anomalies, (b) low latency (<1 month) for timely decision support, (c) familiarity with the FEWS NET user community, and (d) prior evaluation by our team and the broader community. We note here and describe in more detail later that the Integrated Multi-satellite Retrievals for the Global Precipitation Mission (IMERG), a NASA precipitation product (Huffman et al., 2020), have also met these requirements since version 6, which was released in 2019 (after these studies and initial FLDAS configuration). We will describe an IMERG, GDAS, and MERRA-2 comparison in the “Results” (Sect. 3).
2.1 Land surface modeling system and parameters
A land surface model (LSM) can provide spatially and temporally continuous information about the water and energy budgets of the land surface. This information is useful for food and water security applications in places where in situ measurements of rainfall, soil moisture, snow, and runoff are sparse. This is particularly relevant in mountainous places like Afghanistan where heterogeneous geography limits the representativeness of sparse in situ measurements. The FLDAS (McNally et al., 2017) utilizes the NASA's Land Information System Framework (LISF), which is composed of a pre-processor, the Land surface Data Toolkit (LDT; Arsenault et al., 2018), the Land Information System (Kumar et al., 2006; Peters-Lidard et al., 2007), and the Land Verification Toolkit (Kumar et al., 2012). In this data descriptor we describe the two configurations of the FLDAS data streams used for Central Asia food and water security applications. It uses the Noah 3.6 LSM (Chen et al., 1996; Ek et al., 2003) for the two data streams (Fig. 3 and Table 1). The first data stream is global, at ∼ 1-month latency, and provides monthly average outputs on a 10 km grid from 1982–present. The second data stream centered on Central Asia, ∼ 1 d latency, provides daily average outputs at 1 km from 2001–present.
One important feature, added by the NASA LISF software development team, is the radiation correction described in Kumar et al. (2013) which improves the representation of snow dynamics with respect to slope and aspect corrections on the downward solar radiation field. Another noteworthy feature is the method of the Central Asia data stream restart (i.e., annual initialization based on climatology), which was developed to address an issue of excessive interannual snow accumulation found in the Noah LSM. First, a 9-year spin-up of the system was performed to produce stable snow and soil moisture conditions. Next, the resulting model states were compared with the Moderate Resolution Imaging Spectroradiometer (MODIS) Maximum Snow Extent data originally computed by NOAA National Operational Hydrologic Remote Sensing Center (Greg Fall, NOAA Operational Data Center, written communication, 2014). Then, the model-estimated conditions were adjusted to produce a climatological model state for 1 October that is used to initialize each year. This approach ensures that the “water year”, beginning 1 October, is initialized with a reasonable initial amount of snowpack. While this method does effectively manage excessive interannual modeled snow accumulation, the user should be aware that using the climatological model state will persist for ∼ 1–2 months in the water and energy balance of the LSM until they are superseded by “observed” meteorological inputs for the current water year. Preliminary work indicates that this issue will be resolved in future updates. In contrast, the global data stream does not use this 1 October initialization procedure.
Although the two data stream specifications are largely the same, there are some differences related to the input forcings, parameters and specifications (Table 1), and model spin-up procedures.
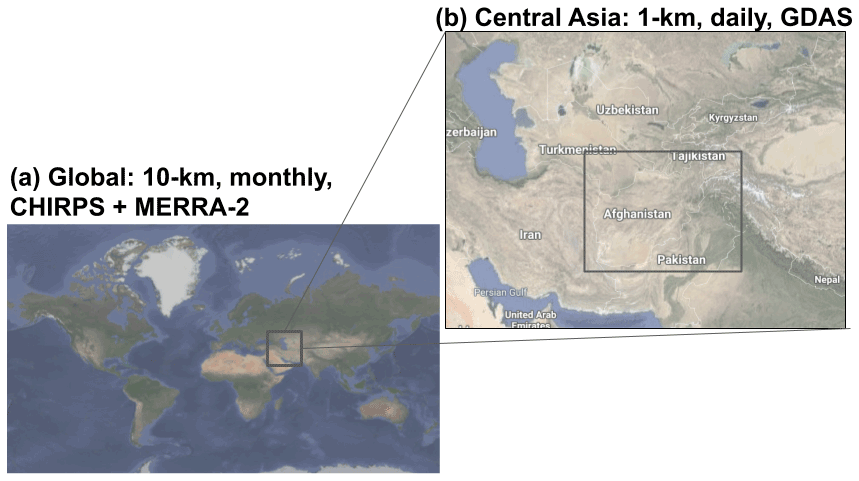
Figure 3The FEWS NET Land Data Assimilation System (FLDAS) domains for (a) the global data stream at 10 km spatial resolution and ∼ 1-month latency for monthly averaged hydrologic estimates and (b) the Central Asia data stream at 1 km spatial resolution and ∼ 1 d latency for daily averaged hydrologic estimates. Imagery 2021 TerraMetrics, map data © Google.
Table 1FEWS NET Land Data Assimilation System (FLDAS) specifications for (a) global data stream, 10 km, monthly with CHIRPS and MERRA-2 and (b) Central Asia data stream, 1 km, daily with GDAS.

The parameters and specifications listed in Table 1 are largely default settings defined by the Noah LSM community (NCAR Research Applications Library, 2021). Ongoing research aims to identify where model output performance can be improved with parameter updates. Evaluating parameter updates had similar challenges as evaluating input forcing described in Sect. 1.2: without reliable reference data it is difficult to determine a “best” input. For example, we have explored changing soil parameters from FAO to the International Soil Reference and Information Centre (ISRIC) SoilGrids database (Hengl et al., 2017). This change did not result in improvements in streamflow statistics in southern Africa, nor in soil moisture anomalies' ability to represent drought events. We expect similar results in Afghanistan where, for example, streamflow will be sensitive to a change in soil parameters and the lack of reference data to evaluate if there is an improvement. Moreover, our model runs at 0.1 and 0.01∘ may not fully exploit the added value of the 250 m soil grids as noted in Ellenburg et al. (2021) for a LISF application in East Africa.
Vegetation parameters are also potential sources of improvement whose importance to hydrologic estimates has been highlighted (e.g., Miller et al., 2006). We have found the NCEP estimates of green vegetation fraction (GVF) to be sufficient for this configuration of Noah 3.6. We found that a time series of GVF derived from the Normalized Difference Vegetation Index (NDVI) did not improve representation of droughts in eastern Africa. However, future FLDAS global and Central Asia versions can be run with Noah-Multiparameterization (Noah-MP) (Niu et al., 2011) which has multiple vegetation options and relies on either leaf area index or GVF. This model update is expected to open possibilities for the choice of datasets to meet our application needs and potentially improve representation of the water balance.
2.2 Meteorological forcing inputs
As previously discussed, precipitation is a critical input to land surface models. The lower-latency Central Asia data stream is a daily product, forced with GDAS (Derber et al., 1991) 3-hourly precipitation, which is available from 2001–present at <1 d latency. This dataset was chosen because of its latency. The global data stream is driven by the daily CHIRPS product (Funk et al., 2015), which is available from 1981–present at ∼ 5 d latency for CHIRPS Preliminary and ∼ 1.5-month latency for CHIRPS Final. The CHIRPS products were chosen as inputs because of their proven performance in the literature, which has made it the “gold standard” for food and water security monitoring by organizations like FEWS NET, the World Food Program, and others who need up-to-date estimates and a 40+ year historical record. As mentioned earlier, the lack of rainfall stations for bias correction of satellite-derived estimates and evaluation poses a major challenge. However, we find that the GDAS rainfall product and the CHIRPS rainfall product are adequate for routine monitoring and, along with additional sources of remote sensed information, are important for the convergence of evidence when making a best estimate at land surface states and fluxes.
Before the daily CHIRPS rainfall data can be used as input to the FLDAS models, the daily precipitation is pre-processed to a sub-daily time step using the LDT component of the LISF software. LDT temporally disaggregates the daily CHIRPS rainfall using an approach similar to the North American Land Data Assimilation System (NLDAS) precipitation temporal downscaling (Cosgrove et al., 2003). For this approach, we use a finer timescale MERRA-2 precipitation timescale as a reference dataset to represent an accurate diurnal cycle. We note that this step in our methodology facilitates the solving of FLDAS water and energy balances at a sub-daily time step. However, for Central Asia we do not have sufficient reference data available to assess the importance of sub-daily precipitation distribution, as was demonstrated by Sarmiento et al. (2021) for the United States where adequate reference data are available. For spatial downscaling, coarser-scale meteorological forcings are spatially disaggregated to the output resolution (0.01 and 0.1∘ for Central Asia and global, respectively) in the LISF using bilinear interpolation.
The FLDAS models require additional meteorological inputs, including air temperature, humidity, radiation, and wind. The lower-latency Central Asia data stream uses GDAS 3-hourly meteorological inputs available from 2001–present at <1 d latency. For a longer historical record, the global data stream uses MERRA-2 (Gelaro et al., 2017) (1979–present) 1-hourly products with a 2-week latency. Over the Afghanistan domain GDAS temperature has an upward trend, whereas MERRA-2 is consistently warmer before 2010. We find that GDAS and MERRA-2 temperature estimates are of similar magnitude during 2011–2020. Similar results were noted by Yoon et al. (2019) who found an upward trend in GDAS temperature, as well as consistently higher temperatures in MERRA-2 across a broad High Asia domain.
2.3 Model evaluation statistics and comparison data
In addition to guidance from previous studies (Sect. 1.2), we assessed the quality of our modeling outputs by conducting comparisons between (1) FLDAS satellite rainfall inputs and other satellite precipitation estimates and (2) model-estimated snow cover fraction and satellite-derived snow cover fraction estimates.
For the precipitation analysis, we compare CHIRPS and GDAS inputs to the Integrated Multi-satellite Retrievals for the Global Precipitation Mission (IMERG), a NASA precipitation product that integrates passive microwave and infrared satellite data with surface station observations (Huffman et al., 2020). The IMERG Final Run precipitation product, available at ∼ 2-month latency (thus not suitable for our monitoring applications), has been used in numerous verification studies, including studies over Africa (Dezfuli et al., 2017), South America (Gadelha et al., 2019; Manz et al., 2017), and the mid-Atlantic region of the United States (Tan et al., 2016). These studies demonstrated that IMERG Final Run was able to capture large spatial patterns and seasonal and interannual patterns of rainfall. However, fewer studies have explored the performance of the lower-latency IMERG Late Run (https://doi.org/10.5067/GPM/IMERGDL/DAY/06, Huffman et al., 2019) product that we use here. Kirschbaum et al. (2016) include a qualitative comparison for CHIRPS Final and IMERG Late Run for the southern Africa start-of-season 2015. IMERG Late Run appears to perform similarly to the 1.5-month latency CHIRPS Final and outperform the 1 d latency NOAA African Rainfall Estimation Algorithm Version 2 (RFE) product (Xie and Arkin, 1996). Differences in the daily rainfall distribution patterns between IMERG Final Run and CHIRPS Final have also been shown to affect the resulting hydrological modeled output in simulations done using the NASA LISF (Sarmiento et al., 2021).
For the snow cover fraction (SCF) analysis, we compare the global and Central Asia data streams with the MODIS daily SCF product, MOD10A1 Collection 6 (Hall and Riggs, 2016). MOD10A1 data are available at 500 m spatial resolution from February 2000 to the present. SCF is generated using the Normalized Difference Snow Index (NDSI) and additional filters to reduce error and flag uncertainty. Routine qualitative comparisons, which can be viewed on the NASA LISF FEWS NET project website, generally show agreement between the model and MODIS SCF, as well as occurrence of cloud cover (https://ldas.gsfc.nasa.gov/fldas/models/central-asia, last access: 28 June 2022). Following Arsenault et al. (2014), we aggregated pixels to 0.01∘ to reduce error related to sensor viewing angles and gridding artifacts. For this analysis, using MODIS SCF as “truth”, we determined true positives (TPs), true negatives (TNs), false negatives (FNs), and false positives (FPs). We then computed probability of detection (POD), where POD = (TP(TP + FN)), and false alarm rate (FAR), where FAR = (FP(FP + TN)). We computed these for the total area of Afghanistan (28–39∘ N, 60–76∘ E), as well as by basin (Fig. 4). This paper does not compare modeled snow water equivalent (SWE) to independent snow observations because, as noted by Yoon et al. (2019), direct evaluation of snow mass and SWE is difficult over Central Asia due to poor coverage of accurate snow observations. We follow the Yoon et al. (2019) recommendation to conduct quantitative SCF comparisons and provide qualitative SWE analysis in “Applications” (Sect. 4).
In addition to rainfall and snow comparisons, we conducted monthly pixel-wise comparison of Central Asia and the global run's estimates of evapotranspiration (ET) and soil moisture versus Operational Simplified Surface Energy Balance (SSEBop; Senay et al., 2013). ET and Soil Moisture Active Passive (SMAP) Level 3 (Entekhabi et al., 2010, 2016) use the normalized information contribution (NIC) metric following Sarmiento et al. (2021). The analysis was performed for the period 2016–2021 to match the SMAP record. The NIC metric first computes anomaly correlations between the model runs and the reference dataset and then computes the difference between the performance of each model run using a scale of −1 to +1 to highlight if the global or Central Asia data stream performs better with respect to the reference. To make the comparisons, the reference datasets (SMAP and SSEBop) were re-gridded to match the grid spacing and locations of the experiment model outputs.
3.1 Gridded rainfall comparison
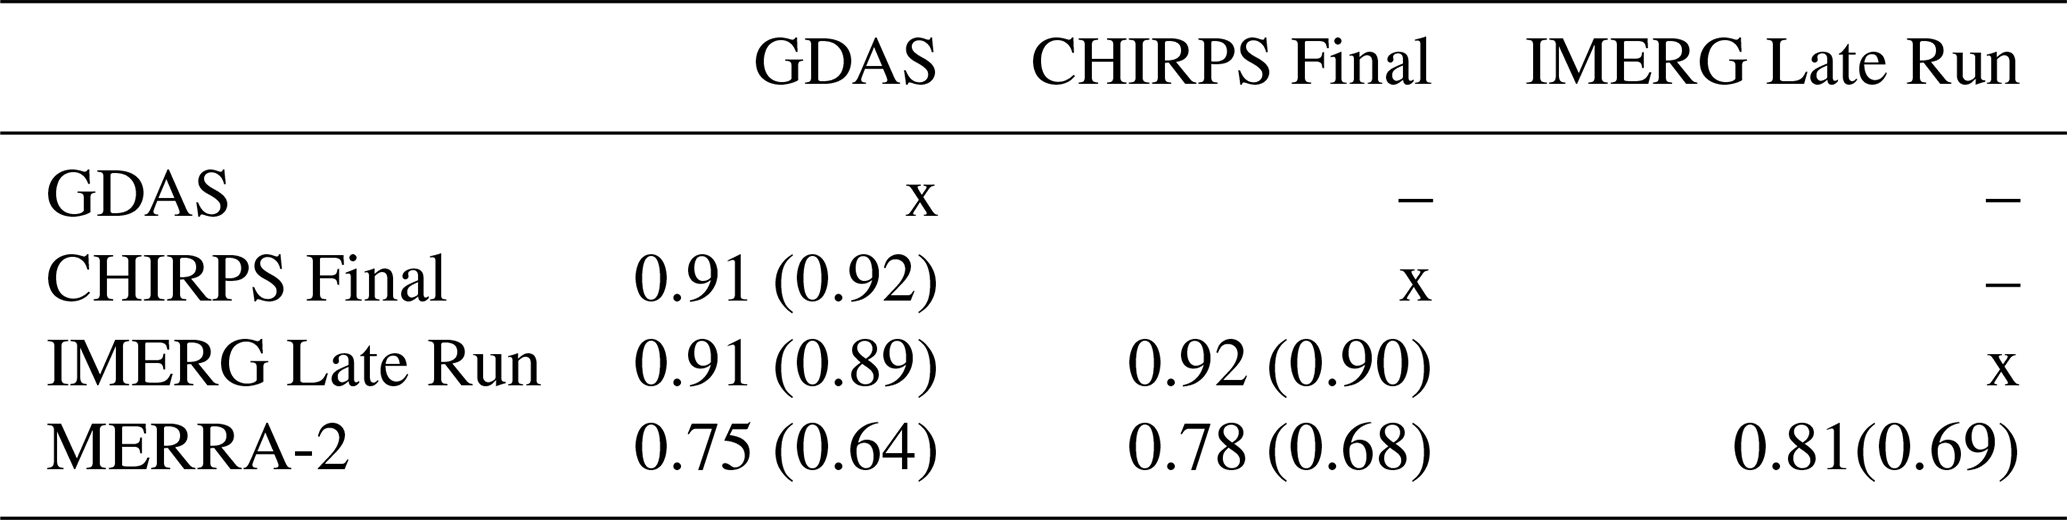
We have two data streams for Central Asia applications with different precipitation inputs: (1) the global data stream with CHIRPS precipitation at 10 km spatial resolution provides a long-term consistent data record; and (2) the Central Asia data stream with GDAS precipitation at 1 km provides near-real-time, finer-spatial-resolution updates. These two data streams have their respective errors and allow data users to apply a convergence of evidence approach for food and water security applications. This section presents a comparison of the GDAS and CHIRPS precipitation inputs used for the Central Asia and global data streams, respectively. We also include IMERG Late Run for comparison as a high-quality, low-latency product. Future work may incorporate the IMERG Late Run precipitation inputs into FLDAS simulations. We also include MERRA-2 precipitation for comparison. Pair-wise correlations are shown in Table 2. CHIRPS Final, IMERG Late Run, and GDAS (R≥0.90) are well correlated in terms of average daily precipitation (mm d−1) at the monthly and annual (i.e., water year) time steps. MERRA-2 correlations with these datasets are lower at the monthly () and water year () time steps. Figure 4 shows the time series of the precipitation products for their overlapping period of record (2001–2020), which illustrates how they vary in time, and shows some general patterns in terms of relative precipitation (in mm): GDAS (blue) and IMERG Late Run (purple) tend to have the highest precipitation totals, CHIRPS (green) has lower precipitation but is higher than MERRA-2 (yellow), which tends to have the lowest precipitation, until 2019 when it is notably higher than the other products.
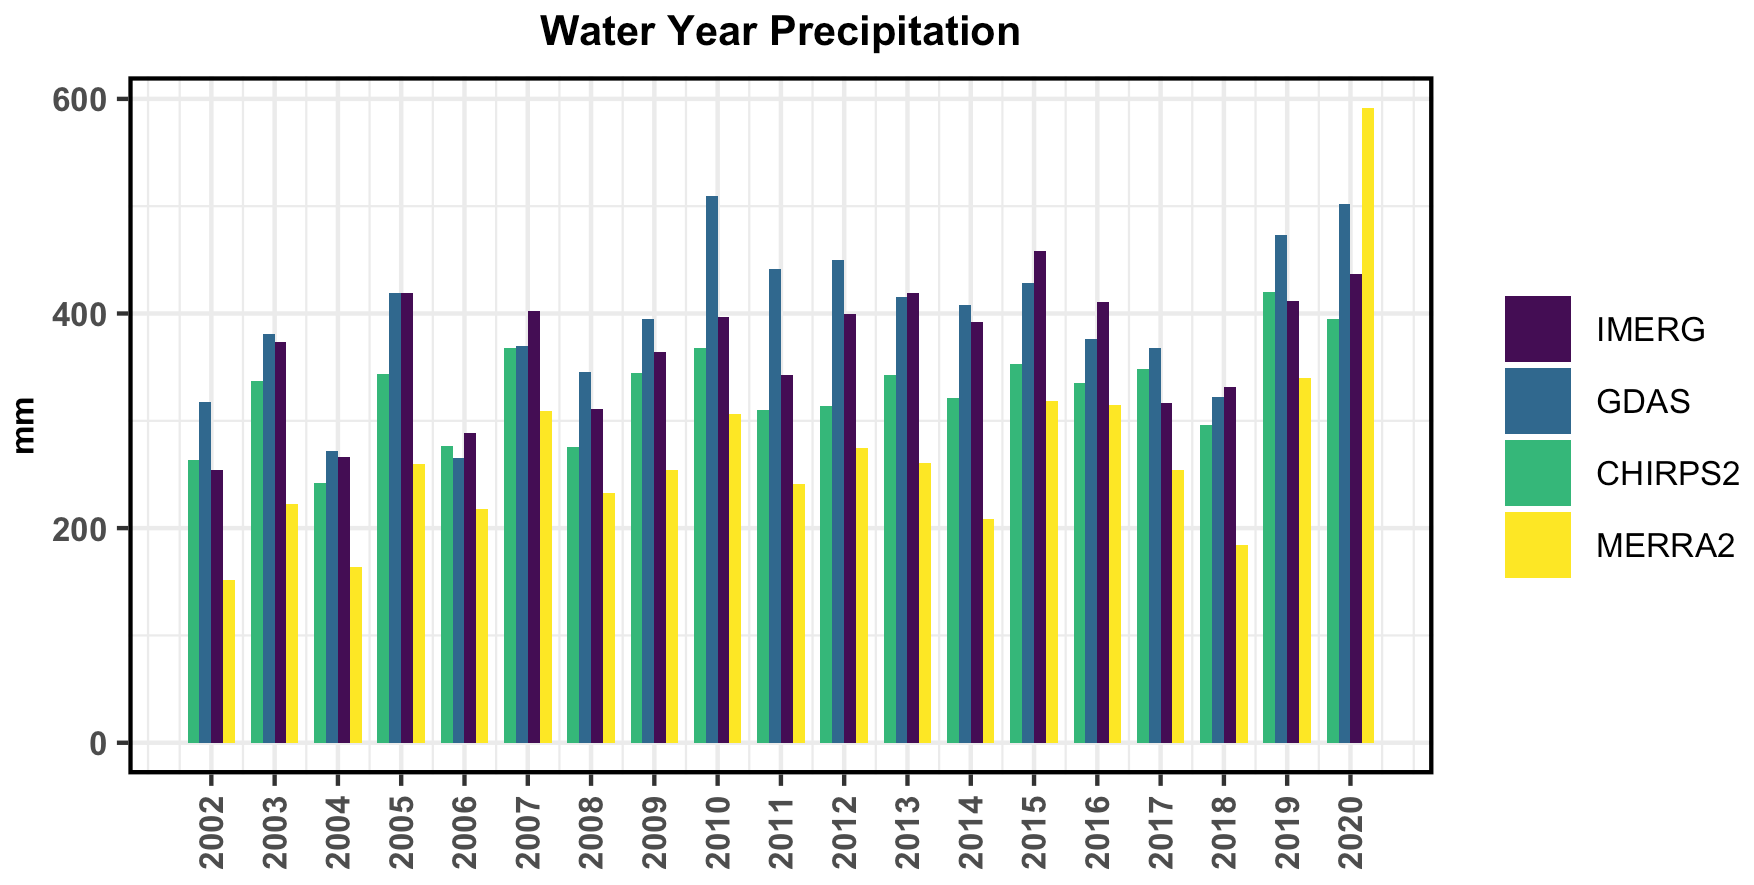
Table 2Afghanistan spatial average Spearman rank correlation (R) of monthly (water year) precipitation 2001–2020.
3.2 Remotely sensed and modeled snow comparisons
The estimation of snow is important for Afghanistan and Central Asia because it is a critical contributor to water resources and irrigated agriculture. We compared average SCF (Fig. 6a), POD, and FAR statistics (Fig. 6b) relative to MODIS SCF over eight hydrologic basins in Afghanistan.
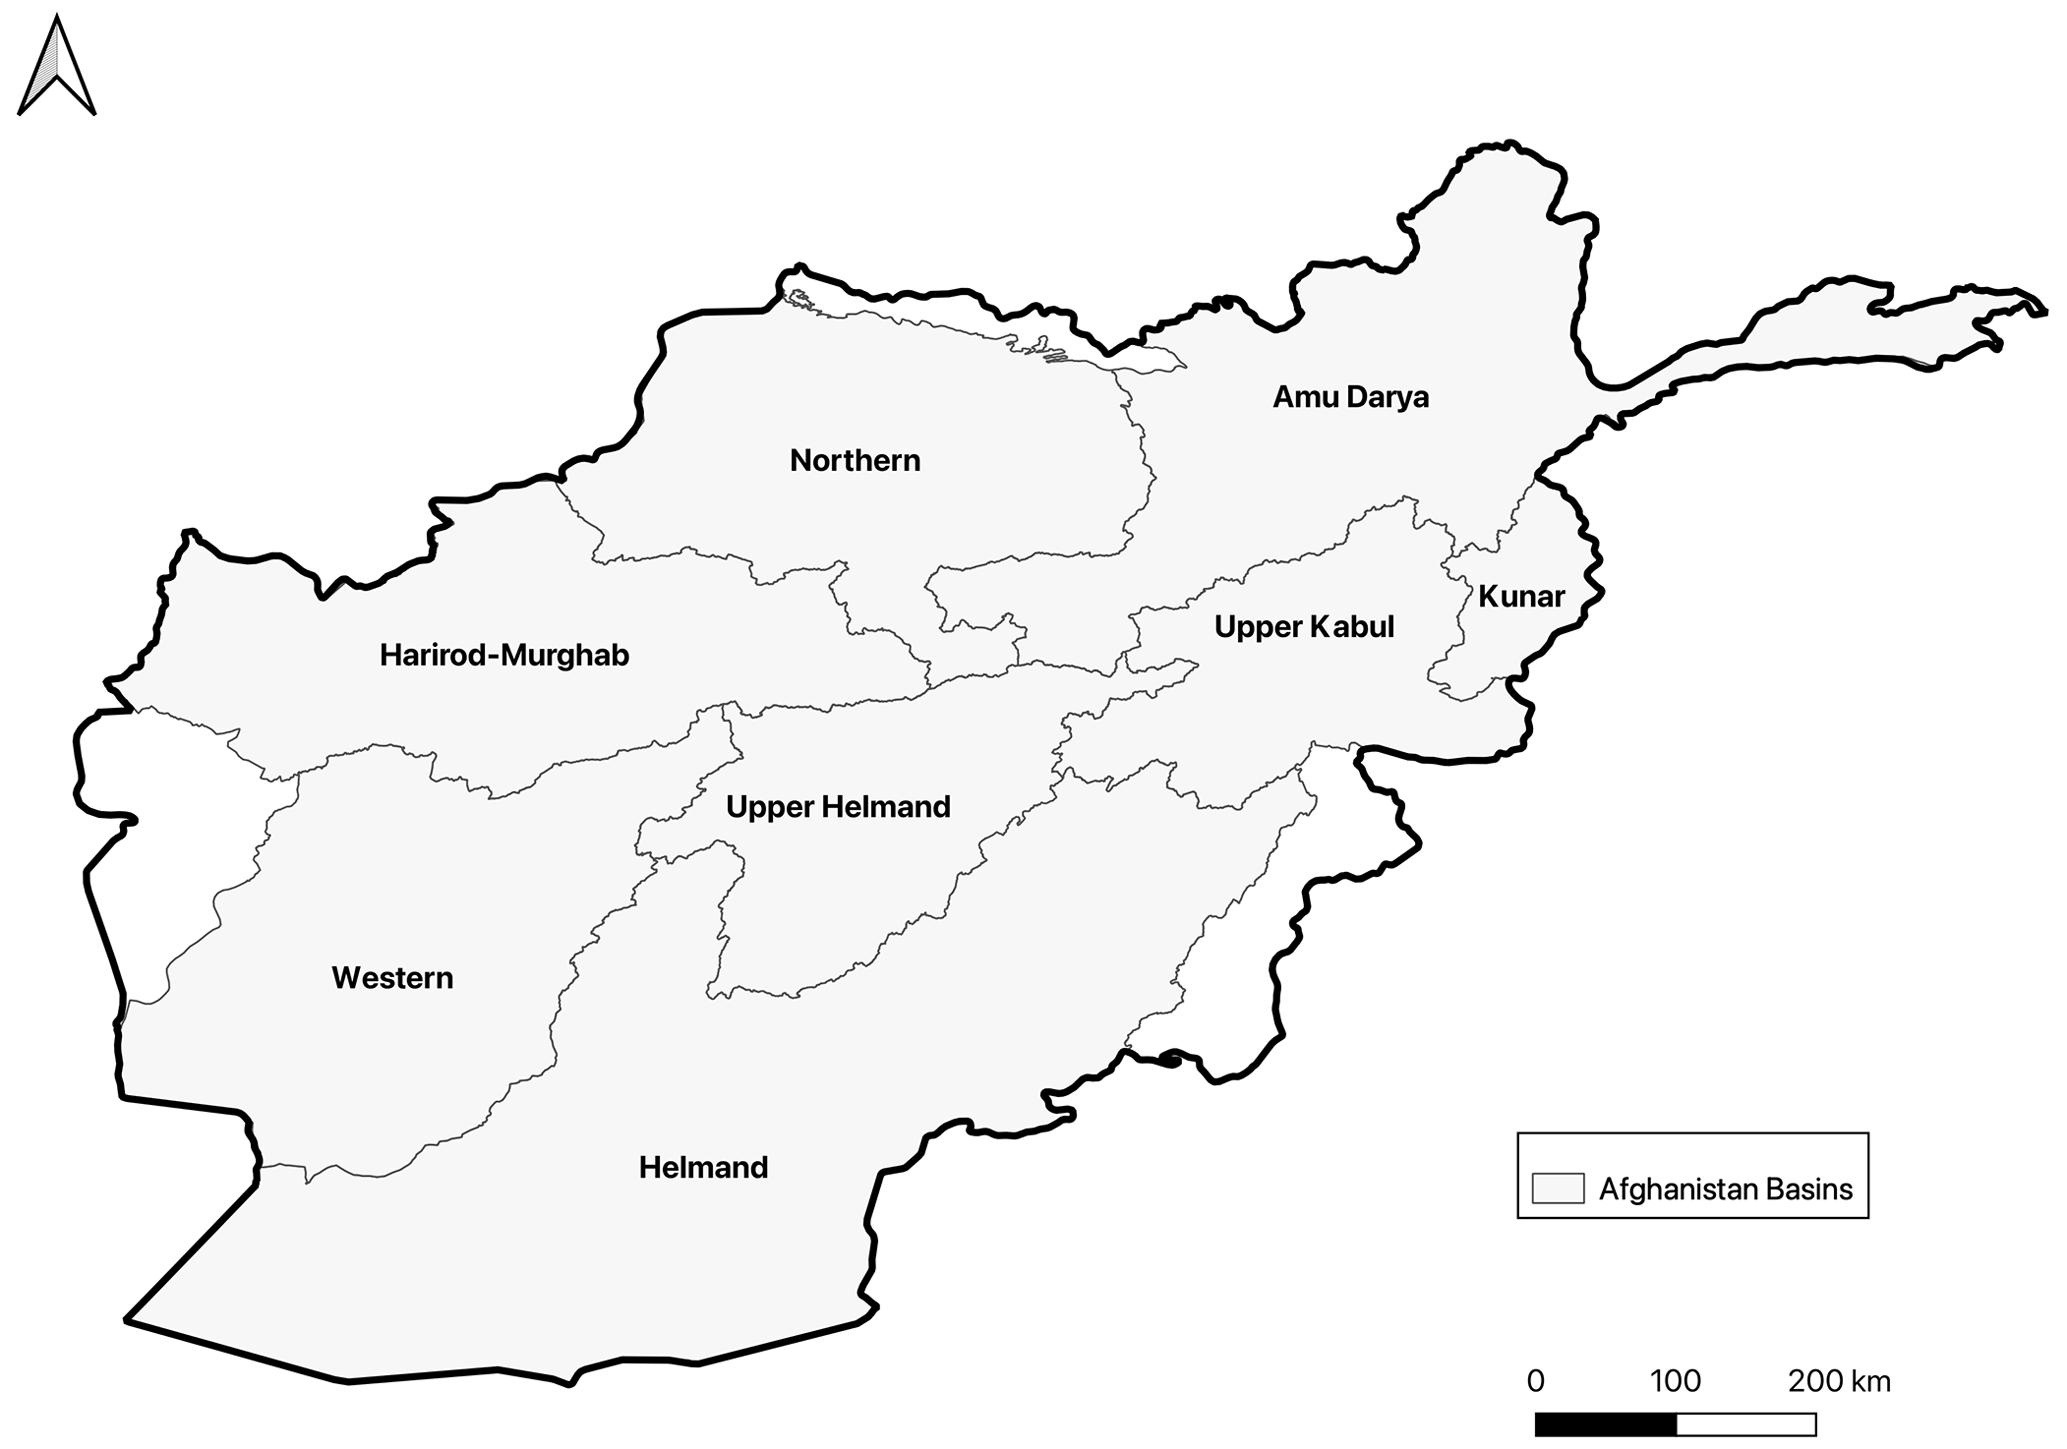
Figure 5Hydrologic basins used in the analysis of categorical statistics for snow-covered fraction.

Figure 6(a) Mean snow cover fraction for the entire area and by hydrologic basin for MODIS Snow Cover Fraction (SCF), Central Asia (CA), and global (GL) data streams for water year 2020. (b) Probability of detection (POD) of snow presence and false alarm rate (FAR) for the Central Asia (CA) and global data streams relative to the MODIS SCF for water year 2020.
Overall, both model runs estimate greater average SCF than the MODIS SCF product. The Central Asia data stream has consistently higher average snow cover for all basins compared to MODIS SCF estimates and the global data stream. It is perhaps not surprising that the Central Asia data stream performs consistently better in POD (by basin = ∼ 80 %) except for the western basin. Similarly, the FAR of the Central Asia data stream is higher where POD is higher except for the northern basin. The difference in statistics may be related to the different forcing inputs or the higher spatial resolution of the Central Asia data stream. Kumar et al. (2013) note that higher spatial resolution was important for snow-dominated basins.
In addition to precipitation and snow cover comparisons we conducted comparisons with remotely sensed soil moisture and ET (not shown). We found that in general, GDAS-derived estimates of ET consistently performed better over Afghanistan in terms of pixel-wise anomaly correlation and NIC with SSEBop ET. Meanwhile, neither modeled estimate of soil moisture consistently outperformed the other with respect to SMAP. The ET results lend some support to the quality of the Central Asia data stream estimates. However, the lack of signal in the soil moisture comparisons suggests that more careful analysis of the model and remote sensing errors is required before drawing conclusions regarding which data stream is “best”.
3.3 Discussion of results compared to previous studies
Despite the lack of ground-based observations, our analysis shows that the remotely sensed estimates and the models have good correspondence with other sources of evidence in terms of seasonal timing and performance. This provides analysts with confidence when using the FLDAS snow estimates, in tandem with other sources, as an input to food security assessments. Our approach is supported by other studies that have explored the challenges of evaluating hydrologic estimates over the region (Immerzeel et al., 2015; Ghatak et al., 2018; Yoon et al., 2019; Qamer et al., 2019).
Yoon et al. (2019) show that their LSM ensembles of SCF have an average POD of 72 % and FAR of 36 %, which are within the range of our POD and FAR statistics (60 %–80 % POD; 20 %–40 % FAR) compared to MODIS SCF. The categorical statistics indicate that Central Asia (GDAS) tends to have both a higher probability of detection and false alarm rate, indicating higher averages than MODIS SCF and global (CHIRPS).
With respect to the soil moisture and ET comparisons, we found that the Central Asia data stream estimates of ET were better correlated with SSEBop ET, but neither data stream was consistently better correlated with SMAP. These differences could be a function of non-precipitation differences or higher spatial resolution. Ghatak et al. (2018) also found that the choice of reference dataset (with its own characteristics and errors) was an important factor.
In general, given the lack of clarity on the “best” FLDAS data stream, the convergence of evidence approach allows us to consult both data streams, leveraging the longer time series of CHIRPS and the lower latency of GDAS.
3.4 Limitations and future developments
Given the need for multiple data streams for the convergence of evidence, we have summarized the pros and cons of the Central Asia and global data streams in Table 3.
Table 3Pros and cons of the two data streams.
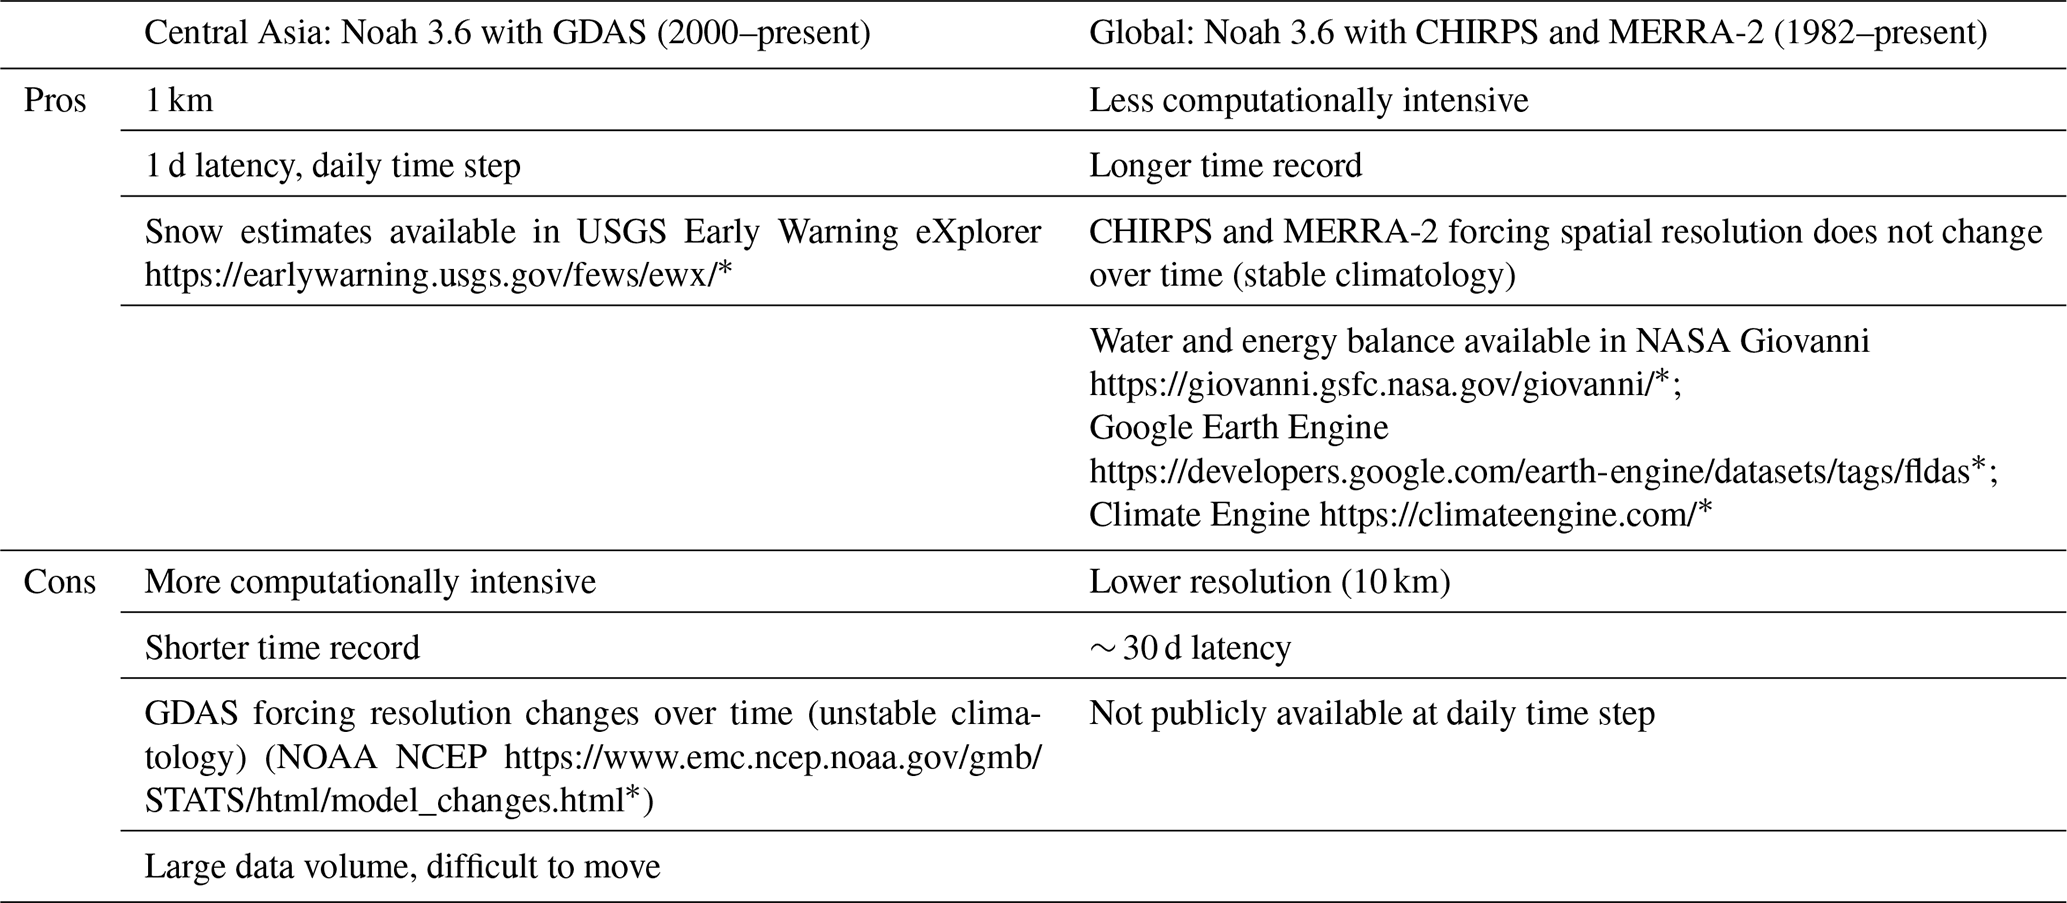
* Last access: 24 June 2022
IMERG version 6 was released in 2019 and includes rainfall estimates processed back to 2000. Prior to this change we had found encouraging results when comparing the onset of rainy season using both IMERG Late Run and CHIRPS (Kirschbaum et al., 2016). However, at that time the period of record was a limitation for computing anomalies. We now have an adequate period of record, and IMERG Late Run is planned to be part of the upcoming FLDAS global and FLDAS Central Asia releases. We are also encouraged by the quality of IMERG at the daily time step when compared to CHIRPS over the United States where accurate reference data are available (Sarmiento et al., 2021).
In addition to IMERG other promising rainfall datasets are in development. Ma et al. (2020) have developed the AIMERG dataset that combines IMERG Final Run with the APHRODITE rain-gauge-derived product (Yatagai et al., 2012). Another promising dataset is CHIMES (Funk et al., 2022), a blend of CHIRPS and IMERG, whose developers have been exploring the strengths and limitations of these two datasets and their fusion to produce an optimal product.
With respect to other FLDAS developments, FLDAS global and Central Asia are planned to be transitioned to Noah-MP. This will allow for improved representation of snowpack and groundwater. This will also necessitate the use of different parameters, e.g., leaf area index, as well as the potential to explore different parameter sets like ISRIC soils. In the meantime, multi-forcing and multi-model ensembles, as well as the convergence of evidence with other remotely sensed data and field reports, are a viable approach for providing hydrologic estimates for various applications.
These data from global and Central Asia data streams are routinely used in several FEWS NET information products listed in Table 4. NOAA's Climate Prediction Center (CPC) international desks provide a weekly briefing on the past week's weather conditions and 1–2-week forecasts for FEWS NET regions of interest, including Central Asia. There is also a monthly FEWS NET seasonal monitor and a monthly seasonal forecast review for which these data provide information on the current state of the snowpack, soil moisture, and runoff. These “observed conditions” can then be qualitatively combined with forecasts 1 week to many months in the future to assess potential hydro-meteorological hazards. To demonstrate the role of these data in the early warning process, at different points in the season, we provide an example of the 2017–2018 wet season in Afghanistan during a La Niña event that contributed to drought.
Table 4Routine applications of FLDAS Afghanistan hydrologic data.

* Last access: 24 June 2022
4.1 Snow monitoring and seasonal outlooks
As previously mentioned, and as shown in Fig. 7, Afghanistan and the broader region are strongly influenced by La Niña, which tends to increase the likelihood of below-average precipitation. Depending on this and antecedent conditions there in an increased likelihood of below-average snowpack, reduced springtime streamflow and flood risk, reduced summer irrigation water availability, and crop yield losses.
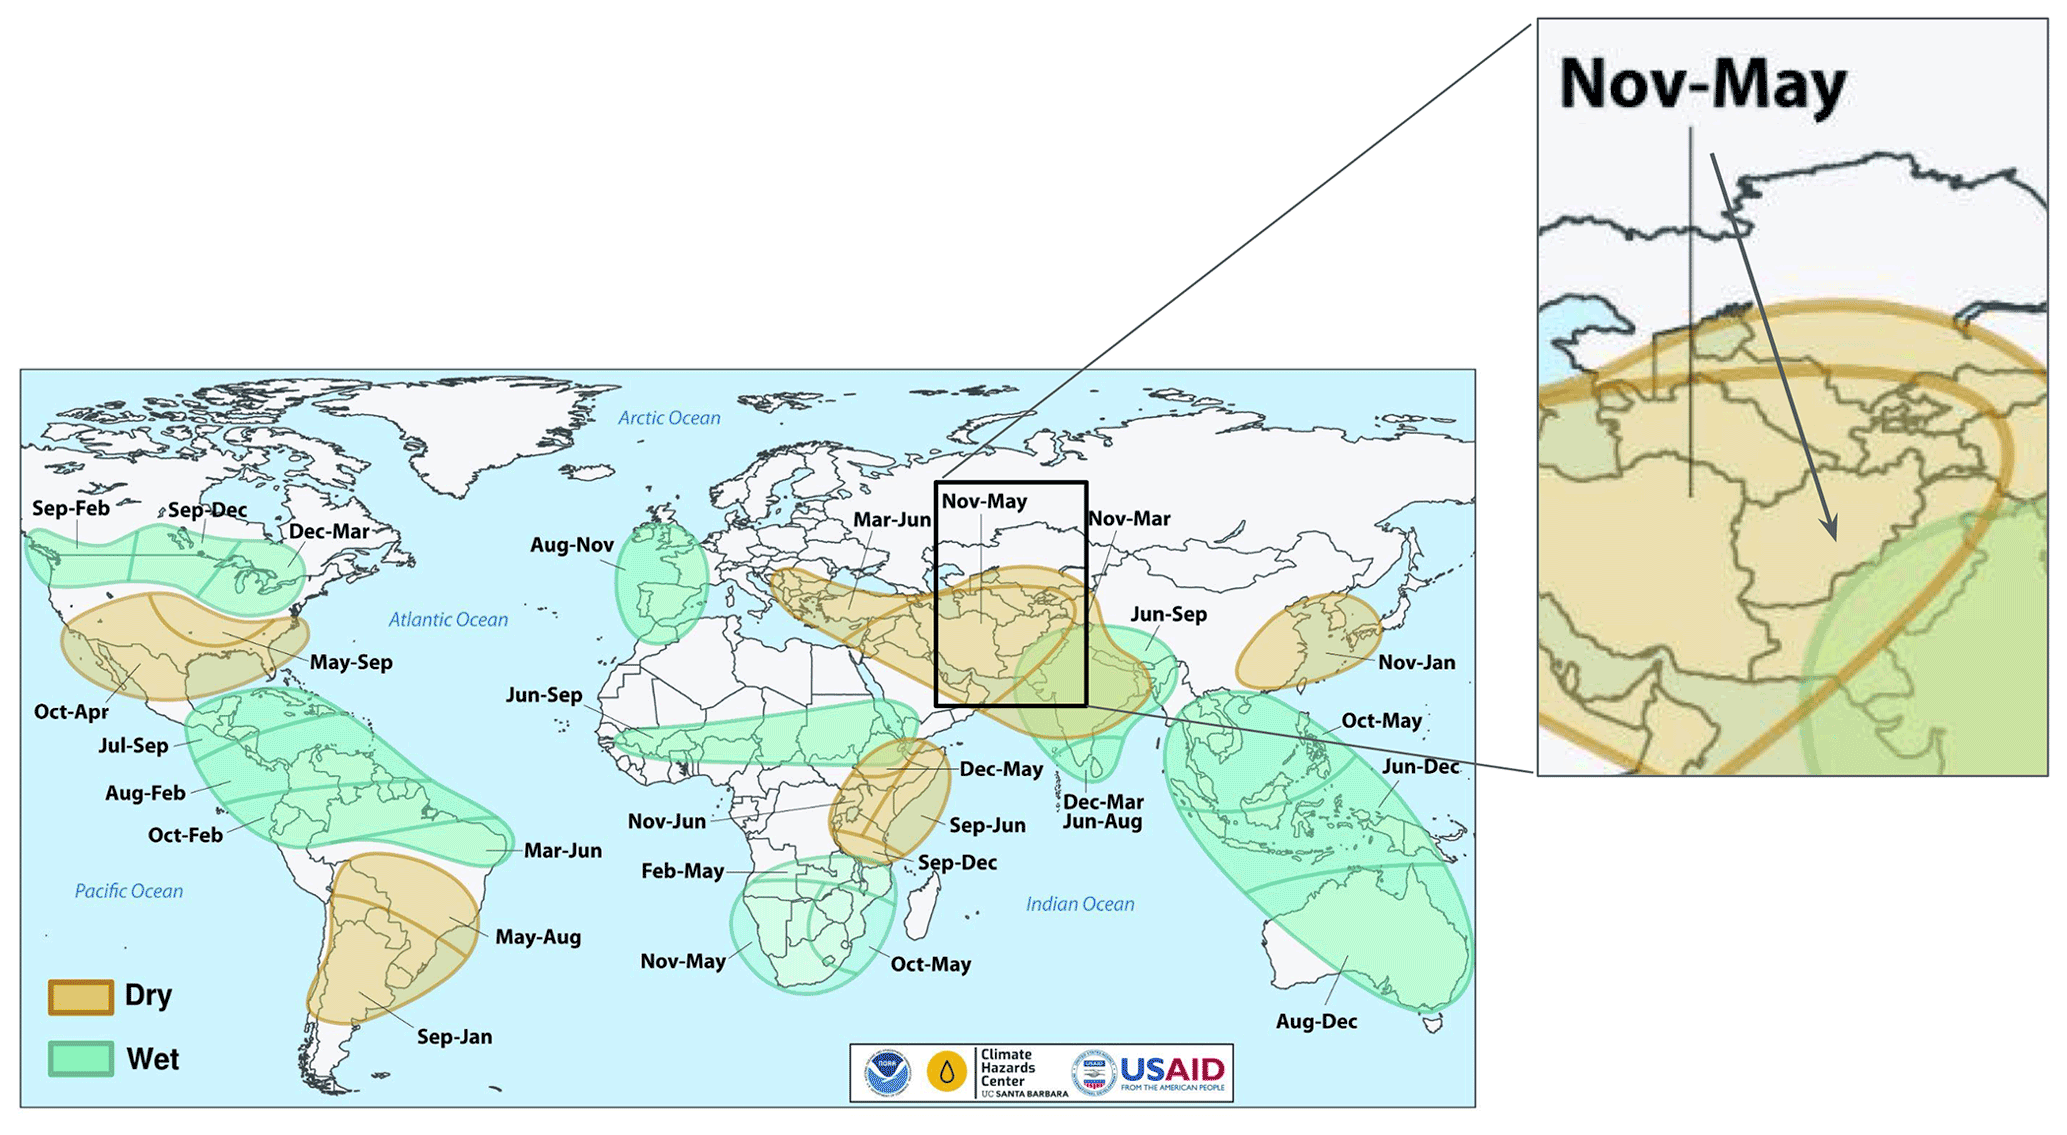
Figure 7Timing of wet and dry conditions related to La Niña. Increased likelihood of dry conditions from November–May for Afghanistan during La Niña events. Image from FEWS NET (2020b).
A La Niña Watch was issued by NOAA in September 2017 (NOAA, 2017). The FEWS NET October 2017 Food Security Outlook (FEWS NET, 2017a) stated that La Niña conditions were expected throughout the Northern Hemisphere in fall and winter and that below-average precipitation was likely over much of Central Asia, including Afghanistan, during the 2017–2018 wet season. With the expectation of below-average precipitation coupled with above-average temperatures, FEWS NET anticipated that snowpack would most likely be below average. In the context of food security outcomes, it was assumed that areas planted with winter wheat were likely to be less than usual, reducing land preparation activities and associated demand for labor. Two provinces of particular concern were Daykundi and Wardak (Fig. 8a; brown borders), both located in the Helmand River Basin (Fig. 8a; gray shading). Precipitation deficits in these provinces would lead to poor rangeland resources and pasture availability and would likely result in decreased livestock productivity and milk production through May. However, given that October was the start of the wet season, there remained a large spread of possible outcomes: spatial and temporal rainfall distributions and snowpack totals necessitating routine updates to assumptions.
Monitoring continued during the wet season, tracking observations from remote sensing, models, and field reports, as well as forecasts across timescales. This information was used to regularly update expectations of end-of-season outcomes. Using the FLDAS Central Asia data stream, an NOAA CPC weather hazards brief for 21 December 2017 reported that parts of northern and central Afghanistan remained atypically snow-free and that northeastern high-elevation areas exhibited SWE deficits. SWE is a commonly used measurement of the amount of liquid water contained within the snowpack, as well as an indicator of the amount of water that will be released from the snowpack when it melts. By 17 January 2018, an abnormal dryness polygon was placed over northeastern Afghanistan and the central highlands based on below-average SWE values from the FLDAS Central Asia estimates. Abnormal dryness is defined for an area that has registered cumulative 4-week precipitation and soil moisture ranking less than the 30th percentile, with a standardized precipitation index (SPI) of 0.4 standard deviations below the average. In addition, it is required that forecasts indicate below-average precipitation (less than 80 % of normal) for that area during the 1-week outlook period. By late February 2018, precipitation deficits and related SWE (Fig. 9) increased and met the criteria for “drought” (Fig. 8b). Drought is defined as an area that has previously been defined as having “abnormal dryness” and has continued to register seasonal precipitation and soil moisture deficits since the beginning of the rainfall season. Specifically, 8-week cumulative precipitation, soil moisture, and runoff below the 20th percentile rank and an SPI of 0.8 SD below the average are classification guidelines.

Figure 8(a) Map showing hydrological basins, with Helmand Basin in darker gray and location of Daykundi and Wardak provinces (outlined in red) where food security conditions were of particular concern. (b) NOAA CPC Afghanistan hazard report for 22–28 February 2018 (CPC NOAA, 2018) showing widespread abnormal dryness and drought, defined by 90 d precipitation deficits and extremely low snow water equivalent.
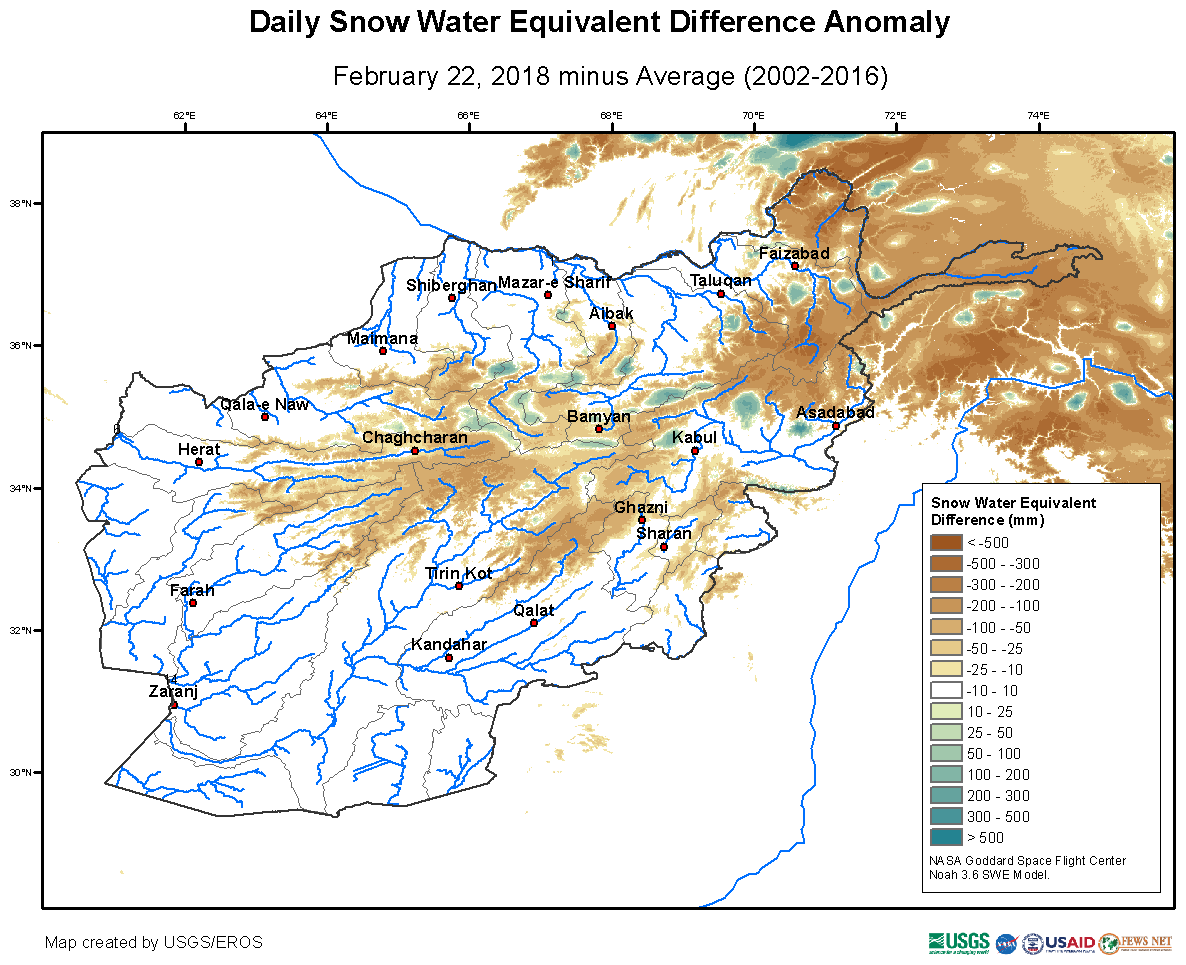
Figure 9FLDAS Central Asia snow water equivalent (SWE) estimates for 22 February 2018. SWE deficits of 300 mm were widespread at this time.
The February 2018 Food Security Outlook (FEWS NET, 2018b) provided the following updates, based on the CPC hazard reports and seasonal monitors: “Snow accumulation and cumulative precipitation were well below average for the season through February 2018, with some basins at or near record low snowpack, with data since 2002 … These factors will likely have an adverse impact on staple production in marginal irrigated areas and in many rainfed areas. [Moreover, with] forecasts for above-average temperatures during the spring and summer, rangeland conditions are expected to be poor during the period of analysis through September 2018. This could have an adverse impact on pastoralists and agro-pastoralists, particularly in areas where livestock movements are limited by conflict”. The Crop Monitor for Early Warning reports for February and March 2018 (GEOGLAM, 2018a, b) also cited reduced snowpack in Afghanistan and the negative impacts on winter wheat crops, as well as irrigation water availability in the spring. The story was also highlighted in NASA Earth Observatory March 2018 “Record Low Snowpack in Afghanistan” (NASA Earth Observatory, 2018).
The USGS Early Warning eXplorer (EWX) (Shukla et al., 2021) allows analysts to look at maps and time series for a variety of variables and specific provinces and river basins. Plots from EWX in Fig. 10 show below-average precipitation for provinces in the Helmand Basin for January and February. CHIRPS cumulative rainfall for 2017–2018 versus the 18-year average for Day Kundi (a.k.a. Daykundi) Province showed near-average conditions until December. From January, cumulative rainfall remained below the 2000–2018 average throughout the rest of the season ending in May; the same pattern occurred in nearby Uruzgan Province. In neighboring Maydan Wardak (a.k.a Wardak) Province, below-average conditions were experienced in January and February, but cumulative rainfall recovered in March to remain slightly above average. Day Kundi (Fig. 10b) and Wardak (Fig. 10c) are provinces located in the upper reaches of the Helmand Basin. Figure 10c shows SWE averaged across the entire Helmand basin. The gray shading indicates the range of the minimum and maximum values, and the dashed blue line is the average. Initial snow conditions start above average until December, after which SWE deficits are near record low values through the beginning of February and then persist at below-average levels.
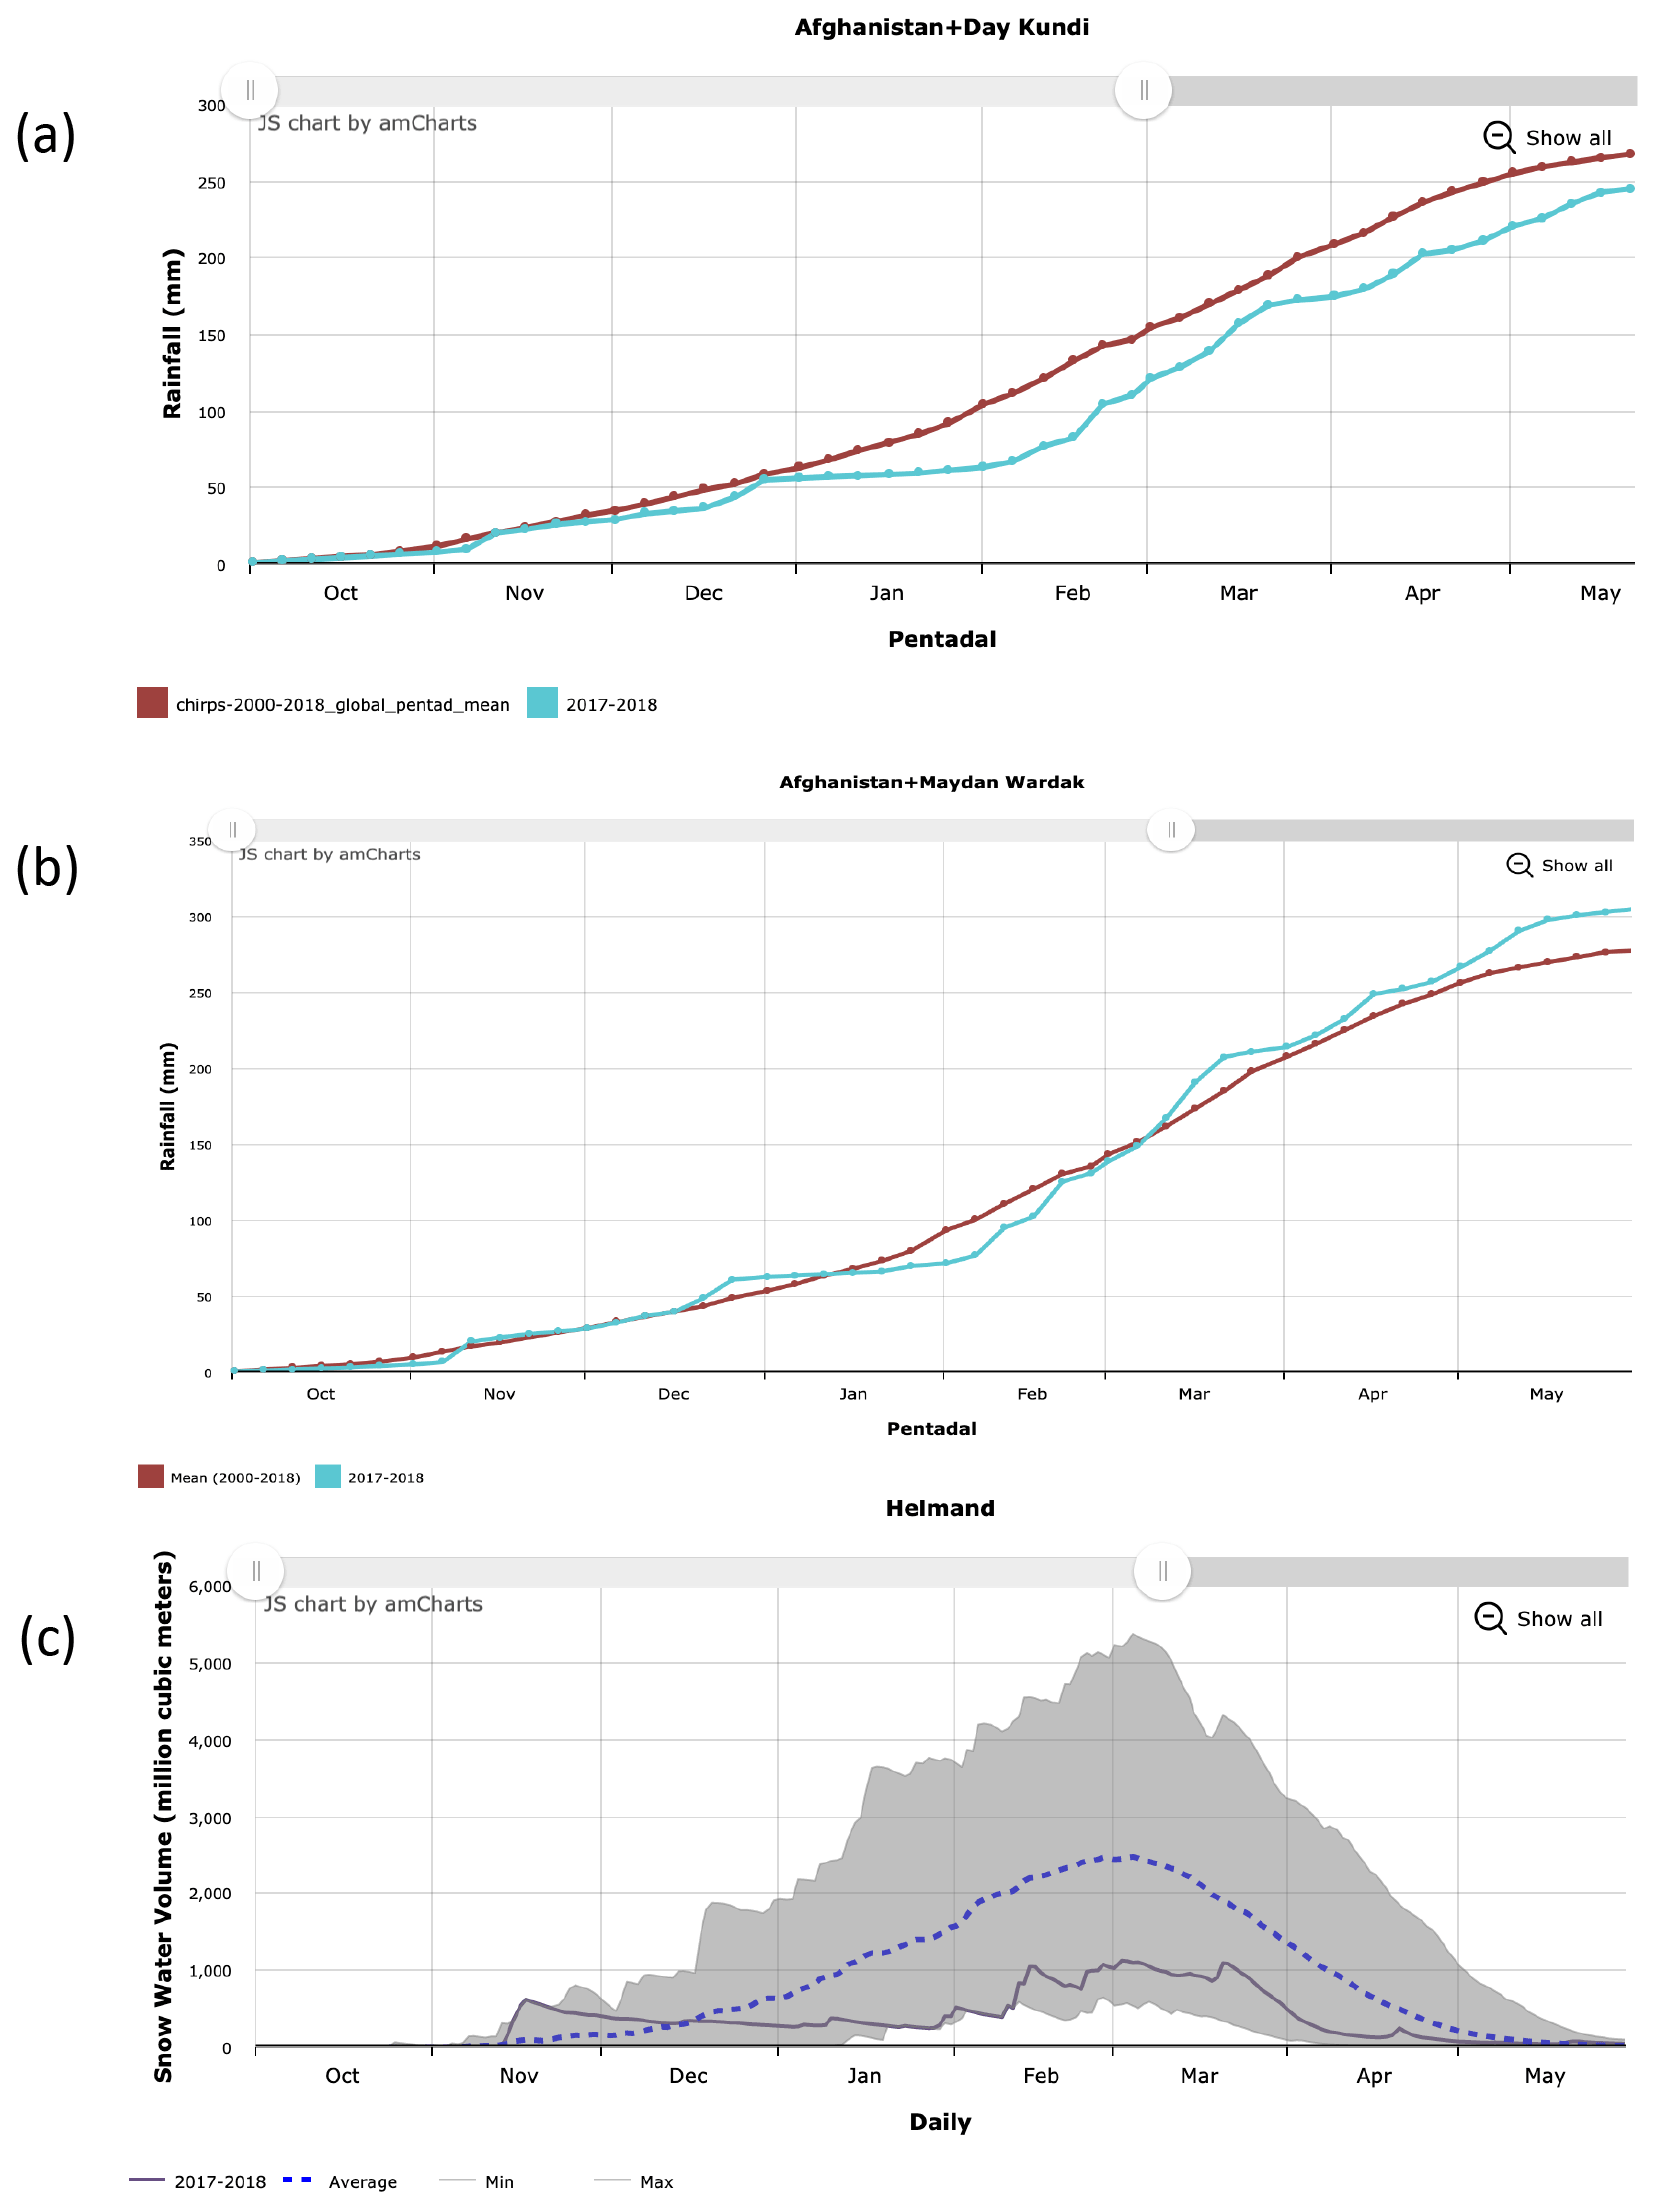
Figure 10(a) CHIRPS cumulative rainfall for 2017–2018 versus average conditions for Daykundi Province. (b) CHIRPS cumulative rainfall for 2017–2018 versus average conditions for Maydan Wardak Province and (c) Helmand Basin SWE from the FLDAS Central Asia data stream. The gray shading indicates the range of the minimum and maximum values, the dashed blue line is the average, and the black line is 2017–2018. Figures from USGS EWX (https://earlywarning.usgs.gov/fews/ewx/, last access: 24 June 2022).
By the end of the season in April 2018, FEWS NET (2018c) concluded that “below-average precipitation throughout most of the country during the October 2017–May 2018 wet season has led to very low snowpack … Low irrigation water availability is likely to have an adverse impact on yields for winter wheat and other … barley, maize, and others … particularly in downstream areas in regions with limited rainfall. … The poor performance of the wet season and above-average temperatures … exacerbated dry rangeland conditions in many areas, particularly in … Sari Pul, [and surrounding] … provinces. Pastoralists and agropastoralists in these areas will likely attempt to migrate to areas with better pasture and water availability or sell livestock at below-average prices”. At the same time, UNICEF (2018) reported in April 2018 that among “the [drought] affected provinces, Baghis, Bamyan, Daykundi, Ghor, Helmand, … and Uruzgan are of critical priority for nutrition and water, sanitation and hygiene assistance”.
Several months after a season has ended and harvest is complete, more statistics become available for further verification of the drought outcomes. The FEWS NET (2018a) October 2018 Food Security Outlook reported that the 2017–2018 drought had significant negative impacts on rainfed wheat production and livestock pasture and body conditions across the country. Reporting statistics from the Afghanistan Ministry of Agriculture, Irrigation, and Livestock, the total wheat production for the 2017–2018 season was about 20 % below average, in which irrigated agriculture performed about average. However, rainfed agricultural production was only about 50 % of average, most severely affecting households in Badakhshan, Badhis, and Daykundi provinces. In these locations dry conditions, conflict, poor incomes, and depleted assets were expected to continue to affect emergency food insecurity through May 2019.
The NASA Land Information System Framework (LISF) is publicly available and open-source software. The software and technical support are available at https://github.com/NASA-LIS/LISF (last access: 28 June 2022). The version used for this paper was LISF-public-7.3.2 https://doi.org/10.5281/zenodo.6795120 (Geiger and Kumar 2021).
The Central Asia data described in this paper can be accessed at the NASA GES DISC repository under data doi https://doi.org/10.5067/VQ4CD3Y9YC0R (Jacob and Slinski, 2021).
The global data described in this paper can be accessed at the NASA GES DISC repository under data doi https://doi.org/10.5067/5NHC22T9375G (McNally, 2018).
This paper describes a comprehensive hydrologic analysis system for food security monitoring in Central Asia, with analysis focusing on Afghanistan. While these data are tailored to specific needs, they are also applicable to other climate services and research. Our intent is to provide the reader with information regarding the configuration and specification of both the current global and Central Asia data streams. These data are publicly available and available at near-real time for food security decision support. Note that, as an on-going initiative, FLDAS model version and parameters are routinely updated, and the user should consult the version updates provided by the NASA Goddard Earth Science Data and Information Services Center (GES DISC) data provider and documentation on the USGS early warning website. For example, efforts are currently underway to upgrade to the Noah-MP (Niu et al., 2011) land surface model, which requires some changes in parameters for snow, glaciers, and groundwater. This, and future changes, can be informed by the strengths and weaknesses of the data stream configurations that we have discussed in this paper.
This paper also provides model–model and model–remote-sensing comparisons, as well as a review of other research, that highlight the challenges of the quantitative evaluation of models and remote sensing in this region. A key challenge to hydrologic modeling is the considerable uncertainty in the meteorological forcing available for this region, particularly precipitation. Advancements in remote sensing and modeling should help reduce these uncertainties. In addition, the current land surface modeling reflects natural conditions; i.e., they do not include representations of anthropogenic effects such as human water abstractions (e.g., dams for flood control or irrigation, water diversions, groundwater pumping) or land application of abstracted water (i.e., irrigation). These factors affect estimates of runoff, soil moisture, evapotranspiration, and sensible heat flux (land surface temperatures) in irrigated areas. Therefore, it is important to be aware of the limitations and combine the products with others (e.g., NDVI or actual evapotranspiration (ETa) in irrigated areas) when exploring water and energy balance. Even with improvements to meteorological forcing and modeling parameterizations, errors will remain. Therefore, the convergence of evidence approach is beneficial and would be important when assessing hydro-meteorological hazards and associated risks to food and water security. By making the data publicly available the broader food security and water resource communities will be able to provide insights that can lead to improvements in our understanding of the water and energy balance that can ultimately lead to improvements to food and water security decision support systems.
JJ runs the code, updates websites, and archives routinely. DPS maintains LISF code used in the paper, JJ, KA, DPS, and SP conducted model evaluation, and AM, KS, CPL, and SK contributed to the design of the evaluation. JR, MB, and SP manage the data for USGS distribution. AH and JPV provide feedback on data quality and interpretation. AM prepared the manuscript with contributions from all co-authors.
The authors Amy L. McNally, Kristi Arsenault, and Daniel P. Sarmiento are employed by the company SAIC. The remaining authors declare that the research was conducted in the absence of any commercial or financial relationships that could be construed as a potential conflict of interest.
Publisher’s note: Copernicus Publications remains neutral with regard to jurisdictional claims in published maps and institutional affiliations.
The authors wish to acknowledge the original version of the Central Asia snow modeling with LIS6 performed at NOAA National Operational Hydrologic Remote Sensing Center by Greg Fall and Logan Karsten. Computing resources have been provided by NASA's Center for Climate Simulation (NCCS). Distribution of data from the Goddard Earth Sciences Data and Information Services Center (GES DISC) is funded by NASA's Science Mission Directorate (SMD). We thank NOAA CPC International Desk for use of figures and the NASA Land Information System Team for software support and development. The authors also thank the USGS reviewer for comments that improved the quality of the manuscript.
USGS work was performed under U.S. Agency for International Development (USAID), Bureau of Humanitarian Assistance (BHA) PAPA AID-FFP-T-17-00003 and USGS contract 140G0119C0001. For Kimberly Slinski, Daniel P. Sarmiento, and Jossy Jacob work was performed under USAID BHA PAPA AID-FFP-T-17-00001. Kimberly Slinski acknowledges support from the NASA Harvest Consortium (NASA Applied Sciences grant no. 80NSSC17K0625).
This paper was edited by David Carlson and reviewed by two anonymous referees.
Arsenault, K. R., Houser, P. R., and De Lannoy, G. J. M.: Evaluation of the MODIS snow cover fraction product: Satellite-based snow cover fraction evaluation, Hydrol. Process., 28, 980–998, https://doi.org/10.1002/hyp.9636, 2014.
Arsenault, K. R., Kumar, S. V., Geiger, J. V., Wang, S., Kemp, E., Mocko, D. M., Beaudoing, H. K., Getirana, A., Navari, M., Li, B., Jacob, J., Wegiel, J., and Peters-Lidard, C. D.: The Land surface Data Toolkit (LDT v7.2) – a data fusion environment for land data assimilation systems, Geosci. Model Dev., 11, 3605–3621, https://doi.org/10.5194/gmd-11-3605-2018, 2018.
Barlage, M., Zeng, X., Wei, H., and Mitchell, K. E.: A global 0.05∘ maximum albedo dataset of snow-covered land based on MODIS observations: Maximum Albedo of Snow-covered, Geophys. Res. Lett., 32, L17405, https://doi.org/10.1029/2005GL022881, 2005.
Barlow, M., Wheeler, M., Lyon, B., and Cullen, H.: Modulation of Daily Precipitation over Southwest Asia by the Madden–Julian Oscillation, Mon. Weather Rev., 133, 3579–3594, https://doi.org/10.1175/MWR3026.1, 2005.
Barlow, M., Zaitchik, B., Paz, S., Black, E., Evans, J., and Hoell, A.: A Review of Drought in the Middle East and Southwest Asia, J. Climate, 29, 8547–8574, https://doi.org/10.1175/JCLI-D-13-00692.1, 2016.
Carroll, M., DiMiceli, C., Wooten, M., Hubbard, A., Sohlberg, R., and Townshend, J.: MOD44W MODIS/Terra Land Water Mask Derived from MODIS and SRTM L3 Global 250 m SIN Grid V006 NASA EOSDIS Land Processes DAAC [data set], https://doi.org/10.5067/MODIS/MOD44W.006, 2017.
Chen, F., Mitchell, K., Schaake, J., Xue, Y., Pan, H.-L., Koren, V., Duan, Q. Y., Ek, M., and Betts, A.: Modeling of land surface evaporation by four schemes and comparison with FIFE observations, J. Geophys. Res., 101, 7251–7268, https://doi.org/10.1029/95JD02165, 1996.
CIA World Factbook: Afghanistan, https://www.cia.gov/the-world-factbook/countries/afghanistan/#introduction, last access: 24 June 2022.
Cosgrove, B. A., Lohmann, D., Mitchell, K. E., Houser, P. R., Wood, E. F., Schaake, J. C., Robock, A., Marshall, C., Sheffield, J., Duan, Q., Luo, L., Higgins, R. W., Pinker, R. T., Tarpley, J. D., and Meng, J.: Real-time and retrospective forcing in the North American Land Data Assimilation System (NLDAS) project, J. Geophys. Res., 108, 2002JD003118, https://doi.org/10.1029/2002JD003118, 2003.
CPC NOAA: Weather Hazards Outlook of Afghanistan and Central Asia for the Period of February 22–28, https://www.cpc.ncep.noaa.gov/products/international/data.shtml (last access: 28 June 2022), 2018.
Csiszar, I. and Gutman, G.: Mapping global land surface albedo from NOAA AVHRR, J. Geophys. Res., 104, 6215–6228, https://doi.org/10.1029/1998JD200090, 1999.
Davenport, F. M., Harrison, L., Shukla, S., Husak, G., Funk, C., and McNally, A.: Using out-of-sample yield forecast experiments to evaluate which earth observation products best indicate end of season maize yields, Environ. Res. Lett., 14, 124095, https://doi.org/10.1088/1748-9326/ab5ccd, 2019.
Derber, J. C., Parrish, D. F., and Lord, S. J.: The New Global Operational Analysis System at the National Meteorological Center, Weather Forecast., 6, 538–547, https://doi.org/10.1175/1520-0434(1991)006<0538:TNGOAS>2.0.CO;2, 1991.
Dezfuli, A. K., Ichoku, C. M., Huffman, G. J., Mohr, K. I., Selker, J. S., van de Giesen, N., Hochreutener, R., and Annor, F. O.: Validation of IMERG Precipitation in Africa, J. Hydrometeorol., 18, 2817–2825, https://doi.org/10.1175/JHM-D-17-0139.1, 2017.
Ek, M. B., Mitchell, K. E., Lin, Y., Rogers, E., Grunmann, P., Koren, V., Gayno, G., and Tarpley, J. D.: Implementation of Noah land surface model advances in the National Centers for Environmental Prediction operational mesoscale Eta model, J. Geophys. Res., 108, 8851, https://doi.org/10.1029/2002JD003296, 2003.
Ellenburg, W. L., Mishra, V., Roberts, J. B., Limaye, A. S., Case, J. L., Blankenship, C. B., and Cressman, K.: Detecting Desert Locust Breeding Grounds: A Satellite-Assisted Modeling Approach, Remote Sensing, 13, 1276, https://doi.org/10.3390/rs13071276, 2021.
Entekhabi, D., Njoku, E. G., O'Neill, P. E., Kellogg, K. H., Crow, W. T., Edelstein, W. N., Entin, J. K., Goodman, S. D., Jackson, T. J., Johnson, J., Kimball, J., Piepmeier, J. R., Koster, R. D., Martin, N., McDonald, K. C., Moghaddam, M., Moran, S., Reichle, R., Shi, J. C., Spencer, M. W., Thurman, S. W., Tsang, L., and Zyl, J. V.: The Soil Moisture Active Passive (SMAP) Mission, P. IEEE, 98, 704–716, https://doi.org/10.1109/JPROC.2010.2043918, 2010.
Entekhabi, D., Das, N., Njoku, E. G., Johnson, J., and Shi, J. C.: SMAP L3 Radar/Radiometer Global Daily 9 km EASE-Grid Soil Moisture, Version 3, NASA National Snow and Ice Data Center DAAC [data set], https://doi.org/10.5067/7KKNQ5UURM2W, 2016.
FEWS NET: Afghanistan Food Security Outlook October 2017–May 2018 Conflict, dry spells, and weak labor opportunities will lead to deterioration in outcomes during 2018 lean season, https://fews.net/central-asia/afghanistan/food-security-outlook/october-2017 (last access: 28 June 2022), 2017a.
FEWS NET: Update on performance of the October 2016–May 2017 wet season, https://fews.net/central-asia/afghanistan/special-report/february-10-2017 (last access: 28 June 2022), 2017b.
FEWS NET: Afghanistan Food Security Outlook: Emergency assistance needs are atypically high through the lean season across the country, FEWS NET, https://fews.net/sites/default/files/documents/reports/AFGHANISTAN Food Security Outlook Oct. 2018 - May 2019.pdf (last access: 28 June 2022), 2018a.
FEWS NET: Afghanistan Food Security Outlook February to September 2018: Low snow accumulation and dry soil conditions likely to impact 2018 staple production, https://fews.net/sites/default/files/documents/reports/AFGHANISTAN Food Security Outlook_Feb_Sept 2018.pdf (last access: 28 June 2022), 2018b.
FEWS NET: Afghanistan Food Security Outlook Update April 2018: Poor rangeland conditions and below-average water availability will limit seasonal improvements, https://fews.net/central-asia/afghanistan/food-security-outlook-update/april-2018 (last access: 28 June 2022), 2018c.
FEWS NET: El Niño and Precipitation, FEWS NET, https://fews.net/el-nino-and-precipitation (last access:, last access: 28 June 2022), 2020a.
FEWS NET: La Niña and Precipitation, FEWS NET, https://fews.net/la-nina-and-precipitation(last access:, last access: 28 June 2022), 2020b.
FEWS NET: Afghanistan Food Security Outlook February to September 2021: Below-average precipitation likely to drive below-average agricultural and livestock production in 2021, https://fews.net/sites/default/files/documents/reports/AFGHANISTAN_Food_Security_Outlook_FINAL_1.pdf (last access: 28 June 2022), 2021.
Funk, C., Peterson, P., Landsfeld, M., Pedreros, D., Verdin, J., Shukla, S., Husak, G., Rowland, J., Harrison, L., Hoell, A., and Michaelsen, J.: The climate hazards infrared precipitation with stations – a new environmental record for monitoring extremes, Sci. Data, 2, 150066, https://doi.org/10.1038/sdata.2015.66, 2015.
Funk, C. C., Peterson, P., Huffman, G. J., Landsfeld, M. F., Peters-Lidard, C., Davenport, F., Shukla, S., Peterson, S., Pedreros, D. H., Ruane, A. C., Mutter, C., Turner, W., Harrison, L., Sonnier, A., Way-Henthorne, J., and Husak, G. J.: Introducing and Evaluating the Climate Hazards Center IMERG with Stations (CHIMES): Timely Station-Enhanced Integrated Multisatellite Retrievals for Global Precipitation Measurement, B. Am. Meteorol. Soc., 103, E429–E454, https://doi.org/10.1175/BAMS-D-20-0245.1, 2022.
Gadelha, A. N., Coelho, V. H. R., Xavier, A. C., Barbosa, L. R., Melo, D. C. D., Xuan, Y., Huffman, G. J., Petersen, W. A., and Almeida, C. D. N.: Grid box-level evaluation of IMERG over Brazil at various space and time scales, Atmos. Res., 218, 231–244, https://doi.org/10.1016/j.atmosres.2018.12.001, 2019.
Geiger, J. and Kumar, S.: Land Information System Framework version LISF-public-7.3.2 forked as almcnall/LISF: LISF-public-7.3.2, Zenodo [code], https://doi.org/10.5281/zenodo.6795120, 2021.
Gelaro, R., McCarty, W., Suárez, M. J., Todling, R., Molod, A., Takacs, L., Randles, C. A., Darmenov, A., Bosilovich, M. G., Reichle, R., Wargan, K., Coy, L., Cullather, R., Draper, C., Akella, S., Buchard, V., Conaty, A., da Silva, A. M., Gu, W., Kim, G.-K., Koster, R., Lucchesi, R., Merkova, D., Nielsen, J. E., Partyka, G., Pawson, S., Putman, W., Rienecker, M., Schubert, S. D., Sienkiewicz, M., and Zhao, B.: The Modern-Era Retrospective Analysis for Research and Applications, Version 2 (MERRA-2), J. Climate, 30, 5419–5454, https://doi.org/10.1175/JCLI-D-16-0758.1, 2017.
GEOGLAM: Early Warning Crop Monitor February 2018, https://cropmonitor.org/documents/EWCM/reports/EarlyWarning_CropMonitor_201802.pdf (last access: 28 June 2022), 2018a.
GEOGLAM: Early Warning Crop Monitor March 2018, https://cropmonitor.org/documents/EWCM/reports/EarlyWarning_CropMonitor_201803.pdf (last access: 28 June 2022), 2018b.
Ghatak, D., Zaitchik, B., Kumar, S., Matin, M. A., Bajracharya, B., Hain, C., and Anderson, M.: Influence of Precipitation Forcing Uncertainty on Hydrological Simulations with the NASA South Asia Land Data Assimilation System, Hydrology, 5, 57, https://doi.org/10.3390/hydrology5040057, 2018.
Grace, K. and Davenport, F.: Climate variability and health in extremely vulnerable communities: investigating variations in surface water conditions and food security in the West African Sahel, Popul. Environ., 42, 553–577, https://doi.org/10.1007/s11111-021-00375-9, 2021.
Gutman, G. and Ignatov, A.: The derivation of the green vegetation fraction from NOAA/AVHRR data for use in numerical weather prediction models, Int. J. Remote Sens., 19, 1533–1543, https://doi.org/10.1080/014311698215333, 1998.
Hall, D. and Riggs, G.: MODIS/Terra Snow Cover Daily L3 Global 500 m SIN Grid, version 6, National Snow and Ice Data Center Distributed Active Archive Center [data set], https://doi.org/10.5067/MODIS/MOD10A1.006, 2016.
Hengl, T., Jesus, J. M. de, Heuvelink, G. B. M., Gonzalez, M. R., Kilibarda, M., Blagotić, A., Shangguan, W., Wright, M. N., Geng, X., Bauer-Marschallinger, B., Guevara, M. A., Vargas, R., MacMillan, R. A., Batjes, N. H., Leenaars, J. G. B., Ribeiro, E., Wheeler, I., Mantel, S., and Kempen, B.: SoilGrids250m: Global gridded soil information based on machine learning, PLOS ONE, 12, e0169748, https://doi.org/10.1371/journal.pone.0169748, 2017.
Hewitt, C., Mason, S., and Walland, D.: The Global Framework for Climate Services, Nat. Clim. Change, 2, 831–832, https://doi.org/10.1038/nclimate1745, 2012.
Hoell, A., Funk, C., and Barlow, M.: The Forcing of Southwestern Asia Teleconnections by Low-Frequency Sea Surface Temperature Variability during Boreal Winter, J. Climate, 28, 1511–1526, https://doi.org/10.1175/JCLI-D-14-00344.1, 2015.
Hoell, A., Barlow, M., Cannon, F., and Xu, T.: Oceanic Origins of Historical Southwest Asia Precipitation During the Boreal Cold Season, J. Climate, 30, 2885–2903, https://doi.org/10.1175/JCLI-D-16-0519.1, 2017.
Hoell, A., Cannon, F., and Barlow, M.: Middle East and Southwest Asia Daily Precipitation Characteristics Associated with the Madden–Julian Oscillation during Boreal Winter, J. Climate, 31, 8843–8860, https://doi.org/10.1175/JCLI-D-18-0059.1, 2018.
Hoell, A., Eischeid, J., Barlow, M., and McNally, A.: Characteristics, precursors, and potential predictability of Amu Darya Drought in an Earth system model large ensemble, Clim. Dynam., 55, 2185–2206, https://doi.org/10.1007/s00382-020-05381-5, 2020.
Huffman, G. J., Stocker, E. F., Bolvin, D. T., Nelkin, E. J., and Tan, J.: GPM IMERG Late Precipitation L3 1 day 0.1 degree × 0.1 degree V06, Edited by Andrey Savtchenko, Greenbelt, MD, Goddard Earth Sciences Data and Information Services Center (GES DISC) [data set], https://doi.org/10.5067/GPM/IMERGDL/DAY/06, 2019.
Huffman, G. J., Bolvin, D. T., Braithwaite, D., Hsu, K.-L., Joyce, R. J., Kidd, C., Nelkin, E. J., Sorooshian, S., Stocker, E. F., Tan, J., Wolff, D. B., and Xie, P.: Integrated Multi-satellite Retrievals for the Global Precipitation Measurement (GPM) Mission (IMERG), in: Satellite Precipitation Measurement: Volume 1, edited by: Levizzani, V., Kidd, C., Kirschbaum, D. B., Kummerow, C. D., Nakamura, K., and Turk, F. J., Springer International Publishing, Cham, 343–353, ISBN 978-3-030-24568-9, https://doi.org/10.1007/978-3-030-24568-9_19, 2020.
Immerzeel, W. W., Wanders, N., Lutz, A. F., Shea, J. M., and Bierkens, M. F. P.: Reconciling high-altitude precipitation in the upper Indus basin with glacier mass balances and runoff, Hydrol. Earth Syst. Sci., 19, 4673–4687, https://doi.org/10.5194/hess-19-4673-2015, 2015.
Jacob, J. and Slinski, K.: FLDAS Noah Land Surface Model L4 Central Asia Daily 0.01 × 0.01 degree, Greenbelt, MD, USA, Goddard Earth Sciences Data and Information Services Center (GES DISC) [data set], https://doi.org/10.5067/VQ4CD3Y9YC0R, 2021.
Jung, H. C., Getirana, A., Policelli, F., McNally, A., Arsenault, K. R., Kumar, S., Tadesse, T., and Peters-Lidard, C. D.: Upper Blue Nile basin water budget from a multi-model perspective, J. Hydrol., 555, 535–546, https://doi.org/10.1016/j.jhydrol.2017.10.040, 2017.
Jung, H. C., Getirana, A., Arsenault, K. R., Holmes, T. R. H., and McNally, A.: Uncertainties in Evapotranspiration Estimates over West Africa, Remote Sensing, 11, 892, https://doi.org/10.3390/rs11080892, 2019.
Kato, H. and Rodell, M.: Sensitivity of Land Surface Simulations to Model Physics, Land Characteristics, and Forcings, at Four CEOP Sites, J. Meteorol. Soc. Jpn. Ser. II, 85A, 187–204, https://doi.org/10.2151/jmsj.85A.187, 2007.
Kirschbaum, D. B., Huffman, G. J., Adler, R. F., Braun, S., Garrett, K., Jones, E., McNally, A., Skofronick-Jackson, G., Stocker, E., Wu, H., and Zaitchik, B. F.: NASA's Remotely Sensed Precipitation: A Reservoir for Applications Users, B. Am. Meteorol. Soc., 98, 1169–1184, https://doi.org/10.1175/BAMS-D-15-00296.1, 2016.
Kumar, S. V., Peters-Lidard, C. D., Tian, Y., Houser, P. R., Geiger, J., Olden, S., Lighty, L., Eastman, J. L., Doty, B., Dirmeyer, P., Adams, J., Mitchell, K., Wood, E. F., and Sheffield, J.: Land information system: An interoperable framework for high resolution land surface modeling, Environ. Modell. Softw., 21, 1402–1415, https://doi.org/10.1016/j.envsoft.2005.07.004, 2006.
Kumar, S. V., Peters-Lidard, C. D., Santanello, J., Harrison, K., Liu, Y., and Shaw, M.: Land surface Verification Toolkit (LVT) – a generalized framework for land surface model evaluation, Geosci. Model Dev., 5, 869–886, https://doi.org/10.5194/gmd-5-869-2012, 2012.
Kumar, S. V., Peters-Lidard, C. D., Mocko, D., and Tian, Y.: Multiscale Evaluation of the Improvements in Surface Snow Simulation through Terrain Adjustments to Radiation, J. Hydrometeorol., 14, 220–232, https://doi.org/10.1175/JHM-D-12-046.1, 2013.
Ma, Z., Xu, J., Zhu, S., Yang, J., Tang, G., Yang, Y., Shi, Z., and Hong, Y.: AIMERG: a new Asian precipitation dataset (0.1∘/half-hourly, 2000–2015) by calibrating the GPM-era IMERG at a daily scale using APHRODITE, Earth Syst. Sci. Data, 12, 1525–1544, https://doi.org/10.5194/essd-12-1525-2020, 2020.
Manz, B., Páez-Bimos, S., Horna, N., Buytaert, W., Ochoa-Tocachi, B., Lavado-Casimiro, W., and Willems, B.: Comparative Ground Validation of IMERG and TMPA at Variable Spatiotemporal Scales in the Tropical Andes, J. Hydrometeorol., 18, 2469–2489, https://doi.org/10.1175/JHM-D-16-0277.1, 2017.
McNally, A.: GES DISC Dataset: FLDAS Noah Land Surface Model L4 Global Monthly 0.1 0.1 degree (MERRA-2 and CHIRPS) (FLDAS_NOAH01_C_GL_M 001), NASA [data set], https://doi.org/10.5067/5NHC22T9375G, 2018.
McNally, A., Husak, G. J., Brown, M., Carroll, M., Funk, C., Yatheendradas, S., Arsenault, K., Peters-Lidard, C., and Verdin, J. P.: Calculating Crop Water Requirement Satisfaction in the West Africa Sahel with Remotely Sensed Soil Moisture, J. Hydrometeorol., 16, 295–305, https://doi.org/10.1175/JHM-D-14-0049.1, 2015.
McNally, A., Shukla, S., Arsenault, K. R., Wang, S., Peters-Lidard, C. D., and Verdin, J. P.: Evaluating ESA CCI soil moisture in East Africa, Int. J. Appl. Earth Obs., 48, 96–109, https://doi.org/10.1016/j.jag.2016.01.001, 2016.
McNally, A., Arsenault, K., Kumar, S., Shukla, S., Peterson, P., Wang, S., Funk, C., Peters-lidard, C. D., and Verdin, J. P.: A land data assimilation system for sub-Saharan Africa food and water security applications, Scientific Data, 4, 170012, https://doi.org/10.1038/sdata.2017.12, 2017.
McNally, A., McCartney, S., Ruane, A. C., Mladenova, I. E., Whitcraft, A. K., Becker-Reshef, I., Bolten, J. D., Peters-Lidard, C. D., Rosenzweig, C., and Uz, S. S.: Hydrologic and Agricultural Earth Observations and Modeling for the Water-Food Nexus, Front. Environ. Sci., 7, 23, https://doi.org/10.3389/fenvs.2019.00023, 2019.
Miller, J., Barlage, M., Zeng, X., Wei, H., Mitchell, K., and Tarpley, D.: Sensitivity of the NCEP/Noah land surface model to the MODIS green vegetation fraction data set, Geophys. Res. Lett., 33, L13404, https://doi.org/10.1029/2006GL026636, 2006.
Molteni, F., Buizza, R., Palmer, T. N., and Petroliagis, T.: The ECMWF Ensemble Prediction System: Methodology and validation, Q. J. Roy. Meteor. Soc., 122, 73–119, https://doi.org/10.1002/qj.49712252905, 1996.
NASA Earth Observatory: Record Low Snowpack in Afghanistan, NASA Earth Observatory, https://earthobservatory.nasa.gov/images/91851/record-low-snowpack-in-afghanistan (last access: 28 June 2022), 2018.
NASA JPL: NASA Shuttle Radar Topography Mission Global 30 arc second, NASA EOSDIS Land Processes DAAC, NASA EOSDIS Land Processes DAAC, NASA EOSDIS Land Processes DAAC [data set], https://doi.org/10.5067/MEaSUREs/SRTM/SRTMGL30.002, 2013.
Nazemosadat, M. J. and Ghaedamini, H.: On the Relationships between the Madden–Julian Oscillation and Precipitation Variability in Southern Iran and the Arabian Peninsula: Atmospheric Circulation Analysis, J. Climate, 23, 887–904, https://doi.org/10.1175/2009JCLI2141.1, 2010.
NCAR Research Applications Library: UNIFIED NOAH LSM, https://ral.ucar.edu/solutions/products/unified-noah-lsm, last access: 12 November 2021.
Niu, G.-Y., Yang, Z.-L., Mitchell, K. E., Chen, F., Ek, M. B., Barlage, M., Kumar, A., Manning, K., Niyogi, D., Rosero, E., Tewari, M., and Xia, Y.: The community Noah land surface model with multiparameterization options (Noah-MP): 1. Model description and evaluation with local-scale measurements, J. Geophys. Res., 116, D12109, https://doi.org/10.1029/2010JD015139, 2011.
NOAA: September ENSO update: La Niña Watch!, ENSO Blog, https://www.climate.gov/news-features/blogs/enso/september-enso-update-la-nina-watch (last access: 28 June 2022), 2017.
NOAA CPC: ENSO Cold & Warm Episodes by Season, https://origin.cpc.ncep.noaa.gov/products/analysis_monitoring/ensostuff/ONI_v5.php, last access: 29 July 2021.
Oki, T. and Kanae, S.: Global Hydrological Cycles and World Water Resources, Science, 313, 1068–1072, https://doi.org/10.1126/science.1128845, 2006.
Pervez, S., McNally, A., Arsenault, K., Budde, M., and Rowland, J.: Vegetation Monitoring Optimization With Normalized Difference Vegetation Index and Evapotranspiration Using Remote Sensing Measurements and Land Surface Models Over East Africa, Frontiers in Climate, 3, 589981, https://doi.org/10.3389/fclim.2021.589981, 2021.
Peters-Lidard, C. D., Houser, P. R., Tian, Y., Kumar, S. V., Geiger, J., Olden, S., Lighty, L., Doty, B., Dirmeyer, P., Adams, J., Mitchell, K., Wood, E. F., and Sheffield, J.: High-performance Earth system modeling with NASA/GSFC's Land Information System, Innovations Syst. Softw. Eng., 3, 157–165, https://doi.org/10.1007/s11334-007-0028-x, 2007.
Qamer, F. M., Tadesse, T., Matin, M., Ellenburg, W. L., and Zaitchik, B.: Earth Observation and Climate Services for Food Security and Agricultural Decision Making in South and Southeast Asia, B. Am. Meteorol. Soc., 100, ES171–ES174, https://doi.org/10.1175/BAMS-D-18-0342.1, 2019.
Rana, S., Renwick, J., McGregor, J., and Singh, A.: Seasonal Prediction of Winter Precipitation Anomalies over Central Southwest Asia: A Canonical Correlation Analysis Approach, J. Climate, 31, 727–741, https://doi.org/10.1175/JCLI-D-17-0131.1, 2018.
Reynolds, C. A., Jackson, T. J., and Rawls, W. J.: Estimating soil water-holding capacities by linking the Food and Agriculture Organization Soil map of the world with global pedon databases and continuous pedotransfer functions, Water Resour. Res., 36, 3653–3662, https://doi.org/10.1029/2000WR900130, 2000.
Sarmiento, D. P., Slinski, K., McNally, A., Funk, C., Peterson, P., and Peters-Lidard, C. D.: Daily precipitation frequency distributions impacts on land-surface simulations of CONUS, Front. Water, 3, 640736, https://doi.org/10.3389/frwa.2021.640736, 2021.
Schiemann, R., Lüthi, D., Vidale, P. L., and Schär, C.: The precipitation climate of Central Asia – intercomparison of observational and numerical data sources in a remote semiarid region, Int. J. Climatol., 28, 295–314, https://doi.org/10.1002/joc.1532, 2008.
Schneider, U., Finger, P., Meyer-Christoffer, A., Rustemeier, E., Ziese, M., and Becker, A.: Evaluating the Hydrological Cycle over Land Using the Newly-Corrected Precipitation Climatology from the Global Precipitation Climatology Centre (GPCC), Atmosphere, 8, 52, https://doi.org/10.3390/atmos8030052, 2017.
Senay, G. B., Bohms, S., Singh, R. K., Gowda, P. H., Velpuri, N. M., Alemu, H., and Verdin, J. P.: Operational Evapotranspiration Mapping Using Remote Sensing and Weather Datasets: A New Parameterization for the SSEB Approach, J. Am. Water Resour. Assoc., 49, 577–591, https://doi.org/10.1111/jawr.12057, 2013.
Shukla, S., Arsenault, K. R., Hazra, A., Peters-Lidard, C., Koster, R. D., Davenport, F., Magadzire, T., Funk, C., Kumar, S., McNally, A., Getirana, A., Husak, G., Zaitchik, B., Verdin, J., Nsadisa, F. D., and Becker-Reshef, I.: Improving early warning of drought-driven food insecurity in southern Africa using operational hydrological monitoring and forecasting products, Nat. Hazards Earth Syst. Sci., 20, 1187–1201, https://doi.org/10.5194/nhess-20-1187-2020, 2020.
Shukla, S., Landsfeld, M., Anthony, M., Budde, M., Husak, G. J., Rowland, J., and Funk, C.: Enhancing the Application of Earth Observations for Improved Environmental Decision-Making Using the Early Warning eXplorer (EWX), Frontiers in Climate, 2, 583509, https://doi.org/10.3389/fclim.2020.583509, 2021.
Tabar, M., Gluck, J., Goyal, A., Jiang, F., Morr, D., Kehs, A., Lee, D., Hughes, D. P., and Yadav, A.: A PLAN for Tackling the Locust Crisis in East Africa: Harnessing Spatiotemporal Deep Models for Locust Movement Forecasting, in: Proceedings of the 27th ACM SIGKDD Conference on Knowledge Discovery & Data Mining, New York, NY, USA, 14–18 August, 2021 3595–3604, https://doi.org/10.1145/3447548.3467184, 2021.
Tan, J., Petersen, W. A., and Tokay, A.: A Novel Approach to Identify Sources of Errors in IMERG for GPM Ground Validation, J. Hydrometeorol., 17, 2477–2491, https://doi.org/10.1175/JHM-D-16-0079.1, 2016.
UNICEF: 500,000 children affected by drought in Afghanistan – UNICEF, https://www.unicef.org/press-releases/500000-children-affected-drought-afghanistan-unicef (last access: 28 June 2022), 2018.
USGS: Knowledge Base, https://earlywarning.usgs.gov/fews/searchkb/Asia/Central Asia/Afghanistan, last access: 12 November 2021.
Vincent, K., Daly, M., Scannell, C., and Leathes, B.: What can climate services learn from theory and practice of co-production?, Climate Services, 12, 48–58, https://doi.org/10.1016/j.cliser.2018.11.001, 2018.
Xie, P. and Arkin, P. A.: Analyses of Global Monthly Precipitation Using Gauge Observations, Satellite Estimates, and Numerical Model Predictions, J. Climate, 9, 840–858, https://doi.org/10.1175/1520-0442(1996)009<0840:AOGMPU>2.0.CO;2, 1996.
Yatagai, A., Kamiguchi, K., Arakawa, O., Hamada, A., Yasutomi, N., and Kitoh, A.: APHRODITE: Constructing a Long-Term Daily Gridded Precipitation Dataset for Asia Based on a Dense Network of Rain Gauges, B. Am. Meteorol. Soc., 93, 1401–1415, https://doi.org/10.1175/BAMS-D-11-00122.1, 2012.
Yoon, Y., Kumar, S. V., Forman, B. A., Zaitchik, B. F., Kwon, Y., Qian, Y., Rupper, S., Maggioni, V., Houser, P., Kirschbaum, D., Richey, A., Arendt, A., Mocko, D., Jacob, J., Bhanja, S., and Mukherjee, A.: Evaluating the Uncertainty of Terrestrial Water Budget Components Over High Mountain Asia, Frontiers in Earth Science, 7, 120, https://doi.org/10.3389/feart.2019.00120, 2019.
The World Meteorological Organization, WMO, defines intermediate (intermediary) users as those who transform climate information into a climate service.