the Creative Commons Attribution 4.0 License.
the Creative Commons Attribution 4.0 License.
 | 24 Jun 2022
High-temporal-resolution hydrometeorological data collected in the tropical Cordillera Blanca, Peru (2004–2020)
Bryan G. Mark
Robert Å. Hellström
Michel Baraer
Jeffrey M. McKenzie
Thomas Condom
Alejo Cochachín Rapre
Gilber Gonzales
Joe Quijano Gómez
Rolando Cesai Crúz Encarnación
This article presents a comprehensive hydrometeorological dataset collected over the past two decades throughout the Cordillera Blanca, Peru. The data-recording sites, located in the upper portion of the Rio Santa valley, also known as the Callejon de Huaylas, span an elevation range of 3738–4750 m a.s.l. As many historical hydrological stations measuring daily discharge across the region became defunct after their installation in the 1950s, there was a need for new stations to be installed and an opportunity to increase the temporal resolution of the streamflow observations. Through inter-institutional collaboration, the hydrometeorological network described in this paper was deployed with the goal of evaluating how progressive glacier mass loss was impacting stream hydrology, and understanding better the local manifestation of climate change over diurnal to seasonal and interannual time scales. The four automatic weather stations supply detailed meteorological observations and are situated in a variety of mountain landscapes, with one on a high-mountain pass, another next to a glacial lake, and two in glacially carved valleys. Four additional temperature and relative humidity loggers complement the weather stations within the Llanganuco valley by providing these data across an elevation gradient. The six streamflow gauges are located in tributaries to the Rio Santa and collect high-temporal-resolution runoff data. The datasets presented here are available freely from https://doi.org/10.4211/hs.35a670e6c5824ff89b3b74fe45ca90e0 (Mateo et al., 2021). Combined, the hydrological and meteorological data collected throughout the Cordillera Blanca enable detailed research of atmospheric and hydrological processes in tropical high-mountain terrain.
- Article
(6445 KB) - Full-text XML
- BibTeX
- EndNote


Glaciers and water resources in the Cordillera Blanca, Peru, have been under close observation for nearly a century. In the 1930s, an Austrian geographer from the University of Innsbruck, Hans Kinzl, laid the groundwork for glaciological research in the region by surveying and mapping the glaciers and identifying other natural features in the mountainous landscape (Kaser and Osmaston, 2002). While the first systematic Peruvian effort to observe glacier tongue variations in the Cordillera Blanca was initiated in 1944 by Broggi (Petersen et al., 1969), glaciers as a source of security and water resources became the subject of study in the subsequent decades. The Unidad de Glaciología e Hidrología (later Unidad de Glaciología y Recursos Hidricos (UGRH) of Electroperú S.A.) was initiated by the Corporación Peruana del Santa, a government company for energy development, and took on glacier and lake monitoring after many glacial lake outburst flooding (GLOF) events damaged communities downstream (Ames, 1998). GLOFs in 1941, 1945, and 1950 killed over 6000 people and destroyed a third of the Ancash district capital of Huaraz (Carey, 2010; Carey et al., 2012). Other glacier hazards have had detrimental impacts on the communities as well, including the 1970 avalanche, triggered by a massive earthquake, which killed approximately 6000 people and along with the debris flow it produced, covered the city of Yungay (Carey, 2010). Lliboutry et al. (1977) investigated two glaciers in the mountain range in relation to the danger they presented for flooding a downstream power plant. From the 1970s to the 1990s, a local Peruvian from Huaraz, Alcides Ames, made many important contributions to the present knowledge of glaciers in the Cordillera Blanca while employed at UGRH, and after retirement continued to dedicate much of his time to studying the glaciers and sharing his knowledge with other researchers (Ames et al., 1989; Hastenrath and Ames, 1995; Ames and Hastenrath, 1996; Ames, 1998; Kaser and Osmaston, 2002). In the 1980s, Georg Kaser, an Austrian geographer, began studying the Cordillera Blanca with a focus on the extent, causes, and possible consequences of the observed glacier retreat (Kaser and Osmaston, 2002). For many decades, much of the research in the region focused on developing better maps of the mountains and observing the marked glacier retreat in the tropics. Although the meteorological and hydrological stations installed by UGRH had been in place for nearly 40 years, it was not until the mid-1990s that studies began to assess water resources in the Cordillera Blanca, but with minimal focus on flooding and GLOFs (Kaser and Georges, 1997; Mark and Seltzer, 2003).
The UGRH spent many years collecting an abundance of climatological, hydrological, and glaciological data, which was useful for future researchers, hydroelectric and mining companies, and other stakeholders throughout the Cordillera Blanca and its glaciers. Since the mid-1990s, most of the daily-resolution discharge data from the Rio Santa watershed have been cataloged and collected at a much-reduced number of sites by private energy companies who took over after Electroperu was privatized. The rapid turnover of the energy companies holding the discharge observations makes it difficult to track down all available historical data. Also, many of the hydrological stations have become defunct since they were installed in the 1950s, creating a need for new stations to be installed for continuous monitoring of the region. A further benefit of installing a new hydrological monitoring network in the 2000s was to significantly increase the temporal resolution of the discharge observations.
Collaborating researchers from The Ohio State University, Bridgewater State University, and McGill University initiated a network of embedded environmental sensors in 2005. The main goals of the instrument arrays were to evaluate how progressive glacier mass loss was impacting stream hydrology, and to better understand the local manifestation of climate change on the variability and controls of local weather phenomena over diurnal to seasonal and interannual time scales. In order to create a sustainable network for continuous, long-term observation, this project has been maintained in close collaboration with Peruvian researchers and government agencies, as well as with other international scientists to leverage resources in maintaining instruments, in exchange for openly sharing data.
The instrumentation for the data collection we present in this work was installed and maintained under a collaborative work agreement (convenio) formalized with the Peruvian government agency overseeing the office in Huaraz (Peruvian Institute of Natural Resources (INRENA) and the Autoridad Nacional del Agua (ANA)). This work agreement involved a secondary collaboration with other international researchers who shared in installing and calibrating the instrumentation. Specifically, Dr. Thomas Condom of the French Institut de Recherche pour le Developpement (IRD) joined the agreement to install and maintain a series of stream gauges logging water stage at 15 min intervals. We also collaborated with the Austrian research team of Dr. Irme Juen and Professor Georg Kaser from the University of Innsbruck, Austria, who co-located a precipitation gauge with our weather station in Llanganuco. Further details about the instrumentation are provided later.
Inter-institutional collaboration in this fashion has provided an effective partnership to aid in maintaining the instrumentation over time, but also introduces challenges of logistical coordination and data continuity. Visitation as non-resident international scientists to the field sites has been feasible only one or two times annually. Thus, the Peruvians in our collaboration have incorporated our instruments within their routine monitoring network. This has permitted regular observations of stations and instruments to download data loggers, perform stream discharge measurement to build a rating curve, and undertake a limited range of repair work. However, limitations in local resources and manpower in Peru have often prevented recordings of stage observation and discharge measurement to constrain rating curves. Likewise, having multiple operators also increases some risk for data recovery errors. For instance, loggers that are improperly relaunched after data downloads can jeopardize subsequent acquisitions. Having more frequent site visits can allow for interventions, but this also involves increased risk of operator error. Furthermore, Peruvian domestic political changes have disrupted the operations by introducing different leadership, with altered operational priorities and resources, which directly or indirectly interrupt the continuity of trained personnel responsible for data recovery and preservation. Overcoming the many challenges of maintaining the instrumentation and constructing rating curves has required regular cross-cultural communication as well as multiple and annual visitations to the region. Likewise, the rating curves continue to be refined as additional measurements are made.
Our collaborative observations have provided important new insights into how the hydroclimate of the region is changing on different scales. Updated discharge and climate observations in specific glacier catchments documented important shifts in seasonal supply of glacier storage to the Yanamarey catchment (Bury et al., 2011) and suggested regional thresholds in glacier melt provision (Mark et al., 2010). The discharge constraints also provided important validation for a novel hydrochemical basin characterization method to quantify proportionate glacier melt and groundwater contributions to streamflow in tributaries of varying glacierized coverage (Baraer et al., 2009; Baraër et al., 2015). Regionally, the gauge network provided the key constraint for a model of time-progressive hydrograph evaluation that verified significantly that the main catchment had already passed “peak water” in the wake of strong glacier recession underway for multiple decades (Baraër et al., 2012). Our embedded temperature and humidity loggers distributed over elevation and linked to weather stations in the Llanganuco valley have revealed novel diurnal to seasonal variations in lapse rates linked to catchment-specific valley wind dynamics validated with downscaled climate models (Hellström et al., 2017). These studies demonstrate the importance of collecting in situ hydrometeorological data and indicate the need for continued data collection in the high Andes (Condom et al., 2020).
In this paper, we document available data from the Cordillera Blanca area collected over the past 15 years. It is separated into (i) meteorological data recorded by permanently installed automatic temperature and relative humidity loggers (Lascars), or automatic weather stations, and (ii) hydrological data consisting of stage and discharge data from multiple sub-catchments. The data are stored in .csv extension format on Consortium of Universities for the Advancement of Hydrologic Science, Inc. (CUAHSI) Hydroshare: https://doi.org/10.4211/hs.35a670e6c5824ff89b3b74fe45ca90e0 (Mateo et al., 2021). The data collection consists of multiple time series of point observations from both meteorological and hydrological measurement sites. These high-temporal-resolution data provide detailed insight into the complex hydro-meteorological system of the tropical Cordillera Blanca.
The Rio Santa (Santa River) captures runoff from the western side of the glacierized Cordillera Blanca and the eastern side of the non-glacierized Cordillera Negra, encompassing a drainage area of 11 636 km2 at the outlet to the Pacific Ocean. While the headwaters of the Rio Santa are found at Laguna Conococha at 4100 m above sea level (a.s.l.), the highest point in the basin (and in Peru) is the summit of Huascaran at 6768 m a.s.l. The average slope of the entire drainage basin is 20.6∘ and its average elevation is 3374 m a.s.l. calculated from a 3 m resolution DEM of the region. The Rio Santa flows over 300 km northwest from its origin at Laguna Conococha, an alpine lake at 4000 m a.s.l., to its outlet into the Pacific Ocean, near Chimbote. The Callejon de Huaylas refers to the upper section of the Rio Santa, comprising approximately 4773 km2 located above the Cañon del Pato 50 MW hydroelectric generation plant in Huallanca (Fig. 1). The Rio Santa basin is home to three other hydroelectric plants and provides water to the expansive Chavimochic irrigation district near the coast (Mark and McKenzie, 2007). The discharge on the Rio Santa has been carefully monitored since the Cañon del Pato dam began operating in the 1950s; however, only one station near the dam remains active, which is situated slightly upstream at La Balsa (labeled as “LBQ” in Fig. 1).
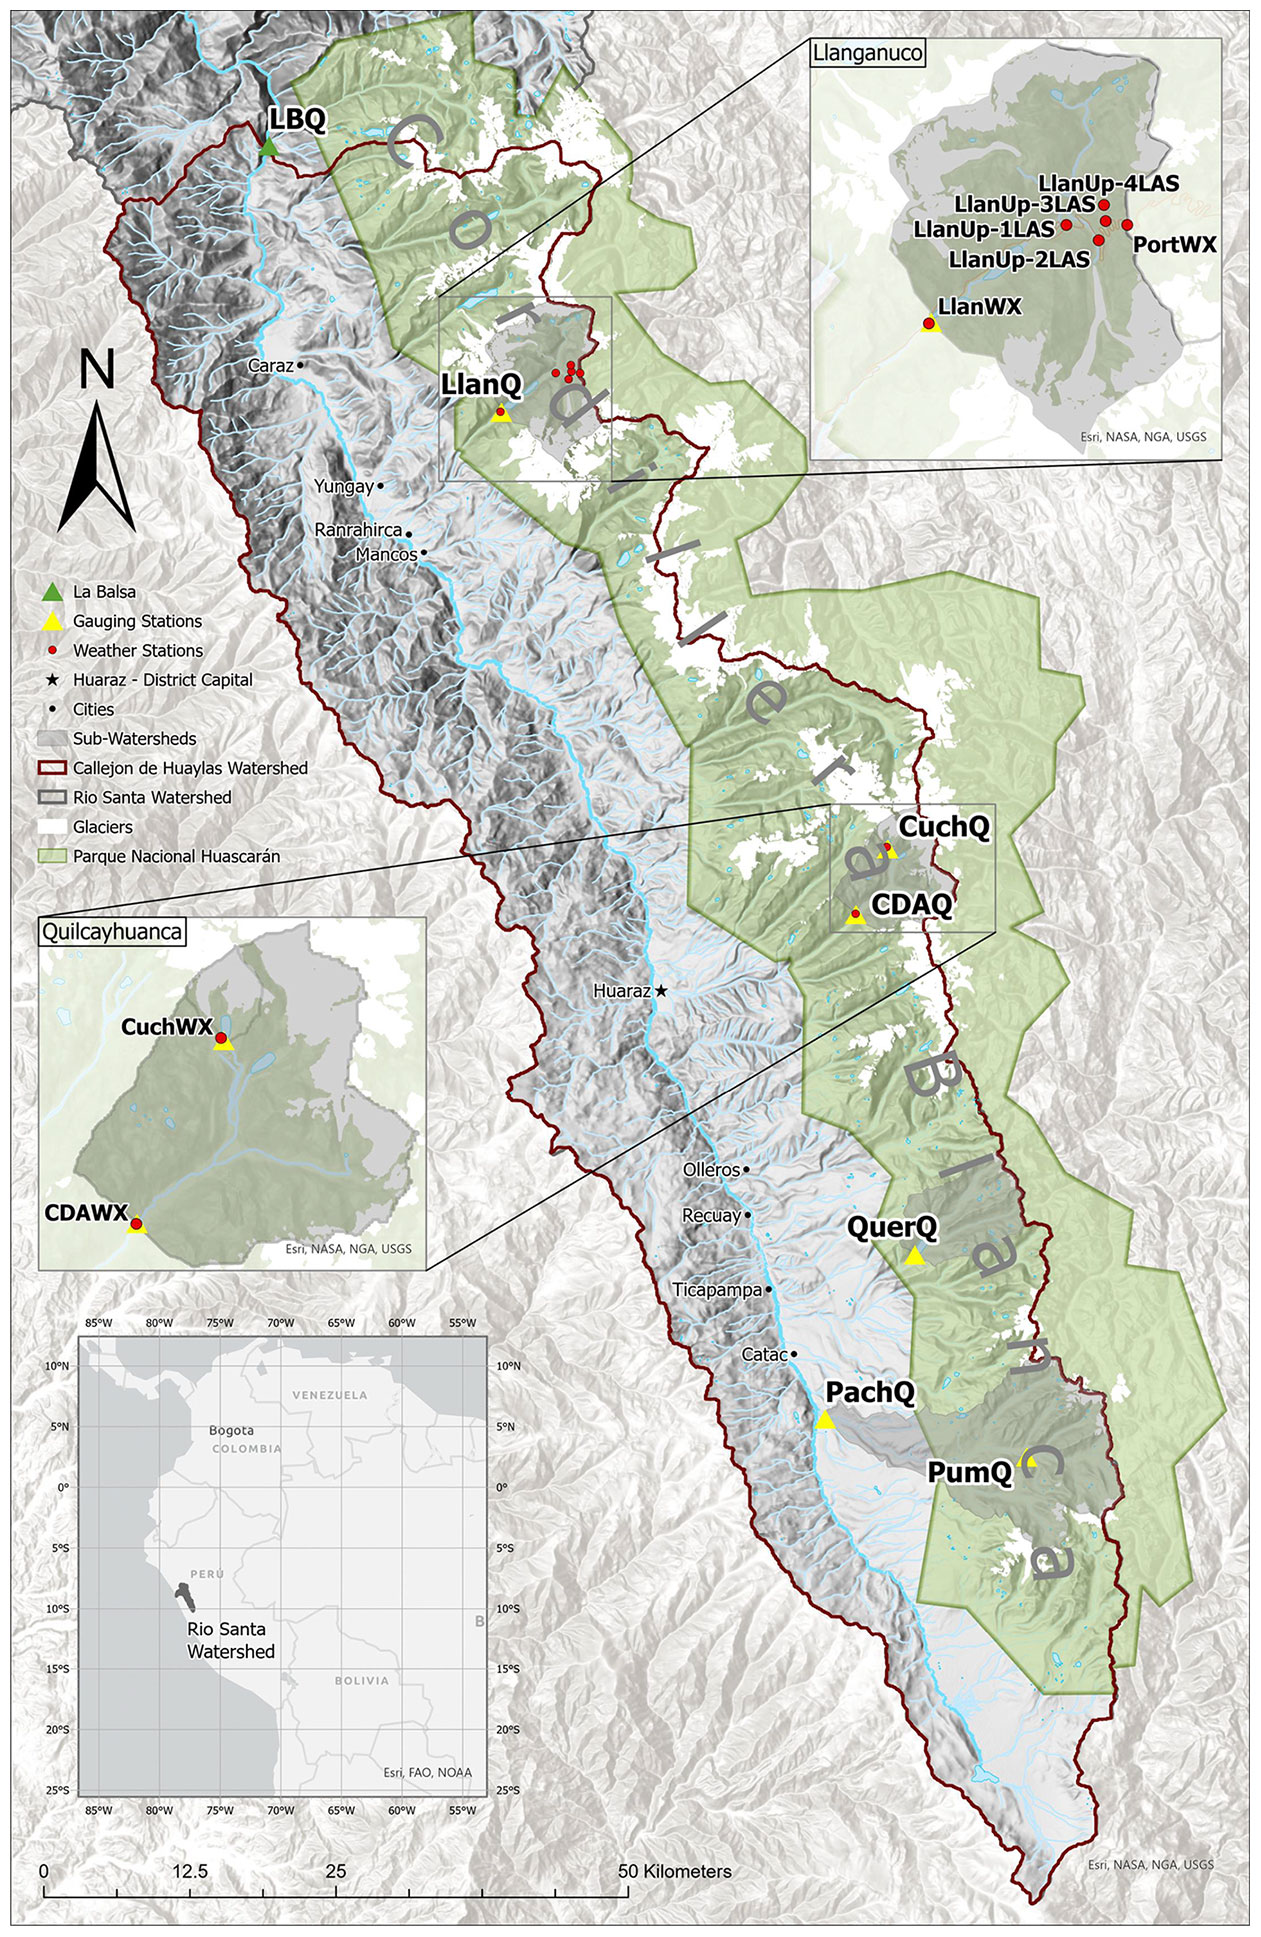
Figure 1Map of the Callejon de Huaylas showing the locations of the hydrological and meteorological stations. (Base layers of the map originated from © Esri, © NASA, © NGA, © USGS, © FAO, and © NOAA; all other layers were created and edited by authors of this article.)
Rio Santa discharge experiences a strong seasonal contrast, with the lowest discharge occurring between July and September, while peak discharge, nearly 20 times greater, typically occurs in March. Calculated from daily streamflow observations between 1954 and 2015, mean annual streamflow at La Balsa station on the Rio Santa, is 87 m3 s−1, while the average annual minimum discharge is 25 m3 s−1 and the average annual maximum discharge is 445 m3 s−1. Approximately 10 % of the Callejon de Huaylas is covered in ice (RGI Consortium, 2017) and has an average slope of 19∘ and an average elevation of 4055 m a.s.l. Glacial melt in the Rio Santa at La Balsa provides 10 %–20 % of the total annual discharge and may exceed 40 % in the dry season (Mark et al., 2005; Condom et al., 2012).
The climate of the Callejon de Huaylas is semi-arid and displays distinct precipitation seasonality, with the wet season between October and May being responsible for 80 % of the 800–1200 mm yr−1 of precipitation (Baraer et al., 2009) and the dry season lasting from June to September (Fig. 2). As a localized example, the Llanganuco valley displays an average total of 8 mm during the dry season and an average total of 258 mm during the wet season months of December, January, and February, based on monthly totals from 1953 to 2010 (Hellström et al., 2017). Variations in river discharge are largely driven by seasonality of precipitation. Temperature remains nearly constant in the outer tropics, with the annual variation in temperature being smaller than diurnal variation (Kaser et al., 1990).
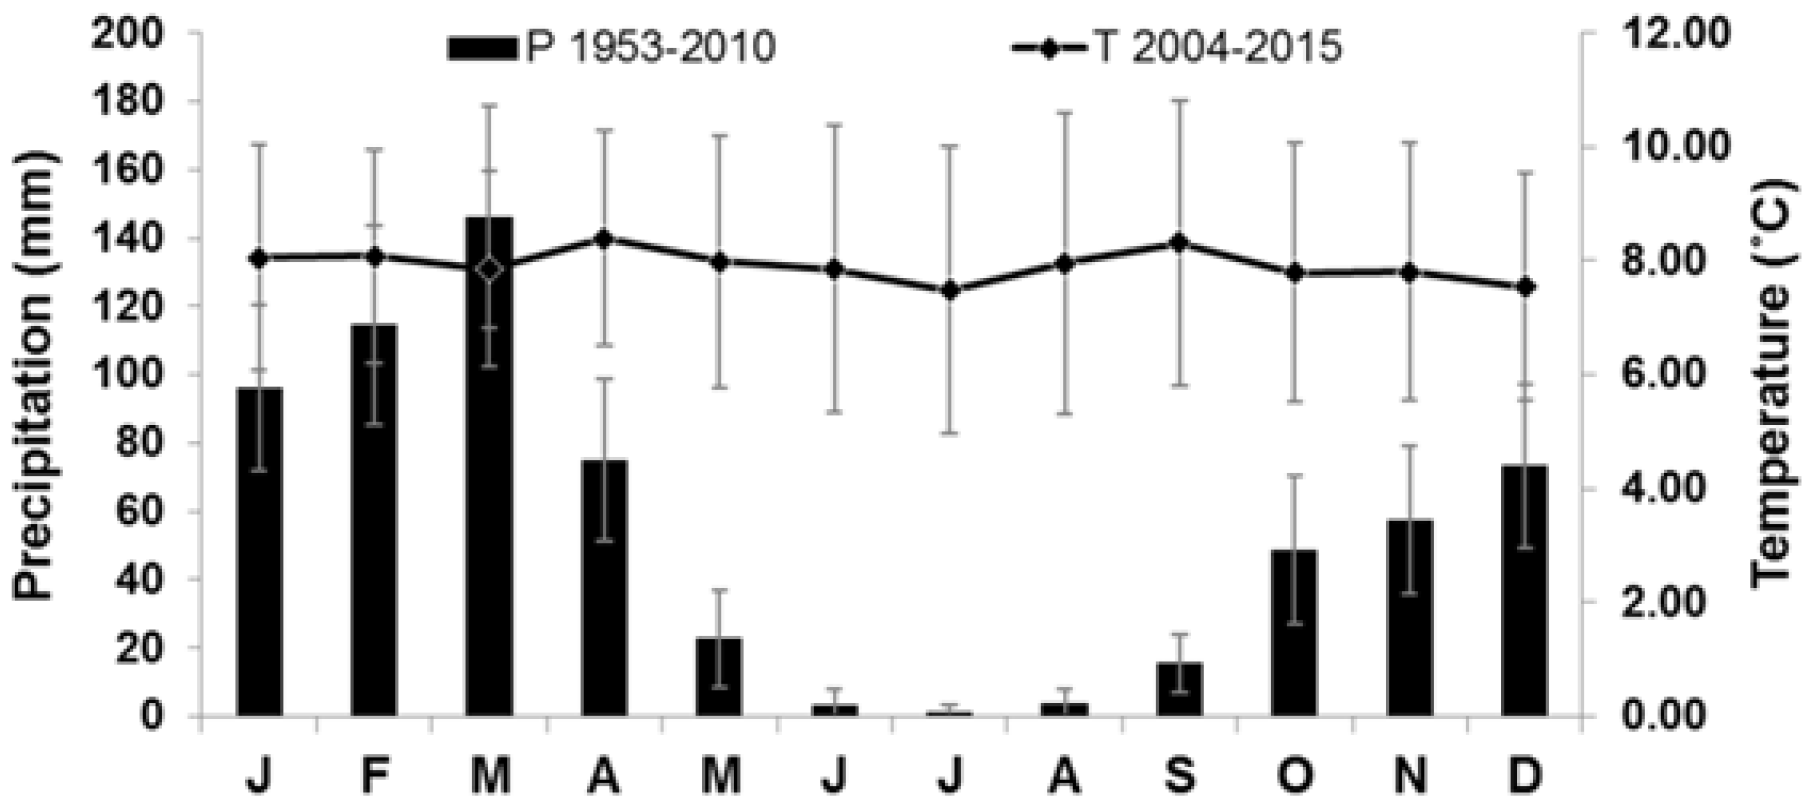
Figure 2A climograph from LlanWX in the Cordillera Blanca displaying the strong contrast in precipitation between wet and dry seasons, while maintaining a steady temperature throughout the entire year.
The geology in the Rio Santa basin is dictated by numerous tectonic and erosional processes because the basin is situated along the active detachment fault of the Cordillera Blanca (McNulty et al., 1998; Garver et al., 2005; Eddy et al., 2017). The highest peaks of the Cordillera Blanca are composed largely of a granodiorite batholith intruded into a metamorphic unit that includes hornfels, gneiss, and sulfide-rich lithologies, such as pyrite schist, phyllite, and pyrite-bearing quartzite (Giovanni et al., 2010; Eddy et al., 2017). Granodiorite is found predominantly in the northern portion of the range, while the southern portion of the range is made up of a variety of metasediments, including quartzites and carbonates (Garver et al., 2005). The main valley of the Rio Santa watershed is covered by recent sediment deposits, including alluvium, landslide deposits, and glacial–fluvial fill. The impact of past and present glacier extent in the topography is visible in geomorphic features throughout the range, including steep-walled U-shaped valleys, moraines, and proglacial lakes (Eddy et al., 2017).
In the following section, the data collected from the Cordillera Blanca are presented in two collections. First, we provide a description of the meteorological stations and embedded sensor network of Lascar data loggers, and then we present the time series data from the stations. Second, we provide details of the setup and context of the discharge gauging station network, and then conclude by presenting the time series of discharge data and the general statistics. Figure A1, A2, and A3 in the Appendix indicate missing data beyond 2020; however, due to travel restrictions over the past 2 years we have not been able to collect the up-to-date measurements. Our intent is to sustain these hydrological and meteorological measurements into the future once travel to the region is possible again. These future data will be available upon request as they are collected.
3.1 Meteorological data
The Servicio Nacional de Meteorología e Hidrología del Perú (SENAMHI) has operated a relatively dense national network of meteorological stations since 1964. Air temperature is provided as daily Tmax and Tmin (additionally measured at 07:00, 13:00, and 19:00 local time), and precipitation is measured once a day. Some SENAMHI stations still provide daily temperature and precipitation data through their web portal, providing data back to 1980 (https://www.senamhi.gob.pe/?&p=descarga-datos-hidrometeorologicos, last access: 15 January 2022), but very few stations within the Rio Santa Valley or Cordillera Blanca, Peru, remain active. Note that additional data from SENAMHI are available upon request from the Swiss MeteoDat GmbH team through a data portal (Schwarb et al., 2011, http://www.meteodat.ch/, last access: 15 January 2022). In addition, the Universidad Nacional Santiago Antúnez de Mayolo (UNASAM) has maintained a network of what was originally 16 meteorological stations located at different elevations in the Cordillera Blanca (Ancash district) since 2012. Monthly totals of precipitation data for the Rio Santa watershed have been collected by Electroperú South America since 1953 although measurements were interrupted in the mid-1990s with the privatization of the respective institutions when most of the stations were abandoned and quality control was an issue (Kaser et al., 2003). More recent installations of weather stations in the Cordillera Blanca have been mostly associated with short-lived research projects typically lasting less than 3 years (Hofer et al., 2010; Georges and Kaser, 2002). The hourly meteorological observations we describe here were collected primarily from instrumentation we installed in two sub-catchments of the Rio Santa drainage basin: Llanganuco and Quilcayhuanca.
The Llanganuco valley is situated on the western side of the Cordillera Blanca across a southwest (∼ 240∘) to northeast (∼ 60∘) axis with elevations ranging from 3400 m a.s.l. to 6746 m a.s.l. Llanganuco is one of most glacierized valleys in the mountain range at 30 % glacier coverage, making it one of the most glacierized tropical valleys in the world. In the Llanganuco catchment, our group has installed multiple weather stations dating back to 2007, although only one remains active. This currently active station, labeled “LlanWX”, is located at 3835 m a.s.l. near the lower of the two largest valley lakes (Table 1).
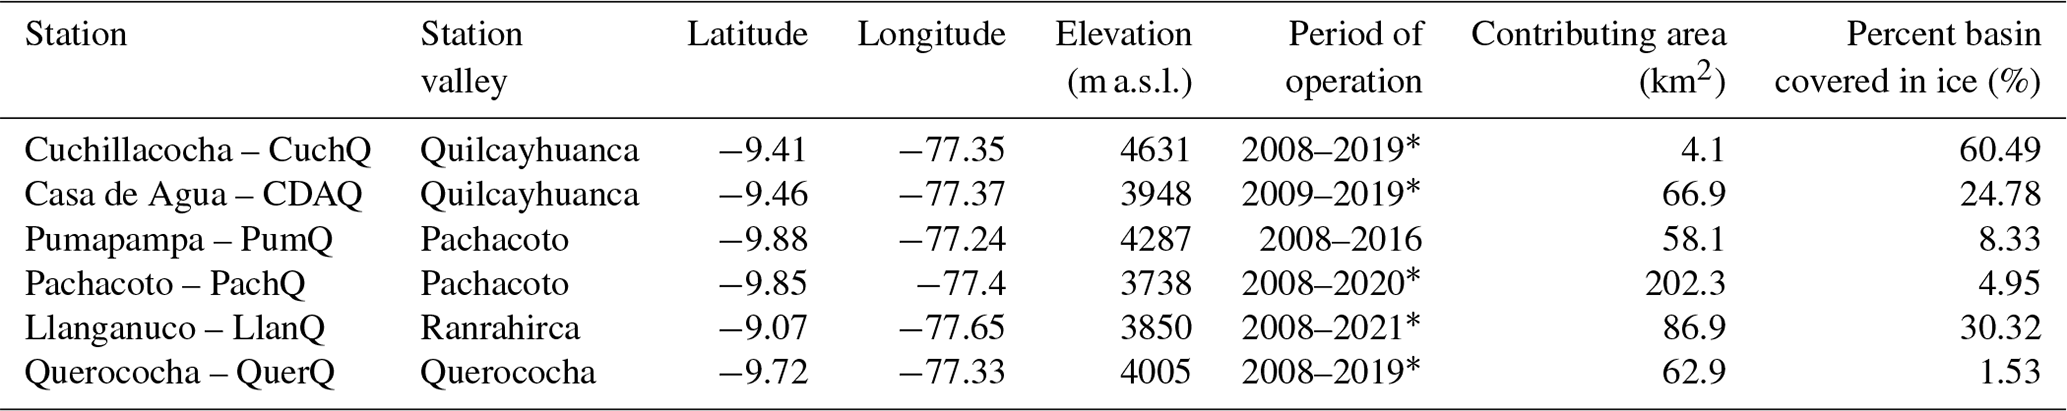
Table 1General information on each meteorological station (WX) and lascar data logger (LAS) location within the embedded sensor network. Dates with an asterisk indicate the station is operational.
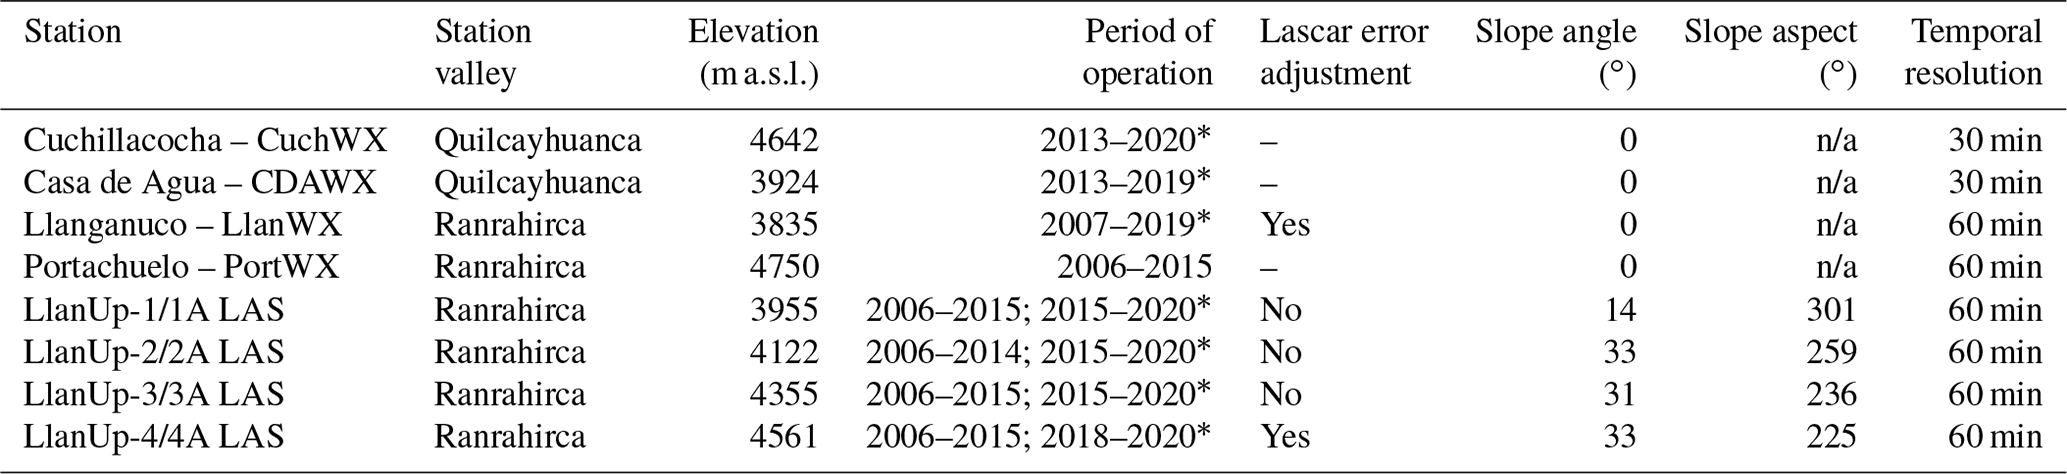
n/a – not applicable
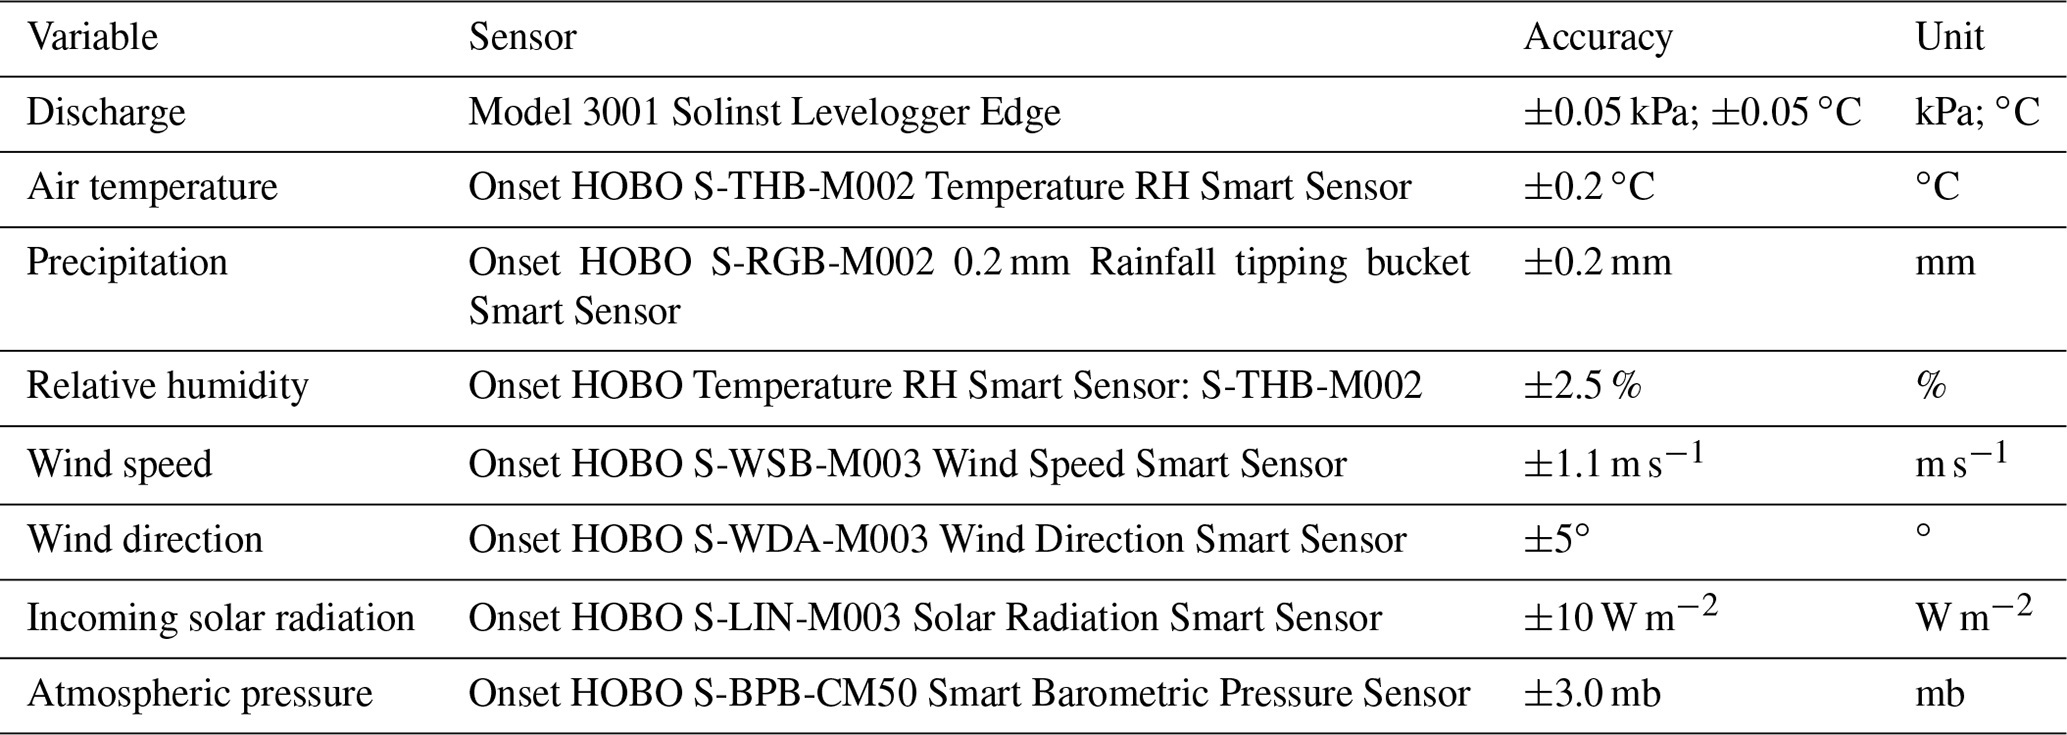
The embedded sensor network (ESN), as described by Hellström et al. (2010) and Hellström and Mark (2006), provides the in situ meteorological data supplied in the paper. In July 2007 the first automatic weather station (AWS), LlanWX, was installed near the lower lake in the Llanganuco valley to collect a continuous record of point measurements of air temperature, wind speed, wind direction, relative humidity, and solar irradiance (Table 2). The AWS shown in Fig. 3a is located in an open area on the valley floor and is surrounded by Polylepis trees. A lascar data logger was also hung at this site for static calibration. The site is protected in Huascaran National Park, and the location was previously used by the University of Innsbruck for precipitation measurements. The most significant wind obstructions are the steep bedrock walls of the valley toward the northwest and southeast, which exceed 1000 m above the valley floor. Northerly and southerly winds are occasionally recorded by LlanWX and are likely caused by turbulence or lateral winds from the uneven heating of the valley walls. Winds flow parallel to the axis of the valley during approximately 92 % of the recorded time and are not greatly obstructed by surface vegetation. The sensors for LlanWX were originally sourced from the Onset Computer Corporation and logged with an Onset HOBO® data logger (http://www.onsetcomp.com, last access: 15 January 2022) until 2014 when these loggers were replaced with an Iridium® satellite DataGarrison logger (http://www.upwardinnovations.com, last access: 15 January 2022). A 102 mm diameter radiation shield was used to reduce air temperature error caused by the sun except during the following years: 2007, 2011–2014. During these years a separate data logger was used as the primary source for air temperature and relative humidity observations. In 2013, our team upgraded the station by replacing the wind sensors with two new units from Onset and a new pyranometer from Apogee (http://www.apogeeinstruments.com/pyranometer, last access: 15 January 2022), which exceeded the 1277 W m−2 maximum reading of the previous Onset sensors (Covert, 2016). The observations from LlanWX are largely continuous since 2007, with data gaps occurring occasionally between 2010 and 2014.
Table 2Variables, sensors, and accuracy of data collected at the meteorological stations throughout the region.
A second AWS, situated at Portachuelo (referred to as “PortWX” in Fig. 1), was installed in July 2006 on a high pass at the top of the Llanganuco valley (4742 m a.s.l.). The station was situated on a steep, rocky ridge between the Llanganuco valley and the Vaqueria valley. There were only wind obstructions to the north due to a steep rock wall within 10 m of the station location. The AWS at Portachuelo had the same sensors as its counterpart; LlanWX, however, was lacking an air temperature and relative humidity sensor with a radiation shield until it was installed in July 2015. Prior to this upgrade, these variables were recorded each hour by a Lascar data logger part of the ESN discussed in the following section. The Portachuelo station was stolen in 2015 after recording data for 9 years; a replacement station installed in 2016 was also stolen and so the site was abandoned. Gaps in weather station data are plotted in Fig. A1.

Figure 3The typical setup for the HOBO automatic weather station; shown here is the LlanWX station near the lower lake in Llanganuco. Measurements include air temperature, humidity, wind speed and direction, incoming solar radiation, and rainfall. Note also the two Lascars with different radiation shields hanging from the crossbar. Photographs taken by Robert Hellström (Covert, 2016).
Smaller loggers measuring air temperature were installed in June 2005 to begin collecting near-surface temperatures to calculate lapse rates (Table 1). These data loggers were a series of eight nickel-sized iButton Thermochron® temperature loggers (Fig. 3). Hellström et al. (2010) demonstrated the effectiveness of using the Thermochron loggers for purposes of observing near-surface lapse rates within the Llanganuco valley between the elevations 3470 and 4740 m a.s.l. (Covert, 2016). The ESN of the iButtons was replaced in July 2006 with a more robust network of Lascar El-USB2 data loggers (http://www.lascarelectronics.com, last access: 15 January 2022) which were setup to measure air temperature and relative humidity at 1 h intervals. Each Lascar logger is attached to a custom-designed and locally crafted radiation shield made of a thin tin cone and two Styrofoam pieces in order to reduce error caused by direct sunlight, as shown in Fig. 3b. Figure 4 (from Covert, 2016) provides photos for a visual landscape context for each Lascar logger. Because the LlanWX, LlanUp-4, and PortWX Lascar loggers are nearly entirely exposed to sunlight, the recorded air temperature values in the dataset are higher than expected and contain greater error than actual temperatures during the day (see Sect. 4.1 for details). This Lascar network is still recording hourly data. The Lascar network does not have any gaps in its time series; thus, it is not included in the Appendix.
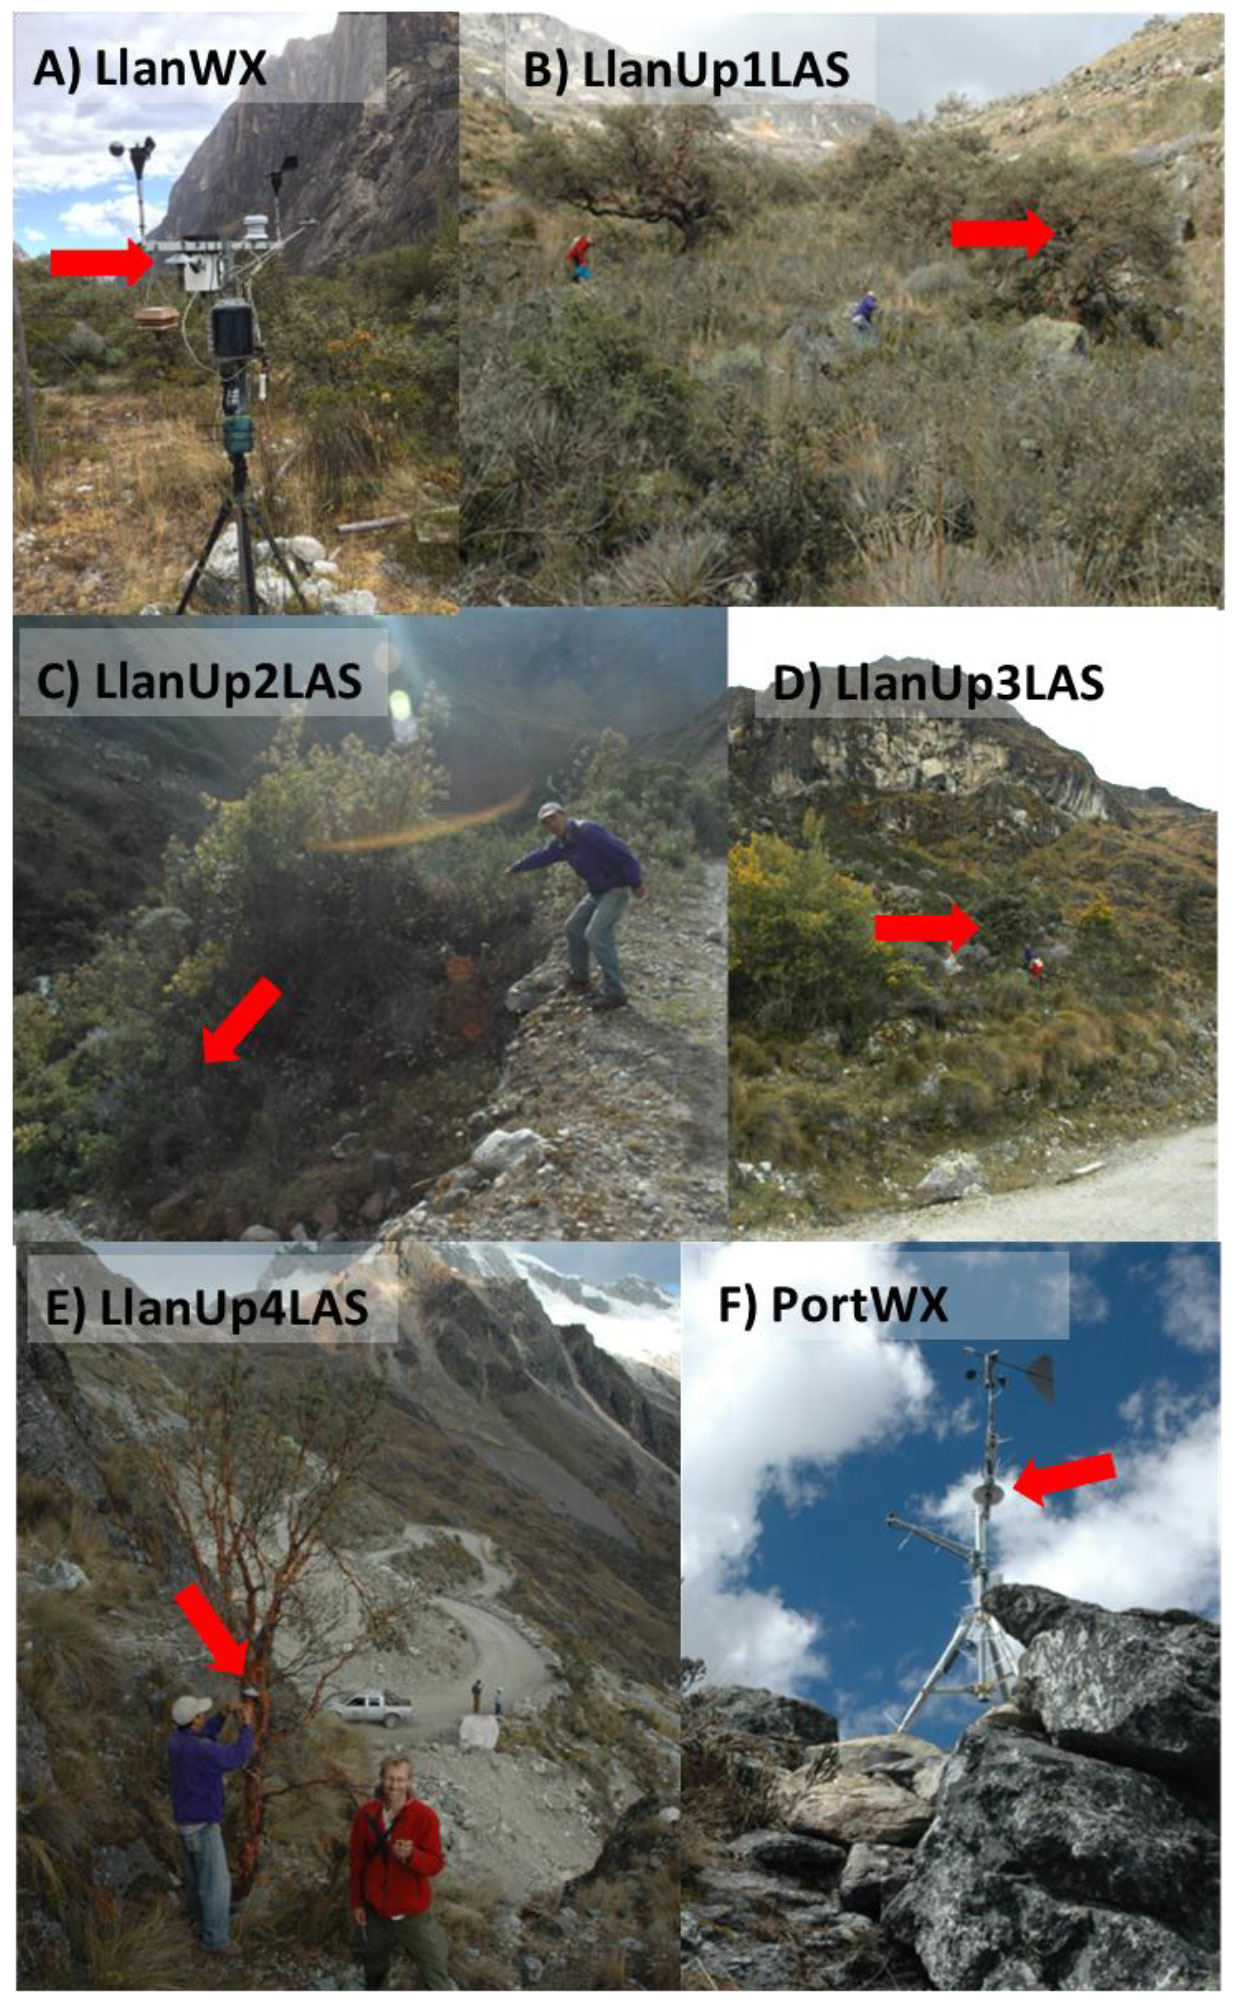
Figure 4Panels (a)–(f) show the locations of all Lascar data loggers labeled by names matching Table 1. Photographs taken by Bryan Mark and Robert Hellström (Covert, 2016).
Quilcayhuanca contains two weather stations (Table 1) similar to the LlanWX station in Llanganuco valley; the lower one is located at 3924 m a.s.l. near an old river diversion station called Casa de Agua (station referred to as “CDAWX” in Fig. 1), and the upper one is located at 4642 m a.s.l. slightly above an alpine lake, Cuchillacocha (station referred to as “CuchWX” in Fig. 1). CDAWX collects all of the same variables as LlanWX (Table 2), is still active since its installation in July 2013, and data are mostly continuous over this duration. CuchWX was also installed in July 2013, is still presently active, and only has one data gap lasting longer than 1 month (from November 2016–June 2017). The data presented here conclude in 2020, but ongoing data extensions will be provided through the repository.
3.1.1 Relative humidity error correction for LlanWX
In 2006 and 2007, saturation of the humidity sensor at LlanWX resulted in relative humidity values greater than 100 % (as high as 110 %) resulting from dust and condensation on the humidity sensor and persisting during the wet season for periods of up to about 48 h, with periods of reasonable humidity values during drier spells. In light of data preservation, these erroneously supersaturated values were simply replaced with 100 % relative humidity; this correction is referred to as “Lascar error adjustment” in Table 1. Note that the dew point was equal to the air temperature for values of relative humidity 100 % or greater, and thus no adjustment was made for dew point. The humidity sensor was replaced in June 2007 and the correction was no longer needed. Both the original and corrected values are retained in the LlanWX data file. There was no similar humidity error observed for PortWX or any of the LAS sensors.
3.1.2 Radiation error correction for Lascar temperature loggers
A year-long comparison between the Lascar (Fig. 5) and LlanWX AWS temperature sensors indicated an expected error in the Lascar that was largely dependent on the time of day. Variability in temperature bias due to solar radiative heating is most likely caused by changes in solar angle and cloud cover patterns, particularly during the dry season. It is well documented that daytime temperature error rises on sunny days with calm wind and is reduced on windy and cloudy days regardless of the season but is far more prominent during the dry season in the tropical Andes (Georges and Kaser, 2002). It is important to note that snow cover, which can create larger biases in temperature by reflected solar radiation, is minimal throughout the year at the locations of the Lascars in this study. Over an entire month, nightly error was within the 0.5 ∘C resolution of the Lascar sensor. The occasional occurrence of greater nighttime error could be caused by the sensor capturing longwave radiation emitted by the surface. The primary source of consistent instrumentation error for air temperature measurements is the heating of radiation shields from those locations exposed to direct sunlight, which required bias correction according to Fig. 5. We bias-corrected for radiation error using comparisons with the LlanWX shielded temperature and Lascar logger hanging next to it under the same exposure, including the LlanWX, LlanUp-4 LAS, and PortWX station locations. We conducted this same comparison when replacing Lascar sensors in 2015 and found no significant differences between old and new sensors. Because solar radiation is the predominant source of error, corrections were only applied to daylight hours between 07:00 and 19:00 (Covert, 2016). Future studies may consider thicker or more encased radiation shields for temperature data loggers in tropical regions. Our group has created and used a variety of styles of radiation shields, as seen in Fig. 5.
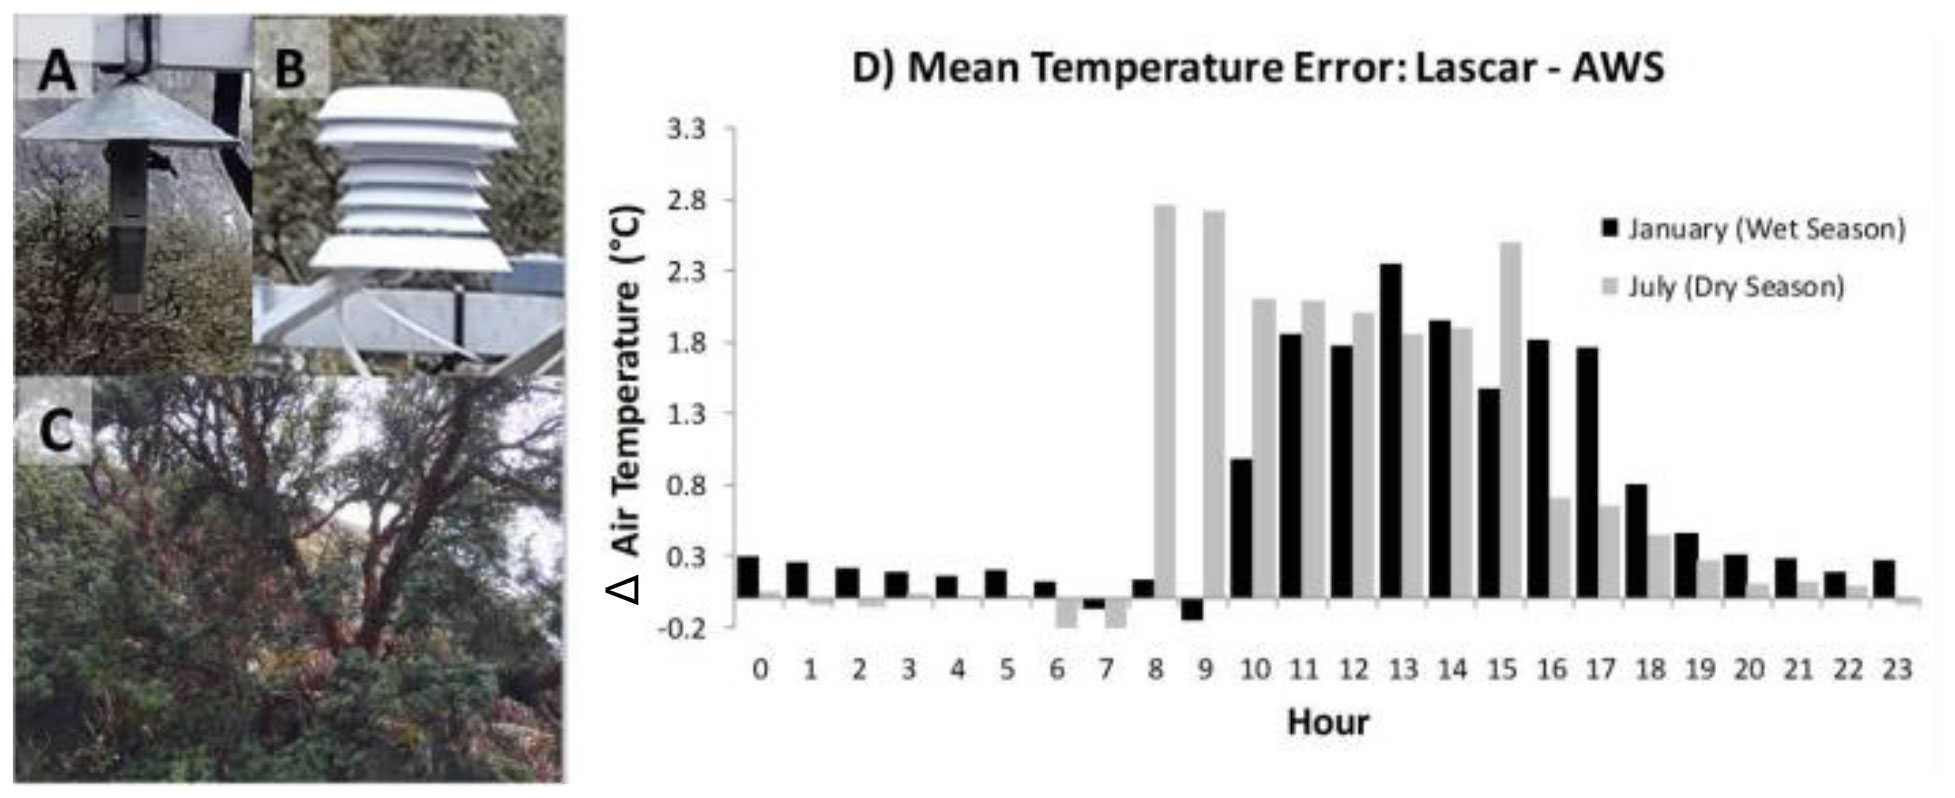
Figure 5Panel (a) displays a Lascar data logger connected to its cone radiation shield. Two white Styrofoam plates beneath the cone insulate the sensor from radiative heating. Panel (b) shows the radiation shields used on the AWS in comparison with the Lascar setup in panel (a). Panel (c) shows Polylepis trees which are used to hide and shade Lascars in order to obtain accurate temperature and relative humidity values. A comparison test between the Lascar setup and the AWS radiation shield with no shading yielded the expected errors shown in graph (d). Positive values indicate that the Lascar reported a temperature higher than the AWS sensor. Photographs taken by Robert Hellström (Covert, 2016).
3.1.3 Data gaps and other quality control checks
The most common reason for gaps in weather data was either loss of sensors due to theft or inability to access sensors because of logistical reasons, such as poor weather conditions or human error during downloading or redeploying of sensors. In addition to corrections for solar radiation heating and the relative humidity correction, humidity and temperature records were assessed for accuracy and outliers were removed if there were unrealistic deviations from the previous 24 h trend of conditions within the valley. Most of these deviations occurred during time intervals coincident with sensor deployment, battery replacement, or data download, although data (less than 1 %) were also removed if there was a concern with the integrity of the sensor. The four Lascar loggers were replaced or had new radiation shields installed in June 2015, and likewise renamed in the dataset as LlanUp-1A, 2A, 3A, and 4A.
3.2 Hydrological data
The La Balsa gauge (8.87∘ S, 77.82∘ W at 1880 m a.s.l.) (Duke Energy, Orazul Energy, Inkia Energy) near the diversion canal for the Cañon del Pato hydroelectric plant has a nearly complete record since 1954, acting as a long-term reference point for discharge on the Rio Santa at the base of the Callejon de Huaylas basin. Many other stream gauges and precipitation stations were put in place by the hydroelectric companies; however, due to the lack of maintenance these stations became unusable after the mid-1990s. In 2008, The Ohio State University, McGill University, IRD, and the Peruvian glaciology unit of ANA commenced a joint project to re-institute a stream gauging network throughout the Cordillera Blanca (Baraër et al., 2012). Many of these redeployed stream gauges in sub-catchments of the Rio Santa are still in working condition and are continuing to be monitored.
The stream gauges comprise custom-designed and locally crafted steel stilling wells containing two Solinst Leveloggers (Fig. 6), with one measuring total pressure (water plus atmospheric) and the other measuring barometric pressure. The Model 3001 Solinst Levelogger Edge has an accuracy of ±0.05 kPa and a resolution of 0.002 % full scale (FS) for pressure with a temperature accuracy of ±0.05 ∘C and a temperature resolution of 0.003 ∘C (http://www.solinst.com, last access: 15 January 2022). Water level is continuously monitored at these gauges at a temporal resolution of 15 min by subtracting atmospheric pressure from the total pressure. The adjusted water level variable in the discharge datasets indicates the adjustment based on where the water level logger was located in the water column. This measurement is conducted in the field using a built-in meter stick at each gauging station. Many factors influence the uncertainty of discharge measurements, especially in smaller, turbid streams (McMillan et al., 2012). First, the Solinst Levelogger instruments used have accuracies and resolutions provided by the company as a percentage of FS as indicated above. Second, we estimate a ±2 mm variation in water stage due to the turbulent nature of the streams in the region. These streams have a variety of bed surfaces, ranging from weedy to rocky, and flat to rolling, which are constantly modified by high flows during each year. Each stage and discharge field measurement are influenced by these small-to-large changes in the stream bed and the timing and location at which the discharge is measured. Finally, stage–discharge rating curves inherently introduce variable amounts of error depending on high or low flows, and how frequently they are updated. Stage–discharge rating curves at all stations were established and verified by conducting discharge measurements using the velocity area method and salt dilution during high flows (Fig. A2 and Table A1 in the Appendix). Prior to publishing this dataset, one updated rating curve was fitted for all the data at each site, helping standardize the measurements and uncertainty in the data. All rating curves developed from discharge measurements in the field are assessed by their fit and significance to a quadratic function. All rating curves display R2 values above 0.85, except for Cuchillacocha, which provides an R2 value of 0.71. This slightly lower R2 value at Cuchillacocha is most likely due to the under-representation of high flows in the field measurements, and overall lower flow volumes recorded at this site. Uncertainties (using standard error at 95 % uncertainty intervals) were calculated for all rating curves, indicating average error ranging from ±3 % to 20 % for low flows and from ±4 % to 70 % during high flows. These error values are standard when using a stage–discharge rating curve as described by Kiang et al. (2018), and McMillan et al. (2012). Rating curves can be further constrained and their variation better understood with the addition of more high-flow discharge point measurements (McMillan et al., 2010; Coxon et el., 2014). Unavailable data are denoted by “NA” in the dataset. Linear interpolation of missing data was only calculated for missing periods of less than 1 h, coinciding with the time the Leveloggers were being downloaded in the field. Other than these short periods of interpolated data, the datasets provided consist of raw data. Gaps of missing streamflow data are plotted in Fig. A3.
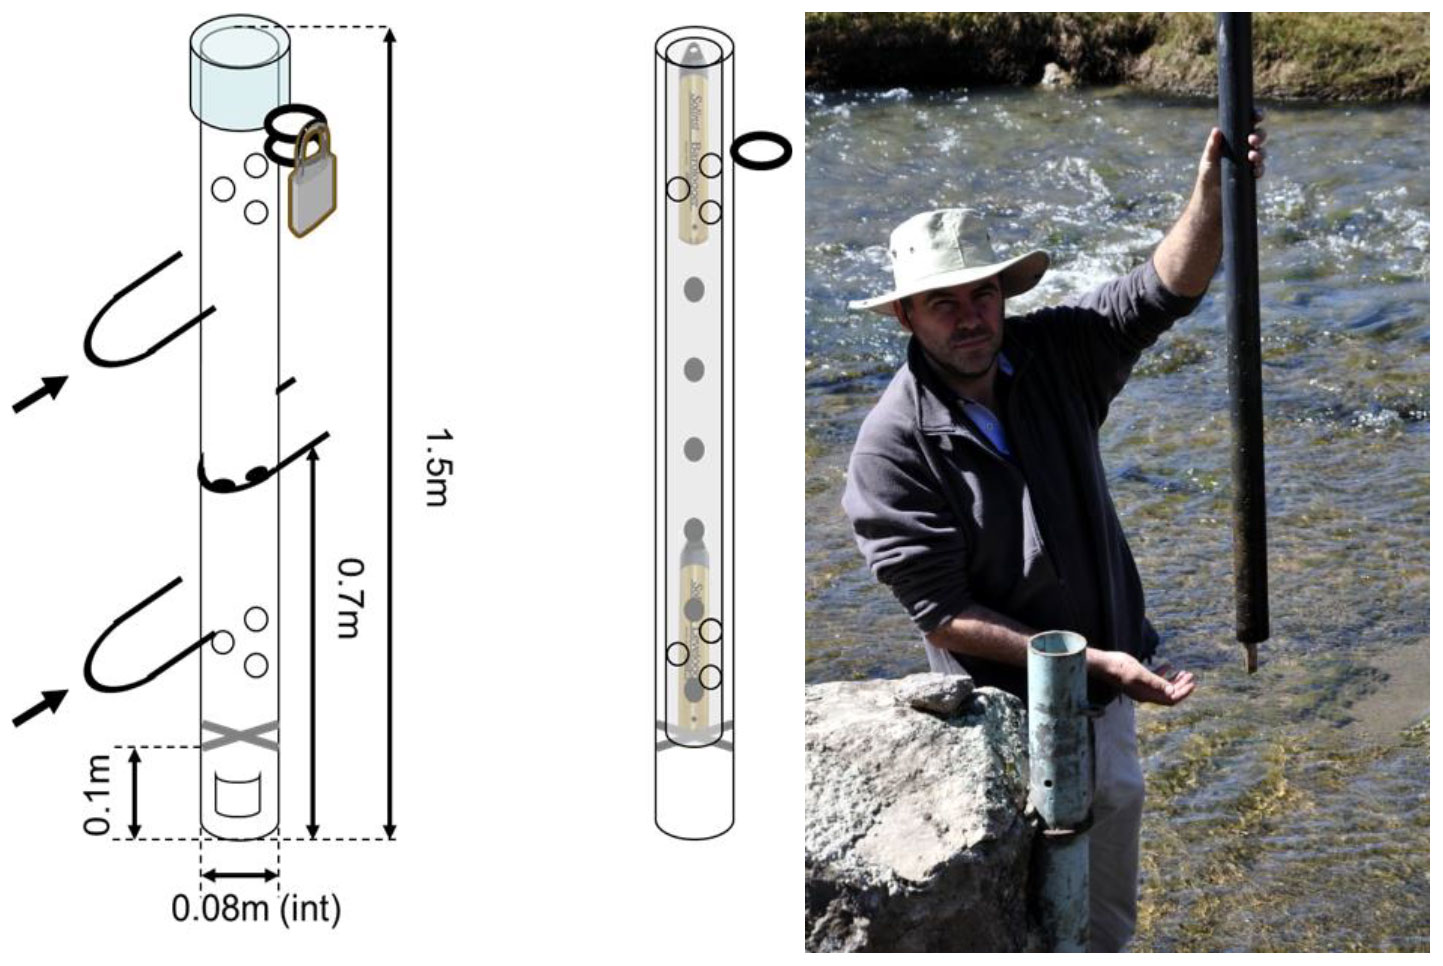
Figure 6Illustration of the design of the stilling wells used to collect total pressure (water + barometric) and barometric pressure. The photograph shows the stilling well and the insert tube containing the pressure data loggers.
The stream gauges that were installed in 2008 and 2009 and which are continuing to collect discharge are Casa de Agua, Cuchillacocha, Pachacoto, Llanganuco, and Querococha (Fig. 1). The Pumapampa gauge went out of commission in 2016 but is also included in this dataset (Table 3). These stream gauges have variable lengths of record due to periods of missing data, but still provide valuable streamflow information in a region where stream records are limited. As shown in the map (Fig. 1), two pairs of these stream gauges are located at different points along the same Rio Santa tributary in their respective sub-catchments: Pumapampa and Pachacoto in the Pachacoto valley; and Cuchillacocha and Casa de Agua in the Quilcayhuanca valley. All discharge measurements are calculated from rating curves containing a minimum of eight point measurements throughout all times of the year. As mentioned, rating curves are not directly provided in this data paper because they are variable in nature as we collect new discharge measurements in the field. The following two subsections provide a brief overview and summary for each gauging station, organized by general location in the Cordillera Blanca, moving from the southern end of the mountain range to the northern. Note that all glacier coverage is calculated from RGI 6.0 (RGI Consortium, 2017).
Table 3Geographical information on each of the hydrological gauging stations. Elevations are recorded at bank of stream. Note that all glacier coverage is calculated from RGI 6.0 (RGI Consortium, 2017). Dates with an asterisk indicate the station is operational.
3.2.1 The southern Cordillera Blanca
The Pumapampa catchment encompasses 58 km2 with about 8 % being covered by glaciers (Table 3). Pumapampa gauge (referred to as “PumQ” in Fig. 1) is located at 4287 m a.s.l., below Nevado Pastoruri at the southern end of the Cordillera Blanca. This stream gauge is situated in a channel through a low-lying meadow, where wet-season flow exceeds bankfull stage, causing inaccuracies in high-discharge measurements. Most notably, a series of values in late February 2014 indicated a peak discharge of 25 m3 s−1, well above extremes measured from the rating curve. It was determined that during this period the Leveloggers were overrun by water and measurements became unreliable solely during this flooding event. Outside of this event, discharge at Pumapampa is consistently within the measured values on the rating curve. Mean annual streamflow (averaged from 3 years of data missing less than 1 month during the entire year) at this stream gauge was 2.3 m3 s−1 and a specific discharge of 1248 mm a−1. Mean streamflow during the dry season (May through September) in Pumapampa was 1 m3 s−1, while the mean streamflow during the wet season (October through April) was 2.9 m3 s−1. The highest mean monthly streamflow occurred in March 2014 with an average of 5.3 m3 s−1 (Fig. 7).
The Pachacoto gauge (referred to as “PachQ” in Fig. 1) measures discharge 19 km downstream of Pumapampa, at 3738 m a.s.l., just above its confluence with the Rio Santa. Streamflow at Pachacoto is significantly greater than Pumapampa as it is the drainage point for a larger area of 202 km2, 5 % of which is covered by glaciers. The mean annual streamflow at Pachacoto was 3.2 m3 s−1, averaged from the seven near-complete years of data, with a calculated specific discharge of 499 mm a−1. Dry season runoff accounted for approximately 20 % of the annual streamflow by volume, while the majority of the remaining wet season runoff occurred during February and March.
Streamflow at another tributary catchment in the southern Cordillera Blanca is recorded at the Querococha gauge (referred to as “QuerQ” in Fig. 1) at 4005 m a.s.l., located 100 m downstream of Querococha lake and defining a drainage area of 63 km2, 1.5 % of which is glacierized. This drainage collects from two sub-catchments, one of which is entirely glacier-free, while the other contains rapidly receding ice masses including the Yanamarey glacier. Using 5 years of complete data, the mean annual streamflow at this gauging station was calculated to be 1.4 m3 s−1 and the specific discharge was 702 mm a−1. The streamflow from this gauge is somewhat regulated by Querococha, the second largest lake in the Cordillera Blanca. This catchment has been featured in many previous research studies, and many other instruments throughout the basin are still consistently monitored by ANA.
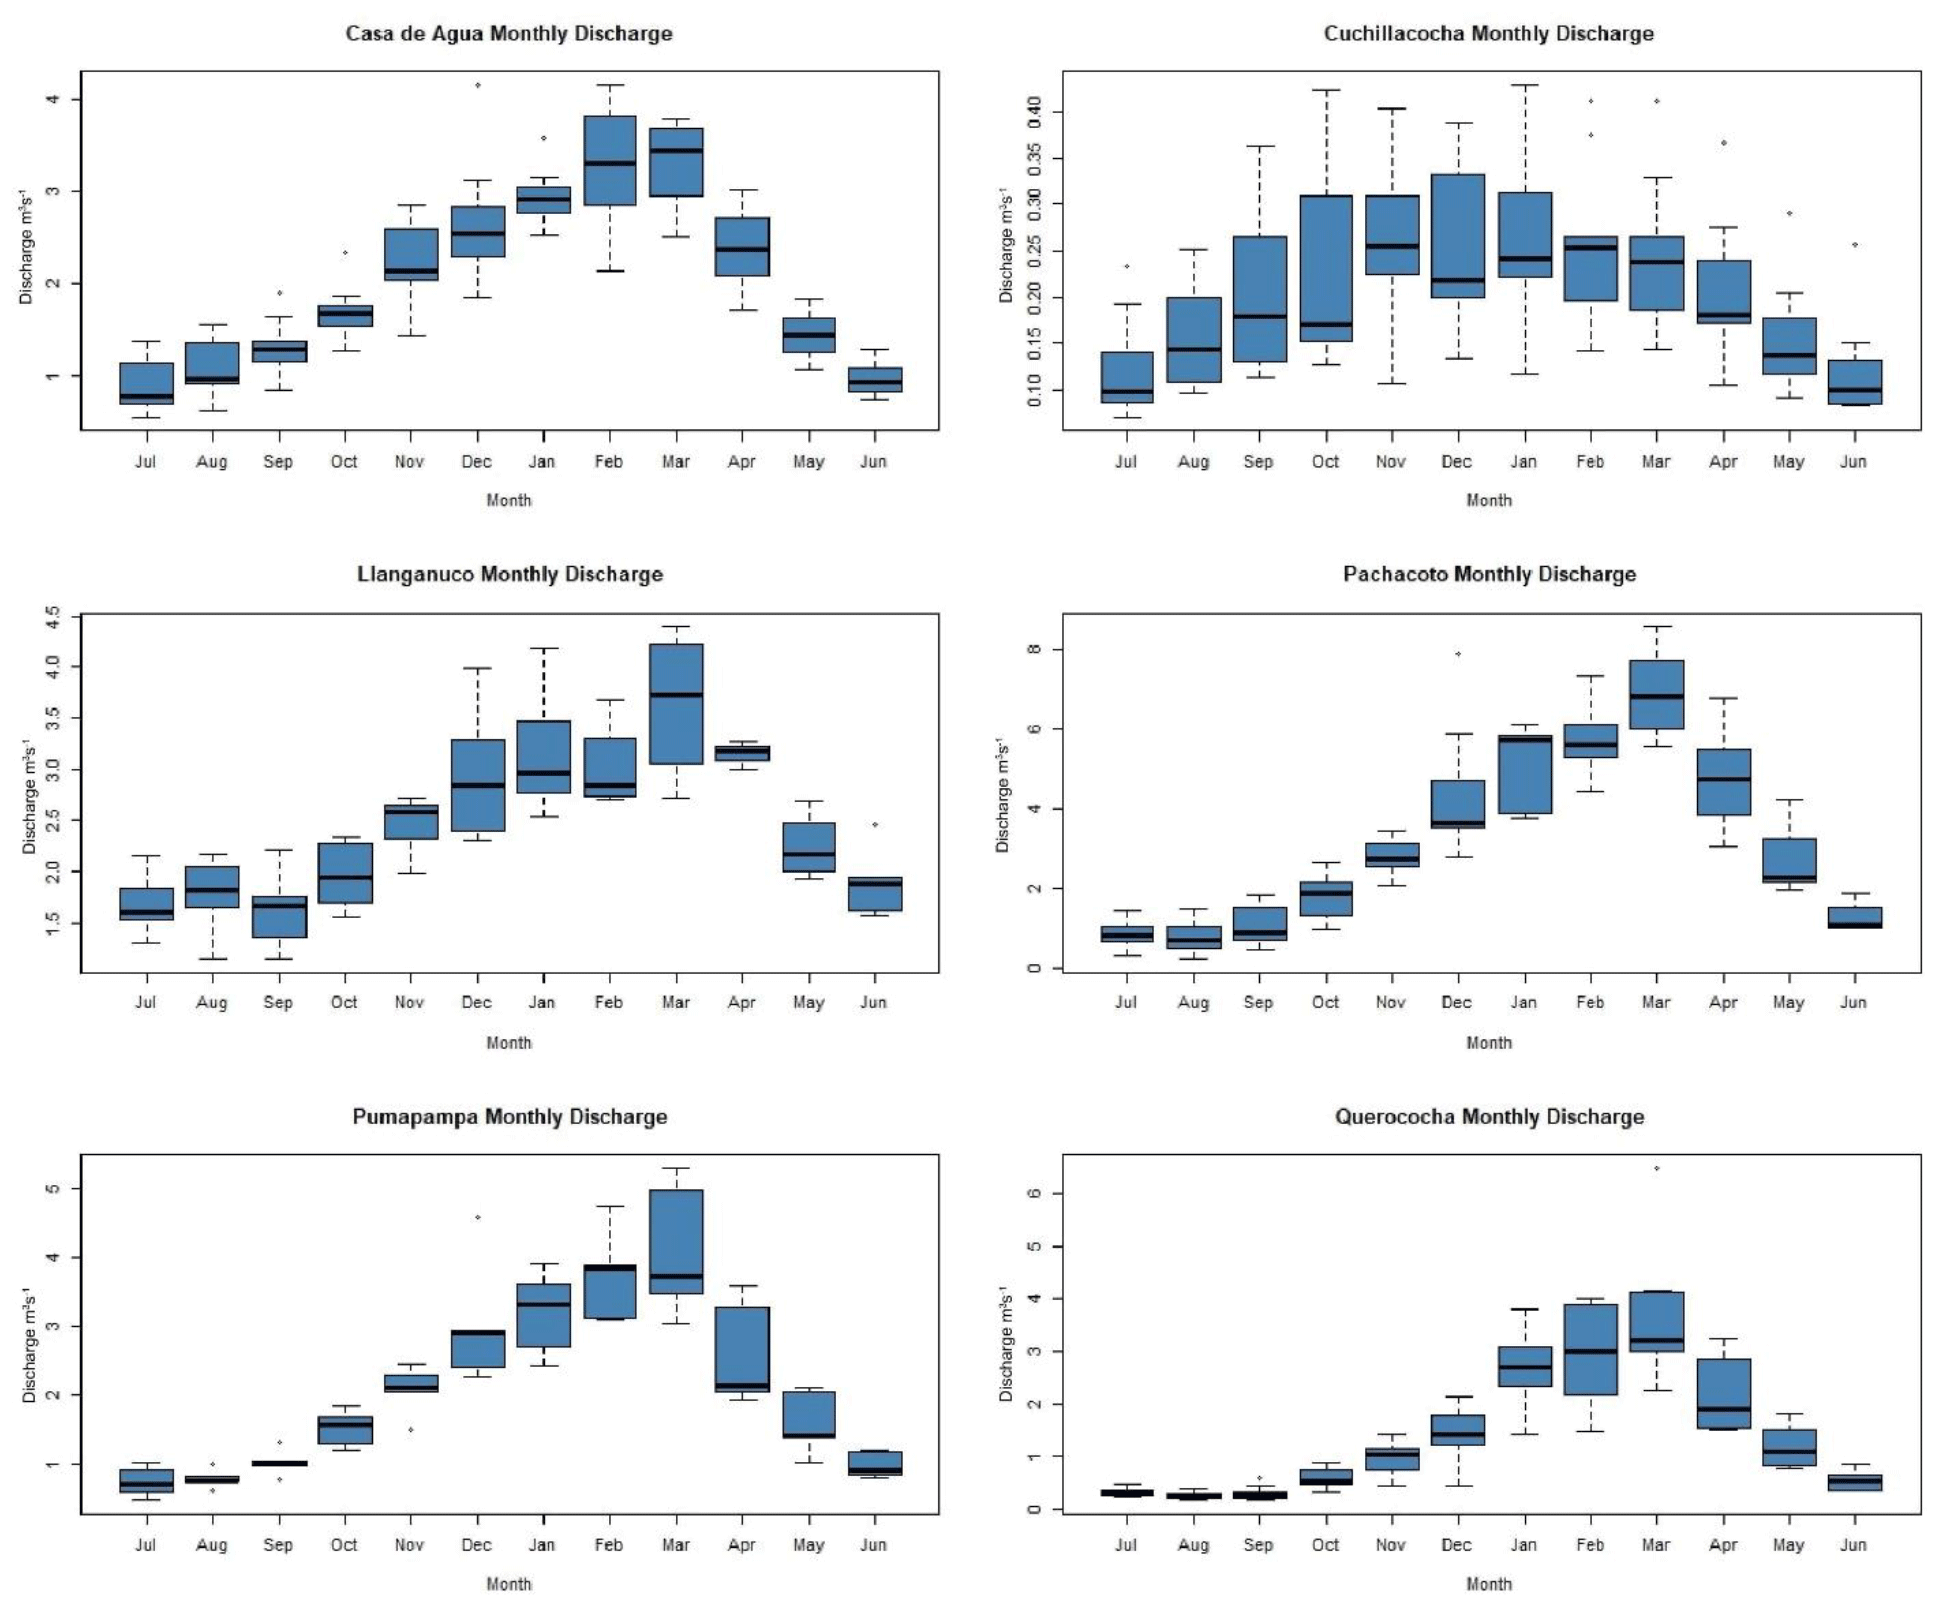
Figure 7Monthly discharge, in m3 s−1, at each of the gauging stations described in this study calculated from all complete months of data for each station. The strong seasonal pattern is clearly visible at most of the stream gauges.
3.2.2 The central and northern Cordillera Blanca
Another catchment that contains two streamflow gauges is Quilcayhuanca, a valley directly above the region's most populous city, Huaraz. The higher elevation stream gauge is Cuchillacocha (referred to as “CuchQ” in Fig. 1), which is situated at 4631 m a.s.l. and measures discharge below a high-alpine lake and two cirque glaciers encompassing a drainage area of 4 km2 (with 61 % of the basin covered in ice). This station displays a noticeably different discharge pattern throughout the year than the lower gauging stations which collect greater runoff. Cuchillacocha discharge is not defined by a strong wet–dry season fluctuation, instead displaying more variability each month and rising to peak values much earlier in the wet season than other stream gauges. The average streamflow values at this location are also an order of magnitude lower than other gauging stations due to the small drainage area it collects from (Fig. 7).
The stream gauge located at a lower elevation in the Quilcayhuanca valley is Casa de Agua (referred to as “CDAQ” in Fig. 1) at 3948 m a.s.l. This gauging station is found near a channel cut in the stream, in a large meadow, where water was previously rerouted for agricultural purposes. This gauge collects drainage from an area of 67 km2 below the confluence of two upper catchments, Cuchillacocha and Cayesh, well above the city of Huaraz (3100 m a.s.l.). From this drainage point in the watershed, the basin is approximately 25 % glacierized. The mean annual streamflow, calculated from 6 complete years of data at Casa de Agua, was 2 m3 s−1, with a specific discharge of 943 mm a−1.
The last streamflow gauge still recording data, Llanganuco (referred to as “LlanQ” in Fig. 1), is named after the valley it is located in and is positioned at 3850 m a.s.l., below two valley lakes and a catchment area of 87 km2, 30 % of which is currently glacierized. The mean annual streamflow, calculated from 3 complete years of data, was 2.3 m3 s−1, with a specific discharge of 835 mm a−1. A stream gauge has been in commission at Llanganuco on and off for 68 years, beginning as a gauge for UGRH and hydroelectric companies and later, after the original station became defunct, a site for our new, higher-temporal-resolution network of gauges.
The datasets presented here are available freely from https://doi.org/10.4211/hs.35a670e6c5824ff89b3b74fe45ca90e0 (Mateo et al., 2021). The hydrological and meteorological data from the Cordillera Blanca have been used in short segments in previous studies (Baraër et al., 2012, 2015). Data availability varies from station to station depending on the location of loggers and on instrumental errors which caused periods of time to lapse without data being recorded. These datasets represent a majority of the streamflow and meteorological data collected by our research group over the past two decades collected at a high temporal resolution of 15–30 min. These include point discharge measurements and short-time periods of 1 min temporal resolution meteorological measurements. The data provided here conclude in 2020; however, future data collected by these stations will be added to an updated version of the repository as future field seasons occur and the effort to provide hydrometeorological data to the scientific community will continue at all of the involved universities and institutions.
The Cordillera Blanca in the tropical Andes of Peru is a unique, high mountain region where high-resolution meteorological and hydrological time series observations collected from a network of instruments over the past two decades have been compiled in a new dataset. The region has been the focus of glacier monitoring efforts for nearly a century. While daily-to-monthly time series of meteorological and hydrological observations have been recorded discontinuously for almost 70 years, there was no generalized sub-daily data monitoring until the early 2000s. Maintaining this network of instruments recording high-temporal-resolution data has involved traveling to remote areas of the Cordillera Blanca, protecting the instruments from the harsh weather conditions at high elevations, and concealing instruments to prevent theft. There is also difficulty in developing long-term strategies because most funding agencies are focused on short-term projects and do not fund continuous monitoring and maintenance of data collection networks. In the context of ongoing global climate change with variable localized extremes, long-term monitoring of hydrometeorological variables is of utmost importance to document and understand the changes that are occurring.
The datasets collected and described in this paper support investigations into climate evolution, water resource availability, and hydrological changes across the Cordillera Blanca in the past 20 years. These datasets will also provide valuable, easy-to-access observations for local water resource managers. This paper provides an overview of the variables which have been measured and what is being made available as of 2021. Future measurements recorded in the field will be made available as they are collected, to further build on the available hydro-meteorological database in the Cordillera Blanca.
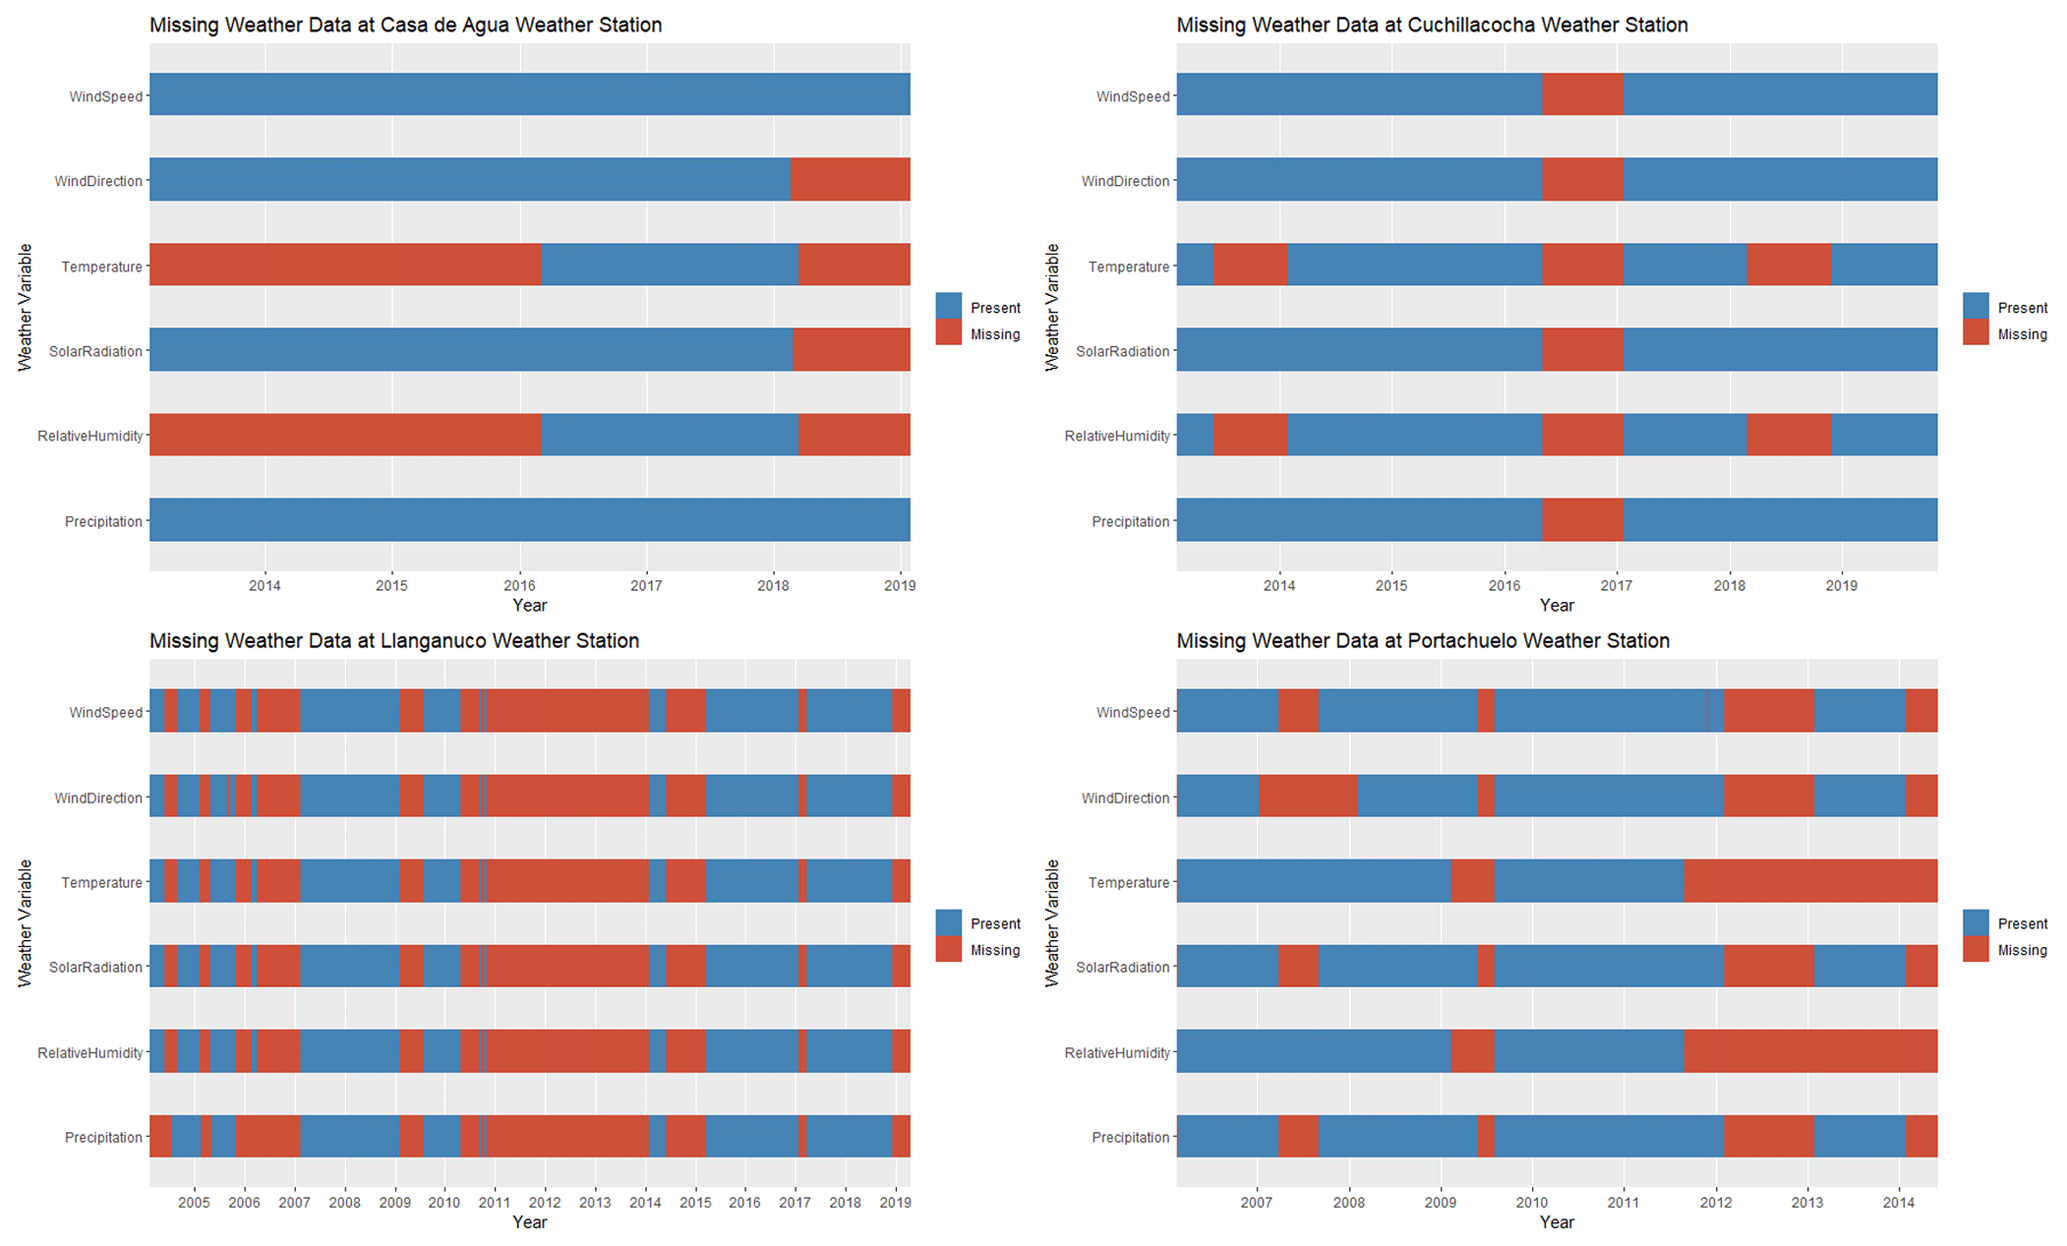
Figure A1Plot of data gaps in the weather station data at each weather station for all variables collected, available at https://doi.org/10.4211/hs.35a670e6c5824ff89b3b74fe45ca90e0 (Mateo et al., 2021).
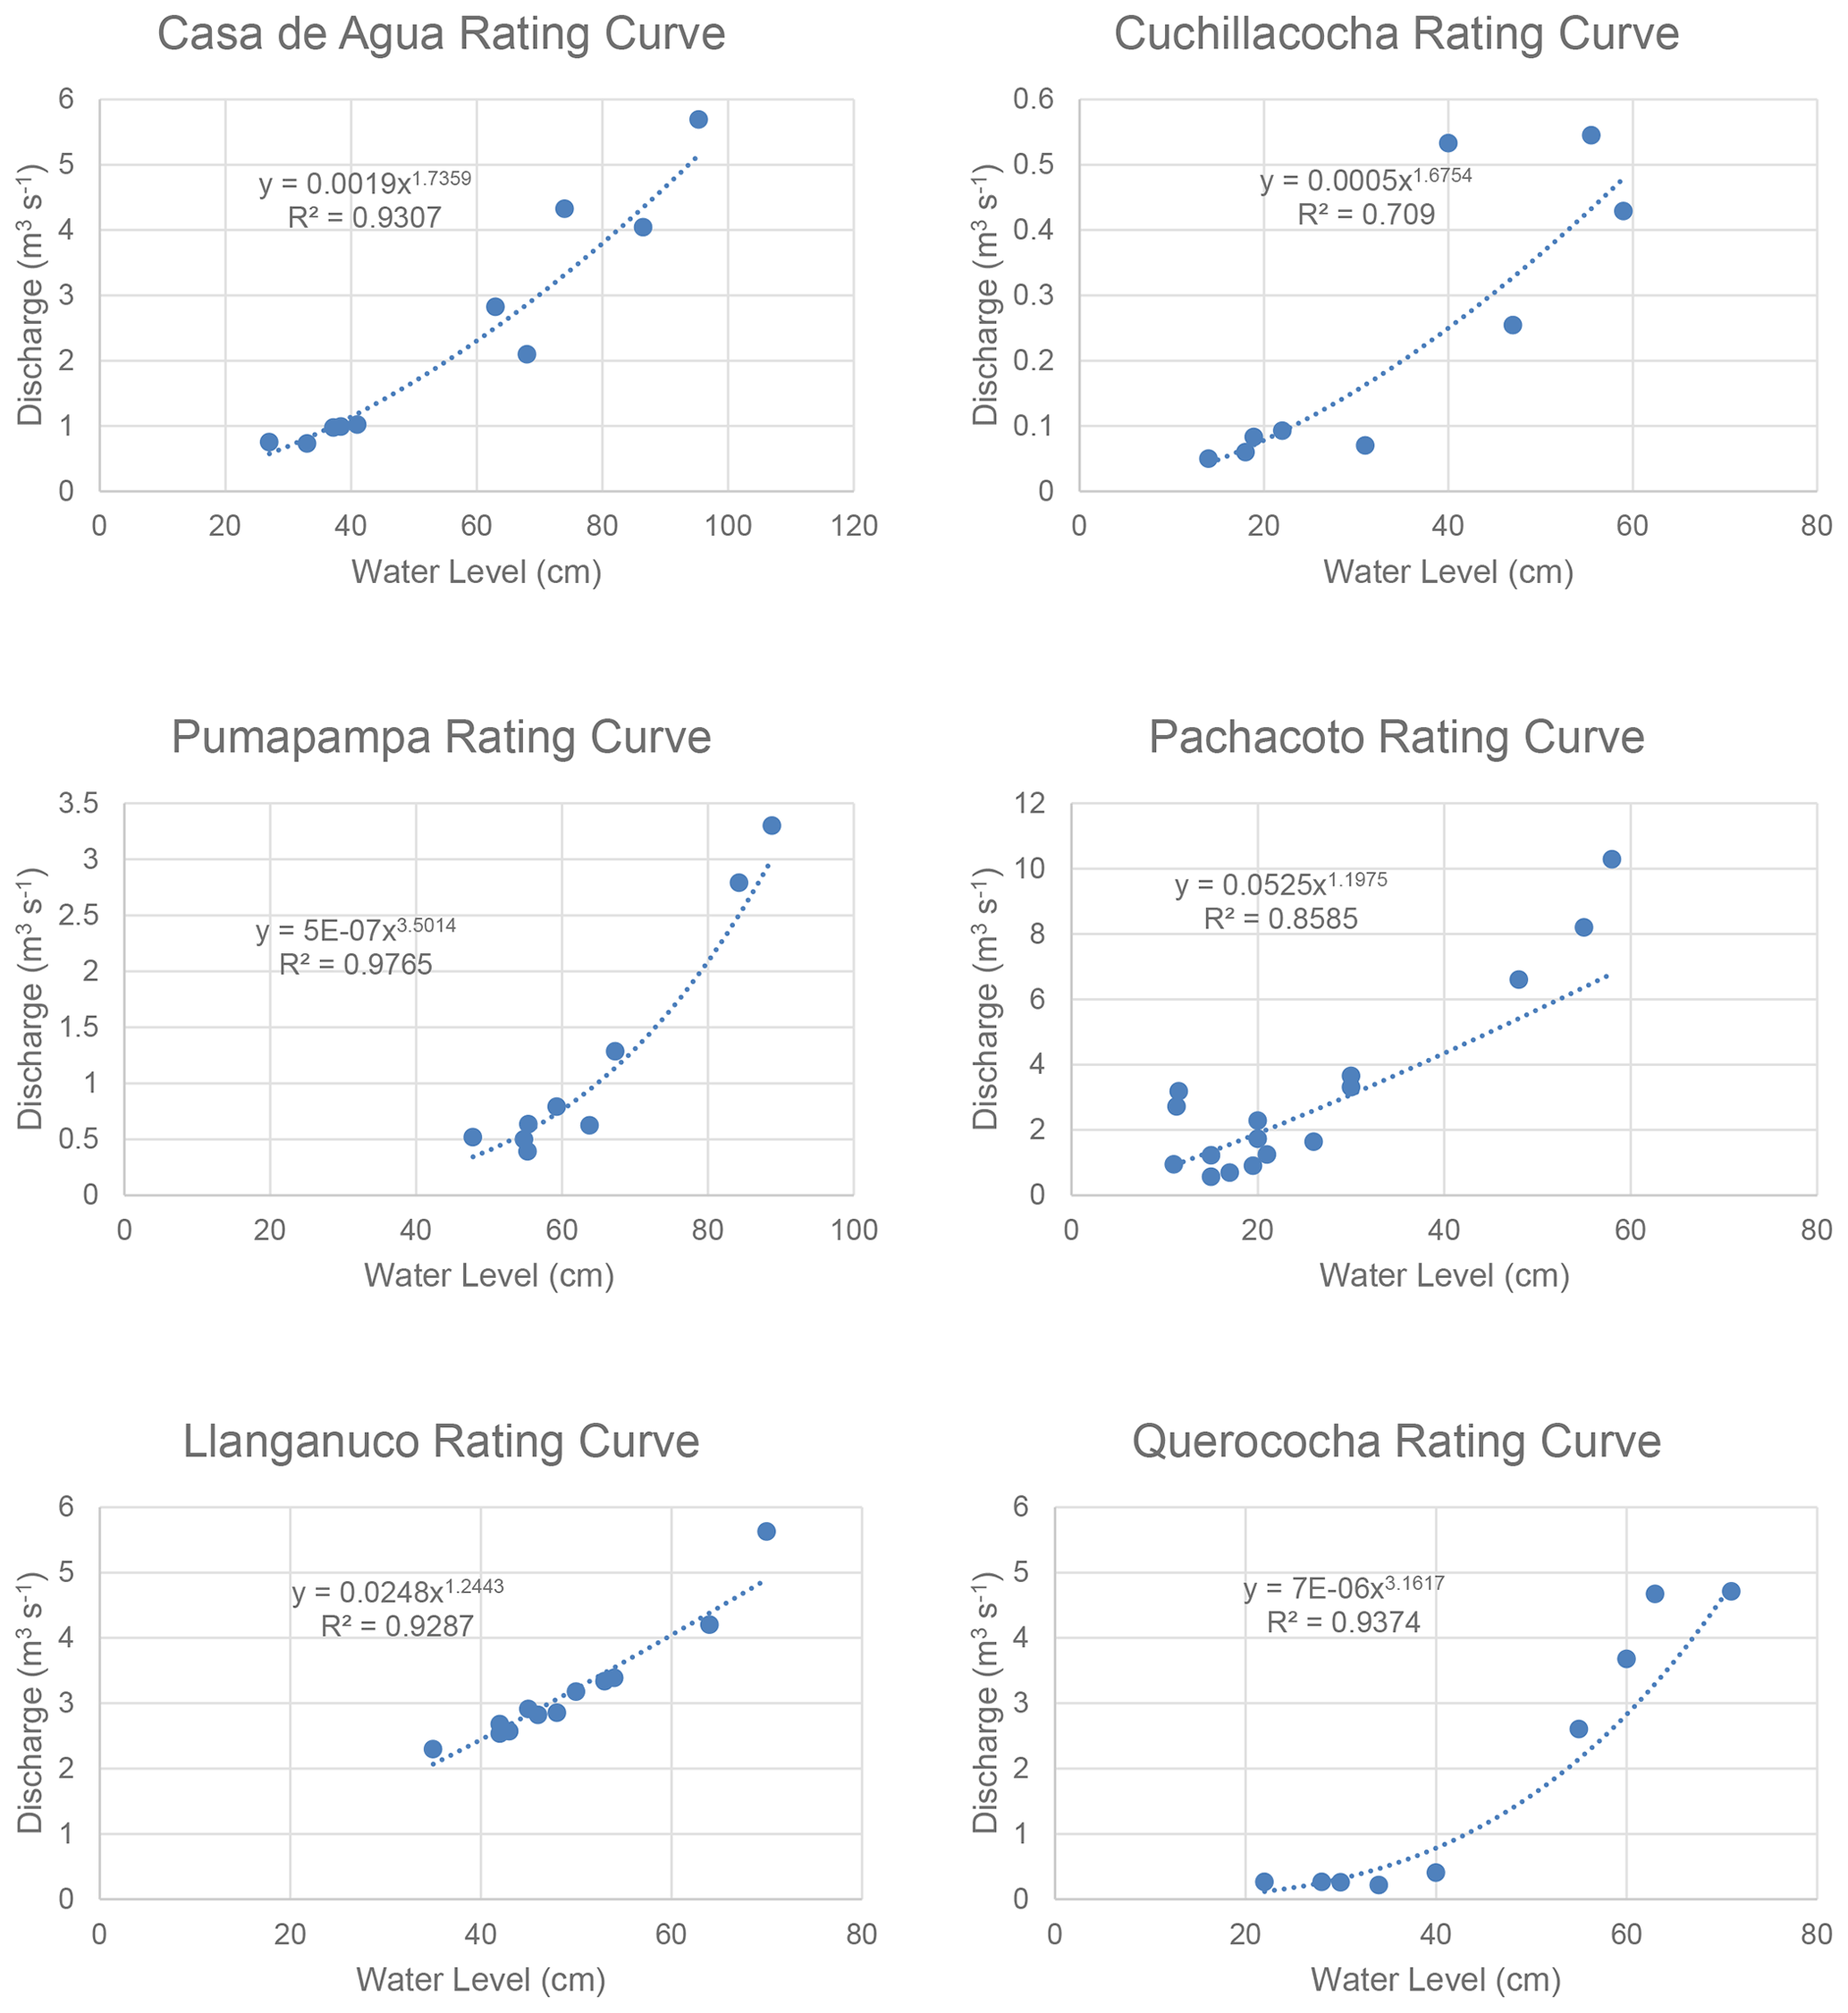
Table A1Rating curve values used for each discharge gauging station.
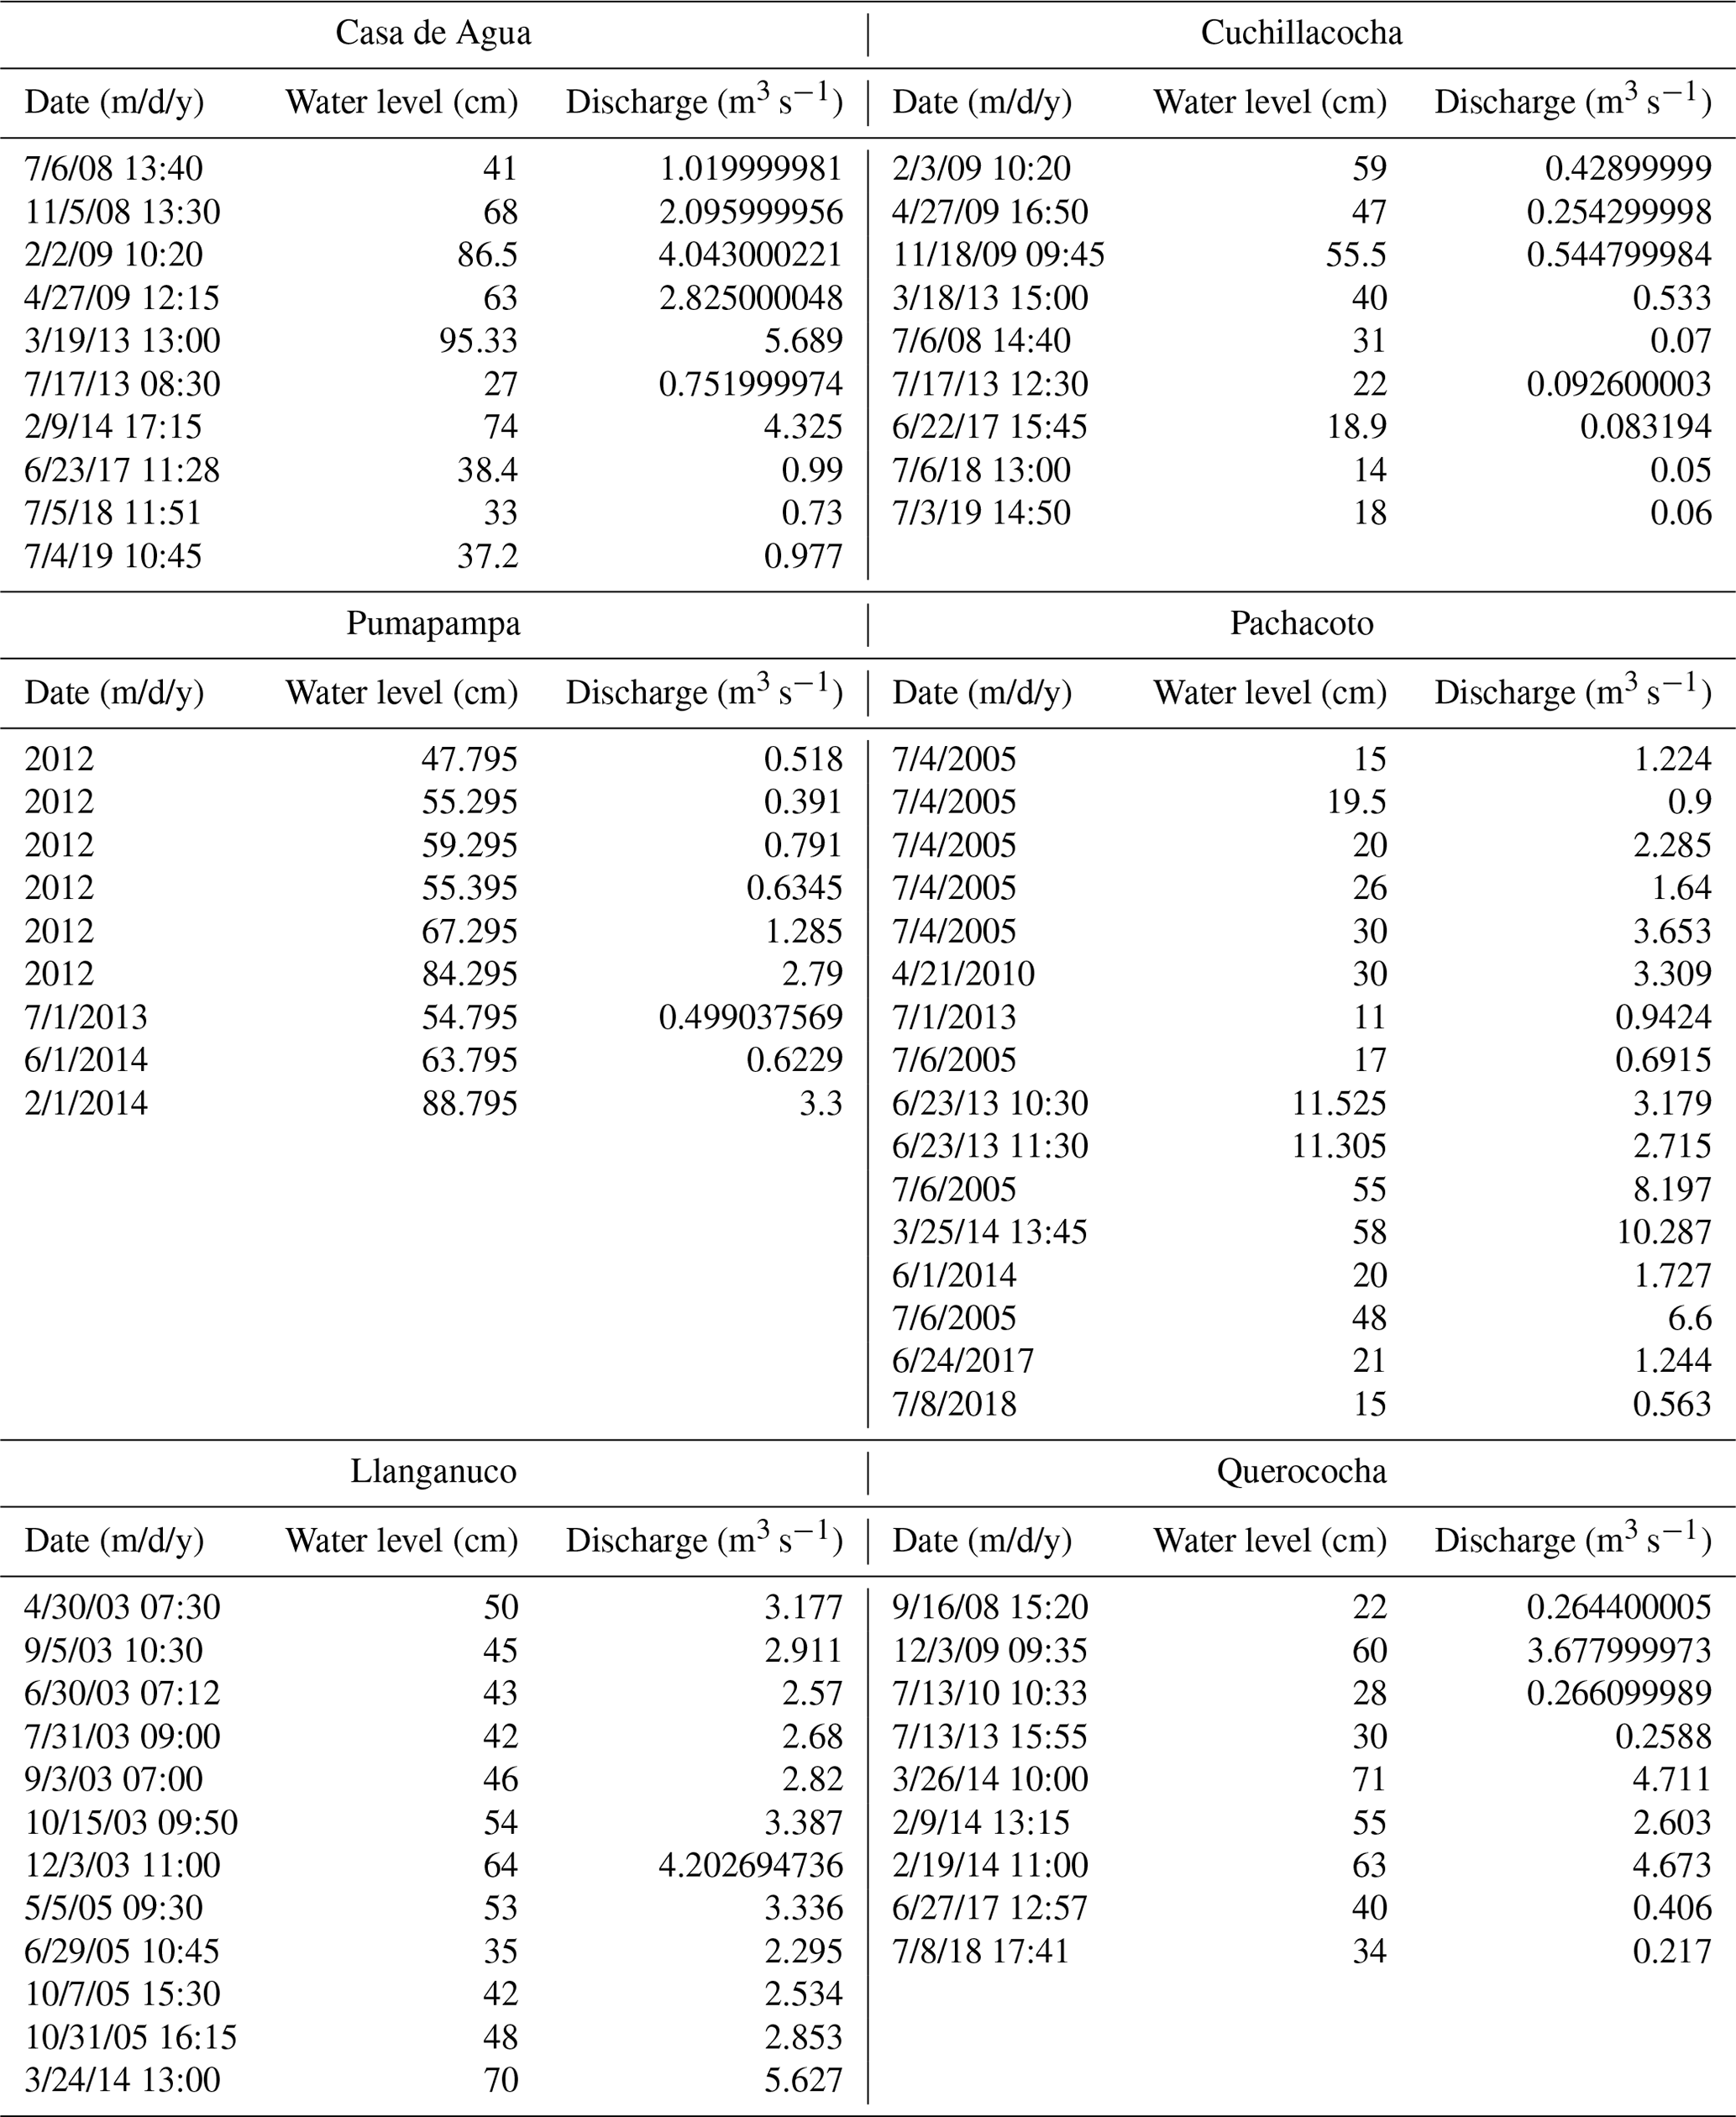

Figure A3Plot of data gaps in the discharge data, organized by gauging station, available at https://doi.org/10.4211/hs.35a670e6c5824ff89b3b74fe45ca90e0 (Mateo et al., 2021).
EIM prepared the manuscript with contributions from co-authors. EIM, RAH, and MB curated the data in preparation for this article. BGM acquired the initial funding for this international research collaboration and instrumental network. All authors collaborated in fieldwork gathering data and maintaining the instruments and data loggers.
The authors declare that they have no conflict of interest.
Publisher's note: Copernicus Publications remains neutral with regard to jurisdictional claims in published maps and institutional affiliations.
Funding for instrumentation, installation, and field maintenance was provided by various agencies and institutions associated with overlapping research projects and educational initiatives through respective institutions. BGM acknowledges The Ohio State University, National Science Foundation, National Geographic Society, NASA, and US Fulbright.
This research has been supported by The Ohio State University, National Science Foundation (NSF no. 0752175 with REU supplement; grant nos. NSF 1010384; NSF 1316432), National Geographic Society, NASA (New Investigator Program), and US Fulbright (Award no. 4506).
This paper was edited by Sibylle K. Hassler and reviewed by two anonymous referees.
Ames, A.: A documentation of glacier tongue variations and lake development in the Cordillera Blanca, Peru, Zeitschrift für Gletscherkunde und Glazialgeologie, 34, 1–36, 1998.
Ames, A. and Hastenrath, S.: Mass balance and iceflow of the Uruashraju Glacier, Cordillera Blanca, Peru, Zeitschrift für Gletscherkunde und Glazialgeologie, 32, 83–89, 1996.
Ames, A., Munoz, G., Verastegui, J., Vigil, R., Zamora, M., and Zapata, M.: Glacier inventory of Peru, Hidrandina, SA, Huaraz, Peru, 1989.
Baraer, M., McKenzie, J. M., Mark, B. G., Bury, J., and Knox, S.: Characterizing contributions of glacier melt and groundwater during the dry season in a poorly gauged catchment of the Cordillera Blanca (Peru), Adv. Geosci., 22, 41–49, https://doi.org/10.5194/adgeo-22-41-2009, 2009.
Baraër, M., Mark, B. G., McKenzie, J. M., Condom, T., Bury, J., Huh, K., Portocarrero, C., Gomez, J., and Rathay, S.: Glacier recession and water resources in Peru's Cordillera Blanca, J. Glaciol., 58, 134–150, https://doi.org/10.3189/2012JoG11J186, 2012.
Baraër, M., McKenzie, J., Mark, B. G., Gordon, R., Bury, J., Condom, T., Gomez, J., Knox, S., and Fortner, S. K.: Contribution of groundwater to the outflow from ungauged glacierized catchments: a multi-site study in the tropical Cordillera Blanca, Peru, Hydrol. Process., 29, 2561–2581, https://doi.org/10.1002/hyp.10386, 2015.
Bury, J. T., Mark, B. G., McKenzie, J. M., French, A., Baraër, M., Huh, K. I., and Gómez López, R. J.: Glacier recession and human vulnerability in the Yanamarey watershed of the Cordillera Blanca, Peru, Climate Change, 105, 179–206, 2011.
Carey, M.: In the Shadow of Melting Glaciers: Climate Change and Andean Society, Oxford University Press, New York, ISBN 978-0195396072, 2010.
Carey, M., Huggel., C., Bury, J., Portocarrero, C., and Haeberli, W.: An integrated socio-environmental framework for glacier hazard management and climate change adaptation: lessons from Lake 513, Cordillera Blanca, Peru, Climate Change, 112, 733-767, 2012.
Condom, T., Escobar, M., Purkey, D., Pouget, J.C., Suarez, W., Ramos, C., Apaestegui, J., Tacsi, A., and Gomez, J.: Simulating the implications of glaciers' retreat for water management: a case study in the Rio Santa basin, Peru, Water Int., 37, 442–459, 2012.
Condom, T., Martínez, R., Pabón, J. D., Costa, F., Pineda, L., Nieto, J. J., López, F., and Villacis, M.: Climatological and Hydrological Observations for the South American Andes: In situ Stations, Satellite, and Reanalysis Data Sets, Front. Earth Sci., 8, https://doi.org/10.3389/feart.2020.00092, 2020.
Covert, J. M.: Observational Analysis of Inter-annual Boundary Layer Processes within the Glaciated Llanganuco Valley, Peru, in: BSU Honors Program Theses and Projects, Item 167, http://vc.bridgew.edu/honors_proj/167 (last access: 15 January 2022), © 2016 Jason Covert, 2016.
Coxon, G., Freer, J., Wagener, T., Odoni, N. A., and Clark, M.: Diagnostic evaluation of multiple hypotheses of hydrological behaviour in a limits-of-acceptability framework for 24 UK catchments, Hydrol. Process., 28, 6135–6150, https://doi.org/10.1002/hyp.10096, 2014.
Eddy, A. M., Mark, B. G., Baraër, M., McKenzie, J. M., Fernández, A., Welch, S., and Fortner, S.: Exploring patterns and controls on the hydrochemistry of proglacial streams in the Upper Santa River, Peru, Revista de Glaciares y Ecosistemas de Montaña, 3, 41–57, 2017.
Garver, J. I., Reiners, P. W., Walker, L. J., Ramage, J. M., and Perry, S. E.: Implications for timing of Andean uplift from thermal resetting of radiation damaged zircon in the Cordillera Huayhuash, northern Peru, J. Geol., 113, 117–138, 2005.
Georges, C. and Kaser, G.: Ventilated and unventilated air temperature measurements for glacier-climate studies on a tropical high mountain site, J. Geophys. Res., 107, 4775, https://doi.org/10.1029/2002JD002503, 2002.
Giovanni, M. K., Horton, B. K., Garzione, C. N., McNulty, B., and Grove, M.: Extensional basin evolution in the Cordillera Blanca, Peru: Stratigraphic and isotopic records of detachment faulting and orogenic collapse in the Andean hinterland, Tectonics, 29, TC6007, https://doi.org/10.1029/2010TC002666, 2010.
Hastenrath, S. and Ames, A.: Recession of Yanamarey Glacier in Cordillera Blanca, Peru, during the 20th century, J. Glaciol., 41, 191–196, https://doi.org/10.1029/94JD03108, 1995.
Hellström, R. Å. and Mark, B. G.: An embedded sensor network for measuring hydrometeorological variability within a tropical alpine valley, Proceedings of the 63rd Eastern Snow Conference, U. Delaware, Newark, DE, USA, 22, https://www.easternsnow.org/esc-2006 (last access: 15 January 2022), 2006.
Hellström, R. Å., Higgins, A., Ferris, D., Mark, B. G., and Levia, D. F.: Impacts of complex terrain on evapotranspiration within a tropical alpine valley in the Peruvian Andes, Proceedings of the 67th Eastern Snow Conference, Jiminy Peak Mountain Resort, Hancock, MA, USA, 13, https://www.easternsnow.org/esc-2010 (last access: 15 January 2022), 2010.
Hellström, R. Å., Fernandez, A., Mark, B. G., Covert, J. M., Cochachin, A., Gomez, J.: Incorporating autonomous sensors and climate modeling to gain insight into seasonal hydrometeorological processes within a tropical glacierized valley, Ann. Am. Assoc. Geogr., 107, 260–273, https://doi.org/10.1080/24694452.2016.1232615, 2017.
Hofer, M., Mölg, T., Marzeion, B., and Kaser, G.: Empirical-statistical downscaling of reanalysis data to high-resolution air temperature and specific humidity above a glacier surface (Cordillera Blanca, Peru), J. Geophys. Res., 115, D12120, https://doi.org/10.1029/2009JD012556, 2010.
Kaser, G. and Georges, C.: Changes of the equilibrium-line altitude in the tropical Cordillera Blanca, Peru, 1930-50, and their spatial variations, Ann. Glaciol., 24, 344–349, 1997.
Kaser, G. and Osmaston, H. A.: Tropical glaciers, Cambridge University Press, Cambridge, United Kingdom, ISBN 978-0195396072, 2002.
Kaser, G., Ames, A., and Zamora, M.: Glacier fluctuations and climate in the Cordillera Blanca, Peru, Ann. Glaciol., 14, 136–140, 1990.
Kaser, G., Fountain, A., and Jansson, P.: A Manual for Monitoring the Mass Balance of Mountain Glaciers, Unesco Paris, 2003.
Kiang, J. E., Gazoorian, C., McMillan, H., Coxon, G., Le Coz, J., Westerberg, I. K., Belleville, A., Sevrez, D., Sikorska, A. E., Peterson-Overleir, A., Reitan, T., Freer, J., Renard, B., Mansanarez, V., and Mason, R.: A comparison of methods for streamflow uncertainty estimation, Water Resour. Res., 54, 7149–7176, https://doi.org/10.1029/2018WR022708, 2018.
Lliboutry, L., Morales, B., Schneider, B.: Glaciological problems set by the control of dangerous Lakes in Cordillera Blanca, Peru. III. Study of Moraines and mass balances at Safuna, J. Glaciol., 18, 275–290, 1977.
Mark, B. G. and McKenzie, J. M.: Tracing increasing tropical Andean glacier melt with stable isotopes in water, Environ. Sci. Technol., 41, 6955–6960, 2007.
Mark, B. G. and Seltzer, G. O.: Tropical glacier meltwater contribution to stream discharge: A case study in the Cordillera Blanca, Peru, J. Glaciol., 49, 271–281, 2003.
Mark, B. G., McKenzie, J. M., and Gomez, J.: Hydrochemical evaluation of changing glacier meltwater contribution to stream discharge: Callejon de Huaylas, Peru, Hydrolog. Sci. J., 50, 975–987, 2005.
Mark, B. G., Bury, J., McKenzie, J. M., French, A., and Baraer, M.: Climate change and tropical Andean glacier recession: evaluating hydrologic changes and livelihood vulnerability in the Cordillera Blanca, Peru, Ann. Assoc. Am. Geogr., 100, 794–805, 2010.
Mateo, E. I., Mark, B. G., Hellström, R. Å., Baraer, M., McKenzie, J. M., Condom, T., Rapre, A. C., Gonzales, G., Gómez, J. Q., and Encarnación, R. C. C.: High temporal resolution hydrometeorological data collected in the tropical Cordillera Blanca, Peru (2004–2020), HydroShare [data set], https://doi.org/10.4211/hs.506c1f66f87e4004b84e6af4097853a4, 2021.
McMillan, H., Freer, J., Pappenberger, F., Krueger, T., and Clark, M.: Impacts of uncertain river flow data on rainfall-runoff model calibration and discharge predictions, Hydrol. Process., 24, 1270–1284, https://doi.org/10.1002/hyp.7587, 2010.
McMillan, H., Krueger, T., and Freer, J.: Benchmarking observational uncertainties for hydrology: Rainfall, river discharge and water quality. Hydrol. Process., 26, 4078–4111, https://doi.org/10.1002/hyp.9384, 2012.
McNulty, B. A., Farber, D. L., Wallace, G. S., Lopez, R., and Palacios, O.: Role of plate kinematics and plate-slip-vector partitioning in continental magmatic arcs: Evidence from the Cordillera Blanca, Peru, Geology, 26, 827–830, 1998.
Petersen, U., Sassarini, L., and Plenge, R.: Glaciar Yanasinga (Central Peru): 24 years of measurements, J. Glaciol., 8, 487–489, 1969.
RGI Consortium: Randolph Glacier Inventory – A Dataset of Global Glacier Outlines: Version 6.0: Technical Report, Global Land Ice Measurements from Space, Colorado, USA, Digital Media, https://doi.org/10.7265/N5-RGI-60, 2017.
Schwarb, M., Acuña, D., Konzelmann, Th., Rohrer, M., Salzmann, N., Serpa Lopez, B., and Silvestre, E.: A data portal for regional climatic trend analysis in a Peruvian High Andes region, Adv. Sci. Res., 6, 219–226, https://doi.org/10.5194/asr-6-219-2011, 2011.