the Creative Commons Attribution 4.0 License.
the Creative Commons Attribution 4.0 License.
 | 18 May 2022
Concentrations and fluxes of suspended particulate matter and associated contaminants in the Rhône River from Lake Geneva to the Mediterranean Sea
Alexandra Gruat
Fabien Thollet
Jérôme Le Coz
Marina Coquery
Matthieu Masson
Aymeric Dabrin
Olivier Radakovitch
Jérôme Labille
Jean-Paul Ambrosi
Doriane Delanghe
Patrick Raimbault
The Rhône River is among the main rivers of western Europe and the biggest by freshwater discharge and sediment delivery to the Mediterranean Sea. Its catchment is characterized by distinct hydrological regimes that may produce annual sediment deliveries ranging from 1.4 to 18.0 Mt yr−1. Its course meets numerous dams, hydro and nuclear power plants as well as agricultural, urban and industrial areas. Moreover, with the climatic crisis we are currently facing, it is proven that the occurrence and the intensity of extreme events (floods or droughts) will increase. Therefore, it is crucial to monitor the concentrations and fluxes of suspended particulate matter (SPM) and associated contaminants to study the current trends and their evolution. In the Rhône River (from Lake Geneva to the Mediterranean Sea), a monitoring network of 15 stations (3 on the Rhône River and 12 on tributaries) has been set up in the past decade by the Rhône Sediment Observatory (OSR) to investigate the concentrations and the fluxes of SPM and associated contaminants as well as their sources. The main purpose of the OSR is to assess the long-term trend of the main contaminant concentrations and fluxes, and to understand their behavior during extreme events, such as floods or dam flushing operations. The dataset presented in this paper contains the concentrations and fluxes of SPM as well as the concentrations and fluxes of several particle-bound contaminants of concern, e.g., polychlorinated biphenyl (PCB), trace metal elements (TME) and radionuclides, the particle size distribution and the particulate organic carbon of SPM. Sediment traps or continuous flow centrifuges were used to collect sufficient amount of SPM in order to conduct the measurements, and data completion was applied to reconstruct missing values. This observatory is on-going since 2011 and the database is regularly updated. All the data are made publicly available in French and English through the BDOH OSR database at https://doi.org/10.15454/RJCQZ7 (Lepage et al., 2021).
- Article
(3812 KB) - Full-text XML
- BibTeX
- EndNote


Human activities, especially in recent decades, impact rivers all over the world and consequently the seas and oceans. This impact is enhanced by the climate changes we are experiencing. In order to understand these changes in our rivers and to better anticipate them, it is important to set up the monitoring of the water and particles transported by these environmental vectors (Syvitski et al., 2005). In addition, the monitoring of rivers allows a better understanding of changes in the seas and oceans where monitoring is more difficult to implement (Vihma et al., 2019). While monitoring of the quantity of water in transit has been effective for several decades (Horowitz, 2008), there are fewer examples of long-term monitoring of SPM and contaminants (Syvitski et al., 2005), leading to many gaps in their behavior and fate on large time scales. Indeed, the literature contains studies on large rivers (Horowitz et al., 2001; Armijos et al., 2017; Martinez et al., 2013), but many other studies are based on either low-frequency sampling and measurement over a long period (Lick, 2008; Delmas et al., 2012; Moatar et al., 2013), or high-frequency sampling and measurement over a short period of time (Radakovitch et al., 2008; Sicre et al., 2008; Panagiotopoulos et al., 2012). It is crucial to extend the observations in different watersheds over the world to better constrain the hydro-sedimentary dynamics according to variables which have a direct relationship with the production of sediments and associated contaminants, such as vegetation cover, industrialization, population density and agriculture. Moreover, contaminants are mainly measured in the liquid fraction of samples, which is analytically simpler than measuring them in the solid fractions; however, the transport of contaminants by the solid fraction is far from negligible (Horowitz, 2009). To better understand the global changes that affect our terrestrial and marine environments, it is therefore important to develop long-term hydro-sedimentary observatories.
The Rhône River (813 km long) arises in the Rhône Glacier in the Swiss Alps, transits through Lake Geneva and flows through southeastern France down to the Mediterranean Sea. It is one of the biggest Mediterranean rivers in terms of freshwater and suspended particulate matter (SPM) delivery to the sea (Ludwig et al., 2009; Sadaoui et al., 2016). Several exceptional floods occurred in the last two decades and have modified its morphology (Antonelli et al., 2008). In fact, the annual SPM flux near the outlet strongly varies due to distinct hydrological regimes in the basin, including glacial, nival, pluvial and Mediterranean components (Pont et al., 2002). Between 1.4 and 18.0 Mt of sediment transit to the Mediterranean Sea each year (Poulier et al., 2019), while the mean inter-annual monthly SPM flux is characterized by a trimodal distribution over the year with maxima in November, January, and May–June (Delile et al., 2020). The Rhône channel is widely artificial with 21 hydroelectric dams, 5 nuclear power plants and 2 big cities with over 500 000 inhabitants (Geneva in Switzerland and Lyon in France). The Rhône River is an important water resource at the interregional scale, notably for drinking water supplies or irrigation as a large area of this catchment is used for agriculture, especially farming and grazing. The Rhône watershed covers about a 5th of the surface of metropolitan France, which implies the transport of eroded material from a wide variety of land uses. Therefore, anthropic contamination of the Rhône River by hydrophobic organic contaminants such as polychlorinated biphenyl (PCB), polycyclic aromatic hydrocarbons (PAH), trace metal elements (TME) and radionuclides has been observed for many years (Radakovitch et al., 2008; Mourier et al., 2014; Delile et al., 2020; Eyrolle et al., 2020). For these substances, SPM transport represents the main driver of contaminants from rivers to coastal areas, leading to an alteration of biogeochemical cycles and water quality (Horowitz, 2009).
In this watershed, studies conducted on sediment dynamics and associated contaminants are unfortunately scarse (Antonelli et al., 2008; Radakovitch et al., 2008; Panagiotopoulos et al., 2012; Delmas et al., 2012) and do not allow an understanding of the observed changes over the long term. On this basis, the monitoring of spatial and temporal distributions of SPM and associated contaminants has been conducted within the Rhône Sediment Observatory (OSR) since 2009 (Le Bescond et al., 2018). A total of 15 monitoring stations have been installed with 3 along the Rhône River channel and 12 on the main tributaries. This monitoring network was designed to improve our understanding on SPM transfer processes in rivers exposed to anthropogenic contamination and extreme hydro-sedimentary events (flood, low-water, dam regulation), and to provide stakeholders with precise values of SPM and contaminants fluxes. The current database provides time series of suspended solid concentrations (SSC), SPM fluxes, particle size distributions (PSD), particulate organic carbon (POC) contents, and the concentrations and fluxes of several contaminants of interest (Thollet et al., 2021).
The hydro-sedimentary and contaminant monitoring data from the Rhône River and the main tributaries are useful for the assessment of:
-
The annual and inter-annual fluxes of SPM and hydrophobic organic contaminants and TME and radionuclides;
-
The spatial and temporal variations of the contaminant concentrations;
-
The impact of extreme events (floods or dam flushing operations) in terms of sediment budget and contaminant concentrations.
In the database (https://doi.org/10.15454/RJCQZ7, Lepage et al., 2021), two types of time series are stored. Discontinuous time series are used for measurements on SPM samples that are collected from a starting time to an ending time (with no information on in-between sampling periods). Calculated time series are obtained by several transformations (including data completion) of the discontinuous time series and the SSC (Fig. 1). Time series can be interpolated, transformed and multiplied within the database application to derive computed time series from existing time series.
The dataset includes the following measured parameters (discontinuous time series):
-
Particle size distribution (PSD, 10 %, 50 %, 90 % percentile diameters D10, D50, D90, in µm);
-
Particulate organic carbon (POC, in g kg−1 dry weight);
-
Trace metal elements (TME): arsenic (As), cadmium (Cd), chromium (Cr), cobalt (Co), copper (Cu), lead (Pb), mercury (Hg), nickel (Ni), zinc (Zn) (in mg kg−1 dry weight);
-
Polychlorinated biphenyl (PCB): PCB28, 52, 101, 118, 138, 153, 180 (in µg kg−1 dry weight);
-
Radionuclides: organically bound tritium (OBT, in Bq kg−1 dry weight), carbon-14 (14C in Bq kg−1 dry weight) and cesium-137 (137Cs in Bq kg−1 dry weight).
The dataset includes the following calculated parameters:
-
Suspended solid concentration (SSC, mg L−1) either derived from in situ turbidity measurements or by filtration of water samples as explained in the Methods section. The procedure for data completion are presented in the Methods section,
-
SPM flux (t s−1) was calculated in the database by multiplying water discharge (not made available in the dataset because it is released separately by data producers, in m3 s−1) and SSC (Fig. 1). The owners of the water discharge data are reported in Tables 2 and 3,
-
Contaminant flux (g s−1 or Bq s−1) was calculated in the database by multiplying the SPM flux and the contaminant concentration (Fig. 1). The procedures for flux computation and data completion of the discontinuous contaminant time series are presented in the Methods section.

Figure 1Calculation processes to obtain SPM and particulate contaminant fluxes from the measured parameters (where X is a contaminant).
Data are organized by station with information on the provider, the period of availability (date in coordinated universal time, UTC) and the amount of data (Fig. 2a). For particulate contaminant concentration, the name of the time series is related to the sampling method, as illustrated in Fig. 2a for Hg, with:
-
CX = discontinuous concentration of particulate contaminant X in SPM samples collected by continuous flow centrifuge,
-
CX-2 = discontinuous concentration of particulate contaminant X in SPM samples collected by particle trap.
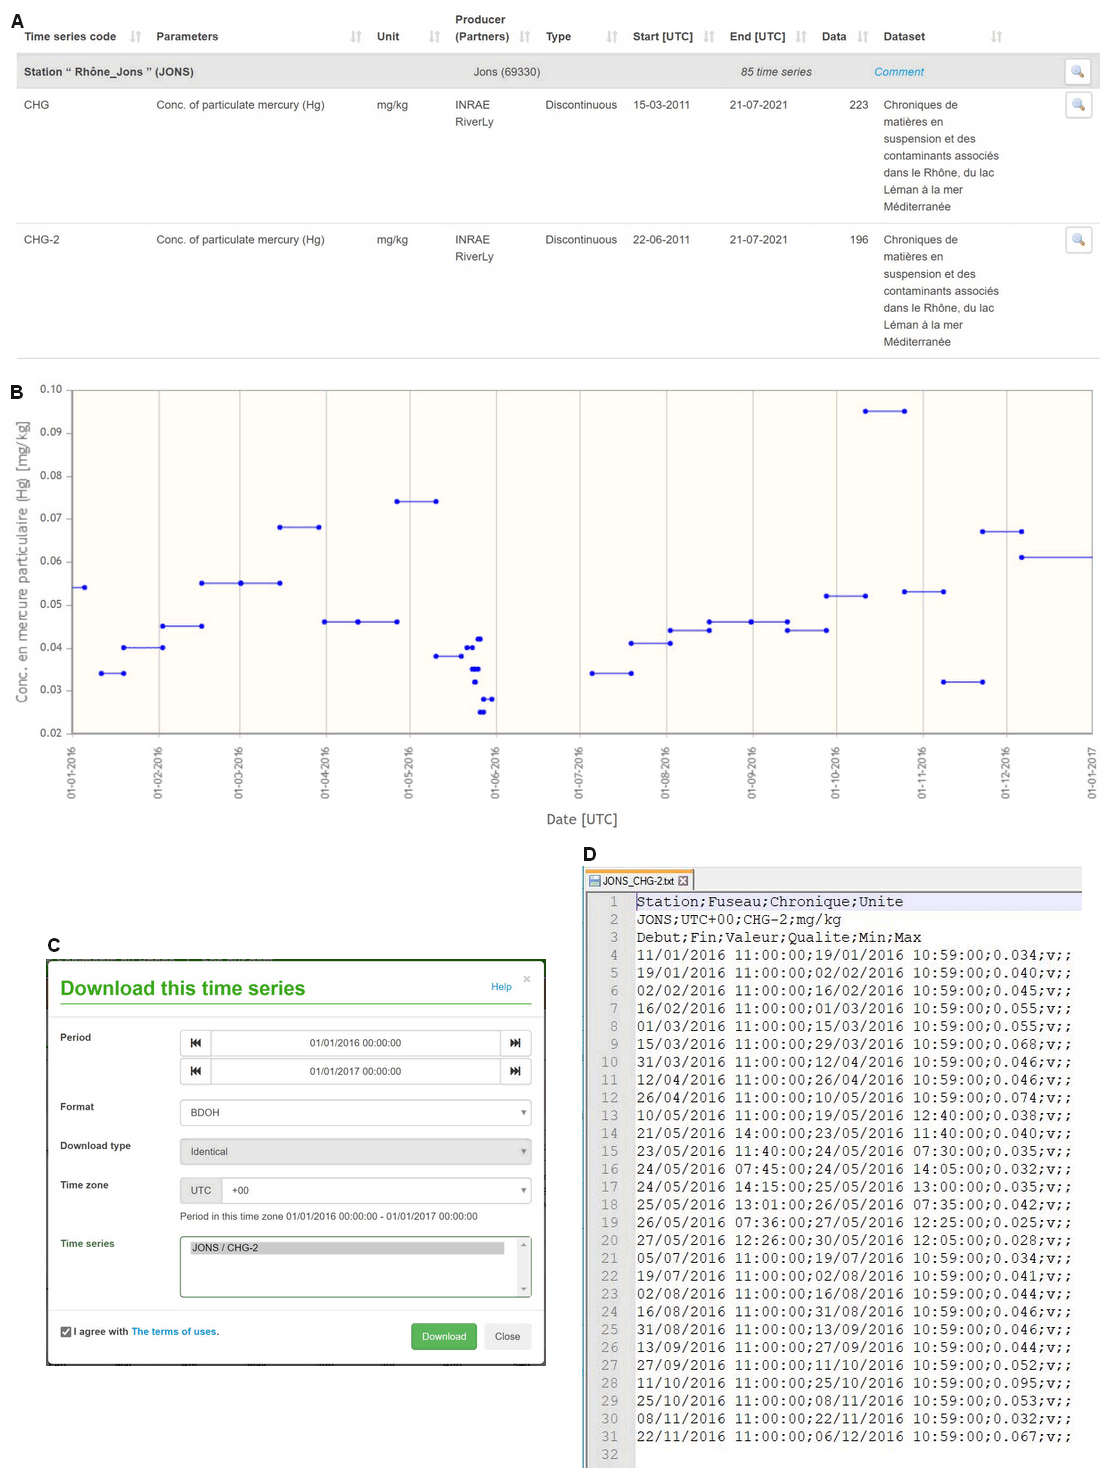
Figure 2Example of time series available at the Rhône station at Jons in the BDOH OSR database: (a) Screenshot of mercury (Hg) time series with CHG for SPM sample collected by continuous flow centrifuge and CHG-2 for SPM sample collected by particle trap, (b) screenshot of the visualization of the time series CHG-2 in 2016, (c) screenshot of the window for choosing download parameters of the time series CHG-2 and (d) screenshot of the flat text file of the time series CHG-2 in 2016 and associated quality code (v = valid) using Notepad (v.8.4).
The user can visualize each time series online (Fig. 2b) and download them individually after choosing several parameters (Fig. 2c) such as:
-
the period of the time series by selecting start and end dates;
-
the file format: BDOH (raw) or Hydro2-QTVAR (specific format used by the French national hydrological services);
-
the type of transformation and time steps: identical (raw data, constant or variable time steps), linear interpolation at constant time steps, mean (1 or 6 h, daily, monthly, yearly, event scale) or accumulation (1 or 6 h, daily, monthly, yearly, event scale). This parameter is only available for calculated and continuous time series;
-
the time zone (by default in the database: UTC +00).
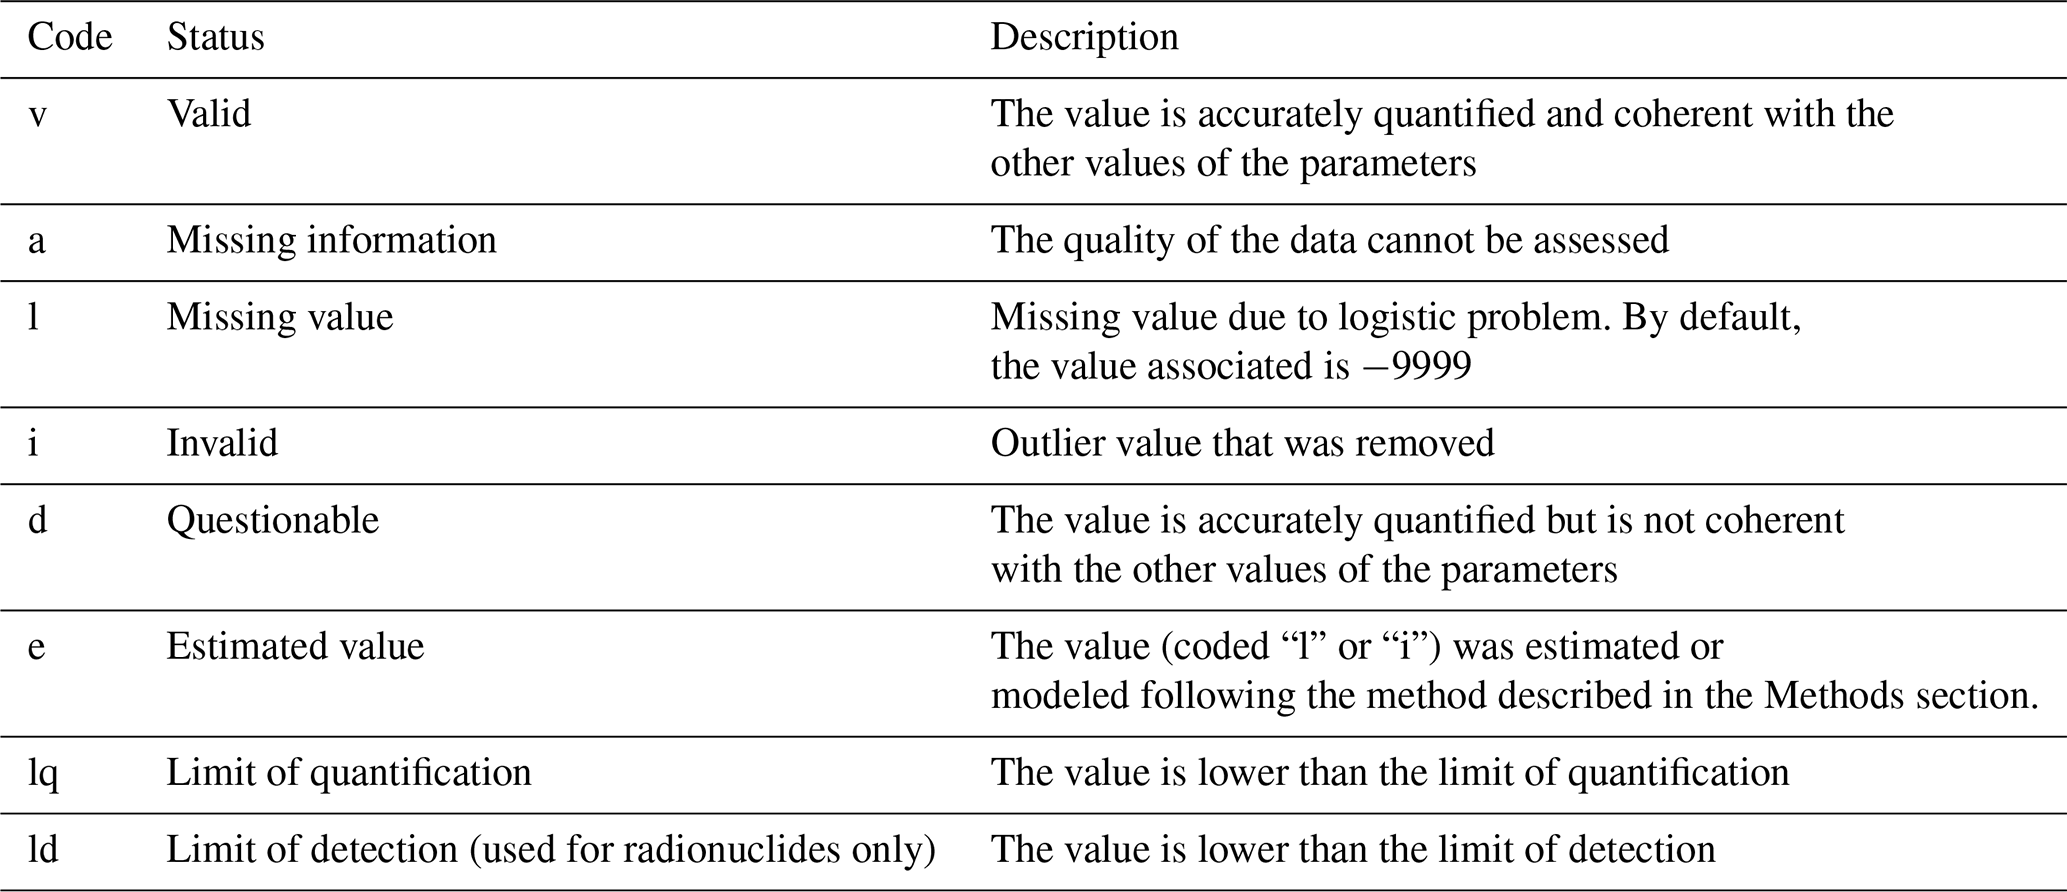
Data are sent by e-mail in a compressed folder (export.zip) containing the time series as flat text files (STATION_PARAMETER.txt) and another file (Report.txt) that contains all the necessary metadata (producer, parameter, genealogy, time zone, conversion factors). The file of the time series can be processed by any software (Excel, R, Matlab, etc.). Each value of the time series is associated with a quality code (Fig. 2d) according to Table 1.
3.1 Sampling location
The monitoring conducted within the OSR is located in the Rhône River catchment downstream of Lake Geneva in Switzerland (∼95 000 km2) (Fig. 3). Due to its large volume and high trapping efficiency, Lake Geneva is a barrier to SPM coming from the upstream catchments so that its sedimentary output can be neglected. A total of 15 monitoring stations have been installed (Fig. 3) with 3 of them along the Rhône River (Table 2) and 12 on the main tributaries (Table 3).
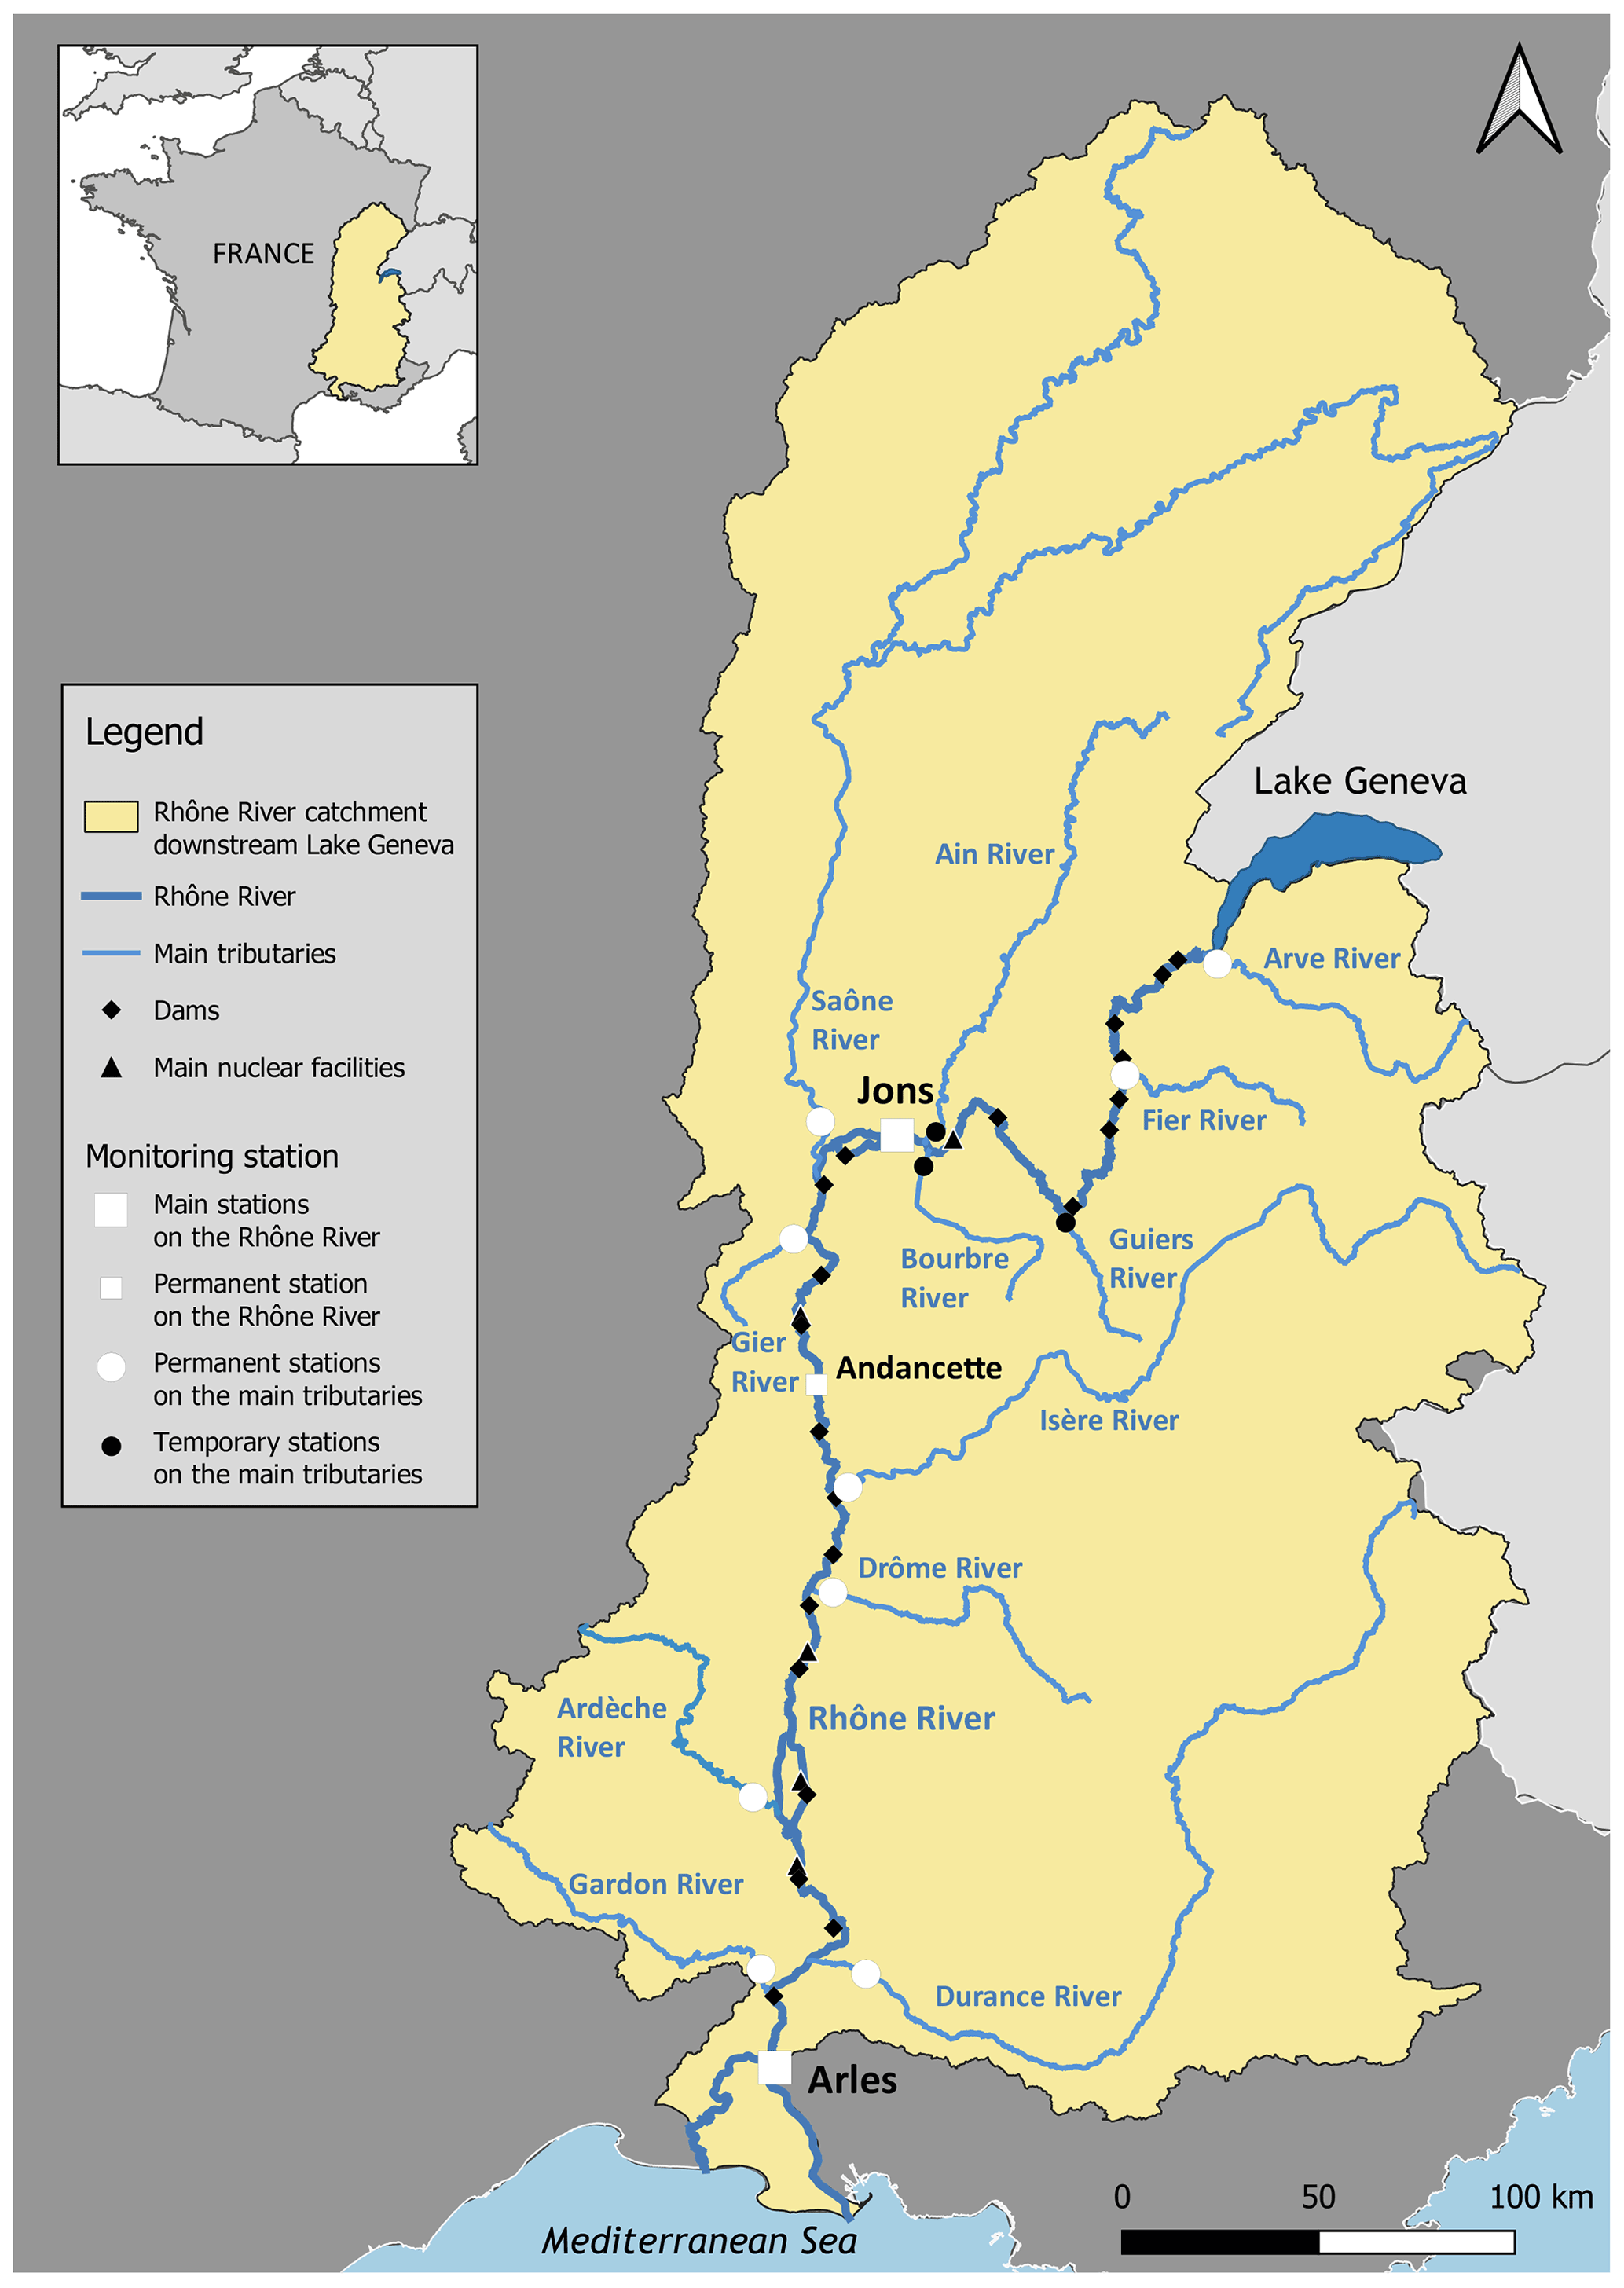
Figure 3Location of the OSR monitoring stations along the Rhône River and at the outlets of the main tributaries, from Lake Geneva to the Mediterranean Sea.
Table 2Location of the sampling stations on the Rhône River (from upstream to downstream): CNR (Compagnie Nationale du Rhône), DREAL (Direction Régionale de l'Environnement, de l'Aménagement et du Logement), INRAE (Institut National de Recherche pour l'Agriculture, l'alimentation et l'Environnement), MIO (Mediterranean Institute of Oceanology), VNF (Voies Navigables de France).
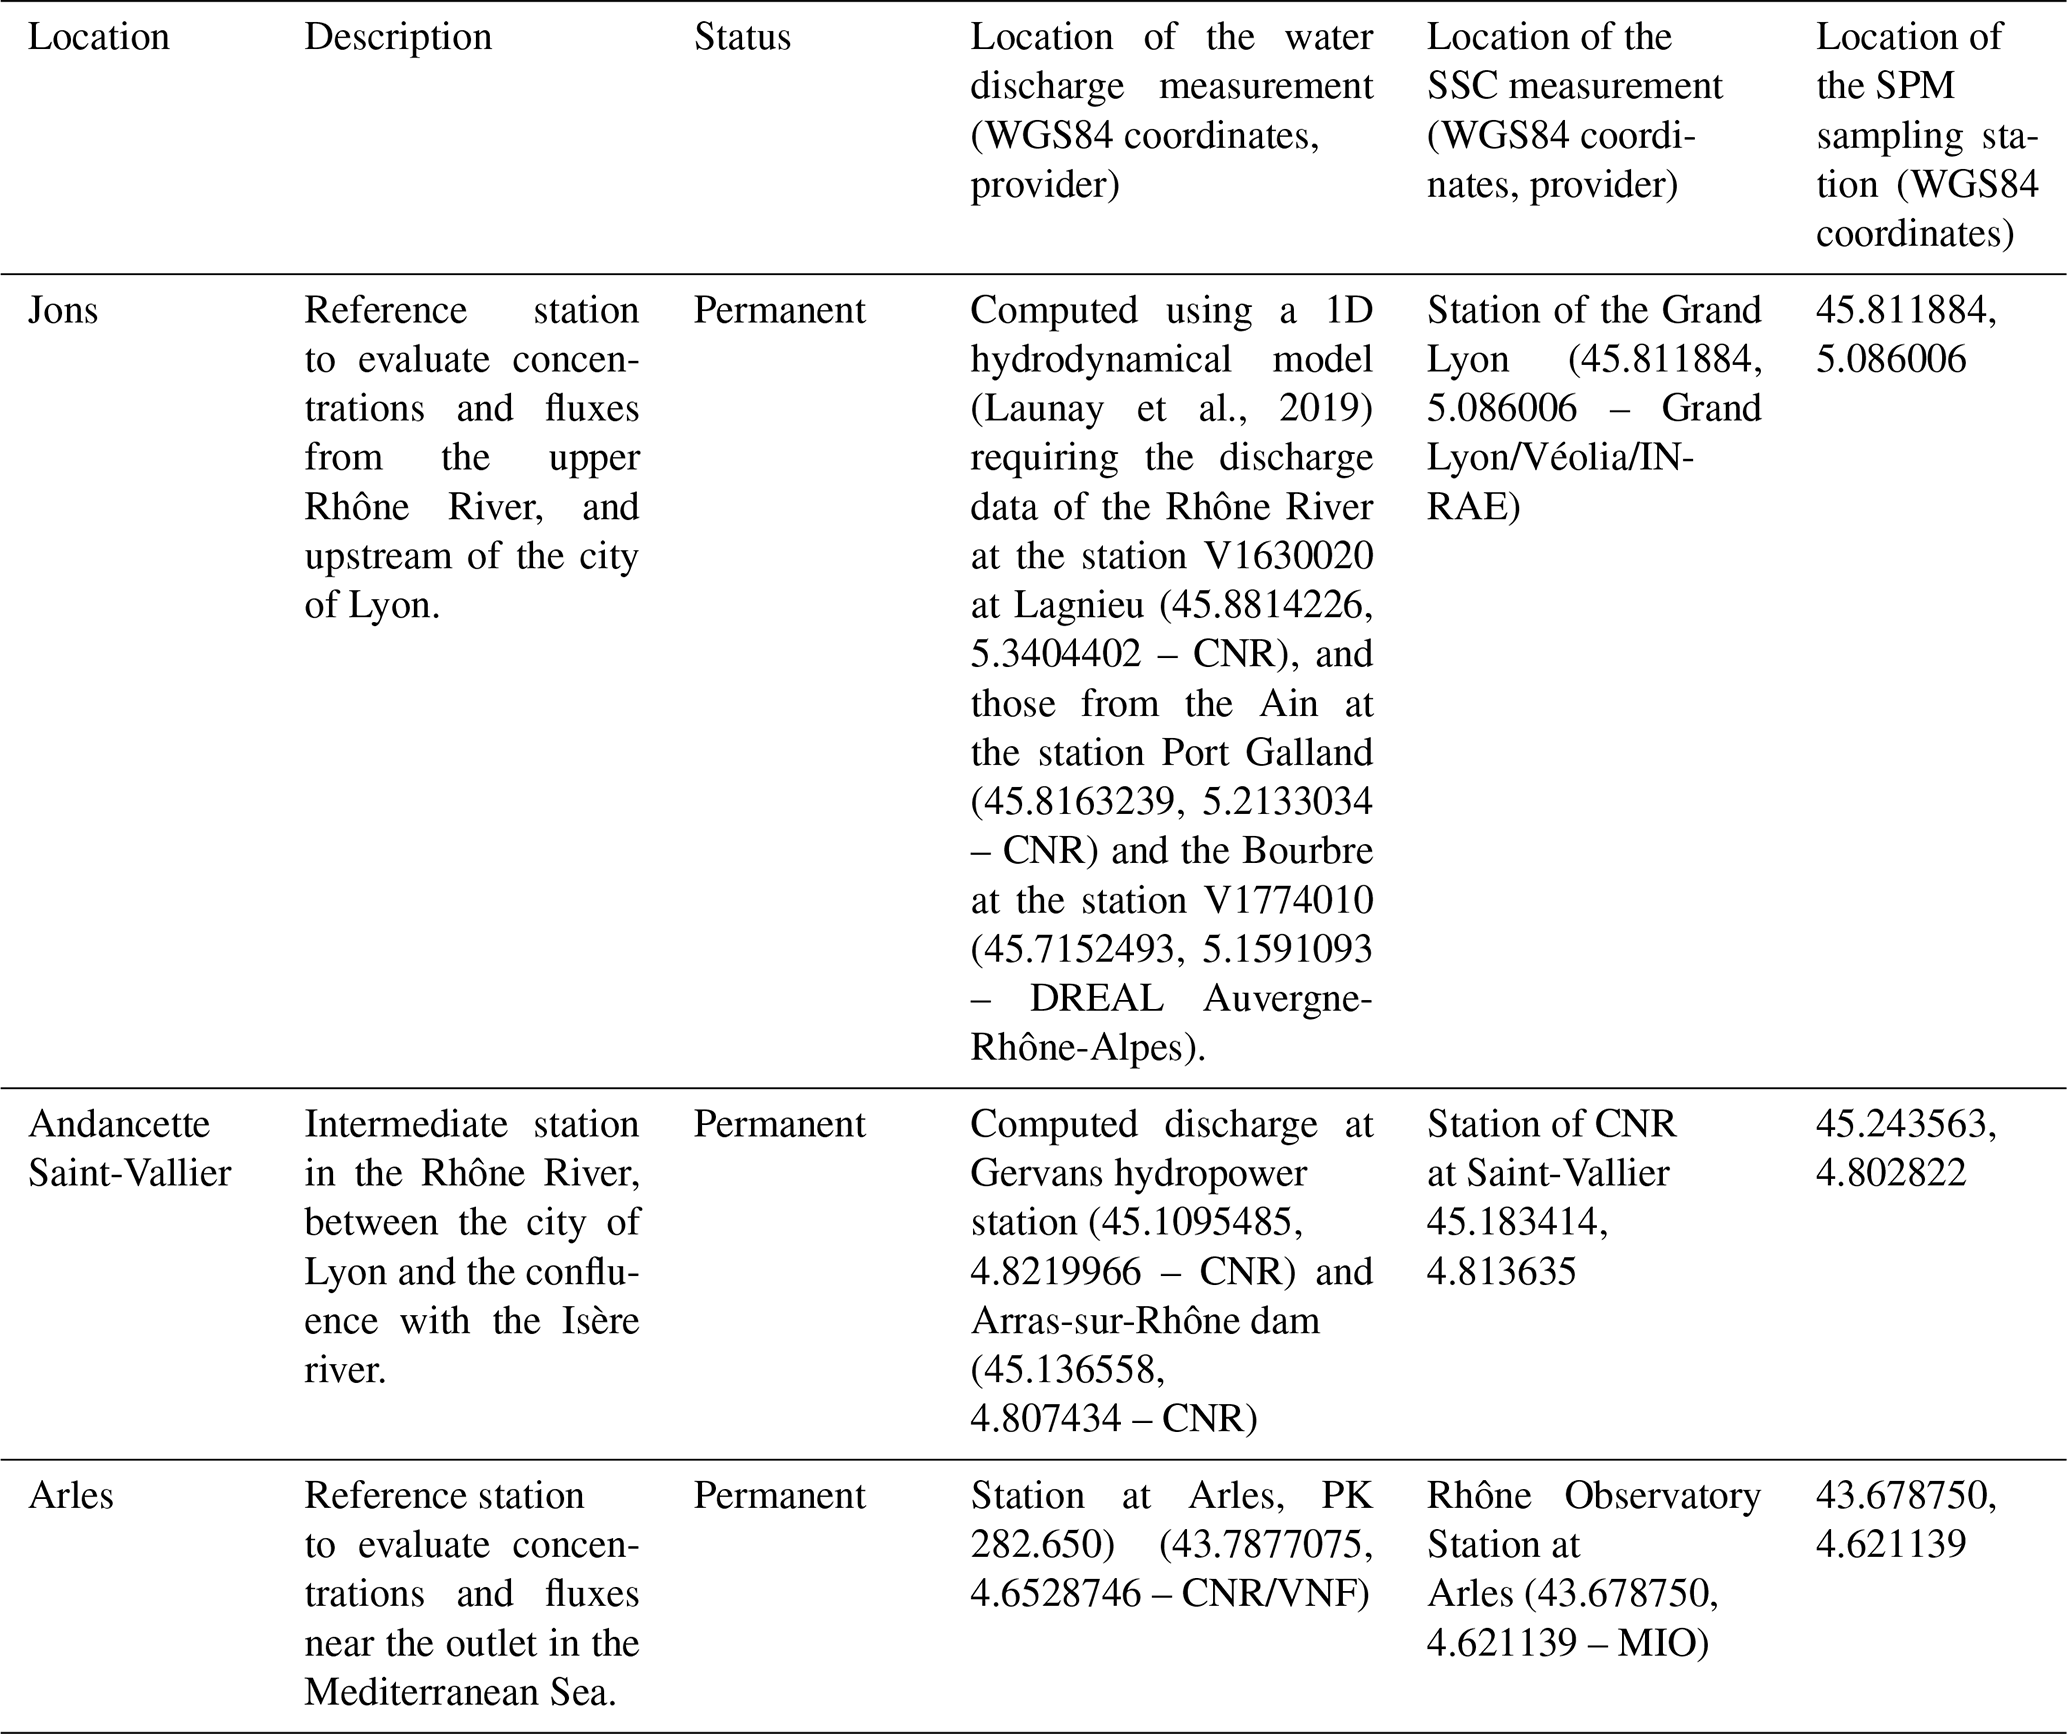
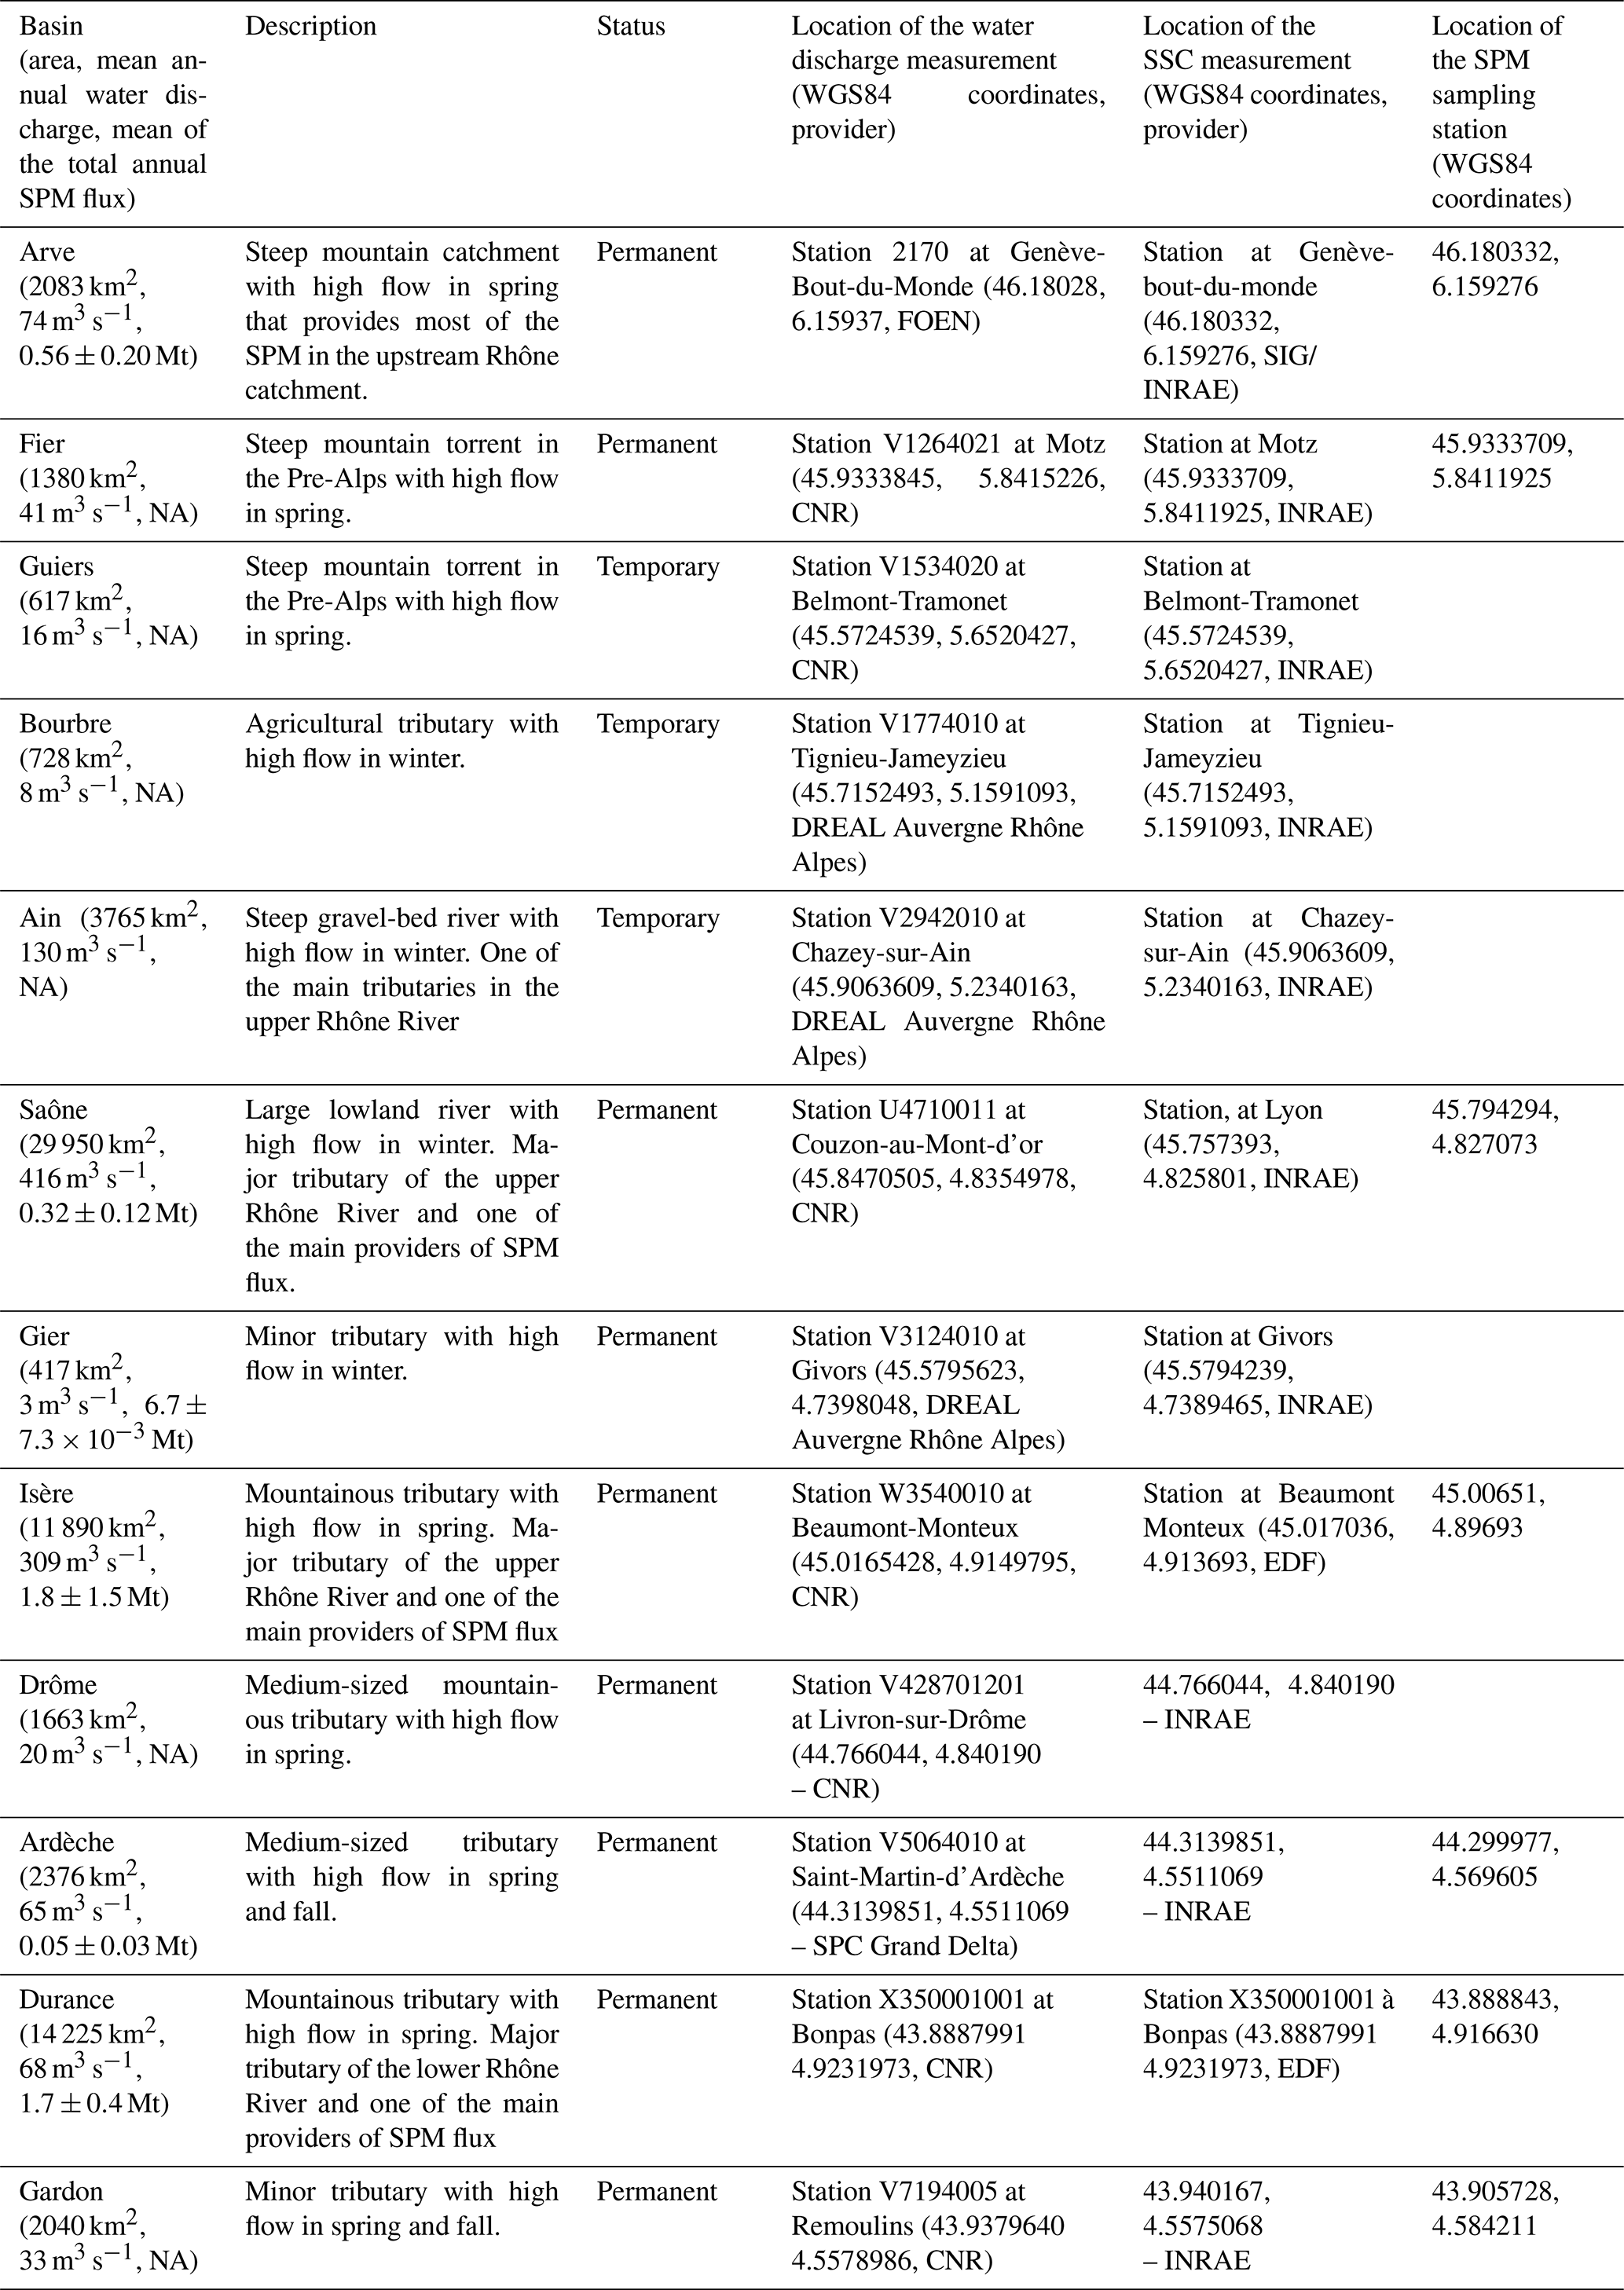
Table 3Description of the monitored tributaries and location of the sampling stations: CNR (Compagnie Nationale du Rhône), DREAL (Direction Régionale de l'Environnement, de l'Aménagement et du Logement), EDF (Electricité de France), INRAE (Institut National de Recherche pour l'Agriculture, l'alimentation et l'Environnement), MIO (Mediterranean Institute of Oceanology), FOEN (Swiss Federal Office for the Environment), SIG (Services Industriels de Genève). NA means not available.
3.2 Suspended Solid Concentration (mg L−1)
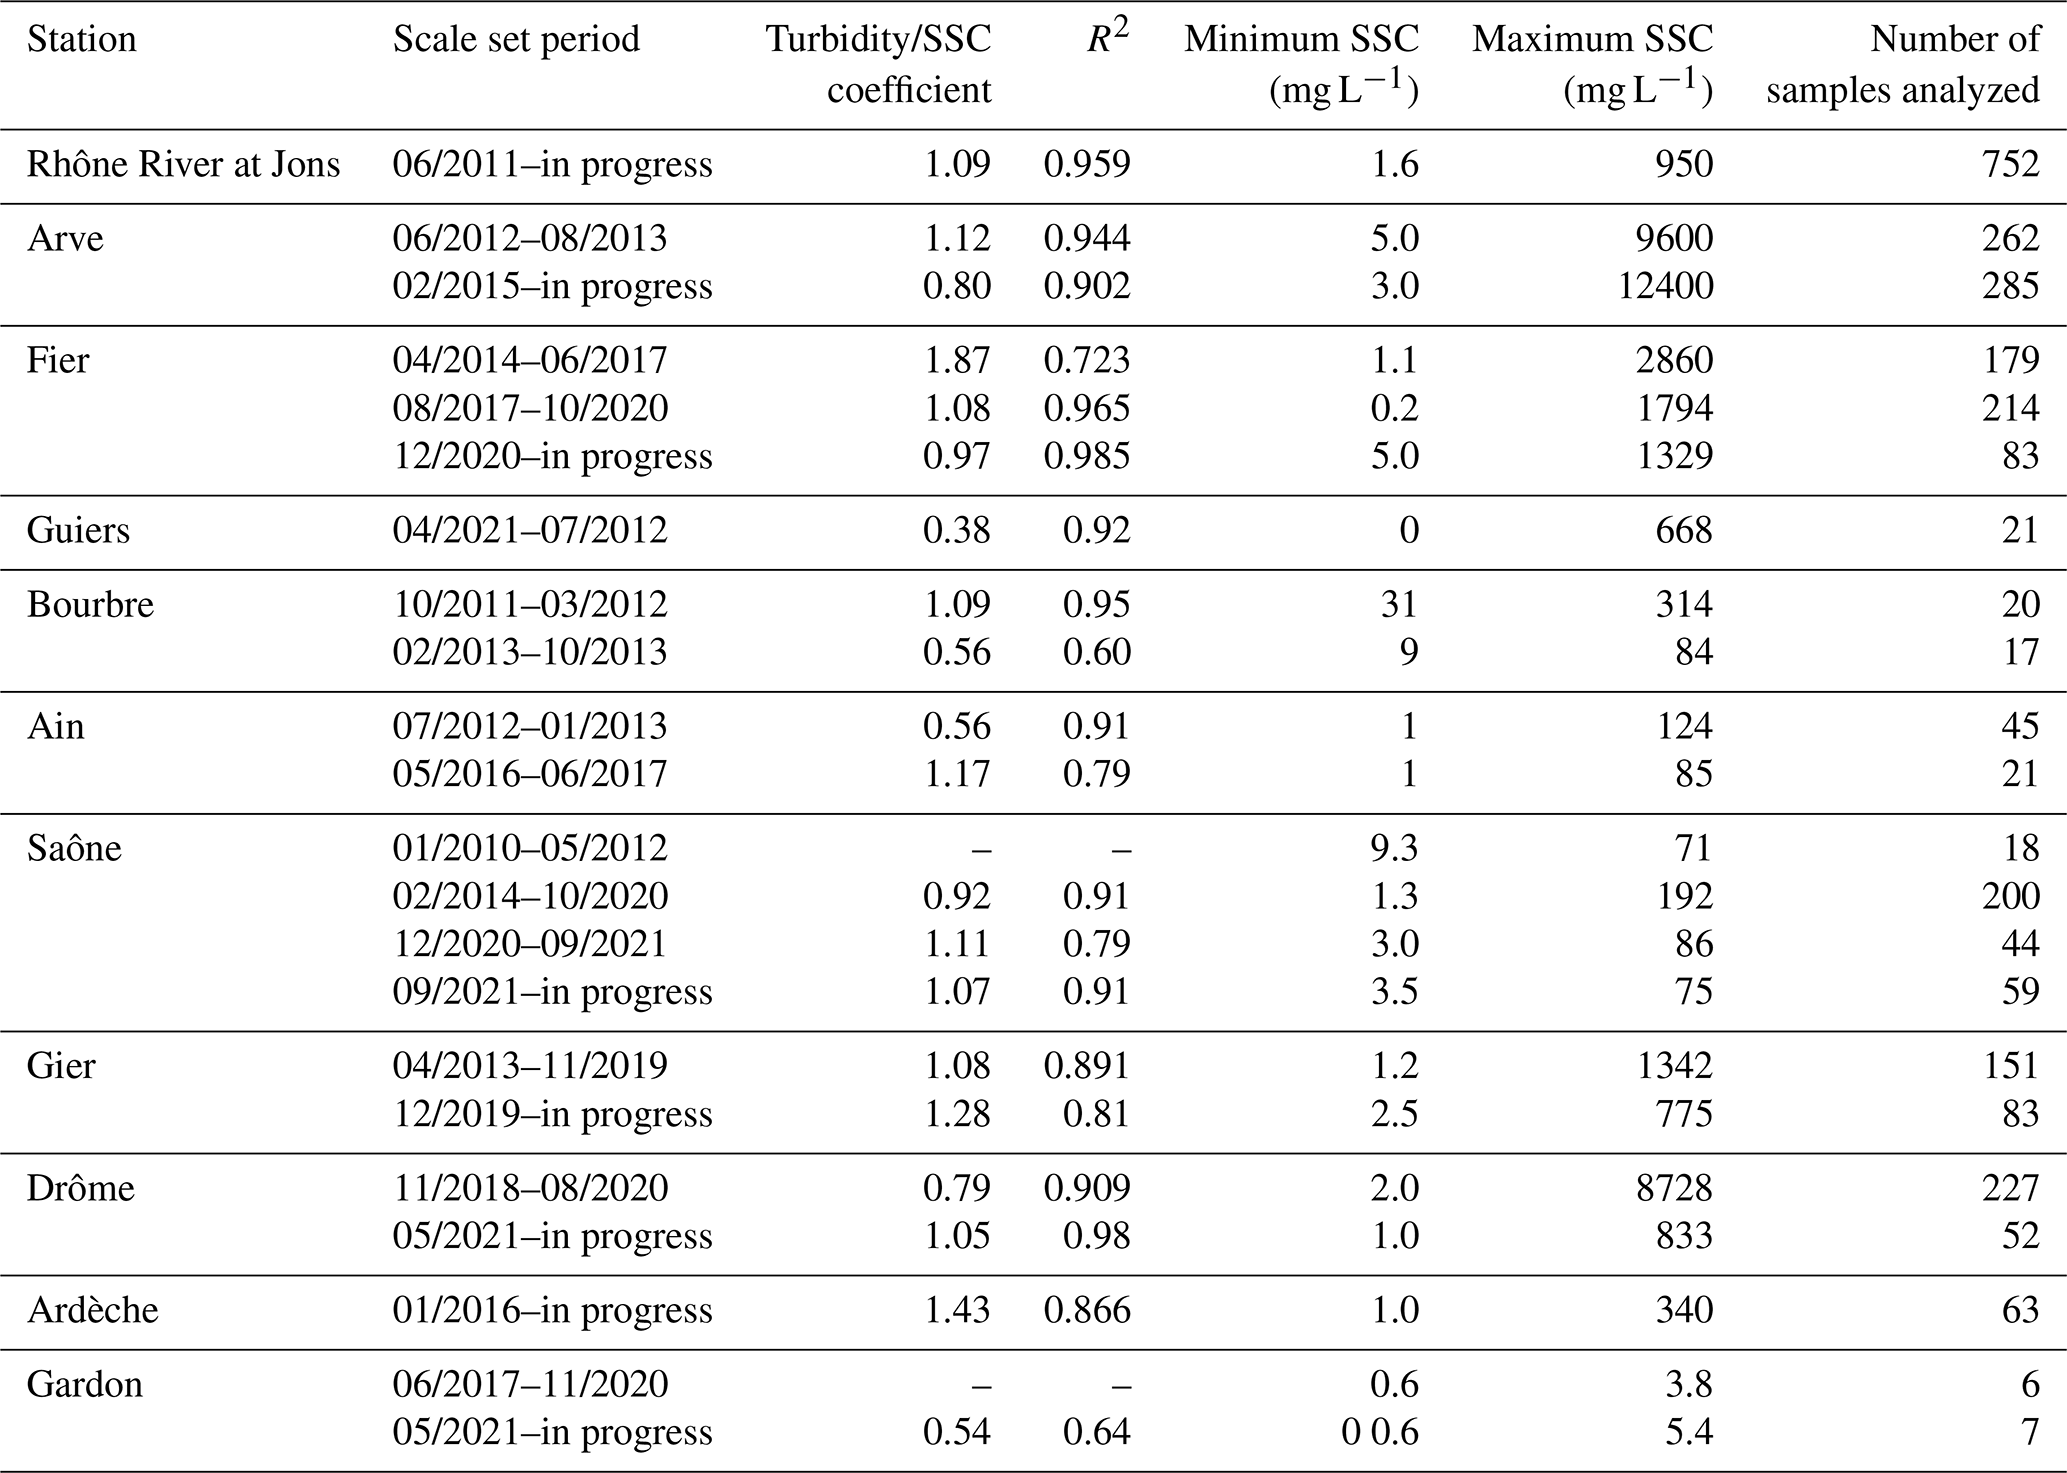
The SSC at most stations are derived from in situ turbidity measurements conducted every 10 min (Le Bescond et al., 2018). Universal Controller SC100 or SC200 (HachLange, Germany) are used in addition to numerical Solitax SC optical turbidity probes (Fig. 4a), all equipped with a mechanical cleaning system (wiper). Sensors use the infrared scattered light method with the optical response being dependent on sediment characteristics in the water. The turbidimeter is usually immersed at a fixed position along the riverbank near the station, avoiding dead zones or effluents so that the measured turbidity is representative of the average turbidity throughout the river cross-section. Exceptions: at Jons, river water is pumped and circulated to an indoor turbidimeter and at Arles there is no turbidimeter. The SSC is then calculated through the site-specific turbidity-SPM rating curve (Navratil et al., 2011), which is determined at each site for a wide range of concentrations (Table 4). The curves are established using water samples collected manually or by automatic samplers (Fig. 4b) triggered hourly during flood events. Water samples are collected regularly to ensure there is no change in the relationship between turbidity and SPM. A new turbidity-SPM rating curve is systematically built when a turbidity probe is replaced. For the Isère, the Durance and the Andancette stations, the conversion is computed by the external provider (Tables 2 and 3). In order to determine SPM values from these samples, they are filtered through preweighed glass fiber filters, dried (105 ∘C during 2 h) and weighted according to the standard method NF EN 872 (AFNOR, 2005). Relative uncertainty on SPM concentrations is estimated to be 9 % (at 95 % uncertainty level, coverage factor k=2).
At Arles, near the outlet of the Rhône River to the Mediterranean Sea, SSC are measured by the Mediterranean Ocean Observing System for the Environment (MOOSE) network with sampling conducted in the SORA monitoring station (Raimbault et al., 2014). Water intake is located on a floatable structure at a distance of 7 m from the bank and 0.5 m under the surface. Sampling for SSC is achieved using a cooled automatic water sampler that fills a daily bottle with 150 mL every 90 min to constitute a daily composite sample (Eyrolle et al., 2010). During flood events (water discharge greater than 3000 m3 s−1), 150 mL samples are collected every 30 min to constitute a composite sample every 4 h. Samples are poisoned with HgCl2 and kept at 5 ∘C until they are filtered on GF/C Whatman preconditioned glass fiber filters (dried at 500 ∘C for 4 h). The filtered volumes are adapted to the charge of SPM.

Figure 4Devices used for SSC measurement and SPM sampling. (A) Hach Lange Solitax SC turbidity probes equipped with a wiper, (B) automatic sampler (ISCO, Teledyne ISCO, Lincoln, USA) used for the calibration of turbidity stations, (C) particle trap, and (D) continuous flow centrifuge at Jons station.
3.3 Sampling of SPM for analysis
The SPM used to measure POC, PSD and contaminant concentrations are mainly collected using particle traps (PT, Fig. 4c), while continuous flow centrifuges (CFC, Fig. 4d) are used to monitor specific events, such as fast flood events. The PT are rectangular stainless-steel boxes, where the internal flow circulates in two distinct parts separated by plates (Schulze et al., 2007; Masson et al., 2018). Such integrated sampling allows the collect of sufficient amounts of SPM for contaminants analysis. The PT are immersed near the riverbank (Fig. 4c) avoiding dead zones or effluents so that the sampled material is representative of the river fine suspension throughout the cross-section. For Andancette and the Saône River monitoring stations, the PT are suspended from a chain and kept immersed at a depth of 0.5–1 m while at the other stations the PT are attached to the riverbed at an average depth of 0.5 m. At Arles, the PT and CFC are located inside the SORA monitoring station (Eyrolle et al., 2010) and supplied by a pipe. These devices allow fluctuations of the SPM flux to be taken into account (Le Bescond et al., 2018; Delile et al., 2020). The PT is generally collected every month but can be collected at shorter time intervals in order to monitor specific events such as a flood or dam regulation. Unfortunately, PT were sometimes not recovered due to logistic constraints including high level of water and vandalism. The measurements conducted on PT samples are considered as time-averaged over its sampling period. The purpose of the PT is to obtain an integrative response over a period, which does not allow for the assessment of variation that may occur within that sampling period.
In addition, SPM samples for contaminants analysis are occasionally collected using a high speed CFC (Masson et al., 2018), especially for the TME at Arles and at Jons. The duration of pumping can be regulated from 10 min to 8 h in order to collect sufficient amounts of SPM. No significant differences in Hg and PCB concentrations were found in samples collected by the two methods although particles in PT are slightly coarser than particles collected using CFC (Masson et al., 2018). The analyses are carried out on the total samples without separation of the organic part because it is negligible in the samples (see the POC measurements). Prior to chemical analysis, SPM collected with the two sampling techniques are transferred to clean brown glass bottles (250 mL) and used to transfer the SPM. Prior to chemical analysis, samples were deep-frozen (−18 ∘C) and freeze-dried before being homogenized in an agate mortar and stored in the dark at ambient temperature.
In addition, excess SPM samples are stored in a chamber at −80 ∘C. This allows analyses to be carried out at a later date, according to the needs and the development of new analytical techniques, without aging of the samples. More than 1300 samples are currently stored this way. Meta-data and location of the samples inside the chamber are saved within the software Collec-Science (Quinton et al., 2020).
3.4 Physicochemical analyses
All the physicochemical analysis information is briefly recalled during visualization and in an additional file (Report.txt) when downloading the data.
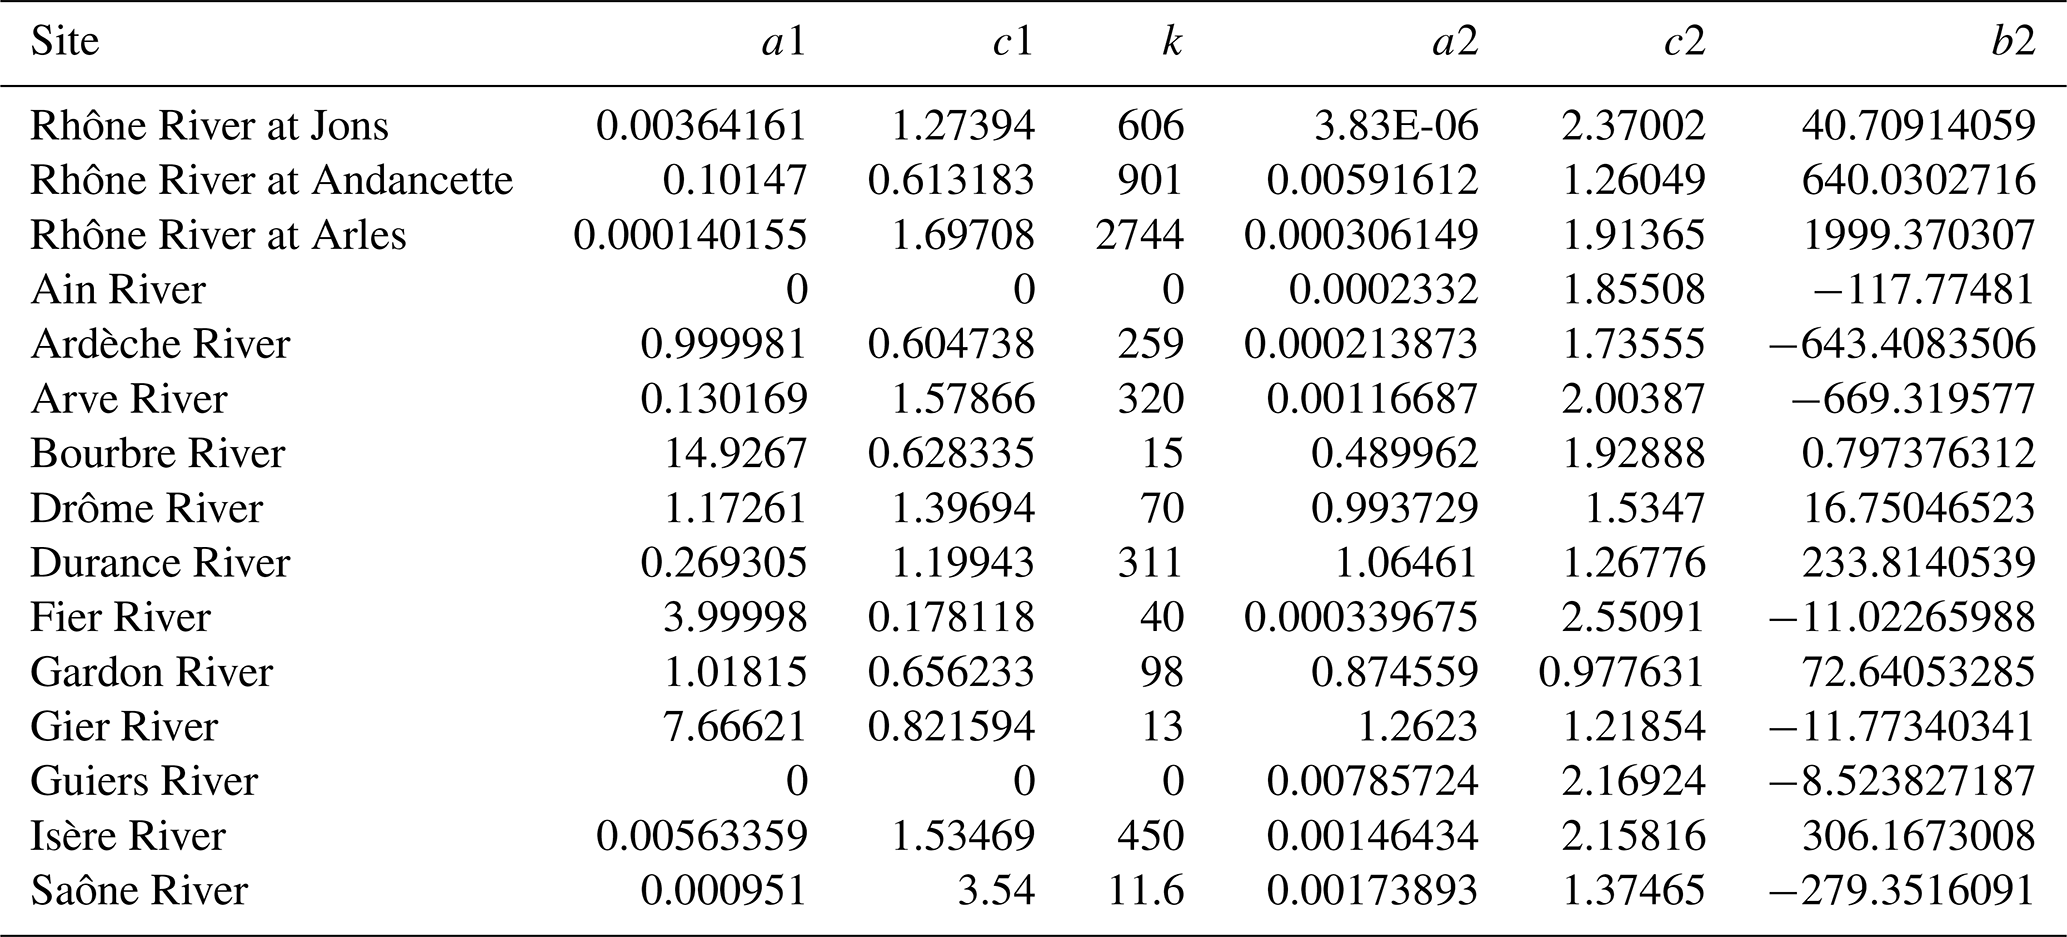
Table 5Parameters of the discharge-SSC relations (Eq. 1) for all the OSR monitoring stations.
3.4.1 Particle size distribution (PSD)
The PSD is measured by laser diffraction with a Cilas 1190 particle size analyzer (Cilas SA, Orléans, France). The volumetric particle size distribution of SPM (measuring range: 0.04–2500 µm) was assessed by INRAE-RiverLy Aquatic chemistry laboratory (AFNOR, 2009). During measurement (obscuration rate typically 15 %), mechanical agitation in the tank (at 350 rpm) and circulation with a peristaltic pump (at 120 rpm) were used in order to homogenize the sample. A refractive index in the range of kaolinite was used for the solid phase (RI =1.55). Ultrasound was used during dispersion and during measurement in order to avoid particle aggregation (20 s at 38 kHz). The PSD was also measured without ultrasound for comparison. The volumetric PSD of the sample was computed using the Fraunhöfer optical model. A quality control sample (made by INRAE) was systematically used to control the device.
Before 2018, the PSD of Ardèche, Durance, Gardon and Arles stations were measured without ultrasound by a Beckman Coulter LS 13 320 (Beckman Coulter, Fullerton, CA, USA) at the CEREGE laboratory. Prior to measurement with this device (measuring range: 0.04–2000 µm), the organic component of the water sample was oxidized using a solution of 30 % hydrogen peroxide (H2O2) at 200 ∘C. The remaining fraction was then resuspended in a 0.3 % hexametaphosphate solution and sub-sampled under stirring (800 rpm) to match the optimal obscuration windows of the laser and of the light polarization system, between 8 % and 16 % and between 50 % and 70 %, respectively. The volumetric particle size calculation model was performed in accordance with the Fraunhöfer and Mie theory. A refractive index in the range of kaolinite was used for the solid phase (RI =1.56). Each sample was analyzed 6 times (90 s each) with water circulation at 80 % and the result finally recorded is an average of the 5 last runs, because some air bubbles sometimes alter the first run just after the rinsing phase. Sample size reproducibility based on independent replicate measurements of the same sample did not exceed 2 % residual (Psomiadis et al., 2014).
The database provides information on characteristic diameters D10, D50 and D90 of the particle size distribution. Non-negligible differences between these parameters were found during an intercomparison of the two devices (Lepage et al., 2019). The comparison of the results must therefore be done with caution. Finally, the entire information on particle size distribution of each sample is stored by INRAE and CEREGE laboratories.
3.4.2 Particulate organic carbon (POC)
At Arles, POC was measured in filtered water samples within the MOOSE observatory (Raimbault et al., 2014). The SPM was collected on GF/C Whatman glass fiber filters (25 mm in diameter) precombusted at 500 ∘C during 4 h. Filters were dried at 60 ∘C and stored dried until analysis. Before analysis the filters were placed in tin capsules and acidified with sulfuric acid (0.25 N) to remove inorganic carbon, and dried at 60 ∘C. The POC measurements were performed using a high-combustion procedure (950 ∘C) on a CN Integra mass spectrometer (serCon Ltd, Crewe, UK) according to Raimbault et al. (2008). Reference materials (glycine and casein) were systematically used to control analytical uncertainty.
For all the other stations, the determination of POC before December 2014 was performed using a CHN Flash 2000 carbon analyzer (ThermoFisher-Scientific, USA) by INRAE-RiverLy Aquatic chemistry laboratory. Prior to analysis, samples were decarbonated using hydrochloric acid HCl (AFNOR, 1995). Depending on the POC concentration, the analytical uncertainty ranged between ∼3 % and ∼6 % (k=2) while the limit of quantification (LQ) was estimated to be 0.1 g kg−1. After December 2014, a different device was used (CNS Flash 2000, ThermoFisher Scientific, USA) following manufacturer recommendations and the above method. Analytical accuracy (93 %) and uncertainty (8 %; k=2) were controlled using a reference material (AGLAE, 15 M9.1; 40 g kg−1) and the LQ was estimated to be 0.5 g kg−1.
3.4.3 Trace metal elements (TME)
The following TME were measured at the LA-ICP-MS platform for elemental chemistry of CEREGE: Cd, Co, Cr, Cu, Ni, Pb, Zn and As (Delile et al., 2020). All laboratory materials used were acid-cleaned and all reagents were ultrapure grade compounds. Samples of 40 mg dry SPM were dissolved in a mixture of 4 mL HNO3 (67 %), 20 drops of H2O2 (35 %), 3 mL of HCl (34 %), and 0.5 mL of HF (47 %–51 %) before being digested in an UltraWAVE Single Reaction Chamber (Milestone, Sorisole, Italy) at 170 ∘C (10 min) and 250 ∘C (10 min; P=100 bar). The complete breakdown of the SPM samples was verified by the absence of residues. Measures were conducted by ICP-MS (Nexlon 300X, PerkinElmer, USA) after dilution of the samples with ultrapure Milli-Q water (Merck). Calibration curves and rhodium solution were used as internal standard while reference sediments PTSD-3 and MESS-4 (Canadian Certified Reference Materials Project) were analyzed repeatedly. The relative uncertainties were 6.7 %, 14 %, 3.6 %, 1.2 %, 5.0 %, 2.3 %, 3.2 %, 3.0 %for As, Cd, Co, Cr, Cu, Ni, Pb and Zn, respectively, while the LQs were 0.5, 0.1, 0.05, 0.1, 0.1, 1, 1, 5 mg kg−1, respectively.
The determination of total Hg in SPM was performed by INRAE-RiverLy Aquatic chemistry laboratory (Delile et al., 2020) using an automated atomic absorption spectrophotometer DMA 80 (Milestone, Sorisole, Italy), following the EPA method 7473 (US EPA, 2007) and Aquaref MA02 method (Cossa et al., 2013). Blanks were systematically checked to verify the absence of contamination during analyses. Analytical uncertainty (16 %; k=2) and accuracy (94 %) were systematically controlled using reference materials (IAEA 457, coastal sediment; IAEA 458, marine sediment) and the LQ was 10 µg kg−1.
3.4.4 Polychlorinated biphenyl (PCB)
The concentrations of 7 indicator PCBi were analyzed by INRAE-RiverLy Aquatic chemistry laboratory as described in Delile et al. (2020): congeners 28, 52, 101, 118, 138, 153, and 180. A 1.0 g dry weight of SPM was extracted with a mixture of cyclohexane and acetone 90:10 then concentrated by evaporation and purified on a 1 g Florisil SPE cartridge.
To avoid sulfur interference, a small amount of copper powder (10 mg mL−1) was added prior to gas chromatography analysis with a 63Ni electron capture detector (GC-ECD). Two columns were used to analyze the samples (RTX®-5 and RTX®-PCB) and the accuracy was checked via the analysis of a certified reference material (BCR 536) and intercomparison exercises. The LQs were estimated between 0.5 and 1 mg kg−1 depending on the congeners while the analytical uncertainties was determine using a sediment sample from the Bourbre River as no certified reference material exists for such low levels of PCBi in equivalent matrix. Analytical uncertainties were estimated to be 60 % (k=2) for concentrations lower than 3 times the LQ, and to be 30 % (k=2) for concentrations higher than 3 times the LQ.
3.4.5 Radionuclides (cesium-137, organically bound tritium and radiocarbon)
For 137Cs activity, the SPM samples were ashed and put into tightly closed plastic boxes (17 or 60 mL) for gamma-ray spectrometry measurements (20–60 g) using low-background and high-resolution high-purity germanium detectors at the IRSN/LMRE laboratory (Eyrolle et al., 2020). These measurements were performed under 17 025 accreditation as the laboratory participates each year in proficiency tests organized mainly by the Analytical Laboratories for the Measurement of Environmental Radioactivity (ALMERA network) of the IAEA. Each sample was measured for 3 d to achieve detection limits around 0.5 Bq kg−1 dry weight for 137Cs, after waiting for 30 d for the radioactive equilibrium of the Ra-226 progeny. Efficiency calibrations were constructed using gamma-ray standard sources in a 1.15 g cm3 density solid resin–water equivalent matrix. Activity results were corrected for true coincidence summing (TCS) and self-attenuation effects (Lefèvre et al., 2003). Measured activities, expressed in Bq kg−1 (dry weight), are decay-corrected to the date of sampling. The activity uncertainty (k=2) was estimated as the combination of calibration uncertainties, counting statistics, and summing and self-absorption correction uncertainties.
Organically bound tritium (OBT in Bq kg−1 dry weight) analysis was performed at the IRSN/LMRE laboratory by the Helium-3 (3He ingrowth method, Cossonnet et al., 2009). The samples were put under vacuum (10−6 mbar) and stored for up to 4 months prior to analysis. The 3He 4He ratio was measured by mass spectrometry after correction of the radiogenic 4He levels contained in the sample (gaseous inclusions) and normalization of the values to ambient atmospheric levels (3He 4He).
Radiocarbon (14C) contents was analyzed by the IRSN/LMRE laboratory using an accelerator mass spectrometer (LMC14 laboratory, Saclay, France). Prior to analyzing the organic part of the sample, carbonates were eliminated by washing the sample (0.5 MHCl, 0.1 MNaOH) and drying it under vacuum as describe in Eyrolle et al. (2018). Decarbonated samples were then sealed in quartz tubes under a vacuum with an excess of CuO and silver wire. Organic carbon was converted into CO2 by introducing the tubes into a furnace at 835 ∘C for 5 h and then released, dried, measured, and collected after breaking the tube under a vacuum. The graphite target is obtained with a direct catalytic reduction of the CO2, using iron powder as a catalyst (Merck® for analysis reduced, 10 µm particles). The reduction reaction occurs at 600 ∘C with excess H2 (H2 CO2 =2.5) and is complete after 4–5 h. The iron-carbon powder is pressed into a flat pellet and stored under pure argon in a sealed tube. All quartz and glass dishes are burned for at least 5 h at 450 ∘C to reduce contamination. To evacuate the vacuum lines, a turbomolecular pump reaching 10−6 mbar is used. Measurements are performed using a 3 MV NEC Pelletron Accelerator coupled with a spectrometer dedicated to radiocarbon dating, measuring 12C, 13C and 14C contents and counting the 14C ions by isobaric discrimination. Analysis require 1–100 mg of dry sample (to obtain 1 mg of carbon). The specific 14C activity is expressed as Becquerel of 14C per kilogram of total organic carbon (Bq kg−1 of C). The detection limit is 0.8 Bq kg−1 of C and the uncertainty is 0.1 % for modern samples (k=2).

Figure 5Transformation step applied to a discontinuous time series for flux calculation. PT particle trap, CFC continuous flow centrifuge.
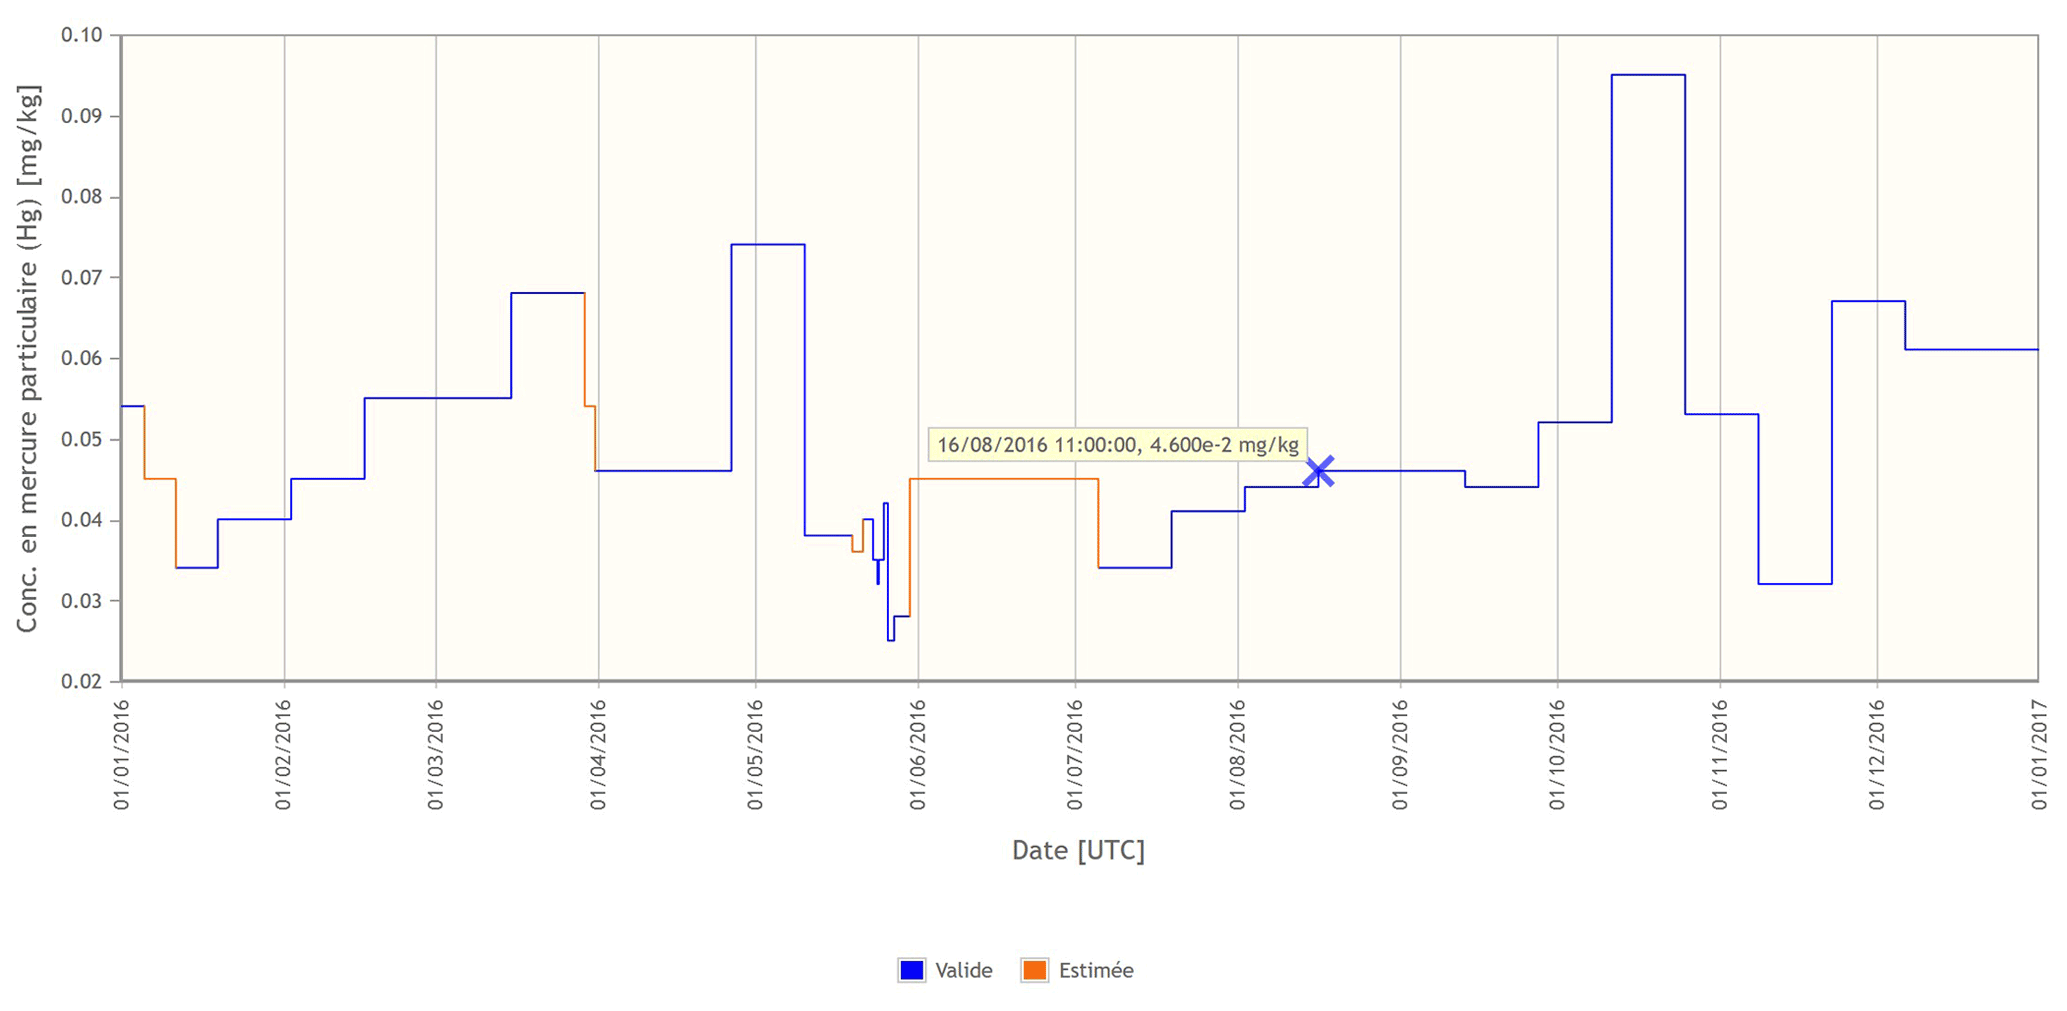
Figure 6BDOH OSR database screenshot of the continuous time series with estimated concentration (orange) of Hg concentration at Jons in samples collected by particle trap.
3.5 Data completion and flux calculation
The SPM fluxes are the product of water discharge and SSC, and contaminant fluxes are the product of the SPM fluxes and the contaminant concentrations (Fig. 1). At most stations, water discharge is provided by a collocated or neighboring hydrometric station. Most often, water levels are measured using pressure sensors, pneumatic probes (bubblers) or radar gauges, and the stage records are converted to discharge using a stage-discharge rating curve (Le Coz et al., 2014; Kiang et al., 2018), or a stage-fall-discharge rating curve (Mansanarez et al., 2016) for stations affected by variable backwater upstream of a dam. Hourly averaged water discharge data are generally calculated by conversion of water level measurements through stage-discharge rating curves, otherwise through numerical modelling. At Jons, the closest hydrometric station is relatively far upstream, and two tributaries bring significant amounts of water between the hydrometric and the turbidity station. Therefore, a 1-D hydrodynamic model (Dugué et al., 2015; Launay et al., 2019) is used to compute the discharge time series at Jons from the three discharge times series measured upstream on the Rhône River (at Lagnieu) and on the two tributaries (Ain and Bourbre Rivers).
Prior to calculating these fluxes, completion of missing values (gaps in the measurement or non-monitored periods) and time step transformation are required.
3.5.1 Completion of missing values of SSC
Missing SSC values are estimated using the empirical relations between water discharge (Q in m3 s−1), and SSC (Cs in mg L−1) also known as sediment rating curves (Horowitz, 2003; Sadaoui et al., 2016). The Q-SSC relations (Eq. 1) were improved by considering a low to moderate water discharge segment (a1 and c1) and a high water discharge segment (a2, b2 and c2) Sadaoui et al., 2016):
The BaRatin method and the BaRatinAGE software (Le Coz et al., 2014) were used to fit the regressions and detects the breakpoints (k in m3 s−1), above which the regression coefficients significantly change. Discharge-SPM rating curves are too uncertain to allow the detection of potential temporal changes. We therefore assume that they are constant over the monitoring period. Estimated parameters of Eq. (1) are listed by station in Table 5 according to Poulier et al. (2019) and updated in 2021 with new data. Estimated values take the code “e” (Table 1).
3.5.2 Completion of missing values of contaminants
For PT, missing values are considered when two successive samplings are not continuous (i.e., the starting date of a sampling is later than the ending date of the previous sampling). Prior to estimating missing values for PT samplings and when the samplings are successive, discontinuous time series are transformed to continuous time series by linear interpolation (Figs. 5 and 6). Missing values were replaced by the median value of the contaminant concentration depending on the hydrological conditions (baseflow or flood) during the integrated sampling period as described in Delile et al. (2020) (Fig. 5). In brief, samples were considered as taken in flood when more than 50 % of the SPM cumulative flux occurred while the water discharge was higher than the flood threshold (defined as half of the 2-year flood peak discharge). For gap periods greater than the usual time period of sampling (28 d), the gap periods were split into two to avoid gap periods greater than 1.5 times this usual sampling period.
For CFC, missing values are considered when the period between two samplings is longer than the usual time period of sampling. For gaps shorter than the usual sampling period, discontinuous time series are transformed to continuous time series by considering the concentration of the last sample until the half of the gap period, while the other half was filled with the next sample concentration (Fig. 5). As with PT, median values for hydrological conditions were calculated to estimate the missing values (Fig. 5). The hydrological condition of a sample was considered as flood if the mean daily water discharge value was higher than the flood threshold. For gaps longer than the usual sampling period, the same rule as for PT was applied.
For both methods, values lower than the LQ were replaced by this LQ divided by 2. Estimated values take the code “e” (Table 1).
3.5.3 Time step transformation
After their completion, the time series are set to the same time step by linear interpolation to the nearest second between two points, so as not to lose any information. For samples collected by PT, the concentration measured is considered as a mean of its sampling period. The SPM (g s−1) and contaminant fluxes (g s−1 or Bq s−1) calculation is then carried out following Eqs. (2) and (3), respectively. The lowest quality code of both values used is kept by respecting the following ranking: v > a > d > e.
with Q in m3 s−1 and CMES in g L−1.
with CX the concentration of the contaminant X in µg kg−1, mg kg−1, g kg−1 or Bq kg−1.
With the data acquired by this network it was possible to improve the calculation of the SPM and associated contaminant fluxes near the outlet of the Rhône River, and also to evaluate the fluxes coming from the upper Rhône River and the tributaries (Poulier et al., 2019; Delile et al., 2020). It was estimated that on average 6.6 Mt of SPM transited each year in the Rhône River at Beaucaire, with strong variation ranging from 1.4 to 18.0 Mt yr−1. The Durance and Isère tributaries were found to be the main contributors to SPM fluxes.
Through this long-term continuous monitoring and its spatial resolution with sampling on the main tributaries, seasonal variations in several contaminant concentrations have recently been highlighted (Delile et al., 2020) as well as the impact of dam flushing operations (Lepage et al., 2020). Nearly two thirds of the annual contaminant fluxes are released into the Mediterranean Sea during three short term periods over the year: 24 % during a Mediterranean component in November, 15 % during oceanic rainfall component in January and 24 % during nival component in May–June. During flushing operations recorded from 2011 to 2016, the mean SPM concentrations were 6–8 times higher than during flood events at equal water discharge (Lepage et al., 2020).
At the Jons station, an original fingerprinting method was conducted based on the TME residual fraction in SPM (Dabrin et al., 2021). This approach demonstrated that under base flow conditions and during dam flushing operations, SPM originated mainly from the Arve River, while the origin was more heterogeneous during flood events.
Finally, within the OSR and using this database, a 1-D hydrodynamic model of SPM dynamics was developed (Launay et al., 2019). This model simulated the concentration of SPM at Arles during a flood event occurring in the Isère and the Durance tributaries. This model was also applied by Dabrin et al. (2021) for the fingerprinting approach and the combination of these two approaches demonstrated that a large portion of SPM from the Arve River was old sediment stored behind the Verbois dam and resuspended during the dam flushing operation.
All the data are made publicly available in French and English through the BDOH OSR database (https://doi.org/10.17180/OBS.OSR, Thollet et al., 2021) at https://doi.org/10.15454/RJCQZ7 (Lepage et al., 2021). The Base de Données pour les Observatoires en Hydrologie (BDOH) application is managed by INRAE. The data are freely available for visualization, and for download after registration of a personal account.
The database presented in this paper will be continuously updated in the coming years, at least until the end of the current OSR program (2021–2024). Discharge, SSC, and particulate contaminants are continuously measured at the permanent stations and data are regularly updated online. The following improvements are planned:
-
Uncertainties on the SPM and contaminants fluxes will be calculated and published;
-
Other TME and new contaminants such as gadolinium will be included in the dataset depending on the authorities' concern and scientific purpose. These contaminants might also be analyzed on the SPM samples already collected and stored in the chamber at −80 ∘C;
-
Additional parameters to describe the particle size distribution will be added, such as the percentage of clay, silt, sand;
-
Link between the different contaminants measured on the same SPM sample will be added as a common sample name;
-
Values lower than LQ or LD will be replaced by a more precise statistical method when feasible.
HL, AG, FT, JLC, MC, OR and JPA conceptualized the study; HL, AG, FT and DD curated the data; HL, AG, FT, JLC, MC, MM, AD and OR performed the formal analysis; HL, JLC, MC, AD, OR, JL, JPA and PR acquired the funds; HL, AG, FT, JLC, MM and DD developed the methodology; HL, AG and FT performed the visualization; all authors contributed to the original draft of the paper.
The contact author has declared that neither they nor their co-authors have any competing interests.
Publisher's note: Copernicus Publications remains neutral with regard to jurisdictional claims in published maps and institutional affiliations.
This study was conducted within the Rhône Sediment Observatory, a multipartner research program funded through the Plan Rhône by the European Regional Development Fund (ERDF), Agence de l'eau RMC, CNR, EDF, and three regional councils (Auvergne-Rhône-Alpes, Région Sud – PACA, and Occitanie). The authors would like to thank the OSR staff for suspended particulate matter sampling and analytical measurements: Hélène Angot, Josselin Panay, Chloé Le Bescond, Mickaël Lagouy, Ghislaine Grisot, Loïc Richard, Stéphanie Gairoard, Julie-Claire Gattacceca, Geneviève Dur, Frédérique Eyrolle, Franck Giner, David Mourier, Pascal Paulat, Julien Faramond, Christelle Antonelli, Anne De vismes, Christophe Ardois, Cédric Le Corre, Adrien Bonnefoy, Michel Fornier. We are very grateful to CNR, DREAL ARA, EDF, Grand Lyon, FOEN, SIG, SPC Grand Delta, Véolia and VNF for cooperating with OSR and sharing their monitoring data. A special thanks to the ZABR and the GRAIE for their interaction with the OSR and their help with logistics.
This paper was edited by Alexander Gelfan and reviewed by two anonymous referees.
AFNOR: NF ISO 10694: Soil quality – Determination of organic and total carbon after dry combustion (elementary analysis), 7 p., 1995.
AFNOR: NF EN 872: Water quality – Determination of suspended solids – Method by filtration through glass fibre filters, 14 p., 2005.
AFNOR: NF ISO 10694: Particle Size Analysis – Laser Diffraction Methods, 51 p., 2009.
Antonelli, C., Eyrolle, F., Rolland, B., Provansal, M., and Sabatier, F.: Suspended sediment and 137Cs fluxes during the exceptional December 2003 flood in the Rhone River, southeast France, Geomorphology, 95, 350–360, https://doi.org/10.1016/j.geomorph.2007.06.007, 2008.
Armijos, E., Crave, A., Espinoza, R., Fraizy, P., Santos, A. L. M. R. D., Sampaio, F., De Oliveira, E., Santini, W., Martinez, J. M., Autin, P., Pantoja, N., Oliveira, M., and Filizola, N.: Measuring and modeling vertical gradients in suspended sediments in the Solimões/Amazon River, Hydrol. Process., 31, 654–667, https://doi.org/10.1002/hyp.11059, 2017.
Cossa, D., Coquery, M., Nakhlé, K., Claisse, D., and Grisot, G.: Mercure, Méthode d'analyse dans les sédiments, les boues et les biotes, AQUAREF, 5 p., 2013.
Cossonnet, C., Neiva Marques, A. M., and Gurriaran, R.: Experience acquired on environmental sample combustion for organically bound tritium measurement, Appl. Radiat. Isot., 67, 809–811, https://doi.org/10.1016/j.apradiso.2009.01.039, 2009.
Dabrin, A., Bégorre, C., Bretier, M., Dugué, V., Masson, M., Le Bescond, C., Le Coz, J., and Coquery, M.: Reactivity of particulate element concentrations: apportionment assessment of suspended particulate matter sources in the Upper Rhône River, France, J. Soil. Sediment., 21, 1256–1274, https://doi.org/10.1007/s11368-020-02856-0, 2021.
Delile, H., Masson, M., Miège, C., Le Coz, J., Poulier, G., Le Bescond, C., Radakovitch, O., and Coquery, M.: Hydro-climatic drivers of land-based organic and inorganic particulate micropollutant fluxes: The regime of the largest river water inflow of the Mediterranean Sea, Water Res., 185, 116067, https://doi.org/10.1016/j.watres.2020.116067, 2020.
Delmas, M., Cerdan, O., Cheviron, B., Mouchel, J. M., and Eyrolle, F.: Sediment export from French rivers to the sea, Earth Surf. Proc. Land., 37, 754–762, https://doi.org/10.1002/esp.3219, 2012.
Dugué, V., Walter, C., Andries, E., Launay, M., Le Coz, J., Camenen, B., and Faure, J. B.: Accounting for hydropower schemes' rules in the 1-D hydrodynamic modeling of the Rhône River from Lake Geneva to the Mediterranean sea, in: 36th IAHR World Congress, June–3 July, 2015, The Hague, the Netherlands, hal-02602195, 2015.
Eyrolle, F., Antonelli, C., Raimbault, P., Boullier, V., and Arnaud, M.: SORA: a high frequency flux monitoring station at the lower Rhône River, in: Proceedings of the 39th CIESM Congress, Venice, Italy, 10–14 May 2010, 2010.
Eyrolle, F., Lepage, H., Antonelli, C., Morereau, A., Cossonnet, C., Boyer, P., and Gurriaran, R.: Radionuclides in waters and suspended sediments in the Rhone River (France) – Current contents, anthropic pressures and trajectories, Sci. Total Environ., 723, 137873, https://doi.org/10.1016/j.scitotenv.2020.137873, 2020.
Eyrolle, F. F., Lepage, H., Copard, Y., Ducros, L. L., Claval, D., Saey, L., Cossonnet, C., Giner, F., and Mourier, D.: A brief history of origins and contents of Organically Bound Tritium (OBT) and 14C in the sediments of the Rhône watershed, Sci. Total Environ., 643, 40–51, https://doi.org/10.1016/j.scitotenv.2018.06.074, 2018.
Horowitz, A. J.: An evaluation of sediment rating curves for estimating suspended sediment concentrations for subsequent flux calculations, Hydrol. Process., 17, 3387–3409, https://doi.org/10.1002/hyp.1299, 2003.
Horowitz, A. J.: Determining annual suspended sediment and sediment-associated trace element and nutrient fluxes, Sci. Total Environ., 400, 315–343, https://doi.org/10.1016/j.scitotenv.2008.04.022, 2008.
Horowitz, A. J.: Monitoring suspended sediments and associated chemical constituents in urban environments: Lessons from the city of Atlanta, Georgia, USA water quality monitoring program, J. Soil. Sediment., 9, 342–363, https://doi.org/10.1007/s11368-009-0092-y, 2009.
Horowitz, A. J., Elrick, K. A., and Smith, J. J.: Annual suspended sediment and trace element fluxes in the Mississippi, Columbia, Colorado, and Rio Grande drainage basins, Hydrol. Process., 15, 1169–1207, https://doi.org/10.1002/hyp.209, 2001.
Kiang, J. E., Gazoorian, C., McMillan, H., Coxon, G., Le Coz, J., Westerberg, I. K., Belleville, A., Sevrez, D., Sikorska, A. E., Petersen-Øverleir, A., Reitan, T., Freer, J., Renard, B., Mansanarez, V., and Mason, R.: A Comparison of Methods for Streamflow Uncertainty Estimation, Water Resour. Res., 54, 7149–7176, https://doi.org/10.1029/2018WR022708, 2018.
Launay, M., Dugué, V., Faure, J. B., Coquery, M., Camenen, B., and Le Coz, J.: Numerical modelling of the suspended particulate matter dynamics in a regulated river network, Sci. Total Environ., 665, 591–605, https://doi.org/10.1016/j.scitotenv.2019.02.015, 2019.
Le Bescond, C., Thollet, F., Poulier, G., Gairoard, S., Lepage, H., Branger, F., Jamet, L., Raidelet, N., Radakovitch, O., Dabrin, A., Coquery, M., and Le Coz, J.: Des flux d'eau aux flux de matières en suspension et de contaminants associés: gestion d'un réseau de stations hydro-sédimentaires sur le Rhône, La Houille Blanche, 104, 63–70, https://doi.org/10.1051/lhb/2018033, 2018.
Le Coz, J., Renard, B., Bonnifait, L., Le Boursicaud, R., Branger, F., and Mansanarez, V.: Guide pratique de la méthode BaRatin pour l'analyse des courbes de tarage et de leurs incertitudes, Irstea, 94 pp., hal-02601038, 2014.
Lefèvre, O., Bouisset, P., Germain, P., Barker, E., Kerlau, G., and Cagnat, X.: Self-absorption correction factor applied to 129I measurement by direct gamma-X spectrometry for Fucus serratus samples, Nucl. Instruments Methods Phys. Res. Sect. A Accel. Spectrometers, Detect. Assoc. Equip., 506, 173–185, https://doi.org/10.1016/S0168-9002(03)01361-5, 2003.
Lepage, H., Masson, M., Delanghe, D., and Le Bescond, C.: Grain size analyzers: results of an intercomparison study, SN Appl. Sci., 1, 1100, https://doi.org/10.1007/s42452-019-1133-9, 2019.
Lepage, H., Launay, M., Le Coz, J., Angot, H., Miège, C., Gairoard, S., Radakovitch, O., and Coquery, M.: Impact of dam flushing operations on sediment dynamics and quality in the upper Rhône River, France, J. Environ. Manage., 255, 109886, https://doi.org/10.1016/j.jenvman.2019.109886, 2020.
Lepage, H., Gruat, A., Thollet, F., Le Coz, J., Coquery, M., Masson, M., Dabrin, A., Radakovitch, O., Eyrolle, F., Labille, J., Ambrosi, J.-P., Delanghe, D., and Raimbault, P.: Concentrations and fluxes of suspended particulate matters and associated contaminants in the Rhône River from Lake Geneva to the Mediterranean Sea, Portail Data INRAE [data set], https://doi.org/10.15454/RJCQZ7, 2021.
Lick, W.: Sediment and contaminant transport in surface waters, Sediment Contam. Transp. Surf. Waters, 1, 1–399, https://doi.org/10.1201/9781420059885, 2008.
Ludwig, W., Dumont, E., Meybeck, M., and Heussner, S.: River discharges of water and nutrients to the Mediterranean and Black Sea: Major drivers for ecosystem changes during past and future decades?, Prog. Oceanography, 80, 199–217, https://doi.org/10.1016/j.pocean.2009.02.001, 2009.
Mansanarez, V., Le Coz, J., Renard, B., Lang, M., Pierrefeu, G., and Vauchel, P.: Bayesian analysis of stage-fall-discharge rating curves and their uncertainties, Water Resour. Res., 52, 7424–7443, https://doi.org/10.1002/2016WR018916, 2016.
Martinez, J. M., Carretier, S., and Santos, R. V.: The hydrology, geochemistry, and dynamics of South American great river systems, J. South Am. Earth Sci., 44, 1–3, https://doi.org/10.1016/j.jsames.2013.01.003, 2013.
Masson, M., Angot, H., Le Bescond, C., Launay, M., Dabrin, A., Miège, C., Le Coz, J., and Coquery, M.: Sampling of suspended particulate matter using particle traps in the Rhône River: Relevance and representativeness for the monitoring of contaminants, Sci. Total Environ., 637–638, 538–549, https://doi.org/10.1016/j.scitotenv.2018.04.343, 2018.
Moatar, F., Meybeck, M., Raymond, S., Birgand, F., and Curie, F.: River flux uncertainties predicted by hydrological variability and riverine material behaviour, Hydrol. Process., 27, 3535–3546, https://doi.org/10.1002/hyp.9464, 2013.
Mourier, B., Desmet, M., Van Metre, P. C., Mahler, B. J., Perrodin, Y., Roux, G., Bedell, J. P., Lefèvre, I., and Babut, M.: Historical records, sources, and spatial trends of PCBs along the Rhône River (France), Sci. Total Environ., 476–477, 568–576, https://doi.org/10.1016/j.scitotenv.2014.01.026, 2014.
Navratil, O., Esteves, M., Legout, C., Gratiot, N., Nemery, J., Willmore, S., and Grangeon, T.: Global uncertainty analysis of suspended sediment monitoring using turbidimeter in a small mountainous river catchment, J. Hydrol., 398, 246–259, https://doi.org/10.1016/j.jhydrol.2010.12.025, 2011.
Panagiotopoulos, C., Sempéré, R., Para, J., Raimbault, P., Rabouille, C., and Charrière, B.: The composition and flux of particulate and dissolved carbohydrates from the Rhone River into the Mediterranean Sea, Biogeosciences, 9, 1827–1844, https://doi.org/10.5194/bg-9-1827-2012, 2012.
Pont, D., Simonnet, J.-P., and Walter, A. V.: Medium-term Changes in Suspended Sediment Delivery to the Ocean: Consequences of Catchment Heterogeneity and River Management (Rhône River, France), Estuar. Coast. Shelf Sci., 54, 1–18, https://doi.org/10.1006/ecss.2001.0829, 2002.
Poulier, G., Launay, M., Le Bescond, C., Thollet, F., Coquery, M., and Le Coz, J.: Combining flux monitoring and data reconstruction to establish annual budgets of suspended particulate matter, mercury and PCB in the Rhône River from Lake Geneva to the Mediterranean Sea, Sci. Total Environ., 658, 457–473, https://doi.org/10.1016/j.scitotenv.2018.12.075, 2019.
Psomiadis, D., Ghilardi, M., Demory, F., Delanghe-Sabatier, D., Bloemendal, J., and Yiu, C.: Late Pleistocene to Mid-Holocene landscape reconstruction in the western part of the Thessaloniki Plain, Greece: Evidence for environmental changes, and implications for human occupation, Z. Geomorphol., 58, 67–87, https://doi.org/10.1127/0372-8854/2013/S-00137, 2014.
Quinton, E., Maindron, A., and Plumejeaud, C.: Collec-Science v2.5.0, Zenodo, https://doi.org/10.5281/zenodo.4277639, 2020.
Radakovitch, O., Roussiez, V., Ollivier, P., Ludwig, W., Grenz, C., and Probst, J. L.: Input of particulate heavy metals from rivers and associated sedimentary deposits on the Gulf of Lion continental shelf, Estuar. Coast. Shelf Sci., 77, 285–295, https://doi.org/10.1016/j.ecss.2007.09.028, 2008.
Raimbault, P., Garcia, N., and Cerutti, F.: Distribution of inorganic and organic nutrients in the South Pacific Ocean – evidence for long-term accumulation of organic matter in nitrogen-depleted waters, Biogeosciences, 5, 281–298, https://doi.org/10.5194/bg-5-281-2008, 2008.
Raimbault, P., Lagadec, V., and Garcia, N.: Water sample analyses – MOOSE – Rhone river, SEDOO OMP, https://doi.org/10.6096/MISTRALS-MOOSE.767, 2014.
Sadaoui, M., Ludwig, W., Bourrin, F., and Raimbault, P.: Controls, budgets and variability of riverine sediment fluxes to the Gulf of Lions (NW Mediterranean Sea), J. Hydrol., 540, 1002–1015, https://doi.org/10.1016/j.jhydrol.2016.07.012, 2016.
Schulze, T., Ricking, M., Schröter-Kermani, C., Körner, A., Denner, H.-D., Weinfurtner, K., Winkler, A., and Pekdeger, A.: The German Environmental Specimen Bank – Sampling, processing, and archiving sediment and suspended particulate matter, J. Soil. Sediment., 7, 361–367, https://doi.org/10.1065/jss2007.08.248, 2007.
Sicre, M. A., Fernandes, M. B., and Pont, D.: Poly-aromatic hydrocarbon (PAH) inputs from the Rhône River to the Mediterranean Sea in relation with the hydrological cycle: Impact of floods, Mar. Pollut. Bull., 56, 1935–1942, https://doi.org/10.1016/j.marpolbul.2008.07.015, 2008.
Syvitski, J. P. M., Vörösmarty, C. J., Kettner, A. J., and Green, P.: Impact of humans on the flux of terrestrial sediment to the global coastal ocean, Science, 308, 376–380, https://doi.org/10.1126/science.1109454, 2005.
Thollet, F., Le Bescond, C., Lagouy, M., Gruat, A., Grisot, G., Le Coz, J., Coquery, M., Lepage, H., Gairoard, S., Gattacceca, J. C., Ambrosi, J.-P., Radakovitch, O., Dur, G., Richard, L., Giner, F., Eyrolle, F., Angot, H., Mourier, D., Bonnefoy, A., Dugué, V., Launay, M., Troudet, L., Labille, J., and Kieffer, L.: Observatoire des sédiments du Rhône, OSR [data set], https://doi.org/10.17180/OBS.OSR, 2021.
US EPA: METHOD 7473: Mercury in Solids and Solutions by Thermal Decomposition, Amalgamation and Atomic Absorption Spectrophotometry SW-846, 1–17, 2007.
Vihma, T., Uotila, P., Sandven, S., Pozdnyakov, D., Makshtas, A., Pelyasov, A., Pirazzini, R., Danielsen, F., Chalov, S., Lappalainen, H. K., Ivanov, V., Frolov, I., Albin, A., Cheng, B., Dobrolyubov, S., Arkhipkin, V., Myslenkov, S., Petäjä, T., and Kulmala, M.: Towards an advanced observation system for the marine Arctic in the framework of the Pan-Eurasian Experiment (PEEX), Atmos. Chem. Phys., 19, 1941–1970, https://doi.org/10.5194/acp-19-1941-2019, 2019.