the Creative Commons Attribution 4.0 License.
the Creative Commons Attribution 4.0 License.
 | 21 Apr 2022
GeoDAR: georeferenced global dams and reservoirs dataset for bridging attributes and geolocations
Blake A. Walter
Fangfang Yao
Chunqiao Song
Meng Ding
Abu Sayeed Maroof
Jingying Zhu
Chenyu Fan
Jordan M. McAlister
Safat Sikder
Yongwei Sheng
George H. Allen
Jean-François Crétaux
Yoshihide Wada
Dams and reservoirs are among the most widespread human-made infrastructures on Earth. Despite their societal and environmental significance, spatial inventories of dams and reservoirs, even for the large ones, are insufficient. A dilemma of the existing georeferenced dam datasets is the polarized focus on either dam quantity and spatial coverage (e.g., GlObal geOreferenced Database of Dams, GOODD) or detailed attributes for a limited dam quantity or region (e.g., GRanD (Global Reservoir and Dam database) and national inventories). One of the most comprehensive datasets, the World Register of Dams (WRD), maintained by the International Commission on Large Dams (ICOLD), documents nearly 60 000 dams with an extensive suite of attributes. Unfortunately, the WRD records provide no geographic coordinates, limiting the benefits of their attributes for spatially explicit applications. To bridge the gap between attribute accessibility and spatial explicitness, we introduce the Georeferenced global Dams And Reservoirs (GeoDAR) dataset, created by utilizing the Google Maps geocoding application programming interface (API) and multi-source inventories. We release GeoDAR in two successive versions (v1.0 and v1.1) at https://doi.org/10.5281/zenodo.6163413 (Wang et al., 2022). GeoDAR v1.0 holds 22 560 dam points georeferenced from the WRD, whereas v1.1 consists of (a) 24 783 dam points after a harmonization between GeoDAR v1.0 and GRanD v1.3 and (b) 21 515 reservoir polygons retrieved from high-resolution water masks based on a one-to-one relationship between dams and reservoirs. Due to geocoding challenges, GeoDAR spatially resolved ∼ 40 % of the records in the WRD, which, however, comprise over 90 % of the total reservoir area, catchment area, and reservoir storage capacity. GeoDAR does not release the proprietary WRD attributes, but upon individual user requests we may provide assistance in associating GeoDAR spatial features with the WRD attribute information that users have acquired from ICOLD. Despite this limit, GeoDAR, with a dam quantity triple that of GRanD, significantly enhances the spatial details of smaller but more widespread dams and reservoirs and complements other existing global dam inventories. Along with its extended attribute accessibility, GeoDAR is expected to benefit a broad range of applications in hydrologic modeling, water resource management, ecosystem health, and energy planning.
- Article
(15843 KB) - Full-text XML
-
Supplement
(453 KB) - BibTeX
- EndNote


Since around the 1950s, the world has seen an unprecedented boom in large dam construction as a response to the ever-growing human demands for water and energy (Chao et al., 2008; Wada et al., 2017). Today, dams and their impounded reservoirs are ubiquitous across many global basins, providing multiple services that range from hydropower and flood control to water supply and navigation (Belletti et al., 2020; Biemans et al., 2011; Boulange et al., 2021; Döll et al., 2009; Grill et al., 2019). These benefits were, however, often gained at the cost of fragmenting river systems, submerging arable lands, displacing population, and disturbing climate regimes (Carpenter et al., 2011; Crétaux et al., 2015; Degu et al., 2011; Grill et al., 2019; Latrubesse et al., 2017; Nilsson and Berggren, 2000; Tilt et al., 2009; Vörösmarty et al., 2003; Wang et al., 2017).
Despite such environmental and societal significance, our spatial inventory of global dams and reservoirs, even for the large ones (such as those with a surface area > 1 km2), has been insufficient. We still lack a thorough and authoritative dataset that documents both geographic coordinates (latitude and longitude) and standard attributes (e.g., purpose, reservoir storage capacity, and hydropower capacity) of the existing large dams. One of the most comprehensive datasets, the World Register of Dams (WRD), is regularly updated by the International Commission on Large Dams (ICOLD; https://www.icold-cigb.org, last access: 13 March 2019), a non-governmental organization dedicated to the global sharing of professional dam or reservoir information. The recent version of the ICOLD WRD documents nearly 60 000 “large” dams, defined as those with a wall higher than 15 m or between 5 and 15 m but with a reservoir storage greater than 3×10⁶ m3 (mcm). These WRD records are considered to be “complete” to the extent of contributions from willing nations and water authorities (Wada et al., 2017).
While the ICOLD WRD provides more than 40 attributes (e.g., reservoir storage capacity, dam height, and reservoir purpose), the dam locations are, unfortunately, either not georeferenced or inaccessible to the public. Despite the availability of many essential attributes, missing geographic coordinates have severely limited the applications of the WRD, including for hydrological modeling and hydropower planning (Yassin et al., 2019), which require the dam records to be spatially explicit. This dilemma may be partially resolved by using georeferenced regional registers such as the United States National Inventory of Dams (US NID; https://nid.sec.usace.army.mil, last access: 20 March 2021). Nevertheless, such regional registers are not always publicly available, especially in developing nations, where dam construction is still booming (Zarfl et al., 2015).
Other global dam and reservoir datasets that are georeferenced, however, often lack essential attributes. An example is the recently published GlObal geOreferenced Database of Dams (GOODD V1) (Mulligan et al., 2020), which contains 38 667 dam points digitized from Google Earth imagery and their associated catchments delineated from digital elevation models (DEMs). Despite this dam quantity, GOODD provides no other attribute information. Another inventory, the Global River Obstruction Database (GROD) (Whittemore et al., 2020; Yang et al., 2022), located more than 30 500 flow obstructions along rivers wider than 30 m as mapped in the Global River Width from Landsat (GRWL) database (Allen and Pavelsky, 2018). The current attributes are mainly limited to obstruction types such as locks, weirs, and multiple types of dams. In addition, GRWL was tailored for the forthcoming Surface Water and Ocean Topography (SWOT) satellite mission, which was designed to observe river reaches wider than 50–100 m (Biancamaria et al., 2016). While these rivers are sufficiently captured by GRWL, the obstruction infrastructure identified along the river mask in GRWL excludes many large dams on rivers narrower than 30 m. In the US, for instance, there are about 9020 NID-registered large dams according to ICOLD criteria, but only ∼ 9 % of them intersect with GRWL (calculated with variable distance tolerance being the maximum river widths (attribute “width_max”) of the GRWL lines).
Among the few global dam or reservoir datasets that provide both georeferenced locations and essential attributes are the United Nations Food and Agricultural Organization (FAO) AQUASTAT (Li et al., 2011) and the Global Reservoir and Dam database (GRanD) (Lehner et al., 2011). GRanD was constructed by harmonizing AQUASTAT and a wide range of regional gazetteers and inventories. Its latest version, v1.3, contains 7320 dams as well as their reservoir boundaries and over 50 attributes, with a cumulative storage capacity of 6881 km3. Since its publication, GRanD has been applied extensively by a variety of studies, although its focus is on the world's largest dams (e.g., > 0.1 km3), and its quantity (7320 dams) is a fraction of the ∼59 000 dams documented in the WRD. A spatially resolved inclusion of additional large dams, such as those in compliance with the ICOLD definition, has been increasingly desired by the hydrology community and encouraged by growing collaborations from multiple disciplines such as biogeochemistry, ecology, energy planning, and infrastructure management (Belletti et al., 2020; Boulange et al., 2021; Grill et al., 2019; Lin et al., 2019; Wada et al., 2017).
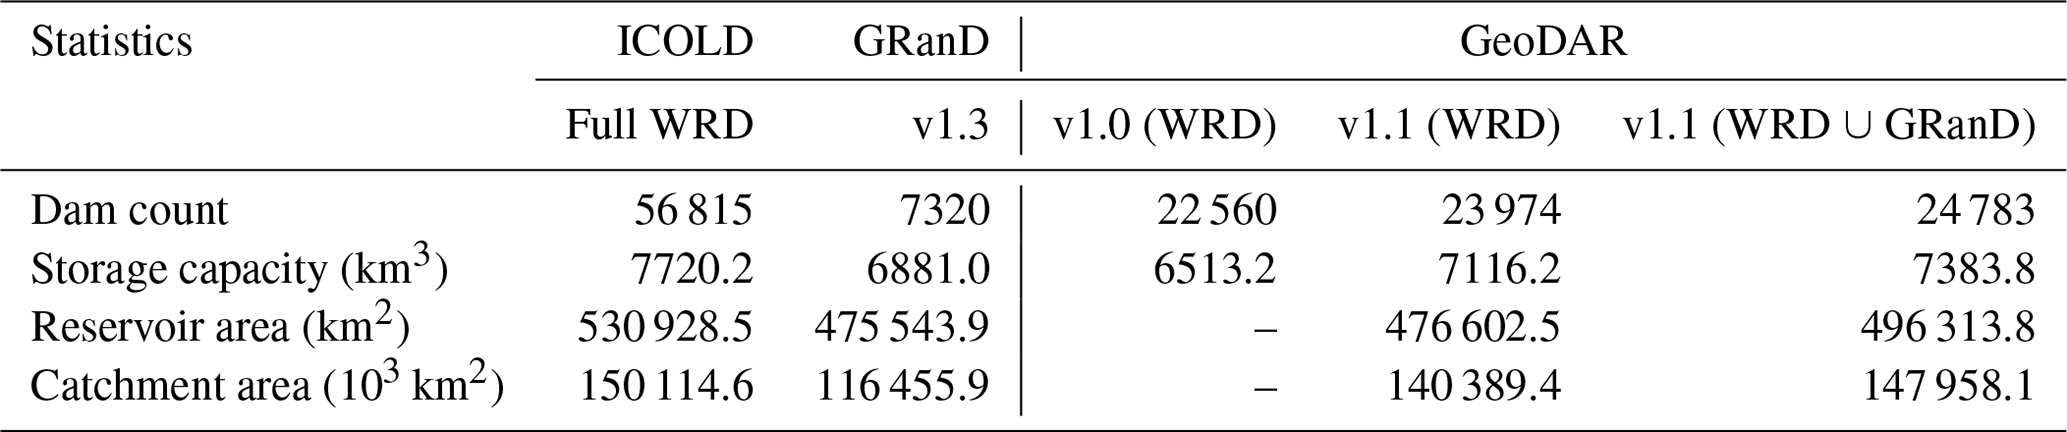
Here, we present the initial versions of the Georeferenced global Dams And Reservoirs dataset, or GeoDAR. We built GeoDAR by leveraging multi-source dam and reservoir inventories and the Google Maps geocoding application programming interface (API). Our goal is to tackle the limitations of existing datasets by offering a dam inventory that is both spatially resolved and has an extended ability to access important attributes. As summarized in Table 1, GeoDAR includes two successive versions. GeoDAR v1.0 is essentially a georeferenced subset of the ICOLD WRD. It contains 22 560 dam points, each indexed by an identifier (ID) that is associated with a unique WRD record, allowing for potential retrieval of all its 40+ proprietary attributes from ICOLD. GeoDAR v1.1 consists of (a) nearly 25 000 dam points which harmonized v1.0 and GRanD for an expanded inclusion of the largest dams and (b) the reservoir boundaries for most (87 %) of the dam points based on a one-to-one relationship between dams and reservoirs. Due to geocoding challenges, GeoDAR v1.0 spatially resolved about 40 % of the dams in the WRD. However, these georeferenced locations were quality controlled, and after the harmonization with GRanD, v1.1 captures a total storage capacity of 7384 km3, a magnitude comparable to the full storage capacity of the WRD. While GeoDAR v1.1 can be considered to be a version that supersedes v1.0, the latter was, in principle, georeferenced independently from GRanD. We opted to release both versions so users have the flexibility to decide whichever works better for their cases and potentially improve the harmonization.
Due to proprietary restrictions, neither GeoDAR version releases any WRD attributes. Instead, we offer an option for users if they need to acquire the attributes: upon individual request we may assist the user who has purchased the WRD (https://www.icold-cigb.org/GB/world_register/world_register_of_dams.asp, last access: 13 March 2019) to associate the GeoDAR ID with the ICOLD “International Code”, through which WRD attributes can be linked to each GeoDAR feature (see Sects. 3.3 and 6 for more details). Even without the proprietary WRD attributes, GeoDAR offers one of the most extensive and spatially resolved global inventory of dams and reservoirs, which may benefit a variety of applications in hydrology, hydropower planning, and ecology.

2.1 Definitions and overview
We aim to georeference (i.e., acquire the latitude and longitude of) each dam listed in the ICOLD WRD by using the nominal location (e.g., a descriptive address for a dam or reservoir) available in the WRD attributes. Examples of the attributes that are important for georeferencing include the names of the dam and reservoir, the administrative divisions the dam is affiliated with, and the name of the impounded river. Using such attribute information, spatial coordinates of a dam may be either (a) queried from an existing register or inventory where dam records were already georeferenced and verified or (b) estimated through a geocoding service that can convert nominal locations to numeric spatial coordinates. Our preference was the former when possible to optimize the georeferencing accuracy.
The schematic procedure of GeoDAR production is illustrated in Fig. 1. We started by removing duplicate records from the ∼ 59 000 dams listed in the original ICOLD WRD (accessed in March 2019). Here “duplicates” are defined as the dams that are either (a) repeatedly recorded with identical (or highly similar) attribute information or (b) different dam structures but associated with the same reservoir. Examples of the second scenario include a reservoir's primary and secondary or auxiliary dams such as the Boonton Dam and the Parsippany Dike (40.884∘ N, 74.408∘ W) in New Jersey and multiple controls for one reservoir such as Veersedam and Zandkreekdam for Veerse Meer (51.549∘ N, 3.678∘ E) in the Netherlands. Although “duplicates” in this scenario refer to different dam bodies, including them could lead to double or multiple counting of the storage capacity of the same reservoir, and similar to the production of GRanD, our goal was to link one reservoir to one dam (if possible). After removing the identified duplicates, the cleaned WRD contains 56 815 unique dams or reservoirs. These dams have an accumulative storage capacity of 7328 km3 based on the original WRD attribute values (which are occasionally missing or erroneous) or 7720 km3 after replacement or correction by Wada et al. (2017) and GRanD (see Sect. 2.4). Unless otherwise described, the ICOLD WRD mentioned in the following text refers to the version after duplicate removal. We acknowledge that owing to the challenges of lacking explicit spatial information and occasional attribute errors in the WRD, our duplicate removal is not perfect and may have misidentified or missed some duplicate dams.
We then compared the unique ICOLD WRD records against a collection of georeferenced dam registers we acquired from regional water authorities and agencies. When the attribute information of a WRD dam matched that in a regional register, the spatial coordinates from the latter were “borrowed” to the WRD record. We term this process “geo-matching”, which resulted in the georeferencing of 13 190 WRD dams. For the remaining dams in the WRD, we applied the alternative approach, “geocoding”, which transforms a nominal location (such as the dam or reservoir address formulated by ICOLD attribute information) to a pair of spatial coordinates. The tool we used to implement geocoding was the Google Maps geocoding API (http://developers.google.com/maps, last access: 14 February 2022). The geocoding process successfully retrieved the spatial coordinates of another 9338 WRD dams. The combined output from both geo-matching and geocoding were next collated with the spatial coordinates and reservoir storage capacities of 133 WRD dams larger than 10 km3 as documented in Wada et al. (2017). These processes resulted in GeoDAR v1.0, a total of 22 560 georeferenced WRD dam points with an accumulative storage capacity of 6441 km3 (accounting for more than 80 % of that in the ICOLD WRD). The Venn diagram in Fig. 2a provides an overview of the logical relations among the georeferencing sources and methods for GeoDAR v1.0.
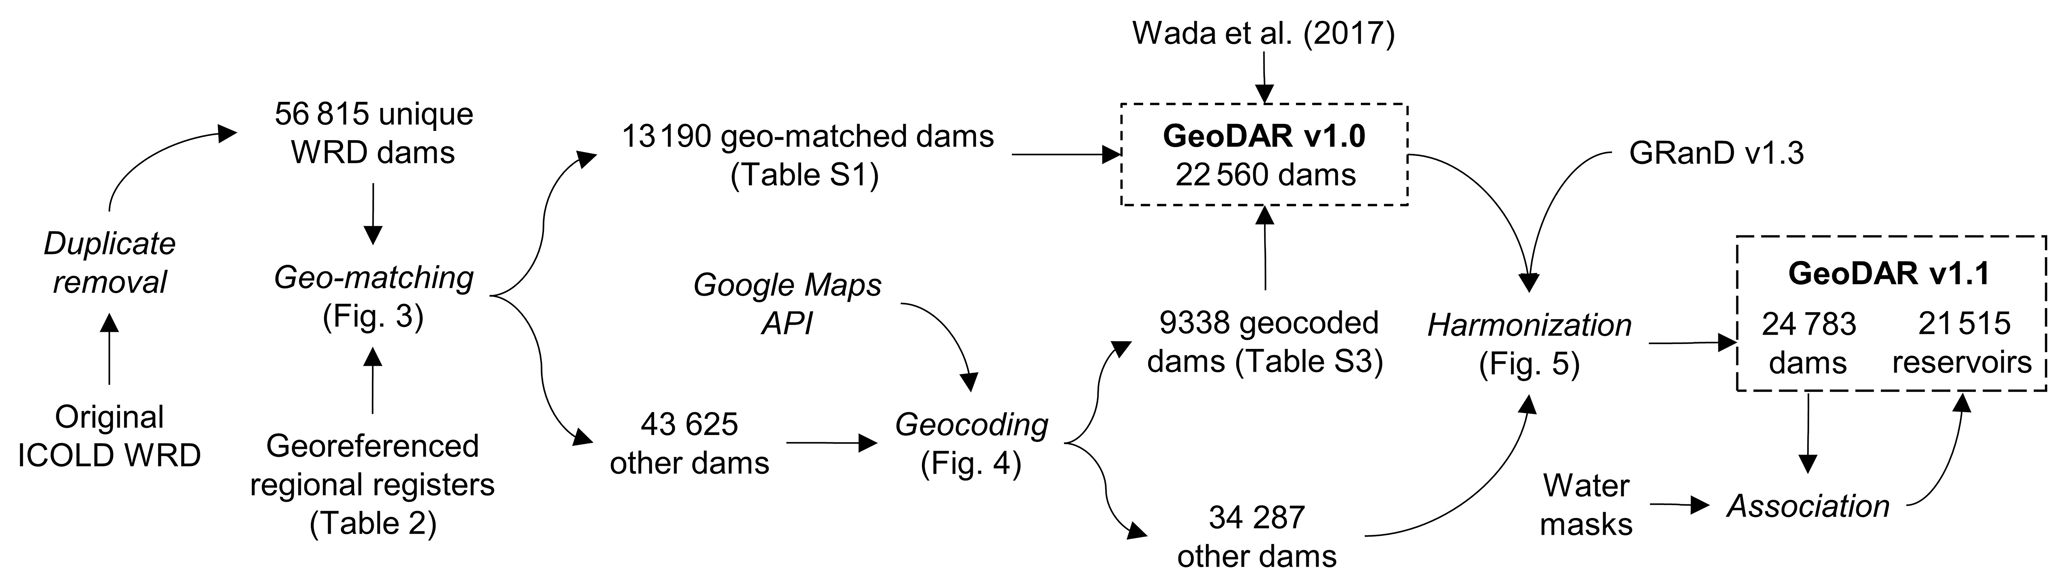
Figure 1Schematic flowchart of GeoDAR production. Text in roman indicates applied or produced datasets, and text in italics indicates methods or procedures.
To further improve our spatial inventory of the world's largest dams, we performed a harmonization between the dam points in GeoDAR v1.0 and GRanD v1.3. The harmonization aimed at merging both datasets, removing duplicates in the overlapped portion between them, and when possible associating new dams supplemented by GRanD with the corresponding WRD records. This process identified another 2223 dam points, including 1414 associated with the WRD but not georeferenced in GeoDAR v1.0. With removal of duplicates, this harmonization led to a total number of 24 783 georeferenced dam points, with an accumulative storage capacity of 7384 km3. An overview of this harmonization process is illustrated by the Venn diagram in Fig. 2b. Finally, the reservoir polygons for each of the georeferenced dams were retrieved as thoroughly as possible from three global water body datasets: GRanD v1.3 reservoirs (Lehner et al., 2011), HydroLAKES v1.0 (Messager et al., 2016), and the Landsat-based UCLA Circa 2015 Lake Inventory (Sheng et al., 2016). These nearly 25 000 dam points and their associated reservoir polygons constitute GeoDAR v1.1. Details of production processes, including quality assurance and quality control (QA/QC), are included in the following method sections.
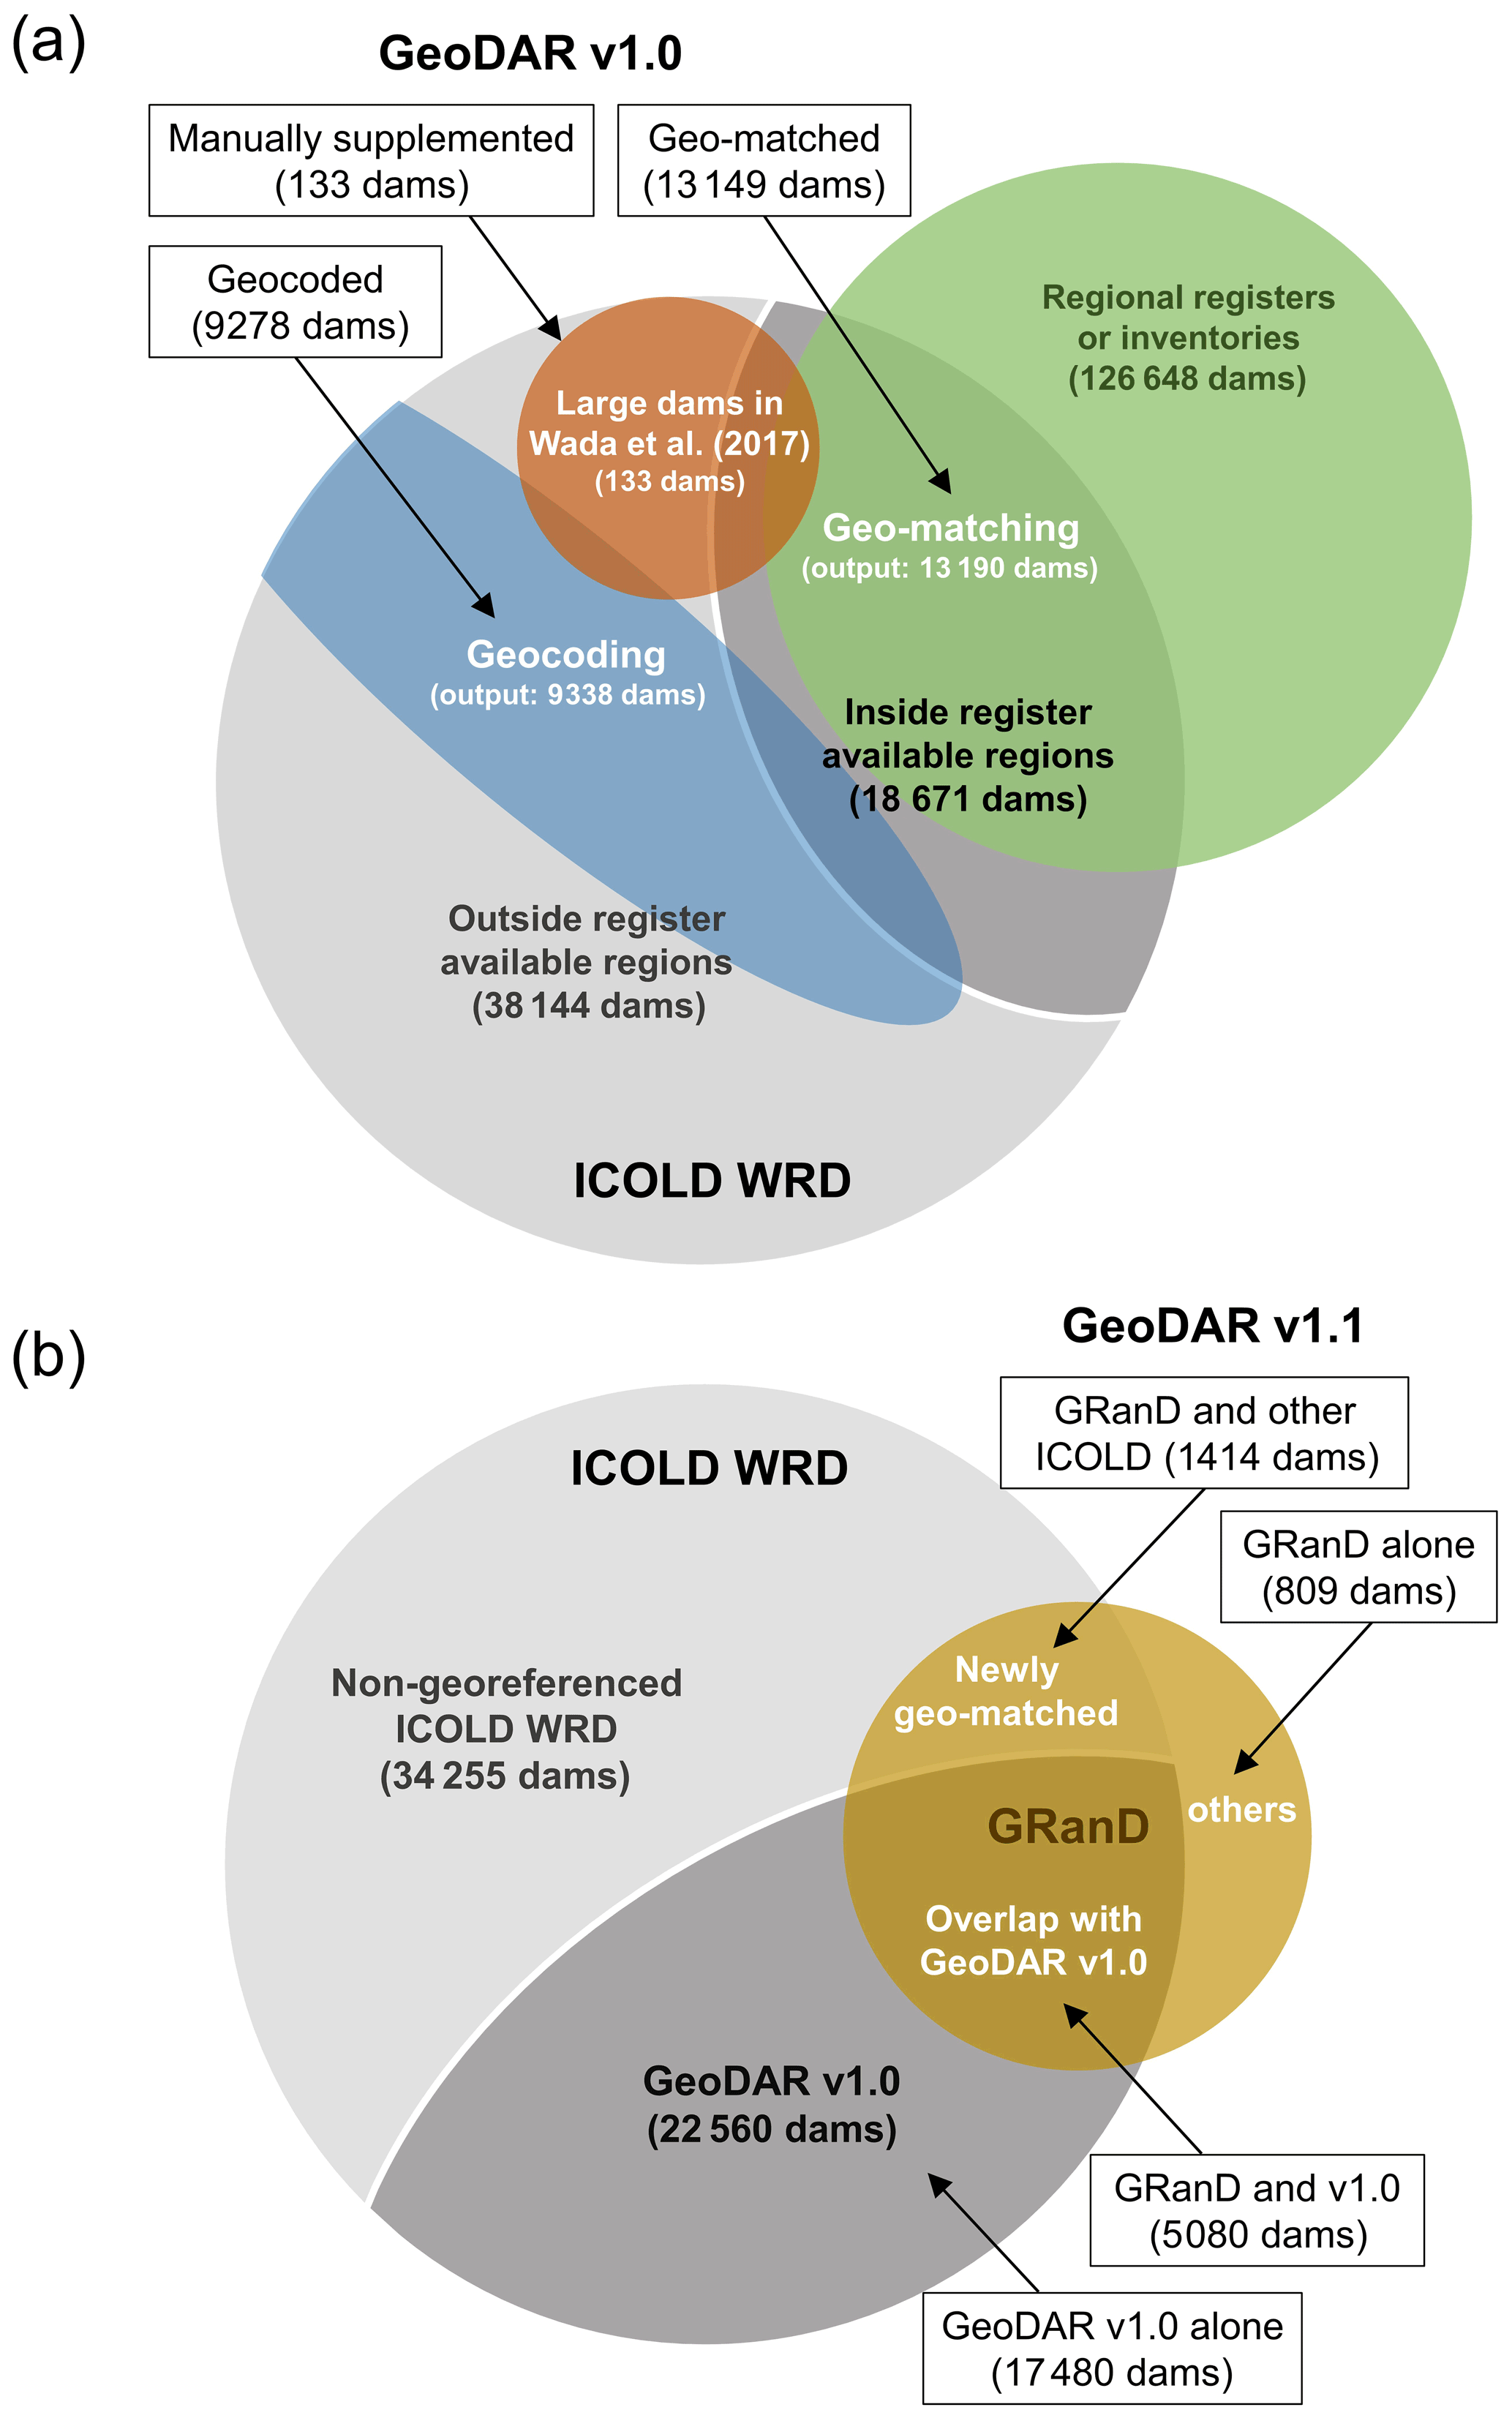
Figure 2Venn diagrams illustrating the logical relations among georeferencing data sources and methods for GeoDAR. (a) GeoDAR v1.0 and (b) GeoDAR v1.1 (dams only). Boxes indicate the final subsets in each GeoDAR version, and the arrows point to the georeferencing sources or methods. Topology of the shapes illustrates logical relations among the data and methods (shape sizes were not drawn to scale of the data volumes).
2.2 Geo-matching regional registers
The ICOLD WRD was a collective contribution from more than 100 member nations, some of which also release detailed and publicly accessible dam registers that have been georeferenced. These regional and local registers, with reliable spatial coordinates already provided for each dam, were our preferred sources for georeferencing the WRD. Since this type of register is not available for most countries, we searched several water authority and project websites and collected seven georeferenced regional registers or inventories that are open-access. Their names, sources, and numbers of documented dams are summarized in Table 2.
Table 2Regional registers or inventories for geo-matching and the validation of geocoding.
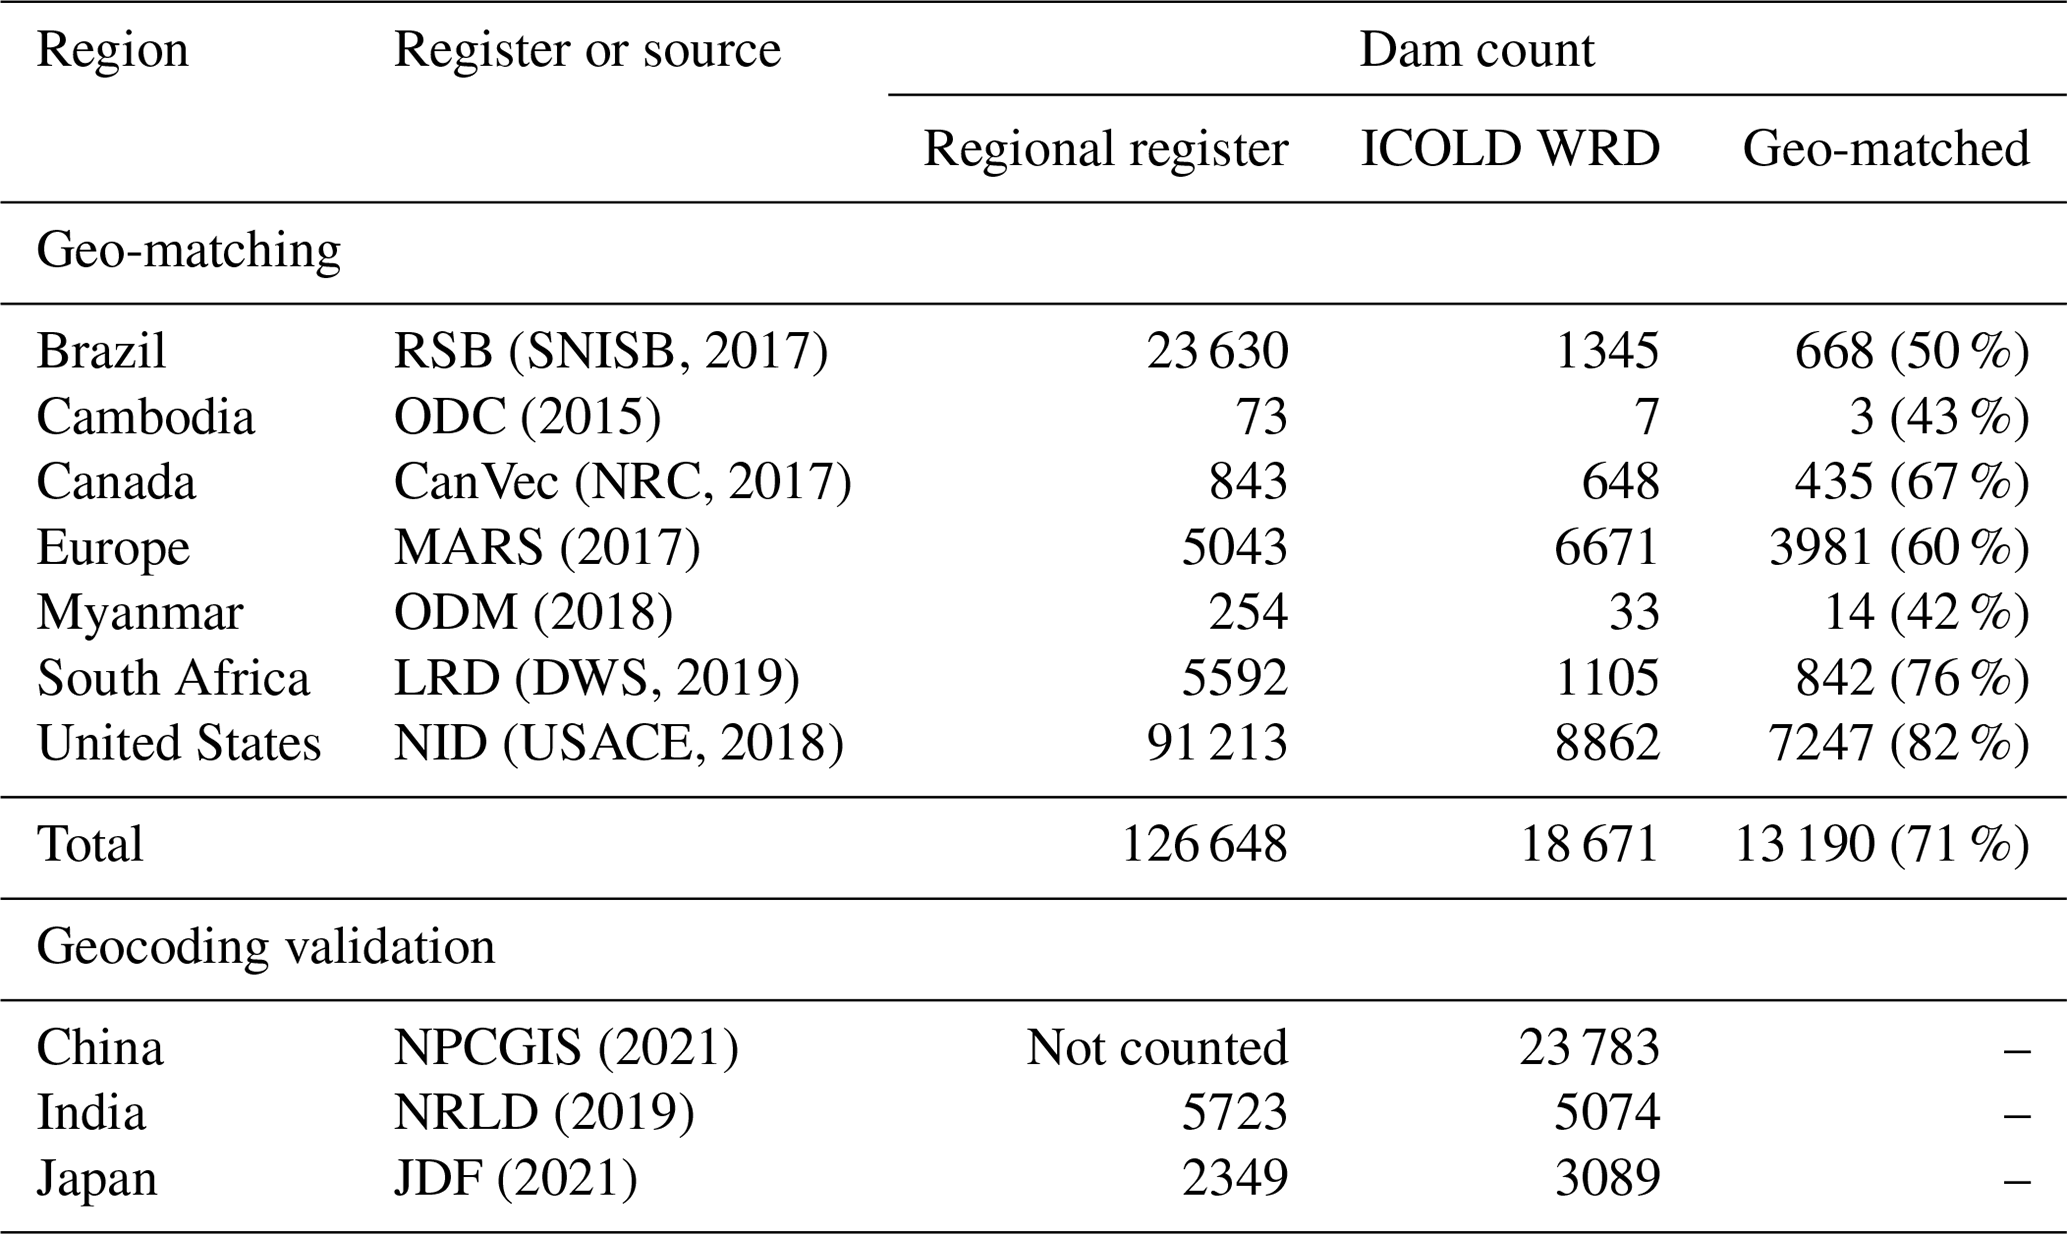
Register or source abbreviations are as follows: Relatório de Segurança de Barragens (RSB; Dams Safety Report of Brazil), Open Development Cambodia (ODC), Managing Aquatic ecosystems and water Resources under multiple Stress project (MARS), Open Development Myanmar (ODM), List of Registered Dams (LRD) of South Africa, National Inventory of Dams (NID) of the US, National Platform for Common Geospatial Information Services (NPCGIS) of China, National Register of Large Dams (NRLD) of India, and Japan Dam Foundation (JDF). Regional inventories were collected with partial reference to the Global Dam Watch website (http://globaldamwatch.org, last access: 1 March 2022; Mulligan et al., 2021). Statistics for regional registers are based on records with valid geographic coordinates, and statistics for the ICOLD WRD are based on records after duplicate removal. See full registers, references, and download links in the reference list.
These seven registers and inventories cover Brazil, Canada, the United States, 31 European countries (including part of Russia), South Africa, and part of Southeast Asia (Cambodia and Myanmar), with a total dam count of more than 126 000. Besides spatial coordinates, each of these registers also provides attributes for their documented dams, which were required by the geo-matching process. While other dam inventories could be available, our geo-matching effort for GeoDAR v1.0 was focused on these collected ones. However, we referred to additional registers or inventories from China, India, and Japan (Table 2) for the validation of our WRD geocoding (see “Validation”). For these additional regional registers, it was either inconvenient to bulk-download the dam records, or we were legally restricted from releasing their dam coordinates. Therefore, we only used these registers for the purpose of validation.
The procedure of geo-matching is illustrated in Fig. 3. Given each regional register, our goal was to find its matching records from the subset of the ICOLD WRD for the same region, by cross-checking value similarities for several key attributes between the two datasets. On one hand, the compared attributes must be mutually available in both datasets. On the other hand, the attributes should cover various themes so that in combination, they are able to disambiguate records that represent different dams but may coincide in certain attributes. Taking both requirements into account, the key attributes used include the dam and reservoir names, multiple levels of administrative or political divisions for the dam, and the dam's completion year. The river on which the dam was constructed was also considered for all regions except Cambodia as the register does not contain such an attribute. For each of the key attributes, we considered values in the WRD and the regional register agreeing with each other if the similarity score between the value sequences exceeded ∼ 85 % (meaning that there are more than eight pairs of identical elements, with consideration of their orders, between two 10-character sequences). This similarity threshold tolerated minor variations in spelling that may occur among different data sources. If an agreement was not reached between the two full sequences (e.g., “Maharashtra Pradesh” and “Maharashtra”), the similarity was then tested at the level of the main subsets of the sequences in order to increase the matching success.
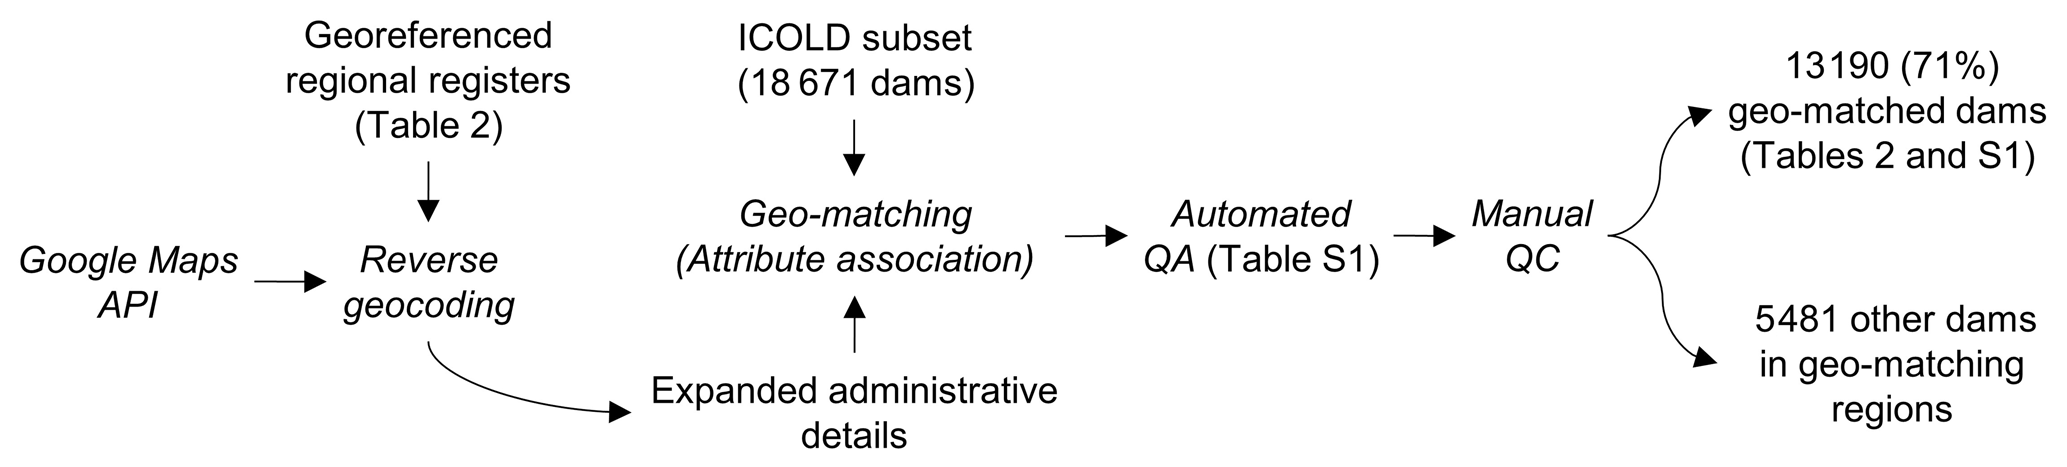
Figure 3Schematic procedure of geo-matching regional registers. Text in roman indicates applied or produced datasets, and text in italics indicates methods or procedures.
One of the geo-matching challenges was that the levels of political or administrative divisions are not always comparable or consistent between the WRD and the regional registers. In the WRD, the divisions were provided at the levels of country, state/province, and the nearest town/city, which are inconsistent with some of the registers. For example, the register for Brazil (Dams Safety Report in 2017) provides the finest division at the county level, whereas the European inventory (from the MARS (Managing Aquatic ecosystems and water Resources under multiple Stress) project) documents no divisions below the national level. To improve the feasibility in division comparison, we performed a “reverse geocoding” for each georeferenced regional register using the Google Maps geocoding API. Opposite to regular (or “forward”) geocoding, which converts a nominal location to numeric spatial coordinates, this reverse geocoding converted the spatial coordinates of each dam documented in the register to a parsed address that contains administrative divisions at consecutive levels. These multi-level divisions and subdivisions were appended to the original regional registers (Fig. 3), thus enabling a more flexible and complete comparison with the WRD attributes and thus an increased success rate of geo-matching.
We considered a WRD record to match a regional record if their agreements on the key attributes warranted reasonable confidence that the two records are the same dam. In principle, high confidence would require a unanimous agreement on all key attributes. However, this ideal scenario was often unnecessary and sometimes impossible. One of the reasons is that the key attributes do not always have valid values. In the WRD, for instance, the values of “nearest town” for nearly all (> 99 %) US dams are missing. While this attribute is available for many other dams, the nearest town/city is not necessarily the division administrating or containing the dam. Another reason is that our collected multi-source datasets were not collated by a universal standard. As a result, inherent discrepancies of the attribute definitions and/or values may exist among the datasets. One example is the dam's “completion year”, which could be ambiguous between the year when the dam construction was concluded and the year when the dam operation was initiated or commissioned. These two definitions do not necessarily lead to the same year. To address such inconsistencies, we defined a baseline scenario that required any pair of matched WRD and regional records to agree on the following:
-
dam or reservoir name;
-
country and state/province if values are valid; and
-
at a minimum, either (a) completion year or river if the town/city values disagree or are invalid or (b) town/city when completion years and rivers do not both disagree.
In compliance with this baseline, we implemented an automated QA to filter out any matching errors and optimize the matching accuracy for each WRD record. In brief, any match that did not meet the baseline scenario was removed, and the remaining geo-matched pairs were ranked to three discrete QA levels (M1, M2, and M3) according to the quality of attribute agreements (see definitions in Table S1 in the Supplement). As the QA rank increases (from M3 to M1), agreements on the key attributes improved from the baseline to the ideal scenario (i.e., a unanimous agreement). If a WRD record was matched to multiple records in the regional register, the QA selected the match with the best rank. This way, each georeferenced WRD record was only matched to the best-ranking regional record. Users may refer to the provided QA ranks as a measure of the reliability of each geo-matched location. It is worth noting that our geo-matching purpose was to acquire the spatial coordinates of any matched WRD record from the regional register rather than collating or correcting any existing attribute values. In other words, some of the WRD and regional records may actually refer to the same dams but were matched unsuccessfully due to major discrepancies between their attribute values. This led to a conservative success rate in our automated geo-matching. More technical details about QA are given in our Python scripts at https://github.com/surf-hydro/georeferencing-ICOLD-dams-and-reservoirs (last access: 13 March 2021).
Following the automated QA, we performed a manual QC to reassure the accuracy of the geo-matching results. We went through each geo-matched WRD record to examine whether its attributes (e.g., dam or reservoir name, administrative locations, river name, construction year, and storage capacity) indeed agreed with those of the regional source. If an evident discrepancy was identified, the “match” was removed or corrected in the final product. Although we made every endeavor to be as rigorous as possible, remnant matching errors may still exist due to the challenges of incompleteness and possible errors in the attribute information (refer to Sect. 4 for accuracies). For occasional cases that a dam was matched correctly to the register attributes but misplaced due to poorer quality of the spatial coordinates in the register, we tried to adjust or, if possible, correct the register's spatial coordinates using the best possible resources (such as Google Maps and other open-source documents). If we were unable to observe any water infrastructure at the location of a correct match, we took a conservative action and removed the match. We admit that this might mistakenly delete some of the structures (e.g., small run-of-the-river hydropower stations, weirs, and diversions) that are too small to be visible from Google Map imagery. Our manual QC identified ∼ 4 % error in the geo-matched WRD records, most of which came from QA rank M3. After removing these errors, the geo-matching process concluded with a total of 13 190 WRD records georeferenced (Fig. 3), including 3238, 6987, and 2965 for QA ranks M1, M2, and M3, respectively (Table S1 in the Supplement). The success rate, i.e., the number of geo-matched dams as a percentage of the number of WRD records, varies from about 40 % in Southeast Asia to about 80 % in South Africa and the US (Table 2), with an overall success of 71 % in all geo-matched regions (Fig. 3).
2.3 Geocoding via Google Maps
The subset of the ICOLD WRD that was not geo-matched includes the remaining 5481 (29 %) dams in the geo-matched regions and the entire 38 144 dams in the other regions of the world (Fig. 2a). For these dams, we applied the Google Maps geocoding API, a sophisticated cloud-based geocoding service, to retrieve the spatial coordinates of each dam as thoroughly and accurately as possible. To do so, we designed a recursive geocoding procedure that implemented three primary steps on each dam: forward geocoding, reverse geocoding, and QA filtering. The purpose of each of the steps and their logical relations are illustrated in Fig. 4.
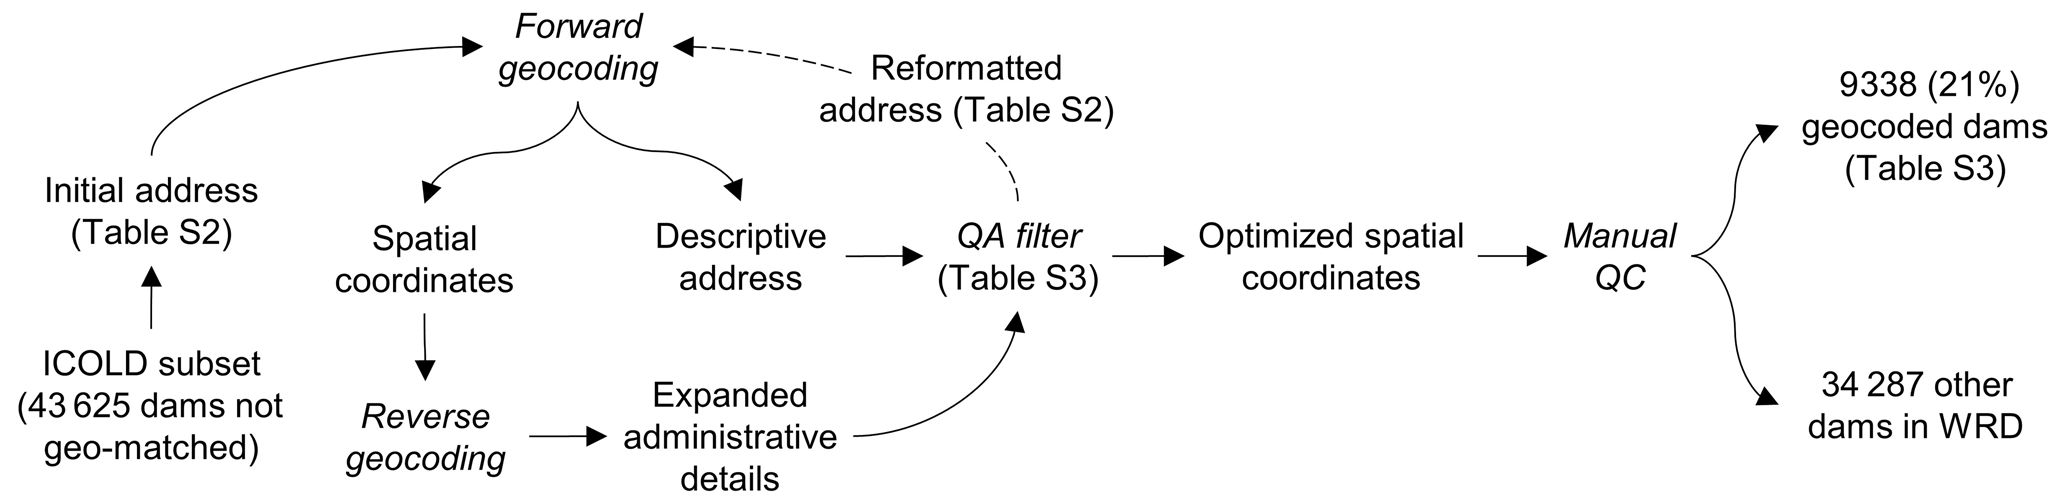
Figure 4Schematic procedure of geocoding using Google Maps API. Text in roman indicates applied or produced datasets, and text in italics indicates methods or procedures. The dashed line arrow indicates that this step is not always necessary.
The forward geocoding (see Sect. 2.1 for definition) used the text address of each dam as the input, which we formatted by concatenating the WRD attribute values, to output the latitude and longitude of the dam. The WRD attributes used for address formatting include dam name, reservoir name, state/province, and country. “Nearest town” was excluded because it is not always the township administrating the dam or reservoir. Together with the spatial coordinates, the forward geocoding also returned a Google Maps address associated with the coordinates, which was parsed to individual components including feature name, street name, and political divisions. These output address components, in return, provided valuable information for QA: if the geocoded coordinates are correct, the associated output address components should agree well with those of the WRD input. However, we noticed that address components from forwarding geocoding are often limited in terms of division levels. To complement this limitation, we also utilized reverse geocoding (see Sect. 2.2 for definition) to convert the coordinates from forward geocoding to an updated address (sometimes with more complete division levels). The address components from both forward and reverse geocoding were combined and are hereafter referred to as the “output address”.
Similar to geo-matching, we employed a QA filter to approach the optimal geocoding result. This process first arranged the attributes of each WRD record to several address formats as they could result in different geocoding outputs. The address arrangements are listed in Table S2 in the Supplement, and their preference order is rationalized in the Supplement. Each of these WRD addresses was used iteratively for both forward and reverse geocoding (as described above). Their geocoded spatial coordinates were then ranked to five discrete QA levels based on how well the input and output addresses agree with each other (C1 to C5 in Table S3 in the Supplement). The iteration could be terminated if the highest QA rank was achieved; otherwise, the coordinates that rendered the best possible QA rank were used as the geocoding result.
As explained in Table S3 in the Supplement, the compared address components include the name of the feature and its affiliated political divisions from town/city to country levels. Consistent with geo-matching, we considered a component to be agreed on if the similarity of its values from both input and output addresses exceeds ∼ 85 %. Since the nearest town in the WRD was not used for forward geocoding, we treated it as an “independent reference” for validating the township component in the output address. Although the town or city near the dam (from the WRD) does not always coincide with that administrating the dam (from the geocoding output), their occasional agreement would strengthen our confidence of the geocoded coordinates if other components were also well matched between the WRD input and the geocoding output. For this reason, we opted to include the township comparison as a supplementary criterion in the geocoding QA process. The highest QA rank (C1) corresponds to a unanimous agreement on all address components. However, the minimum rank (C5) only required the agreement on the feature name, which is a more flexible baseline in comparison with that for geo-matching. This was because some of the large reservoirs, particularly those on or near political boundaries, have shared or ambiguous divisions, and the ambiguity might be further amplified by the output coordinates, which could fall in anywhere from the dam to across the reservoir water surface. In addition, some of the outputs, regardless of agreement on the address components, are not dams or reservoirs. We therefore included another baseline filter which aimed to remove such errors by analyzing the feature type information in the geocoding output (see scripts in “Code availability”). Although the QA process was designed to be automated, we still manually enforced hundreds of the initial outputs, many of which had returned feature names in native languages, to pass the baseline filters. As a result, our QA process yielded more than 16 000 geocoded WRD records, each with the optimal spatial coordinates and the corresponding QA rank.
To complement the QA process, we then conducted a rigorous QC to correct and/or remove the remaining geocoding errors. We considered a geocoding error to be a location where (a) no dam or reservoir could be visibly verified from Google Earth or Esri images, or (b) the WRD attribute information is inconsistent with the feature or division labels on Google Maps. In such cases, we usually first attempted to re-geocode the dam manually (such as by directly using the Google Maps interface) before deleting this error. It is important to clarify that the georeferenced coordinates, although referred to as ”dam points” in our data product, do not always fall on the dam bodies. While the geo-matched coordinates from regional registers are usually on or close to the dams, the geocoded coordinates, depending on the address input (Table S2 in the Supplement) and the available Google Maps information, could be located on the associated reservoir. Note that the latter case was not considered an error, but for improved locations, we manually adjusted some of the georeferenced coordinates more towards the dams. Due to China's GPS shift problem (e.g., misalignment between the street maps and satellite imagery on Google Maps), the geocoded points across mainland China often exhibit systematic offsets of roughly 500 m or more from their actual dam or reservoir features. For such Chinese dams, we tried to reduce their geocoding offsets by manually relocating the coordinate points to their correct dams or reservoirs. Our QC process ended up removing about 42 % of the originally geocoded dams, most of which stemmed from relatively low QA ranks (see statistics in Table S3 in the Supplement). The complete geocoding procedure resulted in 9338 georeferenced and quality-controlled WRD records, with an overall success rate of 21 %.
2.4 Supplementation with other global inventories
The outputs from both geo-matching and geocoding, a total of 22 528 georeferenced ICOLD WRD records (Fig. 2a), were further supplemented or harmonized by two global dam or reservoir inventories to improve our inclusion of the world's largest dams. We considered this process necessary for two reasons. First, our georeferencing process, particularly geocoding via Google Maps API, did not warrant an exhaustive inclusion of the largest dams. This is particularly evident for regions where the address and label information in Google Maps is either lacking or difficult to pass the automated QA due to language ambiguity or naming discrepancies. Second, through cross-referencing we noted that the attribute values of reservoir storage capacity (as well as reservoir surface area) provided in the ICOLD WRD are occasionally erroneous (also noted by Mulligan et al., 2020), e.g., by a factor of 1000, probably caused by unit confusion in WRD compilation. As part of the supplementation and harmonization process, we also reduced the errors in WRD by verifying storage capacities of some of the largest reservoirs and replacing the WRD capacity values by those of the two global inventories.
2.4.1 Supplementation with Wada et al. (2017): forming GeoDAR v1.0
Wada et al. (2017) compiled a list of all 144 large dams with a reservoir storage capacity larger than 10 km3 in the world. Among them, 139 dams were provided with spatial coordinates. We verified each of the dam locations and made minor adjustments to further assure the quality. The attributes of these 139 dams were then manually compared with those in the ICOLD WRD. We found that 133 of them were unique records also documented in the WRD, but 32 of them were georeferenced unsuccessfully in our geo-matching or geocoding procedure. Therefore, we borrowed the spatial coordinates of these 32 large dams in Wada et al. (2017) to supplement what we had georeferenced. The coordinates of the other 101 large dams, which we georeferenced successfully (41 from geo-matching and 60 from geocoding), were also overwritten by those in Wada et al. (2017) to double-assure and improve their spatial accuracies. This supplementation is illustrated by the Venn diagram in Fig. 2a.
We next compared the storage capacities of each of the 133 dams in Wada et al. (2017) with those in the WRD and identified 21 of them exhibiting substantial discrepancies between the two datasets (including 3 dams without capacity values in the WRD). We then collated their storage capacities with other documents (e.g., regional inventories, GRanD, and Wikipedia) and concluded that WRD may supersede Wada et al. (2017) in the accuracy of storage capacity for 5 of the 21 dams. Except these five dams, the original WRD capacities were replaced by those in Wada et al. (2017). More detailed data collation and verification for Wada et al. (2017) are given in Table S4 in the Supplement (full spreadsheet available at https://doi.org/10.5281/zenodo.6163413; Wang et al., 2022). The entire supplementation process, including adding new dams, updating existing dam coordinates, and correcting reservoir storage capacities, increased the total storage capacity of our georeferenced dams by 15 %, and 70 % of the capacity increase comes from the 32 added large dams. For improved clarity, it is worth reiterating that all dams supplemented by Wada et al. (2017) were also documented in the ICOLD WRD. The combined results of geo-matching and geocoding, after the supplementation from Wada et al. (2017), define GeoDAR v1.0, which contains 22 560 georeferenced records in the ICOLD WRD.
2.4.2 Harmonization with GRanD: forming GeoDAR v1.1
While GeoDAR v1.0 largely exceeds GRanD in dam count, a visual comparison of their spatial distributions revealed that the latter is often complementary to (instead of completely duplicated by) the former in many regions of the world. This motivated us to perform a systematic harmonization between the two datasets. The merged version, which we entitled GeoDAR v1.1, combines the merits of GRanD in documenting the world's largest dams and GeoDAR v1.0 in providing extensive spatial details of smaller but more widespread dams.
We assumed that GRanD, by having collated multiple data sources, is superior to GeoDAR v1.0 in the accuracies of both spatial locations and attribute values (particularly reservoir storage capacity) of the world's largest dams. While this may be true for most cases, we identified at least 88 dams in GRanD with possible location errors. With the help of several references such as regional registers (Table 2), the recently published Dataset of Georeferenced Dams in South America (DDSA) (Paredes-Beltran et al., 2021), Google Maps, and other literature and open-access documents, we were able to correct the locations of 76 of these dams and absorbed the corrected coordinates to the harmonization. The other 12 GRanD dams, including 3 duplicates with other dams and 9 we were unable to correct the locations for, were excluded from the harmonization. What was also excluded are another five dams in GranD that were subsumed or replaced by newer dams. For user convenience, we released these ∼ 90 GranD dams together with the identified issues and suggested coordinates (if possible) in Table S5 in the Supplement (full spreadsheet available at https://doi.org/10.5281/zenodo.6163413; Wang et al., 2022). Using the adjusted GRanD data (7303 points), the harmonization (Fig. 5) aimed at (a) improving spatial coordinates of the dam points in GeoDAR v1.0, (b) adding WRD dams that are not georeferenced in GeoDAR v1.0 but are included by GRanD, (c) reducing storage capacity errors in the georeferenced WRD, and (d) absorbing the remaining GRanD dams that are not documented in the WRD. Detailed processing for each of the objectives is given below.
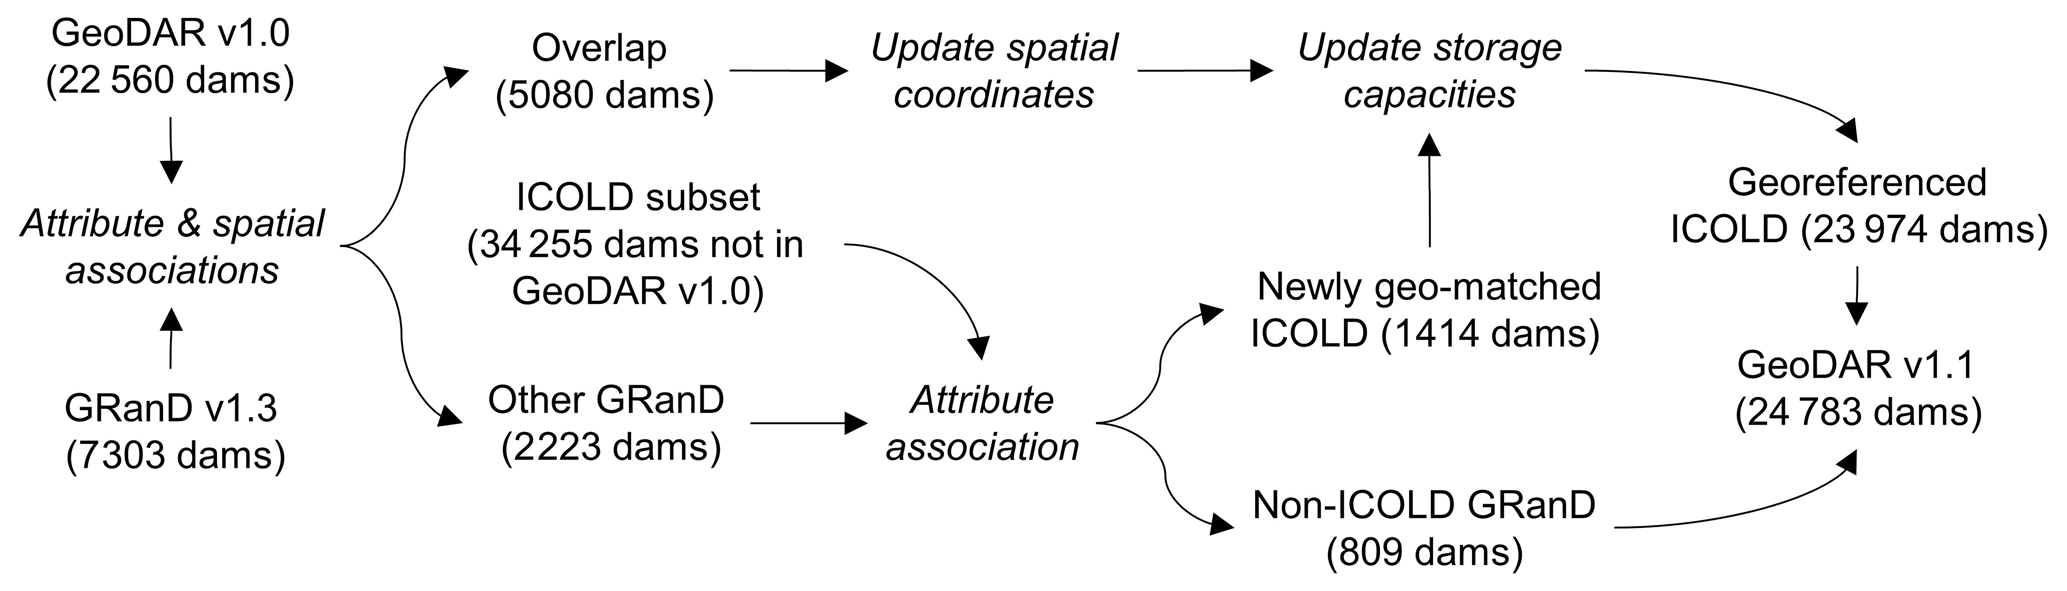
Figure 5Schematic procedure of harmonizing GeoDAR v1.0 and GRanD v1.3 to form GeoDAR v1.1 Text in roman indicates applied or produced datasets, and text in italics indicates methods or procedures.
First, when a dam in GeoDAR v1.0 also exists in GRanD, the spatial coordinates of the former were replaced by those of the latter. We implemented a two-step procedure to identify the overlapping dams between GeoDAR v1.0 and GRanD. Step 1 was based on attribute association, while Step 2 utilized spatial query. Specifically, Step 1 detected the matching records between the WRD and GRanD by assessing their agreements on dam or reservoir names, administrative divisions, impounded rivers, and completion years. The similarity for reservoir storage capacity was also utilized in our manual QC. This step was essentially the same as “geo-matching”, which was used to link WRD records to regional registers for GeoDAR v1.0 (Sect. 2.2). The association results, after a meticulous QC, identified ∼ 4670 dams in GRanD that were georeferenced in GeoDAR v1.0. For the remaining GRanD dams, Step 2 utilized their reservoir polygons to spatially intersect with the dam points in GeoDAR v1.0. A distance tolerance of ∼ 5 km was applied to assist the spatial association and account for possible offsets in GeoDAR v1.0. As part of the QC, the attribute values of each pair (one from GRanD and the other from the WRD) were manually compared to determine whether they are indeed the same dam. This step identified another 400 or so overlapping dams between the two datasets. In total, we found that GeoDAR v1.0 overlaps 5080 out of the 7303 dams in GRanD, and their spatial coordinates were updated to be consistent with those in GRanD.
Second, for the remaining 2223 dams in GRanD that do not overlap GeoDAR v1.0, we assumed that at least part of them could be matched to the WRD records not georeferenced in GeoDAR v1.0. Therefore, we performed another round of attribute association between the remaining subsets of GRanD and the WRD. After QC, this process identified another 1414 WRD dams that are included by GRanD. These additional WRD dams, with a total storage capacity of 603 km3, were then added to our inventory using the spatial coordinates in GRanD. As a result of the first two objectives, GeoDAR v1.1 georeferenced 23 974 (42 %) out of the 56 815 dams in the ICOLD WRD, including 6494 that overlap with GRanD.
Third, to reduce the impact of possible attribute errors in the ICOLD WRD, we next merged the values of reservoir storage capacity from both the WRD and GRanD to a single updated attribute, where the original values in the WRD or Wada et al. (2017) were overwritten by those of the overlapping dams in GRanD (if the GRanD values are valid). This correction led to a minor increase of 86 km3 (1.2 %) in the total reservoir storage capacity. Eventually, the remaining 809 dams in GRanD, which were not found in the WRD, were appended to our georeferenced WRD so that the final inventory absorbed the entirety of GRanD (excluding 17 dams we were unable to utilize; Table S5 in the Supplement). It is worth noting that similar to geo-matching (Sect. 2.2), our attribute association could be conservative, meaning that some of the dams appended from GRanD might be documented in the remaining WRD (the subset not georeferenced successfully). The complete harmonization process, combining the above three steps, led to a total of 24 783 georeferenced dams in GeoDAR v1.1 (Fig. 2b).
2.5 Retrieving reservoir boundaries
Reservoir polygons of the georeferenced dam points were retrieved as thoroughly as possible from three global water body datasets: GRanD reservoirs (Lehner et al., 2011), HydroLAKES v1.0 (Messager et al., 2016), and UCLA Circa 2015 Lake Inventory (Sheng et al., 2016). These three water body datasets exhibit an increasing spatial resolution: from 7000+ polygons in GRanD reservoirs provided exclusively for GRanD's dam points to millions of water body polygons, including both natural lakes and reservoirs, in the other two datasets. While HydroLAKES documents 1.4 million water bodies larger than 0.1 km2 (10 ha), the Landsat-based UCLA Circa 2015 Lake Inventory further reduced the minimum size to only 0.004 km2 (0.4 ha), resulting in another 7.7 million water bodies on the global continental surface. Accordingly, we implemented a hierarchical procedure, where the three water body datasets were applied in ascending order of spatial resolution to retrieve the reservoir boundaries with an overall decreasing size.
Specifically, GRanD v1.3 provides 7162 valid reservoir polygons for the 7303 dam points (after coordinate corrections) used for harmonization. These GRanD polygons were first assigned to their associated dam points in GeoDAR v1.1 through GRanD IDs. Reservoirs of the remaining 17 556 dam points in GeoDAR v1.1, including the 76 GRanD dams with corrected locations (Table S5 in the Supplement), were next retrieved from HydroLAKES when possible. To avoid duplicates in the reservoirs retrieved from different data sources, we only used the subset of HydroLAKES that is spatially independent from (i.e., not intersecting with) GRanD reservoirs. Different from reservoir assignment using GRanD, there was no common attribute ID to pair HydroLAKES polygons with the remaining dam points, so their reservoir retrieval relied completely on spatial association. One major challenge in dam–reservoir spatial association was the ambiguity caused by the offsets between our georeferenced dam points and their actual reservoir polygons (see Sect. 2.3).
To tackle this challenge, we designed a procedure containing three rounds of iteration to progressively optimize reservoir-dam association. This procedure was based on two assumptions, both conditional on a reasonable spatial tolerance. We started with 500 m to be roughly consistent with the Google street map offsets for China. The first assumption was that larger reservoirs are more likely to be documented than smaller ones, in both the ICOLD WRD and Google Maps. Therefore, the first round of iteration assigned each of the dams to the largest water body within the tolerance. This assignment might, however, lead to a situation where multiple dams were assigned to the same reservoir. To untangle this situation, the remaining iterations assumed Tobler's first law of geography (Tobler, 1970): “everything is related to everything else, but near things are more related than distant things” (p. 236). Accordingly, for any water body mistakenly associated with multiple dams, the second round of iteration reassigned the water body to its closest dam, and the other dam(s) within the tolerance, as a result, was/were left unpaired. To reduce the number of such “orphan” dams, a final, third round of iteration assigned the remaining unpaired dams to the next closest water body that was within the spatial tolerance and had not been previously associated with any dams. If this led to multiple dams associated with one reservoir again, only the dam with the closest proximity to the reservoir was kept. Through experimentation, we opted to implement this three-iteration procedure twice, first using a conservative 500 m tolerance to maximize the accuracy for most associations and then a 1 km tolerance to further minimize the number of orphan dams.
This multi-iteration procedure retrieved roughly 7600 reservoir polygons from HydroLAKES. For the remaining dam points left unpaired, we applied the same association procedure to continue retrieving their reservoirs from the high-resolution UCLA Circa 2015 Lake Inventory. Similarly, only the subset that does not intersect with the retrieved HydroLAKES polygons was considered in order to avoid duplicates in the retrieved reservoirs from different datasets. The use of the UCLA Circa 2015 Lake Inventory retrieved another 6700 or so reservoirs.
We followed the automated reservoir retrieval by a manual QC to visually confirm that each retrieved reservoir polygon was matched to the correct dam point, and if not, we corrected the association as thoroughly as possible. This visual QC was particularly necessary for lake-dense regions, including the case of cascade reservoirs immediately downstream or upstream to each other. While some of the dams, such as barrages, diversion infrastructure, and dams under construction, do not have visible impoundments (Lehner et al., 2011), we tried to be as meticulous as possible to verify the orphan dams and recover any missing reservoirs. For instance, we were able to manually retrieve 10 reservoirs (including 4 completed after 2000) from the UCLA Circa 2015 Lake Inventory for the ∼ 70 dams in GRanD v1.3 without reservoir polygons. We also assigned reservoirs to 68 of the 76 GRanD dams with our corrected spatial coordinates. Although no new reservoirs were digitized (all original polygons retrieved from the three water masks), we modified the geometries of some of the reservoirs when necessary. For example, we truncated or split a polygon if we saw its original extent intruding to another reservoir and dissolved several polygons into a multipart feature if they cover the same reservoir surface. We also replaced hundreds of reservoirs initially retrieved from GRanD and HydroLAKES by the polygons in the UCLA inventory to improve the boundary accuracy and completeness.
We here provide a detailed documentation of the components and structure of the GeoDAR versions (v1.0 and v1.1). To facilitate the description, the two GeoDAR versions and their component statistics are explained in Table 1, and spatial distributions of the dam points and reservoir polygons are visualized in Figs. 6 and 7.
3.1 GeoDAR v1.0: dams
GeoDAR v1.0 is a collection of 22 560 dam points georeferenced exclusively for the ICOLD WRD (Fig. 6a). Among them, 13 149 or 58 % were retrieved from geo-matching regional dam registers, 9278 or 41 % from Google Maps geocoding API, and the remaining 133 largest dams from the spatial inventory in Wada et al. (2017) (Fig. 6b). WRD storage capacities of most of these 133 large reservoirs were replaced by the values in Wada et al. (2017) (see Sect. 2.4.1), and unless stated otherwise, our following statistics on storage capacities were calculated after this replacement.
The total reservoir storage capacity of these dams is 6441 km3, meaning that GeoDAR v1.0 georeferenced 40 % of the 56 815 WRD records but included more than 80 % of their cumulative reservoir storage capacity. The total storage capacity of the 133 largest dams from Wada et al. (2017), despite being limited in number, reaches 3900 km3 or 61 % of the cumulative storage capacity in GeoDAR v1.0, and the other ∼ 40 % capacity was split almost equally between the remaining 22 000+ geo-matched and geocoded dams. Although the registers used for geo-matching are regional, the dams in GeoDAR v1.0, as shown in Fig. 6b, are distributed in 151 out of the 165 countries or territories in the WRD, largely owing to our geocoding efforts through Google Maps API. Since the production of v1.0 was largely independent of other global dam datasets such as GRanD, it can also be used to cross-compare, supplement, and potentially improve other dam datasets. Validation of our georeferencing accuracy for v1.0 is provided in Sect. 4.
3.2 GeoDAR v1.1: dams and reservoirs
GeoDAR v1.1 consists of (a) 24 783 dam points (Fig. 6a) representing a full harmonization between GeoDAR v1.0 and GRanD v1.3 and (b) 21 515 reservoir polygons (Fig. 7) based on a one-dam-to-one-reservoir relationship. In these nearly 25 000 dam points, 17 480 or 71 % come from GeoDAR v1.0 alone, 6494 or 26 % are shared by the ICOLD WRD and GRanD, and the other 809 or 3 % are from GRanD alone (Table 1, Fig. 6c). Among the 6494 shared dams, 5080 were georeferenced in both GeoDAR v1.0 and GRanD, and the remaining 1414 were introduced through the harmonization with GRanD. This resulted in a total of 23 974 georeferenced WRD records (42 % of all WRD records) in GeoDAR v1.1. In addition to the expanded number of georeferenced WRD dams, GRanD supplemented another 809 dams which are exclusive of the WRD. The total 2223 dams added by GRanD, notated as “GRanD v1.3 & other ICOLD” and “GRanD v1.3 only” in Fig. 6c, are distributed worldwide and complement v1.0, particularly in regions such as Africa and central Asia, where geocoding using Google Maps was challenging. After this ICOLD–GRanD harmonization, the spatial coverage of the dam points in GeoDAR v1.1 increased to 155 out of the 165 countries in the WRD (also see Table S6 in the Supplement).
As described in Sect. 2.4.2, we substituted the reservoir storage capacities in GRanD for the original capacity values of their overlapping WRD dams. As a result, the total reservoir storage capacity in GeoDAR v1.1 reaches 7384 km3, which compares to ∼ 95 % of the cumulative capacity in the entire ICOLD WRD (see Sect. 5.1 for more comparisons with ICOLD). As reported in Table 1, 81 % (6006 km3) of the total storage capacity in GeoDAR v1.1 is explained by the 5080 large dams georeferenced in both GeoDAR v1.0 and GRanD. The 17 480 smaller dams from GeoDAR v1.0 alone contribute only 7 % (507 km3) of the total storage capacity, which is roughly comparable to the subset from GRanD alone (268 km3) or the subset from GRanD and other ICOLD records (603 km3). These capacity contributions suggest that compared to GRanD, the major improvement of GeoDAR lies in the increased number of relatively small dams rather than the increase in total storage capacity of the dams (see Sect. 5.2 for more comparisons with GRanD).

Figure 6Georeferenced dam points in GeoDAR. (a) A total of 24 783 dam points in v1.1 superimposed by 22 560 dam points by in v1.0. (b) Georeferencing methods and data sources for v1.0. (c) Data sources for v1.1.
Different from GeoDAR v1.0, version 1.1 also includes reservoir polygons for 21 515 or 87 % of the georeferenced dam points (Fig. 7). Reservoir polygons for the remaining 13 % of the dam points were retrieved unsuccessfully due to a combination of factors, including limited spatial resolutions of the applied water masks, missing water occurrence in the masks (when the reservoir water levels are too low), and the fact that some of the dams have no evident water impoundments at all. Nevertheless, the retrieved reservoir polygons have a cumulative area of 496 314 km2, accounting for 98 % of the total reservoir area of all georeferenced dams in GeoDAR v1.1 (reservoir areas without polygons are based on documented attributes). These retrieved reservoirs correspond to a cumulative storage capacity of 7216 km3, also accounting for nearly 98 % of the total storage capacity in v1.1. These statistics indicate that the reservoirs whose boundaries were retrieved unsuccessfully were mostly small in area and storage.
The numbers of reservoir polygons retrieved from each of the three water body datasets are comparable (about 7100–7200 each), but the total reservoir storage capacity and area generally decrease with the increasing spatial resolution of the water body datasets (Table 1). As a result, the mean reservoir polygon size decreased from 63 km2 for those retrieved from GRanD to 2 km2 from HydroLAKES and 5 km2 from the UCLA Circa 2015 Lake Inventory. This result is overall consistent with the design of our hierarchical procedure (Sect. 2.5), where smaller reservoirs were successively retrieved with the help of finer water masks. It is important to note that the retrieved polygons do not always represent the maximum water extents of the reservoirs because water boundaries in the retrieval sources were not necessarily mapped in the maximum inundation periods. For example, the UCLA Circa 2015 Lake Inventory was produced using Landsat images acquired during “lake-steady” periods (Lyons and Sheng, 2018) and thus represents the average seasonal extent of each water body (Sheng et al., 2016). Despite not always being the largest water extents, our retrieved reservoir polygons enhanced the spatial details of global reservoir locations, using which users can further expand or refine the water boundaries to their specific needs.
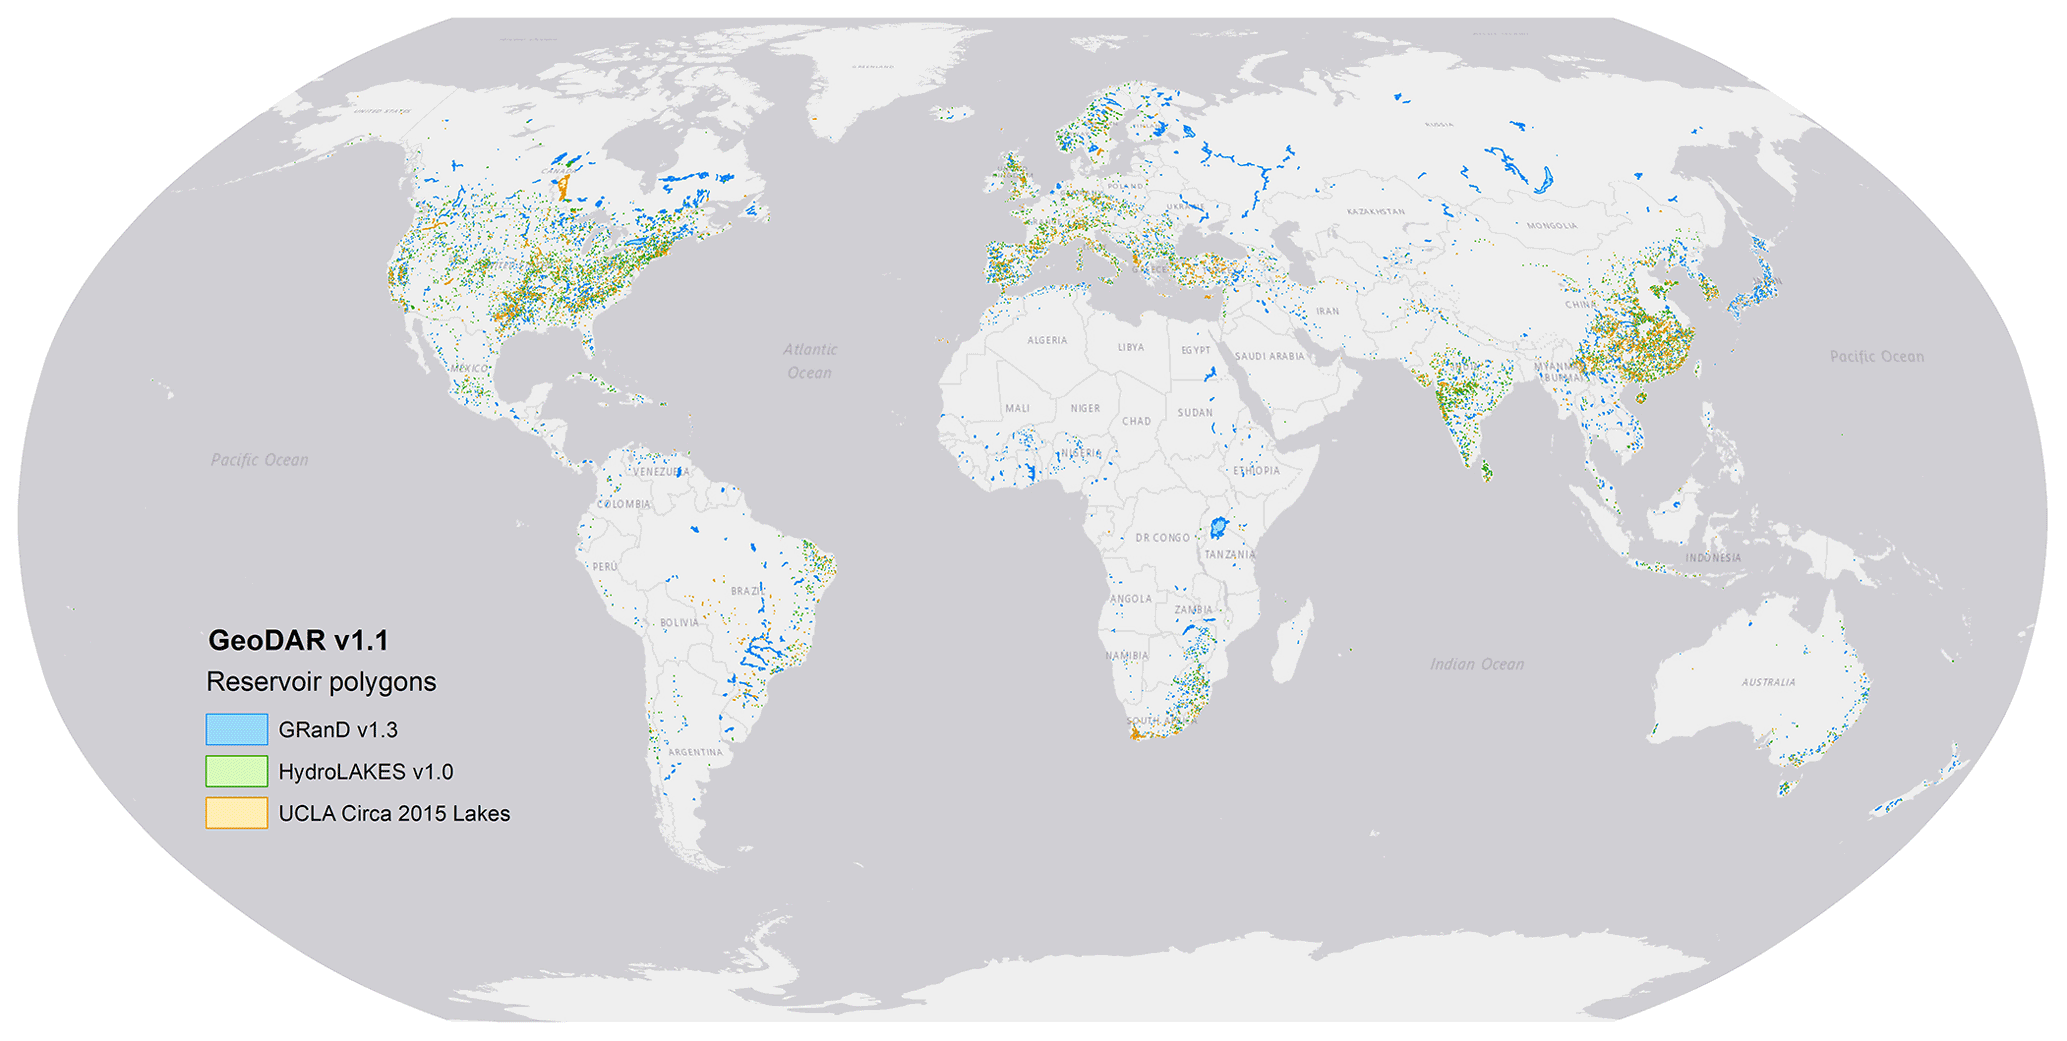
Figure 7Reservoir polygons and their retrieval data sources in GeoDAR v1.1. For display, GRanD polygons are superimposed by HydroLAKES polygons and then by the UCLA Circa 2015 Lake Inventory.
3.3 Attributes and usage
The GeoDAR dataset, including dam points for v1.0 and both dam points and reservoir polygons for v1.1, is provided as three separate shapefiles. For user convenience, we also duplicated the two dam point shapefiles in the comma-separated values (csv) format. The file names and attributes are explained in Table 3. Although most of our dam points were georeferenced using WRD records, our published GeoDAR complies with the legal codes of ICOLD and does not directly release any attribute from the WRD. The attributes we provide in GeoDAR, as listed in Table 3, are limited to our georeferencing methods, QA/QC, validation, and other information (such as spatial coordinates and part of the reservoir storage capacities) that is already open-source or has been permitted for use by the original producers.
Table 3Attributes in the data products of GeoDAR.
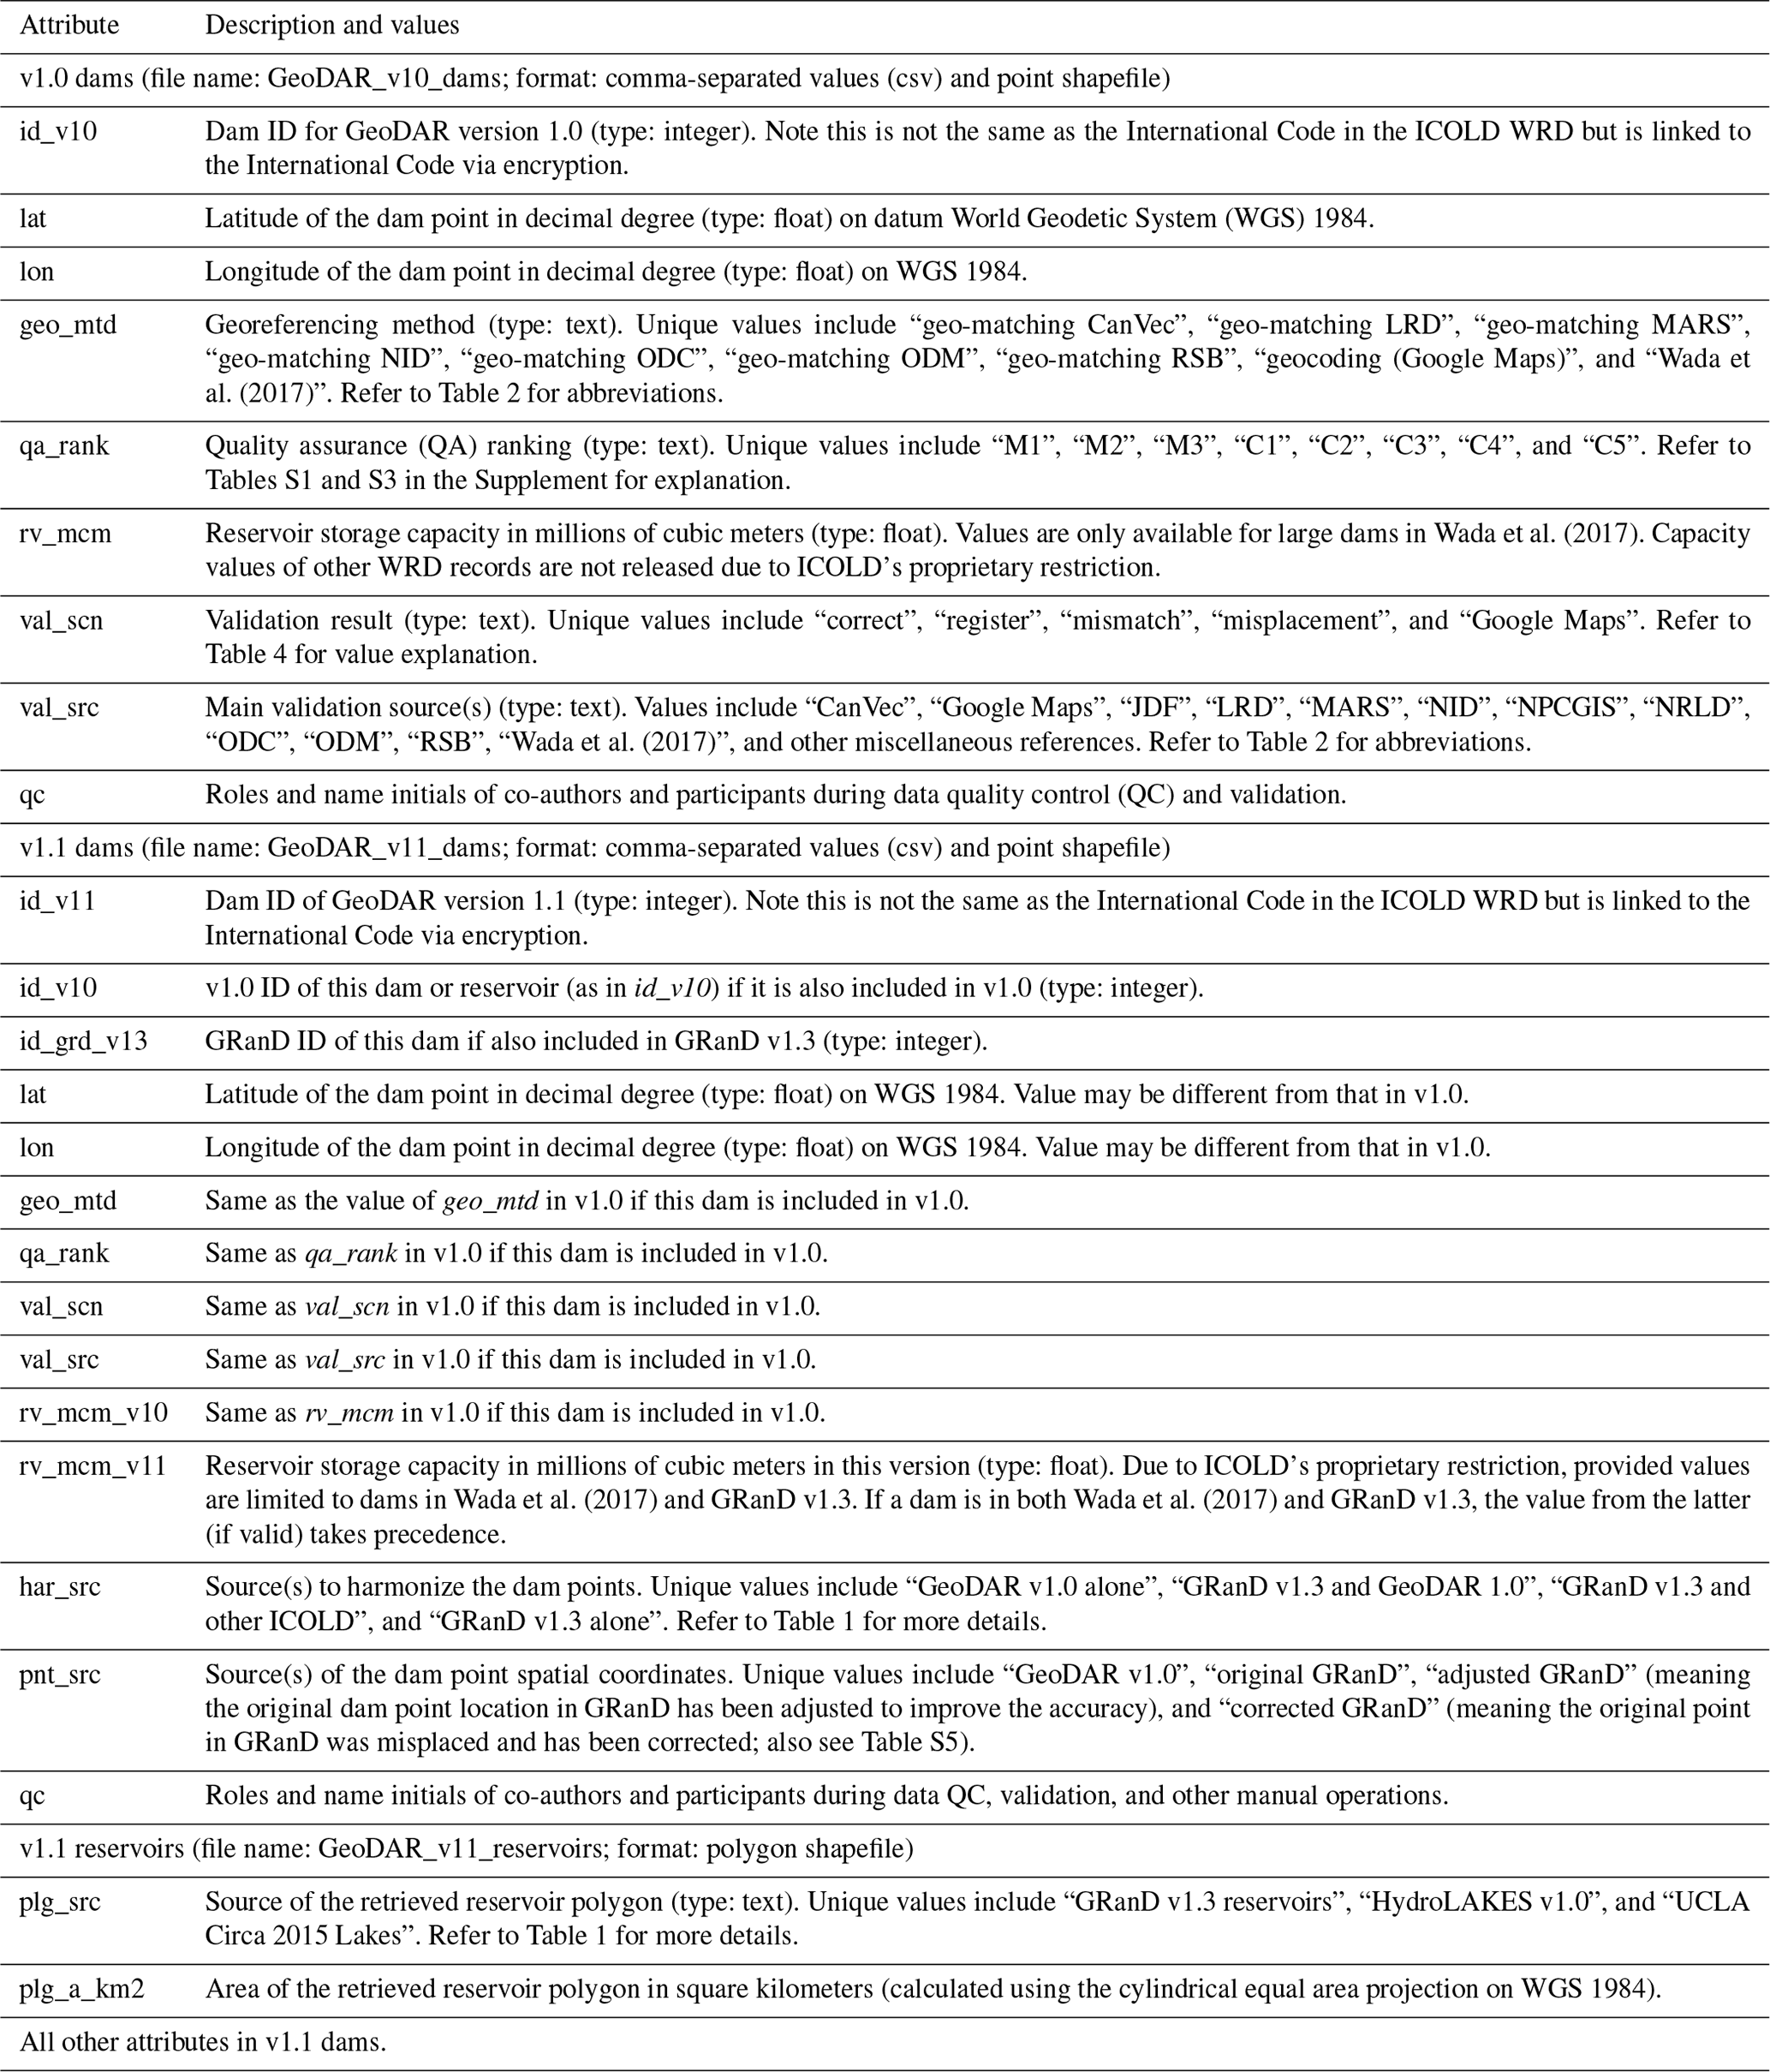
Note: missing or inapplicable values are flagged by “-999” for numeric-type attributes.
Although WRD attributes are not directly available in GeoDAR, we suggest two possible ways for users to acquire at least some of the essential attributes. Upon the user's reasonable request and on a case-by-case basis, we may provide assistance in decrypting the association between GeoDAR IDs (Table 3) and ICOLD's international codes, and using the international codes, the user can link each of the dam or reservoir features in GeoDAR to the entire 40 or so proprietary attributes in the WRD. This is also based on the premise that the user needs to acquire the WRD attribute data from ICOLD themselves and that the user agrees not to release the GeoDAR–WRD association or the WRD attributes to the public. Alternatively, since we imposed no usage restrictions on our spatial features (dam points and reservoir polygons), users are free to integrate them with other datasets and tools, such as remote sensing observations and modeling, to acquire the needed attributes, particularly those not yet documented in the ICOLD WRD. Acquisition methods have been exemplified for at least the following attributes: reservoir hypsometry and bathymetry (Li et al., 2020; Yigzaw et al., 2018); surface evaporation loss (Mady et al., 2020; Zhan et al., 2019; Zhao and Gao, 2019a); operation rules (Shin et al., 2019; Yassin et al., 2019); completion years (Zhang et al., 2019); storage capacities (Liu et al., 2020); and the changes in water area (Pekel et al., 2016; Yao et al., 2019; Zhao and Gao, 2019b), level (Crétaux et al., 2011; Schwatke et al., 2015), and storage or volume (Busker et al., 2019; Crétaux et al., 2016; Gao et al., 2012; Zhang et al., 2014).
In addition to the QA/QC during data production, we performed a posterior validation to further assess the accuracy of the georeferenced ICOLD WRD records. The validation sample consists of about 1400 dam points (Fig. 8), which were selected worldwide from GeoDAR v1.0 and represent the results of our geo-matching and geocoding before GRanD harmonization. The collection of the validation points followed a stratified sampling method (Table 4). From the subset of GeoDAR v1.0 produced by geo-matching, we randomly selected about 40 dam points per geo-matching region (Brazil, Canada, Europe, South Africa, and United States), with the exception of Southeast Asia (Cambodia and Laos), where all 17 geo-matched WRD dams were included for validation. We allowed the sample to occasionally overlap with GRanD because dams in GeoDAR v1.0 were georeferenced independently from GRanD, and those shared with GRanD reflect our georeferencing accuracy for the world's largest dams. However, for each regional sample, we limited the number of GRanD-overlapping dams to no more than 30 % of the entire regional sample size if possible. This was to comply with the size ratio between GRanD and GeoDAR v1.0 (about 1:3) so that our validation still emphasized smaller, newly georeferenced dams. We also randomly selected 40 out of the 133 large WRD dams supplemented by Wada et al. (2017), considering that they are part of GeoDAR v1.0, and the supplementation was based on attribute association similar to regional geo-matching. In total, 260 dams were selected for validating the geo-matching accuracy. For each dam, we manually checked whether its spatial coordinates in GeoDAR v1.0 are consistent with those documented in the geo-matching source (see source references in Table 2).
Table 4Validation statistics for GeoDAR v1.0.

Note: “Error source” lists error scenarios in decreasing order of frequency. “Mismatch” indicates geo-matching errors due to incorrect association between the WRD and the source or reference register. “Register” indicates geo-matching errors due to inaccurate spatial coordinates in the source register (despite correct association). “Misplacement” indicates geocoding errors where the WRD attribute information disagrees with the Google Maps label. “Google Maps” indicates geocoding errors due to endogenous feature labeling mistakes in Google Maps (despite the WRD attribute information and the Google Maps label agreeing with each other). See Table 2 (column “Register or source”) for reference details.
From the remaining subset of GeoDAR v1.0 produced by geocoding, we followed the same stratified sampling scheme and selected 220 to 250 dam points each for China, India, and Japan. Another 450 dam points were sampled from the other regions of the world (Table 4). Compared to geo-matching, which was based on attribute association with georeferenced regional registers, the geocoding process was more complicated and relied largely on the geographic information repository in Google Maps and its embedded geocoding algorithms. To increase our confidence in the geocoding results, we therefore purposefully enlarged the sample size for each validation region. As described in Sect. 2.2, three additional georeferenced inventories for China, India, and Japan were used exclusively for the purpose of geocoding validation (refer to Table 2 for register details). For the remaining regions of the world, the validation was based on a meticulous manual comparison between the WRD information of each sampled dam point and the associated Google Maps label, including the dam or reservoir name, administrative divisions, the nearest town/city, and the impounded river name if possible. When necessary, we also referred to other auxiliary information including open-source gazetteers and other literature. In total, we collected 1153 dam points for validating the accuracy of geocoding, including all ∼230 Japanese dams in GeoDAR v1.0. The distribution of all sampled validation dams is shown in Fig. 8.
As reported in Table 4, our geo-matching accuracy ranges from 88 % to 100 % among different regions, with an overall accuracy of 97 %. Causes of the identified geo-matching errors (see the last column in Table 4) were not always mistakes in our attribute association between the WRD and the georeferenced registers but sometimes inaccurate spatial coordinates provided by the georeferenced registers themselves. An example is Skutvik Dam (completion year 1991) in Norway (Fig. 8), where coordinates are documented to be 68.025∘ N and 15.345∘ E in MARS. However, inspected from high-resolution Google Maps imagery, no dam or reservoir could be conclusively verified at or near this coordinate point, except for three surrounding lakes that are all over 2 km away and labeled with other names (Vanbassenget, Lanstøvatnet, and Stenslandsvatnet). The documented coordinates for this dam are probably inaccurate.
The accuracies of our geocoded samples range from 90 % for Japan to 98 %–99 % for India and China, with an overall accuracy of 95 %. As shown in Table 4, most of the errors were related to the misplacement of the dam or reservoir to another feature, typically a free-flowing river reach, which shares the name and administrative divisions with the dam or reservoir. One example is Nambiar Dam near the city of Tirunelveli in the state of Tamil Nadu, southern India (Fig. 8). The correct coordinates, according to NRLD, are 8.374∘ N and 77.738∘ E, where Google Maps labeled “Nambi Dam” instead of Nambiar Dam. Probably because of this spelling inconsistency, our geocoded coordinates were misplaced on a reach of the Nambi(y)ar River (8.435∘ N, 77.569∘ E; labeled as “Nambiyar”) about 20 km upstream from the dam. Although our recursive geocoding procedure (Sect. 2.3) embedded an automated filter that examines the type of the feature at each returned point, this filter was designed to only eliminate the coordinates where feature types are clearly disparate from a dam or reservoir (such as commercial and residential buildings). Our experiments showed that dams and reservoirs and free-flowing river reaches could both be categorized as “establishment” or “natural feature”, and a feature type that is more specific to dams and reservoirs was hardly seen. Thus, to avoid over-filtering, we allowed a certain ambiguity in the geocoded feature types and then relied on manual QC to correct or remove mistaken coordinates as thoroughly as possible. The misplacement of dams to their upstream and downstream river reaches is a major cause of the relatively low geocoding accuracy in Japan. Through experimentations, we noticed that Google Maps labeling for some of the Japanese dams that are homonymous to their impounded rivers were either lacking or more adapted to the Japanese language. The latter further challenged our geocoding accuracy using English-based ICOLD information. For one of the errors in Japan, we verified from the JDF register that Google Maps mislabeled Myojin Dam in Horoshima Prefecture (34.587∘ N, 132.505∘ E) as “Nabara Dam”, whose correct location is 3 km downstream (34.563∘ N, 132.517∘ E; Fig. 8). As a result, our georeferenced coordinates for Nabara Dam were wrong, although our geocoding process was correct. However, given what we have observed, such endogenous labeling errors in Google Maps are probably rare.
Integrating the validations for both geo-matching and geocoding, our overall georeferencing accuracy is 95.3 % in terms of dam count or 99.0 % in terms of total storage capacity based on the sampled 1413 dams. While these statistics can be considered to be an accuracy measure of our data product, the identified errors in the validation sample have been corrected wherever possible or otherwise removed in our released GeoDAR v1.0 and v1.1 (for simplicity, our reported statistics for QC have considered this additional correction). To reflect the accuracy of GRanD harmonization, we also randomly sampled another ∼ 100 dams in v1.0 that were associated with GRanD in v1.1 and identified no association errors among them.
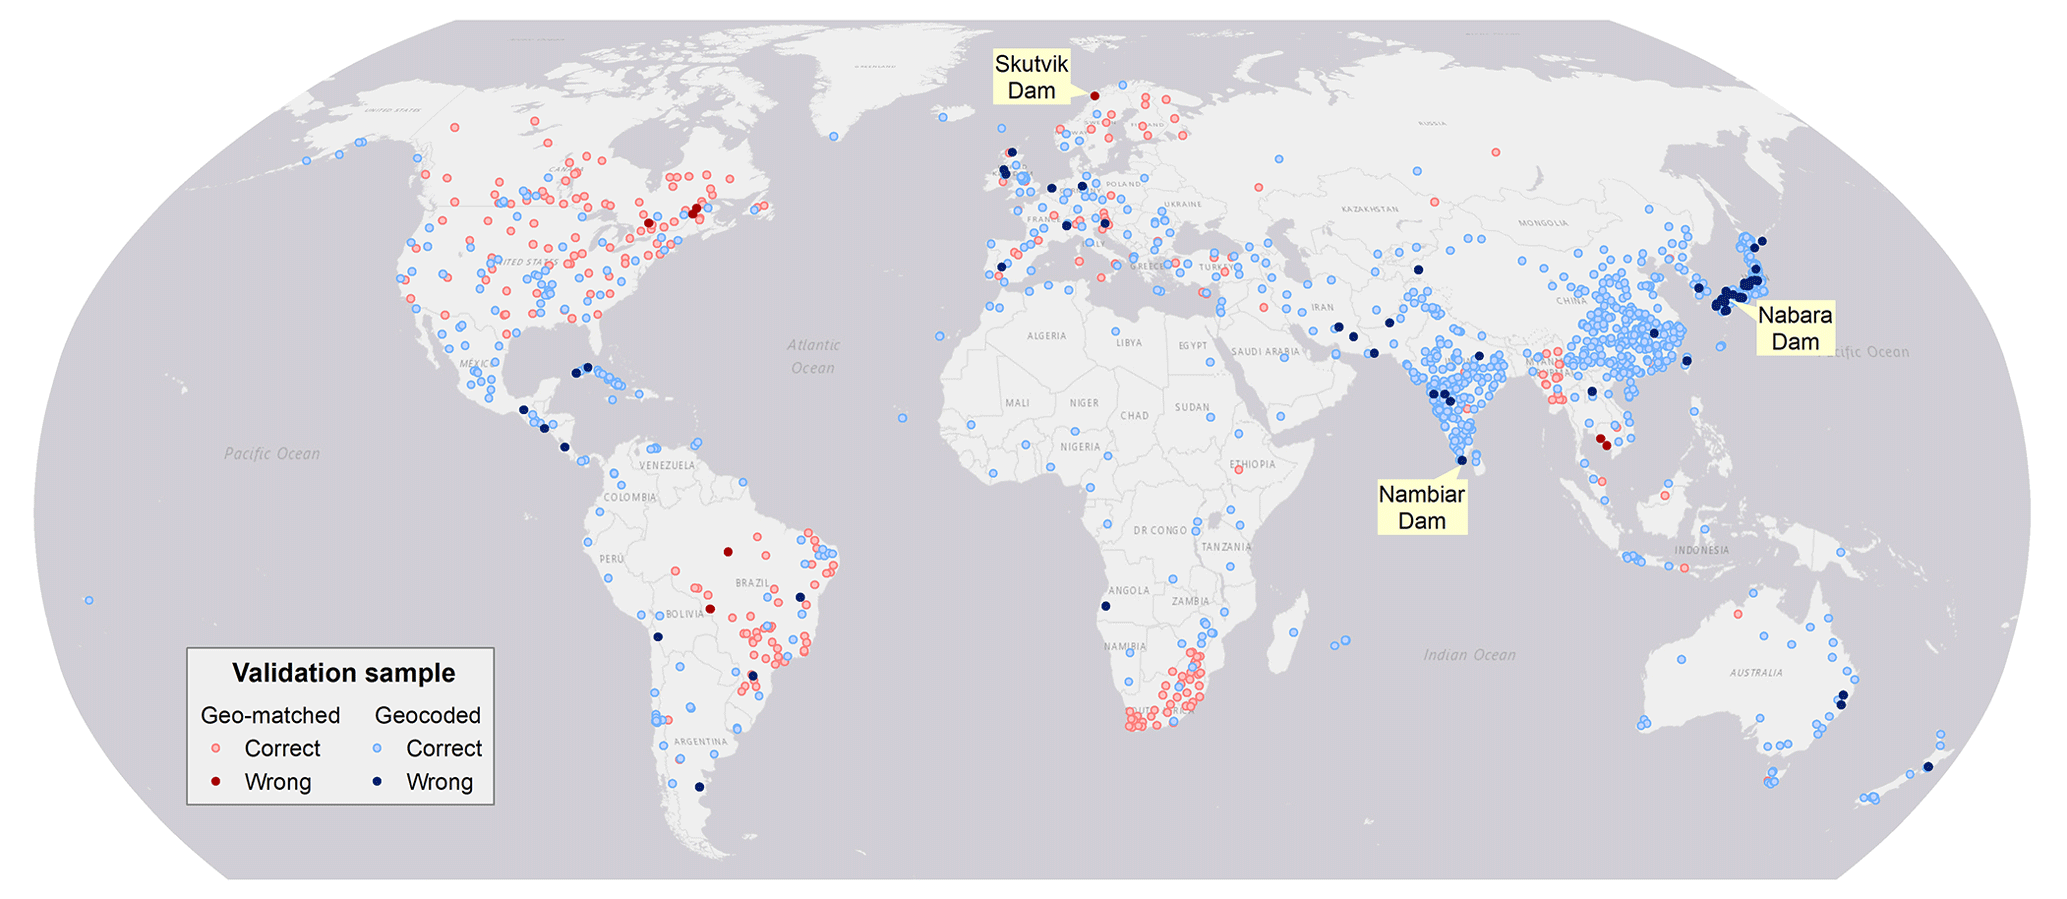
Figure 8Validation sample and results for GeoDAR v1.0. The validation sample consists of 1413 georeferenced ICOLD dams, including 260 dams from geo-matching and 1153 dams from geocoding. The dam points labeled as georeferencing errors are displayed at their corrected locations if possible. See Table 4 for detailed validation statistics.
To better understand the improvements and potential applications of GeoDAR, we compare it with three major global dam and reservoir datasets: the complete ICOLD WRD, GRanD (v1.3), and GOODD (V1). To recap the pros and cons of each dataset, ICOLD WRD documents over 56 000 unique dam records with a broad suite of attributes, but the provided records are not georeferenced. GOODD depicts the spatial details of more than 38 000 dam points and their catchments but does not include any other attribute. GRanD is georeferenced and provides multiple essential attributes, but the records are limited to 7320 large dams. Accordingly, our comparison first emphasized the aspects of dam quantity, reservoir area, and if applicable the spatial pattern and distribution of the dams. These aspects are openly available from the spatial features (i.e., dam points and reservoir polygons) in GeoDAR. Considering that each GeoDAR feature is also linked to a WRD or GRanD record which contains detailed attributes, our comparison also includes two important attributes, i.e., reservoir storage capacity and catchment area, to help inform the extended capability of GeoDAR once it is linked to the WRD attributes.
5.1 Comparison with the ICOLD WRD
Despite our efforts to integrate multi-source registers and the Google Maps geocoding API, georeferencing the ICOLD WRD, particularly smaller dams in poorly documented regions, has proven to be challenging. This challenge was reflected by the proportion of the WRD that was spatially resolved in GeoDAR. As compared in Table 5, GeoDAR v1.0 included 40 % of the 56 815 records in the entire WRD. Although limited in number, these georeferenced dams were a compromise between geocoding quality and thoroughness (see Sect. 2.2 and 2.3) and account for ∼ 84 % of the total reservoir storage capacity in the WRD. The larger proportion in terms of storage capacity indicates that most of the sizable dams in the WRD have been spatially resolved. This message is also corroborated by Fig. 9. Nearly 70 % of the 12 412 WRD dams larger than 10 mcm, for example, have been georeferenced in GeoDAR v1.0 (Fig. 9a). While 80 % of the 21 849 WRD dams smaller than 1 mcm were not georeferenced, these smaller dams account for just 1 % of the total WRD storage capacity (Fig. 9b). After harmonization with GRanD, the proportion of the WRD georeferenced in GeoDAR v1.1 increased to 42 % by count or 92 % by storage capacity (Table 5), and these percentages represent our best result for georeferencing the WRD. By absorbing the remaining dams in GRanD as well, v1.1 has a total dam count equivalent to 44 % of the WRD and a cumulative storage capacity less than 5 % below that of the full WRD (Table 5, Fig. 9b). Compared to v1.0, the margin between the distribution curves of GeoDAR v1.1 and the WRD, particularly for relatively large dams, was further reduced (Fig. 9a). As a result, the number of dams larger than 10 mcm in GeoDAR v1.1 exceeds 80 % of that in the WRD, and the number of dams larger than 1 mcm reaches 60 % of that in the WRD.
Table 5Summative comparisons among the ICOLD WRD, GRanD, and GeoDAR.
Note: we applied the following adjustment throughout Sect. 5 to improve consistency in data comparison. When a dam is documented in both GRanD and the WRD, the attribute values in GRanD (if valid) took precedence (meaning that WRD values were replaced by GRanD values). This explains the minor difference (∼1 %) between the total storage capacity of GeoDAR v1.0 in this table (6513.2 km3) and that in Table 1 (6440.6 km3). If a WRD record is still missing the reservoir area attribute but has a reservoir polygon, the polygon area was used in calculating area statistics for the WRD. Reservoir area statistics for GeoDAR v1.1 were based on the retrieved polygons only. Statistics for GRanD are based on the entire original records in v1.3.
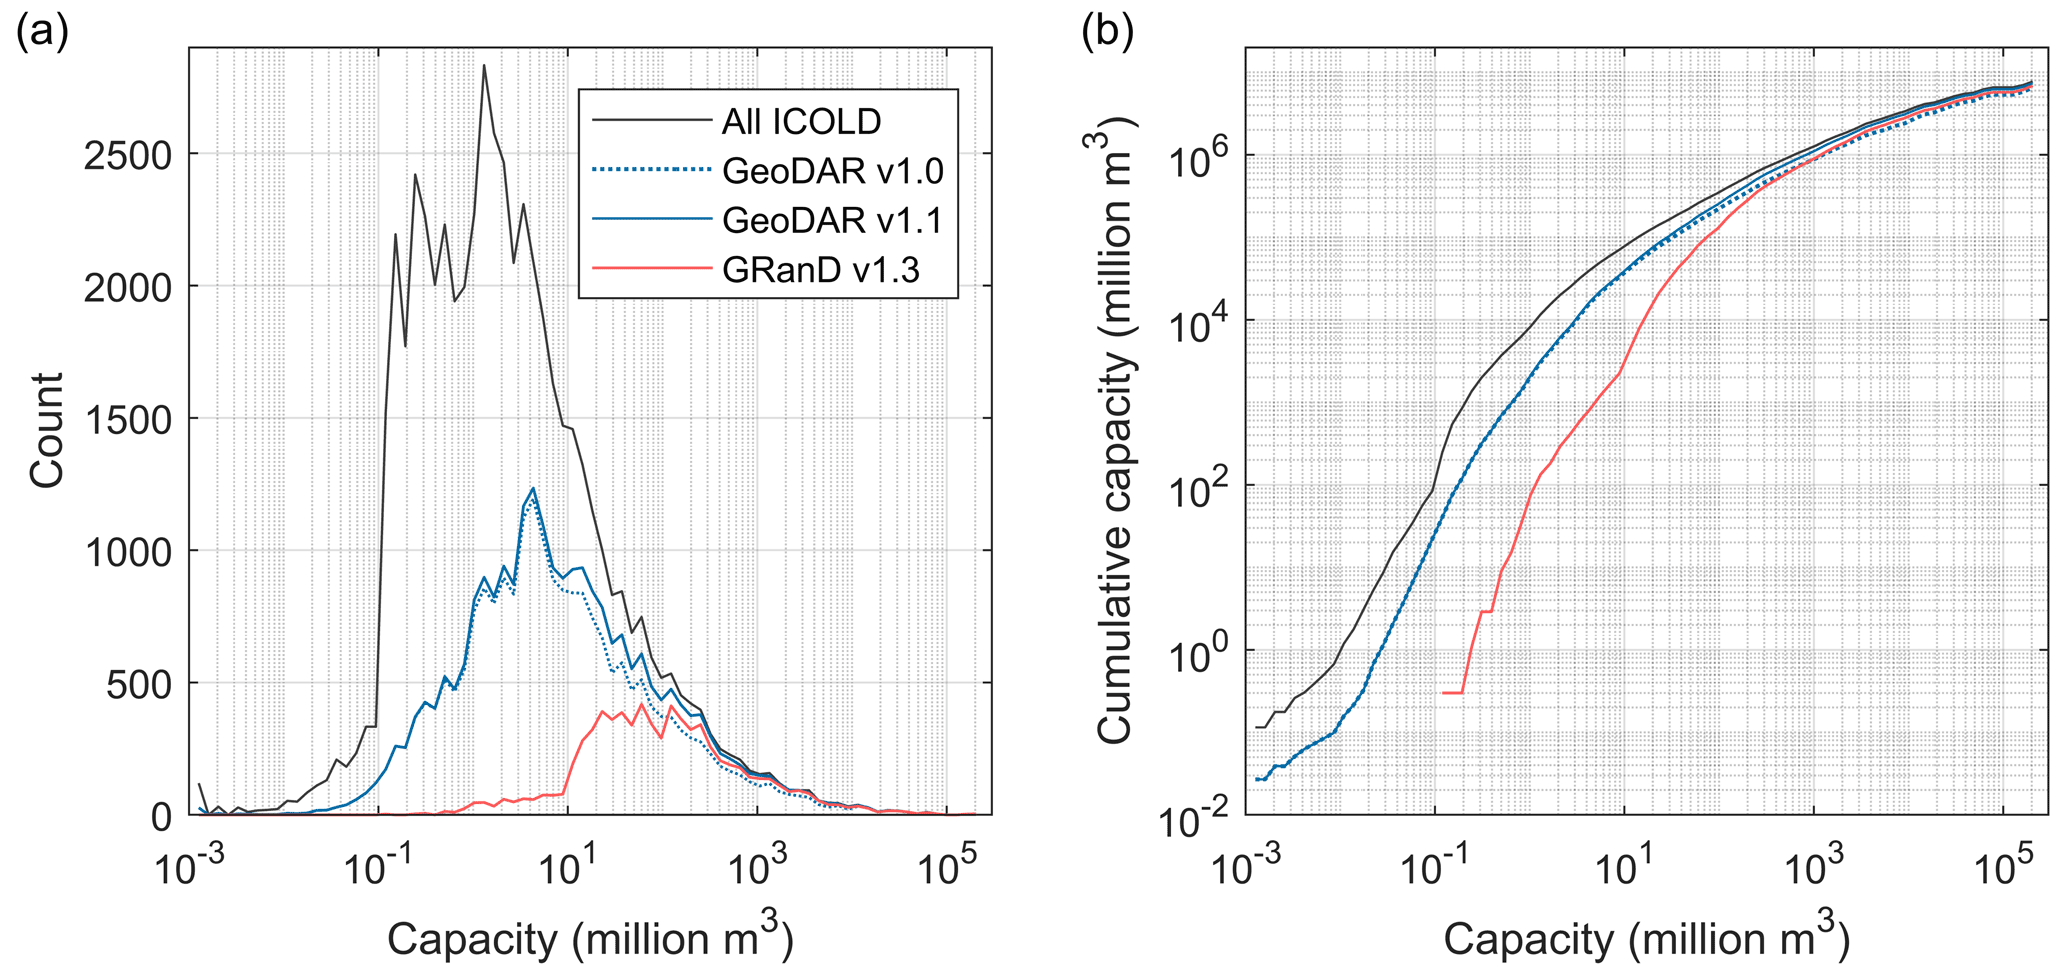
Figure 9Comparison among GeoDAR, the ICOLD WRD, and GRanD by reservoir storage capacity. (a) Frequency (count) distribution. (b) Cumulative (integral) storage capacities. Statistics were based on 80 equal-size bins (except the initial bin) on a logarithmic scale between the minimum and maximum storage capacities (i.e., 0 to 2.05×10⁵ mcm).
The spatial coverage of GeoDAR, in comparison with the WRD, was summarized for each of the 165 countries with registered WRD records (Fig. 10). Our comparison focused on GeoDAR v1.1 as it represents an improved version of our spatial dam inventory. Among these 165 countries, the median of GeoDAR v1.1 coverage by dam count, i.e., the number of dams in GeoDAR v1.1 as a proportion of the number of dams in the WRD, is 62 %, with the first and third quartiles being 35 % and 89 %, respectively. As shown in Fig. 10a, better coverages tend to occur in North America, Europe, Russia, Australia, and part of South America and Africa, whereas poorer coverages are seen in East Asia, South Asia, and part of the Middle East. The coverages in China and India, for example, are only about 22 %–26 % due to a large quantity of WRD records for these two countries (23 749 in China excluding Taiwan and 5074 in India) but relatively limited information on Google Maps. Compared with dam counts, GeoDAR's coverage for reservoir storage capacity is higher overall (Fig. 10b). Among the 158 countries with documented reservoir storage capacities, the median coverage in GeoDAR reaches 98 %, with the first and third quartiles being 87 % and 100 %, respectively. If we exclude the 809 dams supplemented by GRanD alone and only consider the WRD portion of GeoDAR v1.1, the coverage becomes overall lower but by a limited extent (Fig. S1 in the Supplement). Among these countries, the median coverage of WRD dams by GeoDAR v1.1 is 59 % (with 33 % and 83 % as the first and third quartiles) in terms of dam count and 96 % (85 % and over 99 % as first and third quartiles) in terms of reservoir storage capacity, suggesting that a substantial proportion of the WRD had been georeferenced in many countries before the additional supplementation from GRanD. More detailed comparisons (among ICOLD, GranD v1.3, and GeoDAR v1.3) for each of the 165 countries are given in Table S6 in the Supplement.

Figure 10GeoDAR (v1.1) as a proportion of the ICOLD WRD for each country or territory. (a) By dam count and (b) by reservoir storage capacity. Statistics for Taiwan and Greenland were computed separately from mainland China and Denmark (the same for Figs. 14 and S1 in the Supplement).
Catchment areas of the reservoirs often indicate the stream order of the impounded river and thus the scales of flow and sediment alterations by the dam. Locating dams with an improved representation of catchment areas, particularly smaller ones, has been increasingly needed by hydrologic modeling and watershed management (Grill et al., 2019; Lin et al., 2019). To evaluate how GeoDAR spatially resolved the WRD in this aspect, we directly used the values of “catchment area” provided in the attributes. As many records in the WRD are missing catchment areas, we combined the available values in both the WRD and GRanD, and when a dam has catchment areas in both datasets, we preferred the value in GRanD. As reported in Table 5, the subset of the WRD georeferenced in GeoDAR v1.1 has a total catchment area of 140×106 km2, which covers 94 % of the total catchment area in the WRD. The remaining 6 % gap was largely closed by the inclusion of the remaining non-WRD dams from GRanD. It is worth mentioning that these statistics do not take into account the dams without documented catchment areas. While it is possible to retrieve catchment boundaries for GeoDAR dams (e.g., using DEM as per Mulligan et al., 2020), acquiring accurate catchment areas of the other WRD dams (which have not been georeferenced) is prohibited due to unknown locations. Therefore, our comparison was only based on the attribute values that are already available. This explains why GeoDAR georeferenced fewer than half of the WRD records by count but included more than 90 % of the total catchment area. Similar to the pattern of reservoir storage capacity, higher proportions of the WRD catchment area covered by GeoDAR are skewed towards the dams with larger catchment areas (Fig. 11a). For example, the number of dams with a catchment area larger than 10 km2 in GeoDAR equals 89 % of that in the WRD, and the coverage increases to 95 % for the dams with a catchment area larger than 100 km2.
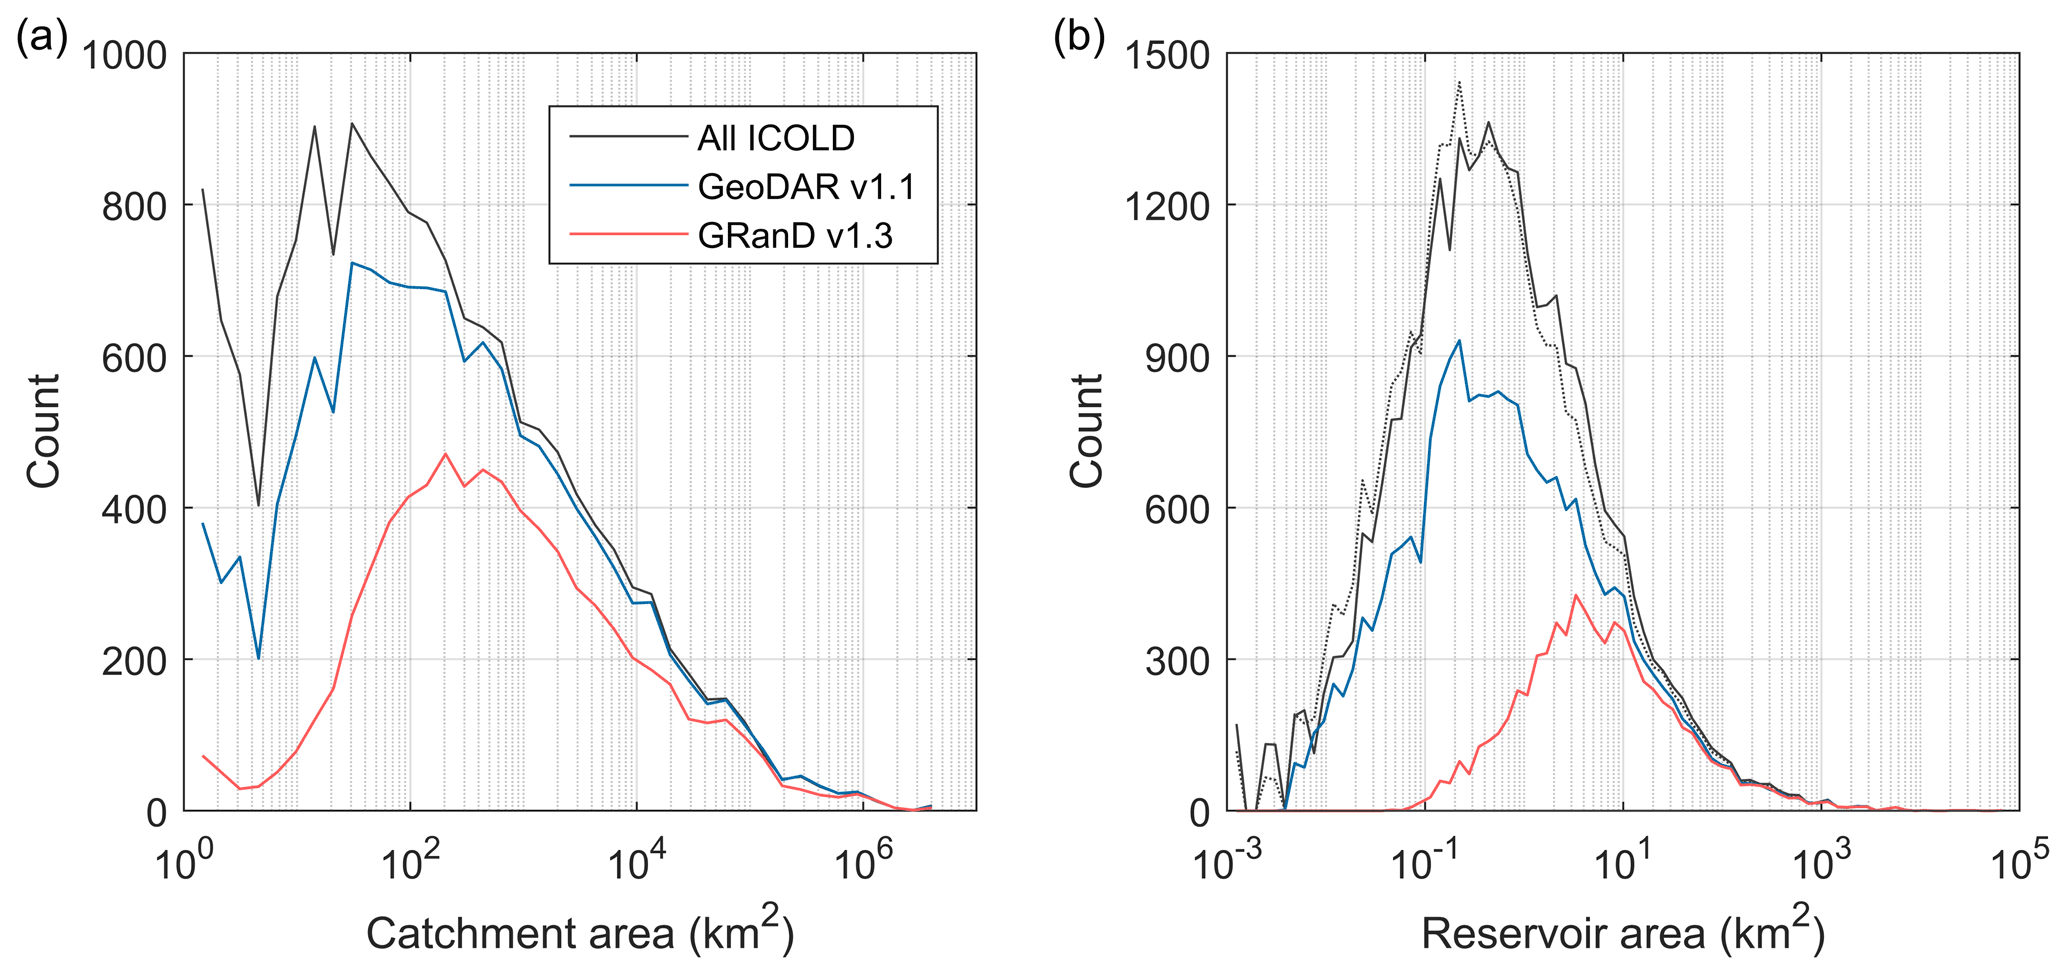
Figure 11Comparison among GeoDAR, the ICOLD WRD, and GRanD by reservoir catchment area and reservoir area. (a) Frequency (count) distributions by reservoir catchment area. Statistics were based on 40 bins between the minimum and maximum catchment areas (i.e., 0 to 4.04×10⁶ km2). (b) Frequency distribution by reservoir area. Statistics are based on 80 bins between the minimum and maximum reservoir areas (i.e., 0 to 6.72×10⁴ km2). All bins (except the initial one) are of equal size on a logarithmic scale. Considering that catchment areas are often missing in the WRD, a smaller bin size was used to generate smoother distribution curves. Reservoir areas for GeoDAR were based on mapped polygons, whereas reservoir areas for the WRD were based on attribute values when available (see note for Table 5). For comparison, the dotted curve in panel (b) shows an alternative distribution where the polygons took precedence in presenting reservoir areas for the WRD.
Although GeoDAR does not include reservoir catchment boundaries, it does provide reservoir polygons for 87 % of the georeferenced dam points. As reported in Sect. 3.2, the remaining 13 % of the dam points without reservoir polygons, if inferred from their available attribute values, yield a reservoir area that is only ∼ 2 % of the total reservoir area of all GeoDAR dams. For this reason, we focus on the retrieved reservoir polygons for comparing how GeoDAR v1.1 represents the reservoir areas in the entire ICOLD WRD. Among the 21 515 polygons, 20 718 (96 %) are associated with georeferenced WRD dams. These retrieved WRD reservoirs have a total area of 476 603 km2, accounting for 90 % of the cumulative reservoir area in the WRD (Table 5). After supplementation of the remaining polygons (for dams in GRanD alone), the total reservoir area reached 496 314 km2, equivalent to 93 % of the cumulative reservoir area in the WRD. Like other attributes, the values of reservoir area are not always available in WRD records. If a WRD record is missing its area attribute value but has a reservoir polygon, we used the area of the reservoir polygon as the de facto reservoir area in calculating WRD statistics (see note for Table 5), and the other WRD records still missing reservoir areas probably contribute a minuscule fraction of the aggregated area. This way, we are essentially comparing the areas of the mapped reservoir polygons in GeoDAR v1.1 with the documented reservoir areas in the WRD. Since our retrieved reservoir polygons are not always at the maximum inundation extents, the comparison includes the uncertainties due to water mapping and errors in the WRD attributes. If we replaced the attribute reservoir areas by our polygon areas, the coverage increased from 93 % to nearly 96 % (dotted curve in Fig. 11b), indicating a global mean bias (underestimation) of about 2 %–3 % in our reservoir polygons. Keeping these limitations and uncertainties in mind, we showed in the distribution curves (Fig. 11b) that the number of GeoDAR reservoir polygons accounts for 68 % of all WRD records that have reservoir area values (either documented or de facto), and consistent with the distributions of other attributes, higher coverages for reservoir area tend to occur for larger reservoirs. For example, GeoDAR retrieved 8263 reservoirs larger than 1 km2, which account for 73 %–80 % of those in the WRD. The coverage increases to 87 %–92 % for reservoirs larger than 10 km2, although the reservoir polygon number decreases to 2570.
5.2 Improved spatial density over GRanD
While GRanD emphasized dams larger than 100 mcm (or 0.1 km3), GeoDAR aimed to georeference WRD records which, by definition, have a minimum storage capacity of 3 mcm or smaller if the dam is higher than 15 m (see Sect. 1). This reduced storage threshold entailed a substantial increase in the dam quantity in GeoDAR. As compared in Table 5, GeoDAR v1.0, which was generated independently from GRanD, is already more than triple the dam quantity in GRanD (7320) and accounts for 95 % of the total reservoir storage capacity in GRanD (6881 Gt). With the harmonization with GRanD, the number of dams in GeoDAR v1.1 reaches 339 % of that in GRanD, with a total reservoir storage capacity also exceeding 7 % of that in GRanD. This comparison suggests that the improvement of GeoDAR is mainly manifested as the increased dam quantity rather than reservoir storage capacity.
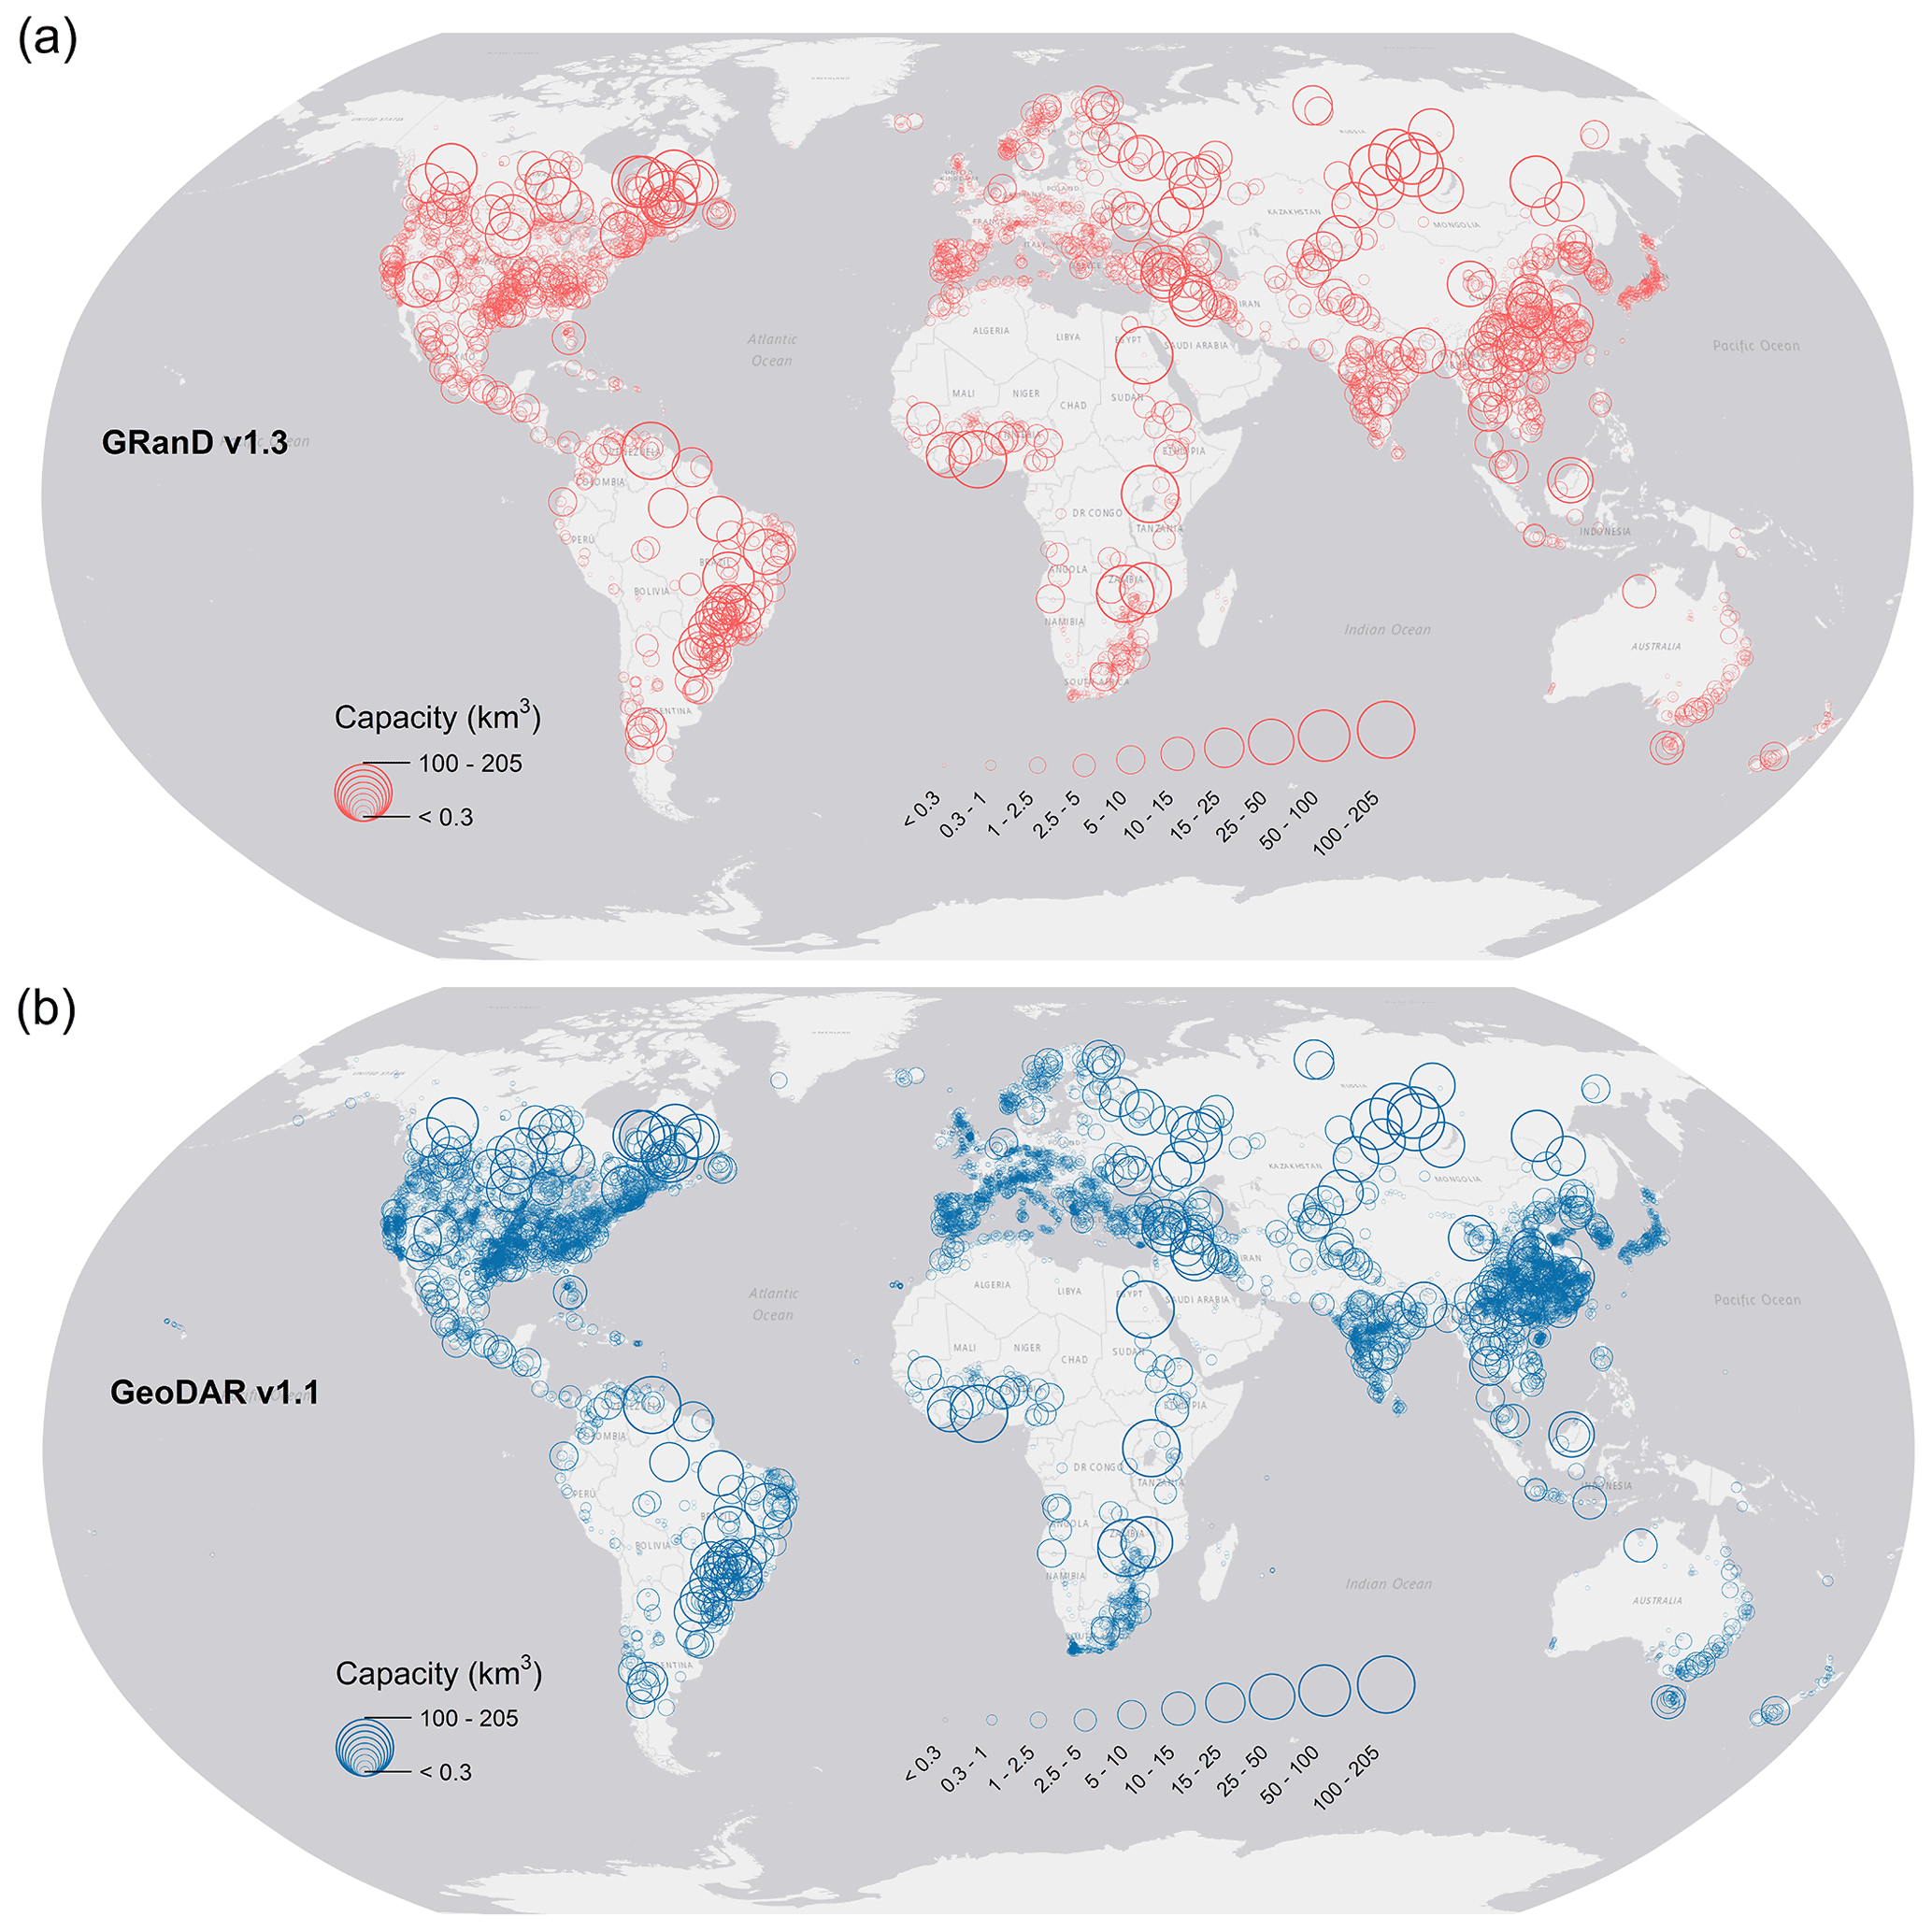
Figure 12Global distribution of reservoir storage capacities of georeferenced dams. (a) GRanD v1.3 and (b) GeoDAR v1.1. Displayed are 7312 out of the 7320 dams in GRanD v1.3 and 24 174 out of the 24 783 dams in GeoDAR v1.1 with documented or estimated reservoir storage capacities.
The increased dam quantity in GeoDAR is manifested as a ubiquitous improvement of the spatial density of smaller dams worldwide (Fig. 12). Since GeoDAR v1.1 has absorbed GRanD v1.3, the global patterns for capacious reservoirs are overall similar between the two datasets. What is noticeably different are the proliferated density of thousands of smaller reservoirs, particularly those beyond the main focus of GRanD (such as those smaller than 100 mcm). The substantial increase in smaller dams and reservoirs is corroborated by the distribution curves in Fig. 9a, where the mode storage capacity (i.e., the capacity corresponding to the peak frequency) shifted from about 100 mcm in GRanD to about 3–5 mcm in GeoDAR (both v1.0 and v1.1). The area between the distribution curves is largely explained by the addition of ∼ 16 500 dams smaller than 100 mcm in GeoDAR v1.1 (Fig. 9a), which correspond to a total storage increase of 124 Gt or 95 % of the total storage of the dams smaller than 100 mcm in GRanD (Fig. 9b). It is important to note that the added reservoirs in GeoDAR still comply with ICOLD's definition of “large dams” (see Sect. 1). Although their aggregated storage is limited, these relatively small reservoirs are geographically widespread, meaning that they are locally significant for filling service gaps between more sporadic larger dams. Examples include hundreds of smaller dams and reservoirs that provide irrigation from southern Europe (Fig. 13b) to northwestern and central India (Fig. 13c), hydropower and water usage in central and southern China (Fig. 13a), and flood controls across the Mississippi River basin and southern Texas in the US (Fig. 13d). The sheer number of these added smaller dams and reservoirs accentuate the benefits of an improved knowledge of their spatial locations, such as what GeoDAR offers, for strategizing water and energy management and assessing fragmentation of the river ecosystems (Belletti et al., 2020; Grill et al., 2019).
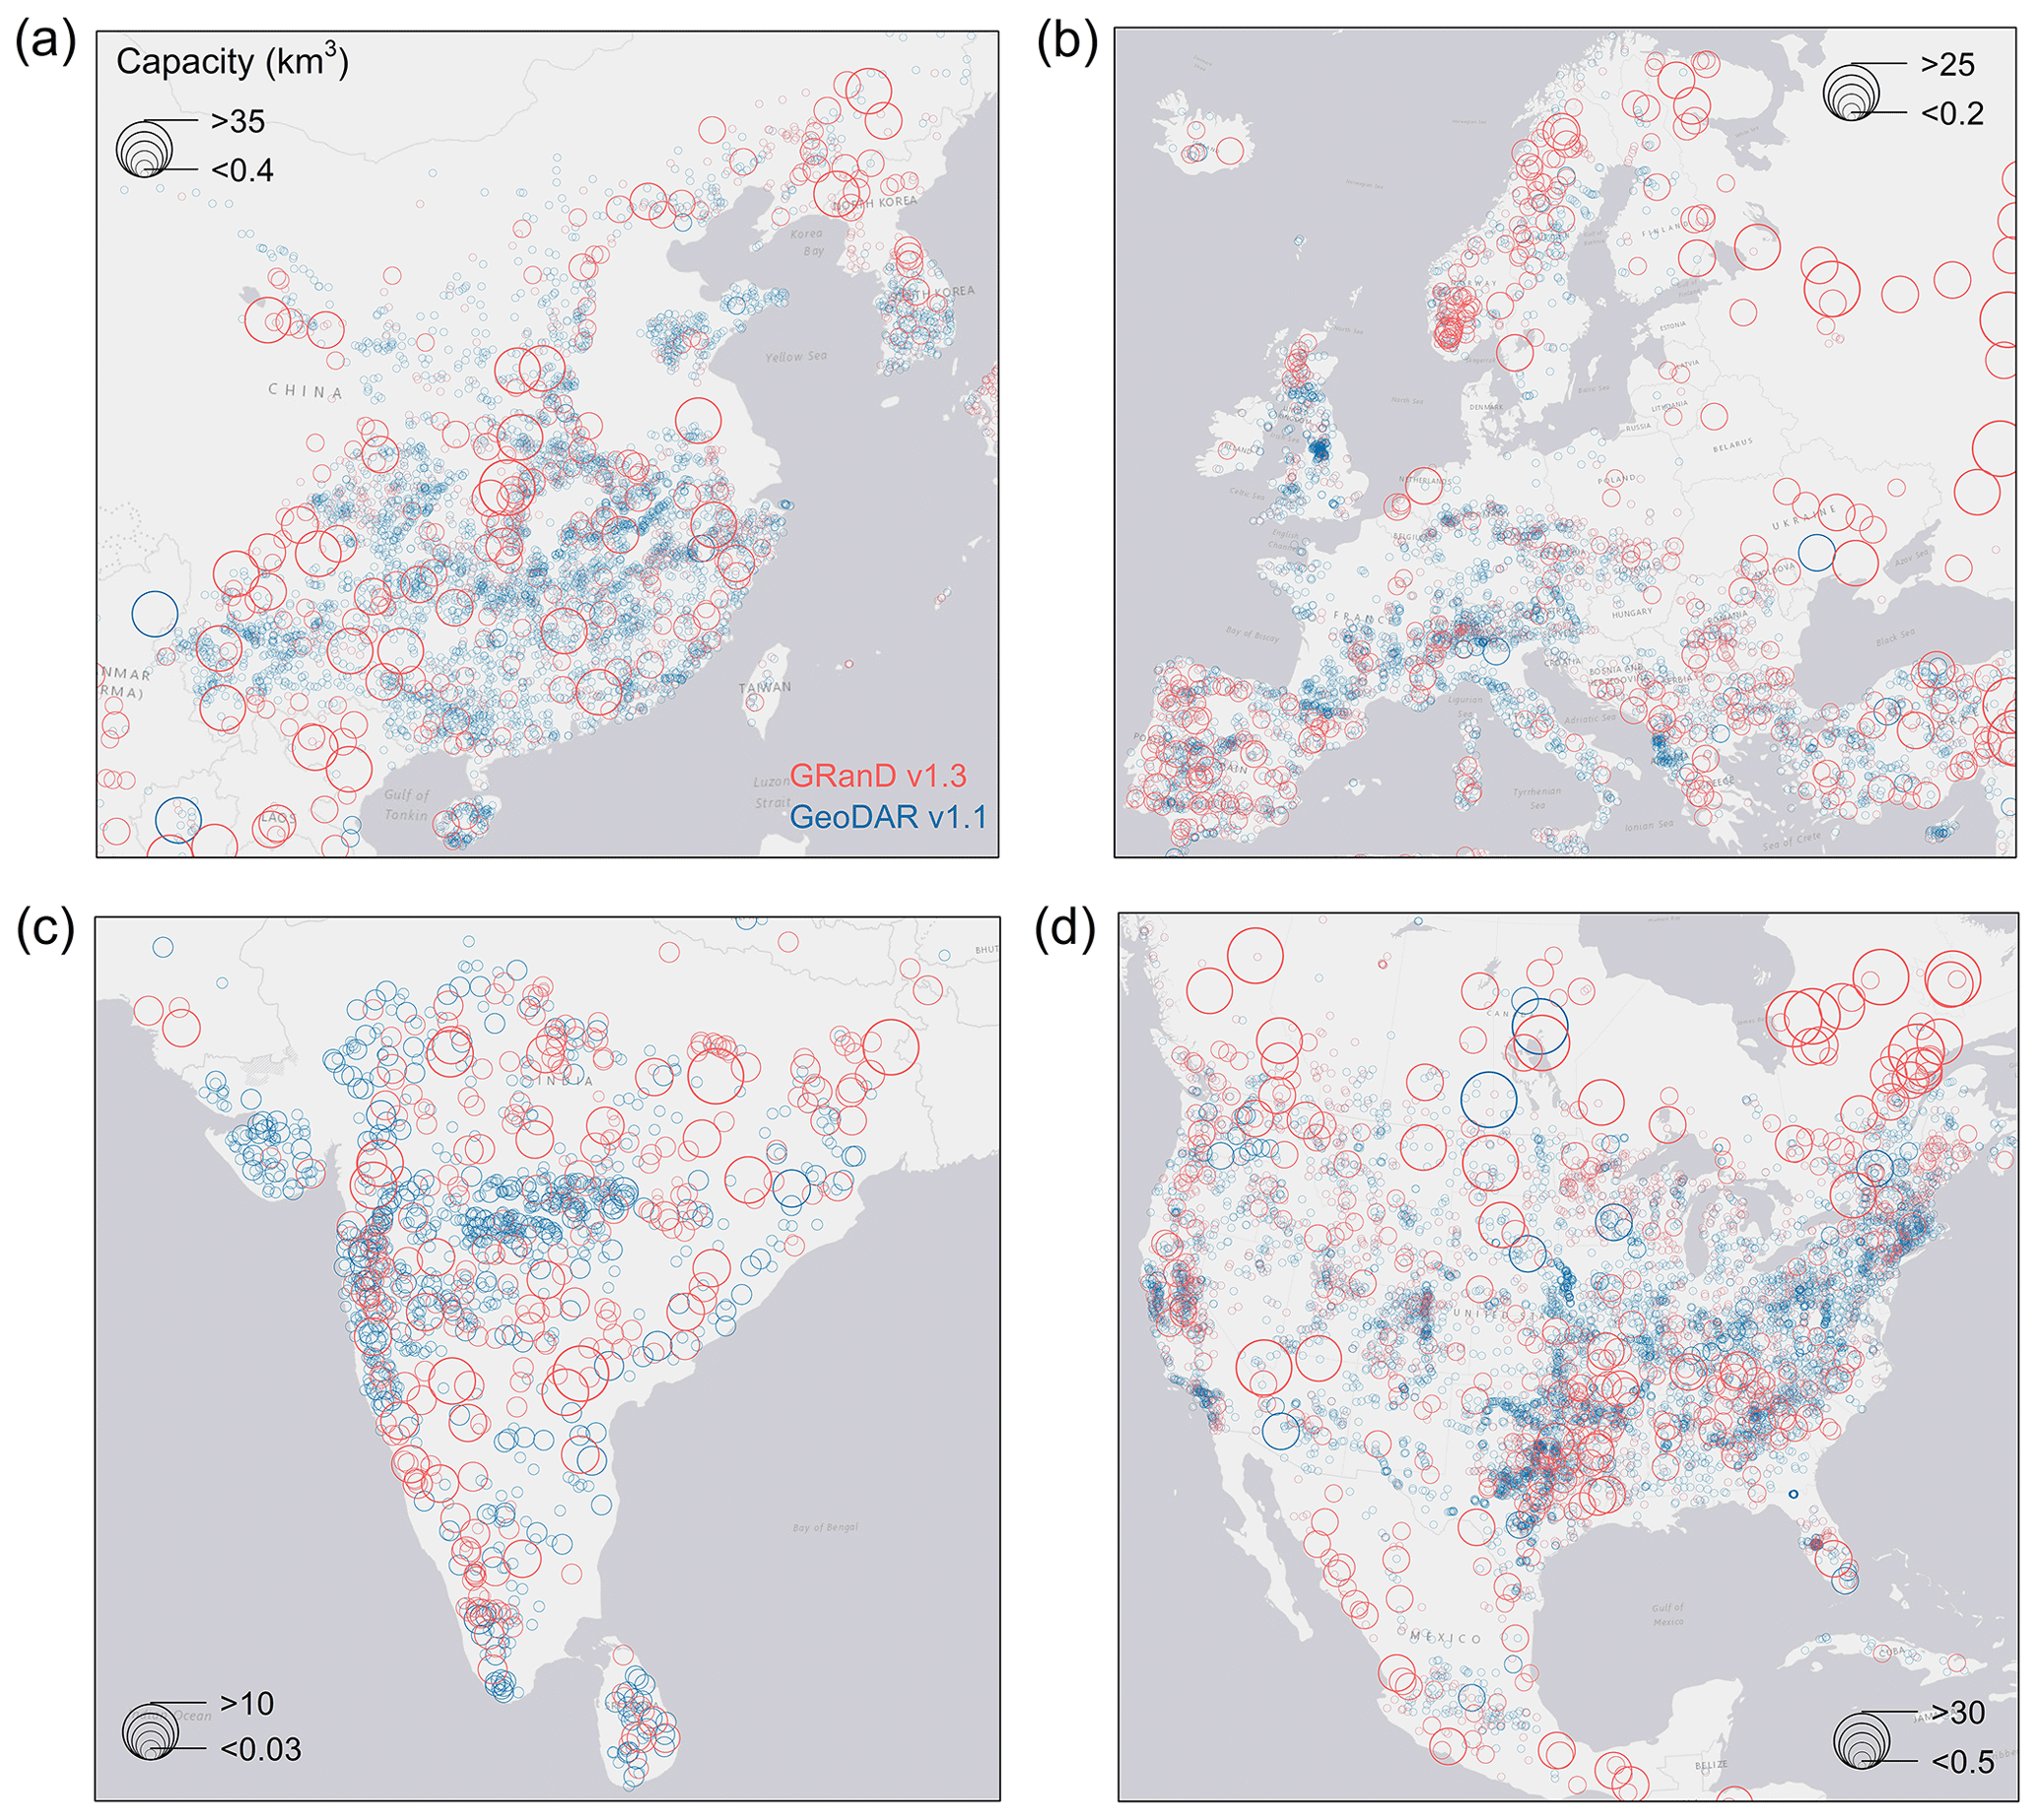
Figure 13Regional distributions of reservoir storage capacities in GRanD v1.3 and GeoDAR v1.1. (a) China and its surrounding East and Southeast Asia. (b) Europe. (c) India and its surrounding South Asia. (d) US and its surrounding North America. Graduated symbols for GeoDAR (blue bubbles) are superimposed by symbols for GRanD (red bubbles).
To assist regional applications, we further aggregated the improvements of GeoDAR over GRanD into national scales. As shown in Fig. 14, GeoDAR's improvements in either dam count or reservoir storage capacity pervade more than 120 countries, occupying 86 % of the continental landmass (excluding Antarctica). The increase in dam count occurs in 127 out of the 155 GeoDAR countries (Fig. 14a, Table S6 in the Supplement). These countries include 18 countries without GRanD records at all (such as Haiti, United Arab Emirates, Yemen, and Bhutan), and the other 109 countries comprise 80 % of the 137 countries with GRanD records. There are slightly fewer countries with a confirmed increase in reservoir storage capacity (Fig. 14b) because some of the added WRD records are missing storage capacity values. The number of these countries is 117, including 15 without GRanD records at all.
While GeoDAR's improvements are widespread, the improvement levels are not geographically uniform (Fig. 14). Globally speaking, the spatial patterns of number and capacity increases are overall consistent, with the major hotspots concurring with large or industrialized nations (e.g., US, China, Brazil, India, and European countries) and less impressive increases in smaller, drier, and/or less developed nations (e.g., part of Africa and South America). This is reasonable as bigger and/or more developed nations usually possess a larger quantity of dam infrastructures and thus a greater potential for GeoDAR to improve. However, this pattern also reflects the disparities due to other factors, such as a possible bias in the WRD (as it is a volunteered dataset, and not all member nations contributed equally), the accessibility of regional registers for geo-matching, and geocoding challenges for different regions. The top five countries in terms of dam count increase are the US (an increase of 6039 or 314 %), China (4352 or 474 %), India (963 or 290 %), South Africa (667 or 248 %), and Spain (575 or 219 %) (Table S6 in the Supplement). These five countries cover 72 % of the global dam count increase (17 463). Similarly, the top five countries in terms of storage capacity increase are the US (123 km3 or 16 %), Canada (73 km3 or 8 %), Brazil (66 km3 or 12 %), China (44 km3 or 7 %), and India (33 km3 or 12 %), which together comprise 68 % of the global storage capacity increase (503 km3).
Certain regions with limited increases in dam count, such as the Middle East, Southeast Asia, and southern Africa, show more pronounced improvements in storage capacity. This contrast indicates that, in addition to smaller dams and reservoirs (e.g., < 100 mcm), GeoDAR also supplemented GRanD by including more capacious reservoirs. Examples are Dau Tieng Dam in Vietnam (storage capacity 1580 mcm; location 11.323∘ N, 106.341∘ E), San Roque Dam in the Philippines (990 mcm; 16.147∘ N, 120.685∘ E), Mrica Dam in Indonesia (193 mcm; 7.392∘ S, 109.605∘ E), Marib Dam in Yemen (398 mcm; 15.396∘ N, 45.244∘ E), and the recently completed Lauca Dam in Angola (5482 mcm; 9.739∘ S, 15.127∘ E). GeoDAR also inventoried some large hydroelectric projects that are under construction or consideration. Examples are Bakhtiari Dam in Iran (expected 4845 mcm; 32.958∘ N, 48.761∘ E), Bekhme Dam in Iraq (17 000 mcm; 36.701∘ N, 44.271∘ E), Diamer-Bhasha Dam in Pakistan (10 000 mcm; 35.521∘ N, 73.739∘ E), and Myitsone Dam in Myanmar (13 282 mcm; 25.691∘ N, 97.516∘ E).
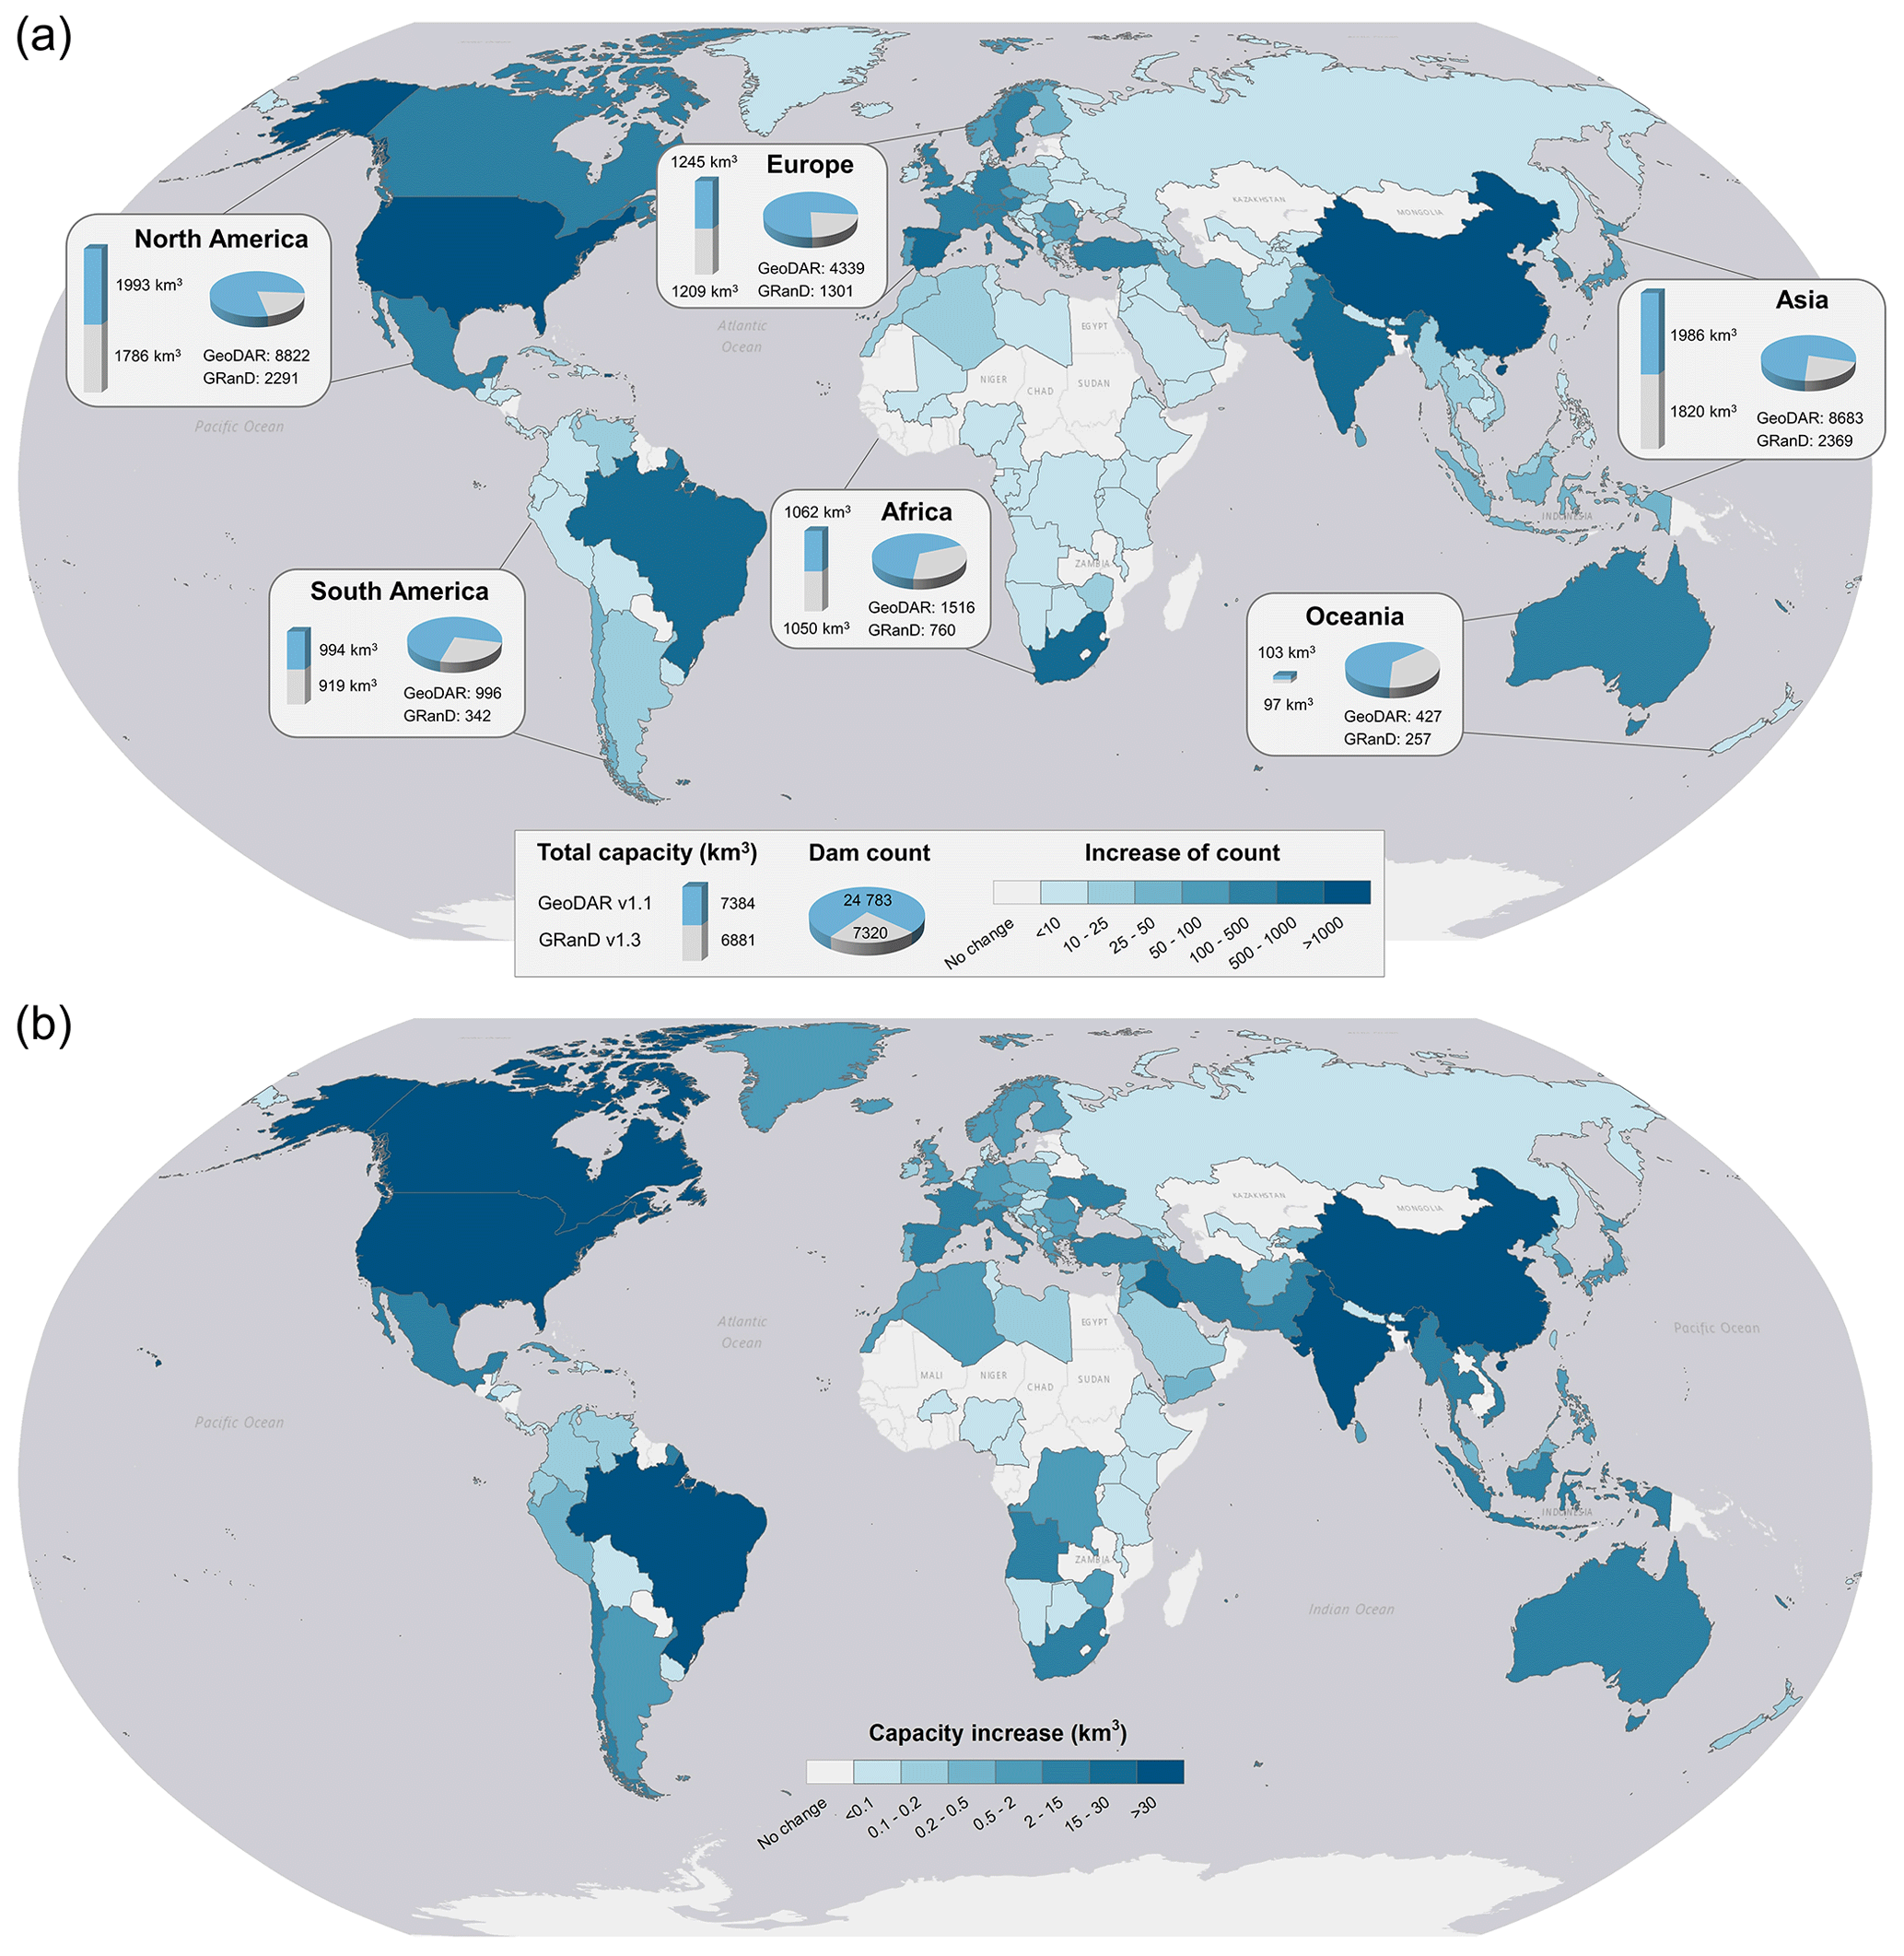
Figure 14Country-level improvements in GeoDAR v1.1 over GRanD v1.3. (a) Increase in dam count and (b) increase in total reservoir storage capacity for each country or territory. Aggregated statistics for dam count and storage capacity were also compared for each continent. For convenience of comparison, both statistics are displayed in panel (a).
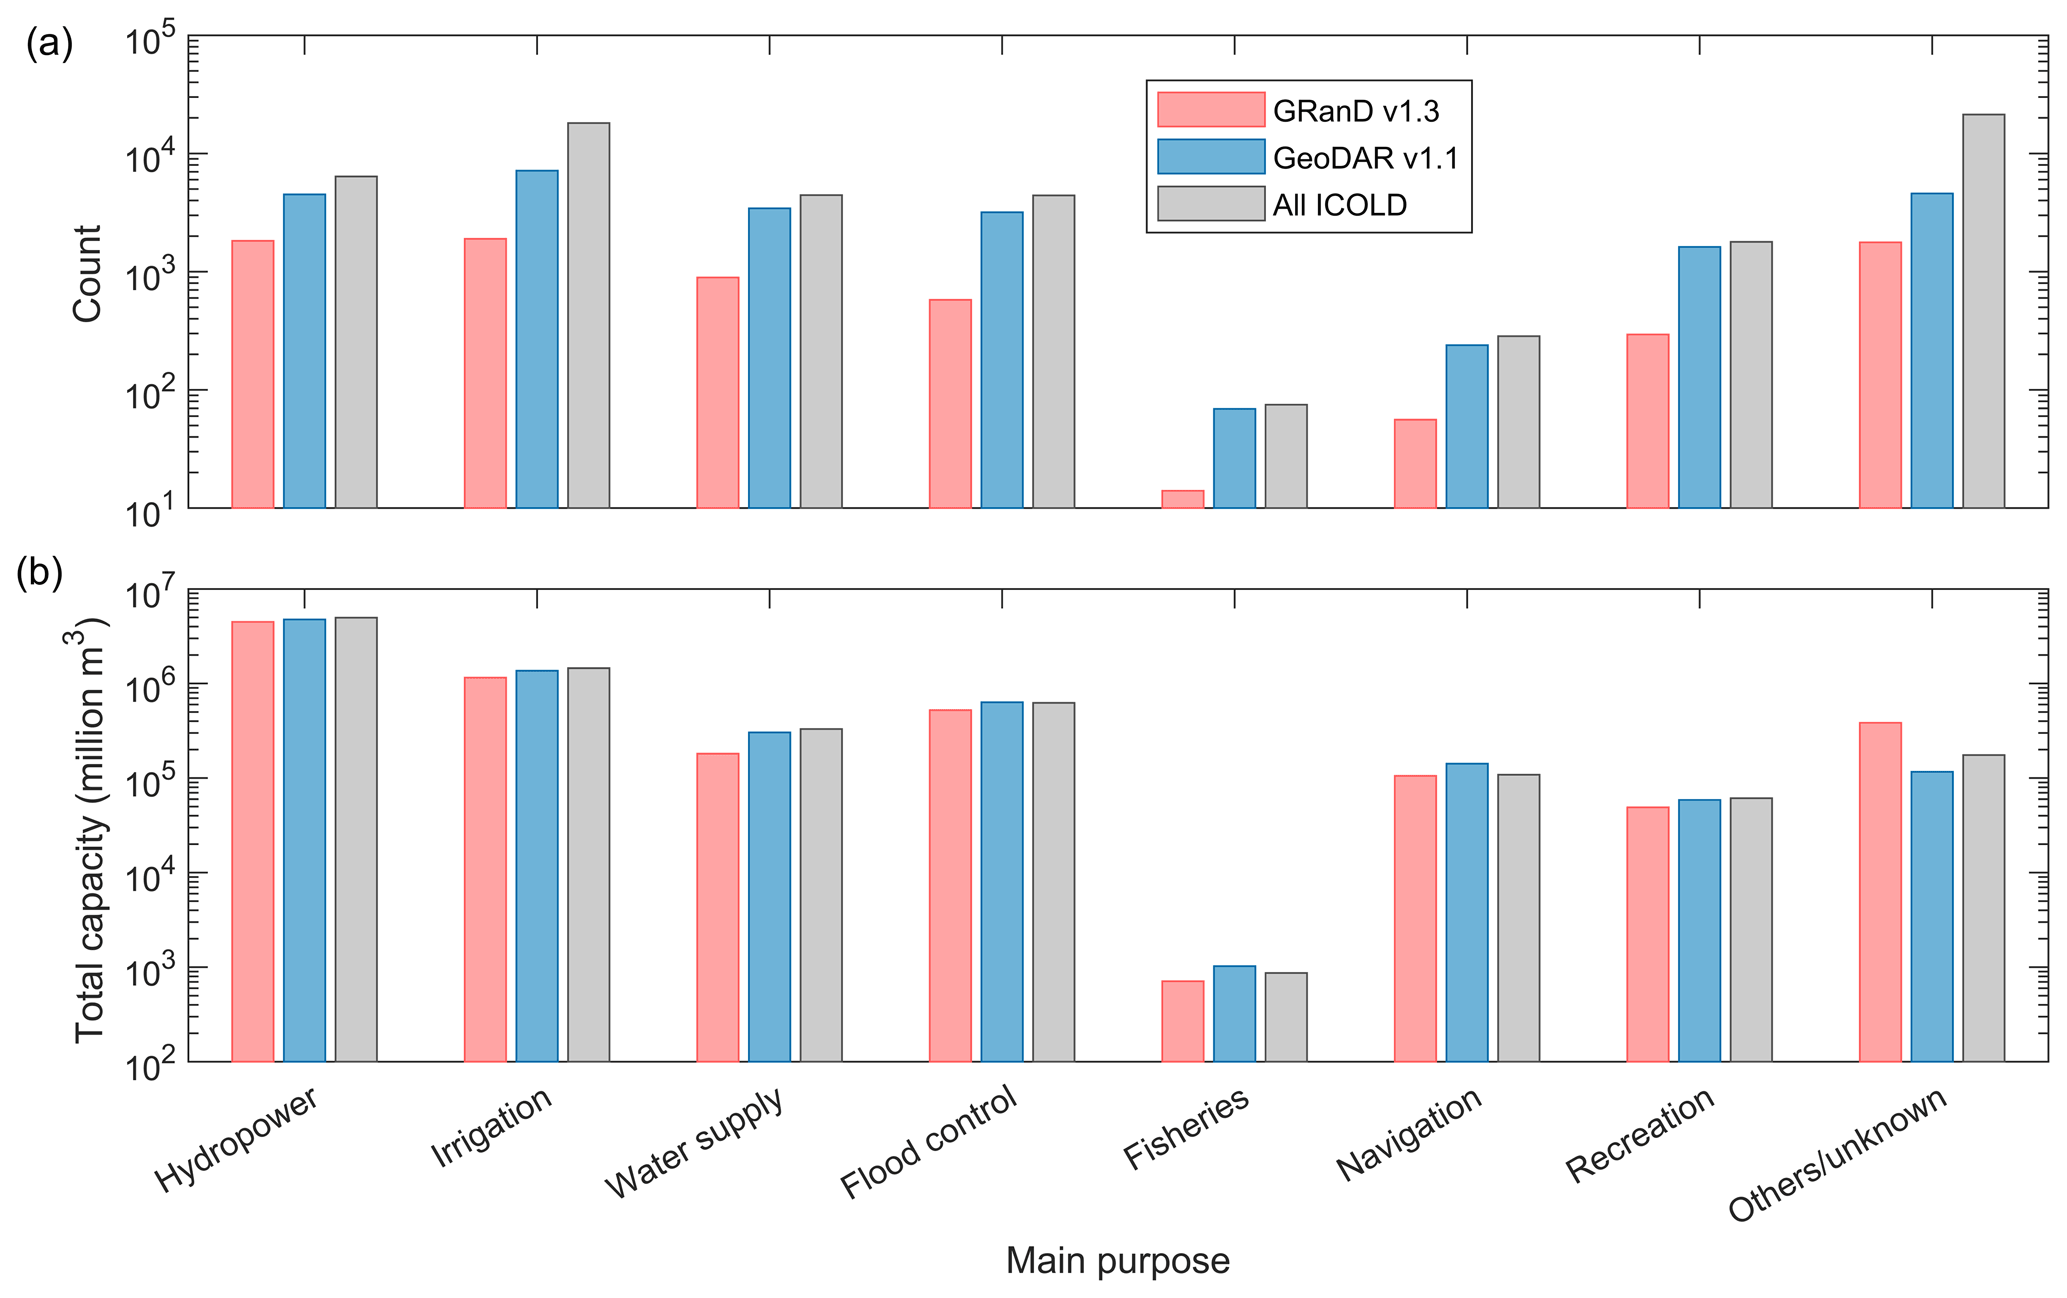
Figure 15Comparison among GRanD v1.3, GeoDAR v1.1, and the ICOLD WRD by dam or reservoir purpose. (a) Dam counts and (b) total reservoir storage capacities for each main purpose. Dam purposes are based on attribute values provided in the WRD and GRanD. For a dam with multiple purposes, its “main purpose” was considered to be the one with the highest order of priority. The main purpose in GRanD took precedence if it differs from that in the WRD.
By further aggregating national statistics to each continent, Fig. 14 echoes the fact that GeoDAR's major improvement lies in the quantity or spatial density of the dams rather than their total reservoir storage capacity. However, this should not overshadow the fact that improvements of both dam count and storage capacity do exist in all continents. As summarized in Fig. 14a, the continental improvement ascends from 170 more dams with a 7 km3 total capacity in Oceania to a scale of 6000–7000 more dams with a 100–200 km3 capacity in North America or Asia. Because the total storage capacity is disproportionally dominated by the largest reservoirs, and GRanD has already included most of them, the added storage capacity by GeoDAR relative to what has existed in GRanD appears limited and descends from 9 %–12 % in Asia and North America and 7 %–8 % in Oceania and South America to 1 %–3 % in Africa and Europe. By contrast, GeoDAR's dam quantity ranges from being almost double that of GRanD in Oceania and Africa to being triple to quadruple in the other continents.

Figure 16Comparisons between GRanD v1.3, GOODD V1, and GeoDAR v1.1 in selected regions of the world. (a–b) Cerrado, Brazil (Mato Grosso State). (c–e) Northern China (Shandong Province). (f–h) Southwestern France (Aquitaine and Midi-Pyrenees). (i–k) Northern Pakistan (northern highlands and foothills). GRanD points (red) are placed on top of GOODD (green), which is placed on top of GeoDAR (yellow). Background image source: Esri imagery base map.
A derivative benefit of the increased dam quantity is a more complete representation of the regulated watersheds, which is critical to improving discharge estimates. As revealed by the distribution curves in Fig. 11a, GeoDAR improved GRanD in the inclusion of reservoir catchment areas in two aspects. First, the exceedance of the number of reservoir catchments is almost unanimous on all area levels. This corresponds to a total increase in catchment area by 32×106 km2 or 27 % (Table 5). Second, the increase in reservoir catchments is skewed towards smaller catchments, signifying a more realistic inventory of human water regulations in the basins of lower stream orders or closer to stream headwaters. As shown in the distribution curves (Fig. 11a), the average increasing rate is augmented from about 30 % for catchments larger than 1000 km2 and about 80 % for catchments between 10 and 1000 km2 to nearly 600 % for those smaller than 10 km2. The mode of catchment areas decreases from about 200–400 km2 in GRanD to 30–100 km2 in GeoDAR, with the latter much closer to the mode of the entire WRD (15–50 km2). As a result, the number of dams with a catchment size smaller than 25 km2, for example, which is the channelization threshold for the high-resolution MERIT Basins hydrography dataset (Lin et al., 2019; Yamazaki et al., 2017), is 3570 or 27 % in GeoDAR in comparison to 695 or 10 % in GRanD. These small-catchment dams, once integrated into river networks, may substantially improve the performance of routing models. Consistent with our comparison with the WRD (Sect. 5.1), these statistics are only based on the records with valid catchment areas. Considering that missing values more likely occur for dams with smaller catchments, our reported improvement could be theoretically conservative.
The increased dam count in GeoDAR also enabled the retrieval of surface extents of another 14 000 or so smaller reservoirs (Fig. 7). The added reservoir polygons, including 10 for the dams in GRanD that originally had no reservoirs and 14 275 for GeoDAR v1.0 alone, have an average size of 1.4 km2 in comparison to 65 km3 in GRanD. They aggregate to a total area of 19 880 km2, a scale comparable to 30 Lake Meads. Although this area increase may appear substantial, it only expanded the global reservoir area in GRanD by a marginal proportion of 4 %. Similar to the pattern of storage capacities, reservoir areas follow a quasi-Pareto distribution, meaning that smaller reservoirs tend to dominate the population (or number), whereas larger reservoirs dominate the area and storage. This explains why the increase in relative area is small, but the increase in absolute quantity is double that of the entire reservoir polygons in GRanD. For example, 95 % of the total reservoir area in GeoDAR comes from only 12 % of the reservoir polygons larger than 10 km2, and about 90 % of these large reservoirs are already included by GRanD (Fig. 11b). This pattern again suggests that the core value of GeoDAR is not to augment the global scale of reservoir area or storage but to amplify the local details of smaller dams and reservoirs. Owing to the added details, the mode of reservoir area is on the order of 1–10 km2 in GRanD but was refined by 1 order of magnitude to 0.1–1 km2 in GeoDAR.
If we group the global dams by their documented main purpose, we observe in Fig. 15 that GeoDAR improved GRanD unanimously in both dam count and storage capacity for all main purposes (Fig. 15). For the same reason as explained above (i.e., the added reservoirs are small), the increases in dam count appear more prominent than those in storage capacity, and the increases in storage capacity from GRanD to GeoDAR are overall more evident than those from GeoDAR to the ICOLD WRD. The exception is the dams with “others” or “unknown” purposes, whose total storage capacity in GeoDAR is lower. This is because when GRanD and WRD records conflict with each other in the GeoDAR harmonization process, the attribute values in GRanD took precedence only if they are available or valid (“others” or “unknown” was considered to be an invalid reservoir purpose). Assuming that reservoir operations vary by purpose, this unanimous improvement of the spatial inventory for all reservoir purposes, in conjunction with satellite-observed water budget variations, can help us better generalize reservoir operation rules which are critical to improving water management.
5.3 Spatially complementary to GOODD
The recently published GOODD (V1) dataset (Mulligan et al., 2020) includes 38 667 dam points in the world, which were digitized by scanning through Google Earth imagery with support of regional inventories and the Shuttle Radar Topography Mission Water Body Dataset (SWBD; Farr et al., 2007). Despite lacking essential attributes, GOODD is thus far the most comprehensive global inventory of dam locations and catchments. The digitization was performed during 2007 to 2011 and was later updated in 2016. This means that reservoirs postdating 2016 were not yet included in the dataset. The completeness and accuracy of GOODD also depend on the sizes of the dams or reservoirs. According to Mulligan et al. (2020), the resolution and quality of available Google Earth imagery during the digitization period were low in some parts of the world (such as China), and an experiment in the US showed that detectable dams and reservoirs from low-resolution imagery (e.g., Landsat Geocover 2000) may require a reservoir length greater than 500 m and a dam width greater than 150 m. These minimum-size criteria do not necessarily duplicate those of the ICOLD WRD, which instead emphasize the reservoir storage capacity and dam height (see Sect. 1).
Because of these digitizing limitations and criterion difference, the dam points in GeoDAR are spatially complementary to, rather than always duplicated by, those in GOODD across many regions. Figure 16 identified four examples in Cerrado Brazil, northern China, southwestern France, and northern Pakistan, where a large proportion of the GeoDAR dams were not digitized by GOODD. Some of the dams that only appear in GeoDAR also comply with the minimum size criteria of GOODD, and examples are those enlarged in the right panels, except the Duber Khwar Dam in Pakistan (35.119∘ N, 72.927∘ E; Fig. 16j), which was completed more recently in 2014. Since the area of the Duber Khwar Reservoir (about 0.05 km2) is smaller than the resolution of HydroLAKES (0.1 km2), and the dam completion year overlaps with the image acquisition period of the UCLA Circa 2015 Lake Inventory (from May 2013 to August 2015; Sheng et al., 2016), GeoDAR georeferenced the dam point but did not successfully retrieve the reservoir polygon.
To approximate how GeoDAR and GOODD complement each other globally, we intersected both dam datasets with the 30 m resolution UCLA Circa 2015 Lake Inventory. As a result of manual snapping to the 30 arcsec HydroSHEDS streamflow network (Lehner et al., 2008), some of the points in GOODD ended up having substantial geographic offsets from the actual dam or reservoir locations. For a pilot experiment, we applied a 1 km tolerance (about 30 arcsec on the Equator) when intersecting the UCLA Circa 2015 Lake Inventory with GOODD and kept a 500 m tolerance as used in Sect. 2.5 for intersecting the lake inventory with GeoDAR. The result shows that among the 55 000 or so water bodies that intersect either dataset, 80 % intersect with GOODD and the other 20 % with GeoDAR alone. These statistics imply that GeoDAR may have an ability to expand the number of dams in GOODD by roughly 25 % (i.e., 20 % divided by 80 %). Since we applied a larger tolerance for GOODD, this estimated expansion by GeoDAR is likely conservative (considering that the number of GOODD-intersecting reservoirs may be overestimated). If a 500 m tolerance is used for both intersections, the expansion by GeoDAR will increase to roughly 45 %. In addition to the expanded spatial coverage, GeoDAR indexed each georeferenced dam point to a WRD and/or GRanD record and thus enabled access to multiple attributes, whereas GOODD carries no attribute information except the delineated reservoir catchments. These regional and global comparisons suggest that, even just with the geometric dam points, GeoDAR is not a simple replication of GOODD but instead complements GOODD for an improved spatial coverage and density of global dams.
GeoDAR v1.0 (dam points) and v1.1 (both dam points and reservoir polygons) are available for download from the Zenodo repository https://doi.org/10.5281/zenodo.6163413 (Wang et al., 2022). The dam points are stored in both csv and shapefile formats, and the reservoir polygons are provided in shapefile. Their attributes and values are described in Table 3 as well as on the repository website. The data usage information is described in Sect. 3.3. Other citation courtesy and disclaimer information are given in the “Disclaimer” section and on the repository website. All released datasets and information are available under the Creative Commons Attribution 4.0 International (CC-BY 4.0) license (https://creativecommons.org/licenses/by/4.0, last access: 31 March 2022). Users who would like to link GeoDAR records to the proprietary WRD attributes they have purchased in advance from ICOLD should contact the corresponding author.
Python scripts for geo-matching, geocoding, and reservoir assignment are publicly available at https://github.com/surf-hydro/georeferencing-ICOLD-dams-and-reservoirs (last access: 13 March 2021). We request users who adapt or use the scripts to cite Wang et al. (2022).
We have produced a comprehensive and spatially resolved dam and reservoir dataset, GeoDAR, which complementarily improved the existing global inventories of large dams. We demonstrated that the production of GeoDAR is not a direct compilation or collation of existing dam datasets. Instead, it involved a first known effort to georeference the ICOLD WRD. This was jointly enabled by geo-matching (or table-associating) multi-source regional registers and geocoding descriptive attributes through the Google Maps API. This georeferencing effort resulted in GeoDAR v1.0, which contains 22 560 spatially resolved dam points, each associated with a WRD record, with an overall accuracy of 95 %. Each of the georeferenced records was also labeled with a QA score, providing users a reference to the qualities of individual dam locations. Our georeferencing process and accuracy validation, as we have elaborated in substantive detail, have important methodological value for future expansions of spatial dam inventories using similar approaches, such as Geo-Wiki and OpenStreetMap.
To further ensure the optimal inclusion of the world's largest dams, we harmonized the georeferenced WRD (or GeoDAR v1.0) carefully with GRanD v1.3. Using the harmonized dam points as spatial identifiers, most of their reservoir boundaries were then retrieved from high-resolution water body datasets. This ICOLD–GRanD harmonization and the subsequent reservoir retrieval resulted in GeoDAR v1.1, our end product, which holds 24 783 dam points (including 23 974 linked to the WRD) and 21 515 reservoir polygons. This product spatially resolved 44 % of the entire ICOLD WRD by dam count and more than 90 % by reservoir storage capacity. Since most of the world's largest reservoirs (e.g., > 0.1 km3) are already included in GRanD, GeoDAR adds limited improvements (by 4 %–27 %) to the total reservoir area, storage capacity, and catchment area. However, by including many smaller dams particularly in lower and middle latitudes, GeoDAR is triple the size of GRanD in terms of dam and reservoir quantity. For this reason, one of the major improvements of GeoDAR is its unparalleled ability to capture relatively small dams, or in other words, to enhance the spatial detail of global dam and reservoir distributions.
Besides an improved quantity and spatial detail, another unique value of GeoDAR is its capability of bridging the locations of dams to a broad suite of attributes that are essential to scientific applications. A standing dilemma of existing global dam datasets is the divergence between the focus on dam quantity or spatial detail and the provision of detailed attributes for a limited dam quantity. This dilemma was partially ameliorated by GeoDAR because its georeferenced dams and reservoirs were explicitly indexed to WRD and/or GRanD records where many attributes are available. Since the original WRD is not georeferenced (or at least, their spatial coordinates are not directly accessible), our perception was that the task of georeferencing the WRD to enable a spatially explicit application of the attribute information, even at regional scales, falls on individual users. To avoid the duplication of efforts and to facilitate scientific applications, we performed this comprehensive georeferencing on the entirety of the ICOLD WRD as thoroughly as possible and hereby released the resultant dam coordinates and reservoir polygons to the public as part of GeoDAR. We would like to reiterate the disclaimer that GeoDAR does not directly contain nor do we intend to release the original WRD attribute data, which are proprietary to ICOLD. In other words, the association between GeoDAR IDs and WRD IDs exists but was purposefully encrypted. However, if individual users need GeoDAR records to be linked to the WRD attributes that they already purchased from ICOLD, we can be contacted, and on a case-by-case basis, we may provide this assistance given that the users agree not to release the decryption key or the proprietary WRD attributes.
We envision that GeoDAR, with its enhanced spatial density and extended accessibility to essential attributes, will benefit from a wide spectrum of disciplines and applications. It is worth noting that although most dams in GeoDAR are smaller than those in GRanD or AQUASTAT, they are still compliant with ICOLD's size criteria, which exclude countless tiny on-farm reservoirs and water storage tanks. Nevertheless, we have suggested from regional examples that GeoDAR partially complements some of the most extensive global dam inventories such as GOODD, despite GOODD owning a larger number of dams. In this sense, even just with the 25 000 or so geometric dam points, GeoDAR contributes yet another fundamental extension to global water infrastructure databases. If these dam points are rectified to high-resolution hydrographic networks (such as MERIT Hydro; Lin et al., 2021; Yamazaki et al., 2019), GeoDAR, together with other existing dam and barrier datasets, can help refine our understanding of how human water infrastructure fragmented global rivers and their ecosystems (Belletti et al., 2020; Grill et al., 2019; Yang et al., 2022), especially with a more exhaustive inclusion of smaller and/or headwater catchments.
Alongside the detailed dam points, GeoDAR's reservoir boundaries provide thus far the most comprehensive global base maps for assessing reservoir dynamics and the impacts of human water regulation. In combination with the expanding constellation of satellite sensors (e.g., ICESat-2, Sentinel-6, and the forthcoming SWOT), this high-resolution base map will, for instance, enable a more complete and accurate monitoring of water storage variation and surface evaporation in global reservoirs (Biancamaria et al., 2016; Chen et al., 2021; Cooley et al., 2021; Crétaux et al., 2016; Zhao and Gao, 2019a). Tracking the spatiotemporal balance between reservoir water storage and evaporative loss will help strategize regional water management under a warming climate (Crétaux et al., 2015). Since our knowledge and understanding improve as observations increase, the observed water storage dynamics for an increased quantity of reservoirs will inevitably entail a more realistic generalization of the reservoir operation rules. This is particularly true if the attribute information such as reservoir purpose and storage capacity is also utilized. Considering that small but widespread reservoirs have a strong cumulative impact on discharge (Habets et al., 2018; Lin et al., 2019), the improved operation rules and the fine details of reservoir storage changes will benefit discharge estimations from hydrological models. From another perspective, GeoDAR's reservoir polygons can also help refine surface water typology, either by directly using them to mask artificial impoundments from natural lakes or by expanding the training pool to enhance machine learning algorithms so that additional reservoirs can be detected (Fang et al., 2019). A refined water typology map will, in turn, assist other analysis tools in improving our assessments of how human footprints alter surface hydrology and its related biodiversity and ecosystem health.
The supplement related to this article is available online at: https://doi.org/10.5194/essd-14-1869-2022-supplement.
JW contributed to conceptualization, data curation, data harmonization, formal analysis, funding acquisition, investigation, methodology, programming, project administration, quality assurance, quality control preparation, quality control, supervision, validation, visualization, and writing (original draft preparation and revision). BAW contributed to data curation, formal analysis, investigation, methodology, programming, visualization, and writing (original draft preparation, review, and editing). FY contributed to data curation, methodology, quality control, and writing (review and editing). CS contributed to methodology, quality control, supervision, validation, and writing (review and editing). MD, ASM, JZ, and CF contributed to quality control and validation. JMM contributed to validation and writing (review and editing). MSS contributed to methodology and writing (review and editing). YS contributed to data curation, methodology, supervision, and writing (review and editing). GHA, JFC, and YW contributed to methodology, supervision, and writing (review and editing).
The contact author has declared that neither they nor their co-authors have any competing interests.
GeoDAR v1.0 and v1.1 contain knowledge derived from the ICOLD WRD (https://www.icold-cigb.org/GB/world_register/world_register_of_dams.asp, last access: 13 March 2019) but release no original
values of the proprietary WRD attributes (except the storage capacities of a
few large dams used to verify and correct Wada et al., 2017; see
Table S4 in the Supplement). The production and dissemination of GeoDAR (spatial
features) abide by ICOLD's legal policies (https://www.icold-cigb.org/GB/legal.asp, last access: 31 March 2022) and were approved by the central
office of ICOLD. GeoDAR v1.0 represents an initial effort of georeferencing
the WRD at a global scale, and the resultant dam distribution may be
geographically skewed and thus may not reflect the distribution of all WRD
records. In addition, since we leveraged multiple data sources and methods to georeference the WRD records, the produced “dam” points in both versions do not always fall exactly on the dam bodies and instead, are often located on the surface of the associated reservoirs. In our QC, we manually adjusted some of the points to be closer to the dams, but more improvement can still be made. The authors are not responsible for any consequence arising from
these limitations. GeoDAR v1.1 absorbed the spatial features (i.e., dam point
coordinates and most of the reservoir polygons) in GRanD v1.3. To
acknowledge the originality of GRanD, we request users to cite Lehner et al. (2011) if they only use the subset of GeoDAR v1.1 from GRanD alone. If GRanD
is used together with our corrected spatial coordinates (Table S5 in the Supplement), we recommend users to cite this paper as well. The source of each
spatial feature in GeoDAR v1.1 is specified in the attributes
“har_src” and “pnt_src” for dam points and
the attribute “plg_src” for reservoir polygons (see Table 3). For any questions about data citation, please contact the corresponding
author Jida Wang. Authors of this paper claim no responsibility or liability for
any consequences related to the use, citation, or dissemination of GeoDAR.
Publisher's note: Copernicus Publications remains neutral with regard to jurisdictional claims in published maps and institutional affiliations.
This research was in part supported by the NASA Surface Water and Ocean Topography (SWOT) grant (grant no. 80NSSC20K1143) and the Kansas State University faculty start-up fund. We would like to acknowledge ICOLD for providing the WRD and the central office of ICOLD for providing information on data dissemination policies and for allowing us to release the position information of the WRD we georeferenced. We thank Aote Xin at Kansas State University for assisting in data harmonization, quality control, and validation and for providing comments on the manuscript. We thank Yao Li at Texas A&M University for providing information on incomplete reservoir polygons and Elizabeth M. Prior at Virginia Tech for providing information on some of the duplicate dam points in the US during the open-discussion process. The authors are also grateful to Bernhard Lehner at McGill University for his constructive suggestions and comments on data curation, usage, and dissemination. We also acknowledge Google Maps Platform (https://cloud.google.com/maps-platform, last access: 14 February 2022) for providing the geocoding API.
This research has been supported by the NASA Surface Water and Ocean Topography (SWOT) grant (grant no. 80NSSC20K1143).
This paper was edited by David Carlson and reviewed by two anonymous referees.
Allen, G. H. and Pavelsky, T. M.: Global extent of rivers and streams, Science, 361, 585–587, https://doi.org/10.1126/science.aat0636, 2018.
Belletti, B., Leaniz, C. G. D., Jones, J., Bizzi, S., Börger, L., Segura, G., Castelletti, A., van der Bund, W., Aarestrup, K., Barry, J., Belka, K., Berkhuysen, A., Birnie-Gauvin, K., Bussettini, M., Carolli, M., Consuegra, S., Dopico, E., Feierfeil, T., Fernández, S., Garrido, P. F., Garcia-Vazquez, E., Garrido, S., Giannico, G., Gough, P., Jepsen, N., Jones, P. E., Kemp, P., Kerr, J., King, J., Łapińska, M., Lázaro, G., Lucas, M. C., Marcello, L., Martin, P., McGinnity, P., O'Hanley, J., Amo, R. O. d., Parasiewicz, P., Pusch, M., Rincon, G., Rodriguez, C., Royte, J., Schneider, C. T., Tummers, J. S., Vallesi, S., Vowles, A., Verspoor, E., Wanningen, H., Wantzen, K. M., Wildman, L., and Zalewski, M.: More than one million barriers fragment Europe's rivers, Nature, 588, 436–441, https://doi.org/10.1038/s41586-020-3005-2, 2020.
Biancamaria, S., Lettenmaier, D. P., and Pavelsky, T. M.: The SWOT mission and its capabilities for land hydrology, Surv. Geophys., 37, 307–337, https://doi.org/10.1007/s10712-015-9346-y, 2016.
Biemans, H., Haddeland, I., Kabat, P., Ludwig, F., Hutjes, R. W. A., Heinke, J., von Bloh, W., and Gerten, D.: Impact of reservoirs on river discharge and irrigation water supply during the 20th century, Water Resour. Res., 47, W03509, https://doi.org/10.1029/2009WR008929, 2011.
Boulange, J., Hanasaki, N., Yamazaki, D., and Pokhrel, Y.: Role of dams in reducing global flood exposure under climate change, Nat. Commun., 12, 417, https://doi.org/10.1038/s41467-020-20704-0, 2021.
Busker, T., de Roo, A., Gelati, E., Schwatke, C., Adamovic, M., Bisselink, B., Pekel, J.-F., and Cottam, A.: A global lake and reservoir volume analysis using a surface water dataset and satellite altimetry, Hydrol. Earth Syst. Sci., 23, 669–690, https://doi.org/10.5194/hess-23-669-2019, 2019.
Carpenter, S. R., Stanley, E. H., and Vander Zanden, M. J.: State of the world's freshwater ecosystems: physical, chemical, and biological changes, Annu. Rev. Environ. Resour., 36, 75–99, https://doi.org/10.1146/annurev-environ-021810-094524, 2011.
Chao, B. F., Wu, Y. H., and Li, Y. S.: Impact of artificial reservoir water impoundment on global sea level, Science, 320, 212–214, https://doi.org/10.1126/science.1154580, 2008.
Chen, T., Song, C., Ke, L., Wang, J., Liu, K., and Wu, Q.: Estimating seasonal water budgets in global lakes by using multi-source remote sensing measurements, J. Hydrol., 593, 125781, https://doi.org/10.1016/j.jhydrol.2020.125781, 2021.
Cooley, S. W., Ryan, J. C., and Smith, L. C.: Human alteration of global surface water storage variability, Nature, 591, 78–81, https://doi.org/10.1038/s41586-021-03262-3, 2021.
Crétaux, J. F., Abarca-del-Rio, R., Berge-Nguyen, M., Arsen, A., Drolon, V., Clos, G., and Maisongrande, P.: Lake volume monitoring from space, Surv. Geophys., 37, 269–305, https://doi.org/10.1007/s10712-016-9362-6, 2016.
Crétaux, J. F., Jelinski, W., Calmant, S., Kouraev, A., Vuglinski, V., Berge-Nguyen, M., Gennero, M. C., Nino, F., Del Rio, R. A., Cazenave, A., and Maisongrande, P.: SOLS: A lake database to monitor in the near real time water level and storage variations from remote sensing data, Adv. Space. Res., 47, 1497–1507, https://doi.org/10.1016/j.asr.2011.01.004, 2011.
Crétaux, J. F., Biancamaria, S., Arsen, A., Berge-Nguyen, M., and Becker, M.: Global surveys of reservoirs and lakes from satellites and regional application to the Syrdarya river basin, Environ. Res. Lett., 10, 015002, https://doi.org/10.1088/1748-9326/10/1/015002, 2015.
Dams in Japan, Japan Dam Foundation (JDF): http://damnet.or.jp/Dambinran/binran/TopIndex_en.html, last access: May 2021.
Degu, A. M., Hossain, F., Niyogi, D., Pielke, R., Shepherd, J. M., Voisin, N., and Chronis, T.: The influence of large dams on surrounding climate and precipitation patterns, Geophys. Res. Lett., 38, L04405, https://doi.org/10.1029/2010GL046482, 2011.
Department of Water and Sanitation (DWS) of South Africa: List of Registered Dams (LRD), DWS [data set], http://www.dwaf.gov.za/DSO/Publications.aspx, 2019.
Döll, P., Fiedler, K., and Zhang, J.: Global-scale analysis of river flow alterations due to water withdrawals and reservoirs, Hydrol. Earth Syst. Sci., 13, 2413–2432, https://doi.org/10.5194/hess-13-2413-2009, 2009.
Fang, W., Wang, C., Chen, X., Wan, W., Li, H., Zhu, S., Fang, Y., Liu, B., and Hong, Y.: Recognizing global reservoirs from Landsat 8 images: a deep learning approach, IEEE J. Sel. Top. Appl., 12, 3701–3701, https://doi.org/10.1109/JSTARS.2019.2929601, 2019.
Farr, T. G., Rosen, P. A., Caro, E., Crippen, R., Duren, R., Hensley, S., Kobrick, M., Paller, M., Rodriguez, E., Roth, L., Seal, D., Shaffer, S., Shimada, J., Umland, J., Werner, M., Oskin, M., Burbank, D., and Alsdorf, D.: The Shuttle Radar Topography Mission, Rev. Geophys., 45, RG2004, https://doi.org/10.1029/2005RG000183, 2007.
Gao, H., Birkett, C., and Lettenmaier, D. P.: Global monitoring of large reservoir storage from satellite remote sensing, Water Resour. Res., 48, W09504, https://doi.org/10.1029/2012WR012063, 2012.
Grill, G., Lehner, B., Thieme, M., Geenen, B., Tickner, D., Antonelli, F., Babu, S., Borrelli, P., Cheng, L., Crochetiere, H., Macedo, H. E., Filgueiras, R., Goichot, M., Higgins, J., Hogan, Z., Lip, B., McClain, M. E., Meng, J., Mulligan, M., Nilsson, C., Olden, J. D., Opperman, J. J., Petry, P., Liermann, C. R., Saenz, L., Salinas-Rodriguez, S., Schelle, P., Schmitt, R. J. P., Snider, J., Tan, F., Tockner, K., Valdujo, P. H., van Soesbergen, A., and Zarfl, C.: Mapping the world's free-flowing rivers, Nature, 569, 215–221, https://doi.org/10.1038/s41586-019-1111-9, 2019.
Habets, F., Molenat, J., Carluer, N., Douez, O., and Leenhardt, D.: The cumulative impacts of small reservoirs on hydrology: a review, Sci. Total Environ., 643, 850–867, https://doi.org/10.1016/j.scitotenv.2018.06.188, 2018.
Latrubesse, E. M., Arima, E. Y., Dunne, T., Park, E., Baker, V. R., d'Horta, F. M., Wight, C., Wittmann, F., Zuanon, J., Baker, P. A., Ribas, C. C., Norgaard, R. B., Filizola, N., Ansar, A., Flyvbjerg, B., and Stevaux, J. C.: Damming the rivers of the Amazon basin, Nature, 546, 363–369, https://doi.org/10.1038/nature22333, 2017.
Lehner, B., Verdin, K., and Jarvis, A.: New global hydrography derived from spaceborne elevation data, Eos T. Am. Geophys. Un., 89, 93–104, https://doi.org/10.1029/2008eo100001, 2008.
Lehner, B., Liermann, C. R., Revenga, C., Vörösmarty, C., Fekete, B., Crouzet, P., Döll, P., Endejan, M., Frenken, K., Magome, J., Nilsson, C., Robertson, J. C., Rodel, R., Sindorf, N., and Wisser, D.: High-resolution mapping of the world's reservoirs and dams for sustainable river-flow management, Front. Ecol. Environ., 9, 494–502, https://doi.org/10.1890/100125, 2011.
Li, B., Yan, Q., and Zhang, L.: Flood monitoring and analysis over the middle reaches of Yangtze River basin using MODIS time-series imagery, in: 2011 IEEE International Geoscience and Remote Sensing Symposium, Vancouver, British Columbia, Canada, 24–29 July 2011, 807–810, https://doi.org/10.1109/IGARSS.2011.6049253, 2011.
Li, Y., Gao, H., Zhao, G., and Tseng, K. H.: A high-resolution bathymetry dataset for global reservoirs using multi-source satellite imagery and altimetry, Remote Sens. Environ., 244, 111831, https://doi.org/10.1016/j.rse.2020.111831, 2020.
Lin, P., Pan, M., Beck, H. E., Yang, Y., Yamazaki, D., Frasson, R., David, C. H., Durand, M., Pavelsky, T. M., Allen, G. H., Gleason, C. J., and Wood, E. F.: Global reconstruction of naturalized river flows at 2.94 million reaches, Water Resour. Res., 55, 6499–6516, https://doi.org/10.1029/2019WR025287, 2019.
Lin, P., Pan, M., Wood, E. F., Yamazaki, D., and Allen, G. H.: A new vector-based global river network dataset accounting for variable drainage density, Sci. Data, 8, 28, https://doi.org/10.1038/s41597-021-00819-9, 2021.
Liu, K., Song, C., Wang, J., Ke, L., Zhu, Y., Zhu, J., Ma, R., and Luo, Z.: Remote sensing-based modeling of the bathymetry and water storage for channel-type reservoirs worldwide, Water Resour. Res., 56, e2020WR027147, https://doi.org/10.1029/2020WR027147, 2020.
Lyons, E. A. and Sheng, Y.: LakeTime: Automated seasonal scene selection for global lake mapping using Landsat ETM+ and OLI, Remote Sensing, 10, 54, https://doi.org/10.3390/rs10010054, 2018.
Mady, B., Lehmann, P., Gorelick, S. M., and Or, D.: Distribution of small seasonal reservoirs in semi-arid regions and associated evaporative losses, Environ. Res Commun., 2, 061002, https://doi.org/10.1088/2515-7620/ab92af, 2020.
Managing Aquatic ecosystems and water Resources under multiple Stress project (MARS): MARS GeoDatabase (MARSgeoDB) version 2 [data set], http://www.mars-project.eu/index.php/databases.html (last access: 4 February 2021), 2017.
Map World (Tianditu), National Platform for Common Geospatial Information Services (NPCGIS): https://map.tianditu.gov.cn, last access: July 2021.
Messager, M. L., Lehner, B., Grill, G., Nedeva, I., and Schmitt, O.: Estimating the volume and age of water stored in global lakes using a geo-statistical approach, Nat. Commun., 7, 13603, https://doi.org/10.1038/ncomms13603, 2016.
Mulligan, M., van Soesbergen, A., and Saenz, L.: GOODD, a global dataset of more than 38,000 georeferenced dams, Sci. Data, 7, 31, https://doi.org/10.1038/s41597-020-0362-5, 2020.
Mulligan, M., Lehner, B., Zarfl, C., Thieme, M., Beames, P., van Soesbergen, A., Higgins, J., Januchowski-Hartley, S. R., Brauman, K. A., De Felice, L., Wen, Q., de Leaniz, C. G., Belletti, B., Mandle, L., Yang, X., Wang, J., and Mazany-Wright, N.: Global Dam Watch: curated data and tools for management and decision making, Environ. Res. Infrastruct. Sustain., 1, 033003, https://doi.org/10.1088/2634-4505/ac333a, 2021.
National Register of Large Dams (NRLD): Government of India, Central Water Commission, Central Dam Safety Organization, New Delhi, 300 pp., June 2019.
Natural Resources Canada (NRC): CanVec 1M Man-Made Features – Dam version 1.0.1, NRC [data set], Data catalogue date: 7 April 2017, originally accessed from http://geogratis.gc.ca/api/en/nrcan-rncan/ess-sst/0c78d7fe-100b-5937-b74e-7590a03a6244.html, last access: September 2017.
Nilsson, C. and Berggren, K.: Alterations of riparian ecosystems caused by river regulation, Bioscience, 50, 783–792, https://doi.org/10.1641/0006-3568(2000)050[0783:AORECB]2.0.CO;2, 2000.
Open Development Cambodia (ODC): Hydropower dams 1993–2014, ODC [data set], https://data.opendevelopmentmekong.net/en/dataset/hydropower-2009-2014 (5 September 2019), 2015.
Open Development Myanmar (ODM): Myanmar Dams, ODM [data set], https://data.opendevelopmentmekong.net/en/dataset/myanmar-dams (last access: 5 September 2019), 2018.
Paredes-Beltran, B., Sordo-Ward, A., and Garrote, L.: Dataset of Georeferenced Dams in South America (DDSA), Earth Syst. Sci. Data, 13, 213–229, https://doi.org/10.5194/essd-13-213-2021, 2021.
Pekel, J. F., Cottam, A., Gorelick, N., and Belward, A. S.: High-resolution mapping of global surface water and its long-term changes, Nature, 540, 418–422, https://doi.org/10.1038/nature20584, 2016.
Schwatke, C., Dettmering, D., Bosch, W., and Seitz, F.: DAHITI – an innovative approach for estimating water level time series over inland waters using multi-mission satellite altimetry, Hydrol. Earth Syst. Sci., 19, 4345–4364, https://doi.org/10.5194/hess-19-4345-2015, 2015.
Sheng, Y., Song, C., Wang, J., Lyons, E. A., Knox, B. R., Cox, J. S., and Gao, F.: Representative lake water extent mapping at continental scales using multi-temporal Landsat-8 imagery, Remote Sens. Environ., 185, 129–141, https://doi.org/10.1016/j.rse.2015.12.041, 2016.
Shin, S., Pokhrel, Y., and Miguez-Macho, G.: High-resolution modeling of reservoir release and storage dynamics at the continental scale, Water Resour. Res., 55, 787–810, https://doi.org/10.1029/2018WR023025, 2019.
Sistema Nacional de Informações sobre Segurança de Barragens (SNISB, Brazilian National Dam Safety Information System): Relatório de Segurança de Barragens 2017 (Dams Safety Report 2017), SNISB [data set], http://www.snisb.gov.br/portal/snisb/relatorio-anual-de-seguranca-de-barragem/2017 (last access: 31 August 2019), 2017.
Tilt, B., Braun, Y., and He, D.: Social impacts of large dam projects: A comparison of international case studies and implications for best practice, J. Environ. Manage., 90, S249–S257, 2009.
Tobler, W. R.: Computer Movie Simulating Urban Growth in Detroit Region, Econ. Geogr., 46, 234–240, https://doi.org/10.2307/143141, 1970.
United States Army Coprs of Engineers (USACE): National Inventory of Dams (NID), USACE [data set], https://nid.usace.army.mil (last access: 20 March 2021), 2018.
Vörösmarty, C. J., Meybeck, M., Fekete, B., Sharma, K., Green, P., and Syvitski, J. P. M.: Anthropogenic sediment retention: major global impact from registered river impoundments, Global Planet. Change, 39, 169–190, https://doi.org/10.1016/S0921-8181(03)00023-7, 2003.
Wada, Y., Reager, J. T., Chao, B. F., Wang, J., Lo, M. H., Song, C., Li, Y. W., and Gardner, A. S.: Recent changes in land water storage and its contribution to sea level variations, Surv. Geophys., 38, 131–152, https://doi.org/10.1007/s10712-016-9399-6, 2017.
Wang, J., Sheng, Y., and Wada, Y.: Little impact of the Three Gorges Dam on recent decadal lake decline across China's Yangtze Plain, Water Resour. Res., 53, 3854–3877, https://doi.org/10.1002/2016WR019817, 2017.
Wang, J., Walter, B. A., Yao, F., Song, C., Ding, M., Maroof, A. S., Zhu, J., Fan, C., McAlister, J. M., Sikder, S., Sheng, Y., Allen, G. H., Crétaux, J.-F., and Wada, Y.: GeoDAR: Georeferenced global Dams And Reservoirs dataset for bridging attributes and geolocations, in: Earth System Science Data (v1.1; v1.0), Zenodo [data set], https://doi.org/10.5281/zenodo.6163413, 2022.
Whittemore, A., Ross, M. R. V., Dolan, W., Langhorst, T., Yang, X., Pawar, S., Jorissen, M., Lawton, E., Januchowski-Hartley, S., and Pavelsky, T.: A participatory science approach to expanding instream infrastructure inventories, Earth's Future, 8, e2020EF001558, https://doi.org/10.1029/2020EF001558, 2020.
Yamazaki, D., Ikeshima, D., Tawatari, R., Yamaguchi, T., O'Loughlin, F., Neal, J. C., Sampson, C. C., Kanae, S., and Bates, P. D.: A high-accuracy map of global terrain elevations, Geophys. Res. Lett., 44, 5844–5853, https://doi.org/10.1002/2017GL072874, 2017.
Yamazaki, D., Ikeshima, D., Sosa, J., Bates, P. D., Allen, G. H., and Pavelsky, T. M.: MERIT Hydro: A high-resolution global hydrography map based on latest topography dataset, Water Resour. Res., 55, 5053–5073, https://doi.org/10.1029/2019WR024873, 2019.
Yang, X., Pavelsky, T. M., Ross, M. R. V., Januchowski-Hartley, S. R., Dolan, W., Altenau, E. H., Belanger, M., Byron, D., Durand, M., Van Dusen, I., Galit, H., Jorissen, M., Langhorst, T., Lawton, E., Lynch, R., Mcquillan, K. A., Pawar, S., and Whittemore, A.: Mapping flow-obstructing structures on global rivers, Water Resour. Res., 58, e2021WR030386, https://doi.org/10.1029/2021WR030386, 2022.
Yao, F., Wang, J., Wang, C., and Crétaux, J. F.: Constructing long-term high-frequency time series of global lake and reservoir areas using Landsat imagery, Remote Sens. Environ., 232, 111210, https://doi.org/10.1016/j.rse.2019.111210, 2019.
Yassin, F., Razavi, S., Elshamy, M., Davison, B., Sapriza-Azuri, G., and Wheater, H.: Representation and improved parameterization of reservoir operation in hydrological and land-surface models, Hydrol. Earth Syst. Sci., 23, 3735–3764, https://doi.org/10.5194/hess-23-3735-2019, 2019.
Yigzaw, W., Li, H. Y., Demissie, Y., Hejazi, M. I., Leung, L. R., Voisin, N., and Payn, R.: A new global storage-area-depth data set for modeling reservoirs in land surface and earth system models, Water Resour. Res., 54, 10372–10386, https://doi.org/10.1029/2017WR022040, 2018.
Zarfl, C., Lumsdon, A. E., Berlekamp, J., Tydecks, L., and Tockner, K.: A global boom in hydropower dam construction, Aquat. Sci., 77, 161–170, https://doi.org/10.1007/s00027-014-0377-0, 2015.
Zhan, S., Song, C., Wang, J., Sheng, Y., and Quan, J.: A global assessment of terrestrial evapotranspiration increase due to surface water area change, Earth's Future, 7, 266–282, https://doi.org/10.1029/2018EF001066, 2019.
Zhang, S., Gao, H., and Naz, B. S.: Monitoring reservoir storage in South Asia from multisatellite remote sensing, Water Resour. Res., 50, 8927–8943, https://doi.org/10.1002/2014WR015829, 2014.
Zhang, W., Pan, H., Song, C., Ke, L., Wang, J., Ma, R., Deng, X., Liu, K., Zhu, J., and Wu, Q. H.: Identifying emerging reservoirs along regulated rivers using multi-source remote sensing observations, Remote Sens., 11, 25, https://doi.org/10.3390/rs11010025, 2019.
Zhao, G. and Gao, H.: Estimating reservoir evaporation losses for the United States: Fusing remote sensing and modeling approaches, Remote Sens. Environ., 226, 109–124, https://doi.org/10.1016/j.rse.2019.03.015, 2019a.
Zhao, G. and Gao, H.: Towards global hydrological drought monitoring using remotely sensed reservoir surface area, Geophys. Res. Lett., 46, 13027–13035, https://doi.org/10.1029/2019GL085345, 2019b.