the Creative Commons Attribution 4.0 License.
the Creative Commons Attribution 4.0 License.
 | 08 Apr 2022
European pollen-based REVEALS land-cover reconstructions for the Holocene: methodology, mapping and potentials
Ralph Fyfe
Marie-Jose Gaillard
Anna-Kari Trondman
Florence Mazier
Anne-Birgitte Nielsen
Anneli Poska
Shinya Sugita
Jessie Woodbridge
Julien Azuara
Angelica Feurdean
Roxana Grindean
Vincent Lebreton
Laurent Marquer
Nathalie Nebout-Combourieu
Miglė Stančikaitė
Ioan Tanţău
Spassimir Tonkov
Lyudmila Shumilovskikh
Quantitative reconstructions of past land cover are necessary to determine the processes involved in climate–human–land-cover interactions. We present the first temporally continuous and most spatially extensive pollen-based land-cover reconstruction for Europe over the Holocene (last 11 700 cal yr BP). We describe how vegetation cover has been quantified from pollen records at a 1∘ × 1∘ spatial scale using the “Regional Estimates of VEgetation Abundance from Large Sites” (REVEALS) model. REVEALS calculates estimates of past regional vegetation cover in proportions or percentages. REVEALS has been applied to 1128 pollen records across Europe and part of the eastern Mediterranean–Black Sea–Caspian corridor (30–75∘ N, 25∘ W–50∘ E) to reconstruct the percentage cover of 31 plant taxa assigned to 12 plant functional types (PFTs) and 3 land-cover types (LCTs). A new synthesis of relative pollen productivities (RPPs) for European plant taxa was performed for this reconstruction. It includes multiple RPP values (≥2 values) for 39 taxa and single values for 15 taxa (total of 54 taxa). To illustrate this, we present distribution maps for five taxa (Calluna vulgaris, Cerealia type (t)., Picea abies, deciduous Quercus t. and evergreen Quercus t.) and three land-cover types (open land, OL; evergreen trees, ETs; and summer-green trees, STs) for eight selected time windows. The reliability of the REVEALS reconstructions and issues related to the interpretation of the results in terms of landscape openness and human-induced vegetation change are discussed. This is followed by a review of the current use of this reconstruction and its future potential utility and development. REVEALS data quality are primarily determined by pollen count data (pollen count and sample, pollen identification, and chronology) and site type and number (lake or bog, large or small, one site vs. multiple sites) used for REVEALS analysis (for each grid cell). A large number of sites with high-quality pollen count data will produce more reliable land-cover estimates with lower standard errors compared to a low number of sites with lower-quality pollen count data. The REVEALS data presented here can be downloaded from https://doi.org/10.1594/PANGAEA.937075 (Fyfe et al., 2022).
- Article
(18374 KB) - Full-text XML
- BibTeX
- EndNote


The reconstruction of past land cover at global, continental and sub-continental scales is essential for the evaluation of climate models, land-use scenarios and the study of past climate–land-cover interactions. Vegetation plays a significant role within the climate system through biogeochemical and biogeophysical feedbacks and forcings (Foley, 2005; Gaillard et al., 2015, 2010b, 2018; Strandberg et al., 2014, 2022). Land use has modified the land cover of Europe over Holocene timescales at local, regional and continental scales (Roberts et al., 2018; Trondman et al., 2015; Woodbridge et al., 2018). Concerted efforts have been made to model land-use and land-cover change (LULCC) over Holocene timescales (e.g. HYDE 3.2, Klein Goldewijk et al., 2017, and KK10, Kaplan et al., 2011). KK10 has been used to assess the impact of the scale of deforestation between 6000 and 200 cal yr BP in Europe on regional climate in the modelling study of Strandberg et al. (2014). The KK10-inferred land-cover change resulted in cooling or warming of regional climate by 1 to 2 ∘C depending on the season (winter or summer) and/or geographical location. Major changes in the forest cover of Europe over the Holocene may therefore have had a significant impact on past regional climate, particularly those driven by deforestation since the start of agriculture during the Neolithic period, the timing of which varies in different parts of Europe (Fyfe et al., 2015; Gaillard et al., 2015; Hofman-Kamińska et al., 2019; Nosova et al., 2018; Pinhasi et al., 2005; de Vareilles et al., 2021). Estimating past land-cover change can enable quantification of the scale at which human impact on terrestrial ecosystems perturbed the climate system. This in turn allows us to consider when environmental changes moved beyond the envelope of natural variability (Ruddiman, 2003; Ruddiman et al., 2016). We focus here on the role of LULCC in the climate system; anthropogenic land-cover change can have broader consequences for other processes and lead to changes in erosion and fluvial systems (Downs and Piégay, 2019), biodiversity (Barnosky et al., 2012), nutrient cycling (Guiry et al., 2018; McLauchlan et al., 2013), habitat exploitation by megafauna (Hofman-Kamińska et al., 2019) and wider ecosystem functioning (Ellis, 2015; Stephens et al., 2019).
The earth system modelling (ESM) community uses LULCC model scenarios, along with dynamic vegetation models, to understand interactions between different components of the earth system in the past (Gilgen et al., 2019; He et al., 2014; Hibbard et al., 2010; Smith et al., 2016). Disagreement between LULCC scenarios suggests that their evaluation is needed using independent, empirical datasets (Gaillard et al., 2010a). Pollen-based reconstruction of past land cover represents probably the best empirical data for this purpose as fossil pollen is a direct proxy for past vegetation, and fossil pollen records are ubiquitous across the continent of Europe (Gaillard et al., 2010a, 2018). The landscape reconstruction algorithm (LRA) with its two models Regional Estimates of VEgetation Abundance from Large Sites (REVEALS) (Sugita, 2007a) and LOcal Vegetation Estimates (LOVE) (Sugita, 2007b) is the only current land-cover reconstruction approach based on pollen data that effectively reduces the biases caused by the non-linear pollen–vegetation relationship due to differences in sedimentary archives, basin size, inter-taxonomic differences in pollen productivity and dispersal characteristics, and spatial scales. REVEALS and LOVE are mechanistic models that transform pollen count data to produce quantitative reconstructions of regional (spatial scale: ≥104 km2) and local (spatial scale: relevant source area of pollen sensu Sugita, 1993, ≥ ca. 1–5 km radius) vegetation cover, respectively (Sugita, 2007a, b). The REVEALS model was first tested and validated in southern Sweden (Hellman et al., 2008a, b) and later in other parts of Europe and the world (Mazier et al., 2012; Soepboer et al., 2010; Sugita et al., 2010).
The first pollen-based REVEALS reconstruction of plant cover over the Holocene covering a large part of Europe (Trondman et al., 2015) was used for the assessment of LULCC scenarios (Kaplan et al., 2017) and helped to evaluate climate model simulations using LULCC scenarios (Strandberg et al., 2014). A comparison between REVEALS-based open land cover from pollen records and Holocene deforestation simulated by HYDE 3.1 and KK10 showed that the REVEALS reconstructions were more similar to KK10 than HYDE 3.1 scenarios (Kaplan et al., 2017). Therefore, estimates of past plant cover from fossil pollen assemblages are essential to both test and constrain LULCC models and also provide alternative inputs to earth system models (ESMs), regional climate models (RCMs) and ecosystem models (Gaillard et al., 2018; Harrison et al., 2020). This allows improved assessments of biogeophysical and biogeochemical forcings on climate due to LULCC over the Holocene (Gaillard et al., 2010a; Harrison et al., 2020; Ruddiman et al., 2016; Strandberg et al., 2014, 2022).
Europe is of particular interest as one of the global regions that has experienced major human-induced land-cover transformations. Europe has large N–S and W–E gradients in modern and historical climate and land use (Marquer et al., 2014, 2017). Early agriculture dates back to the start of the Holocene in the south-eastern Mediterranean region (Palmisano et al., 2019; Roberts et al., 2019; Shennan, 2018), and human impact on vegetation across most of Europe is characterized by early land-cover changes through agriculture and the use of fire (Feurdean et al., 2020; Marquer et al., 2014; Strandberg et al., 2014, 2022; Trondman et al., 2015). There is therefore a clear need to extend quantitative vegetation reconstruction to the whole of Europe, including for the first time the Mediterranean region and additional areas of eastern Europe. The increase in the spatial coverage of sites and temporal scale to the entire Holocene to capture transient vegetation change at sub-millennial timescales is vital to capture information on the transformation of the biosphere by human actions. Europe has a deep history of pollen data production (Edwards et al., 2017) and an open-access repository for pollen records (the European Pollen Database, EPD) as well as regional pollen repositories (list of databases and access links in Sect. 2.2 and the “Data availability” section). These data repositories result in abundant pollen records that can be used for data-driven reconstructions of past vegetation patterns at continental scales. Pollen-based vegetation reconstructions for Europe have used community-level approaches (Huntley, 1990), biomization methods (Davis et al., 2015; Prentice et al., 1996), modern analogue techniques (MATs; Zanon et al., 2018) and pseudobiomization (Fyfe et al., 2010, 2015; Woodbridge et al., 2014). These approaches capture the major trends in vegetation patterns over the course of the Holocene (Roberts et al., 2018; Sun et al., 2020), and biomization methods have proved useful for evaluation of climate model results (Prentice and Webb, 1998). The results of these forms of pollen data manipulation either classify pollen data into discrete classes (e.g. biomization, pseudobiomization) or are semi-quantitative, capturing relative change though time based on all pollen taxa within a sample. They cannot achieve reconstructions of the cover of evergreen versus summer-green trees, for example, or the cover of individual tree and herb taxa. Although useful in summarizing palynological change over time based on entire pollen assemblages, such outputs are of limited use when differentiation of plant functional types (PFTs) is necessary (Strandberg et al., 2014). Forest cover over the Holocene inferred from pollen records using these approaches differs from forest cover obtained with REVEALS (Hellman et al., 2008a; Roberts et al., 2018); these differences confirm that REVEALS corrects biases resulting from the non-linearity of the pollen–vegetation relationship.
In this paper we present the results of the second generation of REVEALS-based reconstruction of plant cover over the Holocene in Europe after the first reconstruction published by Trondman et al. (2015). This second-generation reconstruction is, to date, the most spatially and temporally complete estimate of plant cover for Europe across the Holocene. As with the Trondman et al. (2015) reconstruction, this new dataset is specifically designed to be used in climate modelling. It is performed at a spatial scale of 1∘ × 1∘ (ca. 100 km × 100 km) across 30–75∘ N, 25∘ W–50∘ E (Europe and part of the eastern Mediterranean–Black Sea–Caspian corridor) (Fig. 1). The number of pollen records used (1128), the area covered and time length (entire Holocene) are a significant advancement for the results presented in Trondman et al. (2015), which used 636 pollen records covering NW Europe (including Poland and the Czech Republic but excluding western Russia and the Mediterranean area) and produced estimates for five time windows (in cal yr BP, hereafter abbreviated BP): 6200–5700, 4200–3700, 700–350 and 350–100 BP and 100 BP to present. Marquer et al. (2014, 2017) produced continuous REVEALS reconstructions over the entire Holocene, however, only for transects of individual sites (19 pollen records) and groups of grid cells around them.
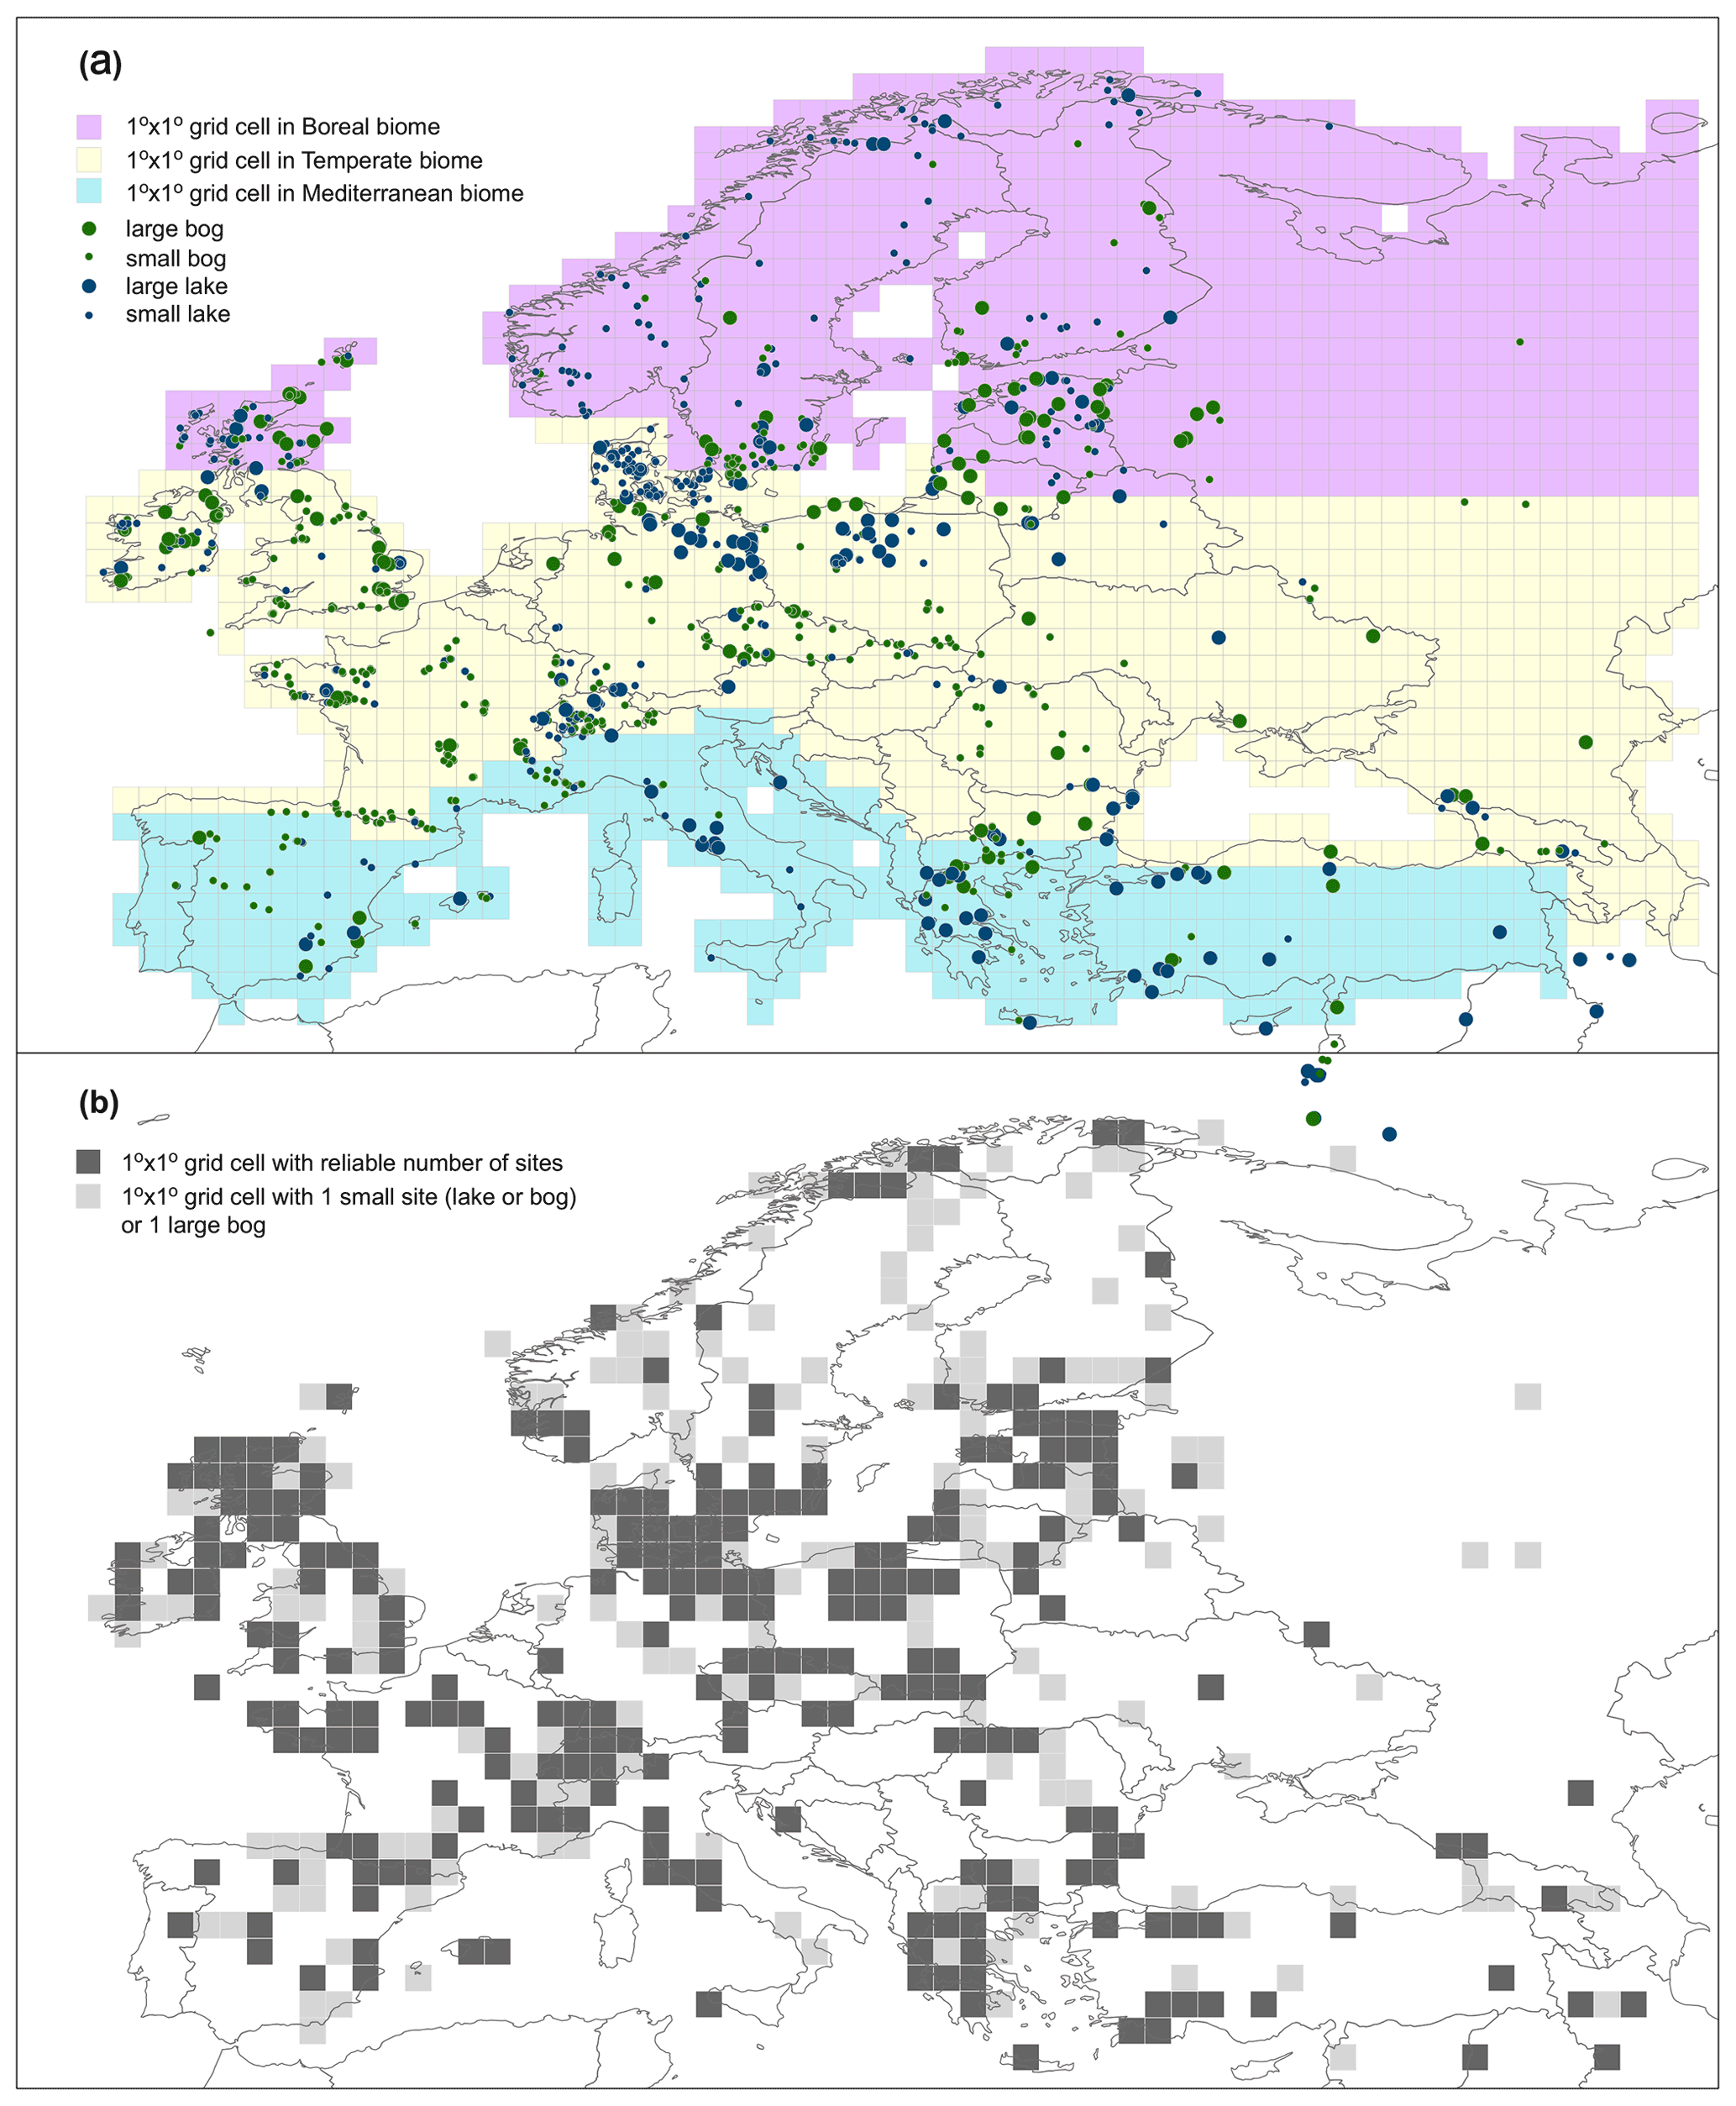
Figure 1Study region showing site coverage. (a) Colours represent different modern biomes (purple: boreal; yellow: temperate; blue: Mediterranean), while size and colour of circle represent site type and size (see caption in panel a). (b) Grid cell reliability dependent on number of pollen records. Black grid cells: reliable results; grey grid cells: less reliable results. Reliable: ≥1 large lake(s), ≥2 small lake(s) and/or small bog(s), mix of ≥1 large lake(s) and ≥1 small lake(s) and/or small bog(s); less reliable: 1 bog (large or small) or 1 small lake. See Sect. 4.1 for details and discussion on reliability of REVEALS results.
2.1 REVEALS model and parameters
The REVEALS model (Sugita, 2007a) is a generalized version of the R value model of Davis (1963). The development of pollen–vegetation modelling from the R value model, via the ERV (extended R value) models of Andersen (1970) and Parsons and Prentice (1981) through to the REVEALS model, is described in detail in numerous earlier papers (Broström et al., 2004; Bunting et al., 2013a; Sugita, 1993, 2007a).
Using simulations, Sugita (2007a) showed that “large lakes” represent regional vegetation; i.e. between-lake differences in pollen assemblages are very small, which was the case for lakes ≥50 ha in the simulations (Sugita, 2007a). Tests using modern pollen data from surface lake sediments have shown that pollen assemblages from lakes ≥50 ha are appropriate to estimate regional plant cover using the REVEALS model (e.g. tests by Hellman et al., 2008a, b, in southern Sweden and by Sugita et al., 2010, in northern America).
The REVEALS model (Eq. 1) calculates estimates of regional vegetation abundance in proportions or percentage cover using fossil pollen counts from large lakes (Sugita, 2007a).
The assumptions of the REVEALS model are listed in Sugita (2007a). Using simulations Sugita (2007a) demonstrated that, in theory, the model can also be applied to pollen records from multiple “small lakes” (<50 ha), i.e. lakes for which between lake differences in pollen assemblages can be large. However, the REVEALS estimates using pollen records from small lakes generally have larger standard errors (SEs) than those based on pollen data from large lakes. The latter was demonstrated for empirical pollen records from large lakes versus small sites (lakes and bogs) by Trondman et al. (2016) in southern Sweden and Mazier et al. (2012) in the Czech Republic. Although the application of the model to pollen data from bogs violates the model assumption that no plants grow on the basin, REVEALS can be applied using models of pollen dispersal and deposition for lakes or bogs. The Prentice model (Prentice, 1985, 1988) describes deposition of pollen at a single point in a deposition basin and is suitable for pollen records from bogs. Sugita (1993) developed the “Prentice–Sugita model” that describes pollen deposition in a lake, i.e. on its entire surface with subsequent mixing in the water body before deposition at the lake bottom. The original versions of both models use the Sutton model of pollen dispersal, i.e. a Gaussian plume model from a ground-level source under neutral atmospheric conditions (Sutton, 1953). A Lagrangian stochastic model (LSM) of dispersion has also been introduced as an alternative for the description of pollen dispersal in models of the pollen–vegetation relationship in general and in the REVEALS model in particular (Theuerkauf et al., 2012, 2016). It is difficult, in both theory and practice, to eliminate the effects of pollen coming from plants growing on sedimentary basins (e.g. Poaceae and Cyperaceae in bogs) on regional vegetation reconstruction. Previous studies have assessed the impacts of the violation of this assumption on REVEALS outcomes (Mazier et al., 2012; Sugita et al., 2010; Trondman et al., 2016, 2015). An empirical study in southern Sweden (Trondman et al., 2016) indicated that REVEALS estimates based on pollen records from multiple small sites (lakes and/or bogs) are similar to the REVEALS estimates based on pollen records from large lakes in the same region. The results also suggested that increasing the number of pollen records significantly decreased the standard error of the REVEALS estimates, as expected based on simulations (Sugita, 2007a). It is therefore appropriate to use pollen records from small bogs to increase the number of pollen records included in a REVEALS reconstruction following the protocol of the first-generation REVEALS reconstruction for Europe (Mazier et al., 2012; Trondman et al., 2015). However, REVEALS estimates of plant cover using pollen assemblages from large bogs should only be interpreted with great caution (Mazier et al., 2012; see also Sect. 4, “Discussion”).
The inputs needed to run the REVEALS model are original pollen counts, relative pollen productivity estimates (RPPs) and their standard deviation, fall speed of pollen (FSP), basin type (lake or bog), size of basin (radius), maximum extent of regional vegetation, wind speed (m s−1), and atmospheric conditions. FSP can be calculated using measurements of the pollen grains and Stokes' law (Gregory, 1973). RPPs of major plant taxa can be estimated using datasets of modern pollen assemblages and related vegetation and the extended R value model (e.g. Mazier et al., 2008). RPPs exist for a large number of European plant taxa, and syntheses of FSPs and RPPs were published earlier by Broström et al. (2008) and Mazier et al. (2012). The latter was used in the “first-generation” REVEALS reconstruction (Trondman et al., 2015). A new synthesis of European RPPs was performed for this “second-generation” reconstruction (Appendices A, B and C). Preparation of data from individual pollen records and the values of model parameters used are described below (Sect. 2.2 and 2.3).
2.2 Pollen records – data compilation and preparation
A total of 1143 pollen records from 29 European countries and the eastern Mediterranean–Black Sea–Caspian corridor were obtained from databases and individual data contributors. The contributing databases include the European Pollen Database (Fyfe et al., 2009; Giesecke et al., 2014), the Alpine Palynological Database (ALPADABA; Institute of Plant Sciences, University of Bern; now also archived in EPD), the Czech Quaternary Palynological Database (PALYCZ; Kuneš et al., 2009), PALEOPYR (Lerigoleur et al., 2015), and datasets compiled within synthesis projects from the Mediterranean region (Fyfe et al., 2018; Roberts et al., 2019) and the eastern Mediterranean–Black Sea–Caspian corridor (EMBSeCBIO project; Marinova et al., 2018) (see Fig. 1 for map, “Data availability” section for data location and “Team list” for individual pollen data contributors). We followed the protocols and criteria published in Mazier et al. (2012) and Trondman et al. (2015) for selection of pollen records and application of the REVEALS model. Available pollen records were filtered based on criteria including basin type (to exclude archaeological sites and marine records) and quality of chronological control (excluding sites with poor age–depth models or fewer than three radiocarbon dates). This resulted in 1128 pollen records from lakes and bogs, both small and large. The rationale behind the use of pollen records from small sites is based on the knowledge that REVEALS estimates based on pollen records from multiple sites provide statistically validated approximations of the regional cover of plant taxa (e.g. Trondman et al., 2016; see details of the REVEALS model in Sect. 2.1).
The taxonomy and nomenclature of pollen morphological types from the 1128 pollen records were harmonized. The pollen morphological types were then consistently assigned to 1 of 31 RPP taxa (Table 1; see Sect. 2.3 and Appendices A–C for details on the RPP dataset used in this study), following the protocol outlined in Trondman et al. (2015; SI-2 with examples of harmonization between pollen morphological types and RPP taxa). This process takes into account plant morphology, biology and ecology of the species that are included in each pollen morphological type. Consequently, RPP-harmonized pollen count data were produced for each of the 1128 pollen records. It should be noted that the EMBSeCBIO data do not contain pollen counts from cultivars; i.e. pollen from cereals and cultivated trees were deleted from the pollen records (Marinova et al., 2018). Therefore, the cover of agricultural land (represented by cereals in this reconstruction) will always be zero in the eastern Mediterranean–Black Sea–Caspian corridor in grid cells with only pollen records from EMBSeCBIO, even though agriculture did occur in the region from the early Neolithic.
For the application of REVEALS, an age–depth model (in cal yr BP) is required for each pollen record. We used the author's original published model, the model available in the contributing database or, where necessary, a new age–depth model was constructed following the approach in Trondman et al. (2015). The age–depth model for each pollen record is used to aggregate RPP-harmonized pollen count data into 25 time windows throughout the Holocene following a standard time division used in Mazier et al. (2012) and Trondman et al. (2015), which were later adopted by the Past Global Changes (PAGES) LandCover6k working group (Gaillard et al., 2018). The first three time windows (present–100 BP (where present is the year of coring), 100–350 BP, 350–700 BP) capture the major human-induced land-cover changes since the early Middle Ages. Subsequent time windows are contiguous 500-year-long intervals (e.g. 700–1200, 1200–1700, 1700–2200 BP) with the oldest interval representing the start of the Holocene (11 200–11 700 BP). The use of 500-year-long time windows is motivated by the necessity to obtain sufficiently large pollen counts for reliable REVEALS reconstructions. Since the size of the error in the REVEALS estimate partly depends on the size of the pollen count (Sugita, 2007a), the length of the time window should be a reasonable compromise to ensure both a useful time resolution of the reconstruction and an acceptable reliability of the REVEALS estimate of plant cover (Trondman et al., 2015).
Table 1Land-cover types (LCTs) and plant functional types (PFTs) according to Wolf et al. (2008) and their corresponding pollen morphological types. Fall speed of pollen (FSP) and the mean relative pollen productivity (RPP) estimates from the new RPP synthesis (see Sect. 2.3 and Appendices A–C for details) with their standard deviations in brackets (see text for more explanations).
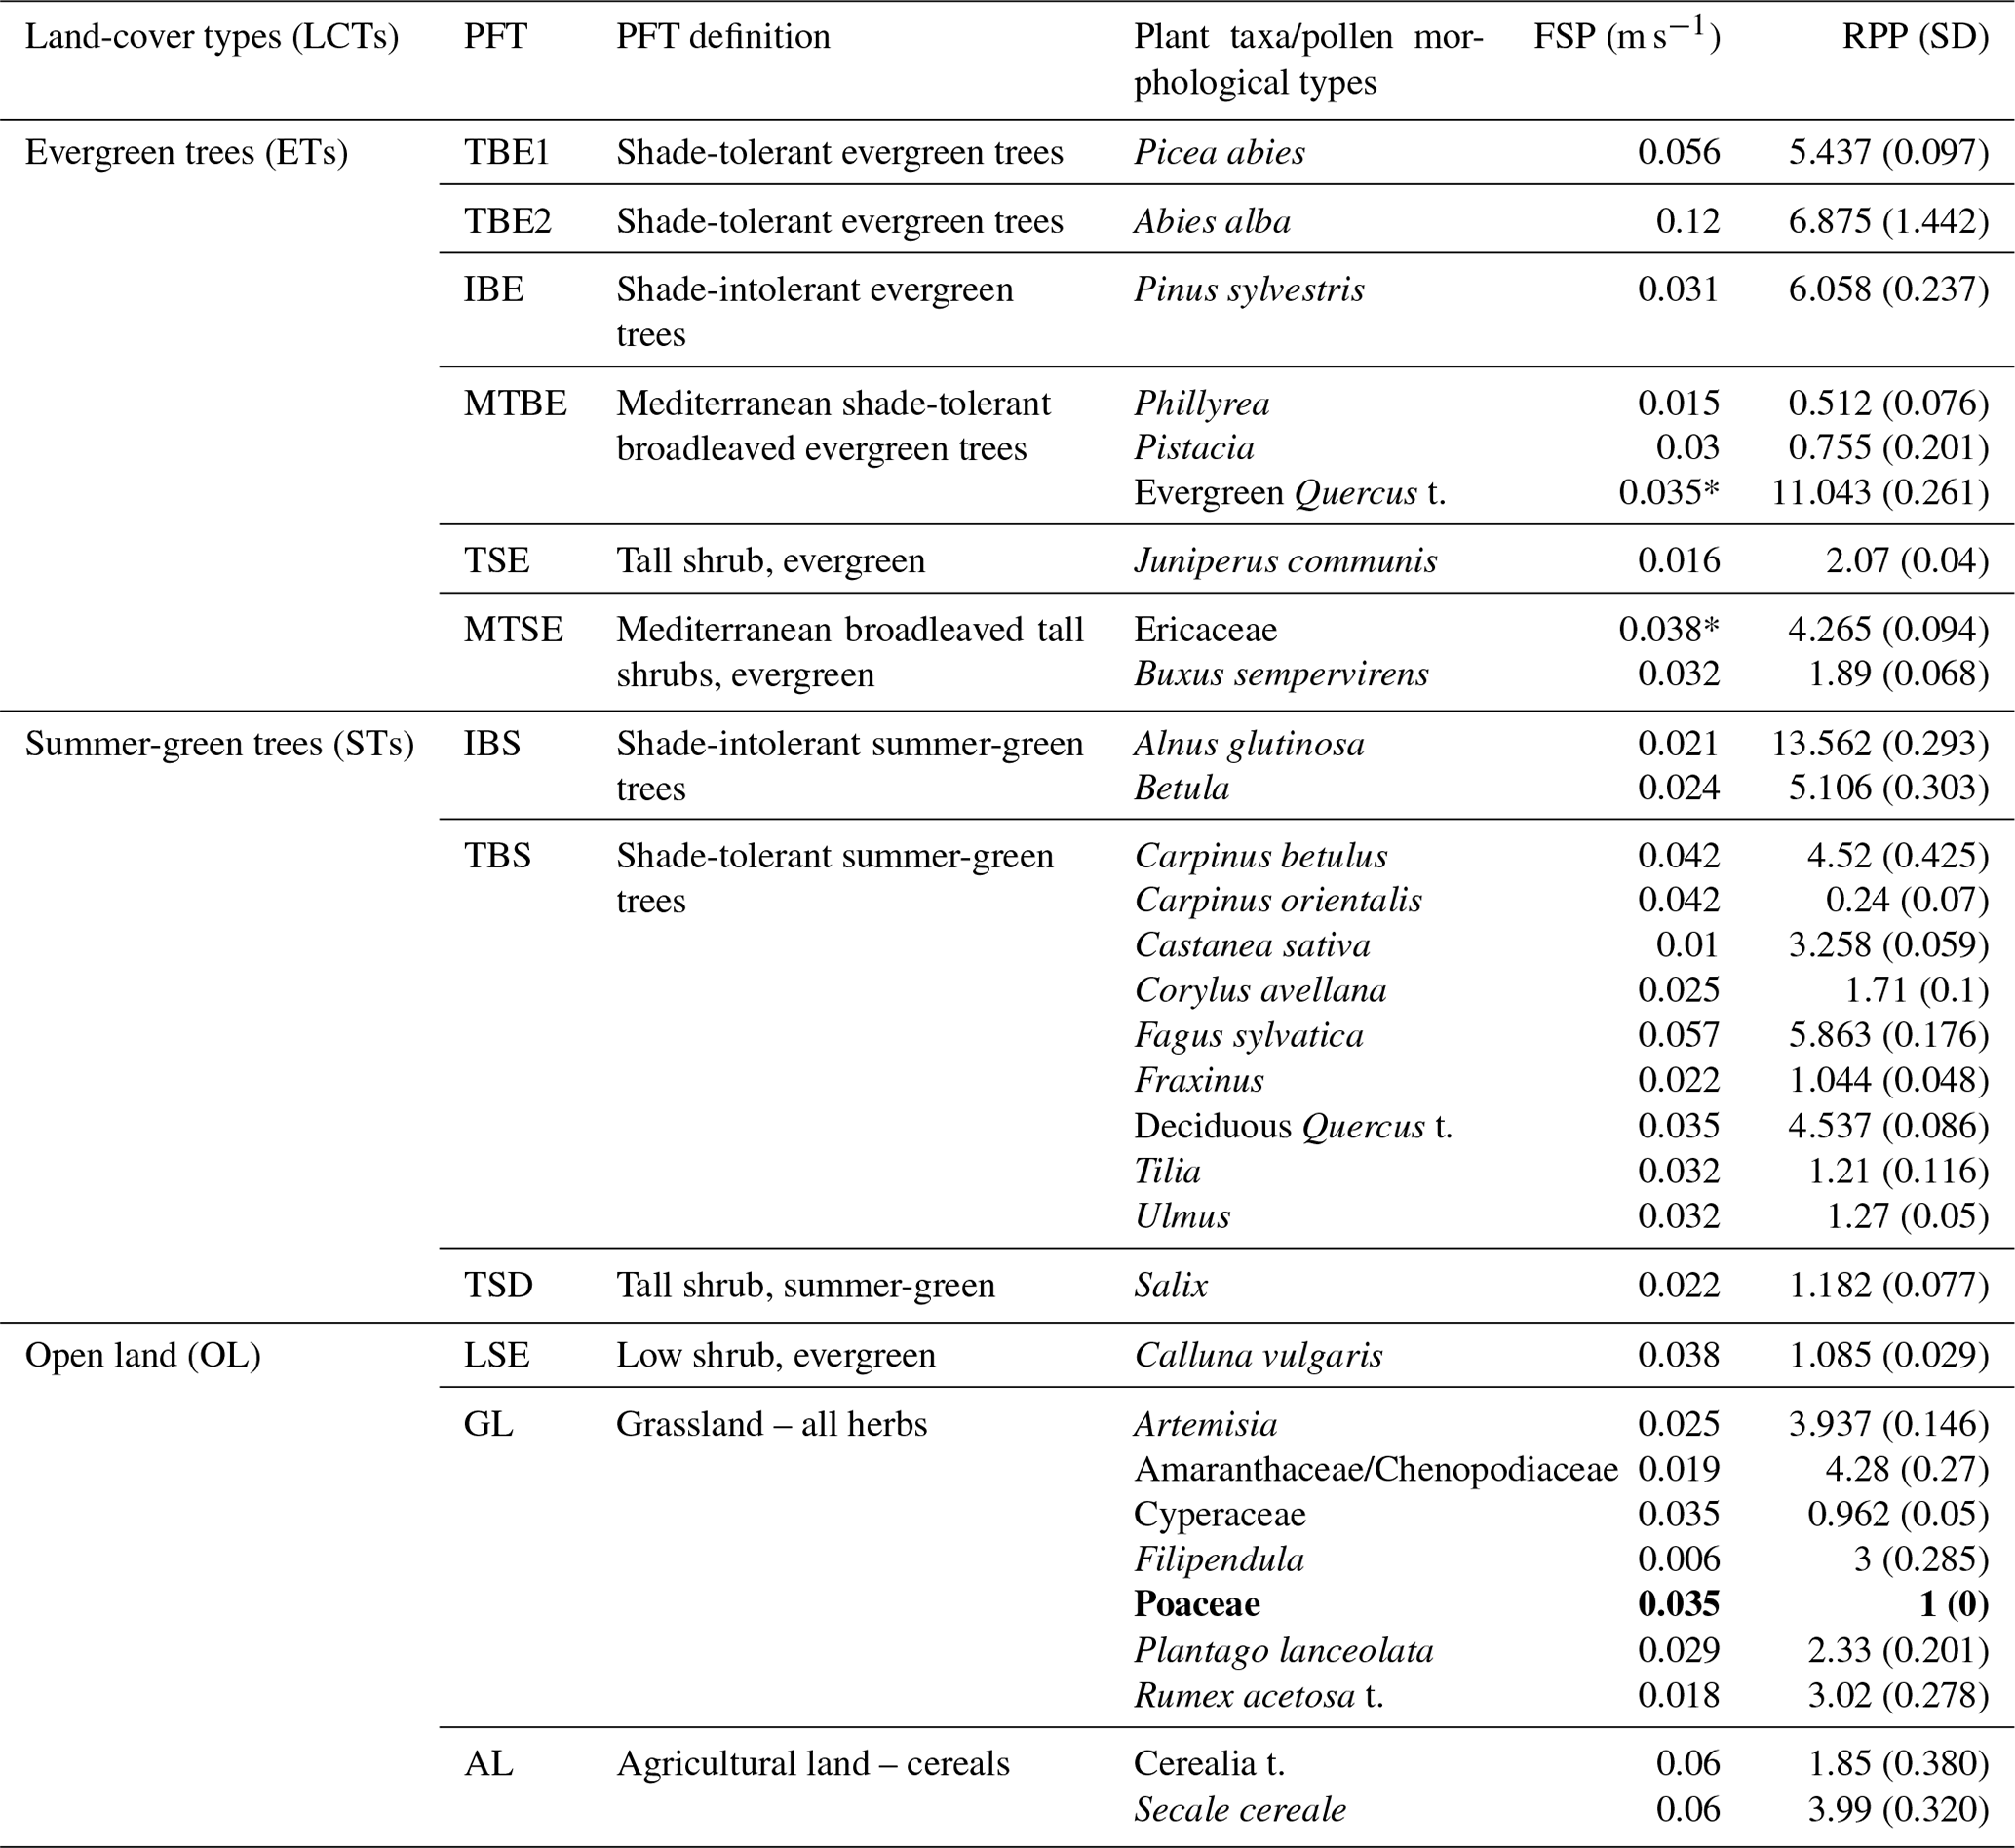
* The FSP values of evergreen Quercus t. and Mediterranean Ericaceae according to the original study (Mazier, unpublished) are 0.015 and 0.051, respectively (see Appendix B, Table B3). The value of 0.035 (FSP of deciduous Quercus t.) and 0.038 (FSP of boreal–temperate Ericaceae) was used instead (see discussion in Sect. 4.2 for explanation); t: type, e.g. evergreen Quercus t. RPP used in this study is relative to grass pollen productivity where Poaceae = 1 (indicated in bold).
2.3 Model parameter setting
For the purpose of this study, a new synthesis of the RPP values available for European plant taxa was performed in 2018–2019 based on the work by Mazier et al. (2012) and additional RPP studies published since then (Appendices A–C). This synthesis provides new alternative RPP datasets for Europe, including or excluding plant taxa with dominant entomophily and with the important addition of plant taxa from the Mediterranean area (Appendix A, Table A1). The selection of RPP studies, RPP values (shown in Appendix B, Tables B1 and B2), and calculation of mean RPP and their standard error (SD) for Europe are explained in Appendix C. The location of studies included in the RPP synthesis is shown in Fig. C1, and related information is provided in Table C1. The synthesis includes a total of 54 taxa for which RPP values are available (Tables B1 and B2); 39 taxa from studies in boreal and temperate Europe; and 15 taxa from studies in Mediterranean Europe, of which 7 include exclusively sub-Mediterranean and Mediterranean taxa: Buxus sempervirens, Carpinus orientalis, Castanea sativa, Ericaceae (Mediterranean species), Phillyrea, Pistacia and evergreen Quercus type (t.). RPP values are available from both boreal or temperate and Mediterranean Europe for seven taxa: i.e. Poaceae (reference taxon), Acer, Corylus avellana, Apiaceae, Artemisia, Plantago lanceolata and Rubiaceae (Table B2). Table A1 presents the new RPP dataset for the 54 plant taxa and, for comparison, the mean RPP values from Mazier et al. (2012) and from the recent synthesis by Wieczorek and Herzschuh (2020). Moreover, comparison with the RPP values of three studies not used in our synthesis is shown in Table A2. For the REVEALS reconstructions presented in this paper, we excluded strictly entomophilous taxa, which resulted in a total of 31 taxa (Table 1). The excluded taxa are Compositae (Asteraceae) SF Cichorioideae, Leucanthemum (Anthemis) t., Potentilla t., Ranunculus acris t. and Rubiaceae. We included entomophilous taxa that are known to be characterized by some anemophily, e.g. Artemisia, Amaranthaceae/Chenopodiaceae, Rubiaceae and Plantago lanceolata. We excluded plant taxa with only one RPP value except Chenopodiaceae, Urtica, Juniperus and Ulmus and the seven exclusively sub-Mediterranean and Mediterranean taxa mentioned above.
The FSP values (Tables 1 and A1) for boreal and temperate plant taxa were obtained from the literature (Broström et al., 2008; Mazier et al., 2012); these values were in turn extracted from Gregory (1973) for trees and calculated based on pollen measurements and Stokes' law for herbs (Broström et al., 2004). FSPs for Mediterranean taxa (Buxus sempervirens, Castanea sativa, Ericaceae (Mediterranean species), Phillyrea, Pistacia and Quercus evergreen type) were obtained by using pollen measurements and Stokes' law (Mazier et al., unpublished); the FSP of Carpinus betulus (Mazier et al., 2012) was used for Carpinus orientalis (Grindean et al., 2019).
The site radius was obtained from original publications where possible. Sites in the EMBSeCBIO were classified as small (0.01–1 km2), medium (1.1–50 km2) or large (50.1–500 km2). These were assigned radii of 399, 2921 and 10 000 m, respectively. Where a site's radius could not be determined from publication, it was geolocated in Google Earth, and the area of the site was measured. A radius value was extracted assuming that a site shape is circular (Mazier et al., 2012). A constant wind speed of 3 m s−1, assumed to correspond approximatively to the modern mean annual wind speed in Europe, was used following Trondman et al. (2015). Zmax (maximum extent of the regional vegetation) was set to 100 km. Zmax and wind speed influence on REVEALS estimates have been evaluated earlier in simulation and empirical studies (Gaillard et al., 2008; Mazier et al., 2012; Sugita, 2007a), which support the values used for these parameters. Atmospheric conditions are assumed to be neutral (Sugita, 2007a).
2.4 Implementation of REVEALS
REVEALS was implemented using the REVEALS function within the LRA R package of Abraham et al. (2014) (see “Code availability”, Sect. 5). The function enables the use of deposition models for bogs (Prentice's model) and lakes (Sugita's model) and two dispersal models (a Gaussian plume model and a Lagrangian stochastic model taken from the DISQOVER package; Theuerkauf et al., 2016). Within this study, the Gaussian plume model was applied. The REVEALS model was run on all pollen records within each 1∘ × 1∘ grid cell across Europe. The REVEALS function is applied to lake and bog sites separately within each 1∘ × 1∘ grid cell and combines results (if there is more than one pollen record per cell) to produce a single mean cover estimate (in proportion) and mean standard error (SE) for each taxon. The formulation of the SE is found in Appendix A of Sugita (2007a). The REVEALS SE accounts for the standard deviations of the relative pollen productivities for the individual pollen taxa (Table 1) and the number of pollen grains counted in the sample (Sugita, 2007a). The uncertainties in the averaged REVEALS estimates of plant taxa for a grid cell are calculated using the delta method (Stuart and Ord, 1994) and expressed as the SEs derived from the sum of the within- and between-site variations in the REVEALS results in the grid cell. The delta method is a mathematical solution to the problem of calculating the mean of individual SEs (see Appendix C in Li et al., 2020, for formula and further details). Results of the REVEALS function are extracted by time window, producing 25 matrices of mean REVEALS land-cover estimates and 25 matrices of corresponding mean SEs for each of the 31 RPP taxa and each grid cell. The 31 RPP taxa are also assigned to 12 plant functional types (PFTs) and 3 land-cover types (LCTs) (Table 1), and their mean REVEALS estimates were calculated. These PFTs follow Trondman et al. (2015), with the addition of two PFTs for Mediterranean vegetation not reconstructed in earlier studies: Mediterranean shade-tolerant broadleaved evergreen trees (MTBE) and Mediterranean broadleaved tall shrubs, evergreen (MTSE). The mean SE for LCTs and PFTs including more than one plant taxon are calculated using the delta method (Stuart and Ord, 1994), as described above.
2.5 Mapping of the REVEALS estimates
To illustrate the information that the new REVEALS reconstruction provides, we present and describe (Sect. 3) maps of the REVEALS estimates (per cent cover) and their associated SEs for the three LCTs (Figs. 2 to 4) and five taxa for eight selected time windows: the five taxa are Cerealia t. and Picea abies (Figs. 5 and 6), Calluna vulgaris, deciduous Quercus type (t.), and evergreen Quercus t. (Figs. D1–D3). The selection of the five taxa and eight time windows is motivated essentially by notable changes in the spatial distribution of these taxa through time, with higher resolution for recent times characterized by the largest and most rapid human-induced changes in vegetation cover. For visualization purposes, the estimates are mapped in nine per cent cover classes. These fractions are the same for the three LCTs (Figs. 2–4), and the mapped output can therefore be directly compared. In contrast, the colour scales used for the five taxa vary between maps depending on the abundance of the PFT or taxon (Figs. 5 and 6, D1–D3). Different taxa thus have different scales, and maps cannot be directly compared. We visualize uncertainty in our data by plotting the SE as a circle inside each grid cell; it is the coefficient of variation (CV; i.e. the standard error divided by the REVEALS estimate). Circles are scaled to fill the grid cell if the SE is equal to or greater than the mean REVEALS estimate (i.e. CV ≥1). Grid-based REVEALS results that are based on pollen records from just one large bog or single small bogs or lakes provide lower-quality results (see Sect. 2.1 on the REVEALS model and Sect. 4.1, “Data reliability”). The quality of REVEALS land-cover estimates by grid cell and time window is provided in Table GC_quality_by_TW (see Sect. 6, “Data availability”). The percentage scale ranges we use here are different from those used in the maps of Trondman et al. (2015), and therefore the data visualization cannot be directly compared.
The complete REVEALS land-cover reconstruction dataset includes mean REVEALS values (in proportions) and their related mean SE for 31 individual tree and herb taxa, 12 PFTs, and 3 LCTs for each grid cell in 25 consecutive time windows of the Holocene (11.7 cal kyr BP to present). Here, results are illustrated by maps of the three LCTs (Figs. 2–4) and five taxa (Figs. 5–6, D1–D3). The presented maps are not part of the published dataset archived in the PANGAEA online public database (see “Data availability”, Sect. 6); they are examples of how the data can be visually presented and what they can be used for.
3.1 Land-cover types
The three land-cover types are evergreen trees (ETs), summer-green trees (STs) and open land (OL). ETs include six PFTs which are composed of nine pollen morphological types (hereinafter referred to as taxa). STs include 3 PFTs which are composed of 12 taxa, while OL includes 3 PFTs that are in turn composed of 10 taxa (Table 1).
3.1.1 Open land (OL)
At the start of the Holocene, open land (OL) (Fig. 2) has higher cover in western Europe, where it generally exceeds 80 % compared with central Europe, where it is typically ∼60 %. There is a general decline in OL cover through the early Holocene. At 5700–6200 BP most grid cells in central Europe have the lowest OL cover values of between 10 %–50 %. In western Europe, whilst OL is generally reduced, several grid cells on the Atlantic fringe of northern Scotland persistently maintain 80 %–90 % OL cover. OL increases from the mid-Holocene, and by 2700–3200 BP the United Kingdom, France, Germany and the Mediterranean region have grid cells recording OL values >70 %. In central, northern and eastern Europe grid cells, OL values vary between 10 %–70 % at 2700–3200 BP. Time windows from the last 2 millennia show a consistent increase in OL with values >60 % across most of central, southern and western Europe and 20 %–70 % in northern Europe.
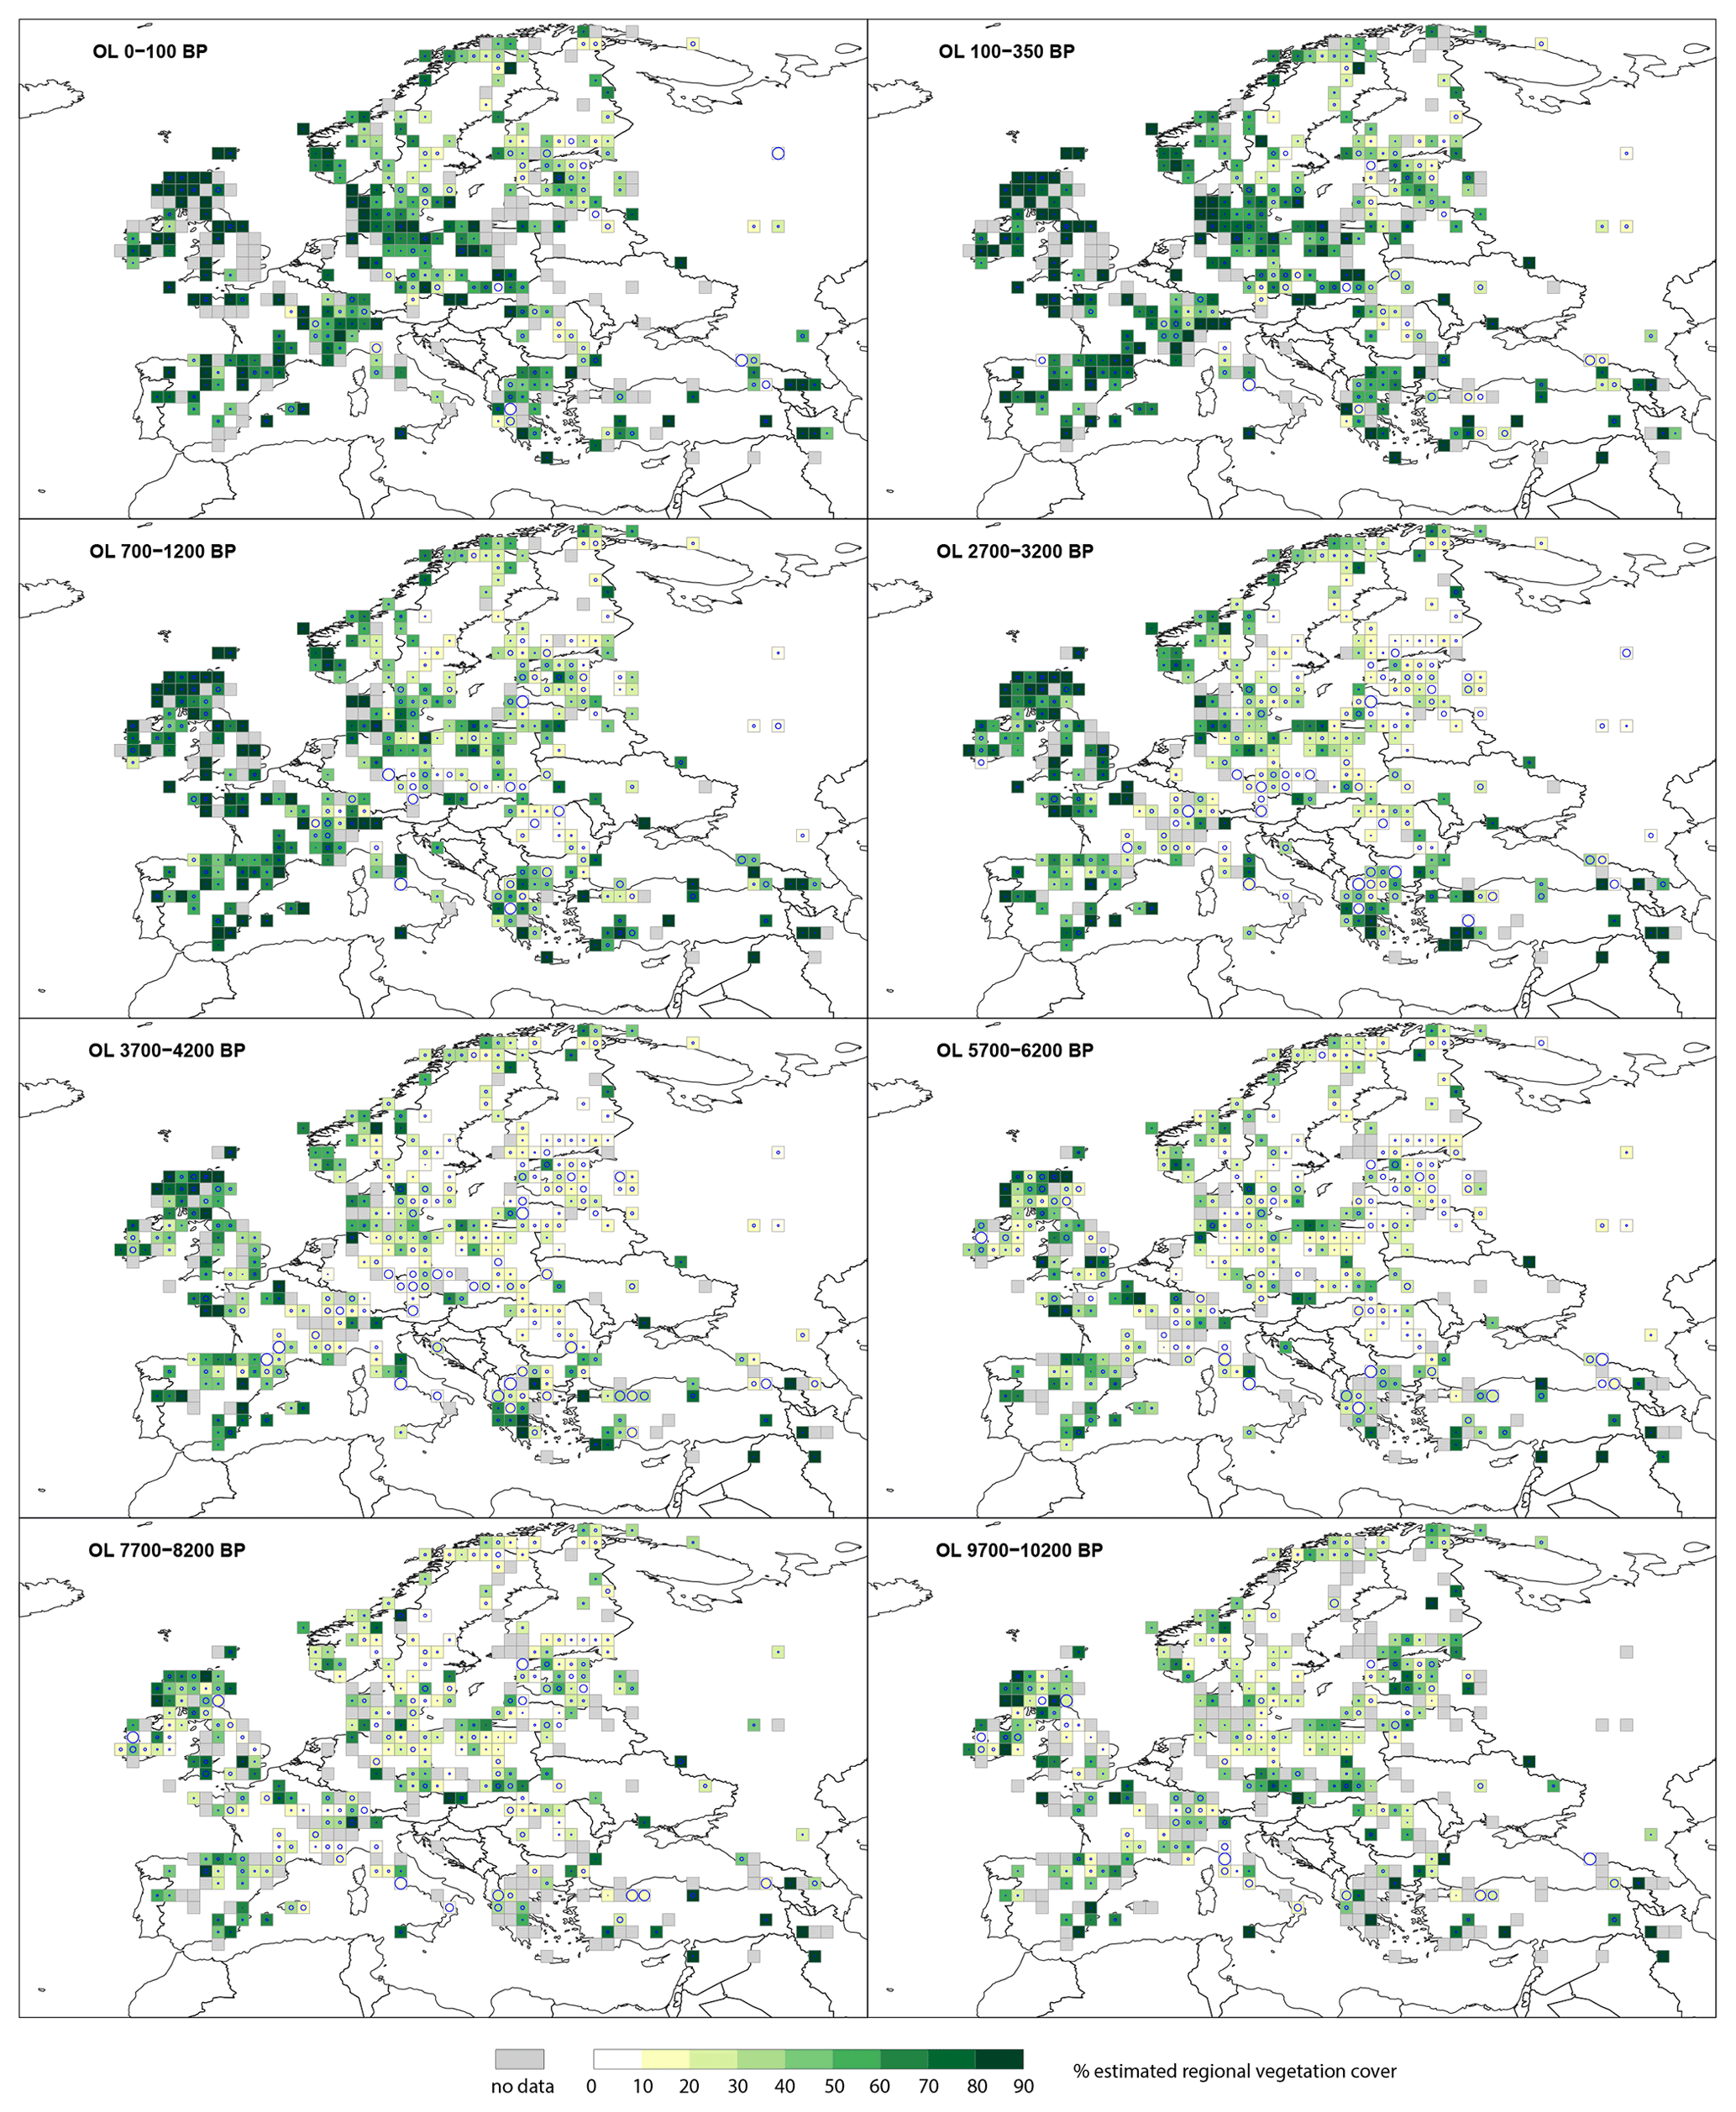
Figure 2Grid-based REVEALS estimates of open land (OL) cover for eight Holocene time windows. Percentage cover of open land in 10 % intervals represented by increasingly darker shades of green from 20 %. Grey cells: cells without pollen data for the time window but with pollen data in other time windows. Circles in grid cells represent the coefficient of variation (CV; the standard error divided by the REVEALS estimate). When SE ≥ REVEALS estimate, the circle fills the entire grid cell, and the REVEALS estimate is not different from zero. This occurs mainly where REVEALS estimates are low.
3.1.2 Evergreen trees (ETs)
The cover of evergreen trees (ETs) (Fig. 3) at 9700–10 200 BP is <30 % across Europe, and by 7700–8200 BP fewer than 30 grid cells show ETs >50 %. ET cover slowly increases through the early Holocene, and at 5700–6200 BP groups of grid cells in southern Europe record >80 %, while in northern Europe ET cover ranges between 10 % and 60 %. There is a consistent increase in ET cover over Europe during the mid and late Holocene, with ET cover peaking at 2700–3200 BP before starting to decline. Across western parts of Europe, including the United Kingdom, western France, Denmark and the Netherlands, ETs never exceed 20 % cover.

Figure 3Grid-based REVEALS estimates of evergreen tree (ET) cover for eight Holocene time windows. Percentage cover of evergreen trees in 10 % intervals represented by increasingly darker shades of green from 20 %. Grey cells: cells without pollen data for the time window but with pollen data in other time windows. Circles in grid cells represent the coefficient of variation (CV; the standard error divided by the REVEALS estimate). When SE ≥ REVEALS estimate, the circle fills the entire grid cell, and the REVEALS estimate is not different from zero. This occurs mainly where REVEALS estimates are low.
3.1.3 Summer-green trees (STs)
The cover of summer-green trees (STs) (Fig. 4) in the early Holocene at 9700–10 200 BP is >40 % across Europe. A small number (<10) of grid cells in northern, western, central and southern Europe have ST cover >60 %. This significantly increases towards 5700–6200 BP, at which time ST cover is >60 % in central Europe and 40 %–60 % in northern Europe. ST cover remains <20 % in southern Europe. From 5700–6200 BP there is a steady decline in ST cover across Europe. At 2700–3200 BP only central Europe has ST cover >50 %, while values are <50 % for the rest of Europe. There is a consistent decline over the last 2 millennia before present. Most of Europe has ST cover <30 % in the two last time windows (100–350 BP and 100 BP–present), except for a group of grid cells in the southern Baltic states and scattered records elsewhere.
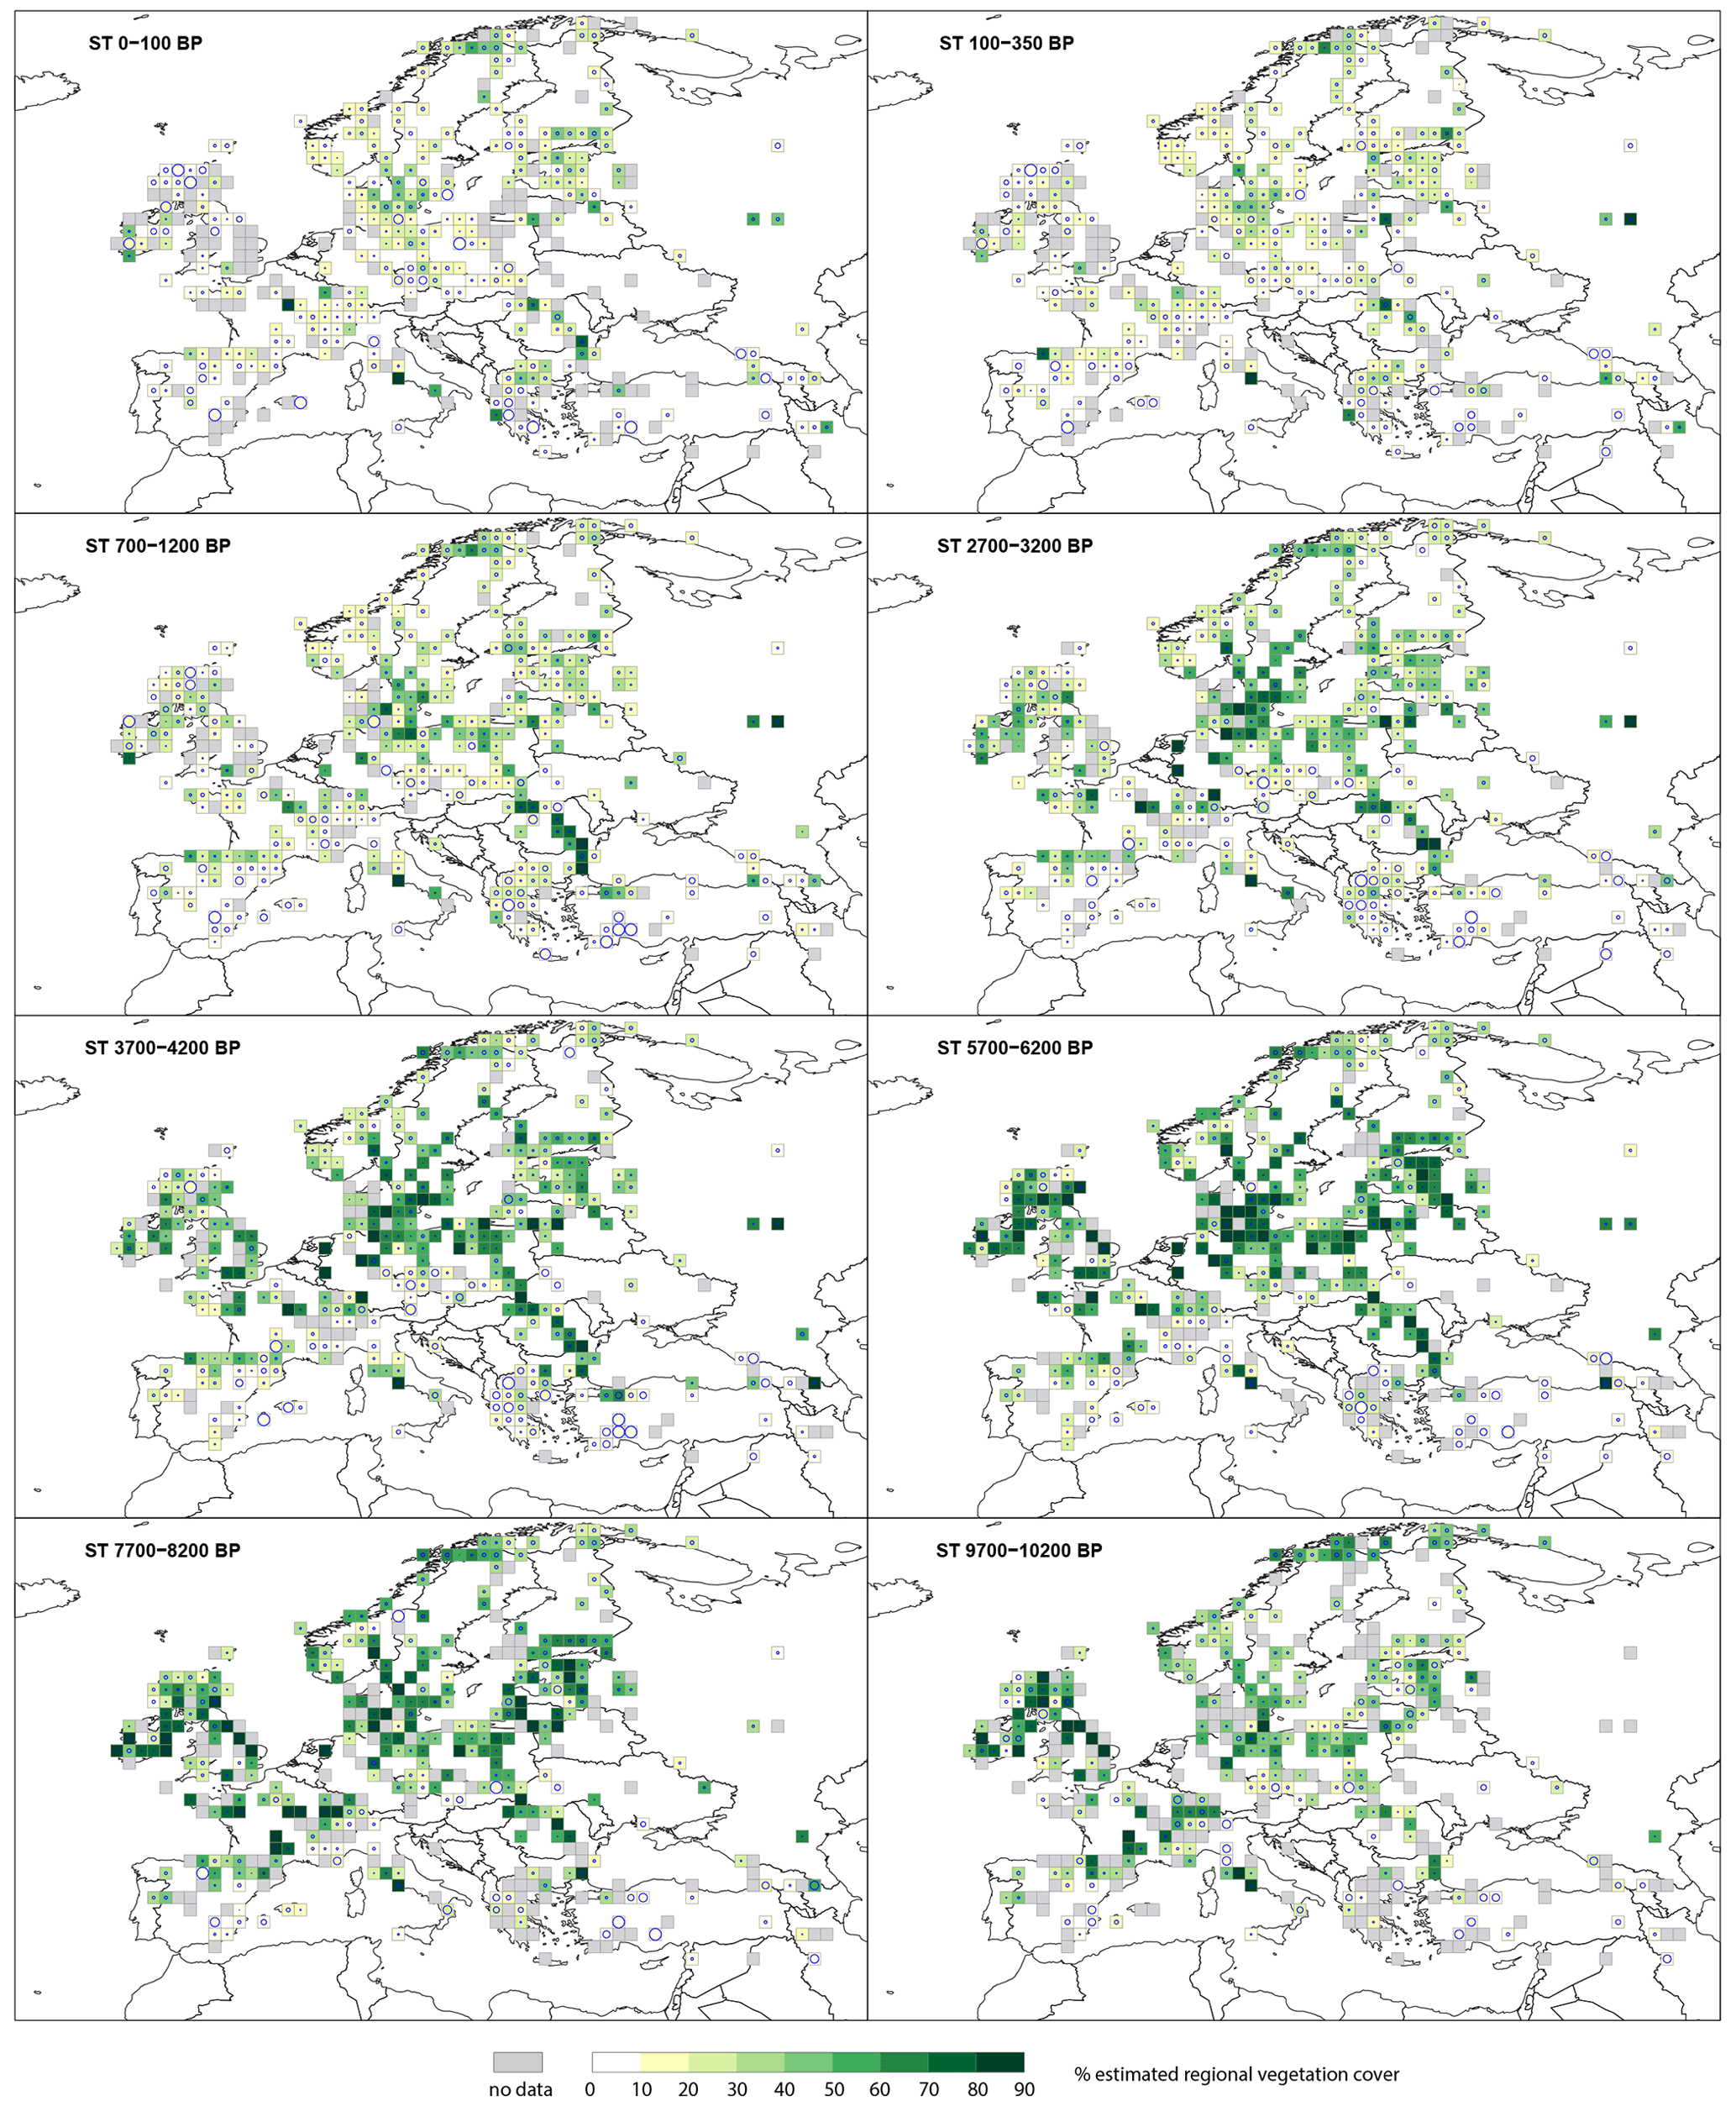
Figure 4Grid-based REVEALS estimates of summer-green tree (ST) cover for eight Holocene time windows. Percentage cover of STs in 10 % intervals represented by increasingly darker shades of green from 20 %. Grey cells: cells without pollen data for the time window but with pollen data in other time windows. Circles in grid cells represent the coefficient of variation (CV; the standard error divided by the REVEALS estimate). When SE ≥ REVEALS estimate, the circle fills the entire grid cell, and the REVEALS estimate is not different from zero. This occurs mainly where REVEALS estimates are low.
3.2 Selected taxa
In terms of PFTs, Cerealia type (t.) is assigned to agricultural land (AL), Picea abies to shade-tolerant evergreen trees (TBE1: Picea abies is the only taxon in this PFT), Calluna vulgaris to low evergreen shrubs (LSE: Calluna vulgaris is the only taxon in this PFT), deciduous Quercus t. to shade-tolerant summer-green trees (TBS) and evergreen Quercus t. to Mediterranean shade-tolerant broadleaved evergreen trees (MTBE) (Table 1).
3.2.1 Cerealia type
Cerealia t. (Fig. 5) is recorded throughout the Holocene, with 10 %–15 % as the maximum cover. Cerealia t. is present in southern Europe at 9700–10 200 BP, with several grid cells recording >5 % to 10 %. Whilst scattered grid cells in central and western Europe record the presence of Cerealia t. at very low levels (0.5 %–1 %), these values have high SE (greater than the REVEALS estimate) and are therefore not different from zero; they correspond to single findings of Cerealia t. By 5700–6200 BP, grid cells in Estonia and France record 3 %–5 % cover, and several regions within central and western Europe record 0 %–5 % (0.5 %–1 %), although with high SEs. At 2700–3200 BP, Cerealia t. is recorded across central and western Europe, in the United Kingdom, France, Germany, and Estonia, with low values. In Norway, Sweden and Finland it has 0 %–1 % cover with high SEs. The highest cover (>5 %) is observed across Europe from 1200 BP.
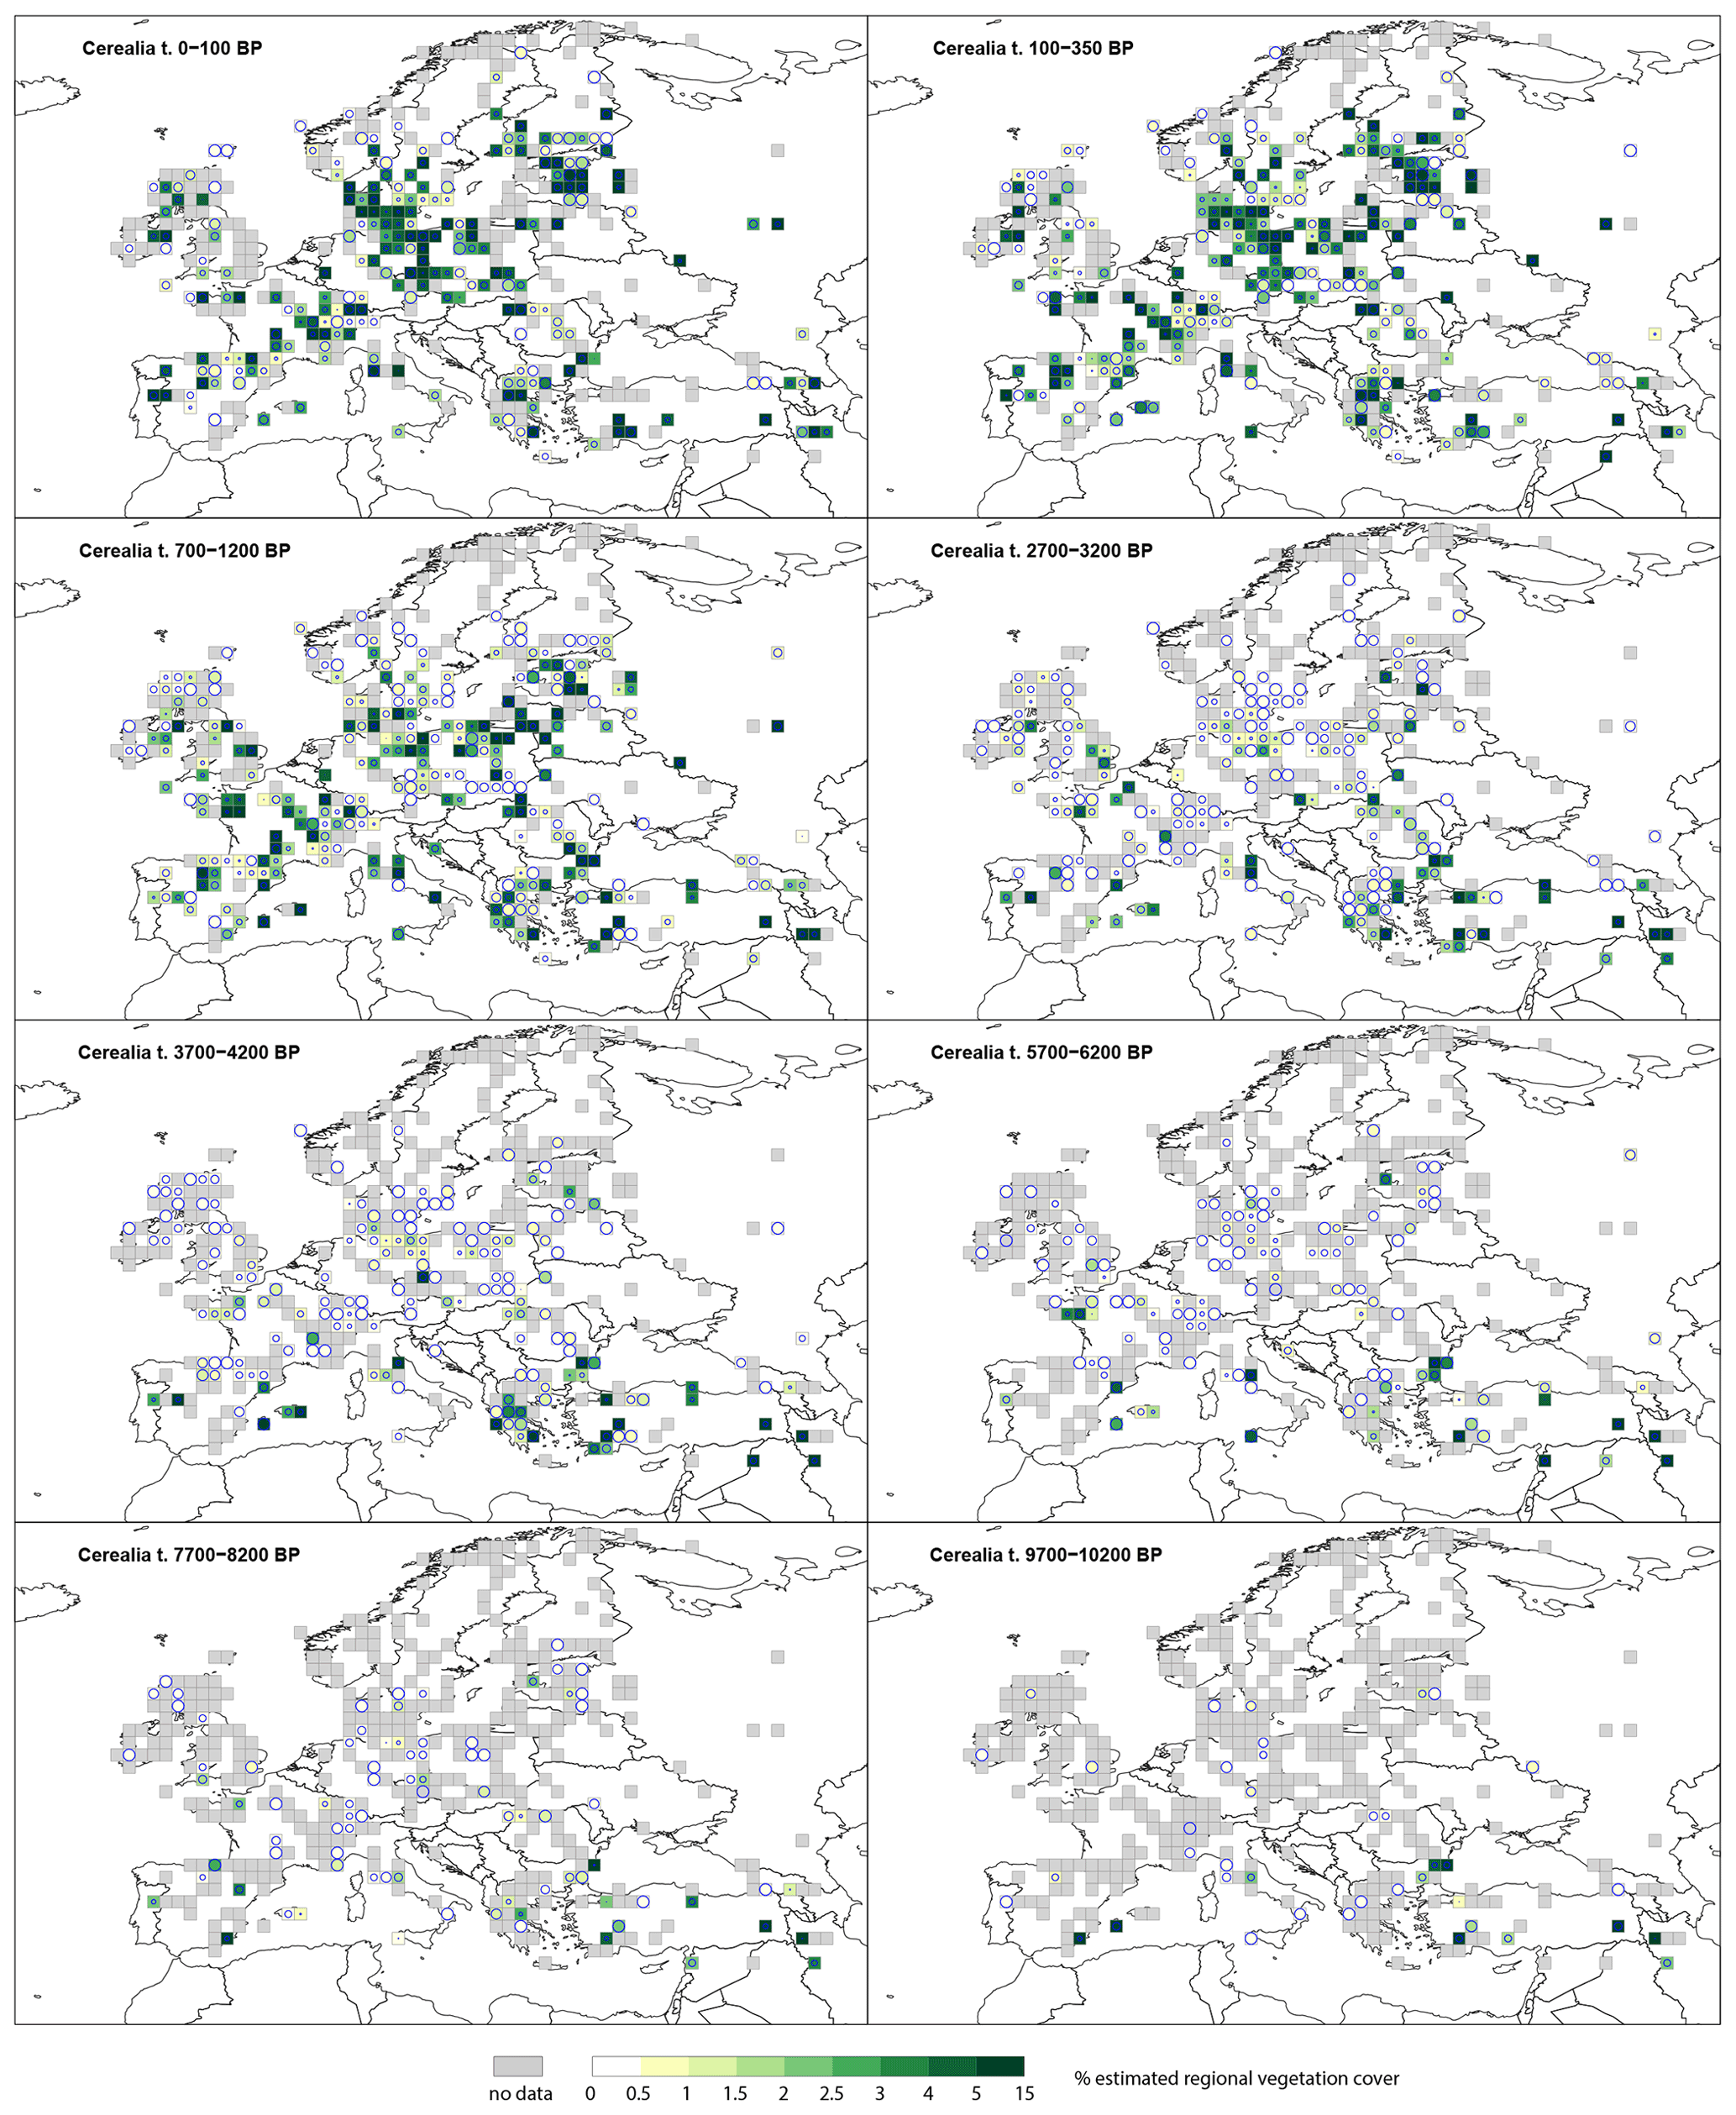
Figure 5Grid-based REVEALS estimates of Cerealia t. cover for eight Holocene time windows. Percentage cover in 0.5 % intervals between 0 % and 3 %, 1 % intervals between 3 % and 5 %, and 5 % intervals between 5 % and 10 %. Intervals represented by increasingly darker shades of green from 1 %–1.5 %. Grey cells: cells without pollen data for the time window but with pollen data in other time windows. Circles in grid cells represent the coefficient of variation (CV; the standard error divided by the REVEALS estimate). When SE ≥ REVEALS estimate, the circle fills the entire grid cell, and the REVEALS estimate is not different from zero. This occurs mainly where REVEALS estimates are low.
3.2.2 Picea abies
Picea abies cover (Fig. 6) is low (1 %–2 %) at 9700–10 200 BP, although a number of grid cells in central and eastern Europe record values between 30 % and 50 %. By 7700–8200 BP, grid cells recording 30 %–50 % cover are observed in more regions of central and eastern Europe than earlier (Russia, Estonia, Romania, Slovakia and Austria). At 5700–6200 BP, almost all of central Europe has consistent but low cover of Picea abies; values are higher towards north-eastern Europe (Russia, Estonia, Latvia, Belarus and Lithuania), up to 30 %–50 %. By 2700–3200 BP the cover of Picea abies has increased across central (ca. 10 %) and north-eastern Europe (>30 %). From 1200 BP, Picea abies is recorded in northern Europe, particularly in Norway and Sweden, with some grid cells recording 25 %–50 % cover.

Figure 6Grid-based REVEALS estimates of Picea cover for eight Holocene time windows. Percentage cover in 1 % intervals between 0 % and 2 %, 3 % intervals between 2 % and 5 %, 5 % intervals between 5 % and 30 %, and 20 % intervals between 30 % and 50 %. Intervals represented by increasingly darker shades of green from 5 %–10 %. Grey cells: cells without pollen data for the time window but with pollen data in other time windows. Circles in grid cells represent the coefficient of variation (CV; the standard error divided by the REVEALS estimate). When SE ≥ REVEALS estimate, the circle fills the entire grid cell, and the REVEALS estimate is not different from zero. This occurs mainly where REVEALS estimates are low.
3.2.3 Calluna vulgaris
During the Holocene, Calluna vulgaris cover (Fig. D1) peaks at 50 % and is largely distributed in a central European belt from the United Kingdom across to the southern Baltic States. At 9700–10 200 BP, it is recorded in only a few grid cells, mostly in central and western Europe, and at levels <10 %. Cover slowly increases, and by 7700–8200 BP, there are several grid cells with cover >25 % within the United Kingdom and with 10 %–20 % cover within Denmark. At 5700–6200 BP, grid cells in coastal locations in north-western Europe (particularly France, Germany and Denmark) have 50 % Calluna vulgaris cover. Cover steadily increases within the same grid cells, and by 2700–3200 BP, cover has increased in northern and eastern Europe, e.g. Norway and Estonia, with values up to 20 % cover. The highest cover of Calluna vulgaris is recorded in the last 2 millennia. Although some grid cells in south-eastern Europe record low cover values, these have high SE.
3.2.4 Deciduous Quercus type (t.)
Deciduous Quercus t. (Fig. D2) is recorded in central and western Europe at 9700–10 200 BP at low levels (<10 %), while in southern Europe (Italy) several grid cells record >20 % cover. By 7700–8200 BP, cover in central and western Europe is between 1 %–10 %, while in northern and eastern European grid cells it is <2 % with high SEs. During the mid-Holocene (5700–6200 BP) most of Europe, with the exception of some grid cells at the northern and south-eastern extremes, records deciduous Quercus t. cover values between 2 %–15 %. By 2700–3200 BP, % cover in the same grid cells has decreased to values between 2 %–10 %. Thereafter, the number of grid cells recording deciduous Quercus t. cover remains similar; however, the percentage cover slowly decreases, and at 350–100 BP, the number of grid cells with deciduous Quercus t. cover above 5 % is very low.
3.2.5 Evergreen Quercus type (t.)
The spatial distribution of evergreen Quercus t. (Fig. D3) remains the same throughout the Holocene. Cover of >30 % is restricted to only a few grid cells and time windows. At the start of the Holocene, evergreen Quercus t. is recorded with values <15 % in southern Europe (Spain, Italy, Greece and Turkey) with high SEs. Cover of evergreen Quercus t. does not exceed 15 % until 6700–7200 BP (not shown), in grid cells located in Turkey, Greece and Italy. From 6700–7200 BP there is an increase in the number of grid cells recording evergreen Quercus t. in southern Europe, but most show low cover values (<15 %) and have high SEs.
The results presented here are the first full-Holocene grid-based REVEALS estimates of land-cover change for Europe spanning the Mediterranean and temperate and boreal biomes and the first to highlight the spatial and temporal dynamics of 31 plant taxa, 12 PFTs and 3 LCTs across Europe over the last 11 700 years. Previous studies have demonstrated major differences between REVEALS results and pollen percentages (Marquer et al., 2014; Trondman et al., 2015) and the differences between REVEALS results and other methods used to transform pollen data, including pseudobiomization, and MAT (Roberts et al., 2018). It is not within the scope of this paper to evaluate the results in that context. This discussion focuses on the reliability and potential of this “second generation” of REVEALS land-cover reconstruction for Europe for use by the wider science community.
4.1 Data reliability
The REVEALS results are reliant on the quality of the input datasets, namely pollen count data, chronological control for sequences, and the number and reliability of RPP estimates used (see discussion on RPPs in Sect. 4.2). The standard errors (SEs) can be considered a measure of the precision of the REVEALS results and of reliability and quality (Trondman et al., 2015). Where SEs are equal to or greater than the REVEALS estimates (represented in the maps of Figs. 2–6 and D1–D3 as a circle that fills the grid), caution should be applied when using the REVEALS estimates as it implies that they are not different from zero when taking the SEs into account. Whilst this is possible within an algorithmic approach that includes estimates of uncertainty, it is conceptually impossible to have negative vegetation cover. If SEs ≥ mean REVEALS value, it is therefore uncertain whether the plant taxon has cover within the grid cell. Either the cover may be very low, or the taxon may be absent within the region (grid cell in this case).
The size of pollen counts impacts the size of REVEALS SEs (Sugita, 2007a); larger counts result in smaller SEs. Aggregation of samples from pollen records to longer time windows results in larger count sizes and thus lower SEs (see Sects. 2.2 above and 4.2 below). Our input dataset includes more than 59 million individual pollen identifications, organized here into 16 711 samples from 1128 sites, where a sample is an aggregated pollen count for RPP taxa for a time window at a site. A total of 77 % of samples have count sizes in excess of 1000, which is deemed most appropriate for REVEALS reconstructions (Sugita, 2007a). The mean count size across all samples is 3550. Samples with count sizes lower than 1000 are still used but result in higher SEs. More than half of the pollen records used in the study were sourced from databases (see Sect. 2.2). Note that the EMBSeCBIO taxonomy has been pre-standardized, and the data compilers have removed Cerealia type (t.). This means that for grid cells within the eastern Mediterranean–Black Sea–Caspian corridor, caution is advised in the interpretation of Cerealia type. Nevertheless, pollen from ruderals that are often related to agriculture, for example, Artemisia, Amaranthaceae/Chenopodiaceae and Rumex acetosa type, are included in the land-cover type open land (OL); therefore, changes in OL cover in the eastern Mediterranean–Black Sea–Caspian corridor may be related to changes in agricultural land (see also discussion below, Sect. 4.3, “agricultural land” PFT).
Aggregation of pollen counts to time windows depends on age–depth models. We have used the best age–depth models available to us, based on the chronologies presented in Giesecke et al. (2014) for EPD sites and through liaison with data contributors. Nevertheless, future REVEALS runs may draw on improvements to age–depth modelling, which may result in some original pollen count data being assigned to different time windows.
The REVEALS results presented here are provided for 1∘ × 1∘ grid cells across Europe. The size and number of suitable pollen records is an important factor in the quality of the REVEALS estimates for each grid cell. The REVEALS model was developed for use with large lakes (≥50 ha; Sugita, 2007a) that represent regional vegetation. Grid cells with multiple large lakes will thus provide results with the highest level of certainty and reflect the regional vegetation most accurately. These grid cell results comprised of one or more large lakes, several small sites (lake or bog), or a mix of large site(s) and small sites are considered “high-quality” (dark-grey grids in Fig. 1b). It has been shown both theoretically (Sugita, 2007a) and empirically (Fyfe et al., 2013; Trondman et al., 2016) that pollen records from multiple smaller (<50 ha) lakes will also provide REVEALS estimates that reflect regional vegetation. However, SEs may be larger if there is high variability in pollen composition between records. We therefore also consider grid cells with multiple sites “high-quality”. Application of REVEALS to pollen records from large bogs violates assumptions of the model (see Sect. 2.1 above). Therefore, REVEALS estimates for grid cells including large bogs or single small sites (lake or bog) may not be representative of regional vegetation, particularly in areas characterized by heterogeneous vegetation. We consider such estimates to be “lower-quality” (light-grey grids in Fig. 1b), although they may still provide first-order indications of vegetation cover and represent an improvement in pollen percentage data (Marquer et al., 2014). Our results provide REVEALS estimates for a maximum of 420 grid cells per time window. The number and type of pollen records in a grid cell can change between time windows: not all pollen records cover the entire Holocene. To assess the reliability of individual results it is important to consider not just the number and type of pollen records in the total dataset, but how these change between the time windows. Results for a maximum of 143 grid cells are based on 3 or more sites, 65 on 2 sites, and a minimum of 212 grid cells on a single site. The results of a maximum of 67 grid cells are based on single small bogs (<400 m radius), 68 on single small lakes (<400 m radius), and 82 on single large bogs.
4.2 Role of RPPs and FSP in REVEALS results
A key assumption of the REVEALS model is that RPP values are constant within the region of interest and through time (Sugita, 2007a). Nevertheless, it has been suggested that RPPs may vary between regions, with the variation caused by environmental variability (climate, land use), vegetation structure or methodological design differences (Broström et al., 2008; Hellman et al., 2008a; Mazier et al., 2012; Li et al., 2020; Wieczorek and Herzschuh, 2020). Wieczorek and Herzschuh (2020) have shown that inter-taxon variability in RPP values is generally lower than intra-taxon variability, lending support to application of the approach we used in the new synthesis of RPPs for Europe (Appendices A–C), i.e. calculation of mean RPPs using all available RPP values that can be considered to be reliable. Nevertheless, some RPP taxa still present a challenge, for example, Ericaceae, where Mediterranean tree forms have a greater number of inflorescences and hence may have a higher RPP than low-growth-form Ericaceae in central and northern Europe. As we only have a unique RPP value for Ericaceae in boreal–temperate Europe and a unique RPP value in Mediterranean Europe, the large difference in RPP between the two biomes remains to be confirmed with more RPP studies.
Currently there is higher confidence in the boreal and temperate RPP values that are based on a wider set of studies increasing the spread of values and hence reliability of the mean RPP values used (Mazier et al., 2012; Wieczorek and Herschuh, 2020), whilst RPP values for Mediterranean taxa are based on fewer empirical RPP studies. The new RPP datasets for Europe produced for this study (Appendices A–C) can be used in different ways. The RPPs provided in Table A1 can be used for the entire European region, including or excluding entomophilous taxa and including all values from the Mediterranean area or only the values for the strictly sub-Mediterranean and/or Mediterranean taxa. If one uses all RPPs from the Mediterranean area, there will be taxa for which there is both an RPP value obtained in boreal–temperate Europe and an RPP value obtained in Mediterranean Europe. Application of both RPP values in a single REVEALS reconstruction is not straightforward to achieve, because the border between the two regions has shifted over the Holocene. In the REVEALS reconstruction presented in this paper, we chose to use the RPPs from Mediterranean Europe only for the sub-Mediterranean and/or Mediterranean taxa (including Ericaceae) (Tables 1 and A1), and for all other taxa we used the RPPs from boreal/ temperate Europe. The major issue with this choice is the RPP value of Ericaceae. Using only the large value from Mediterranean Europe may lead to an under-representation of Ericaceae (Calluna excluded), in particular in boreal Europe, but perhaps also in temperate Europe. Using only the small value from boreal–temperate Europe may lead to an over-representation of Ericaceae in Mediterranean Europe.
Until we have more RPP values for each taxon, it is not possible to disentangle the effect of all factors influencing the estimation of RPPs and to separate the effect of methodological factors from those of factors such as vegetation type, climate and land use. The only way to evaluate the reliability of RPP datasets is to test them with modern or historical pollen assemblages and related plant cover (Hellman et al., 2008a, b). We argue that RPP values of certain taxa may not vary substantially within some plant families or genera, while they might be variable within others, depending on the characteristics of flowers and inflorescences that may be either very different or relatively constant within families or genera (see discussion in Li et al., 2018). Therefore, we advise to use compilations of RPPs at continental or sub-continental scales rather than compilations at multi-continental scales as the Northern Hemisphere dataset proposed by Wieczorek and Herzschuh (2020). We consider the RPP selection used within this work as the most suitable for Europe to date but expect revised and improved RPP values as more RPP empirical studies are published. Moreover, experimentation in REVEALS applications will allow future studies to evaluate the effects of using different RPP datasets on land-cover reconstructions (e.g. Mazier et al., 2012).
The role of FSP values in the pollen dispersal and deposition function (gi(z) in Eq. 1 of the REVEALS model, Sect. 2.1) has been discussed by Theuerkauf et al. (2012). In this application of REVEALS we used the Gaussian plume model (GPM) of dispersion and deposition as most existing RPP values have been estimated using this model. The GPM approximates dispersal as a fast-declining curve with distance from the source plant, which implies short distances of transport for pollen grain with high FSP compared to other models of dispersion and deposition (Theuerkauf et al., 2012). We have used the FSP values obtained for deciduous Quercus type (t.) (0.035 m s−1) and boreal–temperate Ericaceae (0.037 m s−1) for evergreen Quercus t. and Mediterranean Ericaceae, respectively, although the FSP values of those two taxa were estimated to be 0.015 and 0.051 in the Mediterranean study (Tables 1 and A1). Whether using a lower FSP for evergreen Quercus t. (0.015 m s−1) and a higher FSP for Mediterranean Ericaceae (0.051 m s−1) will have an effect on the REVEALS results is not known and requires further testing.
4.3 Use of the REVEALS land-cover reconstruction results
This second-generation dataset of pollen-based REVEALS land cover in Europe over the Holocene is currently used in two major research projects: LandClim and PAGES LandCover6k. LandClim is a Swedish Research Council project studying the difference in the biogeophysical effect of land-cover change on climate at 6000, 2500 and 200 BP (Fyfe et al., 2022; Githumbi et al., 2019; Strandberg et al., 2014, 2022; Trondman et al., 2015). PAGES LandCover6k focuses on providing datasets on past land cover and land use for climate modelling studies (Dawson et al., 2018; Gaillard et al., 2018; Harrison et al., 2020). The first-generation REVEALS land-cover reconstruction (Marquer et al., 2014, 2017; Trondman et al., 2015) was used to evaluate other pollen-based reconstructions of Holocene tree-cover changes in Europe (Roberts et al., 2018) and scenarios of anthropogenic land-cover changes (ALCCs) (Kaplan et al., 2017) (see also Sect. 1). The Trondman et al. (2015) reconstructions were used to create continuous spatial datasets of past land cover using spatial statistical modelling (Pirzamanbein et al., 2014, 2018, 2020).
Spatially explicit datasets and maps based on this second generation of REVEALS reconstructions are currently being produced within PAGES LandCover6k and used to evaluate and revise the HYDE (Klein Goldewijk et al., 2017) and KK10 (Kaplan et al., 2009) ALCC scenarios. Moreover, LandCover6k archaeology-based reconstructions of past land-use change (Morrison et al., 2021) will be integrated with the datasets of REVEALS land cover. Besides the uses listed above, the second generation of REVEALS reconstruction for Europe offers great potential for use in a large range of studies on past European regional vegetation dynamics and changes in biodiversity over the Holocene (Marquer et al., 2014, 2017) as well as the relationship between regional plant cover, land use and climate over millennial and centennial timescales. Since the reconstructions are of regional plant cover they will have value in archaeological research when impacts are expected at the regional level (e.g. the impact of early mining; Schauer et al., 2019). Archaeological questions and research programmes that require information on local vegetation cover will require the full application of the LRA (REVEALS and LOVE; Sugita, 2007a, b), such as the local vegetation estimates presented from Norway focussing on cultural landscape development (Mehl et al., 2015). The same approach of using the REVEALS results within the LOVE model is necessary for ecological questions that require local vegetation estimates (Cui et al., 2013, 2014; Sugita et al., 2010).
Several papers have discussed in depth the issues that need to be taken into account when interpreting REVEALS reconstructions of past plant cover, in particular Trondman et al. (2015) and Marquer et al. (2017). The interpretation in terms of human-induced vegetation change is one of the major challenges. The cover of open land (OL) may be used to assess landscape openness but is not a precise measure of human disturbance. OL will include plant taxa characterizing both naturally open land and agricultural land that has been created by humans through the course of the Holocene with the domestication of plants and livestock. Natural openness can occur in arctic and alpine areas, in wet regions, in river deltas, and around large lakes as well as in eastern steppe areas. It is a particular challenge in the Mediterranean region, where natural vegetation openness represents a larger fraction of the land cover than in temperate or boreal Europe (Roberts et al., 2019). Agricultural land (AL; Trondman et al., 2015) is the only PFT that includes cultivars; nevertheless, it is restricted to cereal cropping, and many other cultivated crop types that can be identified through pollen analysis do not yet have RPP values (e.g. Linum usitatissimum (common flax), Cannabis (hemp), Fagopyrum (buckwheat), beans). Moreover, the Cerealia t. pollen morphological type includes pollen from wild species of Poaceae, especially when identification relies essentially on measurements of the pollen grain and its pore and does not consider exine structure and sculpture (Beug, 2004; Dickson, 1988).
The maps presented and described in Sect. 3 as an illustration of the results show similar changes in spatial distributions and quantitative cover of plant taxa and land-cover types through time, between 6000 BP and the present, as the results published in Trondman et al. (2015). The much greater potential of the new REVEALS reconstruction resides in its larger spatial extent, covering not only boreal and temperate Europe but also southern and eastern Europe, and its contiguous time windows across the entire Holocene, from 11 700 BP to the present. The quality of results is also higher in a number of grid cells in comparison to Trondman et al. (2015), where new pollen records have been included, which may in several cases decrease the standard error of the REVEALS estimates.
REVEALS was implemented using the REVEALS function within the LRA R package (Abraham et al., 2014), available at https://github.com/petrkunes/LRA (last access: 5 April 2022).
Example code for data preparation and implementation of REVEALS, using two grid cells from SW Britain, is available at https://github.com/rmfyfe/landclimII (last access: 5 April 2022; Abraham et al., 2014).
All data files reported in this work which were used for calculations and figure production are available for public download at https://doi.org/10.1594/PANGAEA.937075 (Fyfe et al., 2022). The data available in Pangaea include (1) REVEALS reconstructions and their associated SE for the 25 time windows; (2) metadata of the 1128 pollen records used; (3) LandClimII contributors listing the data contributors, collectors and databases; (4) the list of FSP and RPP values used for the reconstructions; and (5) grid-cell-quality information (in terms of available pollen data, which influence the resulting quality: mean REVEALS estimate of plant cover) for all grid cells. Pollen data were extracted from ALPADABA (https://www.neotomadb.org/, last access: 5 April 2022), EMBSECBIO (https://doi.org/10.17864/1947.109; Harrison and Marinova, 2017), EPD (http://www.europeanpollendatabase.net/index.php, last access: 5 April 2022), LandClimI, PALYCZ (https://botany.natur.cuni.cz/palycz/, last access: 5 April 2022) and PALEOPYR (http://paleopyr.univ-tlse2.fr/, last access: 5 April 2022).
The application of the REVEALS model to 1128 pollen records distributed across Europe has produced the first full-Holocene estimates of vegetation cover for 31 plant taxa in 1∘ × 1∘ grid cells. These data are made available for use by the wider science community, including aggregation of results to PFTs and LCTs. The REVEALS model assumptions are clearly stated to allow interpretation and assessment of our results, and several of the assumptions have been tested and validated. We can therefore use the land-cover reconstructions to test the role of climate and humans in Holocene plant cover at regional scales. The overview of land-cover change across Europe over the Holocene can be used to track the timing and rate of vegetation shifts. We can also determine the effect of human-induced changes in regional vegetation cover on climate, i.e. study land use as a climate forcing (Gaillard et al., 2010a, 2018; Harrison et al., 2020; Strandberg et al., 2014). Local reconstructions (LOVE) can be a complementary approach to archaeological surveys as fine-scale human use of the landscape cannot be distinguished using REVEALS (regional estimates). The LOVE model requires that regional plant cover is known: the REVEALS reconstructions are therefore needed for this purpose as well, and gridded reconstructions may be a way to perform LOVE reconstructions, although other strategies can be chosen (Cui et al., 2013; Mazier et al., 2015). Questions aiming to understand the degree of vegetation openness through the Holocene in Europe or regarding changes in the relationship between summer-green and evergreen tree cover through time can now and in the future be answered and validated with fossil pollen data via the REVEALS approach. In the future, we expect improved REVEALS estimates as more pollen records are incorporated, and work on RPPs develops.
A1 New RPP synthesis for Europe
The most common method to estimate RPPs involves the application of the extended R value (ERV) model on datasets of modern pollen assemblages and related vegetation cover. A summary of the ERV model and its assumptions and an extensive description of standardized field methods for the purpose of RPP studies are found in Bunting et al. (2013a). Estimation of RPPs in Europe started with the studies by Sugita et al. (1999) and Broström et al. (2004) in southern Sweden and Nielsen (2004) in Denmark. The first tests of the RPP in pollen-based reconstructions of plant cover using the LRA's REVEALS (Regional Estimates of VEgetation Abundance from Large Sites) model (Sugita, 2007a) were published by Soepboer et al. (2007) in Switzerland and Hellman et al. (2008a, b) in southern Sweden. Over the last 15 years, a large number of RPP studies have been undertaken in Europe north of the Alps, but it is only recently that RPP studies were initiated in the Mediterranean area (Grindean et al., 2019; Mazier et al., unpublished). Two earlier syntheses of RPPs in Europe were published by Broström et al. (2008) and Mazier et al. (2012). From 2012 onwards, these RPP values have been used in numerous applications of the LRA's two models REVEALS and LOVE (LOcal Vegetation Estimates) (Sugita, 2007a, b) to reconstruct regional and local plant cover in Europe (Cui et al., 2013; Fyfe et al., 2013; Marquer et al., 2020; Mazier et al., 2015; Nielsen et al., 2012; Nielsen and Odgaard, 2010; Trondman et al., 2015). Wieczorek and Herzschuh (2020) published a synthesis of the RPPs available for the Northern Hemisphere; it includes new mean RPP values for Europe that were produced independently from the synthesis we present here.
Table A1 is the result of the new synthesis of RPPs available in Europe that we have performed for the REVEALS reconstruction presented in the paper. It includes RPPs for 39 plant taxa from studies in boreal and temperate Europe, of which 22 (Poaceae included) are herbs or low shrubs, and for 22 plant taxa from studies in the Mediterranean area. The two regions have RPP values for seven plant taxa in common. These RPPs are compared to those from two syntheses published earlier, Mazier et al. (2012) and Wieczorek and Herzschuh (2020). The number of selected RPP values (n) for Poaceae is larger than the total number of RPP (tn), i.e. . This is due to the fact that the study of Bunting et al. (2005) does not include a value for Poaceae, and the RPP values are related to Quercus (Bunting et al., 2005); therefore, RPPs related to Poaceae were calculated by assuming that the RPP value for Quercus (related to Poaceae; Quercus(Poaceae)) was the same in this study region as the mean of Quercus(Poaceae) RPPs from all other available studies. The pollen taxonomy and nomenclature follow the system used in the European Pollen Database (EPD; Fyfe et al. 2009).
The ranking of RPPs (relative to Poaceae, RPP = 1) for 23 tree taxa (M: Mediterranean taxa), from the largest (13.56) to the smallest (0.240), is as follows (Poaceae included for comparison): Alnus > evergreen Quercus t. (M) > Abies alba > Pinus > Fagus sylvatica > Picea abies > Ericaceae (M) > Betula > deciduous Quercus t. > Carpinus betulus > Populus > Juniperus > Corylus avellana > Castanea sativa > Sambucus nigra t. > Ulmus > Tilia > Salix > Fraxinus > Poaceae (=1) > Acer > Pistacia (M) > Phillyrea (M) > Carpinus orientalis (M). All tree taxa have mean RPPs larger than 1 except Acer (0.8), Pistacia (0.755), Phillyrea (0.512) and Carpinus orientalis (0.240). The ranking of RPPs for 24 herb and low shrub taxa, from the largest (10.52) to the smallest (0.10), is as follows: Urtica > Chenopodiaceae > Secale > Artemisia > Rubiaceae > Rumex acetosa t. > Filipendula > Plantago lanceolata > Trollius > Ranunculaceae (M) > Ranunculus acris t. > Cerealia t. > Potentilla t. > Plantago media > Calluna vulgaris > Poaceae (=1) > Cyperaceae > Plantago montana > Fabaceae (M) > Rosaceae (M) > Apiaceae > Compositae SF Cichorioideae > Empetrum > Leucanthemum (Anthemis) t. Of the taxa with RPPs larger than 3, only 6 taxa are herbs, while 12 are trees.
The two studies in the Mediterranean area provide single RPP values for 16 taxa, 5 herb taxa (Poaceae included) and 11 tree taxa, of which 6 are sub-Mediterranean and/or Mediterranean, and three include both temperate and Mediterranean taxa (Cupressaceae, Ericaceae, Fraxinus) (Table B2). The RPPs of herb taxa are significantly different between the study of Grindean et al. (2019) from the forest–steppe zone and our synthesis, except for Artemisia (5.89 and 3.94, respectively). The RPP of Corylus avellana from the study of Mazier et al. (unpublished) (3.44) is double the mean RPP in our synthesis (1.71), and the mean RPP of deciduous Quercus t. in our synthesis (4.54) is 4 times larger than the RPP from the study of Grindean et al. (2019) (1.10).
Table A1New synthesis of European RPPs: mean RPPs with their SDs in brackets and mean RPPs from the syntheses by Mazier et al. (2012) (St2 values) and Wieczorek and Herzschuh (2020) for comparison. This synthesis: values in bold are new mean RPPs compared to Mazier et al. (2012). The RPP values from studies in the Mediterranean area are indicated with “M” in the second column. The RPP and SD values in italic are the mean RPPs used in the new REVEALS reconstruction for Europe (this paper); values in bold are new values, and values not in bold are the same values as in Mazier et al. (2012). The values of fall speed of pollen (FSP) are from Mazier et al. (2012), except those in italic, i.e. FSPs for Amaranthaceae/Chenopodiaceae, Urtica and Sambucus nigra t. (Abraham and Kozáková, 2012), and Populus (Wieczorek and Herzschuh, 2020) and the new FSPs for Mediterranean taxa. For the three syntheses, the number of selected RPP values (n) included in the calculation of the mean RPP estimate is indicated with the total number of available RPP values (tn) in brackets. The reason why the number of selected RPP values (n) for Poaceae is larger than the total number of RPPs (tn) is provided in Sect. A1. Explanations for a–f are provided below the table.
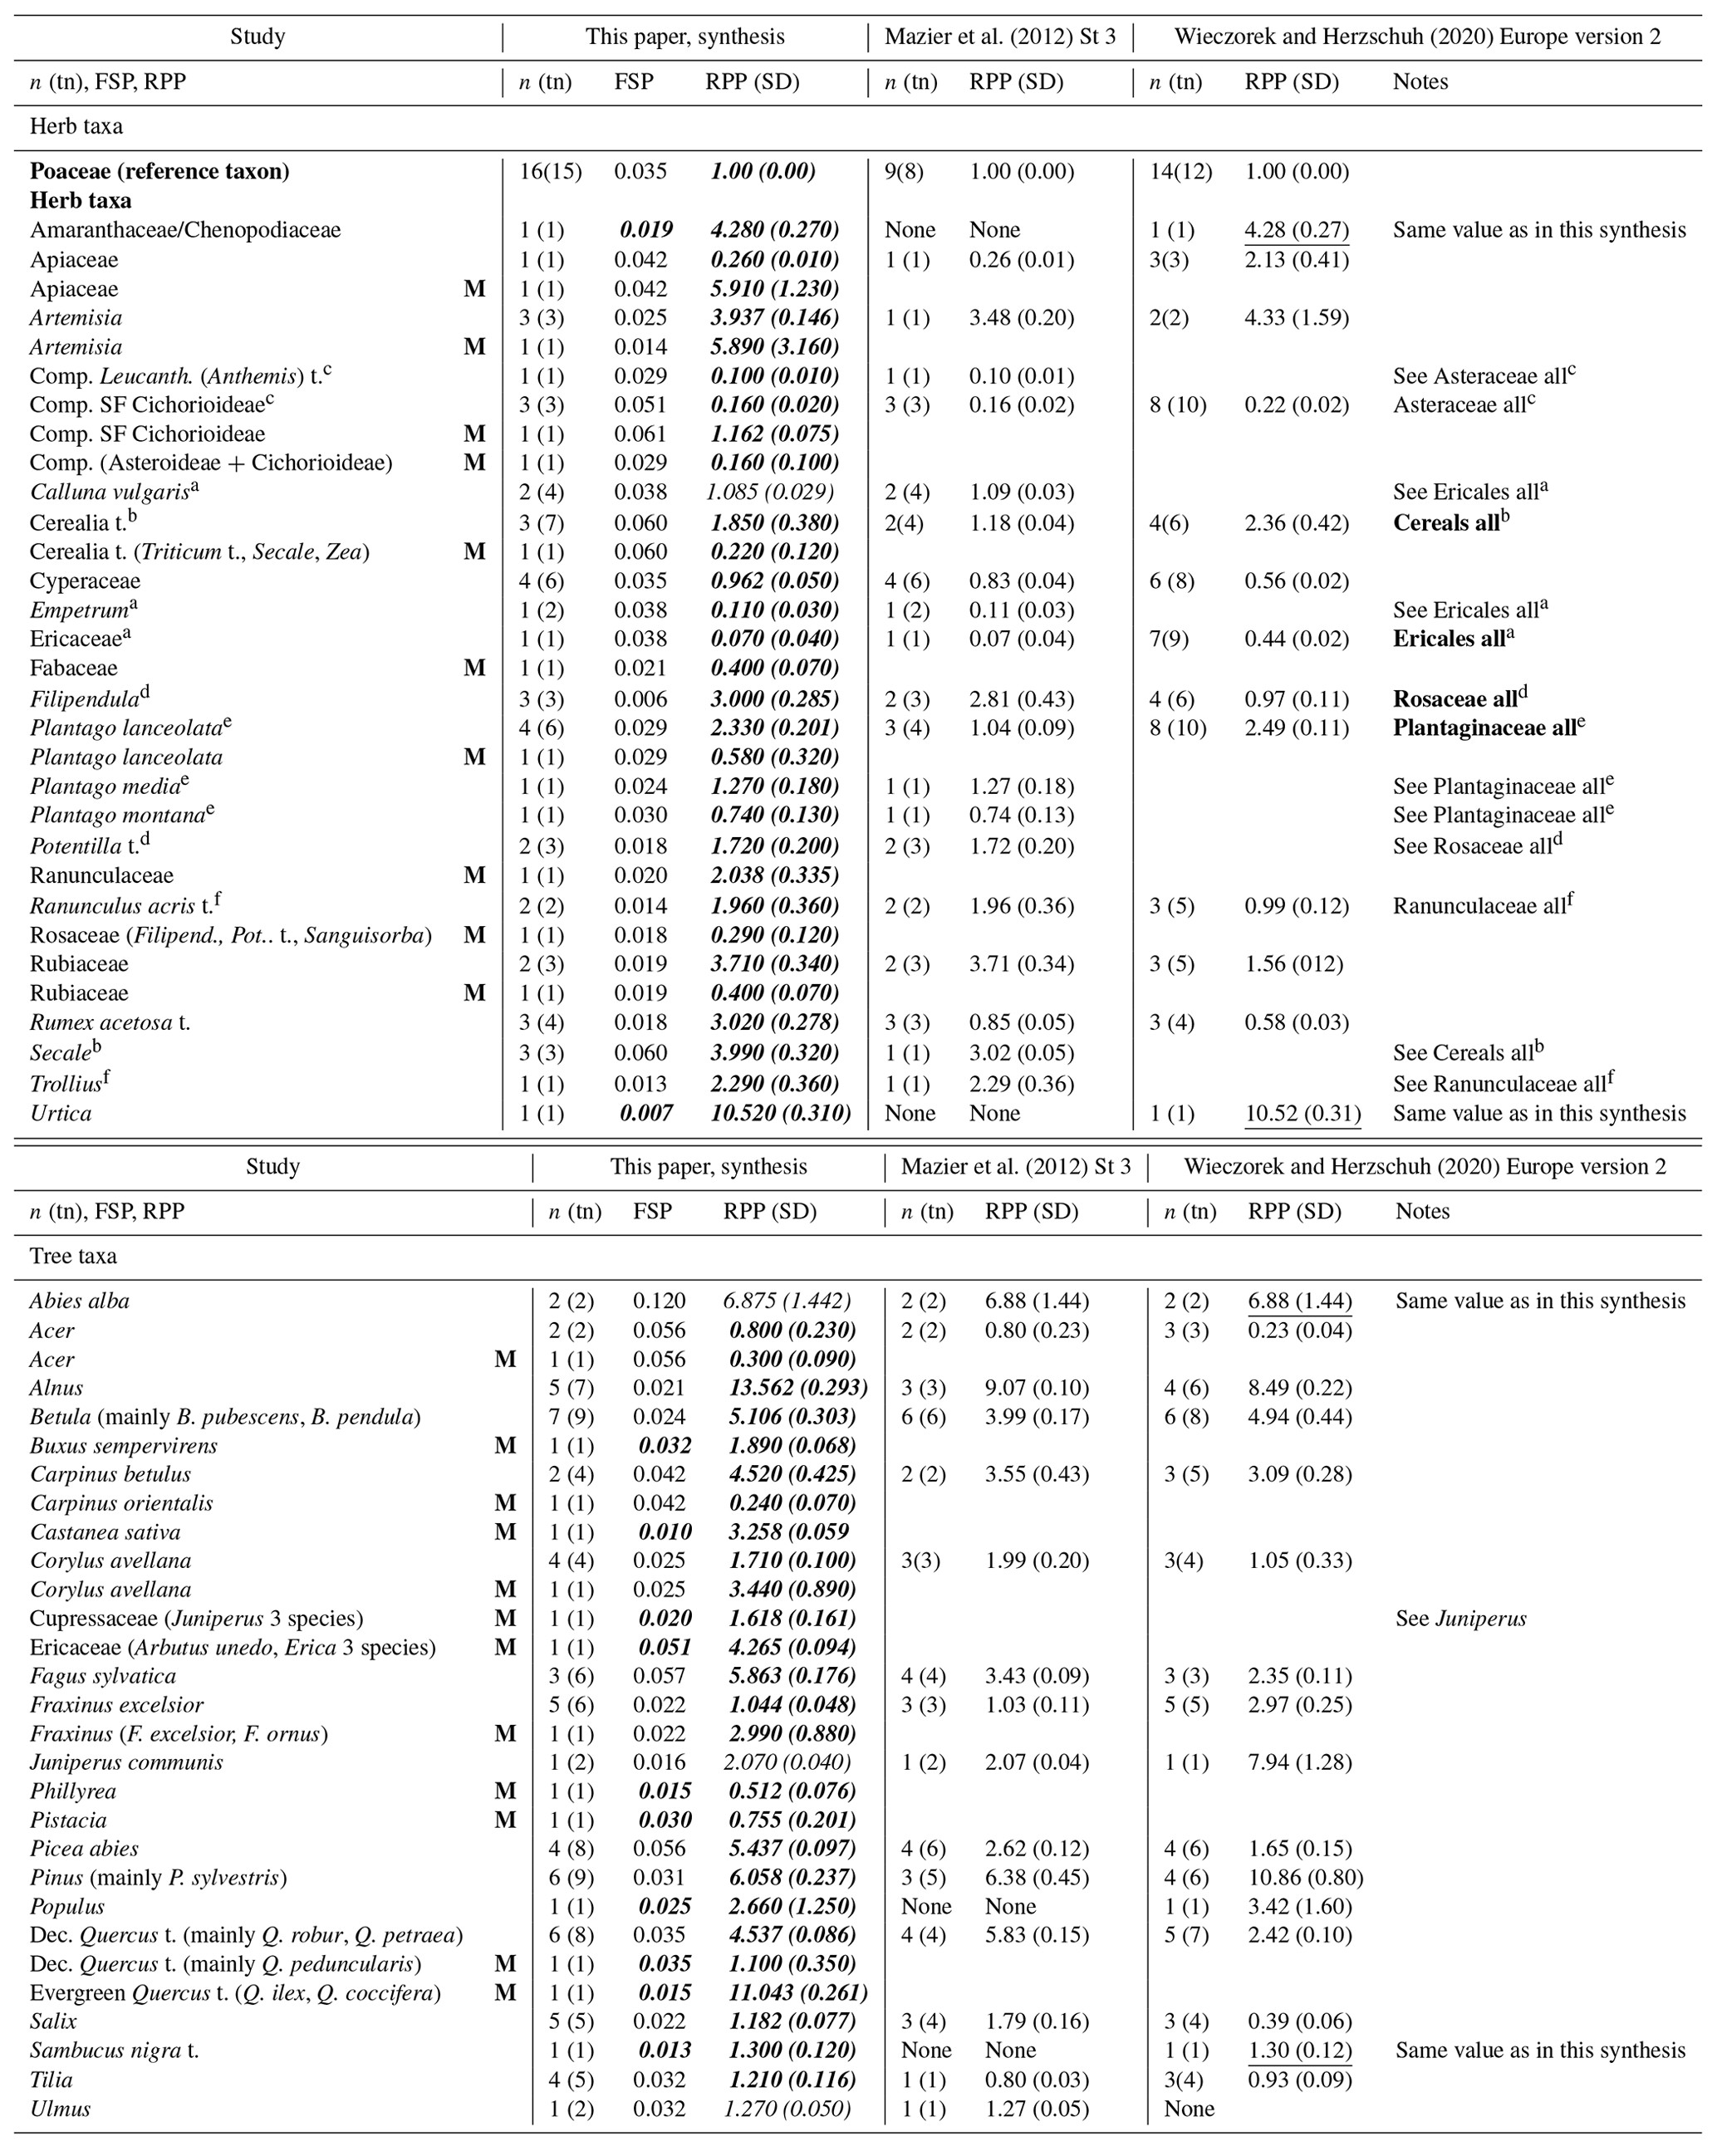
Abbreviations: Comp. – Compositae (Asteraceae), Dec. – deciduous, Filipend. – Filipendula, Leucanth. – Leucanthemum Pot. – Potentilla, SF – subfamily, t. – type. a Separate mean RPP values for Calluna vulgaris, Empetrum and Ericaceae (Calluna and Empetrum excluded) in this synthesis and a single mean RPP value for all Ericales in Wieczorek and Herzschuh (2020). b Separate mean RPP values for Cerealia type (Secale excluded) and Secale in this synthesis and a single mean RPP for all cereals in Wieczorek and Herzschuh (2020). c Separate mean RPP values for Compositae SF Cichorioideae and Leucanthemum (Anthemis) type in this synthesis and a single mean RPP for all Asteraceae in Wieczorek and Herzschuh (2020). Note that there are no RPPs for Asteraceae (Compositae SF Cichorioideae and Leucanthemum (Anthemis) type excluded) in our synthesis. d Separate mean RPP values for Filipendula and Potentilla type in this synthesis and a single mean RPP for all Rosaceae in Wieczorek and Herzschuh (2020). Note that there are no RPPs for Rosaceae (Filipendula and Potentilla-t. excluded) in our synthesis; moreover Filipendula and Potentilla t. are classified as herbs, while Rosaceae is classified as a tree in Wieczorek and Herzschuh (2020). e Separate mean RPP values for Plantago lanceolata, P. media and P. montana in this synthesis and a single mean RPP for all Plantaginaceae in Wieczorek and Herzschuh (2020). Note that there are no RPPs for Plantaginaceae (Plantago lanceolata, P. media and P. montana excluded) in our synthesis. f Separate mean RPP values for Ranunculus acris type and Trollius in this synthesis and a single mean RPP for all Ranunculaceae in Wieczorek and Herzschuh (2020). Note that there are no RPPs for Ranunculaceae (Ranunculus acris t. and Trollius excluded) in our synthesis.
A2 Comparison of the current synthesis with two previous syntheses (Table A1)
Of the 39 plant taxa for which we have a mean RPP in our new synthesis (New), 21 have a new mean RPP value compared to the earlier synthesis of Mazier et al. (2012) (Maz), and 18 taxa have the same mean RPPs in both syntheses. There are three new taxa for which there were no RPPs in Maz, i.e. Amaranthaceae/Chenopodiaceae, Sambucus nigra t. and Urtica. The mean RPPs are comparable between the two syntheses New and Maz, except for Plantago lanceolata (2.33 in New, 1.04 in Maz), Alnus (13.56, 9.07), Betula (5.11, 3.09), Carpinus betulus (4.52, 3.55), Fagus (5.86, 3.43), Picea (5.44, 2.62) and Quercus (4.54, 5.83). Abies alba has the same RPP in all three syntheses. Amaranthaceae/Chenopodiaceae, Sambucus nigra t. and Urtica have the same single RPP values in the synthesis of Wieczorek and Herzschuh (2020) (W&H) and New. New and W&H also have comparable mean RPP values for Artemisia, cereals (Cerealia t., Secale excluded in New; all cereals in W&H), Compositae (SF Cichorioideae in New, all Compositae (Asteraceae) in W&H), Cyperaceae, Plantago (P. lanceolata in New, all Plantaginaceae in W&H), Betula, Corylus, Populus and Tilia. There are relatively large differences in mean RPPs in W&H and New for 16 plant taxa, although the ranking of the plant taxa in terms of their mean RPPs is almost the same. Mean RPP is larger in W&H than in New for Apiaceae (2.13, 0.26), Ericales (in W&H (0.44), in New Empetrum (0.11) and Ericaceae (0.07)), Fraxinus (2.97, 1.04), Juniperus (7.94, 2.07), Pinus (10.86, 6.06). Mean RPP is smaller in W&H than in New for Filipendula (0.97, 3.00), Rubiaceae (1.56, 3.71), Rumex acetosa (0.58, 2.02), Acer (0.23, 0.80), Alnus (8.49, 13.56), Carpinus (3.09, 4.52), Fagus (2.35, 5.86)), Picea (1.65, 5.44), Quercus (2.42, 4.54) and Salix (0.39, 1.18).
The differences between the mean RPPs in New (boreal and temperate Europe, BT) and W&H are larger than those between New (BT) and Maz. This is partly due to differences in selection of studies in the three syntheses. The study of Theuerkauf et al. (2013) is only included in New (BT). The studies of Bunting et al. (2013b), Kuneš et al. (2019) and Grindean et al. (2019) are included only in W&H. Another important influencing factor is the selection of RPP values for calculation of the mean RPP. Although the rules used to select RPP values are very similar between the syntheses, there are obvious differences between New and W&H that are sometimes very significant (e.g. Juniperus).
Table A2Comparison of the mean RPPs in this synthesis with the RPP estimates from Britain (Twiddle et al., 2012), Greenland (Bunting et al., 2013b) and Czech Republic (Kuneš et al., 2019). RPP values are obtained using the extended R value (ERV) model (1 and 3 being two of the three existing ERV sub-models) and different models of pollen dispersion and deposition (or distance-weighting methods), here the Gaussian plume model (GPM) and the Lagrangian stochastic model (LSM) (see “Methods” in Appendix B and caption of Table C1); random: distribution of pollen samples in the study; R: ERV model implemented with an R code. Explanations for symbols a–f in the taxa list are in the caption below Table A1. The RPP and SD values in italic are the mean RPPs used in the new REVEALS reconstruction for Europe (this paper); values in bold are new values, and values not in bold are the same values as in Mazier et al. (2012). Underlined values are values from the three published studies that are close to the values of the synthesis in this paper. g The original paper does not provide an RPP for Poaceae and SDs for the RPPs. We extracted the RPP values related to Picea from Table 5 in Twiddle et al. (2012). RPPs related to Poaceae (1.00g) were then calculated by assuming that the RPP of Picea was equal to the mean RPP of Picea in Europe (this synthesis) (in bold). h The RPPs and their SDs are not listed in the original paper; we therefore extracted the values from Fig. 4 in Bunting et al. (2013b), and the decimals are approximate. i Kuneš et al. (2019): we chose the RPP values that were considered best by the authors, i.e. using the lake dataset (pollen from lake sediment), ERV sub-model 1 and the Lagrangian stochastic model (for details, see “Discussion” section in this paper). j Value for Plantago maritima and k two values for Rumex acetosa and Rumex acetosella, respectively (Bunting et al., 2013b), for comparison with Plantago spp. and Rumex acetosa t. (this paper).

A3 Comparison of the new synthesis with three additional individual studies (Table A2)
The RPPs from Twiddle et al. (2012) (Twi) for Pinus, Betula and Calluna are considerably larger than the mean RPPs in our synthesis (New). This is probably due to the assumption made on the RPP of Picea related to Poaceae. The RPP of Picea varies greatly between the selected studies in New, from 0.57 to 8.43 (eight values available). If we assumed that the RPP of Picea related to Poaceae in the study region of Twi was the mean RPP of the five smallest RPPs, i.e. 1.57, the RPP of the three taxa would be 4.8 for Pinus, 3.4 for Betula and 3.3 for Calluna, which is more comparable to the mean RPPs in New.
Three taxa in Bunting et al. (2013b) (Bun) have an RPP comparable to the mean RPP in New, i.e. for Cyperaceae, Ranunculus acris t. and Rumex acetosa t. (R. acetosa in Bun). The other taxa have an RPP in Bun smaller than the mean RPP in New, except Plantago maritima, which has a larger RPP (5.8) in Bun than the mean RPP for P. lanceolata in New.
Of nine taxa, three have an RPP in Kuneš et al. (2019) (Kun) that is comparable to the mean RPP in New, i.e. for Plantago lanceolata, Ranunculus acris t. and Rumex acetosa t. The RPPs of the other six taxa are larger in Kun than the mean RPP in New (Compositae SF Cichorioideae, Cyperaceae, Leucanthemum (Anthemis) t.) or smaller (Amaranthaceae/Chenopodiaceae, Rubiaceae) to considerably smaller (Urtica). Of the 14 tree taxa, only 4 have an RPP in Kun comparable to the mean RPP in New, i.e. for Corylus, Fraxinus, Salix and Ulmus. For the other 10 tree taxa, the RPP in Kun is much smaller than the mean RPP in New for Abies alba, Alnus, Carpinus, Fagus, Picea and Pinus; smaller for Quercus; and larger for Acer and Tilia.
Most of the RPP values of the three studies Twi, Bun and Kun are in the range of the values selected from the studies included in our synthesis (New) except for Urtica, Abies alba, Carpinus and Pinus in Kun. The Lagrangian stochastic model is used in Kun instead of the Gaussian plume model in New, which may be one of the factors behind the lower RPPs in Kun, in particular (but not only) for taxa with heavy pollen grains.
Methods
Tables B1 (boreal and temperate Europe) and B2 (Mediterranean Europe) list the RPP values from the 16 selected studies according to the information on models used provided in Appendix C (Table C1) with further explanations on selection of RPP studies. We followed similar procedures and rules as Mazier et al. (2012) and Li et al. (2018) to produce a new standard RPP dataset for Europe. We consider that there are still too few RPP values per taxon to disentangle variability in the RPP values for a particular taxon due to methodological issues, landscape characteristics, land use or climate. We therefore use the mean of selected RPP values for each taxon in the new standard RPP dataset following Broström et al. (2008) and Mazier et al. (2012). In boreal and temperate Europe, the number of RPP values per taxon varies between one and nine (Betula) (Table B1), and in Mediterranean Europe, there is only one value per taxon (Table B2). In general, all three sub-models of the ERV model were used in the RPP studies. We selected the RPP values obtained with the ERV sub-model considered by the authors to have provided the best results (following the approach of Li et al., 2018). This is usually evaluated from the shape of the curve of likelihood function scores (LFSs) or log likelihood (LL) (Twiddle et al., 2012) and the LFS and LL values themselves. All RPPs selected for this synthesis are expressed relative to Poaceae (RPP = 1). In studies that used another reference taxon and calculated an RPP for Poaceae, the RPPs were recalculated relative to Poaceae. In studies that did not include an RPP value for Poaceae, it was assumed that the reference taxon had an RPP related to Poaceae equal to the mean of the RPP values for that taxon in the other studies (Mazier et al., 2012). For simplicity, we used the value of Quercus (5.83) calculated by Mazier et al. (2012) for the study by Bunting et al. (2005) (Quercus as reference taxon, no RPP value for Poaceae). We could also have used the new mean RPP for Quercus (4.54) using our selected RPPs (five values instead of three in Mazier et al., 2012). The latter would not have changed our results significantly; the mean RPP for Quercus would have been 4.28 instead of 4.54 (Table A2). For the study by Baker et al. (2016), we used the RPP values obtained with Poaceae as the reference taxon, given that the RPPs relative to Quercus or Pinus were almost identical when ERV sub-model 3 was used. The selection of RPP values in boreal and temperate Europe for the calculation of the mean RPP values of each taxon (values in bold in Table B1) is based on the following rules:
-
We excluded the RPP values that were not significantly different from zero considering the lower bound of its SD and values that were considered to be uncertain by the authors of the original publications (e.g. Vaccinium for Finland (Räsänen et al., 2007), Pinus for central Sweden (von Stedingk et al., 2008)). Moreover, some RPP values were excluded as they were assumed to be outliers or unreliable based on experts' knowledge on the plants involved, the pollen–vegetation dataset and the field characteristics of the related studies. For example, the RPPs for Cyperaceae, Potentilla t. and Rubiaceae obtained in SW Norway (Hjelle, 1998) and those for Salix and Calluna vulgaris from central Sweden (von Stedingk et al., 2008) were assumed to be too low compared to the values obtained in other study areas (Mazier et al., 2012).
-
(i) When five or more RPP estimates of pollen productivity (N≥5) were available for a pollen type, the largest and the smallest RPP values (generally outlier values) were excluded, and the mean was calculated using the remaining three or more RPP estimates. (ii) When N=4, the most deviating value was excluded, and the mean was calculated using the other three RPP values. (iii) When N=3, the mean was based on all values available except if one value was strongly deviating from the other two. (iv) When N=2, the mean was based on the two values available; an exception is Ulmus, for which we excluded the value from Germany (Theuerkauf et al., 2012) given that several of the RPPs in this study are considerably higher than most values in the other available studies, i.e. for Betula (18.7), Quercus (17.85) and Tilia (12.38). The latter values were also excluded from the mean RPP, as well as the unusually high values found by Baker et al. (2016) for Betula (13.94), Pinus (23.12) and Quercus (18.47). Baker et al. (2016) argue that the high RPP values might be characteristic of temperate deciduous forests that were little impacted by human activities. More studies in this type of wooded environments would be needed to confirm this assumption. In the absence of such studies we consider these values to be outliers.
The SDs for the mean RPP values were calculated using the delta method (Stuart and Ord, 1994), a mathematical solution to the problem of calculating the mean of individual SDs (see Li et al., 2020, for more details). The pollen taxonomy and nomenclature follow the system used in the European Pollen Database (EPD; Fyfe et al. 2009).
Table B1Europe (Mediterranean area excluded): RPP estimates and their SDs (in brackets) with the total number of taxa per study indicated and in brackets the number of taxa with selected RPP estimates (in bold). (a) Studies using moss pollsters as pollen samples. (b) Studies using surface lake sediments as pollen samples. Abbreviations: t. – type, C – central, Comp. – Compositae (Asteraceae), ERV 1 and 3 – extended R value model sub-models 1 and 3, Medit. – Mediterranean region, Rep – Republic, S – southern, SF – subfamily. a RPPs for herbs from Broström et al. (2004); RPPs for trees from Sugita et al. (1999) (reference taxon Juniperus) converted to Poaceae as reference taxon by Broström et al. (2004). b Bunting et al. (2005), reference taxon Quercus and no RPP for Poaceae; RPPs relative to Poaceae calculated by Mazier et al. (2012) assuming that the RPP of Quercus relative to Poaceae is the same as the mean RPP of Quercus from three other studies in NW Europe. c New RPPs from the Czech Republic (Abraham and Kozáková, 2012). d New RPPs from Poland. Poaceae as reference taxa (see text for more details). e New RPPs from Germany (Matthias et al., 2012), reference taxon Pinus. RPPs converted to Poaceae as reference taxon. We selected the RPP estimates obtained with the dataset of vegetation cover including only the trees that had reached their flowering age (allFIDage) (for more information, see Matthias et al., 2012). f New RPPs from Germany (Theuerkauf et al., 2012); in the original publication, the ERV analysis was performed with the Lagrangian stochastic model (LSM) for dispersal of pollen and with Pinus as reference taxon. For this synthesis, Martin Theuerkauf redid the analysis with the Gaussian plume model for dispersal of pollen (Parsons and Prentice, 1981; Prentice and Parsons, 1983) and with Poaceae as reference taxon. In bold: selected RPP estimates for calculation of the mean RPP values. g RPP estimates excluded because of too large of a difference with the other available estimates and their mean (less than half or more than double the mean RPP). h RPP estimates excluded due to their extremely high value compared to the other available estimates (much over double the mean of the other RPPs), i.e. from the study at Bialowice Forest (Poland; Baker et al., 2016) for Betula, Pinus and Quercus; central Sweden (von Stedingk et al., 2008) for Pinus; and Germany (Theuerkauf et al., 2013) for Betula, Quercus, Tilia and Ulmus. Values in italic: RPP estimates excluded because SD ≥ RPP.
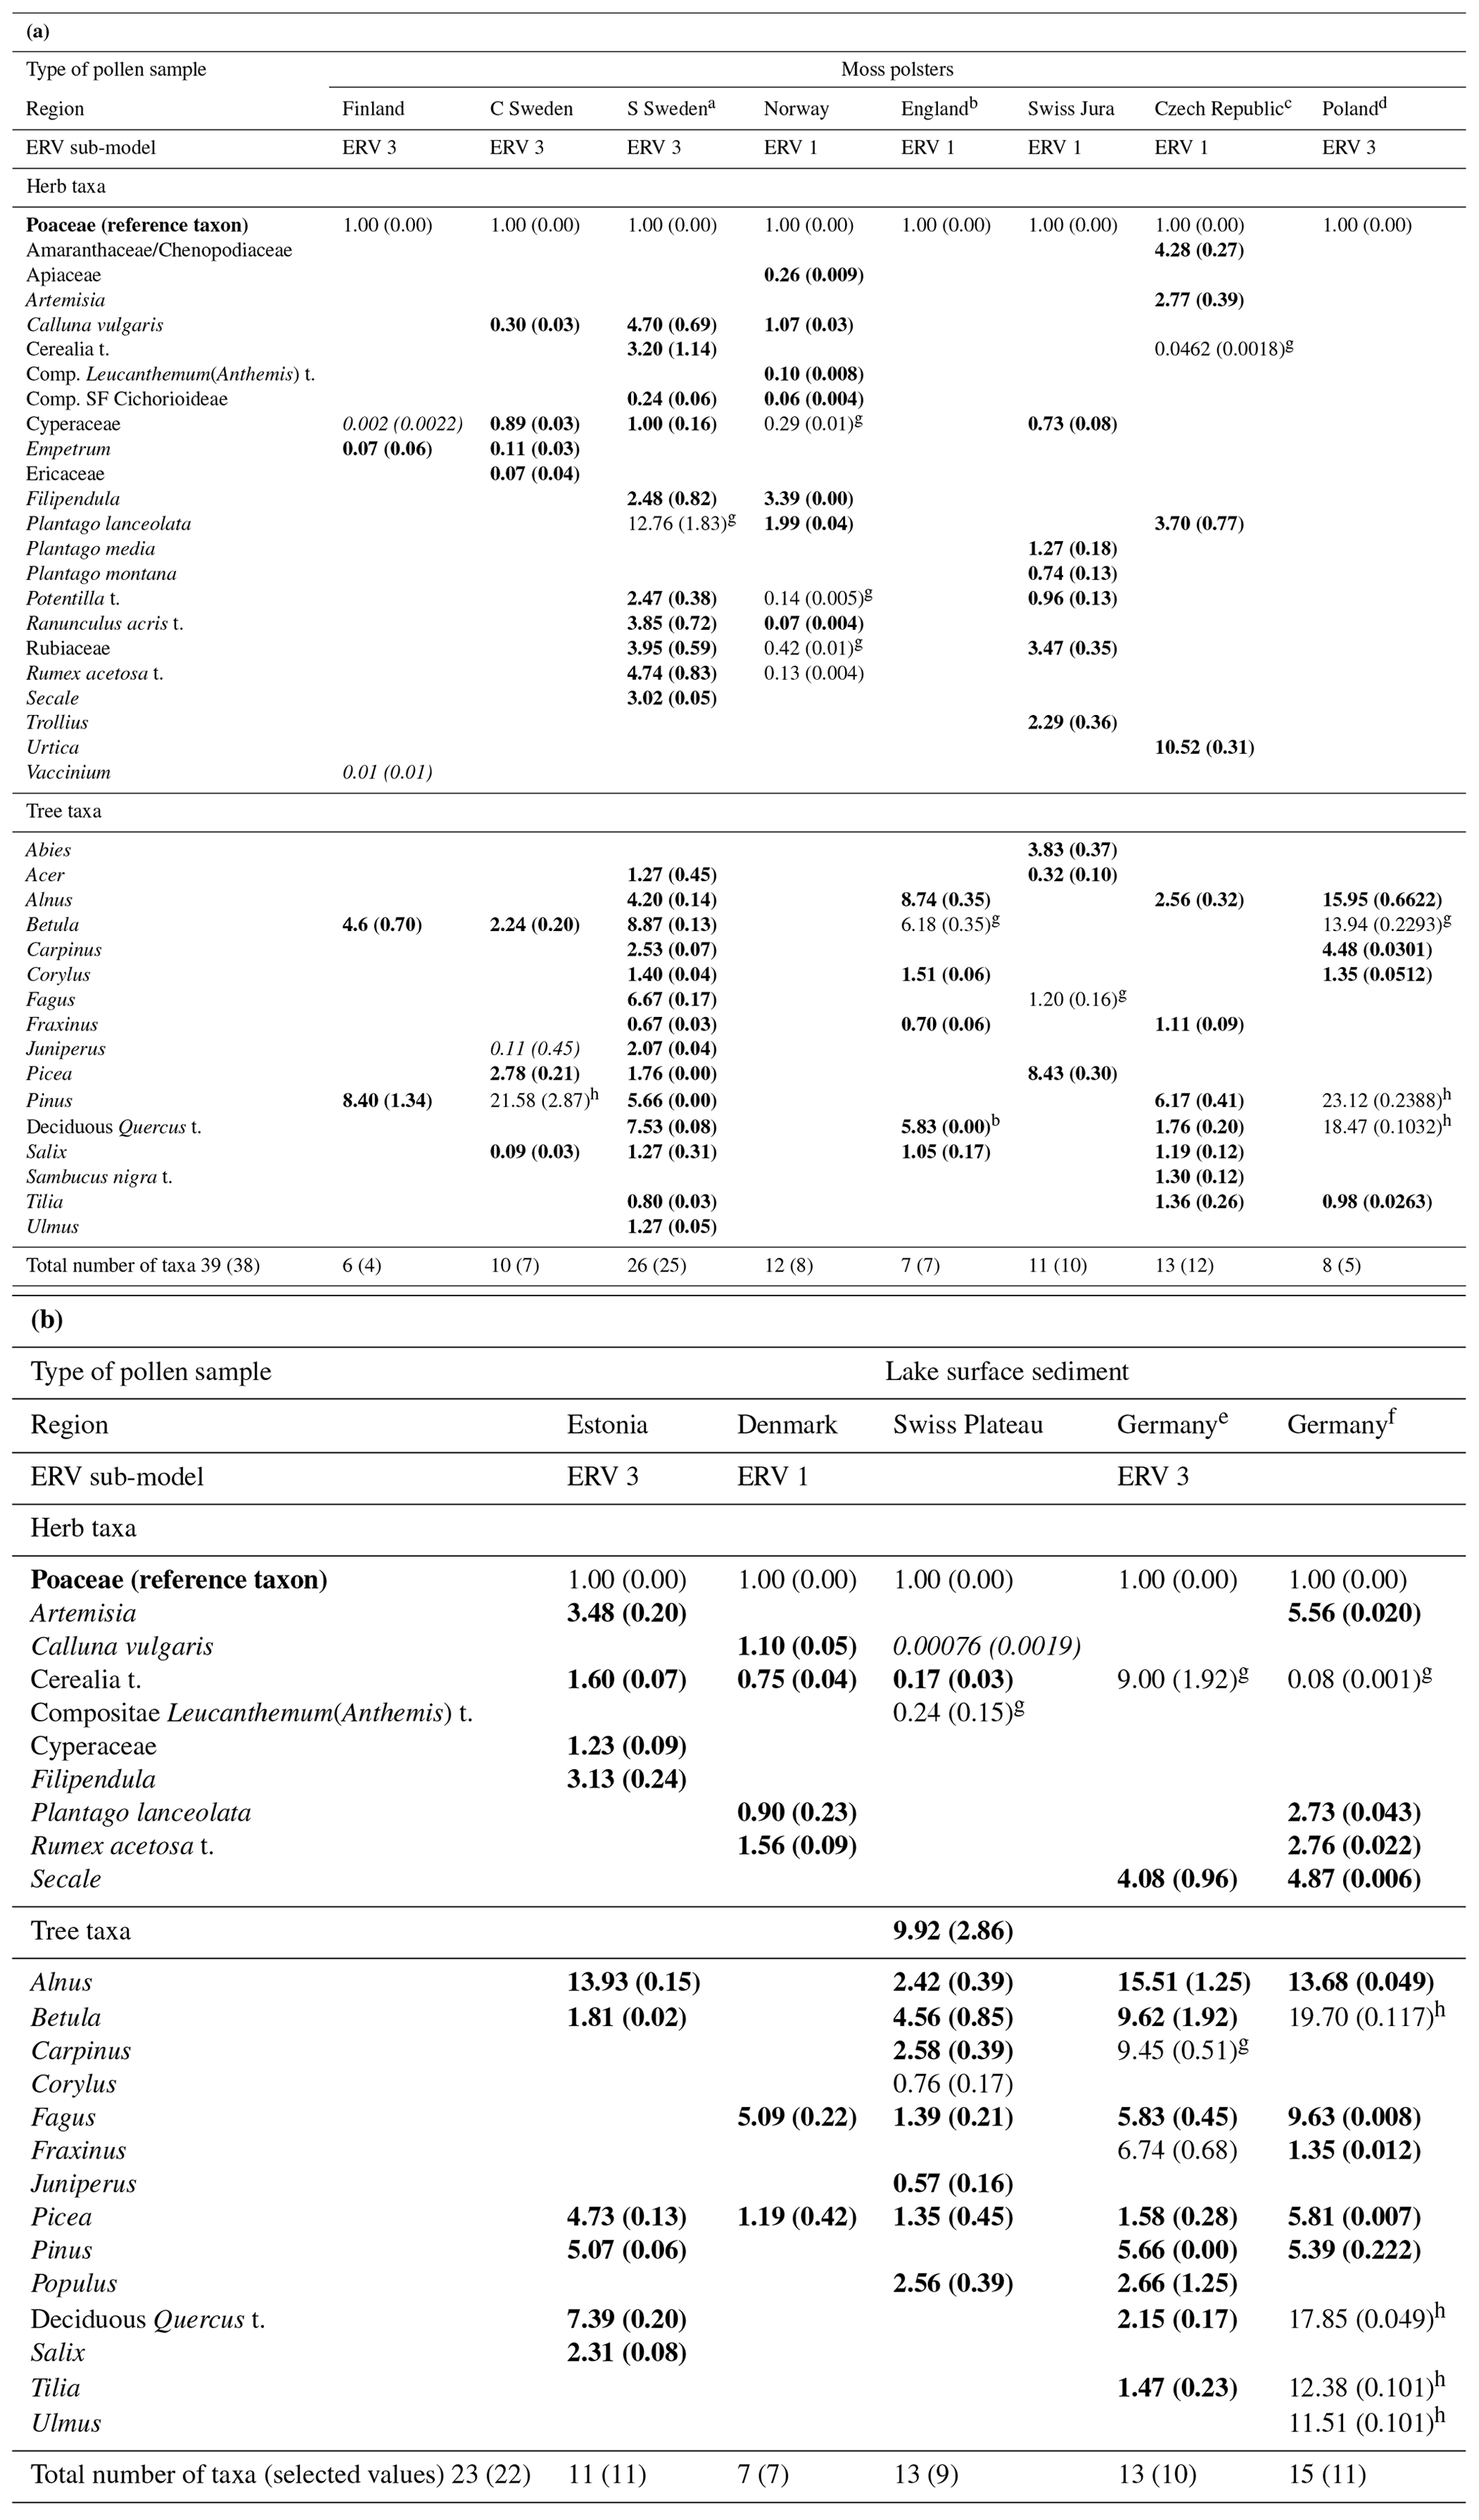
Table B2Mediterranean area: RPP estimates and their SDs from two available studies and mean RPPs for northern and temperate Europe (Table A1, Appendix A) for comparison. RPPs and FSPs emphasized in bold are those used in the REVEALS reconstruction for Europe (this paper). The underlined values exhibit small differences between the Mediterranean study regions and/or between Mediterranean Europe and temperate–boreal Europe. FSP values: from Mazier et al. (2012) except a new values from Mazier et al. (unpublished), b value from Abraham and Kózaková (2012), and c value from Commerford et al. (2013). FSP from Mazier et al. (2012) used in the REVEALS reconstruction (this study) for Ericaceae (Medit.)d and evergreen Quercus t.e instead of the new FSP values from Mazier et al. (unpublished); for more explanations, see “Discussion” section in this paper. Abbreviations: Comp. – Compositae (Asteraceae), ERV 3 – extended R value model sub-model 3, Medit. – Mediterranean region, SF – subfamily.
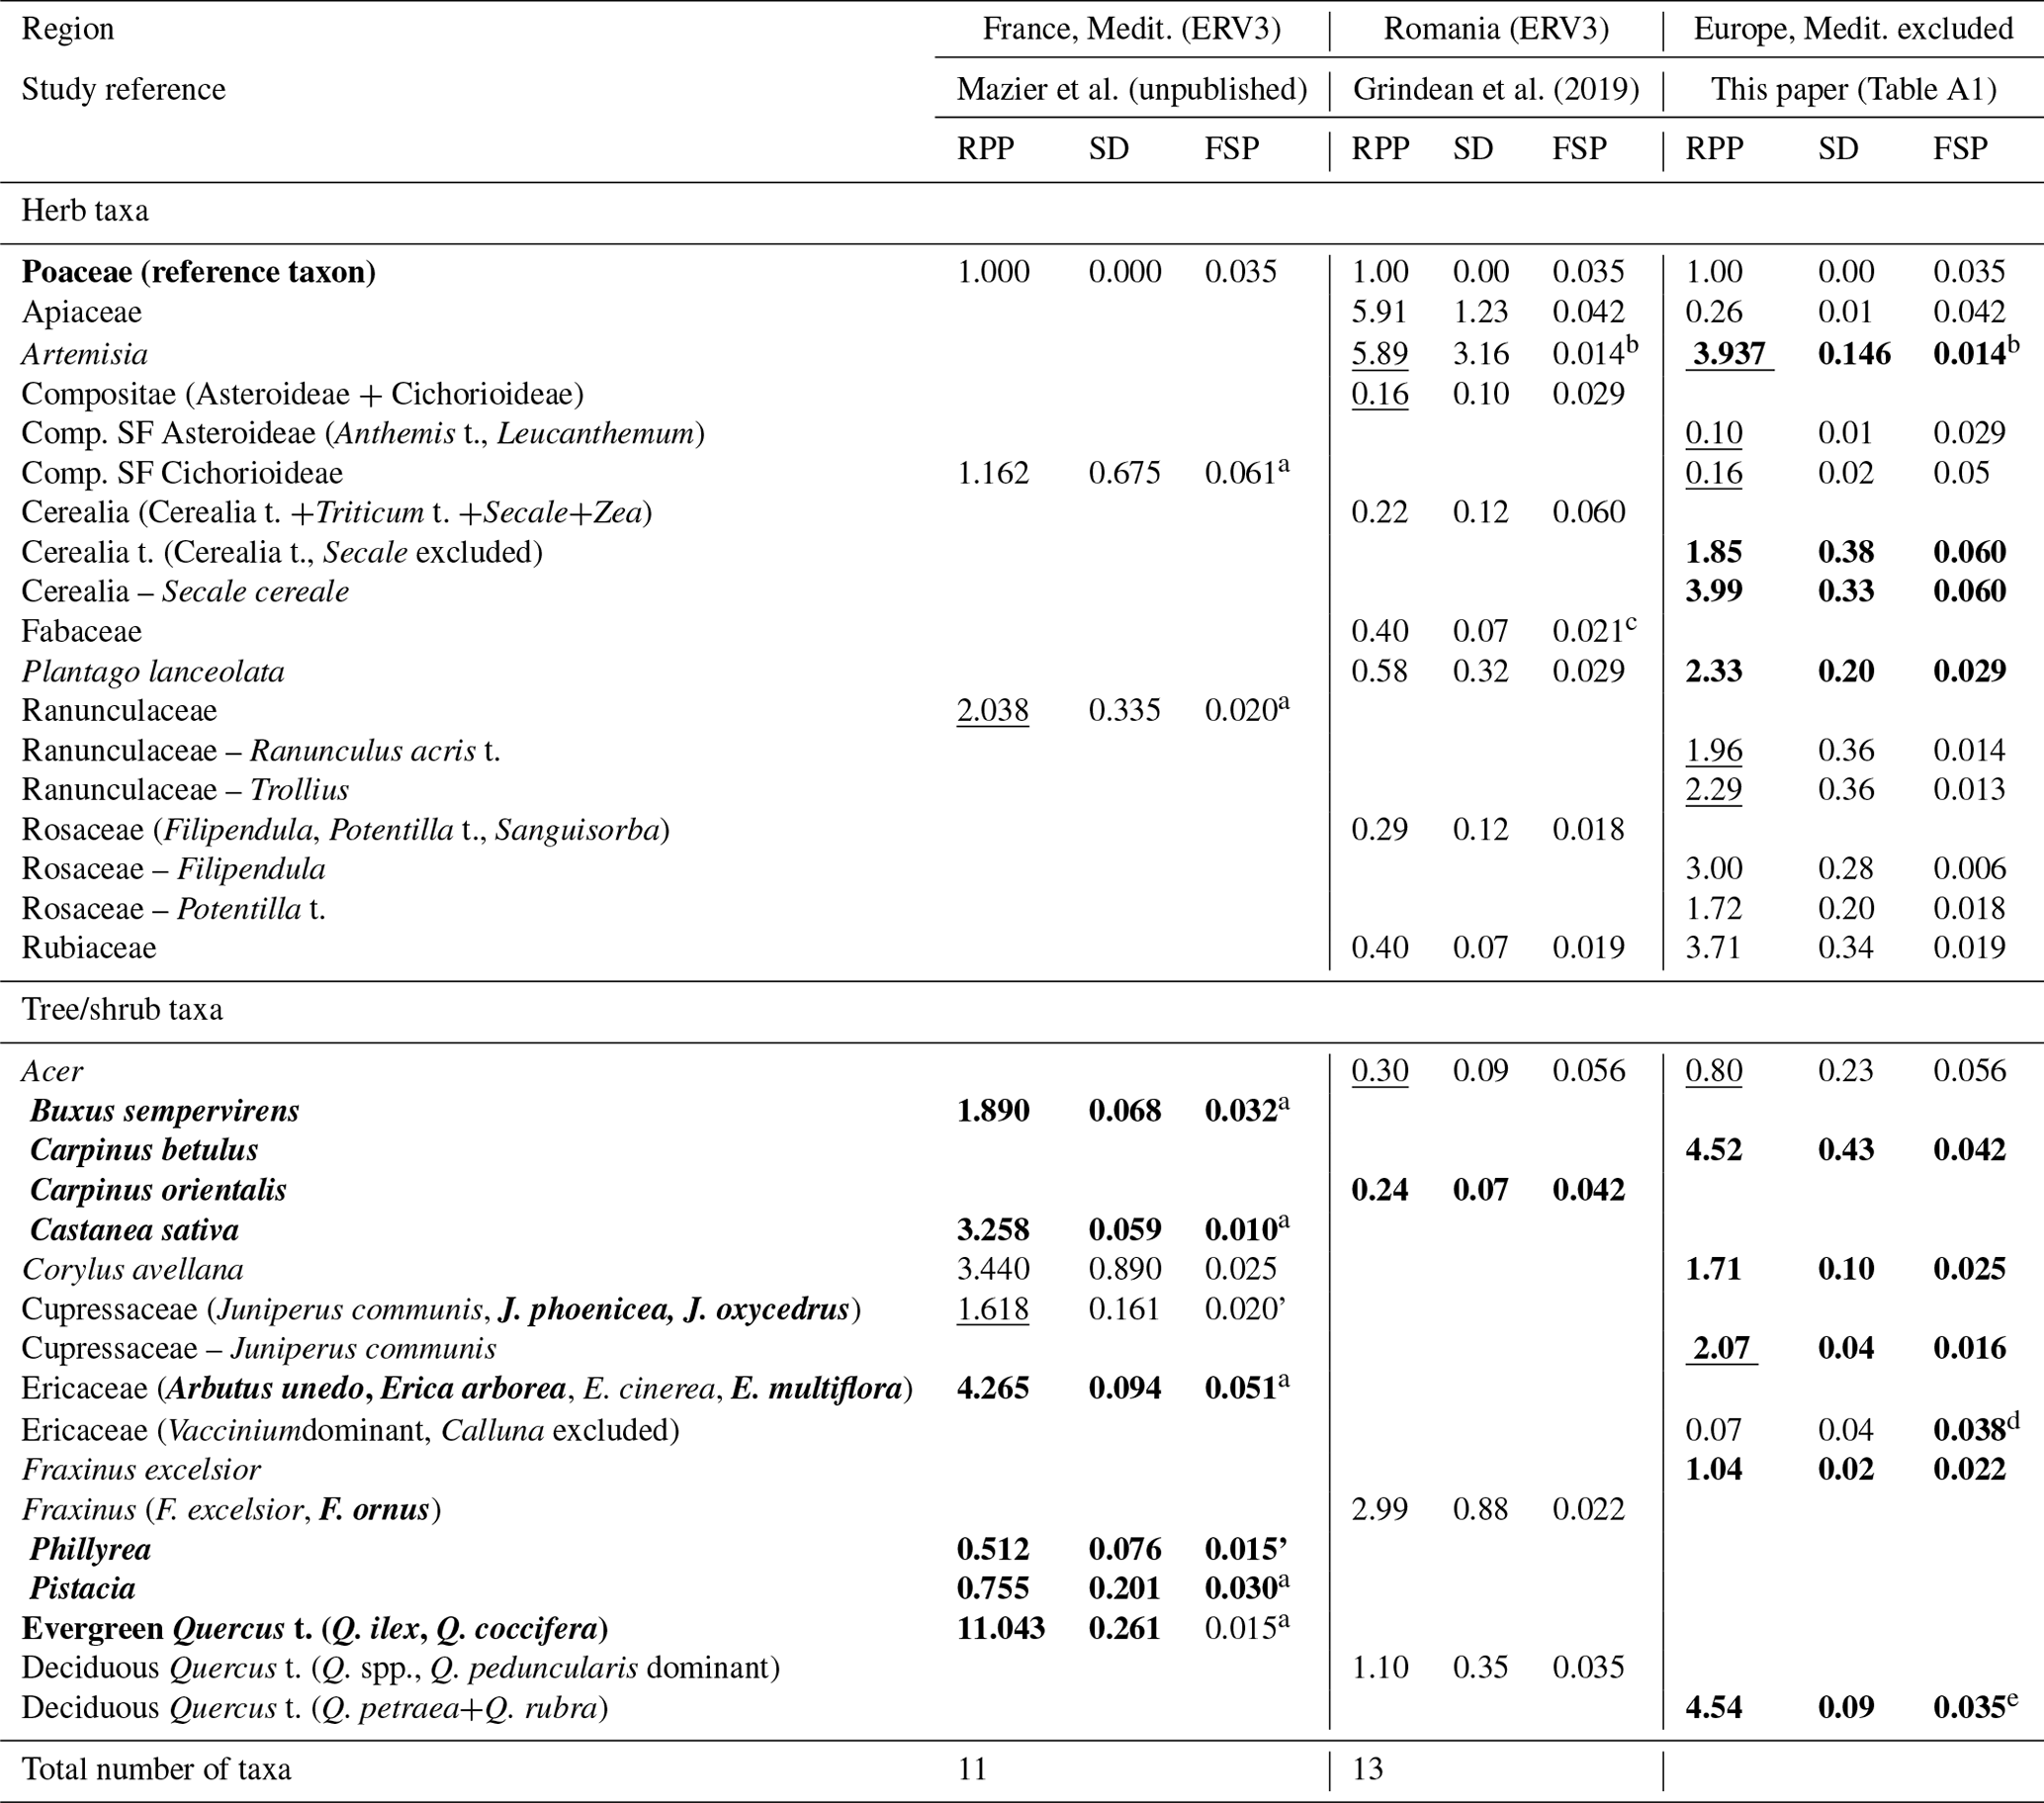
The synthesis of mean RPPs presented here was produced in 2018 and applied in REVEALS reconstructions from 2018–2020. Of 19 RPP studies available (in July 2021), we selected 14 published studies between 1998 and 2018, 1 unpublished study in 2018 (Grindean et al., 2019), and 1 still unpublished study (Mazier et al., unpublished). The 16 study regions are distributed in 12 European countries (Fig. C1) and detailed in Table C1. Three studies are not included in our synthesis: Britain (Twiddle et al., 2012) because of the absence of Poaceae in the calculated RPPs, curves of likelihood function scores exhibiting departures from theoretically correct curves and doubts expressed by the authors on the reliability of the values; Greenland (Bunting et al., 2013b) because this land area was not included in the REVEALS reconstruction of Holocene plant cover in Europe presented in this paper; and Czech Republic (Kuneš et al., 2019) because the study was not ready when we finalized our synthesis. However, we compare the RPP values from these three studies with the mean RPP values in this synthesis (Appendix A, Table A2).
All studies used the ERV model to calculate RPPs, and all but one study used modern pollen assemblages and vegetation; only Nielsen (2004; Denmark) used historical pollen and vegetation data. A total of 11 studies used pollen assemblages from moss pollsters, and 5 studies used pollen assemblages from lake sediments. Grindean et al. (2019; Romania) also used some pollen assemblages from surface soil samples. All studies used distance-weighted vegetation except two, Hjelle (1998; SW Norway) and Sugita et al. (1999; S Sweden). The Gaussian plume model (GPM) was used for pollen dispersal and deposition in order to distance-weight vegetation data, i.e. the Prentice bog model (Parsons and Prentice, 1981; Prentice and Parsons, 1983) in studies using pollen from moss pollsters and Sugita's lake model (Sugita, 1993) in studies using pollen from lake sediments (see also caption of Table C1). In the case of the study by Theuerkauf et al. (2012), the published RPP values were calculated using the Lagrangian stochastic model. For the purpose of this synthesis, Theuerkauf recalculated the RPPs using the GPM bog model in the application of the ERV model. The distribution of sites for collection of pollen samples and vegetation data within the study regions is random or random stratified in 7 of the 11 studies using moss pollsters; the 5 remaining studies used selected sites (or systematic distribution). Studies using lake sediments normally result in a systematic site distribution. Earlier studies (Broström et al., 2005; Twiddle et al., 2012) showed that random distribution of sites provided better estimates of “relevant source area of pollen” (RSAP; sensu Sugita, 1994) and thus of RPPs, given that the reliable RPPs are those obtained at the RSAP distance and beyond. Both studies indicated that systematic distribution of sites have the tendency to result in curves of likelihood function scores that do not follow the theoretical behaviour, i.e. an increase in the scores with distance until the values reach an asymptote. However, the difference in RPPs between systematic and random sampling is generally not very large. Nonetheless, systematic sampling may lead to uncertainty in terms of reliability of RPPs, and random distribution of sites is recommended and has generally been used in studies using moss pollsters or soil samples published from 2008 and onwards.
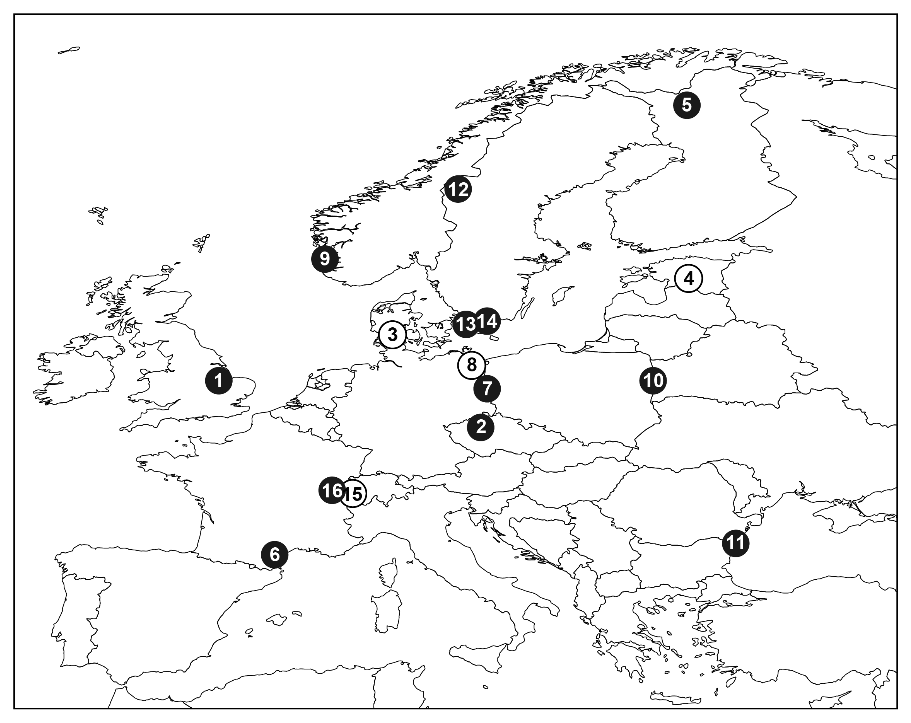
Figure C1Location of the selected studies of relative pollen productivities (RPPs) in Europe: 1 – Britain (Bunting et al., 2005), 2 – Czech Republic (Abraham and Kozáková, 2012), 3 – Denmark (Nielsen, 2004), 4 – Estonia (Poska et al., 2011), 5 – Finland (Räsänen et al., 2007), 6 – France (Mazier et al., unpublished), 7 – Germany (Matthias et al., 2012), 8 – Germany (Theuerkauf et al., 2012), 9 – Norway (Hjelle, 1998), 10 – Poland (Baker et al., 2016), 11 – Romania (Grindean et al., 2019), 12 – Sweden (von Stedingk et al., 2008), 13 – Sweden (Sugita et al., 1999), 14 – Sweden (Broström et al., 2004), 15 – Switzerland (Soepboer et al., 2007), 16 – Switzerland (Mazier et al., 2008).
Table C1Selection of studies for the synthesis of relative pollen productivity (RPP) estimates. Emphasized in bold: additional, new studies compared to the studies included in the synthesis of Mazier et al. (2012). a L: lakes; M: moss pollsters; S: surface soil. b Different distance-weighting models were used depending on the study, including the Gaussian plume model (GPM), , (d = distance) and the Lagrangian stochastic model (LSM). The GPM is used in the model developed for both bogs (Parsons and Prentice, 1981; Prentice and Parsons, 1983) and lakes (Sugita, 1993). For this RPP synthesis, we chose the results from the analyses using GPM rather than or . Note: in the study of Theuerkauf et al. (2012) the LSM was used. For this synthesis, Theuerkauf recalculated his RPPs using the lake model developed by Sugita (1993). c Number of plant taxa for which RPP was estimated, including the reference taxon. Note: in the study by Theuerkauf et al. (2012) RPPs were estimated for 17 taxa using the LSM. The RPPs were recalculated using the lake model (Sugita, 1993) for 15 taxa (see note under b above) for this synthesis. In the study of Sugita et al. (1999) RPPs were calculated for 14 trees and 3 herbs. We used only the values for the 14 trees in this synthesis, following the syntheses by Broström et al. (2008) and Mazier et al. (2012). d Britain: the study includes two areas in which RPP estimates were calculated for different sets of taxa, and the two areas have different numbers of sites (Calthorpe (34), five taxa; Wheatfen (19), same five taxa and Corylus (six taxa in total). e The study of Bunting et al. (2005) does not include an RPP for Poaceae. In order to calculate the RPPs relative to Poaceae, it was assumed that the RPP of Quercus was equal to the mean of the RPPs from three other studies in Europe (see Mazier et al., 2012, for details). Although we have included new RPP values for Quercus in this synthesis, we did not recalculate the RPPs from Bunting et al. (2005) with a new mean value for Quercus but used the same values as in Mazier et al. (2012). For comparison, the mean value for Quercus using the RPPs of the additional studies included in this synthesis is 4.28 (instead of 5.83 in Mazier et al., 2012). This would imply slightly lower RPPs in Britain also for Alnus, Betula, Corylus, Fraxinus and Salix. f Vegetation data from historical maps around 1800 CE. g Lake sediments dated to ca. 1800. h The reference taxon used in the original study is different from Poaceae. For this synthesis the RPPs were converted to values relative to Poaceae. i Random distribution restricted to areas of the study region with existing vegetation maps (therefore no sites outside these areas), i.e. study region including separate areas (Mazier et al., 2008). j No distance weighting used for vegetation data because there was no information about vegetation with increasing distance from the pollen sample (Hjelle, 1998; Sugita et al., 1999). In the Swedish study, vegetation data within a 102 m2 (herb taxa) and 103 m2 quadrat (tree taxa) centred on the pollen sample were used (Sugita et al., 1999).
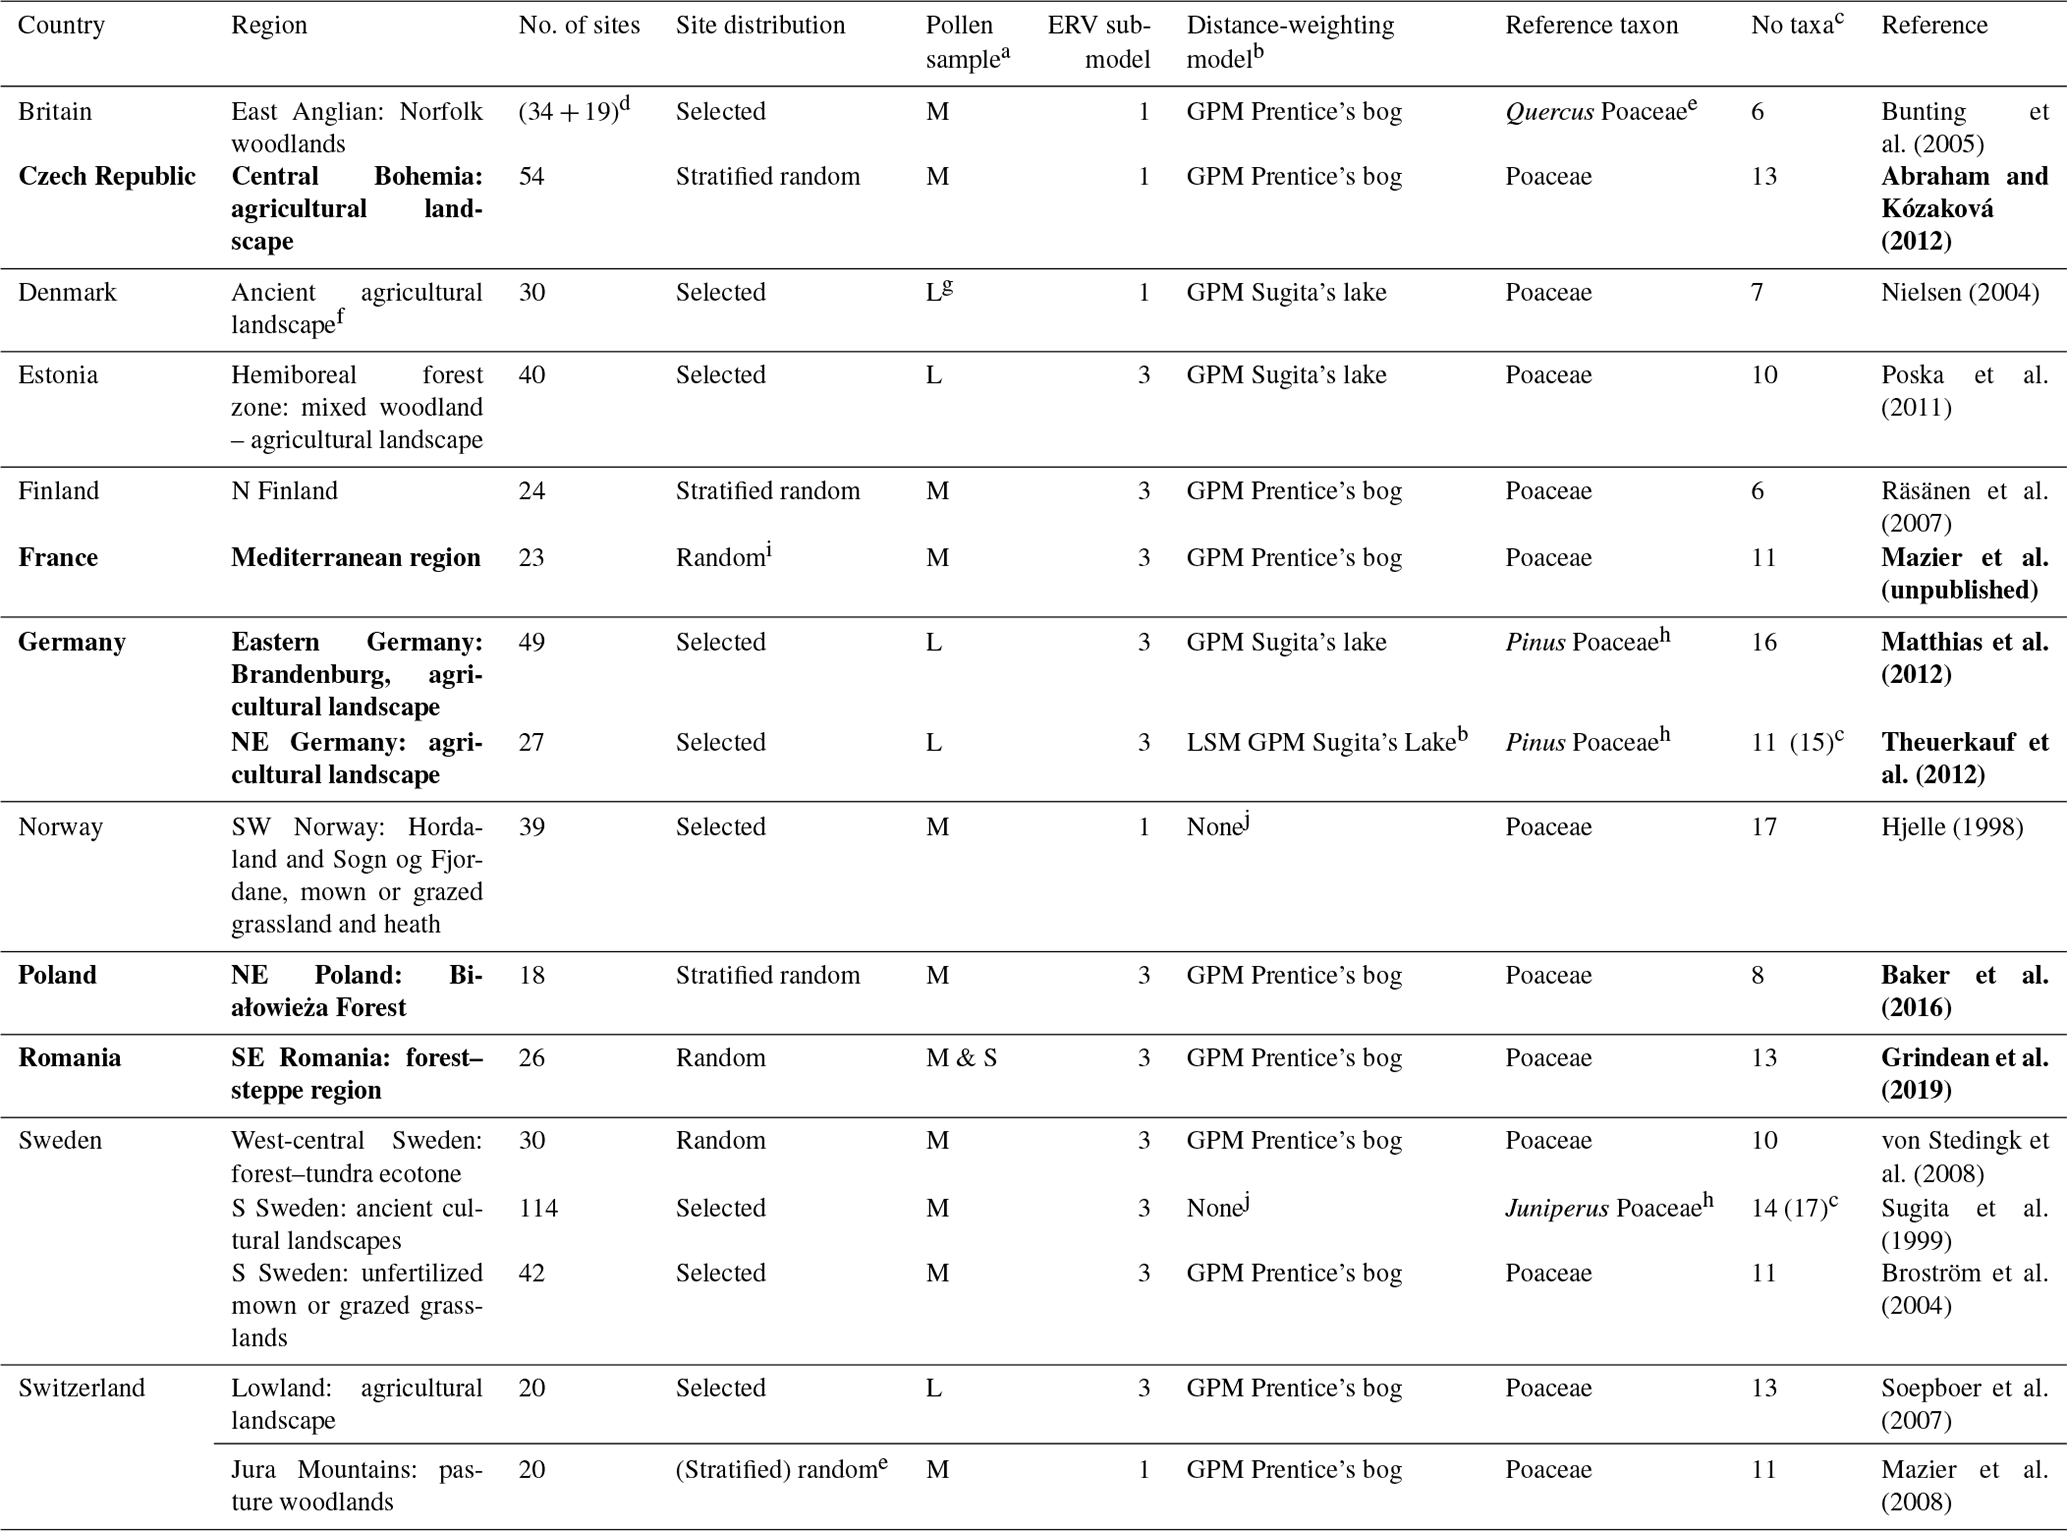
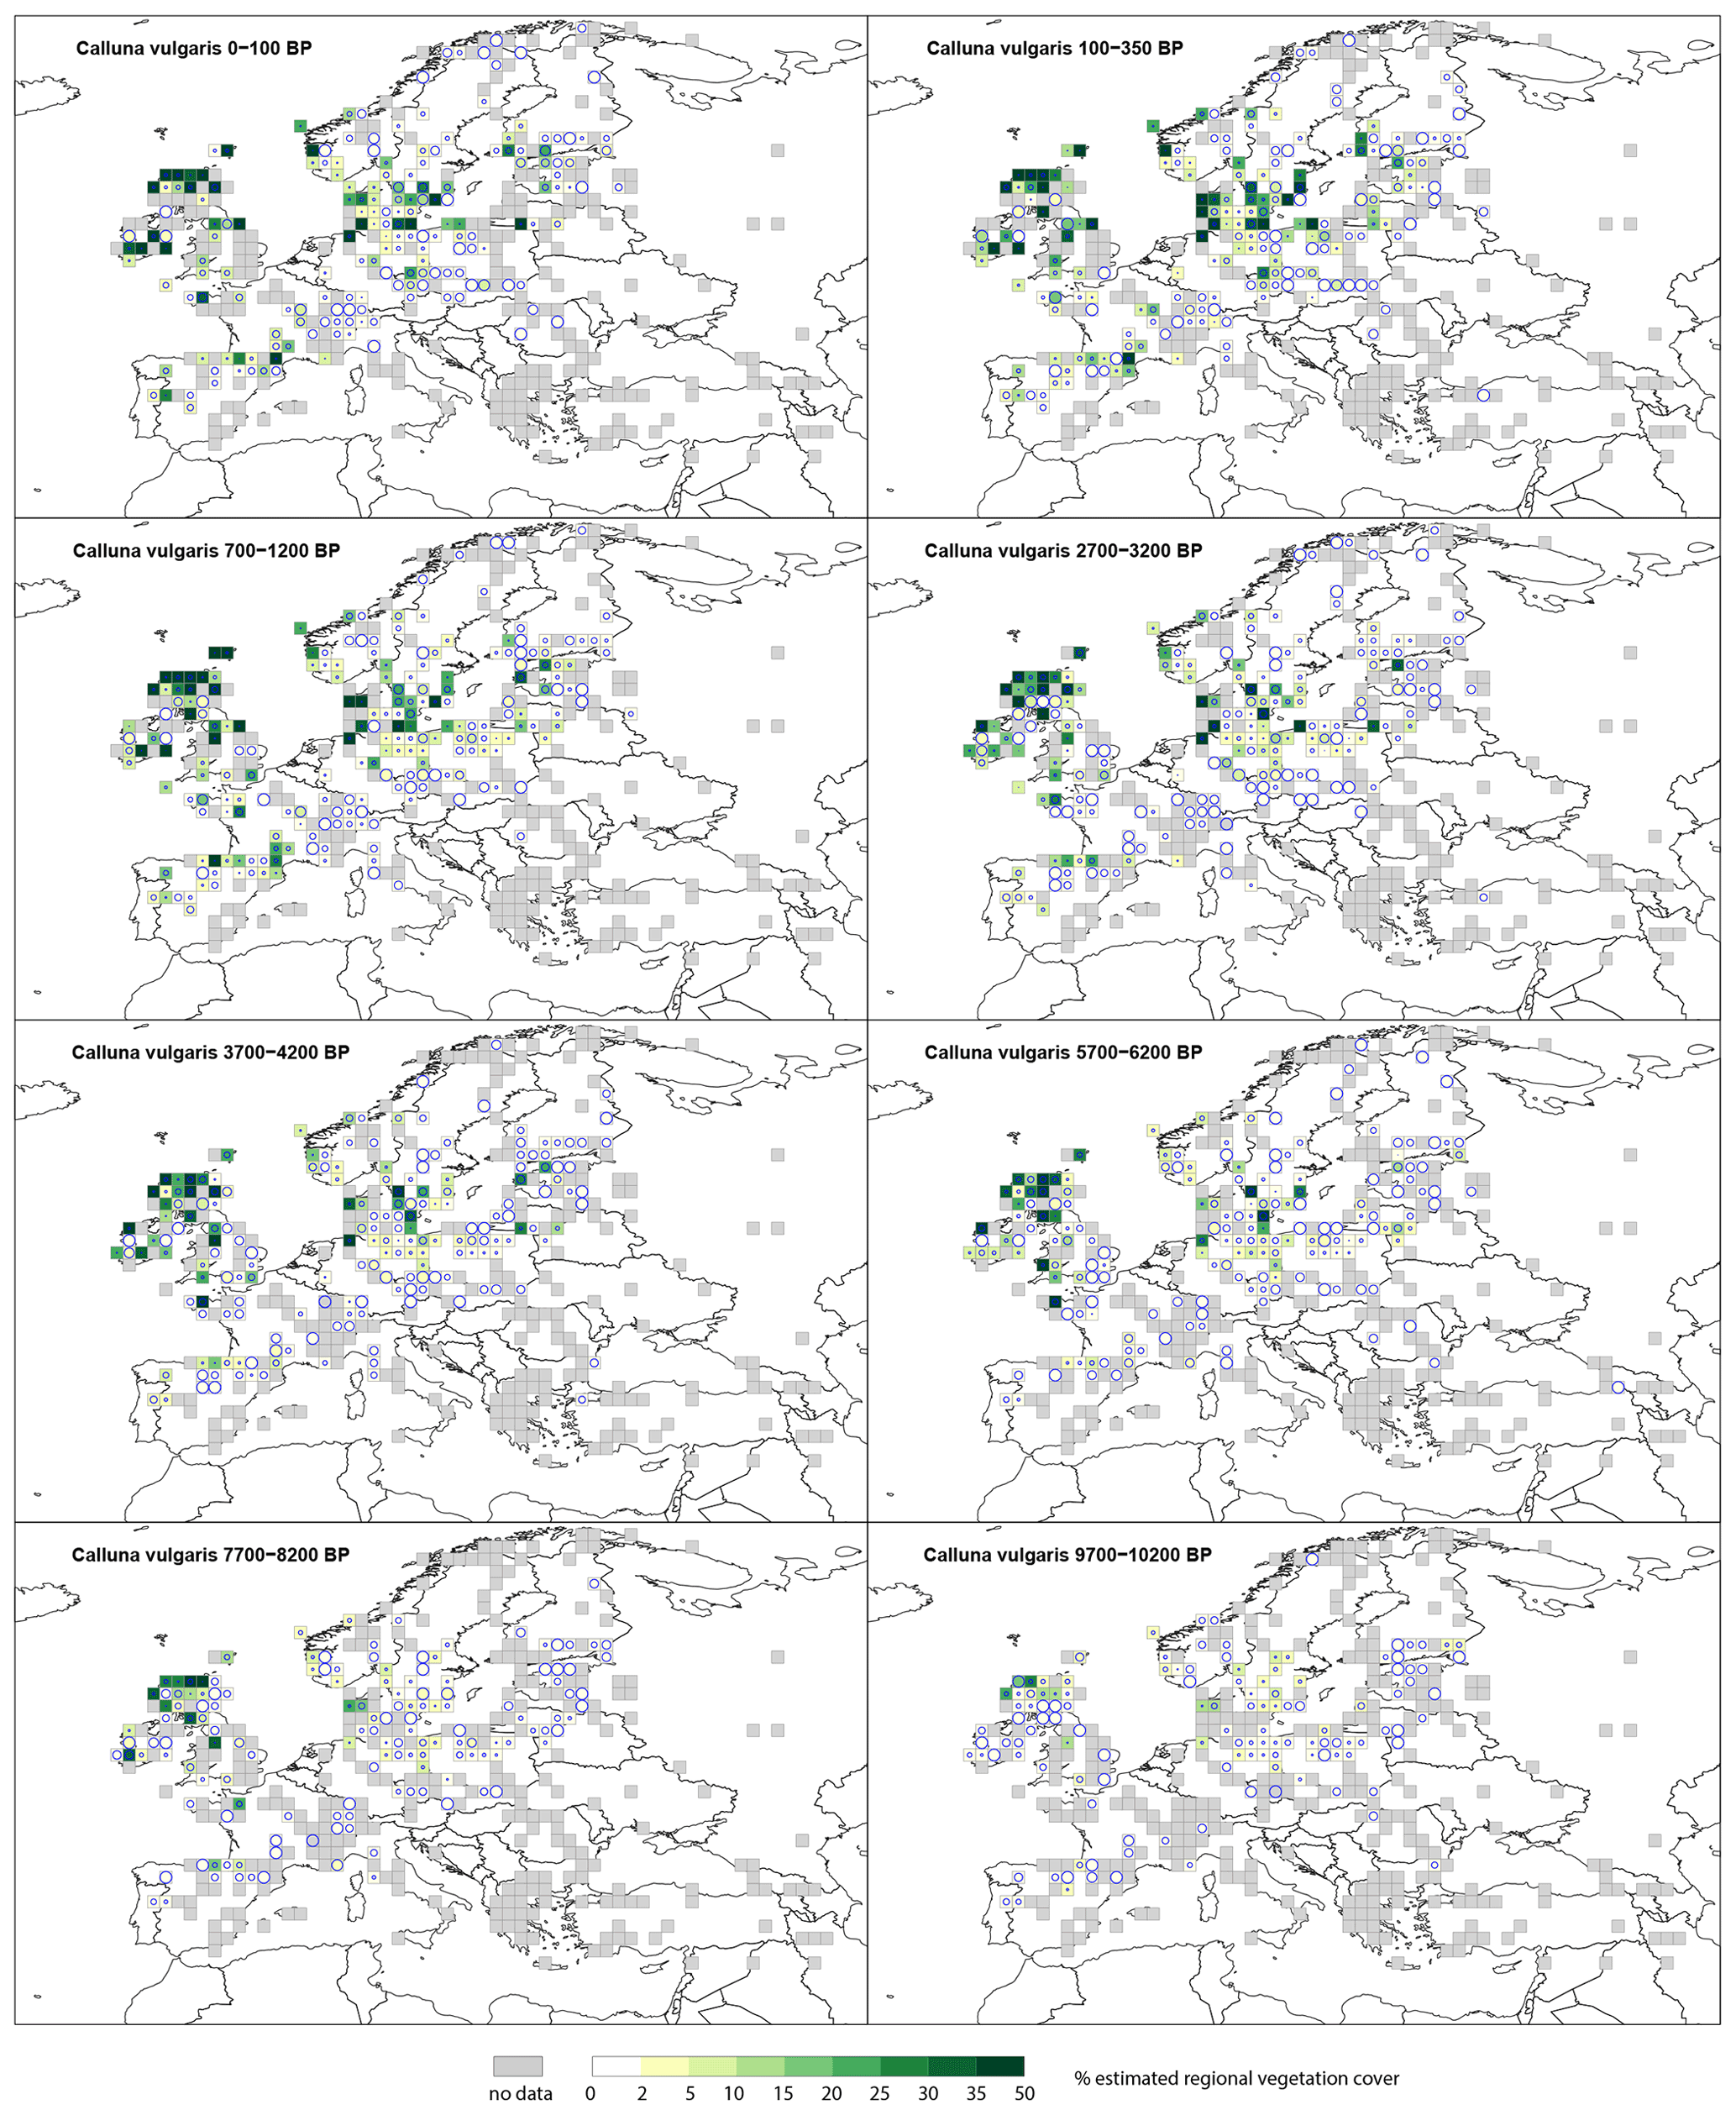
Figure D1Grid-based REVEALS estimates of Calluna vulgaris cover for eight Holocene time windows. Percentage cover in 2 % intervals between 0 % and 2 %, 3 % intervals between 2 % and 5 %, 5 % intervals between 5 % and 35 %, and 15 % intervals between 35 % and 50 %. Intervals represented by increasingly darker shades of green from 5 %–10 %. Grey grid cells have no data (pollen) for Calluna vulgaris in the mapped time window. The circles represent the coefficient of variation (CV; the standard error divided by the REVEALS estimate). When SE ≥ REVEALS estimate, the circle fills the entire grid cell, and the REVEALS estimate is not different from zero. This occurs mainly where REVEALS estimates are low.
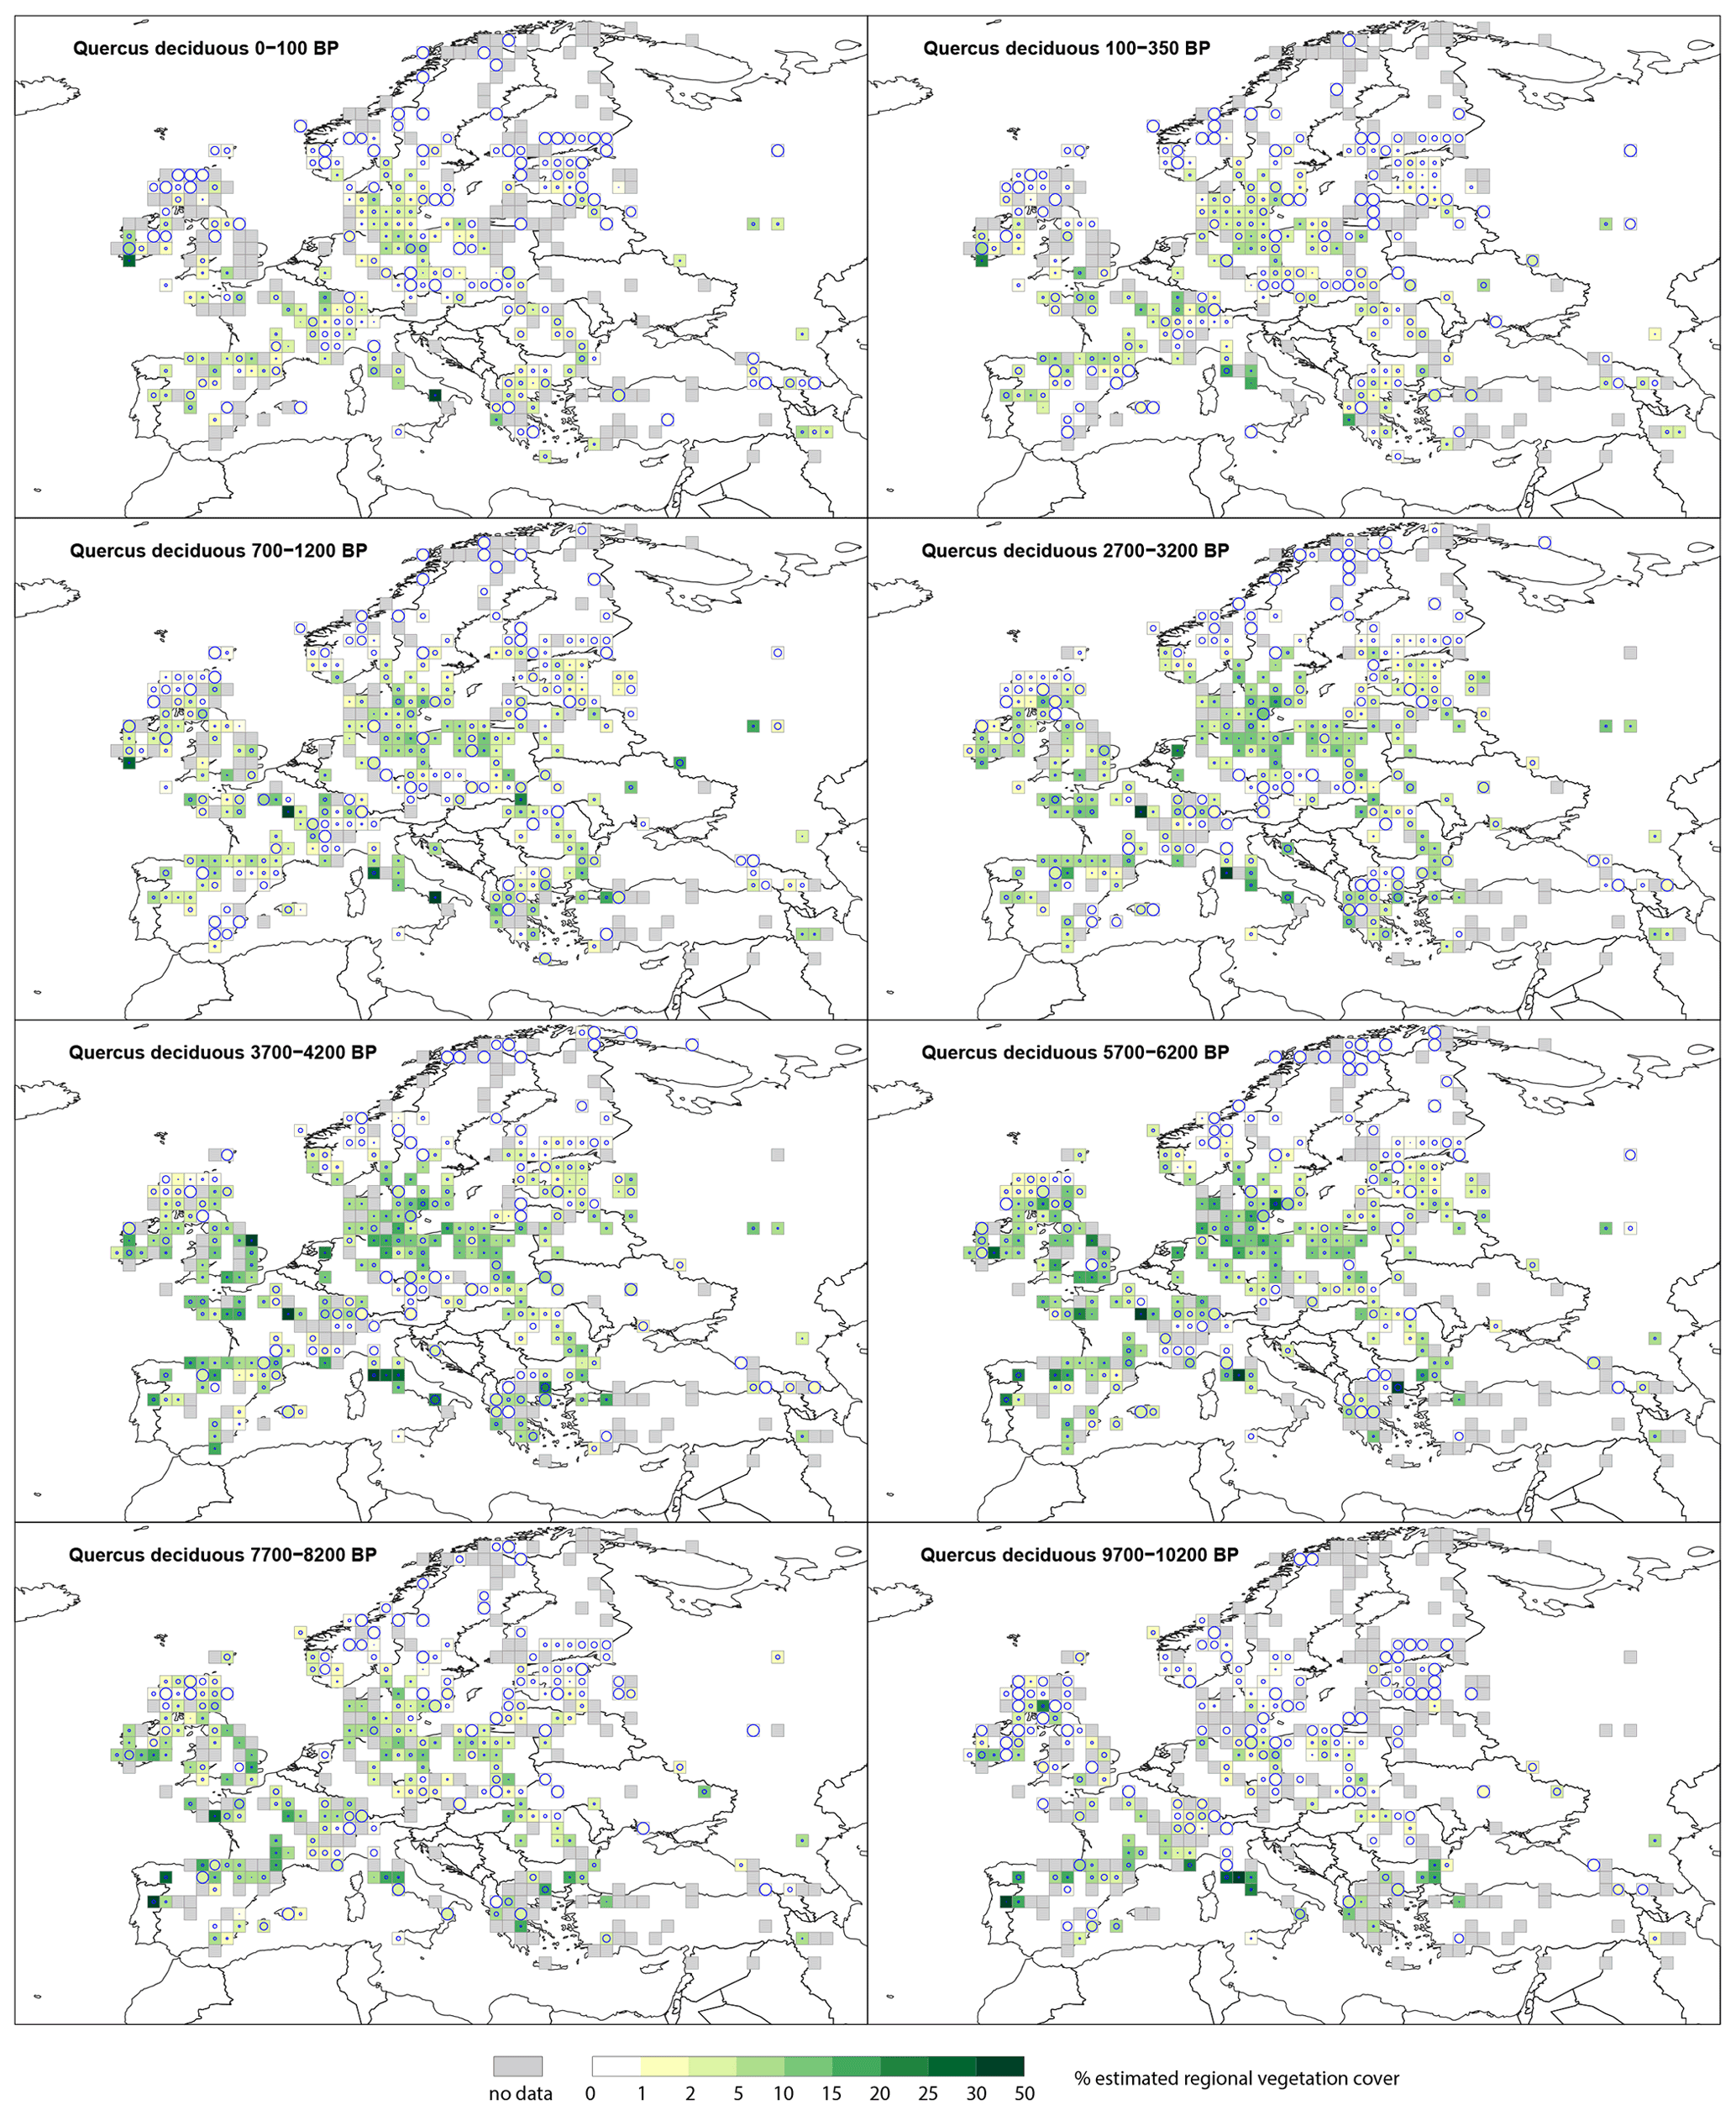
Figure D2Grid-based REVEALS estimates of deciduous Quercus cover in eight Holocene time windows. Percentage cover in 1 % intervals between 0 % and 2 %, 3 % intervals between 2 % and 5 %, 5 % intervals between 5 % and 30 %, and 20 % intervals between 30 % and 50 %. Intervals represented by increasingly darker shades of green from 2 %–5 %. Grey grid cells have no data (pollen) for Calluna vulgaris in the mapped time window. The circles represent the coefficient of variation (CV; the standard error divided by the REVEALS estimate). When SE ≥ REVEALS estimate, the circle fills the entire grid cell, and the REVEALS estimate is not different from zero. This occurs mainly where REVEALS estimates are low.
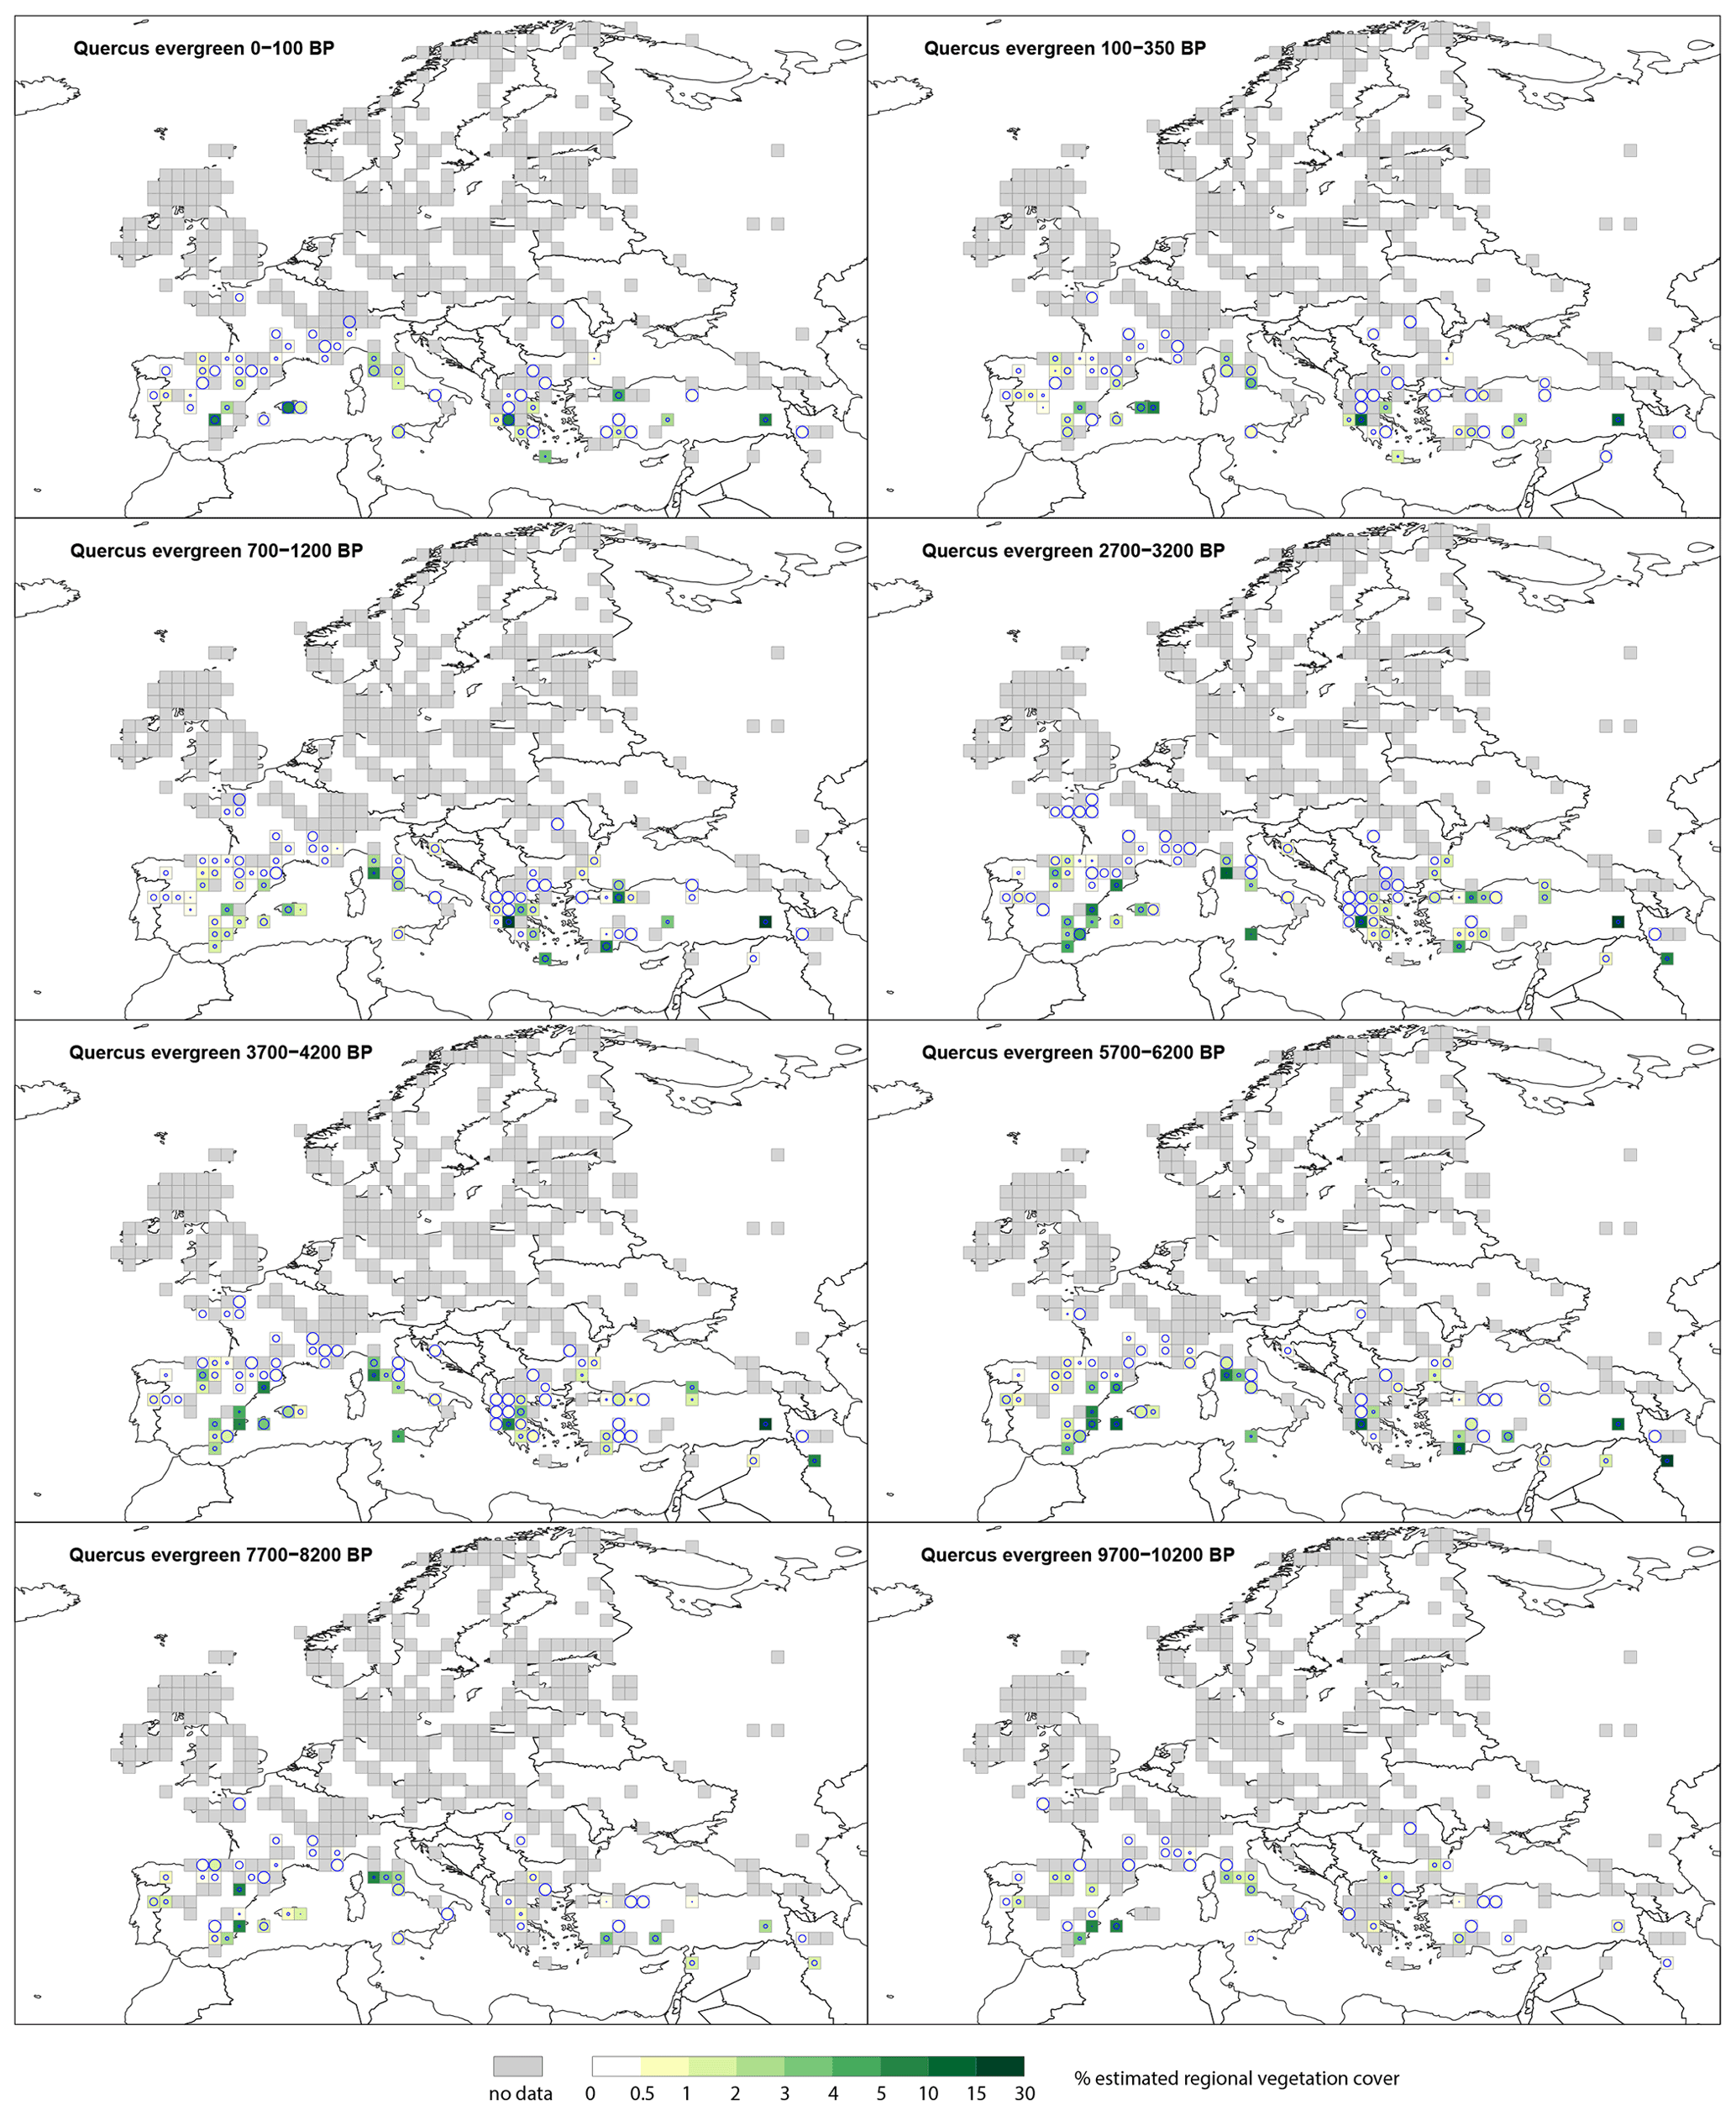
Figure D3Grid-based REVEALS estimates of evergreen Quercus cover for eight Holocene time windows. Percentage cover in 0.5 % intervals between 0 % and 1 %, 1 % intervals between 1 % and 5 %, 5 % intervals between 5 % and 15 %, and 15 % intervals between 15 % and 30 %. See caption of Fig. A1 for more explanations. Intervals represented by increasingly darker shades of green from 1 %–2 %. Grey grid cells have no data (pollen) for Calluna vulgaris in the mapped time window. The circles represent the coefficient of variation (CV; the standard error divided by the REVEALS estimate). When SE ≥ REVEALS estimate, the circle fills the entire grid cell, and the REVEALS estimate is not different from zero. This occurs mainly where REVEALS estimates are low.
Christine Åkesson (School of Geography & Sustainable Development, University of St. Andrews, St. Andrews, UK), Lauras Balakauskas (Department of Geology and Mineralogy, Vilnius University, Vilnius, Lithuania), Vlada Batalova (Department of Physical Geography and Landscape Science, Lomonosov Moscow State University, Moscow, Russia), H. John B. Birks (Department of Biological Sciences, Bjerknes Centre for Climate Research, University of Bergen, Bergen, Norway), Anne E. Bjune (Department of Biological Sciences, Bjerknes Centre for Climate Research, University of Bergen, Bergen, Norway), Olga Borisova (Insitute of Geography, Russian Academy of Sciences, Moscow, Russia), Elissaveta Bozilova (Department of Botany, Sofia University St. Kliment Ohridski, Sofia, Bulgaria), Francesc Burjachs (ICREA Barcelona, Barcelona, Spain; Rovira i Virgili University (URV), Tarragona, Barcelona, Spain; Institut Català de Paleoecologia Humana i Evolució Social (IPHES), Campus Sescelades URV, W3, 43007 Tarragona, Spain), Rachid Cheddadi (Institut des Sciences de l'Evolution de Montpellier, Université de Montpellier, CNRS-UM-IRD, Montpellier, France), Jörg Christiansen (Department of Palynology and Climate Dynamics, Georg August University, Göttingen, Germany), Remi David (Archeosciences Laboratory, UMR 6566 CReAAH, CNRS, Université de Rennes 1, Rennes, France), Pim de Klerk (State Museum of Natural History, Karlsruhe, Germany), Federico Di Rita (Dipartimento di Biologia Ambientale, Università di Roma “La Sapienza”, Piazzale Aldo Moro, 5, 00185, Rome, Italy), Walter Dörfler (Institute fur Ur- und Fruhgeschichte, Kiel University, Kiel, Germany), Elise Doyen (Paleobotalab, Bureau d'étude spécialisé en reconstitution des paléoenvironnements à partir de vestiges botaniques, 01300 Nattages, France), Warren Eastwood (School of Geography, Earth and Environmental Sciences, University of Birmingham B15 2TT, Birmingham, UK), David Etienne (French National Institute for Agriculture, Food, and Environment (INRAE), Savoie Mont Blanc University, Chambéry, France), Ingo Feeser (Institut für Ur- und Frühgeschichte, Kiel University, Kiel, Germany), Mariana Filipova-Marinova (Museum of Natural History, Varna, Bulgaria), Elske Fischer (Institute fur Ur- und Fruhgeschichte, Kiel University, Kiel, Germany), Didier Galop (GEODE UMR 5602, Toulouse University, Toulouse, France), Jose Garcia Sebastian Carrion (Departamento de Biología Vegetal, Facultad de Biología, Universidad de Murcia, 30100 Murcia, Spain), Emilie Gauthier (Laboratoire Chrono-Environnement, UMR 6249 CNRS-Franche-Comté University, Besançon, France), Thomas Giesecke (Department of Physical Geography, Utrecht University, Utrecht, the Netherlands), Christa Herking (Institute of Botany and Landscape Ecology, EMAU, Greifswald, Germany), Ulrike Herzschuh (Alfred-Wegener-Institut, Potsdam, Germany), Isabelle Jouffroy-Bapicot (Laboratoire Chrono-Environnement, UMR 6249 CNRS, Franche-Comté University, Besançon, France), Alisa Kasianova (Department of Palynology and Climate Dynamics, Georg August University, Göttingen, Germany), Katerina Kouli (Department of Geology and Geoenvironment, National and Kapodistrian University of Athens, Panepistimioupolis, 15784 Athens, Greece), Petr Kuneš (Department of Botany, Charles University, Prague, Czech Republic), Per Lagerås (The Archaeologists, National Historical Museums, Lund, Sweden), Małgoržata Latałowa (Department of Plant Ecology, University of Gdańsk, Gdańsk, Poland), Jutta Lechterbeck (State Office for Cultural Heritage Baden-Württemberg, Stuttgart, Germany), Chantal Leroyer (Archeosciences Laboratory, UMR 6566 CReAAH, CNRS, Université de Rennes 1, Rennes, France), Michelle Leydet (European Pollen Database, IMBE, Aix-Marseille Université, Avignon Université, IRD, Aix-en-Provence, France), Olga Lisytstina (Department of Geology, Tallinn University of Technology, 19086 Tallinn, Estonia), Ekaterina Lukanina (Department of Palynology and Climate Dynamics, Georg August University, Göttingen, Germany), Enikő Magyari (Department of Environmental and Landscape Geography, Eötvös Loránd University, Budapest, Hungary), Dominique Marguerie (UMR 6553 ECOBIO/Thème PaysaBio, Université de Rennes 1, 35042 Rennes CEDEX, France), Marta Mariotti Lippi (Dipartimento di Biologia, Università di Firenze, Via G. La Pira, 4, 50121 Florence, Italy), Scott Mensing (Department of Geography, University of Nevada, Reno, NV 89557, USA), Anna Maria Mercuri (Laboratorio di Palinologia e Paleobotanica, Dipartimento di Scienze della Vita, Università di Modena e Reggio Emilia, Modena, Italy), Andrea Miebach (Steinmann Institute for Geology, Mineralogy, and Paleontology, University of Bonn, Bonn, Germany), Paula Milburn (College of Science and Engineering, University of Edinburgh, Edinburgh, Scotland), Yannick Miras (CNRS HNHP UMR 7194, Museum National d'Histoire Naturelle, Paris, France), César Morales del Molino (Alpine Pollen Database, Institute of Plant Sciences, Bern University, Bern, Switzerland), Almut Mrotzek (Institute of Botany and Landscape Ecology, EMAU, Greifswald, Germany), Maria Nosova (Main Botanical Garden, Russian Academy of Sciences, Moscow, Russia), Bent Vad Odgaard (Department of Geoscience, Aarhus University, Aarhus, Denmark). Mette Overballe-Petersen (Forest & Landscape, Faculty of Life Sciences, University of Copenhagen, Copenhagen, Denmark), Sampson Panajiotidis (Aristotle University of Thessaloniki, Department of Forestry and Natural Environment, P.O. Box: 270, GR54124 Thessaloniki, Greece), Danail Pavlov (Society of Innovative Ecologists of Bulgaria, Varna, Bulgaria), Thomas Persson† (Department of Geology, Lund University, Lund, Sweden), Zsolt Pinke (Department of Physical Geography, Eötvös Loránd University, Budapest, Hungary), Pascale Ruffaldi (Laboratoire Chrono-Environnement, UMR 6249 CNRS, Franche-Comté University, Besançon, France), Tatyana Sapelko (Institute of Limnology, Russian Academy of Sciences, St. Petersburg, Russia), Monika Schmidt (Department of Palynology and Climate Dynamics, Georg August University, Göttingen, Germany), Manuela Schult (Institute of Botany and Landscape Ecology, EMAU, Greifswald, Germany), Normunds Stivrins (Department of Geography, Faculty of Geography and Earth Sciences, University of Latvia, Jelgavas iela 1, Riga, 1004, Latvia), Pavel E. Tarasov (Institute of Geological Sciences, Free University of Berlin, Berlin, Germany), Martin Theuerkauf (Institute of Botany and Landscape Ecology, EMAU Greifswald, 1748 Greifswald, Germany), Siim Veski (Department of Geology, Tallinn University of Technology, Tallinn, Estonia), Lucia Wick (IPNA, University of Basel, Basel, Switzerland), Julian Wiethold (INRAP, Direction interrégionale Grand-Est Nord, Laboratoire archéobotanique, Metz, France), Henk Woldring (Groningen Institute of Archaeology, University of Groningen, Groningen, the Netherlands), Valentina Zernitskaya (Institute for Nature Management, National Academy of Sciences of Belarusk, Minsk, Republic of Belarus).
MJG coordinated the study as part of LandClim II and PAGES LandCover6k, two research projects for which she is the overall coordinator and administrator. MJG, AKT, EG, FM, RF, ABN, AP and SS conceptualized the study and methodology. SS developed the REVEALS model and helped with all issues related to the application of the model and interpretation of results. EG, AKT, RF, FM, ABN and AP collected new pollen records from individual authors. JW provided part of the pollen records from the Mediterranean area (collected earlier for a separate project). LS, MS and ST provided unpublished pollen records. EG and AKT had the major responsibility of handling the pollen data files and collecting all related metadata. AKT collected new values of relative pollen productivity estimates (RPPs) in Europe. FM provided unpublished RPP values for the Mediterranean area. FM, JA, VL, LM and NNC were all involved in the unpublished RPP study in southern France, and AF, RG, ABN and IT performed the RPP study in Romania. MJG performed the selection of RPP values for the new RPP synthesis used in this paper; EG made the calculations of mean RPPs; and MJG wrote Appendices A, B and C and prepared the figures and tables therein. RF performed the REVEALS model runs and created Fig. 1 and the maps of REVEALS-based plant cover (Figs. 2–6 and D1–D3). EG, RF and MJG designed the manuscript; EG prepared the first draft of the manuscript and all tables and the final manuscript for submission; and RF and MJG wrote parts of the text and edited the full manuscript. All the co-authors, including the data contributors in the team list (LandClim II data contributors), were involved in commenting and revising the manuscript.
The contact author has declared that neither they nor their co-authors have any competing interests.
Publisher's note: Copernicus Publications remains neutral with regard to jurisdictional claims in published maps and institutional affiliations.
This study was funded by the Swedish Research Council VR (Vetenskapsrådet) within the framework of the “Quantification of the bio-geophysical and biogeochemical forcings from anthropogenic de-forestation on regional Holocene climate in Europe, LandClim II” research project. Financial support from Linnaeus University's Faculty of Health and Life Science is acknowledged for Marie-José Gaillard, Anna-Kari Trondman and Esther Githumbi. This is a contribution to the Swedish Strategic Research Area (SRA) MERGE (ModElling the Regional and Global Earth system; http://www.merge.lu.se, last access: 4 April 2022) and to the Past Global Change (PAGES) project and its working group LandCover6k (http://pastglobalchanges.org/landcover6k, last access: 4 April 2022) that in turn received support from the Swiss National Science Foundation, the Swiss Academy of Sciences, the US National Science Foundation and the Chinese Academy of Sciences. Anneli Poska was supported by the ESF project number PRG323. We thank Sandy Harrison (University of Reading, UK) for providing the pollen records from the EMBSeCBIO project. The work of the data contributors to – and the database managers of – ALPADABA (https://www.neotomadb.org/, last access: 4 April 2022), EMBSECBIO (https://research.reading.ac.uk/palaeoclimate/embsecbio/, last access: 4 April 2022), EPD (http://www.europeanpollendatabase.net/index.php, last access: 4 April 2022), LandClimI (Trondman et al., 2015), PALYCZ (https://botany.natur.cuni.cz/palycz/, last access: 4 April 2022) and PALEOPYR (http://paleopyr.univ-tlse2.fr/, last access: 4 April 2022) is gratefully acknowledged.
This research has been supported by the Swedish Research Council VR (Vetenskapsrådet) (Quantification of the bio-geophysical and biogeochemical forcings from anthropogenic de-forestation on regional Holocene climate in Europe, LandClim II).
This paper was edited by David Carlson and reviewed by Mary Edwards and Qinghai Xu.
Abraham, V. and Kozáková, R.: Relative pollen productivity estimates in the modern agricultural landscape of Central Bohemia (Czech Republic), Rev. Palaeobot. Palynol., 179, 1–12, https://doi.org/10.1016/j.revpalbo.2012.04.004, 2012.
Abraham, V., Oušková, V., and Kuneš, P.: Present-Day Vegetation Helps Quantifying Past Land Cover in Selected Regions of the Czech Republic, edited by B. Bond-Lamberty, PLoS One, 9, e100117, https://doi.org/10.1371/journal.pone.0100117, 2014.
Andersen, S. T.: The relative pollen productivity and pollen representation of north European trees, and correction factors for tree pollen spectra, Danmarks Geol. Undersogelse II, 96, 1–99, https://doi.org/10.34194/raekke2.v96.6887, 1970.
Baker, A. G., Zimny, M., Keczyński, A., Bhagwat, S. A., Willis, K. J., and Latałowa, M.: Pollen productivity estimates from old-growth forest strongly differ from those obtained in cultural landscapes: Evidence from the Białowieża National Park, Poland, The Holocene, 26, 80–92, https://doi.org/10.1177/0959683615596822, 2016.
Barnosky, A. D., Hadly, E. A., Bascompte, J., Berlow, E. L., Brown, J. H., Fortelius, M., Getz, W. M., Harte, J., Hastings, A., Marquet, P. A., Martinez, N. D., Mooers, A., Roopnarine, P., Vermeij, G., Williams, J. W., Gillespie, R., Kitzes, J., Marshall, C., Matzke, N., Mindell, D. P., Revilla, E., and Smith, A. B.: Approaching a state shift in Earth's biosphere, Nature, 486, 52–58, https://doi.org/10.1038/nature11018, 2012.
Beug, H. J.: Leitfaden der Pollenbestimmung für Mitteleuropa und angrenzende Gebiete (Guide to pollen determination for Central Europe and neighboring areas), Verlag Dr. Friedrich Pfeil, ISBN 10:3899370430, 2004.
Broström, A., Sugita, S., and Gaillard, M.-J.: Pollen productivity estimates for the reconstruction of past vegetation cover in the cultural landscape of southern Sweden, The Holocene, 14, 368–381, https://doi.org/10.1191/0959683604hl713rp, 2004.
Broström, A., Sugita, S., Gaillard, M.-J., and Pilesjö, P.: Estimating the spatial scale of pollen dispersal in the cultural landscape of southern Sweden, The Holocene, 15, 252–262, https://doi.org/10.1191/0959683605hl790rp, 2005.
Broström, A., Nielsen, A. B., Gaillard, M.-J., Hjelle, K., Mazier, F., Binney, H., Bunting, J., Fyfe, R., Meltsov, V., Poska, A., Räsänen, S., Soepboer, W., von Stedingk, H., Suutari, H., and Sugita, S.: Pollen productivity estimates of key European plant taxa for quantitative reconstruction of past vegetation: a review, Veg. Hist. Archaeobot., 17, 461–478, https://doi.org/10.1007/s00334-008-0148-8, 2008.
Bunting, M. J., Armitage, R., Binney, H. A., and Waller, M.: Estimates of`relative pollen productivity' and`relevant source area of pollen' for major tree taxa in two Norfolk (UK) woodlands, The Holocene, 15, 459–465, https://doi.org/10.1191/0959683605hl821rr, 2005.
Bunting, M. J., Farrell, M., Broström, A., Hjelle, K. L., Mazier, F., Middleton, R., Nielsen, A. B., Rushton, E., Shaw, H., and Twiddle, C. L.: Palynological perspectives on vegetation survey: a critical step for model-based reconstruction of Quaternary land cover, Quaternary Sci. Rev., 82, 41–55, https://doi.org/10.1016/j.quascirev.2013.10.006, 2013a.
Bunting, M. J., Schofield, J. E., and Edwards, K. J.: Estimates of relative pollen productivity (RPP) for selected taxa from southern Greenland: A pragmatic solution, Rev. Palaeobot. Palynol., 190, 66–74, https://doi.org/10.1016/j.revpalbo.2012.11.003, 2013b.
Commerford, J. L., McLauchlan, K. K., and Sugita, S.: Calibrating Vegetation Cover and Grassland Pollen Assemblages in the Flint Hills of Kansas, USA, Am. J. Plant Sci., 04, 1–10, https://doi.org/10.4236/ajps.2013.47A1001, 2013.
Cui, Q.-Y., Gaillard, M.-J., Lemdahl, G., Sugita, S., Greisman, A., Jacobson, G. L., and Olsson, F.: The role of tree composition in Holocene fire history of the hemiboreal and southern boreal zones of southern Sweden, as revealed by the application of the Landscape Reconstruction Algorithm: Implications for biodiversity and climate-change issues, The Holocene, 23, 1747–1763, https://doi.org/10.1177/0959683613505339, 2013.
Cui, Q., Gaillard, M., Lemdahl, G., Stenberg, L., Sugita, S., and Zernova, G.: Historical land-use and landscape change in southern Sweden and implications for present and future biodiversity, Ecol. Evol., 4, 3555–3570, https://doi.org/10.1002/ece3.1198, 2014.
Davis, B. A. S., Collins, P. M., and Kaplan, J. O.: The age and post-glacial development of the modern European vegetation: a plant functional approach based on pollen data, Veg. Hist. Archaeobot., 24, 303–317, https://doi.org/10.1007/s00334-014-0476-9, 2015.
Davis, M. B.: On the theory of pollen analysis, Am. J. Sci., 261, 897–912, https://doi.org/10.2475/ajs.261.10.897, 1963.
Dawson, A., Cao, X., Chaput, M., Hopla, E., Li, F., Edwards, M., Fyfe, R., Gajewski, K., Goring, S. J., Herzschuh, U., Mazier, F., Sugita, S., Williams, J. W., Xu, Q., and Gaillard, M.-J.: Finding the magnitude of human-induced Northern Hemisphere land-cover transformation between 6 and 0.2 ka BP, Past Glob. Chang. Mag., 26, 34–35, https://doi.org/10.22498/pages.26.1.34, 2018.
de Vareilles, A., Pelling, R., Woodbridge, J., and Fyfe, R.: Archaeology and agriculture: plants, people, and past land-use, Trends Ecol. Evol., 36, 943–954, https://doi.org/10.1016/j.tree.2021.06.003, 2021.
Dickson, C.: Distinguishing cereal from wild grass pollen: some limitations, Circaea, 5, 67–71, 1988.
Downs, P. W. and Piégay, H.: Catchment-scale cumulative impact of human activities on river channels in the late Anthropocene: implications, limitations, prospect, Geomorphology, 338, 88–104, https://doi.org/10.1016/j.geomorph.2019.03.021, 2019.
Edwards, K. J., Fyfe, R., and Jackson, S. T.: The first 100 years of pollen analysis, Nat. Plants, 3, 17001, https://doi.org/10.1038/nplants.2017.1, 2017.
Ellis, E. C.: Ecology in an anthropogenic biosphere, Ecol. Monogr., 85, 287–331, https://doi.org/10.1890/14-2274.1, 2015.
Feurdean, A., Vannière, B., Finsinger, W., Warren, D., Connor, S. C., Forrest, M., Liakka, J., Panait, A., Werner, C., Andrič, M., Bobek, P., Carter, V. A., Davis, B., Diaconu, A.-C., Dietze, E., Feeser, I., Florescu, G., Gałka, M., Giesecke, T., Jahns, S., Jamrichová, E., Kajukało, K., Kaplan, J., Karpińska-Kołaczek, M., Kołaczek, P., Kuneš, P., Kupriyanov, D., Lamentowicz, M., Lemmen, C., Magyari, E. K., Marcisz, K., Marinova, E., Niamir, A., Novenko, E., Obremska, M., Pędziszewska, A., Pfeiffer, M., Poska, A., Rösch, M., Słowiński, M., Stančikaitė, M., Szal, M., Święta-Musznicka, J., Tanţău, I., Theuerkauf, M., Tonkov, S., Valkó, O., Vassiljev, J., Veski, S., Vincze, I., Wacnik, A., Wiethold, J., and Hickler, T.: Fire hazard modulation by long-term dynamics in land cover and dominant forest type in eastern and central Europe, Biogeosciences, 17, 1213–1230, https://doi.org/10.5194/bg-17-1213-2020, 2020.
Foley, J. A.: Global Consequences of Land Use, Science, 309, 570–574, https://doi.org/10.1126/science.1111772, 2005.
Fyfe, R., de Beaulieu, J.-L., Binney, H., Bradshaw, R. H. W., Brewer, S., Le Flao, A., Finsinger, W., Gaillard, M.-J., Giesecke, T., Gil-Romera, G., Grimm, E. C., Huntley, B., Kunes, P., Kühl, N., Leydet, M., Lotter, A. F., Tarasov, P. E., and Tonkov, S.: The European Pollen Database: past efforts and current activities, Veg. Hist. Archaeobot., 18, 417–424, https://doi.org/10.1007/s00334-009-0215-9, 2009.
Fyfe, R., Roberts, N., and Woodbridge, J.: A pollen-based pseudobiomisation approach to anthropogenic land-cover change, The Holocene, 20, 1165–1171, https://doi.org/10.1177/0959683610369509, 2010.
Fyfe, R., Twiddle, C., Sugita, S., Gaillard, M. J., Barratt, P., Caseldine, C. J., Dodson, J., Edwards, K. J., Farrell, M., Froyd, C., Grant, M. J., Huckerby, E., Innes, J. B., Shaw, H., and Waller, M.: The Holocene vegetation cover of Britain and Ireland: Overcoming problems of scale and discerning patterns of openness, Quaternary Sci. Rev., 73, 132–148, https://doi.org/10.1016/j.quascirev.2013.05.014, 2013.
Fyfe, R. M., Woodbridge, J., and Roberts, N.: From forest to farmland: pollen-inferred land cover change across Europe using the pseudobiomization approach, Glob. Chang. Biol., 21, 1197–1212, https://doi.org/10.1111/gcb.12776, 2015.
Fyfe, R. M., Woodbridge, J., and Roberts, C. N.: Trajectories of change in Mediterranean Holocene vegetation through classification of pollen data, Veg. Hist. Archaeobot., 27, 351–364, https://doi.org/10.1007/s00334-017-0657-4, 2018.
Fyfe, R. M., Githumbi, E., Trondmann, A.-K., Mazier, F., Nielsen, A. B., Poska, A., Sugita, S., Woodbridge, J., Contributors, L., and Gaillard, M.-J.: A full Holocene record of transient gridded vegetation cover in Europe, Pangaea [data set], https://doi.org/10.1594/PANGAEA.937075, 2022.
Gaillard, M.-J., Sugita, S., Bunting, M. J., Middleton, R., Broström, A., Caseldine, C., Giesecke, T., Hellman, S. E. V., Hicks, S., Hjelle, K., Langdon, C., Nielsen, A.-B., Poska, A., von Stedingk, H., and Veski, S.: The use of modelling and simulation approach in reconstructing past landscapes from fossil pollen data: a review and results from the POLLANDCAL network, Veg. Hist. Archaeobot., 17, 419–443, https://doi.org/10.1007/s00334-008-0169-3, 2008.
Gaillard, M.-J., Sugita, S., Mazier, F., Trondman, A.-K., Broström, A., Hickler, T., Kaplan, J. O., Kjellström, E., Kokfelt, U., Kuneš, P., Lemmen, C., Miller, P., Olofsson, J., Poska, A., Rundgren, M., Smith, B., Strandberg, G., Fyfe, R., Nielsen, A. B., Alenius, T., Balakauskas, L., Barnekow, L., Birks, H. J. B., Bjune, A., Björkman, L., Giesecke, T., Hjelle, K., Kalnina, L., Kangur, M., van der Knaap, W. O., Koff, T., Lagerås, P., Latałowa, M., Leydet, M., Lechterbeck, J., Lindbladh, M., Odgaard, B., Peglar, S., Segerström, U., von Stedingk, H., and Seppä, H.: Holocene land-cover reconstructions for studies on land cover-climate feedbacks, Clim. Past, 6, 483–499, https://doi.org/10.5194/cp-6-483-2010, 2010a.
Gaillard, M. J., Sugita, S., Rundgren, M., Smith, B., Mazier, F., Trondman, A.-K., Fyfe, R., Kokfelt, U., Nielsen, A.-B., Strandberg, G., and Team, L. members: Pollen-inferred quantitative reconstructions of Holocene land-cover in NW Europe for the evaluation of past climate-vegetation feedbacks – The Swedish LANDCLIM project and the NordForsk LANDCLIM network, Geophys. Res. Abstr., 12, 3–4, 2010b.
Gaillard, M.-J., Kleinen, T., Samuelsson, P., Nielsen, A. B., Bergh, J., Kaplan, J. O., Poska, A., Sandström, C., Strandberg, G., Trondman, A.-K., and Wramneby, A.: Second Assessment of Climate Change for the Baltic Sea Basin, edited by: The BACC II Author Team, Springer International Publishing, Cham, https://doi.org/10.1007/978-3-319-16006-1, 2015.
Gaillard, M. J., Morrison, K. D., Madella, M., and Whitehouse, N.: Editorial: Past land-use and land-cover change: the challenge of quantification at the subcontinental to global scales, Past Glob. Chang. Mag., 26, 3, https://doi.org/10.22498/pages.26.1.3, 2018.
Giesecke, T., Davis, B., Brewer, S., Finsinger, W., Wolters, S., Blaauw, M., de Beaulieu, J.-L., Binney, H., Fyfe, R. M., Gaillard, M.-J., Gil-Romera, G., van der Knaap, W. O., Kuneš, P., Kühl, N., van Leeuwen, J. F. N. N., Leydet, M., Lotter, A. F., Ortu, E., Semmler, M., and Bradshaw, R. H. W. W.: Towards mapping the late Quaternary vegetation change of Europe, Veg. Hist. Archaeobot., 23, 75–86, https://doi.org/10.1007/s00334-012-0390-y, 2014.
Gilgen, A., Wilkenskjeld, S., Kaplan, J. O., Kühn, T., and Lohmann, U.: Effects of land use and anthropogenic aerosol emissions in the Roman Empire, Clim. Past, 15, 1885–1911, https://doi.org/10.5194/cp-15-1885-2019, 2019.
Githumbi, E., Fyfe, R., Kjellström, E., Lindström, J., Lu, Z., Mazier, F., Nielsen, A. B., Poska, A., Smith, B., Strandberg, G., Sugita, S., Zhang, Q., and Gaillard, M.-J.: Holocene quantitative pollen-based vegetation reconstructions in Europe for climate modelling: LandClim II, in INQUA 2019: Life on the Edge, Dublin, https://portal.research.lu.se/portal/en/publications/holocene-quantitative-pollenbased-vegetation-reconstructions-in-europe-for-climate-modelling-landclim-ii(46cc8471-f51c-4117-a7c6-ccff00638e82)/export.html (last access: 9 August 2021), 2019.
Gregory, P.: Spores: their properties and sedimentation in still air. Microbiology of the atmosphere, A plant science monograph, Leonard Hill, ISBN 0249441101, 1973.
Grindean, R., Nielsen, A. B., Tanţău, I., and Feurdean, A.: Relative pollen productivity estimates in the forest steppe landscape of southeastern Romania, Rev. Palaeobot. Palynol., 264, 54–63, https://doi.org/10.1016/j.revpalbo.2019.02.007, 2019.
Guiry, E., Beglane, F., Szpak, P., Schulting, R., McCormick, F., and Richards, M. P.: Anthropogenic changes to the Holocene nitrogen cycle in Ireland, Sci. Adv., 4, eaas9383, https://doi.org/10.1126/sciadv.aas9383, 2018.
Harrison, S. and Marinova, E.: EMBSeCBIO modern pollen biomisation, University of Reading [data set], https://doi.org/10.17864/1947.109, 2017.
Harrison, S. P., Gaillard, M.-J., Stocker, B. D., Vander Linden, M., Klein Goldewijk, K., Boles, O., Braconnot, P., Dawson, A., Fluet-Chouinard, E., Kaplan, J. O., Kastner, T., Pausata, F. S. R., Robinson, E., Whitehouse, N. J., Madella, M., and Morrison, K. D.: Development and testing scenarios for implementing land use and land cover changes during the Holocene in Earth system model experiments, Geosci. Model Dev., 13, 805–824, https://doi.org/10.5194/gmd-13-805-2020, 2020.
He, F., Vavrus, S. J., Kutzbach, J. E., Ruddiman, W. F., Kaplan, J. O., and Krumhardt, K. M.: Simulating global and local surface temperature changes due to Holocene anthropogenic land cover change, Geophys. Res. Lett., 41, 623–631, https://doi.org/10.1002/2013GL058085, 2014.
Hellman, S., Gaillard, M.-J., Broström, A., and Sugita, S.: The REVEALS model, a new tool to estimate past regional plant abundance from pollen data in large lakes: validation in southern Sweden, J. Quat. Sci., 23, 21–42, https://doi.org/10.1002/jqs.1126, 2008a.
Hellman, S. E. V., Gaillard, M., Broström, A., and Sugita, S.: Effects of the sampling design and selection of parameter values on pollen-based quantitative reconstructions of regional vegetation: a case study in southern Sweden using the REVEALS model, Veg. Hist. Archaeobot., 17, 445–459, https://doi.org/10.1007/s00334-008-0149-7, 2008b.
Hibbard, K., Janetos, A., van Vuuren, D. P., Pongratz, J., Rose, S. K., Betts, R., Herold, M., and Feddema, J. J.: Research priorities in land use and land-cover change for the Earth system and integrated assessment modelling, Int. J. Climatol., 30, 2118–2128, https://doi.org/10.1002/joc.2150, 2010.
Hjelle, K. L.: Herb pollen representation in surface moss samples from mown meadows and pastures in western Norway, Veg. Hist. Archaeobot., 7, 79–96, https://doi.org/10.1007/BF01373926, 1998.
Hofman-Kamińska, E., Bocherens, H., Drucker, D. G., Fyfe, R. M., Gumiński, W., Makowiecki, D., Pacher, M., Piličiauskienė, G., Samojlik, T., Woodbridge, J., and Kowalczyk, R.: Adapt or die – Response of large herbivores to environmental changes in Europe during the Holocene, Glob. Chang. Biol., 25, 2915–2930, https://doi.org/10.1111/gcb.14733, 2019.
Huntley, B.: European vegetation history: Palaeovegetation maps from pollen data – 13 000 yr BP to present, J. Quat. Sci., 5, 103–122, https://doi.org/10.1002/jqs.3390050203, 1990.
Kaplan, J., Krumhardt, K., Gaillard, M.-J., Sugita, S., Trondman, A.-K., Fyfe, R., Marquer, L., Mazier, F., and Nielsen, A.: Constraining the Deforestation History of Europe: Evaluation of Historical Land Use Scenarios with Pollen-Based Land Cover Reconstructions, Land, 6, 91, https://doi.org/10.3390/land6040091, 2017.
Kaplan, J. O., Krumhardt, K. M., and Zimmermann, N.: The prehistoric and preindustrial deforestation of Europe, Quaternary Sci. Rev., 28, 3016–3034, https://doi.org/10.1016/j.quascirev.2009.09.028, 2009.
Kaplan, J. O., Krumhardt, K. M., Ellis, E. C., Ruddiman, W. F., Lemmen, C., and Goldewijk, K. K.: Holocene carbon emissions as a result of anthropogenic land cover change, The Holocene, 21, 775–791, https://doi.org/10.1177/0959683610386983, 2011.
Klein Goldewijk, K., Beusen, A., Doelman, J., and Stehfest, E.: Anthropogenic land use estimates for the Holocene – HYDE 3.2, Earth Syst. Sci. Data, 9, 927–953, https://doi.org/10.5194/essd-9-927-2017, 2017.
Kuneš, P., Abraham, V., Kovářík, O., Kopecký, M., Břízová, E., Dudová, L., Jankovská, V., Knipping, M., Kozšková, R., Nováková, K., Petr, L., Pokorný, P., Roszková, A., Rybníčková, E., Svobodová-Svitavská, H., and Wacnik, A.: Czech quaternary palynological Database – Palycz: review and basic statistics of the data, Preslia, 81, 209–238, 2009.
Kuneš, P., Abraham, V., Werchan, B., Plesková, Z., Fajmon, K., Jamrichová, E., and Roleček, J.: Relative pollen productivity estimates for vegetation reconstruction in central-eastern Europe inferred at local and regional scales, The Holocene, 29, 1708–1719, https://doi.org/10.1177/0959683619862026, 2019.
Lerigoleur, E., Mazier, F., Jégou, L., Perret, M., and Galop, D.: PALEOPYR: un système d'information pour la gestion et l'exploitation de données palaeoenvironnementales sur le massif nord-pyrénéen, Ingénieurie des Systèmes d'Information 3, http://paleopyr.univ-tlse2.fr/ (last access: 4 April 2022), 2015.
Li, F., Gaillard, M.-J., Xu, Q., Bunting, M. J., Li, Y., Li, J., Mu, H., Lu, J., Zhang, P., Zhang, S., Cui, Q., Zhang, Y., and Shen, W.: A Review of Relative Pollen Productivity Estimates From Temperate China for Pollen-Based Quantitative Reconstruction of Past Plant Cover, Front. Plant Sci., 9, 1214, https://doi.org/10.3389/fpls.2018.01214, 2018.
Li, F., Gaillard, M.-J., Cao, X., Herzschuh, U., Sugita, S., Tarasov, P. E., Wagner, M., Xu, Q., Ni, J., Wang, W., Zhao, Y., An, C., Beusen, A. H. W., Chen, F., Feng, Z., Goldewijk, C. G. M. K., Huang, X., Li, Y., Li, Y., Liu, H., Sun, A., Yao, Y., Zheng, Z., and Jia, X.: Towards quantification of Holocene anthropogenic land-cover change in temperate China: A review in the light of pollen-based REVEALS reconstructions of regional plant cover, Earth-Sci. Rev., 203, 103119, https://doi.org/10.1016/j.earscirev.2020.103119, 2020.
Marinova, E., Harrison, S. P., Bragg, F., Connor, S., Laet, V., Leroy, S. A. G., Mudie, P., Atanassova, J., Bozilova, E., Caner, H., Cordova, C., Djamali, M., Filipova-Marinova, M., Gerasimenko, N., Jahns, S., Kouli, K., Kotthoff, U., Kvavadze, E., Lazarova, M., Novenko, E., Ramezani, E., Röpke, A., Shumilovskikh, L., Tanţau, I., and Tonkov, S.: Pollen-derived biomes in the Eastern Mediterranean–Black Sea–Caspian-Corridor, J. Biogeogr., 45, 484–499, https://doi.org/10.1111/jbi.13128, 2018.
Marquer, L., Gaillard, M.-J., Sugita, S., Trondman, A.-K., Mazier, F., Nielsen, A. B., Fyfe, R., Odgaard, B. V., Alenius, T., Birks, H. J. B., Bjune, A. E., Christiansen, J., Dodson, J., Edwards, K. J., Giesecke, T., Herzschuh, U., Kangur, M., Lorenz, S., Poska, A., Schult, M., and Seppä, H.: Holocene changes in vegetation composition in northern Europe: why quantitative pollen-based vegetation reconstructions matter, Quaternary Sci. Rev., 90, 199–216, https://doi.org/10.1016/j.quascirev.2014.02.013, 2014.
Marquer, L., Gaillard, M.-J., Sugita, S., Poska, A., Trondman, A.-K., Mazier, F., Nielsen, A. B., Fyfe, R., Jönsson, A. M., Smith, B., Kaplan, J. O., Alenius, T., Birks, H. J. B. J. B., Bjune, A. E., Christiansen, J., Dodson, J., Edwards, K. J., Giesecke, T., Herzschuh, U., Kangur, M., Koff, T., Latałowa, M., Lechterbeck, J., Olofsson, J., and Seppä, H.: Quantifying the effects of land use and climate on Holocene vegetation in Europe, Quaternary Sci. Rev., 171, 20–37, https://doi.org/10.1016/j.quascirev.2017.07.001, 2017.
Marquer, L., Mazier, F., Sugita, S., Galop, D., Houet, T., Faure, E., Gaillard, M.-J., Haunold, S., de Munnik, N., Simonneau, A., De Vleeschouwer, F., and Le Roux, G.: Pollen-based reconstruction of Holocene land-cover in mountain regions: Evaluation of the Landscape Reconstruction Algorithm in the Vicdessos valley, northern Pyrenees, France, Quaternary Sci. Rev., 228, 106049, https://doi.org/10.1016/j.quascirev.2019.106049, 2020.
Matthias, I., Nielsen, A. B., and Giesecke, T.: Evaluating the effect of flowering age and forest structure on pollen productivity estimates, Veg. Hist. Archaeobot., 21, 471–484, https://doi.org/10.1007/s00334-012-0373-z, 2012.
Mazier, F., Broström, A., Gaillard, M.-J., Sugita, S., Vittoz, P., and Buttler, A.: Pollen productivity estimates and relevant source area of pollen for selected plant taxa in a pasture woodland landscape of the Jura Mountains (Switzerland), Veg. Hist. Archaeobot., 17, 479–495, https://doi.org/10.1007/s00334-008-0143-0, 2008.
Mazier, F., Gaillard, M. J., Kunes, P., Sugita, S., Trondman, A.-K., and Brostrom, A.: Testing the effect of site selection and parameter setting on REVEALS-model estimates of plant abundance using th Czech Quaternary Palynological database Testing the effect of site selection and parameter setting on REVEALS-model estimates of plant abunda, Rev. Palaeobot. Palynol., 187, 38–49, 2012.
Mazier, F., Broström, A., Bragée, P., Fredh, D., Stenberg, L., Thiere, G., Sugita, S., and Hammarlund, D.: Two hundred years of land-use change in the South Swedish Uplands: comparison of historical map-based estimates with a pollen-based reconstruction using the landscape reconstruction algorithm, Veg. Hist. Archaeobot., 24, 555–570, https://doi.org/10.1007/s00334-015-0516-0, 2015.
McLauchlan, K. K., Williams, J. J., Craine, J. M., and Jeffers, E. S.: Changes in global nitrogen cycling during the Holocene epoch, Nature, 495, 352–355, https://doi.org/10.1038/nature11916, 2013.
Mehl, I. K., Overland, A., Berge, J., and Hjelle, K. L.: Cultural landscape development on a west–east gradient in western Norway – potential of the Landscape Reconstruction Algorithm (LRA), J. Archaeol. Sci., 61, 1–16, https://doi.org/10.1016/j.jas.2015.04.015, 2015.
Morrison, K. D., Hammer, E., Boles, O., Madella, M., Whitehouse, N., Gaillard, M.-J., Bates, J., Vander Linden, M., Merlo, S., Yao, A., Popova, L., Hill, A. C., Antolin, F., Bauer, A., Biagetti, S., Bishop, R. R., Buckland, P., Cruz, P., Dreslerová, D., Dusseldorp, G., Ellis, E., Filipovic, D., Foster, T., Hannaford, M. J., Harrison, S. P., Hazarika, M., Herold, H., Hilpert, J., Kaplan, J. O., Kay, A., Klein Goldewijk, K., Kolář, J., Kyazike, E., Laabs, J., Lancelotti, C., Lane, P., Lawrence, D., Lewis, K., Lombardo, U., Lucarini, G., Arroyo-Kalin, M., Marchant, R., Mayle, F., McClatchie, M., McLeester, M., Mooney, S., Moskal-del Hoyo, M., Navarrete, V., Ndiema, E., Góes Neves, E., Nowak, M., Out, W. A., Petrie, C., Phelps, L. N., Pinke, Z., Rostain, S., Russell, T., Sluyter, A., Styring, A. K., Tamanaha, E., Thomas, E., Veerasamy, S., Welton, L., and Zanon, M.: Mapping past human land use using archaeological data: A new classification for global land use synthesis and data harmonization, edited by J. Freeman, PLoS One, 16, e0246662, https://doi.org/10.1371/journal.pone.0246662, 2021.
Nielsen, A. B.: Modelling pollen sedimentation in Danish lakes at c.ad 1800: an attempt to validate the POLLSCAPE model, J. Biogeogr., 31, 1693–1709, https://doi.org/10.1111/j.1365-2699.2004.01080.x, 2004.
Nielsen, A. B. and Odgaard, B. V.: Quantitative landscape dynamics in Denmark through the last three millennia based on the Landscape Reconstruction Algorithm approach, Veg. Hist. Archaeobot., 19, 375–387, https://doi.org/10.1007/s00334-010-0249-z, 2010.
Nielsen, A. B., Giesecke, T., Theuerkauf, M., Feeser, I., Behre, K.-E., Beug, H.-J., Chen, S.-H., Christiansen, J., Dörfler, W., Endtmann, E., Jahns, S., de Klerk, P., Kühl, N., Latałowa, M., Odgaard, B. V., Rasmussen, P., Stockholm, J. R., Voigt, R., Wiethold, J., and Wolters, S.: Quantitative reconstructions of changes in regional openness in north-central Europe reveal new insights into old questions, Quaternary Sci. Rev., 47, 131–149, https://doi.org/10.1016/j.quascirev.2012.05.011, 2012.
Nosova, M. B., Novenko, E. Y., Severova, E. E., and Volkova, O. A.: Vegetation and climate changes within and around the Polistovo-Lovatskaya mire system (Pskov Oblast, north-western Russia) during the past 10,500 years, Veg. Hist. Archaeobot., 28, 123–140, https://doi.org/10.1007/s00334-018-0693-8, 2018.
Palmisano, A., Woodbridge, J., Roberts, C. N., Bevan, A., Fyfe, R., Shennan, S., Cheddadi, R., Greenberg, R., Kaniewski, D., Langgut, D., Leroy, S. A. G., Litt, T., and Miebach, A.: Holocene landscape dynamics and long-term population trends in the Levant, The Holocene, 29, 708–727, https://doi.org/10.1177/0959683619826642, 2019.
Parsons, R. W. and Prentice, I. C.: Statistical approaches to R-values and the pollen – vegetation relationship, Rev. Palaeobot. Palynol., 32, 127–152, https://doi.org/10.1016/0034-6667(81)90001-4, 1981.
Pinhasi, R., Fort, J., and Ammerman, A. J.: Tracing the origin and spread of agriculture in Europe, PLoS Biol., 3, 1–9, https://doi.org/10.1371/journal.pbio.0030410, 2005.
Pirzamanbein, B., Lindström, J., Poska, A., Sugita, S., Trondman, A.-K., Fyfe, R., Mazier, F., Nielsen, A. B., Kaplan, J. O., Bjune, A. E., Birks, H. J. B., Giesecke, T., Kangur, M., Latałowa, M., Marquer, L., Smith, B., and Gaillard, M.-J.: Creating spatially continuous maps of past land cover from point estimates: A new statistical approach applied to pollen data, Ecol. Complex., 20, 127–141, https://doi.org/10.1016/j.ecocom.2014.09.005, 2014.
Pirzamanbein, B., Lindström, J., Poska, A., and Gaillard, M. J.: Modelling Spatial Compositional Data: Reconstructions of past land cover and uncertainties, Spat. Stat., 24, 14–31, https://doi.org/10.1016/j.spasta.2018.03.005, 2018.
Pirzamanbein, B., Poska, A., and Lindström, J.: Bayesian Reconstruction of Past Land Cover From Pollen Data: Model Robustness and Sensitivity to Auxiliary Variables, Earth Space Sci., 7, https://doi.org/10.1029/2018EA000547, 2020.
Poska, A., Meltsov, V., Sugita, S., and Vassiljev, J.: Relative pollen productivity estimates of major anemophilous taxa and relevant source area of pollen in a cultural landscape of the hemi-boreal forest zone (Estonia), Rev. Palaeobot. Palynol., 167, 30–39, https://doi.org/10.1016/j.revpalbo.2011.07.001, 2011.
Prentice, C.: Records of vegetation in time and space: the principles of pollen analysis, in: Vegetation history, 17–42, edited by: Huntley, B. and Webb, T., Springer the Netherlands, Dordrecht, https://doi.org/10.1007/978-94-009-3081-0_2, 1988.
Prentice, C., Guiot, J., Huntley, B., Jolly, D., and Cheddadi, R.: Reconstructing biomes from palaeoecological data: a general method and its application to European pollen data at 0 and 6 ka, Clim. Dynam., 12, 185–194, https://doi.org/10.1007/BF00211617, 1996.
Prentice, I. C.: Pollen Representation, Source Area, and Basin Size: Toward a Unified Theory of Pollen Analysis, Quaternary Res., 23, 76–86, https://doi.org/10.1016/0033-5894(85)90073-0, 1985.
Prentice, I. C. and Parsons, R. W. A.: Maximum Likelihood Linear Calibration of Pollen Spectra in Terms of Forest Composition, Biometrics, 39, 1051–1057, https://doi.org/10.2307/2531338, 1983.
Prentice, I. C. and Webb III, T.: BIOME 6000: reconstructing global mid-Holocene vegetation patterns from palaeoecological records, J. Biogeogr., 25, 997–1005, https://doi.org/10.1046/j.1365-2699.1998.00235.x, 1998.
Räsänen, S., Suutari, H., and Nielsen, A. B.: A step further towards quantitative reconstruction of past vegetation in Fennoscandian boreal forests: Pollen productivity estimates for six dominant taxa, Rev. Palaeobot. Palynol., 146, 208–220, https://doi.org/10.1016/j.revpalbo.2007.04.004, 2007.
Roberts, C. N., Woodbridge, J., Palmisano, A., Bevan, A., Fyfe, R., and Shennan, S.: Mediterranean landscape change during the Holocene: Synthesis, comparison and regional trends in population, land cover and climate, The Holocene, 29, 923–937, https://doi.org/10.1177/0959683619826697, 2019.
Roberts, N., Fyfe, R. M., Woodbridge, J., Gaillard, M.-J., Davis, B. A. S. S., Kaplan, J. O., Marquer, L., Mazier, F., Nielsen, A. B., Sugita, S., Trondman, A.-K., and Leydet, M.: Europe's lost forests: a pollen-based synthesis for the last 11,000 years, Sci. Rep.-UK, 8, 716, https://doi.org/10.1038/s41598-017-18646-7, 2018.
Ruddiman, W. F.: The Anthropogenic Greenhouse Era Began Thousands of Years Ago, Clim. Change, 61, 261–293, https://doi.org/10.1023/B:CLIM.0000004577.17928.fa, 2003.
Ruddiman, W. F., Fuller, D. Q., Kutzbach, J. E., Tzedakis, P. C., Kaplan, J. O., Ellis, E. C., Vavrus, S. J., Roberts, C. N., Fyfe, R., He, F., Lemmen, C., and Woodbridge, J.: Late Holocene climate: Natural or anthropogenic?, Rev. Geophys., 54, 93–118, https://doi.org/10.1002/2015RG000503, 2016.
Schauer, P., Shennan, S., Bevan, A., Cook, G., Edinborough, K., Fyfe, R., Kerig, T. and Parker Pearson, M.: Supply and demand in prehistory? Economics of Neolithic mining in northwest Europe, J. Anthropol. Archaeol., 54, 149–160, https://doi.org/10.1016/j.jaa.2019.03.001, 2019.
Shennan, S.: The First Farmers of Europe An Evolutionary Perspective, Cambridge University Press, Cambridge, https://www-cambridge-org.proxy.lnu.se/se/academic/subjects/archaeology/archaeology-europe-and-near-and-middle-east/first-farmers-europe-evolutionary-perspective?format=HB&isbn=9781108422925 (last access: 4 April 2022), 2018.
Smith, P., Davis, S. J., Creutzig, F., Fuss, S., Minx, J., Gabrielle, B., Kato, E., Jackson, R. B., Cowie, A., Kriegler, E., van Vuuren, D. P., Rogelj, J., Ciais, P., Milne, J., Canadell, J. G., McCollum, D., Peters, G., Andrew, R., Krey, V., Shrestha, G., Friedlingstein, P., Gasser, T., Grübler, A., Heidug, W. K., Jonas, M., Jones, C. D., Kraxner, F., Littleton, E., Lowe, J., Moreira, J. R., Nakicenovic, N., Obersteiner, M., Patwardhan, A., Rogner, M., Rubin, E., Sharifi, A., Torvanger, A., Yamagata, Y., Edmonds, J., and Yongsung, C.: Biophysical and economic limits to negative CO2 emissions, Nat. Clim. Chang., 6, 42–50, https://doi.org/10.1038/nclimate2870, 2016.
Soepboer, W., Sugita, S., Lotter, A. F., van Leeuwen, J. F. N., and van der Knaap, W. O.: Pollen productivity estimates for quantitative reconstruction of vegetation cover on the Swiss Plateau, The Holocene, 17, 65–77, https://doi.org/10.1177/0959683607073279, 2007.
Soepboer, W., Sugita, S., and Lotter, A. F.: Regional vegetation-cover changes on the Swiss Plateau during the past two millennia: A pollen-based reconstruction using the REVEALS model, Quaternary Sci. Rev., 29, 472–483, https://doi.org/10.1016/j.quascirev.2009.09.027, 2010.
Stephens, L., Fuller, D., Boivin, N., et al.: Archaeological assessment reveals Earth's early transformation through land use, Science, 365, 897–902, https://doi.org/10.1126/science.aax1192, 2019.
Strandberg, G., Kjellström, E., Poska, A., Wagner, S., Gaillard, M.-J., Trondman, A.-K., Mauri, A., Davis, B. A. S., Kaplan, J. O., Birks, H. J. B., Bjune, A. E., Fyfe, R., Giesecke, T., Kalnina, L., Kangur, M., van der Knaap, W. O., Kokfelt, U., Kuneš, P., Latałowa, M., Marquer, L., Mazier, F., Nielsen, A. B., Smith, B., Seppä, H., and Sugita, S.: Regional climate model simulations for Europe at 6 and 0.2 k BP: sensitivity to changes in anthropogenic deforestation, Clim. Past, 10, 661–680, https://doi.org/10.5194/cp-10-661-2014, 2014.
Strandberg, G., Lindström, J., Poska, A., Zhang, Q., Fyfe, R., Githumbi, E., Kjellström, E., Mazier, F., Nielsen, A. B., Sugita, S., Trondman, A.-K., Woodbridge, J., and Gaillard, M.-J.: Mid-Holocene European climate revisited: New high-resolution regional climate model simulations using pollen-based land cover, Quaternary Sci. Rev., 281, 107431, https://doi.org/10.1016/j.quascirev.2022.107431, 2022.
Stuart, A. and Ord, J. K.: Kendall's advanced theory of statistics, Distrib. theory, 1, https://ci.nii.ac.jp/naid/10004597057 (last access: 2 July 2021), 1994.
Sugita, S.: A Model of Pollen Source Area for an Entire Lake Surface, Quaternary Res., 39, 239–244, https://doi.org/10.1006/qres.1993.1027, 1993.
Sugita, S.: Pollen representation of vegetation in quaternary sediments – theory and method in patchy vegetation, J. Ecol., 82, 881–897, https://doi.org/10.2307/2261452, 1994.
Sugita, S.: Theory of quantitative reconstruction of vegetation I: pollen from large sites REVEALS regional vegetation composition, The Holocene, 17, 229–241, https://doi.org/10.1177/0959683607075837, 2007a.
Sugita, S.: Theory of quantitative reconstruction of vegetation II: all you need is LOVE, The Holocene, 17, 243–257, https://doi.org/10.1177/0959683607075838, 2007b.
Sugita, S., Gaillard, M.-J., and Broström, A.: Landscape openness and pollen records: a simulation approach, The Holocene, 9, 409–421, https://doi.org/10.1191/095968399666429937, 1999.
Sugita, S., Parshall, T., Calcote, R., and Walker, K.: Testing the Landscape Reconstruction Algorithm for spatially explicit reconstruction of vegetation in northern Michigan and Wisconsin, Quaternary Res., 74, 289–300, https://doi.org/10.1016/j.yqres.2010.07.008, 2010.
Sun, A., Luo, Y., Wu, H., Chen, X., Li, Q., Yu, Y., Sun, X., and Guo, Z.: An updated biomization scheme and vegetation reconstruction based on a synthesis of modern and mid-Holocene pollen data in China, Glob. Planet. Change, 192, 103178, https://doi.org/10.1016/j.gloplacha.2020.103178, 2020.
Sutton, O.: Micrometeorology., Q. J. Roy. Meteor. Soc., 79, 457–457, https://doi.org/10.1002/qj.49707934125, 1953.
Theuerkauf, M., Kuparinen, A., and Joosten, H.: Pollen productivity estimates strongly depend on assumed pollen dispersal, The Holocene, 23, 14–24, https://doi.org/10.1177/0959683612450194, 2012.
Theuerkauf, M., Couwenberg, J., Kuparinen, A., and Liebscher, V.: A matter of dispersal: REVEALSinR introduces state-of-the-art dispersal models to quantitative vegetation reconstruction, Veg. Hist. Archaeobot., 25, 541–553, https://doi.org/10.1007/s00334-016-0572-0, 2016.
Trondman, A. K., Gaillard, M. J., Mazier, F., Sugita, S., Fyfe, R., Nielsen, A. B., Twiddle, C., Barratt, P., Birks, H. J. B., Bjune, A. E., Björkman, L., Broström, A., Caseldine, C., David, R., Dodson, J., Dörfler, W., Fischer, E., van Geel, B., Giesecke, T., Hultberg, T., Kalnina, L., Kangur, M., van der Knaap, P., Koff, T., Kuneš, P., Lagerås, P., Latalowa, M., Lechterbeck, J., Leroyer, C., Leydet, M., Lindbladh, M., Marquer, L., Mitchell, F. J. G., Odgaard, B. V., Peglar, S. M., Persson, T., Poska, A., Rösch, M., Seppä, H., Veski, S., and Wick, L.: Pollen-based quantitative reconstructions of Holocene regional vegetation cover (plant-functional types and land-cover types) in Europe suitable for climate modelling, Glob. Chang. Biol., 21, 676–697, https://doi.org/10.1111/gcb.12737, 2015.
Trondman, A.-K., Gaillard, M.-J., Sugita, S., Björkman, L., Greisman, A., Hultberg, T., Lagerås, P., Lindbladh, M., and Mazier, F.: Are pollen records from small sites appropriate for REVEALS model-based quantitative reconstructions of past regional vegetation? An empirical test in southern Sweden, Veg. Hist. Archaeobot., 25, 131–151, https://doi.org/10.1007/s00334-015-0536-9, 2016.
Twiddle, C. L., Jones, R. T., Caseldine, C. J., and Sugita, S.: Pollen productivity estimates for a pine woodland in eastern Scotland: The influence of sampling design and vegetation patterning, Rev. Palaeobot. Palynol., 174, 67–78, https://doi.org/10.1016/j.revpalbo.2011.12.006, 2012.
von Stedingk, H., Fyfe, R. M., and Allard, A.: Pollen productivity estimates from the forest–tundra ecotone in west-central Sweden: implications for vegetation reconstruction at the limits of the boreal forest, The Holocene, 18, 323–332, https://doi.org/10.1177/0959683607086769, 2008.
Wieczorek, M. and Herzschuh, U.: Compilation of relative pollen productivity (RPP) estimates and taxonomically harmonised RPP datasets for single continents and Northern Hemisphere extratropics, Earth Syst. Sci. Data, 12, 3515–3528, https://doi.org/10.5194/essd-12-3515-2020, 2020.
Wolf, A., Callaghan, T. V., and Larson, K.: Future changes in vegetation and ecosystem function of the Barents Region, Clim. Change, 87, 51–73, https://doi.org/10.1007/s10584-007-9342-4, 2008.
Woodbridge, J., Fyfe, R. M., and Roberts, N.: A comparison of remotely sensed and pollen-based approaches to mapping Europe's land cover, J. Biogeogr., 41, 2080–2092, https://doi.org/10.1111/jbi.12353, 2014.
Woodbridge, J., Fyfe, R., Roberts, C., Trondman, A., Mazier, F., and Davis, B.: European forest cover since the start of Neolithic agriculture: a critical comparison of pollen-based reconstructions, Past Glob. Chang. Mag., 26, 10–11, https://doi.org/10.22498/pages.26.1.10, 2018.
Zanon, M., Davis, B. A. S. S., Marquer, L., Brewer, S., and Kaplan, J. O.: European Forest Cover During the Past 12,000 Years: A Palynological Reconstruction Based on Modern Analogs and Remote Sensing, Front. Plant Sci., 9, 1–25, https://doi.org/10.3389/fpls.2018.00253, 2018.
- Abstract
- Introduction
- Methods
- Results
- Discussion
- Code availability
- Data availability
- Conclusions
- Appendix A: New RPP dataset for Europe
- Appendix B: Selection of RPP values and calculation of the mean RPPs and their SDs
- Appendix C: Selection of RPP studies
- Appendix D: Maps of REVEALS cover for three plant taxa (Calluna vulgaris, deciduous Quercus type (t.) and evergreen Quercus t.)
- Team list
- Author contributions
- Competing interests
- Disclaimer
- Acknowledgements
- Financial support
- Review statement
- References