the Creative Commons Attribution 4.0 License.
the Creative Commons Attribution 4.0 License.
 | 08 Mar 2021
Merging ground-based sunshine duration observations with satellite cloud and aerosol retrievals to produce high-resolution long-term surface solar radiation over China
Fei Feng
Although great progress has been made in estimating surface solar radiation (Rs) from meteorological observations, satellite retrieval, and reanalysis, getting best-estimated long-term variations in Rs are sorely needed for climate studies. It has been shown that Rs data derived from sunshine duration (SunDu) can provide reliable long-term variability, but such data are available at sparsely distributed weather stations. Here, we merge SunDu-derived Rs with satellite-derived cloud fraction and aerosol optical depth (AOD) to generate high-spatial-resolution (0.1∘) Rs over China from 2000 to 2017. The geographically weighted regression (GWR) and ordinary least-squares regression (OLS) merging methods are compared, and GWR is found to perform better. Based on the SunDu-derived Rs from 97 meteorological observation stations, which are co-located with those that direct Rs measurement sites, the GWR incorporated with satellite cloud fraction and AOD data produces monthly Rs with R2=0.97 and standard deviation =11.14 W m−2, while GWR driven by only cloud fraction produces similar results with R2=0.97 and standard deviation =11.41 W m−2. This similarity is because SunDu-derived Rs has included the impact of aerosols. This finding can help to build long-term Rs variations based on cloud data, such as Advanced Very High Resolution Radiometer (AVHRR) cloud retrievals, especially before 2000, when satellite AOD retrievals are not unavailable. The merged Rs product at a spatial resolution of 0.1∘ in this study can be downloaded at https://doi.org/10.1594/PANGAEA.921847 (Feng and Wang, 2020).
- Article
(6976 KB) - Full-text XML
- BibTeX
- EndNote


A clear knowledge of variations in surface solar radiation (Rs) is vitally important for an improved understanding of the global climate system and its interaction with human activity (Jia et al., 2013; Myers, 2005; Schwarz et al., 2020; Wang and Dickinson, 2013; Wild, 2009, 2017; Zell et al., 2015). Direct measurements have shown that Rs has significant decadal variability, namely a decrease (global dimming) from the 1950s to the late 1980s and subsequent increase (global brightening) (Wild, 2009). The variation in Rs is closely related to the Earth's water cycle, the whole biosphere, and the amount of available solar energy. This situation emphasizes the urgency to develop reliable Rs products to obtain the variability in Rs.
Great progress has been made in the detection of variability in Rs by meteorological observations, satellite retrieval, and radiation transfer model simulations or reanalysis Rs products in previous studies (Rahman and Zhang, 2019; Wang et al., 2015). However, each estimation has its advantages and disadvantages. Directly observed data provide accurate Rs records at short timescales; however, careful calibration and instrument maintenance are needed to maintain their long-term homogeneity. Previous studies have reported that directly observed Rs over China may have major inhomogeneity problems due to sensitivity drift and instrument replacement (Wang, 2014; Wang et al., 2015; Yang et al., 2018). Before 1990, the imitations of the USSR pyranometers had different degradation rates of the thermopile, resulting in an important sensitivity drift. To overcome the radiometer ageing problem, China replaced its instruments from 1990 to 1993. However, the new solar trackers failed frequently and introduced a high data missing rate for the direct radiation component of Rs (Lu and Bian, 2012; Mo et al., 2008). After 1993, although the instruments were substantially improved, the Chinese-developed pyranometers still had high thermal offset with directional response errors, and the stability of these instruments was also worse than that of the first-class pyranometers recommended by the World Meteorological Organization (WMO) (Lu et al., 2002; Lu and Bian, 2012; Yang et al., 2010). Yang et al. (2018) show that nearly half of observed Rs values (60 out of the 119 Rs observation stations) have inhomogeneity issues. These artificial change points in observed Rs are mainly caused by instrument change (42 shifts), station relocation (34 shifts), and observation schedule change (20 shifts). The remaining 64 change points could not be identified.
Sunshine duration (SunDu) data are relatively widely distributed and have a long-term record (Sanchezlorenzo et al., 2009; Wild, 2009). Existing studies have also confirmed that SunDu-derived Rs data are reliable Rs data, which can capture long-term trends of Rs and reflect the impacts of both aerosols and clouds at timescales ranging from daily to decadal (Feng and Wang, 2019; Manara et al., 2015; Sanchezlorenzo et al., 2013; Sanchezromero et al., 2014; Tang et al., 2011; Y. Wang et al., 2012; Wild, 2016). Even though SunDu data do not provide a direct estimate of Rs and have different sensitivity to atmospheric turbidity changes, compared with Rs observations, they are still a good proxy for variations in Rs (Manara et al., 2017).
Sunshine duration observations collected at weather stations in China have been used to reconstruct long-term Rs (Che et al., 2005; Feng et al., 2019; He et al., 2018; He and Wang, 2020; Jin et al., 2005; Shi et al., 2008; Yang et al., 2006, 2020). Based on the global SunDu-derived Rs records, He et al. (2018) found that SunDu permitted a revisit of global dimming from the 1950s to the 1980s over China, Europe, and the USA, with brightening from 1980 to 2009 in Europe and a declining trend in Rs from 1994 to 2010 in China. Wang et al. (2015) found that the dimming trend from 1961 to 1990 and nearly constant zero trend after 1990 over China, as calculated from the SunDu-derived Rs, was consistent with independent estimates of AOD (Luo et al., 2001); they also observed changes in the diurnal temperature range (K. C. Wang et al., 2012; Wang and Dickinson, 2013) and the observed pan evaporation (Yang et al., 2015). Although direct observations and SunDu-derived Rs can provide accurate long-term variations in Rs, both direct observations and sunshine duration records are often sparsely spatially distributed.
Satellite Rs retrievals and radiation transfer model simulations or reanalysis Rs products can provide Rs estimation with global coverage at high spatial resolution. However, model simulations and reanalysis Rs products have substantial biases due to the deficiency of simulating cloud and aerosol quantities (Feng and Wang, 2019; Zhao et al., 2013). Previous comparative studies have shown that the accuracies of Rs from reanalyses are lower than those of satellite products (Wang et al., 2015; Zhang et al., 2016) due to the good capability of capturing the spatial distribution and dynamic evolution of clouds in satellite remote sensing data.
Table 1 lists the current satellite-based Rs products, which have been widely validated in previous studies. Zhang et al. (2004) found that the monthly International Satellite Cloud Climatology Project-Flux Data (ISCCP-FD) Rs product had a positive bias of 8.8 W m−2 using Global Energy Balance Archive (GEBA) archived data as a reference. By comparing 1151 global sites, Zhang et al. (2015) evaluated four satellite-based Rs products, including ISCCP-FD, the Global Energy and Water Cycle Experiment-Surface Radiation Budget (GEWEX-SRB), the University of Maryland/Shortwave Radiation Budget (UMD-SRB), and the Earth's Radiant Energy System energy-balanced and filled product (CERES EBAF) and concluded that CERES EBAF shows better agreement with observations than other products. A similar overall good performance of CERES EBAF can also be found (Feng and Wang, 2018; Ma et al., 2015).
Table 1Current satellite-derived surface solar radiation (Rs) products.
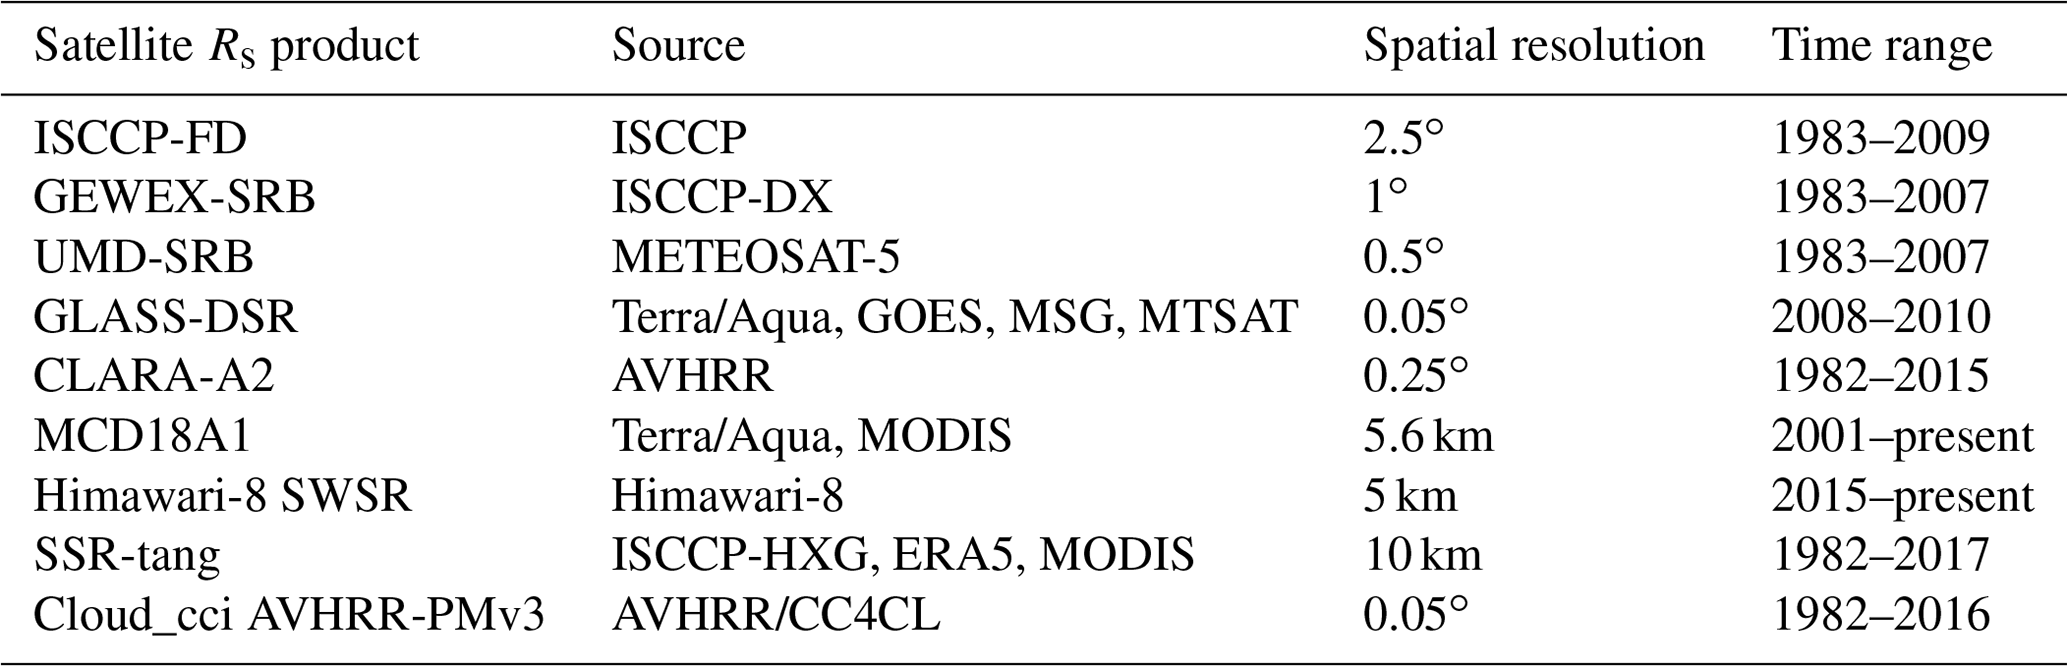
Although CERES EBAF uses more accurate input data to provide Rs data, its spatial resolution is only 1∘ (Kato et al., 2018). Since 2010, new-generation geostationary satellites have provided opportunities for high-temporal- and high-spatial-resolution Rs data, such as Himawari-8 (Hongrong et al., 2018; Letu et al., 2020). However, the time span of the new-generation satellite-based Rs product is short. The long-term AVHRR records provide the possibility of building long-term radiation datasets. The CLoud, Albedo and RAdiation dataset, the AVHRR-based data-second edition (CLARA-A2), covers a long time period, but the spatial resolution is only 0.25∘ (Karlsson et al., 2017). Recently, Tang et al. (2019) built a satellite-based Rs (SSR-tang) dataset using ISCCP-HXG cloud data. By using a variety of cloud properties derived from AVHRR, Stengel et al. (2020) presented the Cloud_cci AVHRR-PMv3 dataset generated within the Cloud_cci project.
Validation against the BSRN data indicated that SSR-tang values have the mean bias error (MBE) of −11.5 W m−2 and root-mean-square error (RMSE) of 113.5 W m−2 for the instantaneous Rs estimates at a 10 km scale, but Tang et al. (2019) point out that care should be taken when using this dataset for trend analysis due to the absence of realistic aerosol input data. Stengel et al. (2020) also show that Rs derived from Cloud_cci AVHRR-PMv3 reveals a very good agreement against BSRN stations, with low standard deviations of 13.8 W m−2 and correlation coefficients above 0.98, and a bias for shortwave fluxes that is small (1.9 W m−2). However, default aerosol optical depth of 0.05 or data from Aerosol cci Level-2 or NASA MODIS Level-2 are used in the BUGSrad model to calculate clear-sky Rs, indicating that the impact of aerosols is not perfectly parameterized in Cloud_cci AVHRR-PMv3.
On the other hand, the long-term cloud records also contain uncertainties. For example, ISCCP cloud products, which directly combine geostationary and polar orbiter satellite-based cloud data, have large inhomogeneity due to different amounts of data from polar orbit and geostationary satellites and their different capabilities for detecting low-level clouds (Dai et al., 2006; Evan et al., 2007). This inhomogeneity of the cloud products might introduce significant inhomogeneity to the Rs values calculated from the cloud products (Montero-Martín et al., 2020; Pfeifroth et al., 2018b), and Rs long-term variability estimation still needs improvement.
Efforts have been made to further improve Rs products. Merging multisource data has become an effective empirical method for improving the quality of Rs products (Camargo and Dorner, 2016; Feng and Wang, 2018; Hakuba et al., 2014; Journée et al., 2012; Lorenzo et al., 2017; Ruiz-Arias et al., 2015). For instance, to produce spatiotemporally consistent Rs data, multisource satellite data are used in Global LAnd Surface Satellite (GLASS) Rs products (Jin et al., 2013). By merging reanalysis and satellite Rs data by the probability density function-based method, the reanalysis Rs biases can be substantially reduced (Feng and Wang, 2018). This finding suggests that fusion methods are effective ways to improve the estimation of Rs, especially when Rs impact factors are considered (Feng and Wang, 2019). Although linear regression fusion methods can produce Rs data incorporated with Rs impact factors, the stable regression parameters might have negative effects on the final fusion results due to the complex characteristics of Rs spatial–temporal variability.
On the other hand, the spatial resolution of Rs data is crucial for regional meteorology studies, as the minimum requirement of the spatial resolution of Rs data, as suggested by the Observing Systems Capabilities Analysis and Review of WMO OSCAR), is 20 km (Huang et al., 2019). Interpolation methods are often included in Rs fusion methods to further improve the spatial resolutions of Rs data (Loghmari et al., 2018). For example, Zou et al. (2016) estimated global solar radiation using an artificial neural network based on an interpolation technique in southeast China. By integrating Rs data from 13 ground stations with Meteosat Second Generation satellite Rs products, Journée and Bertrand (2010) found that kriging with the external drift interpolation method performed better than mean bias correction, interpolated bias correction, and ordinary kriging with satellite-based correction. However, interpolation results have uncertainties due to the lack of detailed high-spatial-resolution information. Although traditional linear regression fusion methods can incorporate high-spatial-resolution data during the fusion process, the impacts of the stable regression parameters need further investigation.
The performances of different machine learning methods have been evaluated in many previous studies, including simulation Rs at regional scale with support of satellite retrievals (Wei et al., 2019; Yeom et al., 2019) and site scale by using routine meteorological observations (Cornejo-Bueno et al., 2019; Hou et al., 2020). Whatever models or training data are selected, the impacts of the spatial relationship are not taken into account in these machine-learning-based models, and therefore a large number of input data are required to ensure accuracy.
Geographically weighted regression (GWR) is an extension of the traditional regression model by allowing the relationships between dependent and explanatory variables to vary spatially. Researchers have examined and compared the applicability of GWR for the analysis of spatial data relative to that of other regression methods (Ali et al., 2007; Gao et al., 2006; Georganos et al., 2017; LeSage, 2004; Sheehan et al., 2012; Q. Zhou et al., 2019). Due to the large spatial heterogeneity of Rs over China, the GWR method might produce accurate Rs variability estimations with an improved spatial resolution.
This study is established to merge SunDu-derived Rs data with satellite-derived cloud fraction (CF) and AOD data to generate high-spatial-resolution (0.1∘) Rs over China from 2000 to 2017. The GWR and ordinary least-squares (OLS) regression merging methods are compared. CF and AOD are important Rs impact factors; however, many long-term Rs satellite products use climatology aerosol data as input. Whether much improvement is made in merging SunDu-derived Rs by incorporating AOD is also evaluated in this study, instead of evaluating direct merging current Rs products with SunDu-derived Rs. Since current high-quality Rs such as CERES EBAF have low spatial resolution, the output of this study provides reliable high-resolution grid Rs data to avoid the disadvantage of CERES EBAF for capturing the variability of Rs within a 1∘ box and provides guidance to merge multisource data to generate long-term Rs data over China.
2.1 Ground-based observations
2.1.1 Direct observations
Rs direct observations from 2000 to 2017 are obtained from the China Meteorological Data Service Centre (CMDC, http://data.cma.cn/data/index.html, last access: 3 March 2021) of the China Meteorological Administration (CMA). TBQ-2 pyranometers and DFY4 pyranometers have been used to measure Rs since 1993. Daily Rs values from 97 Rs stations are collected, and we calculated monthly Rs values by averaging daily Rs values when daily observed data are available for more than 15 d for each month at each radiation station. These monthly Rs values from direct measurements and collocated SunDu-derived Rs are used as independent reference data to investigate the performances of the fusion methods (Fig. 1). The whole area over China is further divided into nine zones by the K-mean cluster method based on geographic locations and multiyear mean Rs using 97 Rs direct observation sites, as shown in Fig. 1. The download instructions of the Rs direct observations can be found in Table 2.
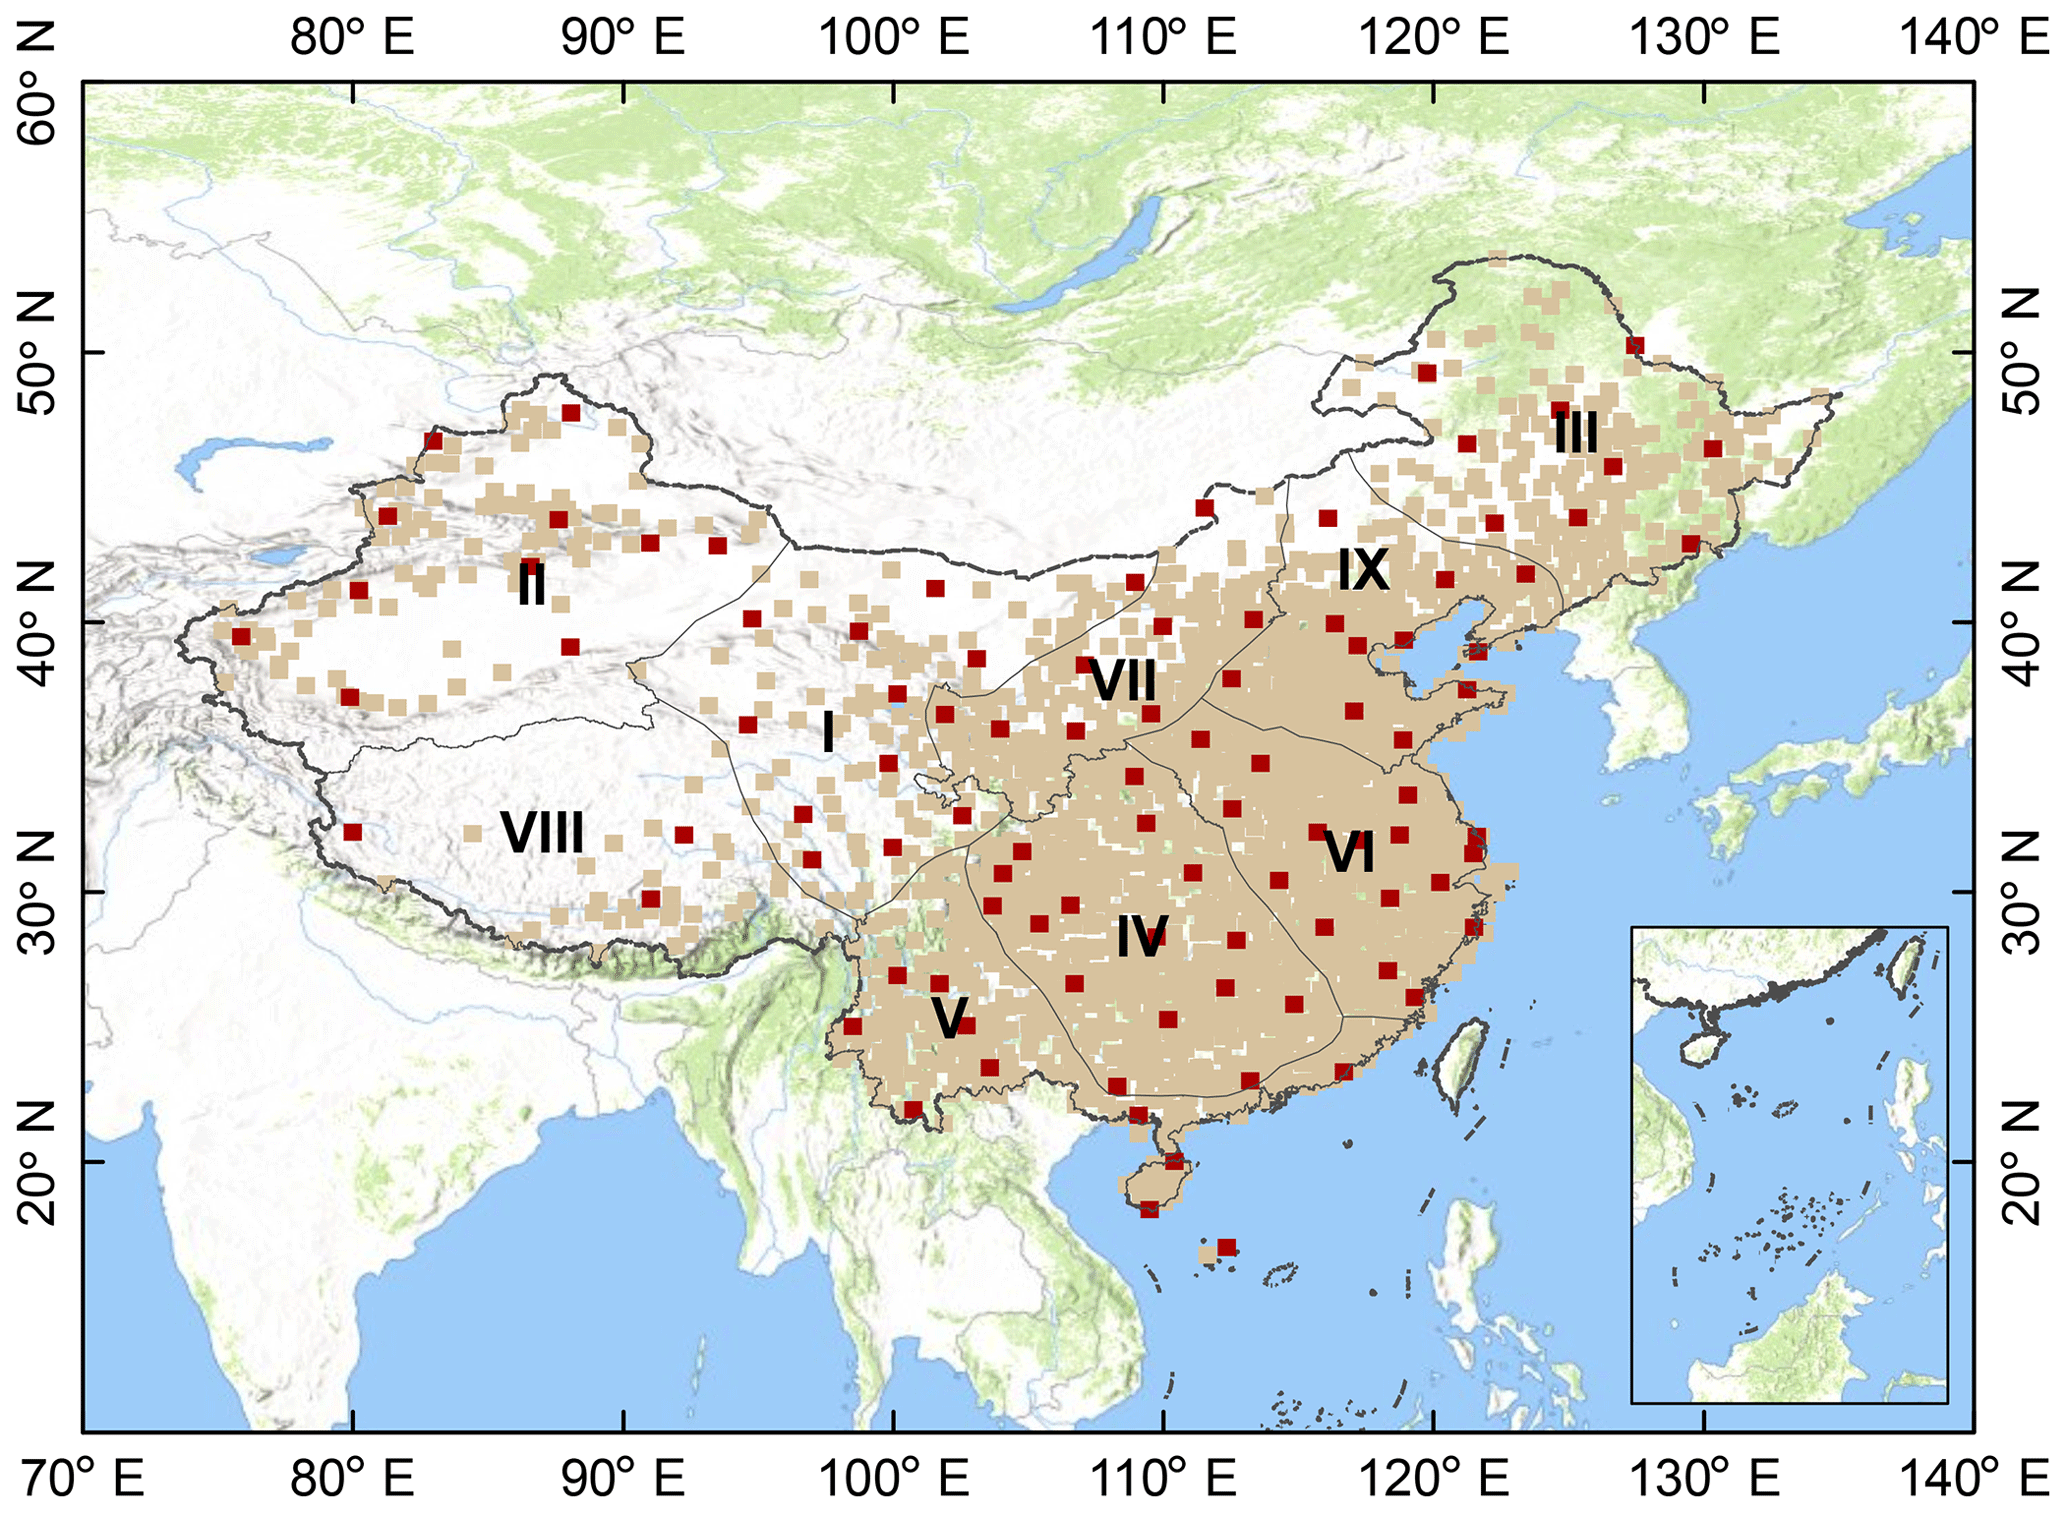
Figure 1The 2400 sunshine duration (SunDu) merging sites are shown as light brown points, and 97 independent validation sites, including Rs direct measurements and SunDu-derived Rs measurements, are shown as brown red points. The whole region is classified into nine subregions (I to IX) by the K-mean cluster method based on geographic locations and multiyear mean Rs using 97 Rs direct observation sites. The base hillshade map was produced by an elevation map of the study area using the global digital elevation model (DEM) derived from the Shuttle Radar Topography Mission 30 (SRTM30) dataset.
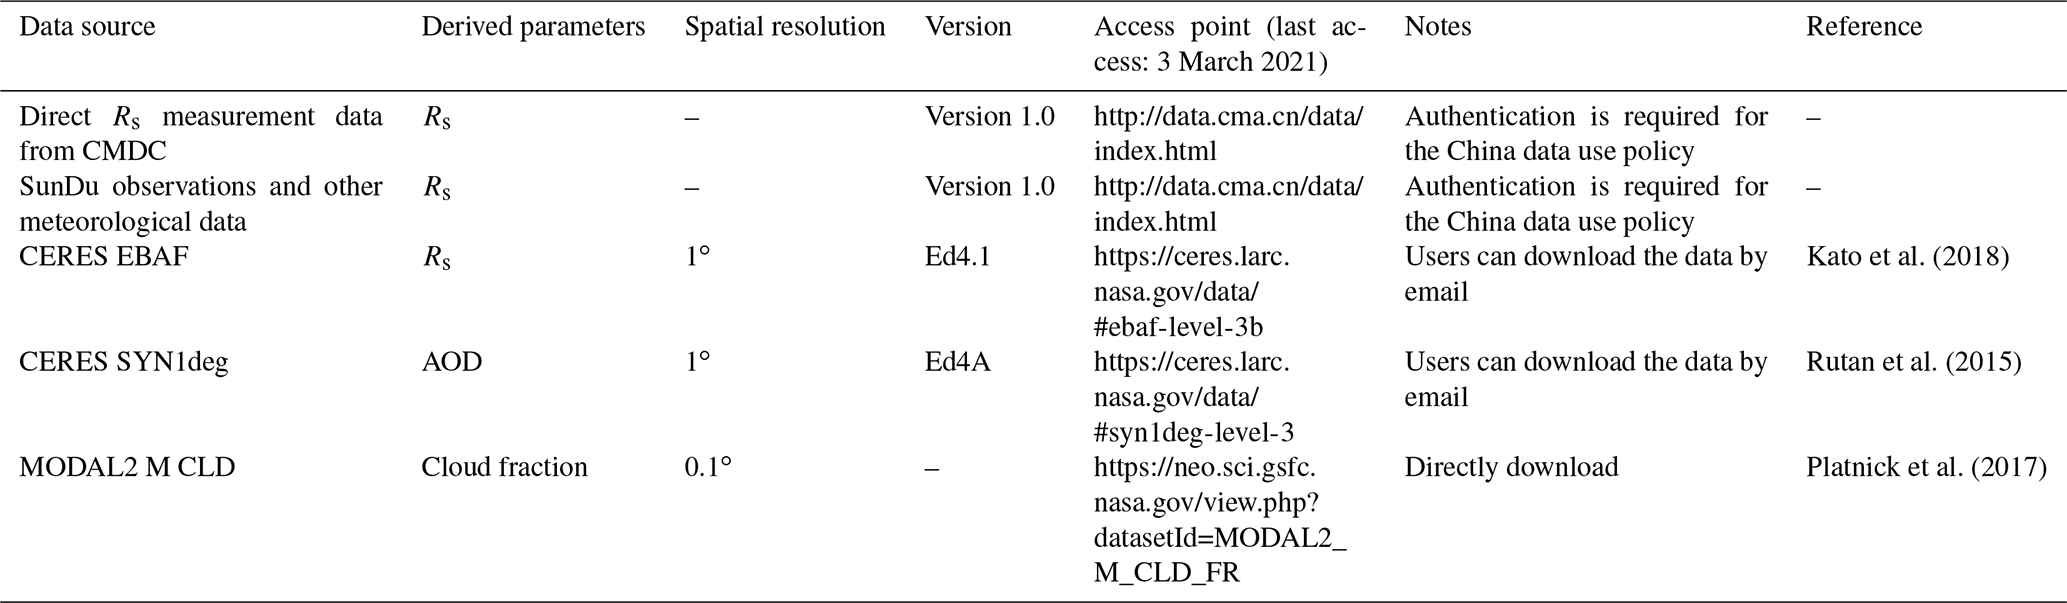
Table 2Summary of availability information for all source data used in this study. CMDC is the China Meteorological Data Service Centre. SunDu is the sunshine duration data. Rs is surface solar radiation, and AOD is the aerosol optical depth.
2.1.2 SunDu-derived Rs
Sunshine duration observations (SunDu) and other meteorological data (e.g. air temperature, relative humidity, and surface pressure) from 1980 to 2017, which were collected from approximately 2400 meteorological stations (http://data.cma.cn/data/index.html) from the CMA, are used to calculate the SunDu-derived Rs (Fig. 1). Rs values are calculated following the method of the revised Ångström–Prescott equation (Eqs. 1–2) (He et al., 2018; Wang, 2014; Wang et al., 2015; Yang et al., 2006).
Here n represents the measured SunDu, and K represents the theoretical value of the SunDu. a0, a1, and a2 are the station-dependent parameters by tuning this equation with measurements of Rs and SunDu, and then the method is applied regionally (Wang, 2014). Instead of using observations from weather stations in Japan (Yang et al., 2006), observations in CMA are used (Wang, 2014). Rc is the daily total solar radiation at the surface under clear-sky conditions (Eq. 2). τc_dir and τc_dif represent the direct radiation transmittance and the diffuse radiation transmittance under clear-sky conditions. I0 is the solar irradiance at the top of the atmosphere (TOA). For the clear-sky Rs, τc_dir and τc_dif are calculated using a modified a broadband radiative transfer model by simplifying Leckner's spectral model (Leckner, 1978), where the effect of transmittance functions of permanent gas absorption, Rayleigh scattering, water vapour absorption, ozone absorption, and aerosol extinction are parameterized using the surface air temperature, surface pressure, precipitable water, thickness of the ozone layer, turbidity, and sunshine duration as inputs (Yang et al., 2006). Calculation of Rs also includes impacts of aerosols because SunDu is impacted by changes in both clouds and aerosols (Wang, 2014).
Based on the classified subregions using 97 direct Rs observations in Fig. 1, the intercomparison results in Figs. 2 and 3 show that the agreement between SunDu-derived Rs and CERES EBAF Rs estimates is better than that between the direct observations and SunDu-derived Rs estimates, which is likely due to the inhomogeneity issue of direct Rs observations over China, as mentioned in many previous studies (Wang, 2014; Yang et al., 2018). The satellite Rs retrievals and SunDu-derived Rs are totally independent, but the high agreements of these two datasets indicate that they both are of higher accuracy. Similar results are also reported by Wang et al. (2015) that low agreement between SunDu-derived Rs and direct Rs observation is likely due to the directional response errors of the direct observations of Rs.
The SunDu-derived Rs observations, excluding SunDu observations located at direct observation sites, are used for merging. A total of 10 % merging observations are randomly selected for GWR parameter optimization. The download instructions of the SunDu observations can be found in Table 2.
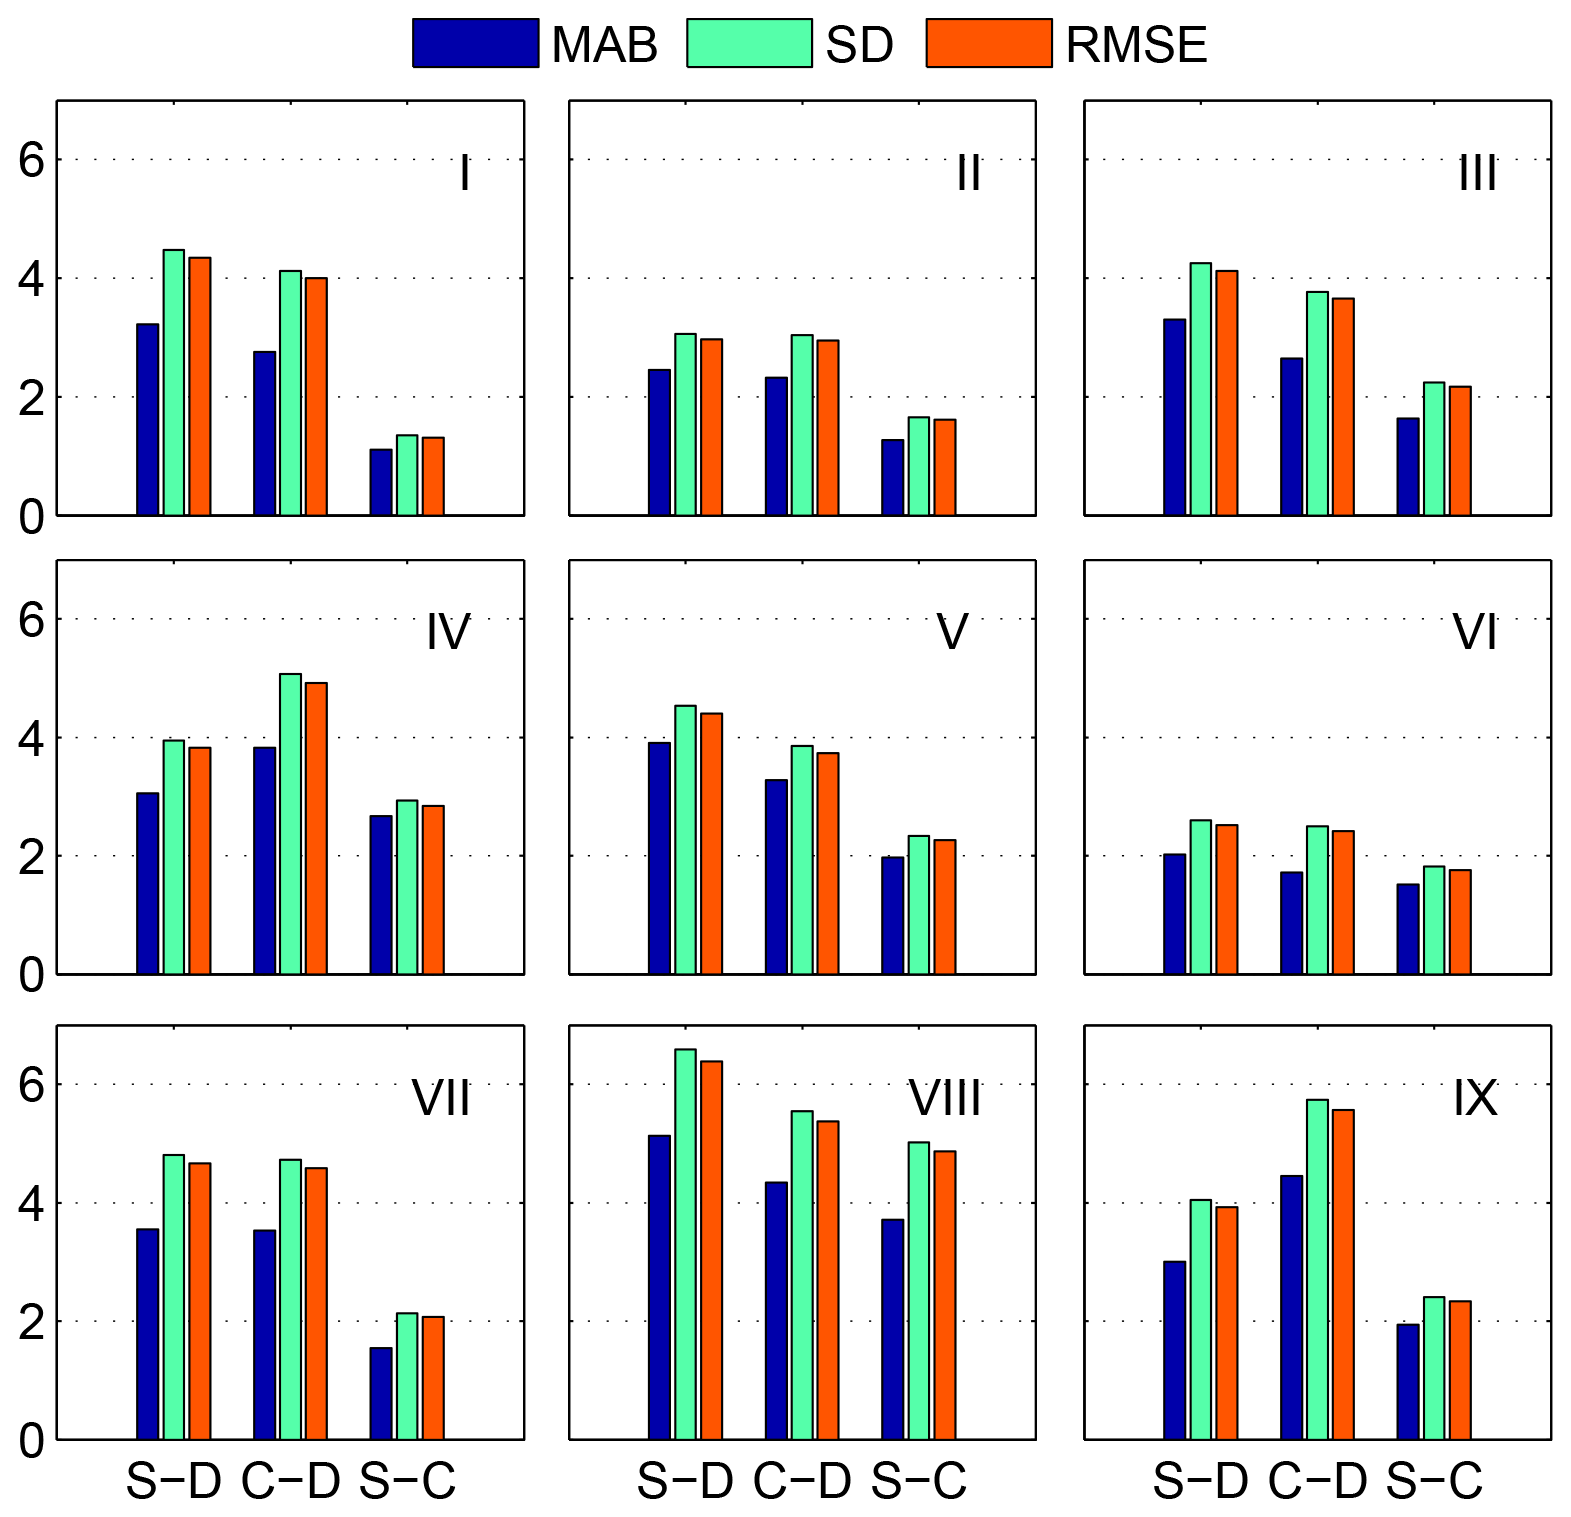
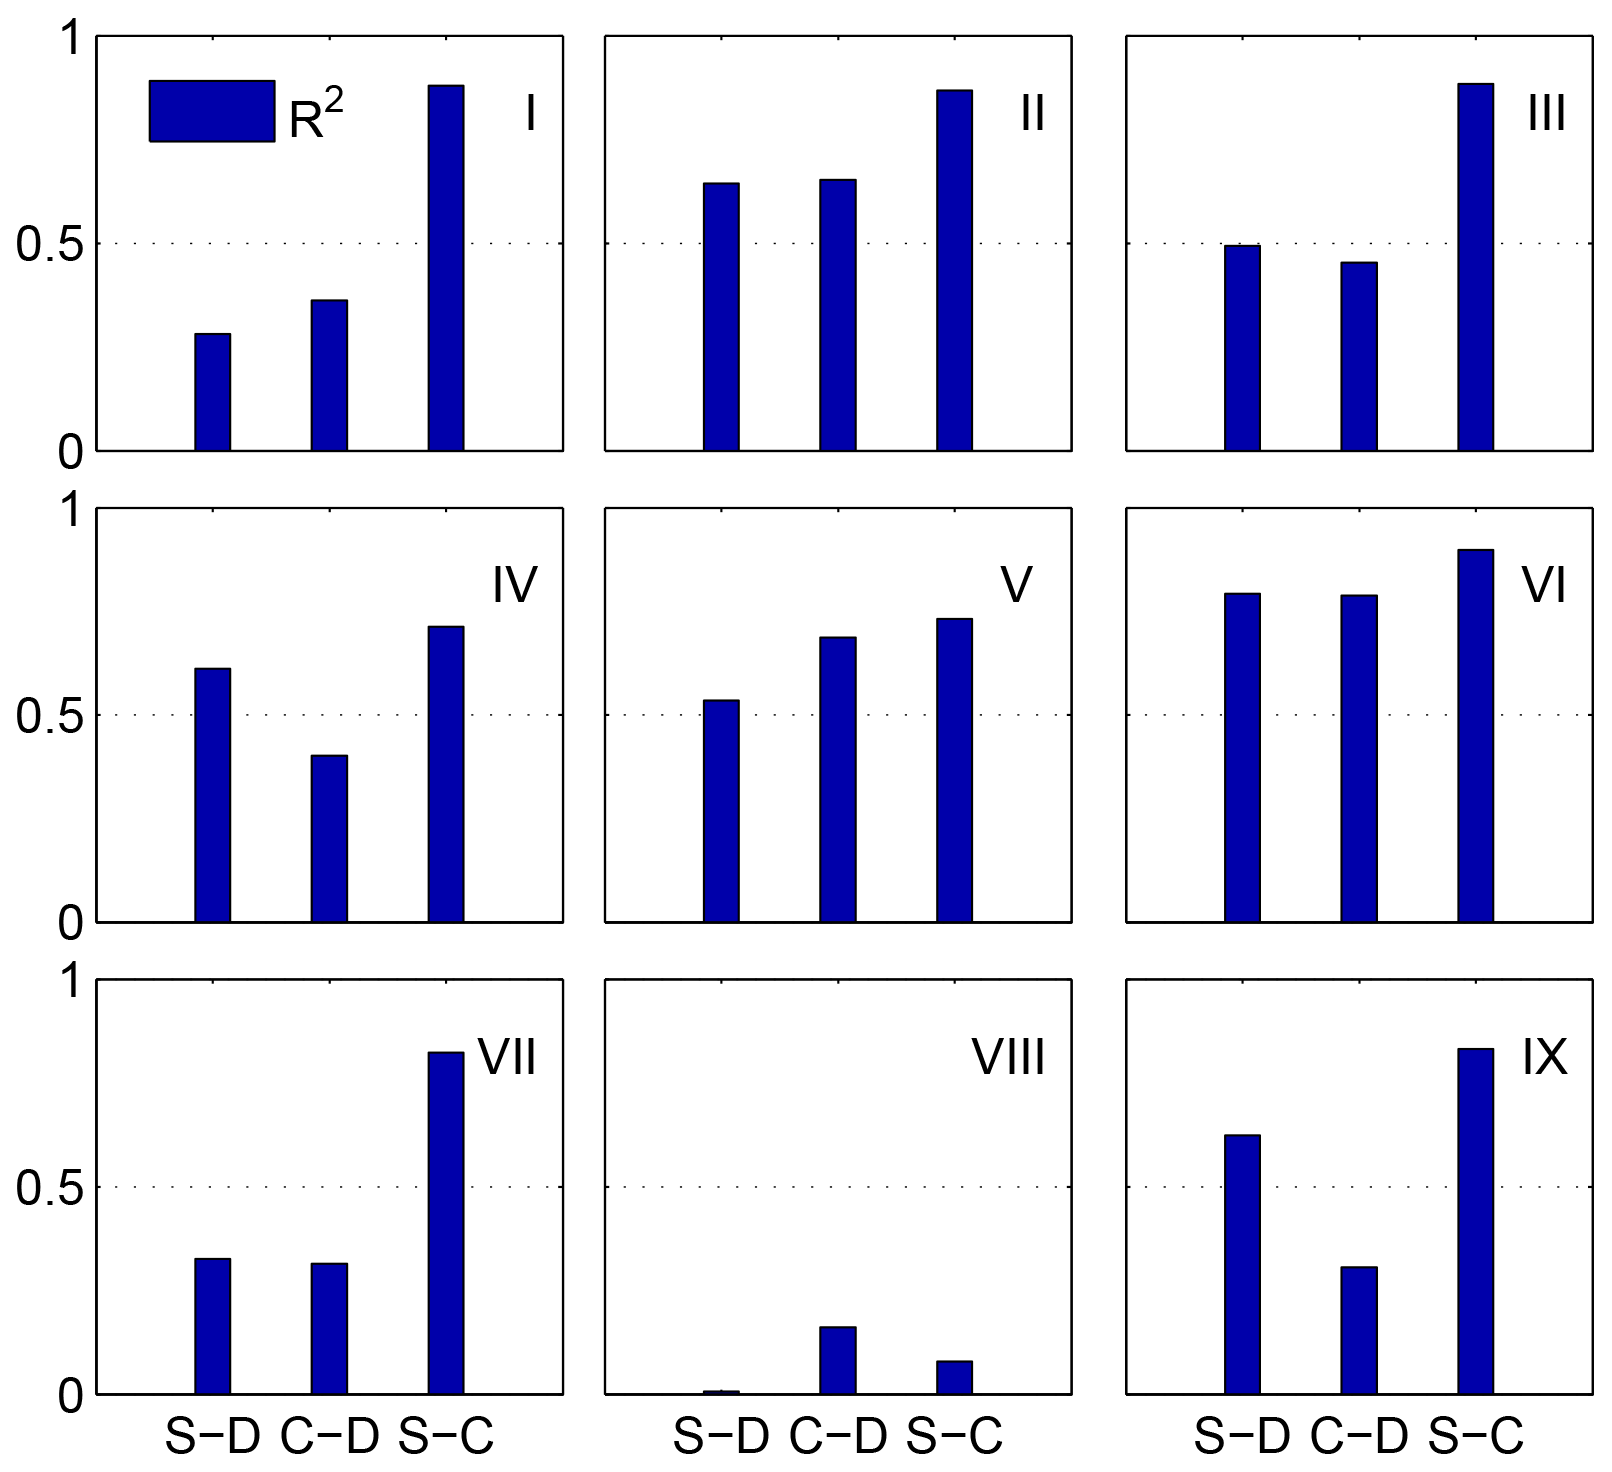
Figure 2Statistical summary of annual anomaly Rs from direct observed Rs, SunDu-derived Rs, and CERES EBAF Rs estimates in different subregions. The statistics include the mean absolute bias (MAB), standard deviation (SD), and root-mean-square error (RMSE). We use MAB due to the cancelling out effect of positive bias and negative bias. Nine subregions (I to IX) over China are shown in Fig. 1. S-D represents comparisons between SunDu-derived Rs and directly observed Rs. C-D represents comparisons between CERES EBAF Rs and directly observed Rs. S-C represents comparisons between SunDu-derived Rs and CERES EBAF Rs. The unit of the y axis is W m−2.
2.2 Satellite data
Rs data from the Clouds and Earth's Radiant Energy System energy balanced and filled product (CERES Synoptic (CERES) EBAF) surface product (edition 4.1) (Kato et al., 2018), cloud fraction from MODAL2 M CLD data product (Platnick et al., 2017), and AOD from the CERES SYN1deg edition 4A product (Doelling et al., 2013) are collected in this study. CERES EBAF Rs data are used as reference data. AOD from CERES SYN1deg and cloud fraction from MODAL2 M CLD are used as input data for fusion methods.
CERES is a three-channel radiometer measuring three filtered radiances, including shortwave (0.3–5 µm), total (0.3–200 µm), and window (8–12 µm). Rs values from CERES EBAF are adjusted using radiative kernels, including bias correction and Lagrange multiplier processes. The input data of CERES EBAF are adjusted during the product-generating process constrained by CERES observations at the TOA. The biases in temperature and specific humidity from the Goddard Earth Observing System (GEOS) reanalysis are adjusted by atmospheric infrared sounder (AIRS) data. Cloud properties, such as optical thickness and emissivity, from MODIS and geostationary satellites are constrained by cloud profiling radar; Cloud-Aerosol Lidar, and Infrared Pathfinder Satellite Observations (CALIPSO) detectors, and CloudSat. The uncertainties of CERES EBAF data, reported by Kato et al. (2018), in all sky global annual mean Rs is 4 W m−2. Previous studies (Feng and Wang, 2019, 2018; Ma et al., 2015; Wang et al., 2015) have shown that the CERES EBAF surface product provides reliable estimations of Rs.
CERES SYN1deg AOD derived from an aerosol transport model, named Atmospheric Transport and Chemistry Modelling (MATCH) (Collins et al., 2001), which assimilates MODIS AOD data, is used to obtain spatiotemporally consistent AOD data. Different aerosol constituents, including small dust (<0.5 µm), large dust (>0.5 µm), stratosphere, sea salt, soot, and soluble, are used to compute the optical thickness for a given constituent optical thickness for a given constituent. We did not use AOD from MODIS, because MODIS AOD conation misses values and cannot meet the requirements of spatio-temporal continuity of AOD input in this study. In addition, MODIS AOD is only available under clear-sky conditions while AOD provided by the assimilation system is averaged under all conditions.
Cloud fraction data from MODAL2 M CLD are collected as input cloud fraction data with a spatial resolution of 0.1∘ and time span from 2000 to 2017 (Platnick et al., 2017). The MODAL2 M CLD data are synthesized based on the cloud data from MOD06. Cloud fraction data from MOD06 are generated by the cloud mask product of MOD35 with a spatial resolution of 1 km. The MOD35 cloud mask is determined by applying appropriate single field-of-view (FOV) spectral tests to each pixel with a series of visible and infrared threshold and consistency tests. Each land type has different algorithms and thresholds for the tests. For each pixel test, an individual confidence flag is determined and then combined to produce the final cloud mask flag. The three confidence levels included in the cloud mask flag output are (i) high confidence for cloudless pixels (group confidence values >0.95), (ii) low confidence for unobstructed views on the surface (group confidence values Q≤0.66), and (iii) values between 0.66 and 0.95. Spatial and temporal continuity tests are further applied to determine whether the pixel is absolutely cloudless. Then, the cloud fraction is calculated from the 5 km × 5 km cloud mask pixel groupings; i.e. given the 25 pixels in the group, the cloud fraction for the group equals the number of cloudy pixels divided by 25.
2.3 Methods
2.3.1 Fusion models
OLS regression and GWR are used to build fusion methods for estimating Rs data. Cloud fraction and AOD have been important factors that affect variations in Rs. We compare different combinations of input data for the fusion methods, which can be classified into two types. The first type only contains cloud fraction data. The second type contains cloud fraction and AOD (Feng and Wang, 2020).
The OLS regression model is a commonly used model to estimate dependent variables by minimizing the sum-of-square differences between the independent and dependent variables. GWR is a regression model that allows the relationships between the independent and dependent variables to vary by locality (Brunsdon et al., 2010, 1998). GWR deviates from the assumption of homoscedasticity or static variance but calculates a specific variance for data within a zone or search radius of each predictor variable (Brunsdon et al., 1998; Fotheringham et al., 1996; Sheehan et al., 2012). The regression coefficients in GWR are not based on global information; rather, they vary with location, which is generated by a local regression estimation using subsampled data from the nearest neighbouring observations. The principle of GWR is described as follows:
where yi is the value of Rs unit i; denotes location i; xik indicates the value of the xik variable, such as cloud fraction and AOD; and ε denotes the residuals. δ(i) is the regression intercept. δk(i) is the vector of regression coefficients determined by spatial weighting function w(i), which is the weighting function quantifying the proximities of location i to its neighbouring observation sites; X is the variable matrix; and b is the bias vector.
The weighting functions are generally determined using the threshold method, inverse distance method, Gauss function method, and bi-square method. Due to the irregular distribution of observation sites and computer ability, the adaptive Gaussian function method is selected as a weighting function that varies in extent as a function of Rs observation site density.
where wij is the weighting function for observation site j that refers to location i; dij denotes the Euclidian distance between j and i; and b is the size of the neighbourhood, the maximum distance away from regression location i, called “band width”, which is determined by the number of nearest-neighbour points (NNPs).
2.3.2 GWR parameter comparison
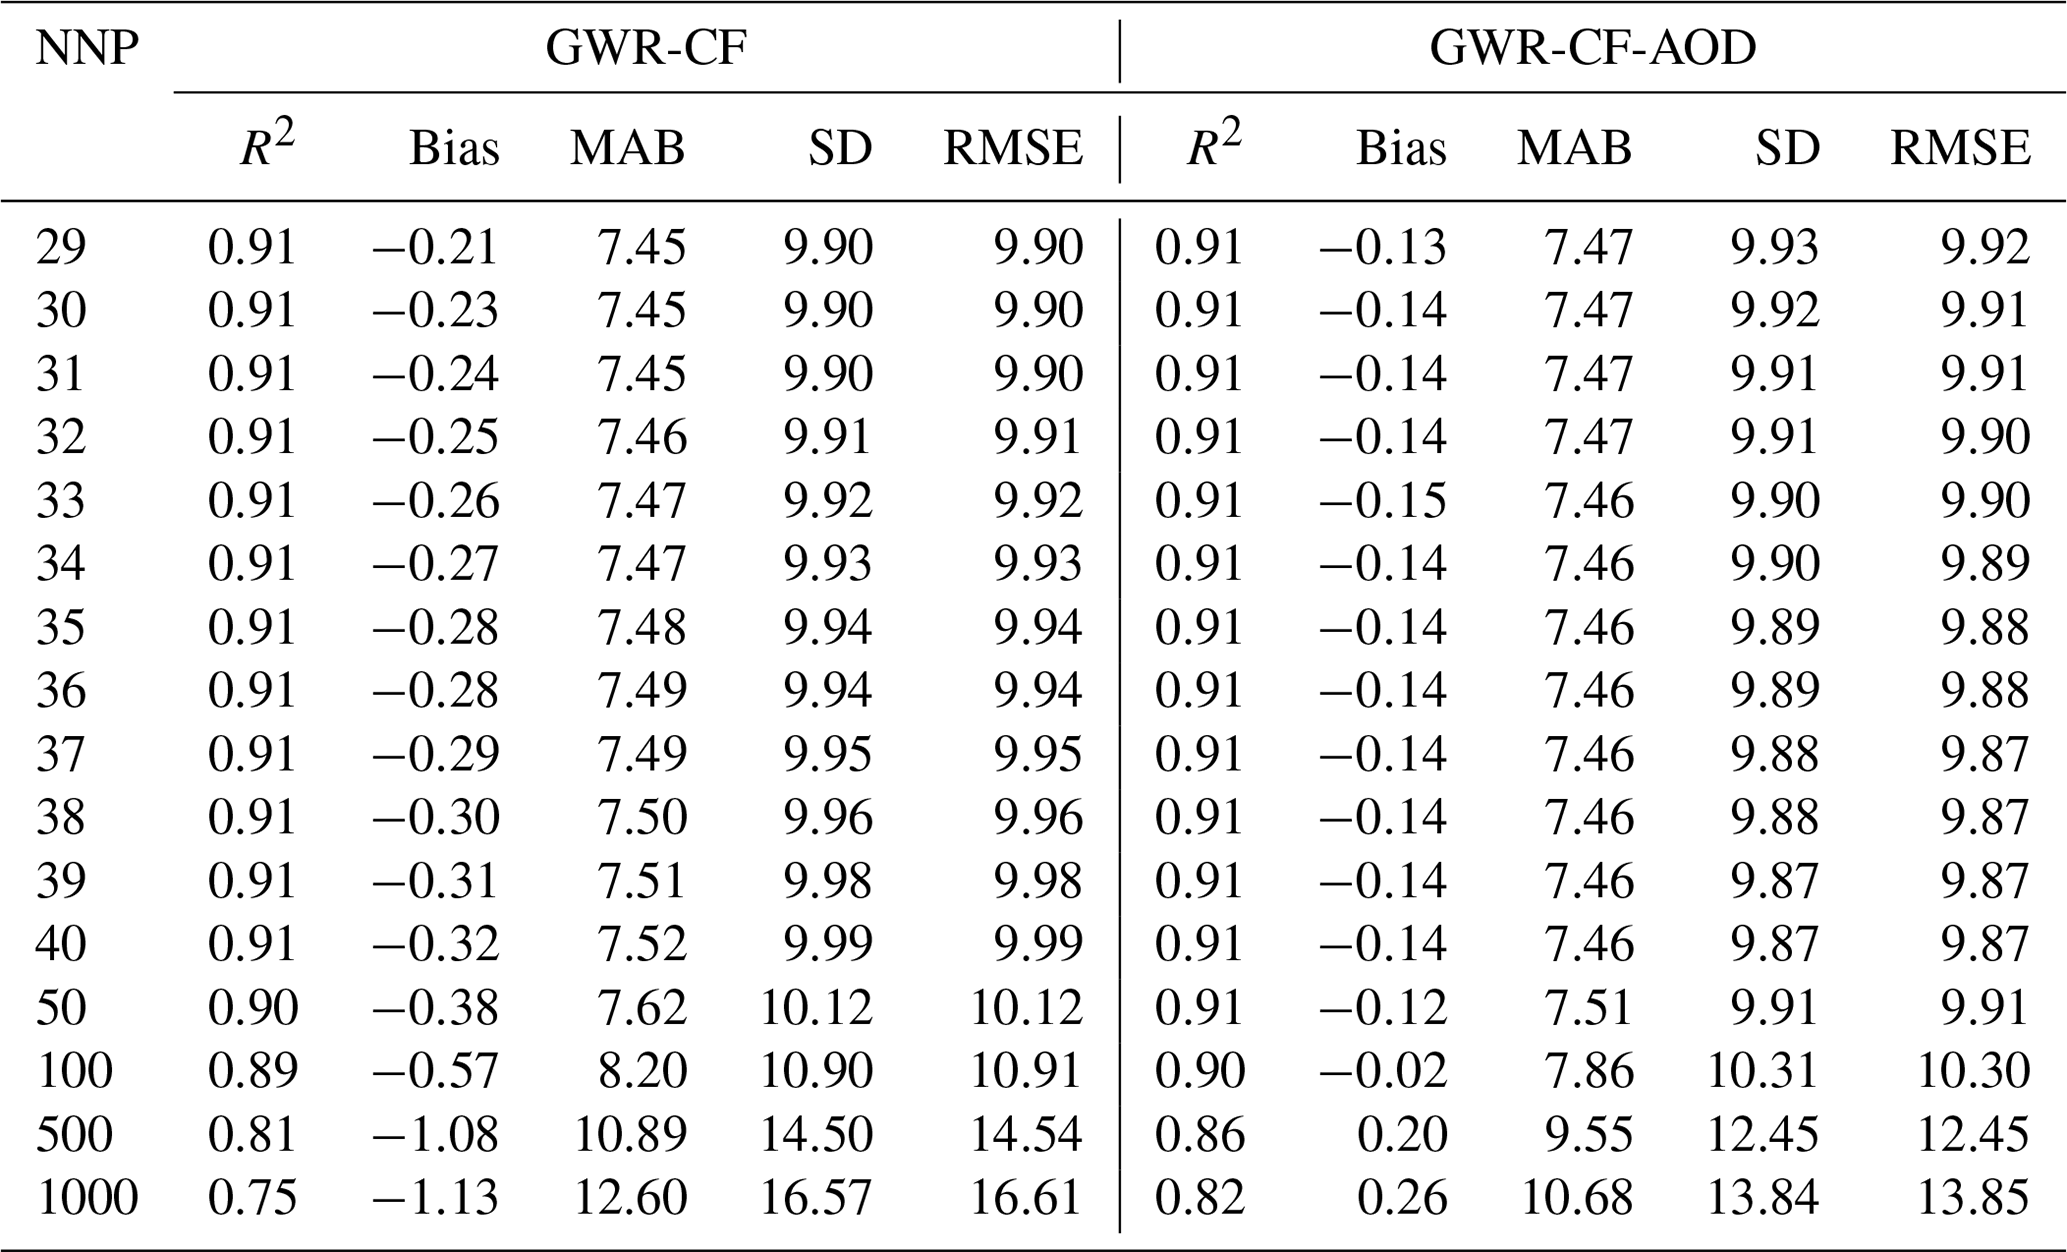
To perform the local regression for every local area, the number of NNPs is required to estimate spatially varying relationships between CF, AOD, and Rs in the GWR-based fused method. To identify the best combination of parameter values, we test the number of NNPs ranging from 29 to 1000. A total of 10 % of merging SunDu-derived Rs data are randomly selected to validate these GWR parameters (Fig. 1). The results show that R2 increases and bias decreases when the number of NNPs decreases. However, when the NNP is smaller than 30, the GWR-based fusion method produces spatially incomplete Rs data due to the local collinearity problem with large spatial variability. Therefore, 30 is selected as the NNP parameter (Table 3).
Table 3Statistical summary of GWR parameter optimization. NNP is the number of nearest-neighbour points. GWR-CF presents the GWR-based fused method using only cloud fraction (CF) input, and GWR-CF-AOD presents that using both CF and aerosol optical depth (AOD) as input. MAB is the mean absolute bias. SD is the standard deviation. RMSE is the root-mean-square error.
3.1 Site validation
Based on the independent SunDu validation sites, both the GWR and OLS methods explain 97 %–86 % of Rs variability (Fig. 4). The GWR method generally shows an improved performance compared with the OLS method due to the representativeness of the spatial heterogeneity relationship between Rs and its impact factors in GWR. Both the GWR and OLS methods produce better simulations of Rs if satellite and AOD data are incorporated.
Direct observations from 2000 to 2016 are also used to further evaluate the performance of the fusion methods (Fig. 4). The comparative result shows that both fusion methods show slightly reduced performances when using direct Rs observations rather than the SunDu-derived Rs. Both the GWR and OLS methods explain 91 %–82 % of Rs variability by using direct observations as reference data. Similarly, the GWR method exhibits better performances than the OLS-based fusion method, with an R2 of 0.91 and root-mean-square error (RMSE) ranging from 19.89 to 19.97 W m−2 at the monthly timescale (Table 4).
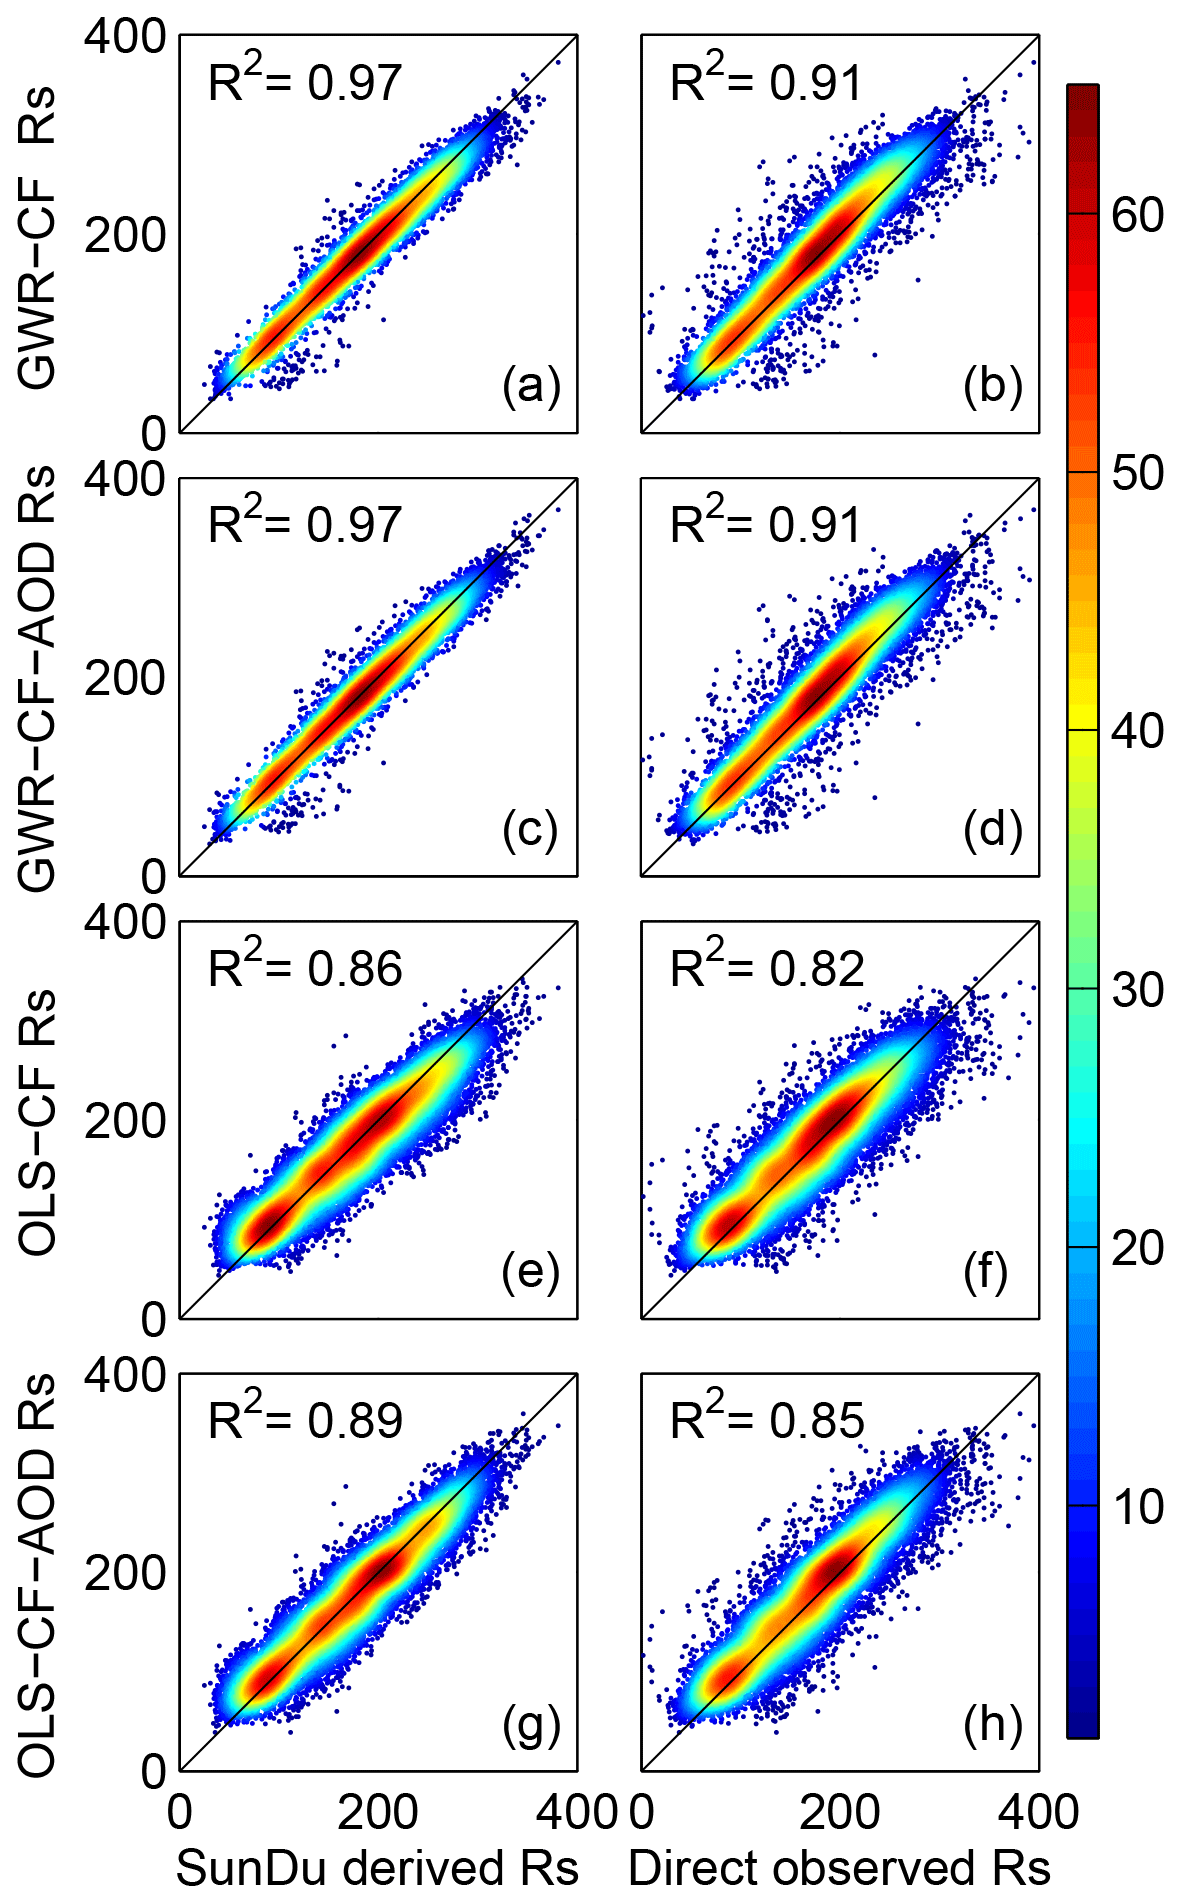
Figure 4Comparison of surface solar radiation (Rs) derived from the GWR method and the OLS method. Panels (a), (c), (e), and (g) represent validation results using SunDu-derived Rs data as a reference. Panels (b), (d), (f), and (h) show directly observed Rs data. Panels (a)–(d) denote the GWR validation results, and panels (e)–(h) denote the OLS validation results.
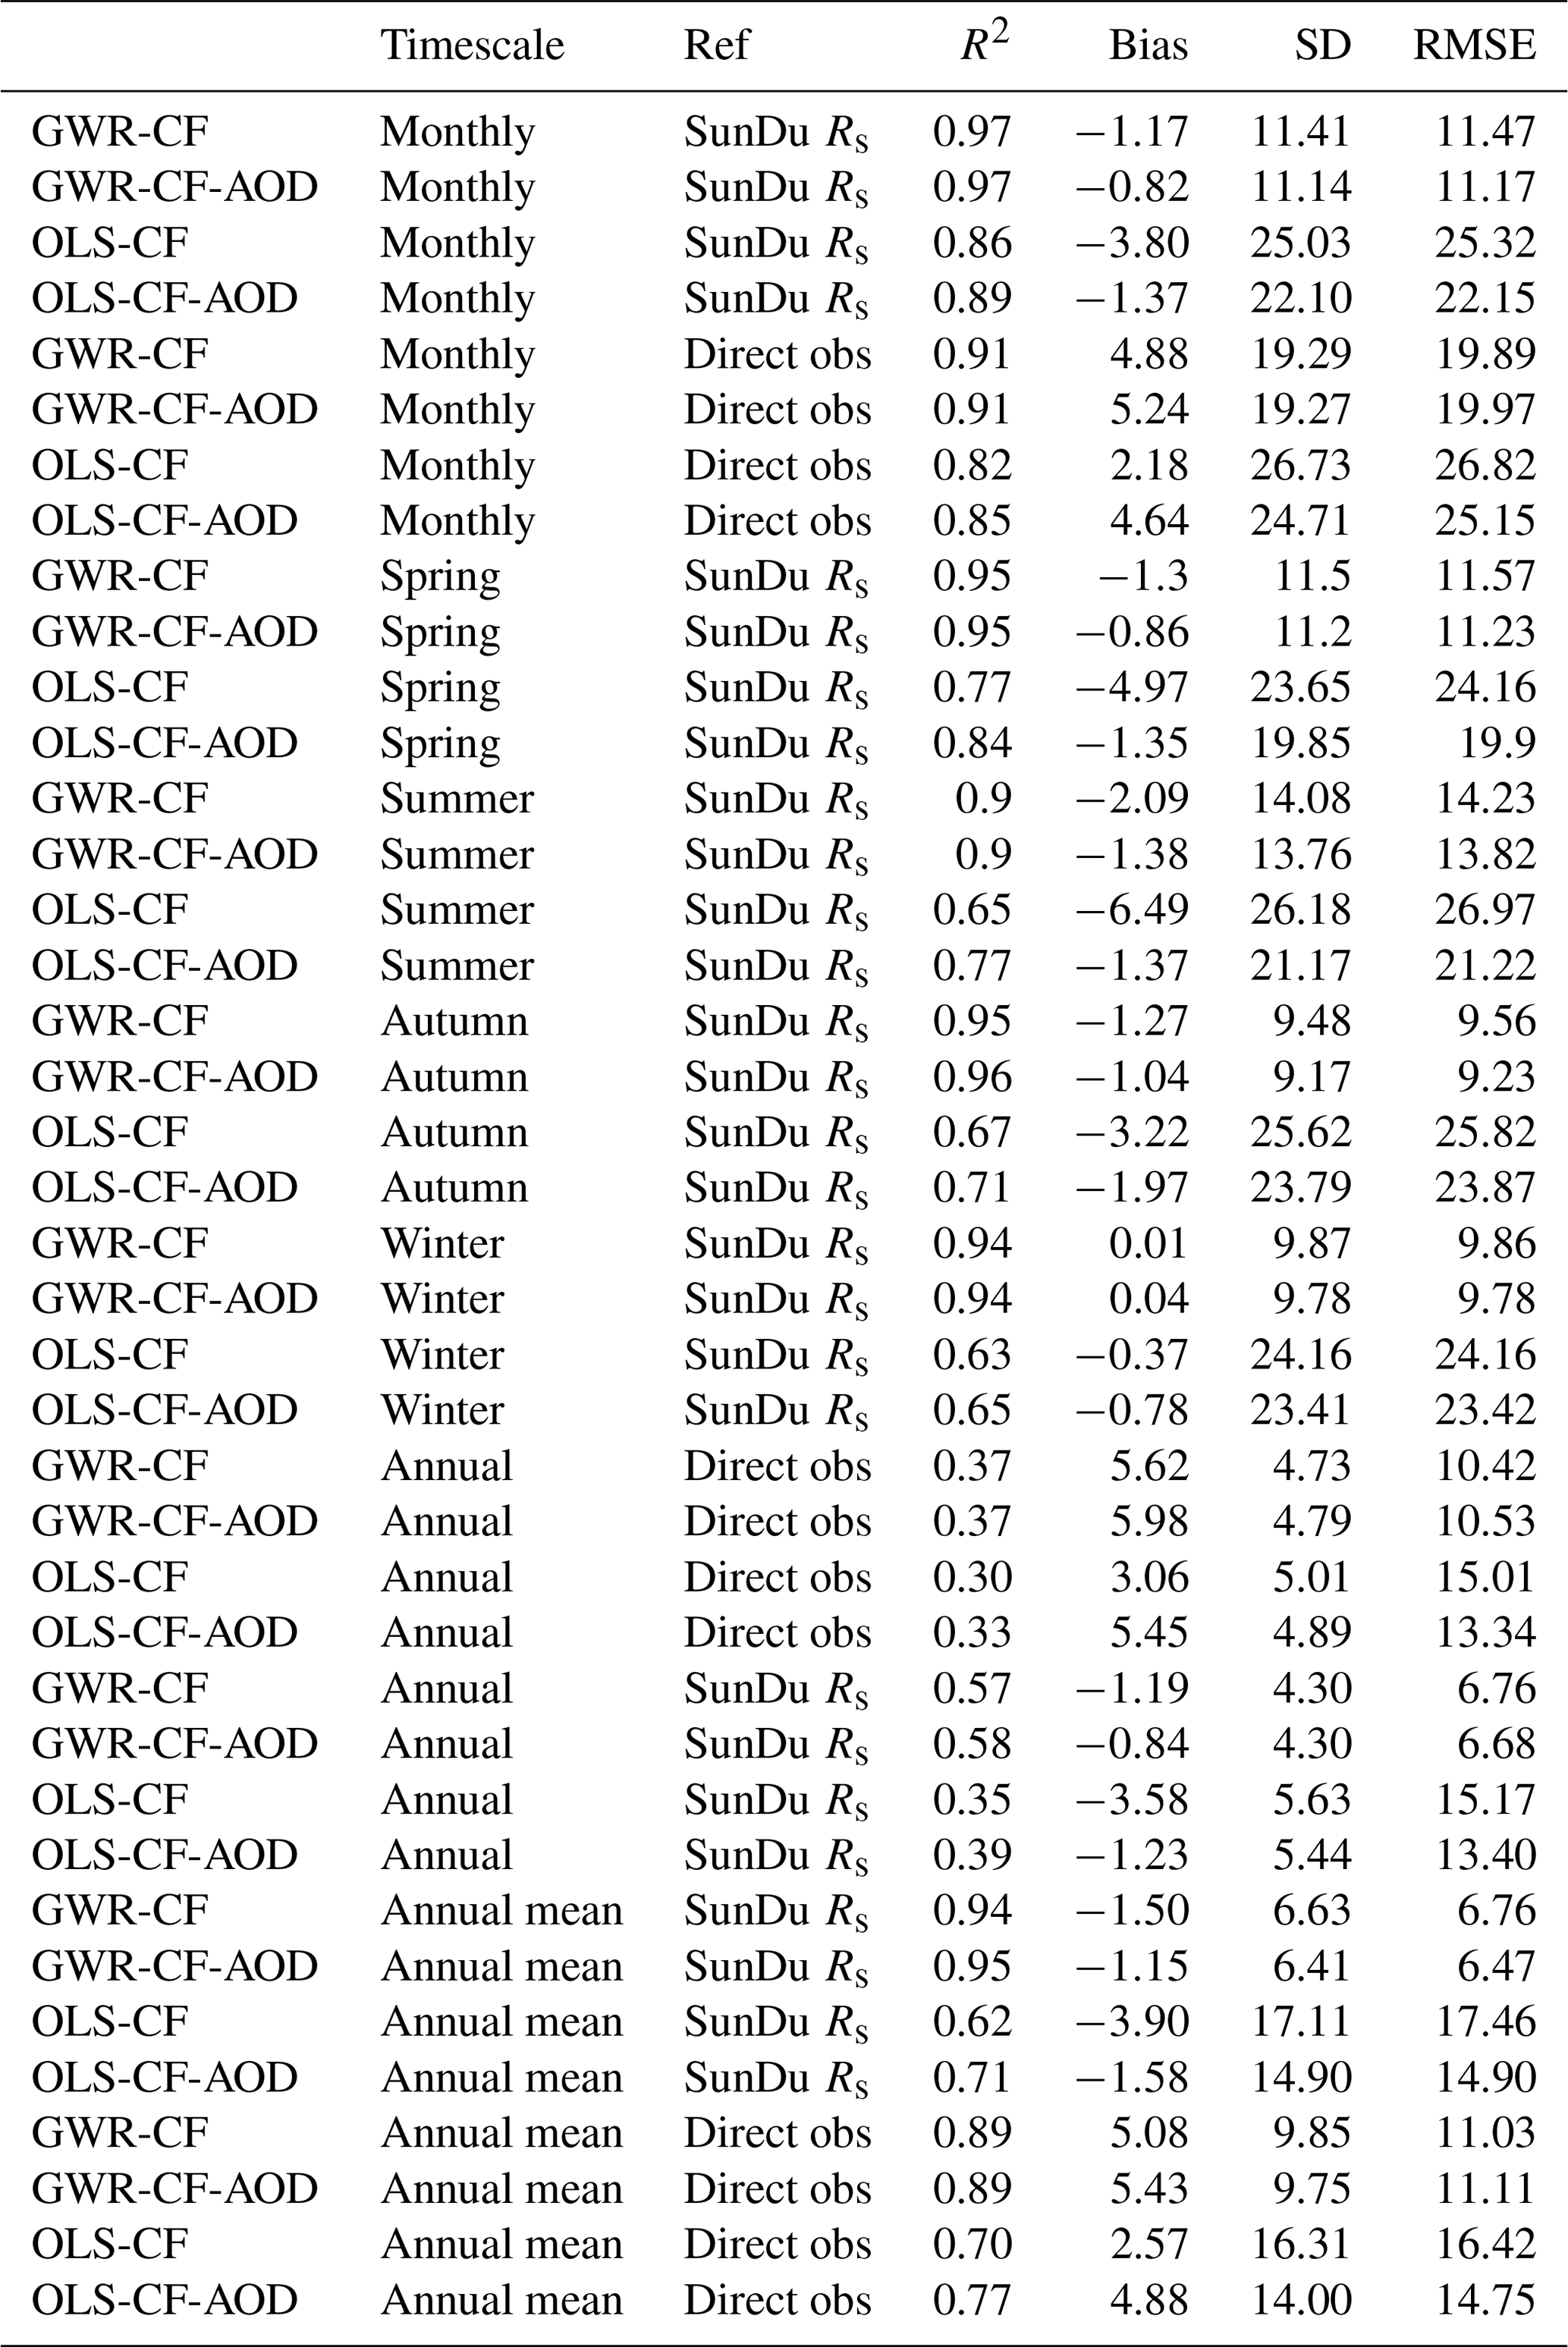
Table 4Validation of fusion methods driven by cloud fraction (CF) and AOD. GWR-CF and OLS-CF represent the GWR fusion method and OLS fusion method driven only by CF. GWR-CF-AOD and OLS-CF-AOD represent GWR and OLS fusion methods driven by CF and AOD, respectively.
3.2 Seasonal and annual variations in Rs
To analyse the impacts of AOD on the GWR fusion results, the GWR driven with only CF (GWR-CF) and GWR driven with CF and AOD (GWR-CF-AOD) are compared. Two validation sites (Changchun, 43.87∘ N, 125.33∘ E and Beihai, 21.72∘ N, 109.08∘ E) are randomly selected to evaluate the seasonal and annual variations in Rs derived from the GWR method (Fig. 5). The multiyear mean of AOD from Changchun and Beihai is 0.49 and 0.70, respectively. As shown in panels (a) and (b), both GWR-CF and GWR-CF-AOD produce similar seasonal variation patterns compared with SunDu-derived Rs and CERES EBAF Rs data. Small differences are found in the seasonal variation in Rs derived from GWR regardless of whether AOD was incorporated. Examination of the annual variation in Rs from the GWR-CF and GWR-CF-AOD is shown in panels (c) and (d) of Fig. 5. The two fusion methods also produce similar annual Rs variations. The similar performances of the GWR-CF and GWR-CF-AOD might suggest that the impacts of AOD have already been included in the SunDu-derived Rs site data.
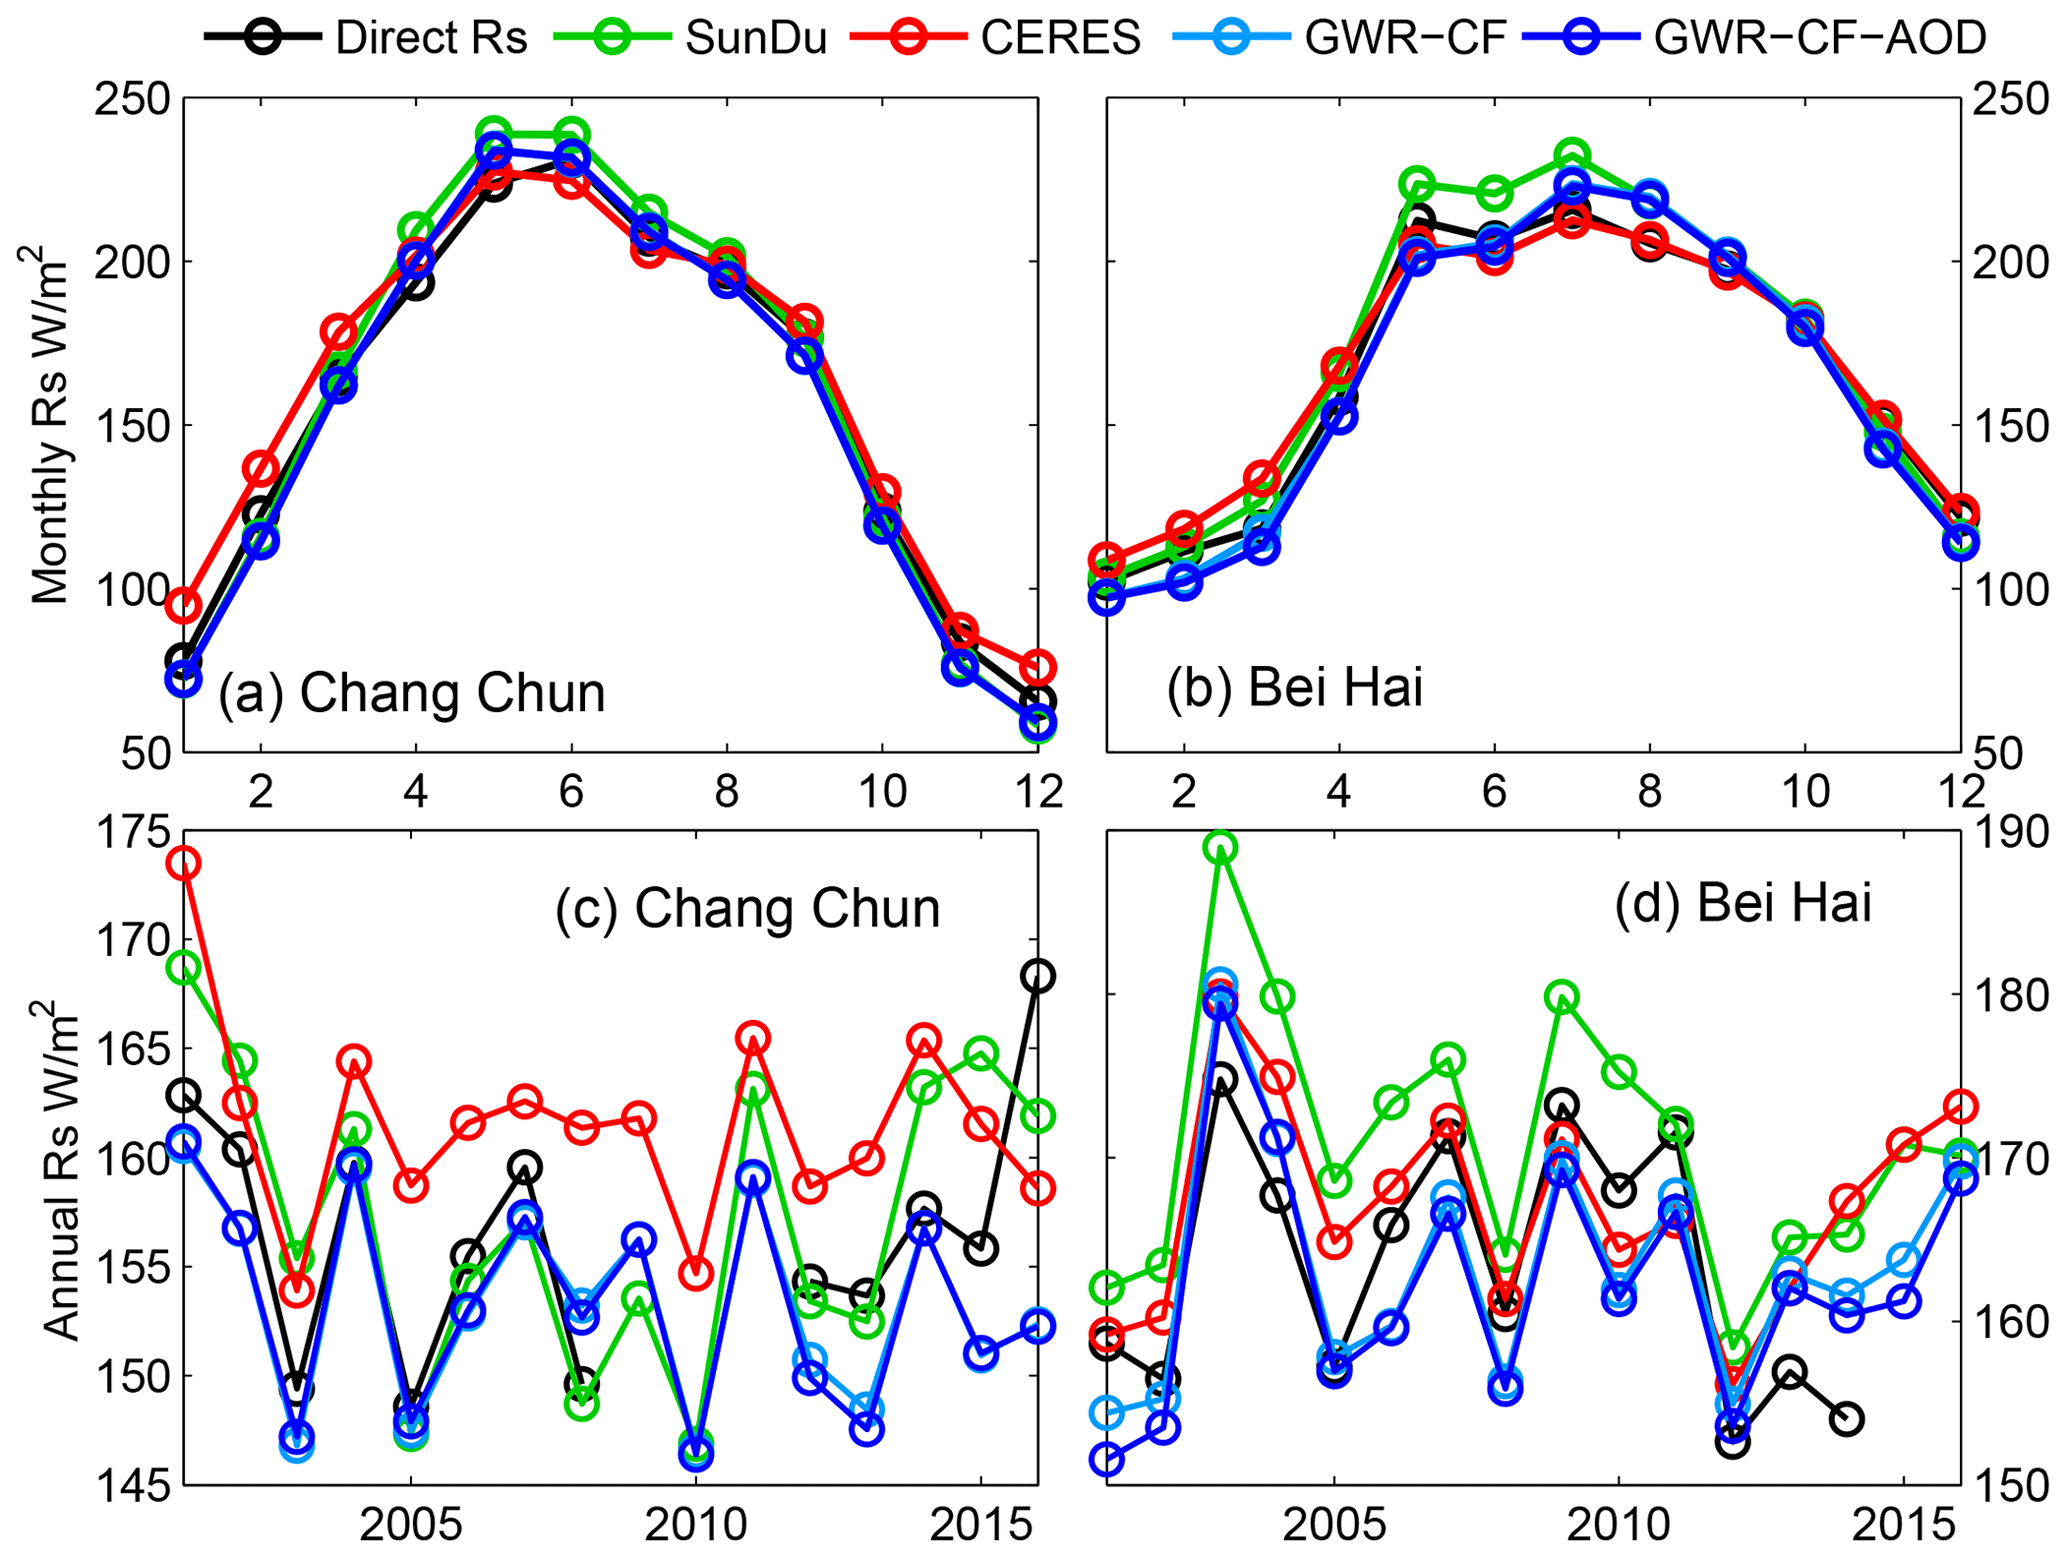
Figure 5Seasonal and annual variations in Rs at two sites: Changchun (a, c, 43.87∘ N, 125.33∘ E) and Beihai (b, d, 23.50∘ N, 99.72∘ E). SunDu Rs is the SunDu-derived Rs data, and GWR-CF Rs is Rs produced by the GWR method incorporating only the cloud fraction. GWR-CF-AOD is Rs produced by the GWR method incorporating cloud fraction and AOD. The multiyear mean of AOD from Changchun and Beihai is 0.49 and 0.70, respectively.
We also analyse the performances of fusion methods for different seasons at all validation sites, as shown in Table 4. At seasonal scales, both the GWR-CF and GWR-CF-AOD methods have high R2 values ranging from 0.94 to 0.96, compared with direct Rs measurement or SunDu-derived Rs. GWR-CF and GWR-CF-AOD show slight differences, indicating that both fusion methods produce consistent Rs seasonal variation patterns, which might be because the impacts of AOD have already been included in the SunDu-derived Rs site data at seasonal timescales. Comparatively, the GWR methods perform best in autumn, with RMSEs ranging from 9.23 to 9.56 W m−2 followed by winter, spring, and summer. Both the GWR-CF and GWR-CF-AOD methods produce similar annual variations in Rs from 2000 to 2016, with R2 values ranging from 0.57 to 0.58 (Table 4). The statistics indicate that the GWR can produce reasonable seasonal and annual variations in Rs.
3.3 Multiyear mean and long-term variability in Rs
Figure 6 shows the performance of GWR-CF and GWR-CF-AOD in simulating the multiyear mean Rs by using 97 direct Rs observation sites and independent SunDu-derived Rs sites. Based on direct Rs measurements, both GWR-based methods show good performances with high R2 (0.89–0.95) and low RMSE (11.03–11.11 W m−2), and few differences are found for the GWR merging results, whether or not AOD is taken as input data (Table 4).
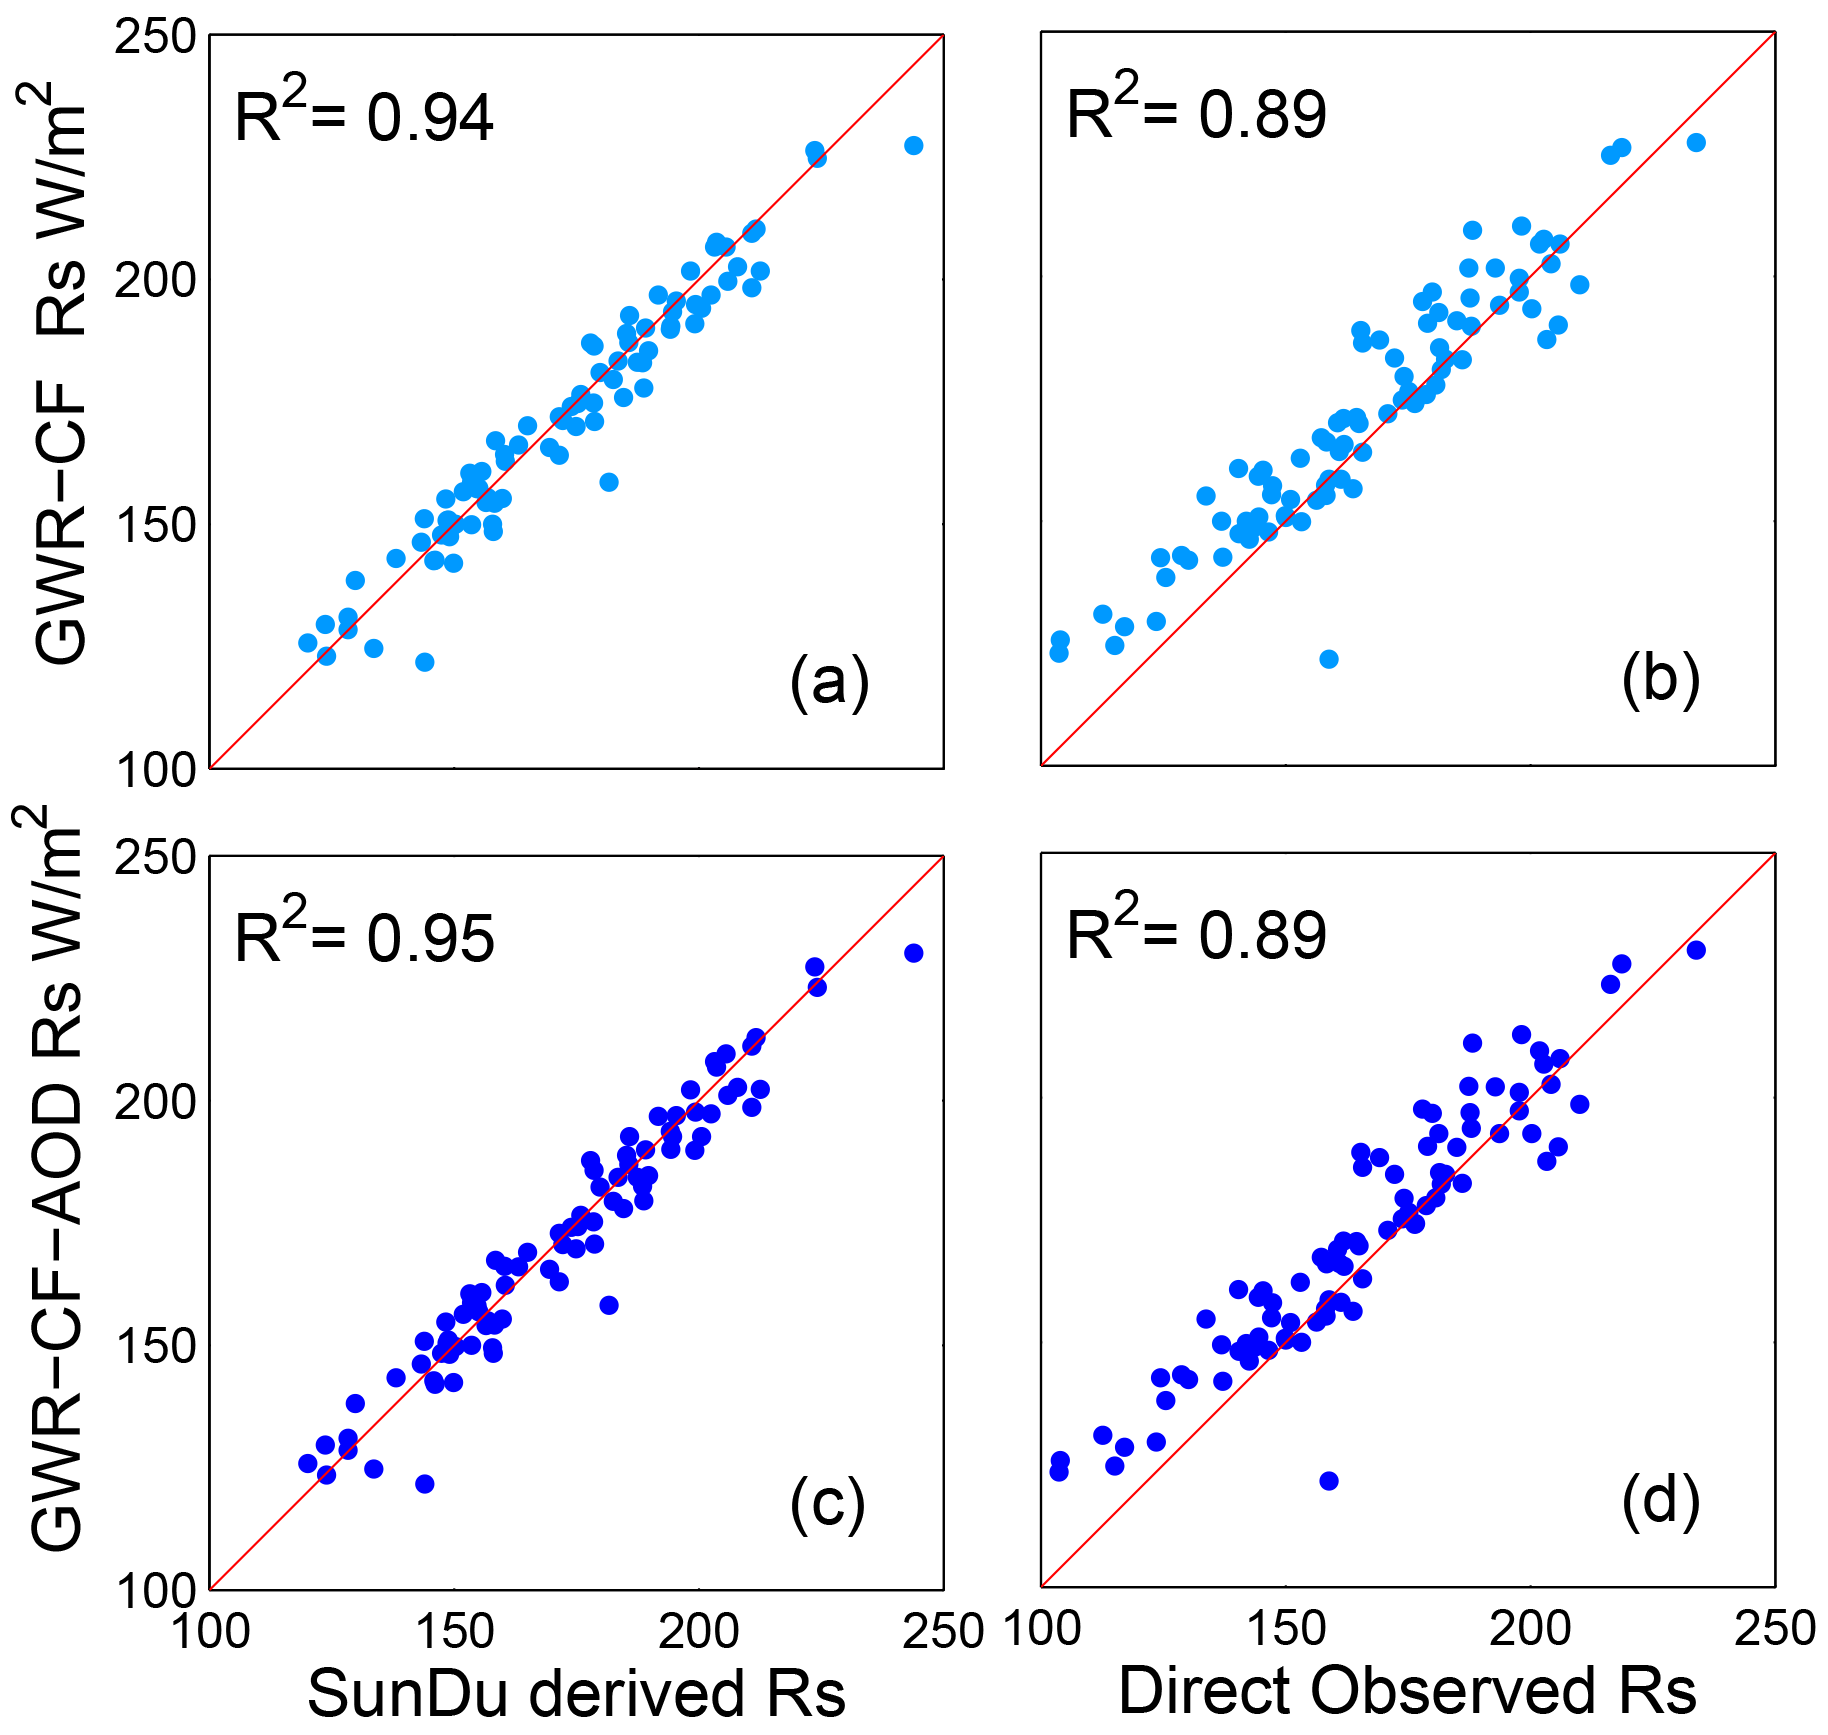
Figure 6Comparison of multiyear mean surface solar radiation (Rs) derived from the GWR method. Panels (a) and (c) represent validation results using SunDu-derived Rs data as a reference, while that of panels (b) and (d) uses directly observed Rs data.
The spatial distributions of the multiyear means of Rs from 2000 to 2017 are shown in Fig. 7. The SunDu sites show that Rs is high in northwest China, ranging from 180 to 300 W m−2, and low in eastern China, ranging from 120 to 180 W m−2. Both the GWR-CF and GWR-CF-AOD methods show consistent Rs spatial patterns with SunDu-derived Rs observations and CERES EBAFs, indicating that the relationship between Rs and impact factors is not linearly stable and is closely related to spatial position. The spatial distribution of the Rs trend derived from the GWR method is also consistent with the SunDu-derived Rs trend, especially in western China (Fig. 8). In order to prove that SunDu-derived Rs can add value to the 0.1∘ product, instead of cloud fraction data alone, we perform a similar GWR analysis but using CERES EBAF interpolated to 0.1∘ and 0.1∘ cloud, and we compare the results with those using SunDu-derived Rs and 0.1∘ cloud (Fig. 9). The results indicate that SunDu-derived Rs can add value to the 0.1∘ product and the merged Rs by using interpolated CERES EBAF, and 0.1∘ cloud products are also similar to the original CERES EBAF but not the 0.1∘ cloud product.
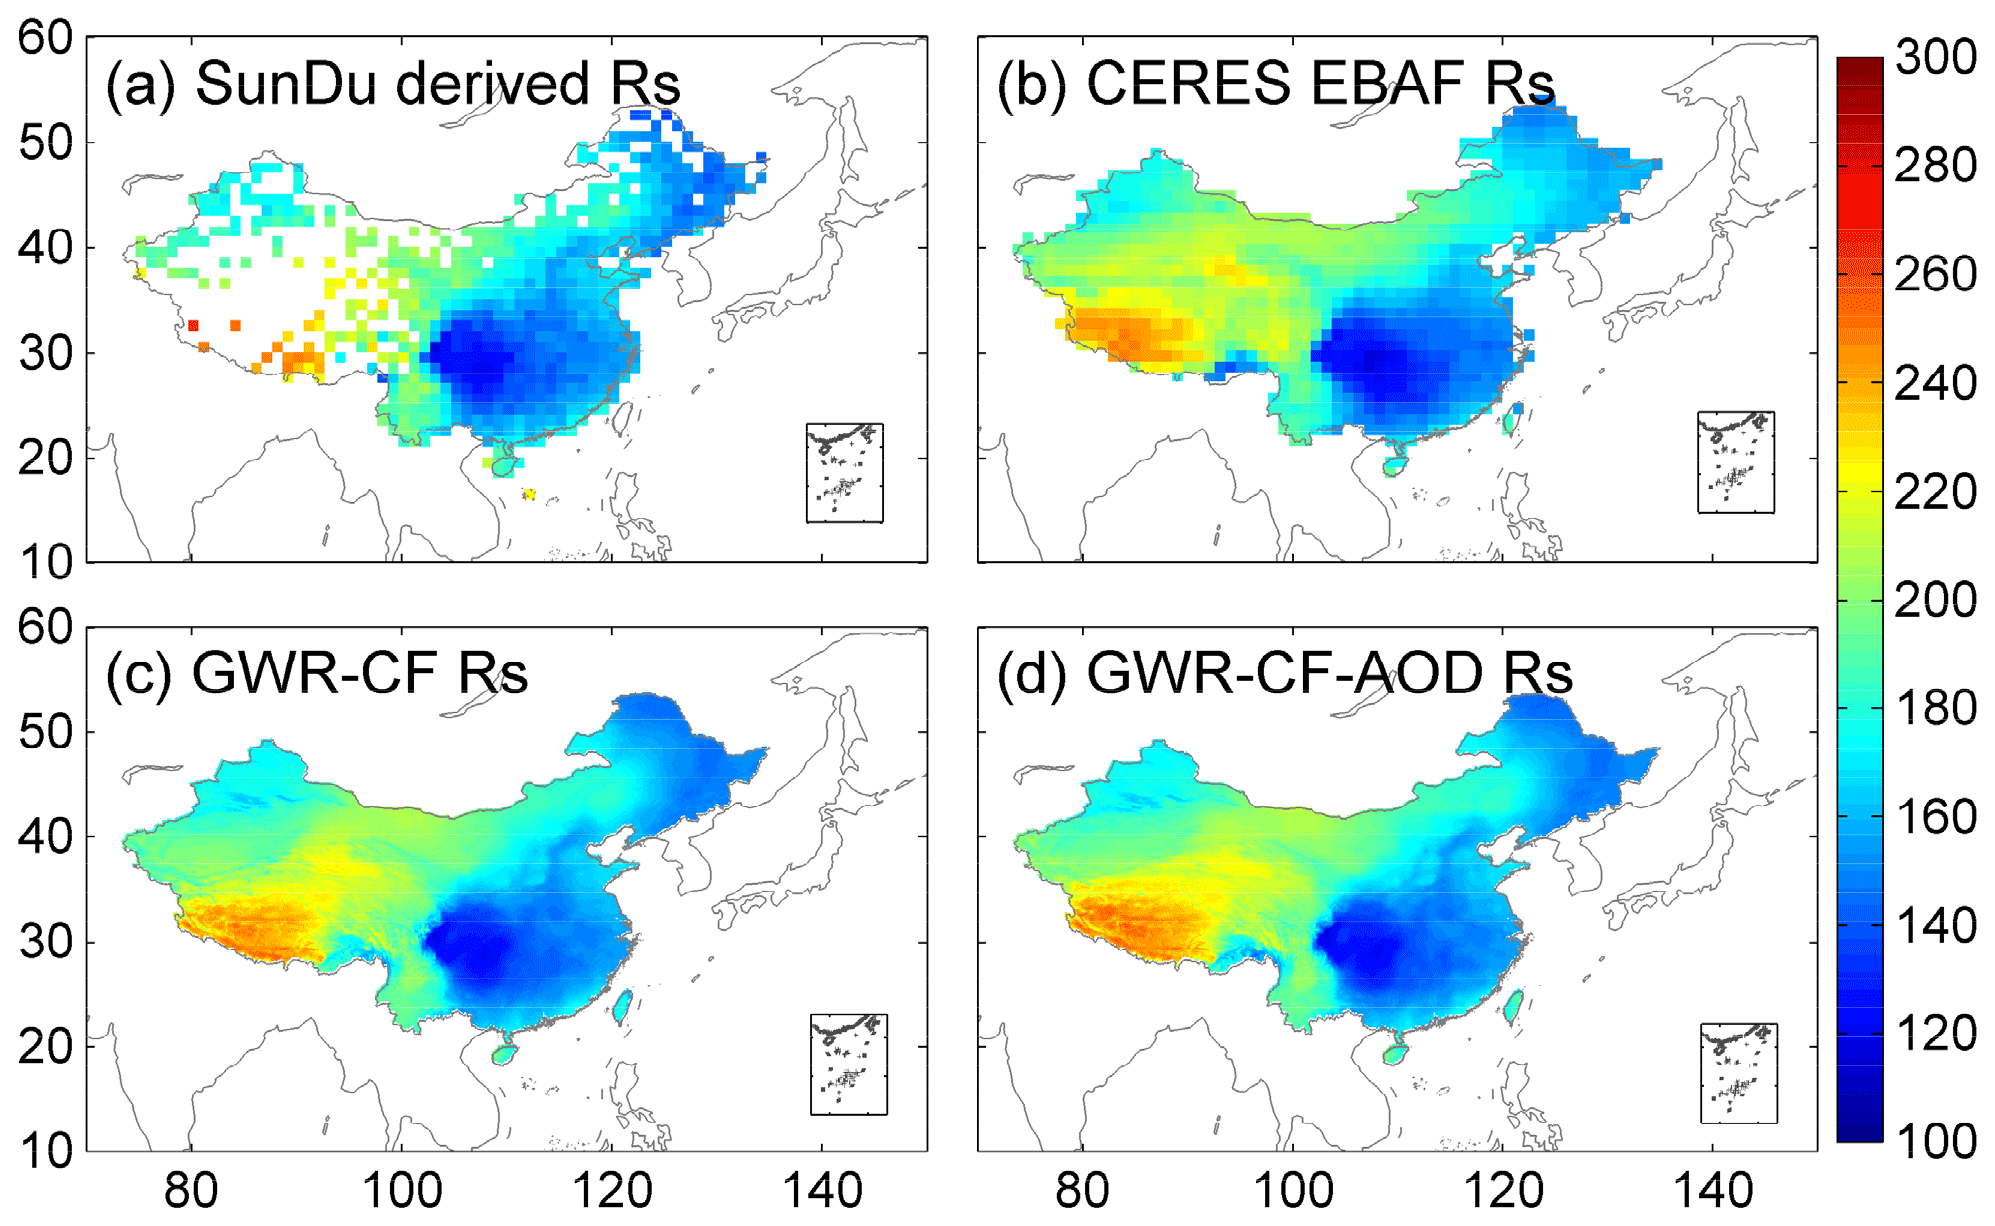
Figure 7Spatial distribution of multiyear mean monthly surface solar radiation (Rs) from 2000 to 2017. The first line (a, b) shows the observed multiyear mean monthly Rs from SunDu and CERES EBAF; the multiyear mean monthly Rs derived from the GWR method is shown in the second line (c, d), respectively.
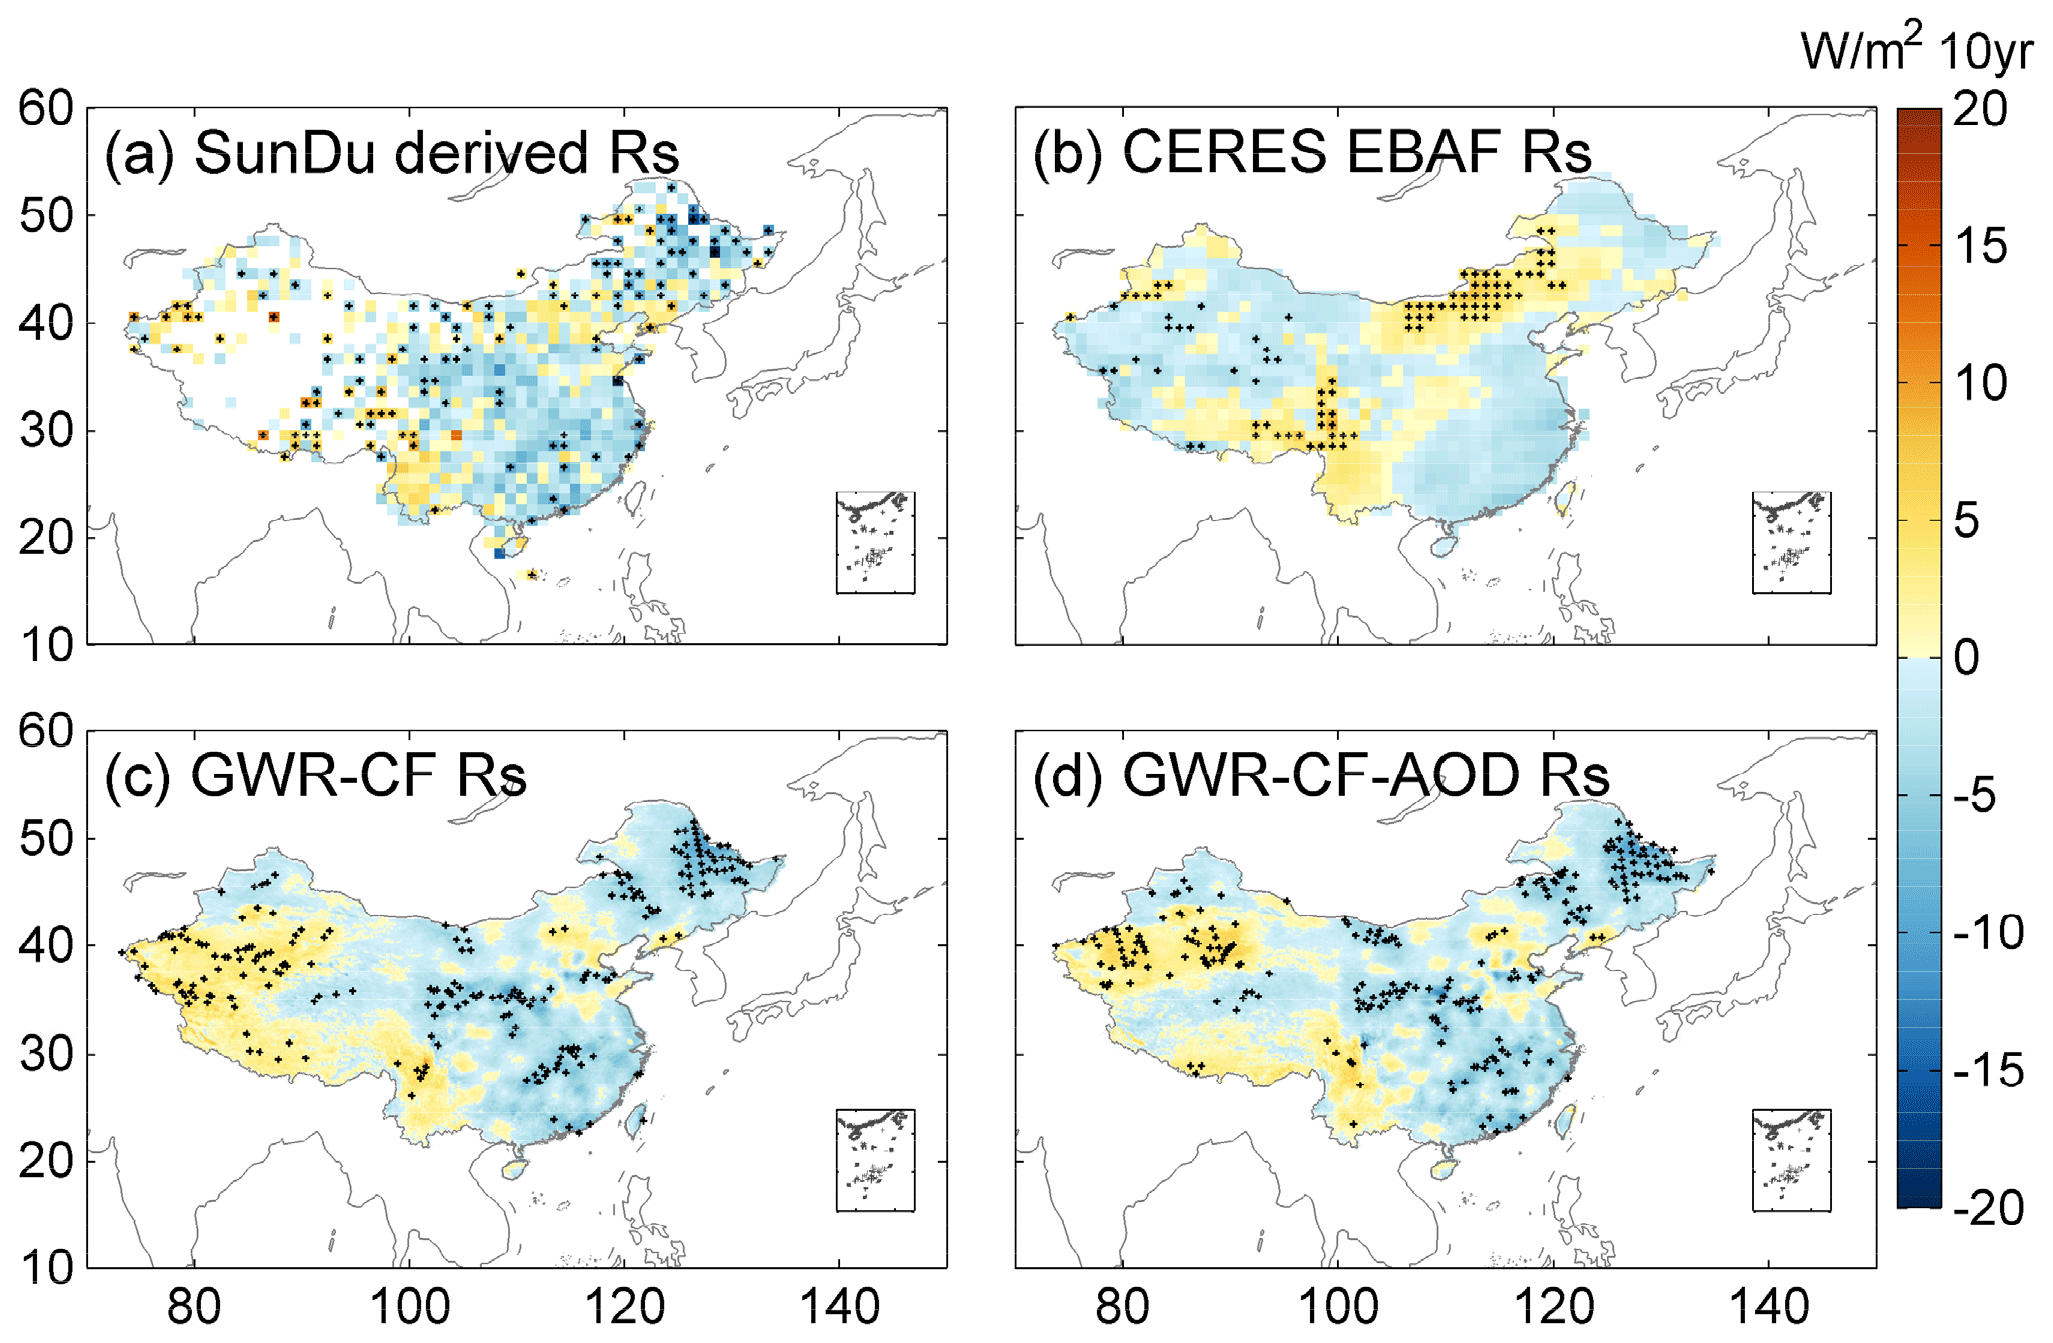
Figure 8Spatial distributions of monthly anomaly trends of surface solar radiation (Rs) from 2000 to 2017. The first line (a, b) shows the SunDu-derived Rs and CERES EBAF Rs; the Rs-derived GWR fusion methods are shown in the second line (c, d). Panel (c) incorporates only CF, and panel (d) incorporates CF and AOD. The black dots on the maps represent significant trends (P<0.05).
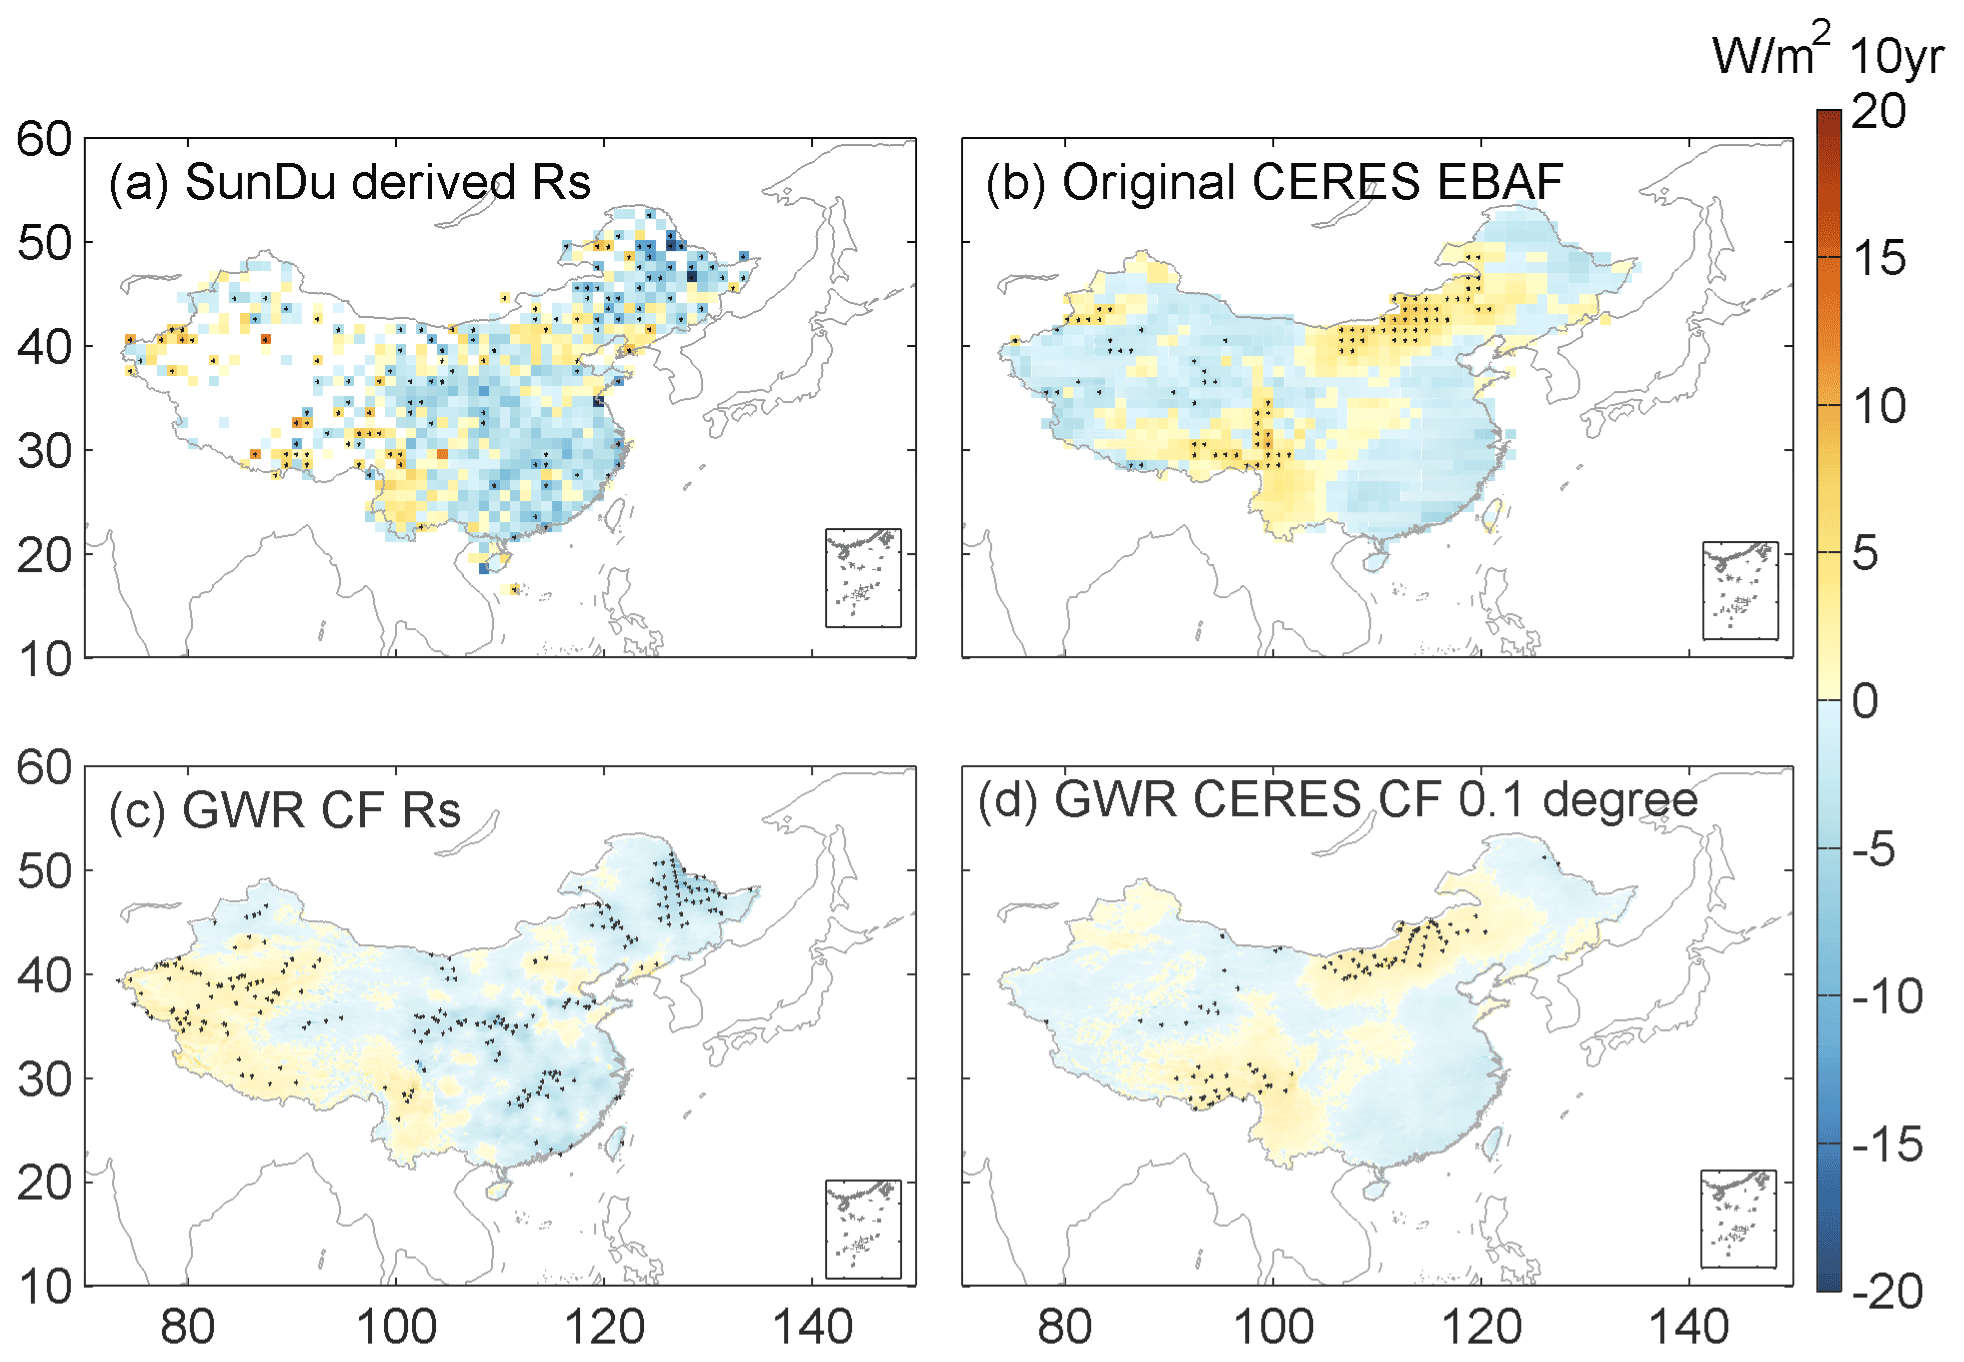
Figure 9Spatial distributions of monthly anomaly trends of surface solar radiation (Rs) from 2000 to 2017. The first line (a, b) shows the SunDu-derived Rs and CERES EBAF Rs; the Rs-derived GWR fusion methods are shown in the second line (c, d). (c) SunDu-derived Rs incorporates only CF, and (d) is the results of GWR analysis using CERES data interpolated to 0.1∘ and 0.1∘ cloud. The black dots on the maps represent significant trends (P<0.05).
Based on the classified subregions using 97 direct Rs observations in Fig. 1, the regional means of Rs annual anomaly variation from 2000 to 2016 are shown in Fig. 10. Compared with observations, both the GWR-CF and GWR-CF-AOD methods produce consistent long-term Rs trends with SunDu-derived Rs and CERES EBAF Rs (Figs. 2, 3, and 10), indicating that the GWR-CF and GWR-CF-AOD methods can produce reasonable annual Rs variations over China.
In zones I and II, located in northern arid and semiarid regions, the annual anomaly Rs variation shows small fluctuations ranging from −10 to 10 W m−2. In contrast, zones IV, V, VIII, and IX covering the Sichuan Basin, Yunnan–Guizhu Plateau, Qinghai–Tibet Plateau, and North China Plain show large Rs variation trends. Li et al. (2018) found a sharply increasing Rs trend over east China, especially in the North China Plain, which is due to controlling air pollution and reducing aerosol loading. However, our results indicate that the increased surface solar radiation in north China is not confirmed by satellite retrieval (CERES) and SunDu-derived Rs.
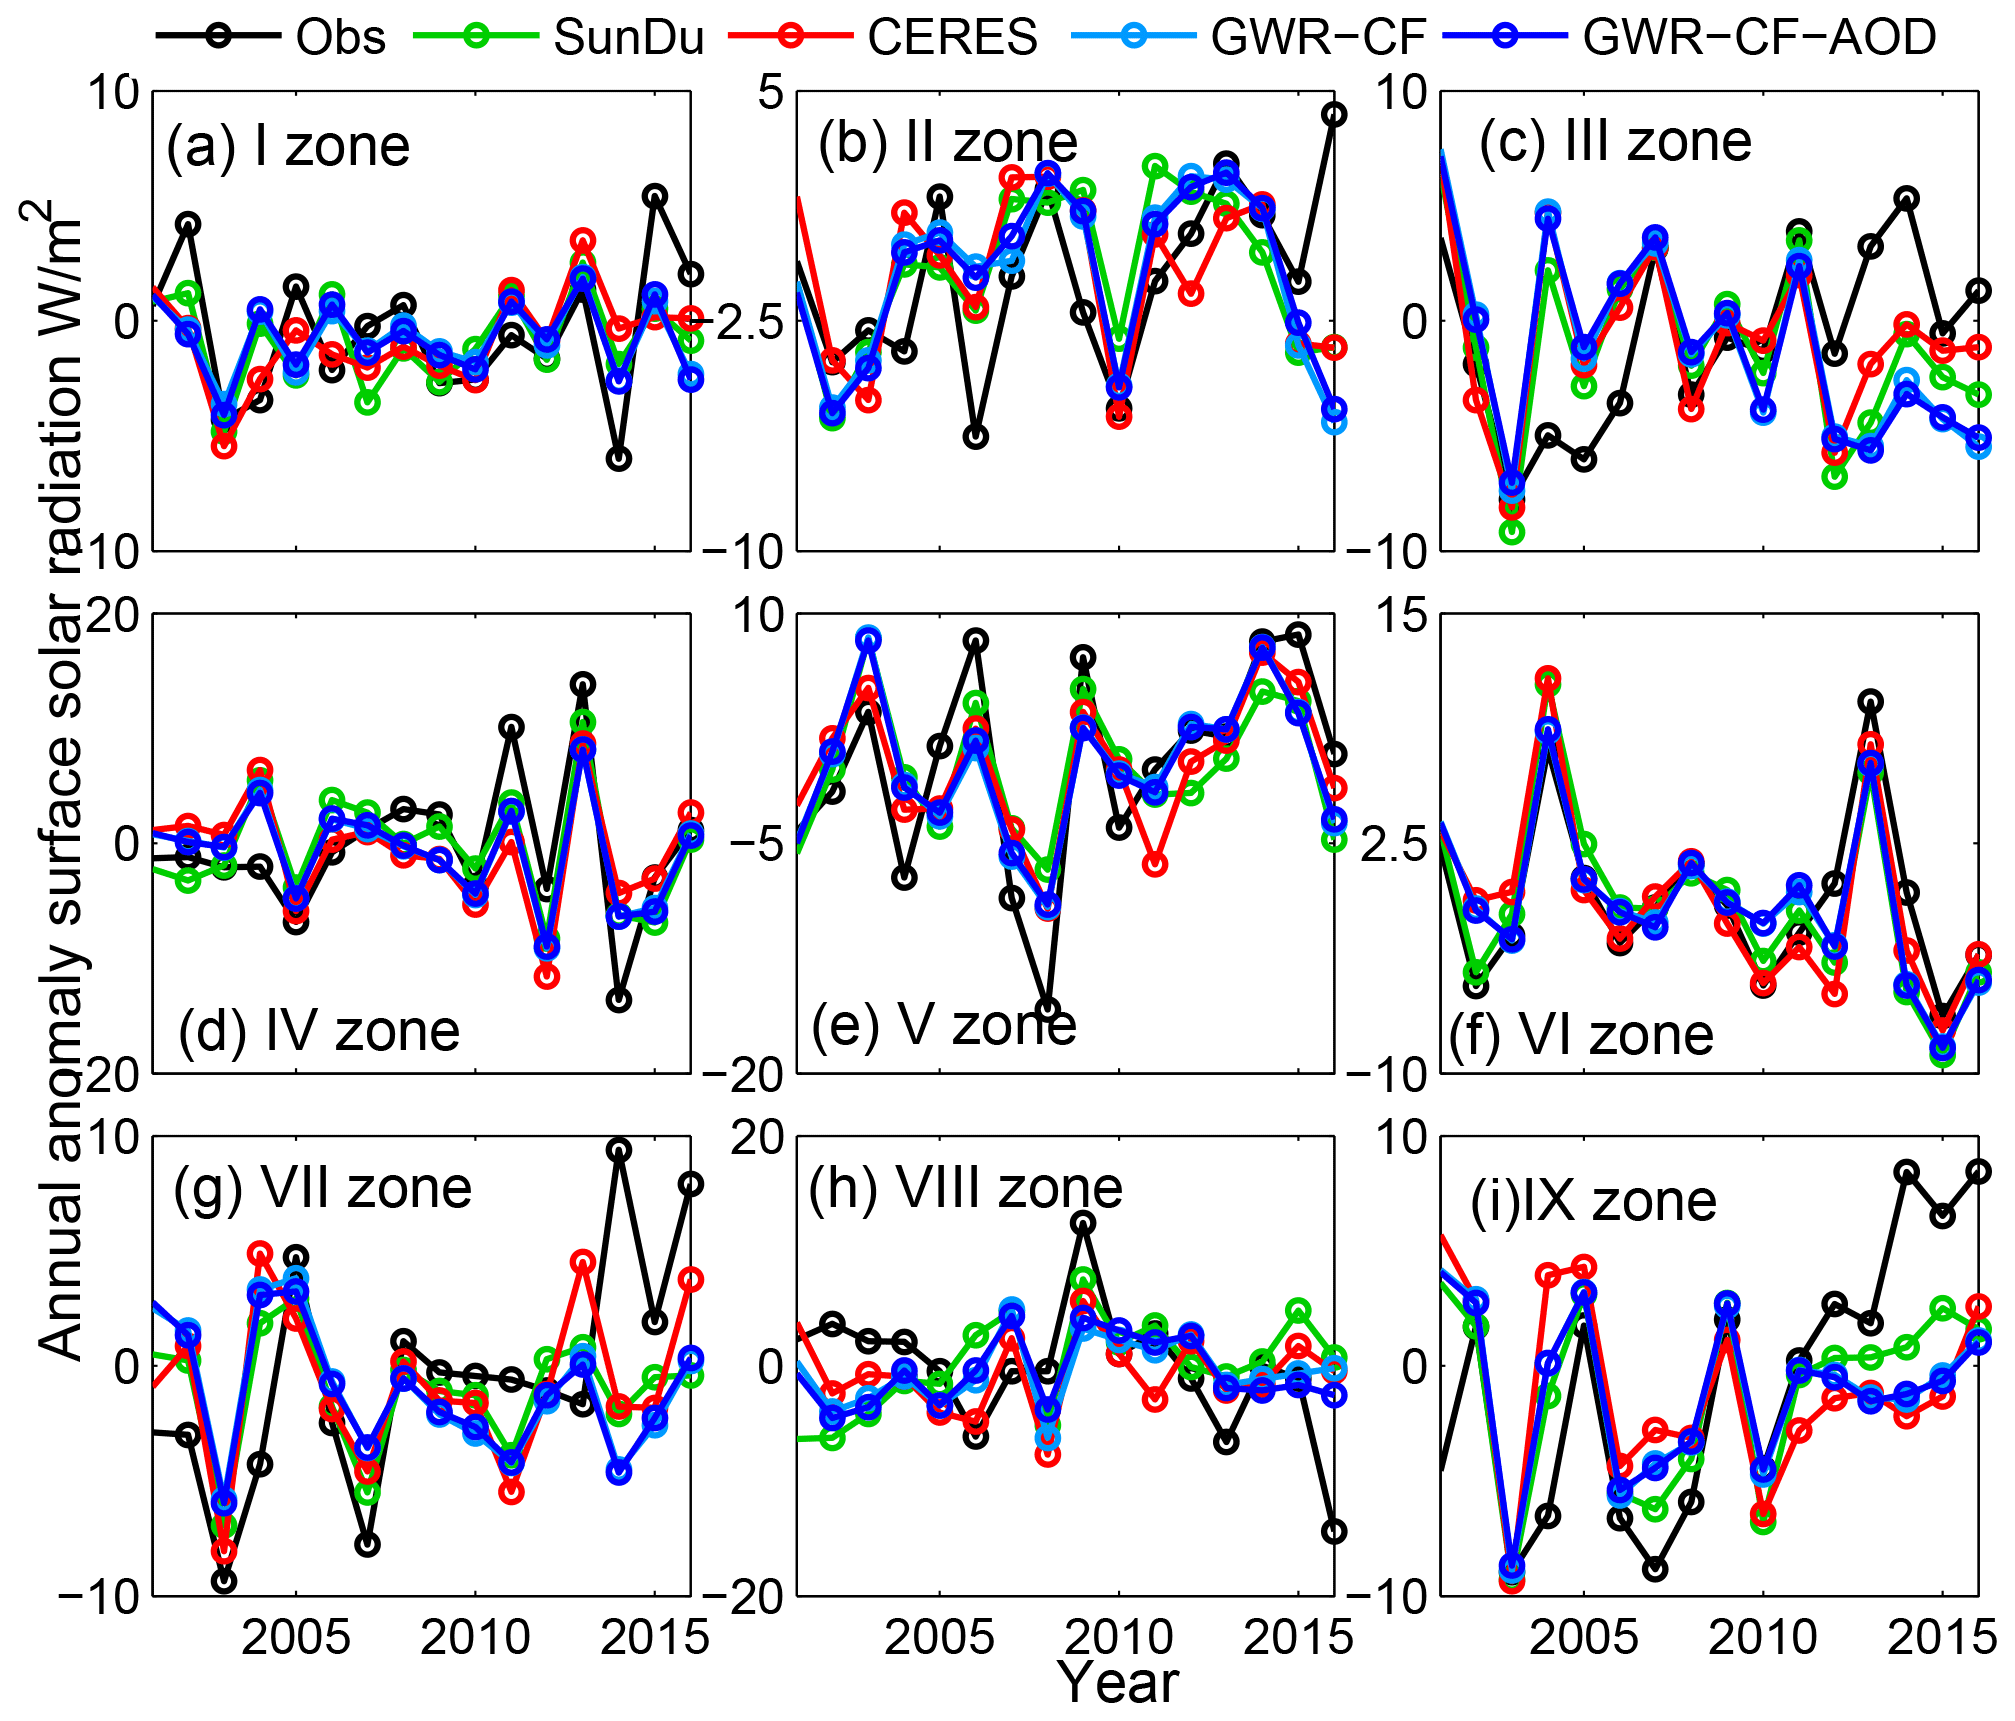
Figure 10The regional mean of the annual anomaly of the surface solar radiation (Rs) for different subregions. Nine subregions (I to IX) over China are shown in Fig. 1. Direct Rs observations, SunDu-derived Rs, and CERES EBAF are shown as black lines, green lines, and red lines, respectively. Light and dark blue represent the Rs variation derived from the GWR-CF and the GWR-CF-AOD methods.
4.1 Impact factors of Rs
In this study, we merged more than 2400 sunshine-duration-derived Rs site data with MODIS CF and AOD data to generate high-spatial-resolution (0.1∘) Rs over China from 2000 to 2017. The results show that the GWR method incorporated with CF and AOD (GWR-CF-AOD) performs best, indicating the non-neglected role of clouds and aerosols in regulating the variation in Rs over China.
Clouds and aerosols impact the solar radiation reaching the surface by radiative absorption and scattering (Tang et al., 2017). Recent Rs trend studies over Europe suggest that CF may play a key role in the positive trend of Rs since the 1990s (Pfeifroth et al., 2018a). In terms of input data, our results also indicate that the cloud fraction might be a major factor affecting Rs, which is consistent with our previous studies (Feng and Wang, 2019).
Changes in aerosol loading have also been reported to be an important impact factor (Che et al., 2005; Li et al., 2018; Liang and Xia, 2005; Qian et al., 2015; Xia, 2010; Z. Zhou et al., 2019). The atmospheric visibility data show that the slope of the linear variation in surface solar radiation with respect to atmospheric visibility is distinctly different at different stations (Yang et al., 2017), implying that the relationship between Rs and aerosols varies with location.
4.2 Performances of the fusion methods
The good overall performances of the GWR model have been reported in many previous studies, including geography (Chao et al., 2018; Georganos et al., 2017), economics (Ma and Gopal, 2018), meteorology (Li and Meng, 2017; Q. Zhou et al., 2019), and epidemiology (Tsai and Teng, 2016). Chao et al. (2018) used the GWR method to merge satellite precipitation and gauge observations to correct biases in satellite precipitation data and downscale satellite precipitation to a finer spatial resolution at the same time. Q. Zhou et al. (2019) used GWR to analyse haze pollution over China and found that the GWR estimate was better than the OLS estimate, with an improvement in correlation coefficient from 0.20 to 0.75.
Compared with other traditional interpolation methods, such as optimal interpolation (OI), GWR can theoretically integrate geographical location and Rs impact factors for spatial Rs estimations and reflect the non-stationary spatial relationship between Rs and its impact factors. The thin plate spline method can include CF and AOD as covariates to simulate the approximately linear dependence of these impact factors on Rs, but this linear function cannot fully describe the relationship among CF, AOD, and Rs (Hong et al., 2005).
Comparison results from (Wang et al., 2017) also indicate that the GWR method is better than the multiple linear regression method and spline interpolation method for near-surface air temperature. By using the spatial interpolation method, CERES EBAF Rs can also be downscaled to 1 km or 30 m. These interpolated CERES Rs data cannot represent the detailed Rs distributions at spatial resolution of 1 km or 30 m due to the variability of Rs within a 1∘ box. Without additional high-spatial-resolution data, interpolated data cannot capture more detail variability of Rs.
The software code used for this article can be accessed at https://doi.org/10.5281/zenodo.4584571 (forgetbear, 2021).
The merged Rs product by GWR methods with cloud fraction and AOD data as input in this study is available at https://doi.org/10.1594/PANGAEA.921847 (Feng and Wang, 2020). The cloud data can be downloaded from https://neo.sci.gsfc.nasa.gov/view.php?datasetId=MODAL2_M_CLD_FR (last access: 3 March 2021; NASA Earth Observations, 2021). The CERES SYN data can be downloaded from https://ceres.larc.nasa.gov/data/ (last access: 3 March 2021; CERES Science Team, 2021).
Accurate estimation of Rs variability is crucially important for regional energy budget, water cycle, and climate change studies. Recent studies have shown that SunDu-derived Rs data can provide reliable long-term Rs series. In this study, we merged SunDu-derived Rs data with satellite-derived cloud fraction (CF) and aerosol optical depth (AOD) data to generate high spatial resolution (0.1∘) Rs over China from 2000 to 2017 (Feng and Wang, 2020). The GWR and OLS merging methods were also compared.
Our results show that the spatial resolutions of all fusion results are improved to 0.1∘ by incorporating MODIS cloud fraction data. The GWR shows better performance than OLS, with increases in R2 by 9.21 %–12.81 % and RMSEs reduced by 49.56 %–54.68 %, indicating that Rs has complex characteristics of spatial variability over China, which has also indicated the necessity of the high spatial resolution of Rs data. As clouds and aerosols play vital roles in the variability in Rs, apparent improvements in the results of SunDu-derived Rs data-merging are found if both cloud fraction and AOD are incorporated. Based on the merging results incorporating only cloud fraction, cloud fraction is suggested to be the major factor impacting Rs, which explained approximately 86 %–97 % of Rs variability. Generally, SunDu-derived Rs data merging results derived from GWR show more consistent multiyear mean Rs and long-term Rs trends compared with those from OLS. Our results show that the improvement in Rs variability estimation is closely related to Rs impact factors and Rs spatial heterogeneity. The merged Rs products derived from GWR-CF-AOD can be downloaded at https://doi.org/10.1594/PANGAEA.921847.
All of the authors collected data, designed the study, analysed the data, and prepared the manuscript. All of the authors contributed to the main research ideas and manuscript organization. All of the authors edited this paper and agreed to the published version of the manuscript.
The authors declare that they have no conflict of interest.
We would like to thank Chengyang Xu, Yuna Mao, Jizeng Du, Runze Li, Qian Ma, Guocan Wu, and Chunlue Zhou for their insightful comments. We are grateful to Amelie Driemel for her help in uploading the data in PANGAEA.
This study was funded by the National Key Research & Development Program of China (grant no. 2017YFA06036001), the National Natural Science Foundation of China (grant no. 41525018), the Fundamental Research Funds for the Central Universities (grant no. BLX201907), and the State Key Laboratory of Earth Surface Processes and Resource Ecology (grant no. U2020-KF-02).
This paper was edited by David Carlson and reviewed by two anonymous referees.
Ali, K., Partridge, M. D., and Olfert, M. R.: Can Geographically Weighted Regressions Improve Regional Analysis and Policy Making?, Int. Reg. Sci. Rev., 30, 300–329, 2007.
Brunsdon, C., Fotheringham, A. S., and Charlton, M. E.: Geographically Weighted Regression : A Method for Exploring Spatial Nonstationarity, Geogr. Anal., 28, 281–298, 2010.
Brunsdon, C., Fotheringham, S., and Charlton, M.: Geographically Weighted Regression, J. Roy. Statist. Soc. D, 47, 281–298, 1998.
Camargo, L. R. and Dorner, W.: Integrating satellite imagery derived data and GIS-based solar radiation algorithms to map solar radiation in high temporal and spatial resolutions for the province of Salta, Argentina, Proc. SPIE 10005, Earth Resources and Environmental Remote Sensing/GIS Applications VII, 100050E https://doi.org/10.1117/12.2242042, 2016.
CERES Science Team: Dataset of CERES SYN, available at: https://ceres.larc.nasa.gov/data/, last access: 3 March 2021.
Chao, L., Zhang, K., Li, Z., Zhu, Y., Wang, J., and Yu, Z.: Geographically weighted regression based methods for merging satellite and gauge precipitation, J. Hydrol., 558, 275–289, 2018.
Che, H. Z., Shi, G. Y., Zhang, X. Y., Arimoto, R., Zhao, J. Q., Xu, L., Wang, B., and Chen, Z. H.: Analysis of 40 years of solar radiation data from China, 1961–2000, Geophys. Res. Lett., 1029, 2341–2352, 2005.
Collins, W. D., Rasch, P. J., Eaton, B. E., Khattatov, B. V., Lamarque, J. F., and Zender, C. S.: Simulating aerosols using a chemical transport model with assimilation of satellite aerosol retrievals: Methodology for INDOEX, J. Geophys. Res., 106, 7313–7336, 2001.
Cornejo-Bueno, L., Casanova-Mateo, C., Sanz-Justo, J., and Salcedo-Sanz, S.: Machine learning regressors for solar radiation estimation from satellite data, Sol. Energy, 183, 768–775, 2019.
Dai, A., Karl, T. R., Sun, B., and Trenberth, K. E.: Recent Trends in Cloudiness over the United States: A Tale of Monitoring Inadequacies, B. Am. Meteorol. Soc., 87, 597–606, 2006.
Doelling, D. R., Loeb, N. G., Keyes, D. F., Nordeen, M. L., Morstad, D., Nguyen, C., Wielicki, B. A., Young, D. F., and Sun, M.: Geostationary Enhanced Temporal Interpolation for CERES Flux Products, J. Atmos. Ocean Tech., 30, 1072–1090, 2013.
Evan, A. T., Heidinger, A. K., and Vimont, D. J.: Arguments against a physical long-term trend in global ISCCP cloud amounts, Geophys. Res. Lett., 34, 290–303, 2007.
Feng, F. and Wang, K. C.: Merging Satellite Retrievals and Reanalyses to Produce Global Long-Term and Consistent Surface Incident Solar Radiation Datasets, Remote Sens., 10, 602–620, https://doi.org/10.3390/rs13040602, 2018.
Feng, F. and Wang, K. C.: Determining Factors of Monthly to Decadal Variability in Surface Solar Radiation in China: Evidences From Current Reanalyses, J. Geophys. Res.-Atmos., 124, 9161–9182, 2019.
Feng, F. and Wang, K. C.: Monthly surface solar radiation data over China (2000-2017) by merging satellite cloud and aerosol data with ground-based sunshine duration data, PANGAEA, https://doi.org/10.1594/PANGAEA.921847, 2020.
Feng, Y., Chen, D., and Zhao, X.: Estimated long-term variability of direct and diffuse solar radiation in North China during 1959–2016, Theor. Appl. Climatol., 137, 153–163, https://doi.org/10.1016/j.rse.2019.111371, 2019.
forgetbear: forgetbear/essd-2020-231: Code availability (Version essdx2020231-1), Zenodo, https://doi.org/10.5281/zenodo.4584571, 2021.
Fotheringham, A. S., Charlton, M., and Brunsdon, C.: The geography of parameter space: an investigation of spatial non-stationarity, Int. J. Geogr. Inf. Syst., 10, 605–627, 1996.
Gao, X., Asami, Y., and Chung, C.-J. F.: An empirical evaluation of spatial regression models, Comput. Geosci., 32, 1040–1051, 2006.
Georganos, S., Abdi, A. M., Tenenbaum, D. E., and Kalogirou, S.: Examining the NDVI-rainfall relationship in the semi-arid Sahel using geographically weighted regression, J. Arid Environ., 146, 64–74, 2017.
Hakuba, M. Z., Folini, D., Schaepman-Strub, G., and Wild, M.: Solar absorption over Europe from collocated surface and satellite observations, J. Geophys. Res., 119, 3420–3437, 2014.
He, Y. and Wang, K. C.: Variability in direct and diffuse solar radiation across China from 1958 to 2017, Geophys. Res. Lett., 47, 1–11, https://doi.org/10.1029/2019GL084570, 2020.
He, Y., Wang, K., Zhou, C., and Wild, M.: A Revisit of Global Dimming and Brightening Based on the Sunshine Duration, Geophys. Res. Lett., 45, 4281–4289, 2018.
Hong, Y., Nix, H. A., Hutchinson, M. F., and Booth, T. H.: Spatial interpolation of monthly mean climate data for China, Int. J. Climatol., 25, 1369–1379, 2005.
Hongrong, S., Weiwei, L., Xuehua, F., Jinqiang, Z., Bo, H., Letu, H., Huazhe, S., Xinlei, H., Zijue, S., and Yingjie, Z.: First assessment of surface solar irradiance derived from Himawari-8 across China, Sol. Energy, 174, 164–170, 2018.
Hou, N., Zhang, X., Zhang, W., Xu, J., Feng, C., Yang, S., Jia, K., Yao, Y., Cheng, J., and Jiang, B.: A New Long-Term Downward Surface Solar Radiation Dataset over China from 1958 to 2015, Sensors-Basel, 20, 6167–6190, https://doi.org/10.3390/s20216167, 2020.
Huang, G., Li, Z., Li, X., Liang, S., Yang, K., Wang, D., and Zhang, Y.: Estimating surface solar irradiance from satellites: Past, present, and future perspectives, Remote Sens. Environ., 233, 111371–111387, https://doi.org/10.1016/j.rse.2019.111371, 2019.
Jia, B., Xie, Z., Dai, A., Shi, C., and Chen, F.: Evaluation of satellite and reanalysis products of downward surface solar radiation over East Asia: Spatial and seasonal variations, J. Geophys. Res.-Atmos., 118, 3431–3446, 2013.
Jin, H.-A., Li, A.-N., Bian, J.-H., Zhang, Z.-J., Huang, C.-Q., and Li, M.-X.: Validation of global land surface satellite (GLASS) downward shortwave radiation product in the rugged surface, J. Mt. Sci., 10, 812–823, 2013.
Jin, Z., Yezheng, W., and Gang, Y.: General formula for estimation of monthly average daily global solar radiation in China, Energy Convers. Manag., 46, 257–268, 2005.
Journée, M. and Bertrand, C.: Improving the spatio-temporal distribution of surface solar radiation data by merging ground and satellite measurements, Remote Sens. Environ., 114, 2692–2704, 2010.
Journée, M., Müller, R., and Bertrand, C.: Solar resource assessment in the Benelux by merging Meteosat-derived climate data and ground measurements, Sol. Energy, 86, 3561–3574, 2012.
Karlsson, K.-G., Anttila, K., Trentmann, J., Stengel, M., Fokke Meirink, J., Devasthale, A., Hanschmann, T., Kothe, S., Jääskeläinen, E., Sedlar, J., Benas, N., van Zadelhoff, G.-J., Schlundt, C., Stein, D., Finkensieper, S., Håkansson, N., and Hollmann, R.: CLARA-A2: the second edition of the CM SAF cloud and radiation data record from 34 years of global AVHRR data, Atmos. Chem. Phys., 17, 5809–5828, https://doi.org/10.5194/acp-17-5809-2017, 2017.
Kato, S., Rose, F. G., Rutan, D. A., Thorsen, T. J., Loeb, N. G., Doelling, D. R., Huang, X., Smith, W. L., Su, W., and Ham, S.-H.: Surface Irradiances of Edition 4.0 Clouds and the Earth's Radiant Energy System (CERES) Energy Balanced and Filled (EBAF) Data Product, J. Climate, 31, 4501-4527, 2018.
Leckner, B. G.: The spectral distribution of solar radiation at the earth's surface–elements of a model, Sol. Energy, 20, 143–150, 1978.
LeSage, J. P.: A Family of Geographically Weighted Regression Models,Advances in Spatial Econometrics, Adv. Spatial Sci., Springer, Berlin, Heidelberg, https://doi.org/10.1007/978-3-662-05617-2_11, 2004.
Letu, H., Yang, K., Nakajima, T. Y., Ishimoto, H., Nagao, T. M., Riedi, J., Baran, A. J., Ma, R., Wang, T., Shang, H., Khatri, P., Chen, L., Shi, C., and Shi, J.: High-resolution retrieval of cloud microphysical properties and surface solar radiation using Himawari-8/AHI next-generation geostationary satellite, Remote Sens. Environ., 239, 111583, https://doi.org/10.1016/j.rse.2019.111583, 2020.
Li, J., Jiang, Y. W., Xia, X. G., and Hu, Y. Y.: Increase of surface solar irradiance across East China related to changes in aerosol properties during the past decade, Environ.Res. Lett., 13, 034006–034015, https://doi.org/10.1088/1748-9326/aaa35a, 2018.
Li, T. and Meng, Q.: Forest dynamics to precipitation and temperature in the Gulf of Mexico coastal region, Int. J. Biometeorol., 61, 869–879, 2017.
Liang, F. and Xia, X. A.: Long-term trends in solar radiation and the associated climatic factors over China for 1961-2000, Ann. Geophys., 23, 2425–2432, https://doi.org/10.5194/angeo-23-2425-2005, 2005.
Loghmari, I., Timoumi, Y., and Messadi, A.: Performance comparison of two global solar radiation models for spatial interpolation purposes, Renew. Sust. Energ. Rev., 82, 837–844, 2018.
Lorenzo, A. T., Morzfeld, M., Holmgren, W. F., and Cronin, A. D.: Optimal interpolation of satellite and ground data for irradiance nowcasting at city scales, Sol. Energy, 144, 466–474, 2017.
Lu, W., Mo, Y., and Wang, D.: Characteristics investigation for pyranometers, Acta Energi. Sin., 23, 313–316, 2002.
Lu, W. H. and Bian, Z. Q.: Station experiment and preliminary data analysis of high-precision solar radiation measurement system, Meteorol. Hydrol. Mar. Instrum., 3, 1–5, 2012.
Luo, Y., Lu, D., Zhou, X., Li, W., and He, Q.: Characteristics of the spatial distribution and yearly variation of aerosol optical depth over China in last 30 years, J. Geophys. Res., 106, 14501–14513, 2001.
Ma, Q., Wang, K. C., and Wild, M.: Impact of geolocations of validation data on the evaluation of surface incident shortwave radiation from Earth System Models, J. Geophys. Res.-Atmos., 120, 6825–6844, 2015.
Ma, Y. and Gopal, S.: Geographically Weighted Regression Models in Estimating Median Home Prices in Towns of Massachusetts Based on an Urban Sustainability Framework, Sustainability, 10, 1026–1053, https://doi.org/10.3390/su10041026, 2018.
Manara, V., Beltrano, M. C., Brunetti, M., Maugeri, M., Sanchez-Lorenzo, A., Simolo, C., and Sorrenti, S.: Sunshine duration variability and trends in Italy from homogenized instrumental time series (1936–2013), J. Geophy. Res.-Atmos., 120, 3622–3641, 2015.
Manara, V., Brunetti, M., Maugeri, M., Sanchez-Lorenzo, A., and Wild, M.: Sunshine duration and global radiation trends in Italy (1959–2013): To what extent do they agree?, J. Geophys. Res., 122, 4312–4331, 2017.
Mo, Y. Q., Yang, Y., Liang, H. L., and Wang, D.: Investigation report on technology of status and development of meteorological radiation observation in China, Chinese J. Sci. Instrum., 29, 518–522, 2008.
Montero-Martín, J., Antón, M., Vaquero-Martínez, J., and Sanchez-Lorenzo, A.: Comparison of long-term solar radiation trends from CM SAF satellite products with ground-based data at the Iberian Peninsula for the period 1985–2015, Atmos. Res., 236, 104839–104849, https://doi.org/10.1016/j.atmosres.2019.104839, 2020.
Myers, D. R.: Solar radiation modeling and measurements for renewable energy applications: data and model quality, Energy, 30, 1517–1531, 2005.
NASA Earth Observations (NEO): Dataset of MODAL2 M CLD FR, available at: https://neo.sci.gsfc.nasa.gov/view.php?datasetId=MODAL2_M_CLD_FR, last access: 3 March 2021.
Pfeifroth, U., Bojanowski, J. S., Clerbaux, N., Manara, V., Sanchez-Lorenzo, A., Trentmann, J., Walawender, J. P., and Hollmann, R.: Satellite-based trends of solar radiation and cloud parameters in Europe, Adv. Sci. Res., 15, 31–37, https://doi.org/10.5194/asr-15-31-2018, 2018a.
Pfeifroth, U., Sanchez-Lorenzo, A., Manara, V., Trentmann, J., and Hollmann, R.: Trends and Variability of Surface Solar Radiation in Europe Based On Surface- and Satellite-Based Data Records, J. Geophy. Res.-Atmos., 123, 1735–1754, 2018b.
Platnick, S., Ackerman, S., King, M., Wind, G., Meyer, K., Menzel, W., Holz, R., Baum, B., and Yang, P.: MODIS atmosphere L2 cloud product (06_L2), NASA MODIS Adaptive Processing System, Goddard Space Flight Center, available at: https://modis-images.gsfc.nasa.gov/MOD06_L2/doi.html (last access: 5 March 2021), 1, 1, 2017.
Qian, Y., Kaiser, D. P., Leung, L. R., and Xu, M.: More frequent cloud-free sky and less surface solar radiation in China from 1955 to 2000, Geophys. Res. Lett., 33, 311–330, 2015.
Rahman, M. and Zhang, W.: Review on estimation methods of the Earth's surface energy balance components from ground and satellite measurements, J. Earth Syst. Sci., 128, 1–84, https://doi.org/10.1007/s12040-019-1098-5, 2019.
Ruiz-Arias, J. A., Quesada-Ruiz, S., Fernández, E. F., and Gueymard, C. A.: Optimal combination of gridded and ground-observed solar radiation data for regional solar resource assessment, Sol. Energy, 112, 411–424, 2015.
Rutan, D. A., Kato, S., Doelling, D. R., Rose, F. G., Nguyen, L. T., Caldwell, T. E., and Loeb, N. G.: CERES Synoptic Product: Methodology and Validation of Surface Radiant Flux, J. Atmos. Ocean Tech., 32, 1121–1143, 2015.
Sanchezlorenzo, A., Calbó, J., Brunetti, M., and Deser, C.: Dimming/brightening over the Iberian Peninsula: Trends in sunshine duration and cloud cover and their relations with atmospheric circulation, J. Geophys. Res.-Atmos., 114, 114, D100D109, https://doi.org/10.1029/2008JD011394, 2009.
Sanchezlorenzo, A., Azorinmolina, C., Wild, M., Vicenteserrano, S. M., Lópezmoreno, J. I., and Corellcustardoy, D.: Feasibility of sunshine duration records to detect changes in atmospheric turbidity: A case study in Valencia (Spain), AIP Conf. Proc., Berlin, Germany, 6–10 August 2012, 1531, 736–739, 2013.
Sanchezromero, A., Sanchezlorenzo, A., Calbó, J., González, J. A., and Azorin-Molina, C.: The signal of aerosol-induced changes in sunshine duration records: A review of the evidence, J. Geophys. Res.-Atmos., 119, 4657–4467, 2014.
Schwarz, M., Folini, D., Yang, S., Allan, R. P., and Wild, M.: Changes in atmospheric shortwave absorption as important driver of dimming and brightening, Nat. Geosci., 13, 110–115, 2020.
Sheehan, K. R., Strager, M. P., and Welsh, S. A.: Advantages of Geographically Weighted Regression for Modeling Benthic Substrate in Two Greater Yellowstone Ecosystem Streams, Environ. Monit. Assess., 18, 209–219, 2012.
Shi, G.-Y., Hayasaka, T., Ohmura, A., Chen, Z.-H., Wang, B., Zhao, J.-Q., Che, H.-Z., and Xu, L.: Data Quality Assessment and the Long-Term Trend of Ground Solar Radiation in China, J. Appl. Meteorol. Climatol., 47, 1006–1016, 2008.
Stengel, M., Stapelberg, S., Sus, O., Finkensieper, S., Würzler, B., Philipp, D., Hollmann, R., Poulsen, C., Christensen, M., and McGarragh, G.: Cloud_cci Advanced Very High Resolution Radiometer post meridiem (AVHRR-PM) dataset version 3: 35-year climatology of global cloud and radiation properties, Earth Syst. Sci. Data, 12, 41–60, https://doi.org/10.5194/essd-12-41-2020, 2020.
Tang, W., Yang, K., Qin, J., Niu, X., Lin, C., and Jing, X.: A revisit to decadal change of aerosol optical depth and its impact on global radiation over China, Atmos. Environ., 150, 106–115, https://doi.org/10.1016/j.atmosenv.2016.11.043, 2017.
Tang, W., Yang, K., Qin, J., Li, X., and Niu, X.: A 16-year dataset (2000–2015) of high-resolution (3 h, 10 km) global surface solar radiation, Earth Syst. Sci. Data, 11, 1905–1915, https://doi.org/10.5194/essd-11-1905-2019, 2019.
Tang, W.-J., Yang, K., Qin, J., Cheng, C. C. K., and He, J.: Solar radiation trend across China in recent decades: a revisit with quality-controlled data, Atmos. Chem. Phys., 11, 393–406, https://doi.org/10.5194/acp-11-393-2011, 2011.
Tsai, P. and Teng, H.: Role of Aedes aegypti (Linnaeus) and Aedes albopictus (Skuse) in local dengue epidemics in Taiwan, BMC Infectious Diseases, 16, 662–682, https://doi.org/10.1186/s12879-016-2002-4, 2016.
Wang, K. C.: Measurement biases explain discrepancies between the observed and simulated decadal variability of surface incident solar radiation, Sci. Rep.-UK, 4, 6144–6150, https://doi.org/10.1038/srep06144, 2014.
Wang, K. C. and Dickinson, R. E.: Contribution of solar radiation to decadal temperature variability over land, P. Natl. Acad. Sci. USA, 110, 14877, https://doi.org/10.1073/pnas.1311433110, 2013.
Wang, K. C., Ye, H., Chen, F., Xiong, Y., and Wang, C.: Urbanization Effect on the Diurnal Temperature Range: Different Roles under Solar Dimming and Brightening*, J. Climate, 25, 1022–1027, 2012.
Wang, K. C., Ma, Q., Li, Z., and Wang, J.: Decadal variability of surface incident solar radiation over China: Observations, satellite retrievals, and reanalyses, J. Geophys. Res.-Atmos., 120, 6500-6514, 2015.
Wang, M., He, G., Zhang, Z., Wang, G., Zhang, Z., Cao, X., Wu, Z., and Liu, X.: Comparison of Spatial Interpolation and Regression Analysis Models for an Estimation of Monthly Near Surface Air Temperature in China, Remote Sens., 9, 1278, 2017.
Wang, Y., Yang, Y., Zhao, N., Liu, C., and Wang, Q.: The magnitude of the effect of air pollution on sunshine hours in China, J. Geophys. Res.-Atmos., 117, D00V14, https://doi.org/10.1029/2011JD016753, 2012.
Wei, Y., Zhang, X., Hou, N., Zhang, W., Jia, K., and Yao, Y.: Estimation of surface downward shortwave radiation over China from AVHRR data based on four machine learning methods, Sol. Energy, 177, 32–46, 2019.
Wild, M.: Global dimming and brightening: A review, J. Geophys. Res.-Atmos., 114, D00D16, https://doi.org/10.1029/2008JD011470, 2009.
Wild, M.: Decadal changes in radiative fluxes at land and ocean surfaces and their relevance for global warming, WIRES Clim. Change, 7, 91–107, 2016.
Wild, M.: Towards Global Estimates of the Surface Energy Budget, Curr. Clim. Change Rep., 3, 87–97, 2017.
Xia, X.: Spatiotemporal changes in sunshine duration and cloud amount as well as their relationship in China during 1954–2005, J. Geophys. Res.-Atmos., 115, 1–13 https://doi.org/10.1029/2009JD012879, 2010.
Yang, H., Li, Z., Li, M., and Yang, D.: Inconsistency in Chinese solar radiation data caused by instrument replacement: Quantification based on pan evaporation observations, J. Geophys. Res., 120, 3191–3198, 2015.
Yang, K., Koike, T., and Ye, B.: Improving estimation of hourly, daily, and monthly solar radiation by importing global data sets, Agr. Forest Meteorol., 137, 43–55, 2006.
Yang, L., Cao, Q., Yu, Y., and Liu, Y.: Comparison of daily diffuse radiation models in regions of China without solar radiation measurement, energy, 191, 116571–116621, https://doi.org/10.1016/j.energy.2019.116571, 2020.
Yang, S., Wang, X. L., and Wild, M.: Homogenization and Trend Analysis of the 1958–2016 In Situ Surface Solar Radiation Records in China, J. Climate, 31, 4529–4541, 2018.
Yang, X., Zhao, C., Zhou, L., Wang, Y., and Liu, X.: Distinct impact of different types of aerosols on surface solar radiation in China, J. Geophys. Res.-Atmos., 121, 6459–6471, https://doi.org/10.1002/2016JD024938, 2017.
Yang, Y., Ding, L., and Wang, D.: Experiments and analysis of pyranometer on nighttime zero offset, Meteorol. Mon., 36, 100–103, 2010.
Yeom, J. M., Park, S., Chae, T., Kim, J. Y., and Lee, C. S.: Spatial Assessment of Solar Radiation by Machine Learning and Deep Neural Network Models Using Data Provided by the COMS MI Geostationary Satellite: A Case Study in South Korea, Sensors-Basel, 19, https://doi.org/10.3390/s19092082, 2019.
Zell, E., Gasim, S., Wilcox, S., Katamoura, S., Stoffel, T., Shibli, H., Engel-Cox, J., and Al Subie, M.: Assessment of solar radiation resources in Saudi Arabia, Sol. Energy, 119, 422–438, 2015.
Zhang, X., Liang, S., Wild, M., and Jiang, B.: Analysis of surface incident shortwave radiation from four satellite products, Remote Sens. Environ., 165, 186–202, 2015.
Zhang, X., Liang, S., Wang, G., Yao, Y., Jiang, B., and Cheng, J.: Evaluation of the reanalysis surface incident shortwave radiation products from NCEP, ECMWF, GSFC, and JMA using satellite and surface observations, Remote Sens., 8, 225–249, 2016.
Zhang, Y., Rossow, W. B., Lacis, A. A., Oinas, V., and Mishchenko, M. I.: Calculation of radiative fluxes from the surface to top of atmosphere based on ISCCP and other global data sets: Refinements of the radiative transfer model and the input data, J. Geophys. Res.-Atmos., 109, https://doi.org/10.1029/2003JD004457, 2004.
Zhao, L., Lee, X., and Liu, S.: Correcting surface solar radiation of two data assimilation systems against FLUXNET observations in North America, J. Geophys. Res.-Atmos., 118, 9552–9564, 2013.
Zhou, Q., Wang, C., and Fang, S.: Application of geographically weighted regression (GWR) in the analysis of the cause of haze pollution in China, Atmos. Pollut. Res., 10, 835–846, 2019.
Zhou, Z., Lin, A., Wang, L., Qin, W., Zhong, Y., and He, L.: Trends in downward surface shortwave radiation from multi-source data over China during 1984–2015, Int. J. Climatol., 40, 1–19, 2019.
Zou, L., Wang, L., Lin, A., Zhu, H., Peng, Y., and Zhao, Z.: Estimation of global solar radiation using an artificial neural network based on an interpolation technique in southeast China, J. Atmos. Sol. Terr. Phys., 146, 110–122, 2016.