the Creative Commons Attribution 4.0 License.
the Creative Commons Attribution 4.0 License.
 | 08 Dec 2021
Landsat-based Irrigation Dataset (LANID): 30 m resolution maps of irrigation distribution, frequency, and change for the US, 1997–2017
Holly K. Gibbs
Tyler J. Lark
Data on irrigation patterns and trends at field-level detail across broad extents are vital for assessing and managing limited water resources. Until recently, there has been a scarcity of comprehensive, consistent, and frequent irrigation maps for the US. Here we present the new Landsat-based Irrigation Dataset (LANID), which is comprised of 30 m resolution annual irrigation maps covering the conterminous US (CONUS) for the period of 1997–2017. The main dataset identifies the annual extent of irrigated croplands, pastureland, and hay for each year in the study period. Derivative maps include layers on maximum irrigated extent, irrigation frequency and trends, and identification of formerly irrigated areas and intermittently irrigated lands. Temporal analysis reveals that 38.5×10⁶ ha of croplands and pasture–hay has been irrigated, among which the yearly active area ranged from ∼22.6 to 24.7×10⁶ ha. The LANID products provide several improvements over other irrigation data including field-level details on irrigation change and frequency, an annual time step, and a collection of ∼10 000 visually interpreted ground reference locations for the eastern US where such data have been lacking. Our maps demonstrated overall accuracy above 90 % across all years and regions, including in the more humid and challenging-to-map eastern US, marking a significant advancement over other products, whose accuracies ranged from 50 % to 80 %. In terms of change detection, our maps yield per-pixel transition accuracy of 81 % and show good agreement with US Department of Agriculture reports at both county and state levels. The described annual maps, derivative layers, and ground reference data provide users with unique opportunities to study local to nationwide trends, driving forces, and consequences of irrigation and encourage the further development and assessment of new approaches for improved mapping of irrigation, especially in challenging areas like the eastern US. The annual LANID maps, derivative products, and ground reference data are available through https://doi.org/10.5281/zenodo.5548555 (Xie and Lark, 2021a).
- Article
(23350 KB) - Full-text XML
- BibTeX
- EndNote


Irrigated agriculture is vital to global food security. Irrigation helps stabilize farm production by enhancing land productivity that would otherwise be lower due to water limitations to plant growth. In the US, approximately 14.6 % of the total cropland is irrigated (USDA-NASS, 2019). Despite this relatively small proportion, irrigated agriculture plays a significantly disproportionate role in agriculture, accounting for major proportions of the economic value and environmental impacts; irrigated farms account for 54 % of the total value of crop sales (USDA-NASS, 2021). However, agricultural irrigation uses over 40 % of total freshwater withdrawals and 80 % to 90 % of consumptive water use in the US (Dieter et al., 2018; USDA, 2021). As a result, improved management and understanding of irrigation use and trends offer a key leverage point to improve the sustainability of US agriculture.
Knowledge of the spatial and temporal patterns of irrigation is a crucial first step to improve this understanding and management and to help policymakers make decisions to support sustainable water use for crop production. However, the spatiotemporal patterns of irrigation and their impacts are not well understood, even for data-rich countries like the US. This insufficient knowledge about irrigation hampers a much larger body of research and applications, such as the modeling of land surface characteristics, climate and weather, and the growth of crops and other vegetation. For those applications that do incorporate irrigation modules, they are typically based on infrequently updated coarse-resolution global maps that cannot represent the precise locations of irrigated fields (Zaussinger et al., 2019; Ozdogan et al., 2010). As such, there is significant need for field-relevant resolution maps of irrigated agricultural land and its temporal changes. The value of such detailed irrigation information is further magnified as society formulates strategies towards sustainable use of limited water resources from local to global scales under the context of increasing food and fuel demands, climate change and extremes, and population growth (Lark et al., 2015; Rosegrant et al., 2009; Seto et al., 2012; Seager et al., 2012; Mcdonald et al., 2011).
Table 1Currently available irrigation maps covering part to the entire CONUS. The boldfaced maps are compared with LANID in the Results section (RF: random forest; RS: remote sensing).
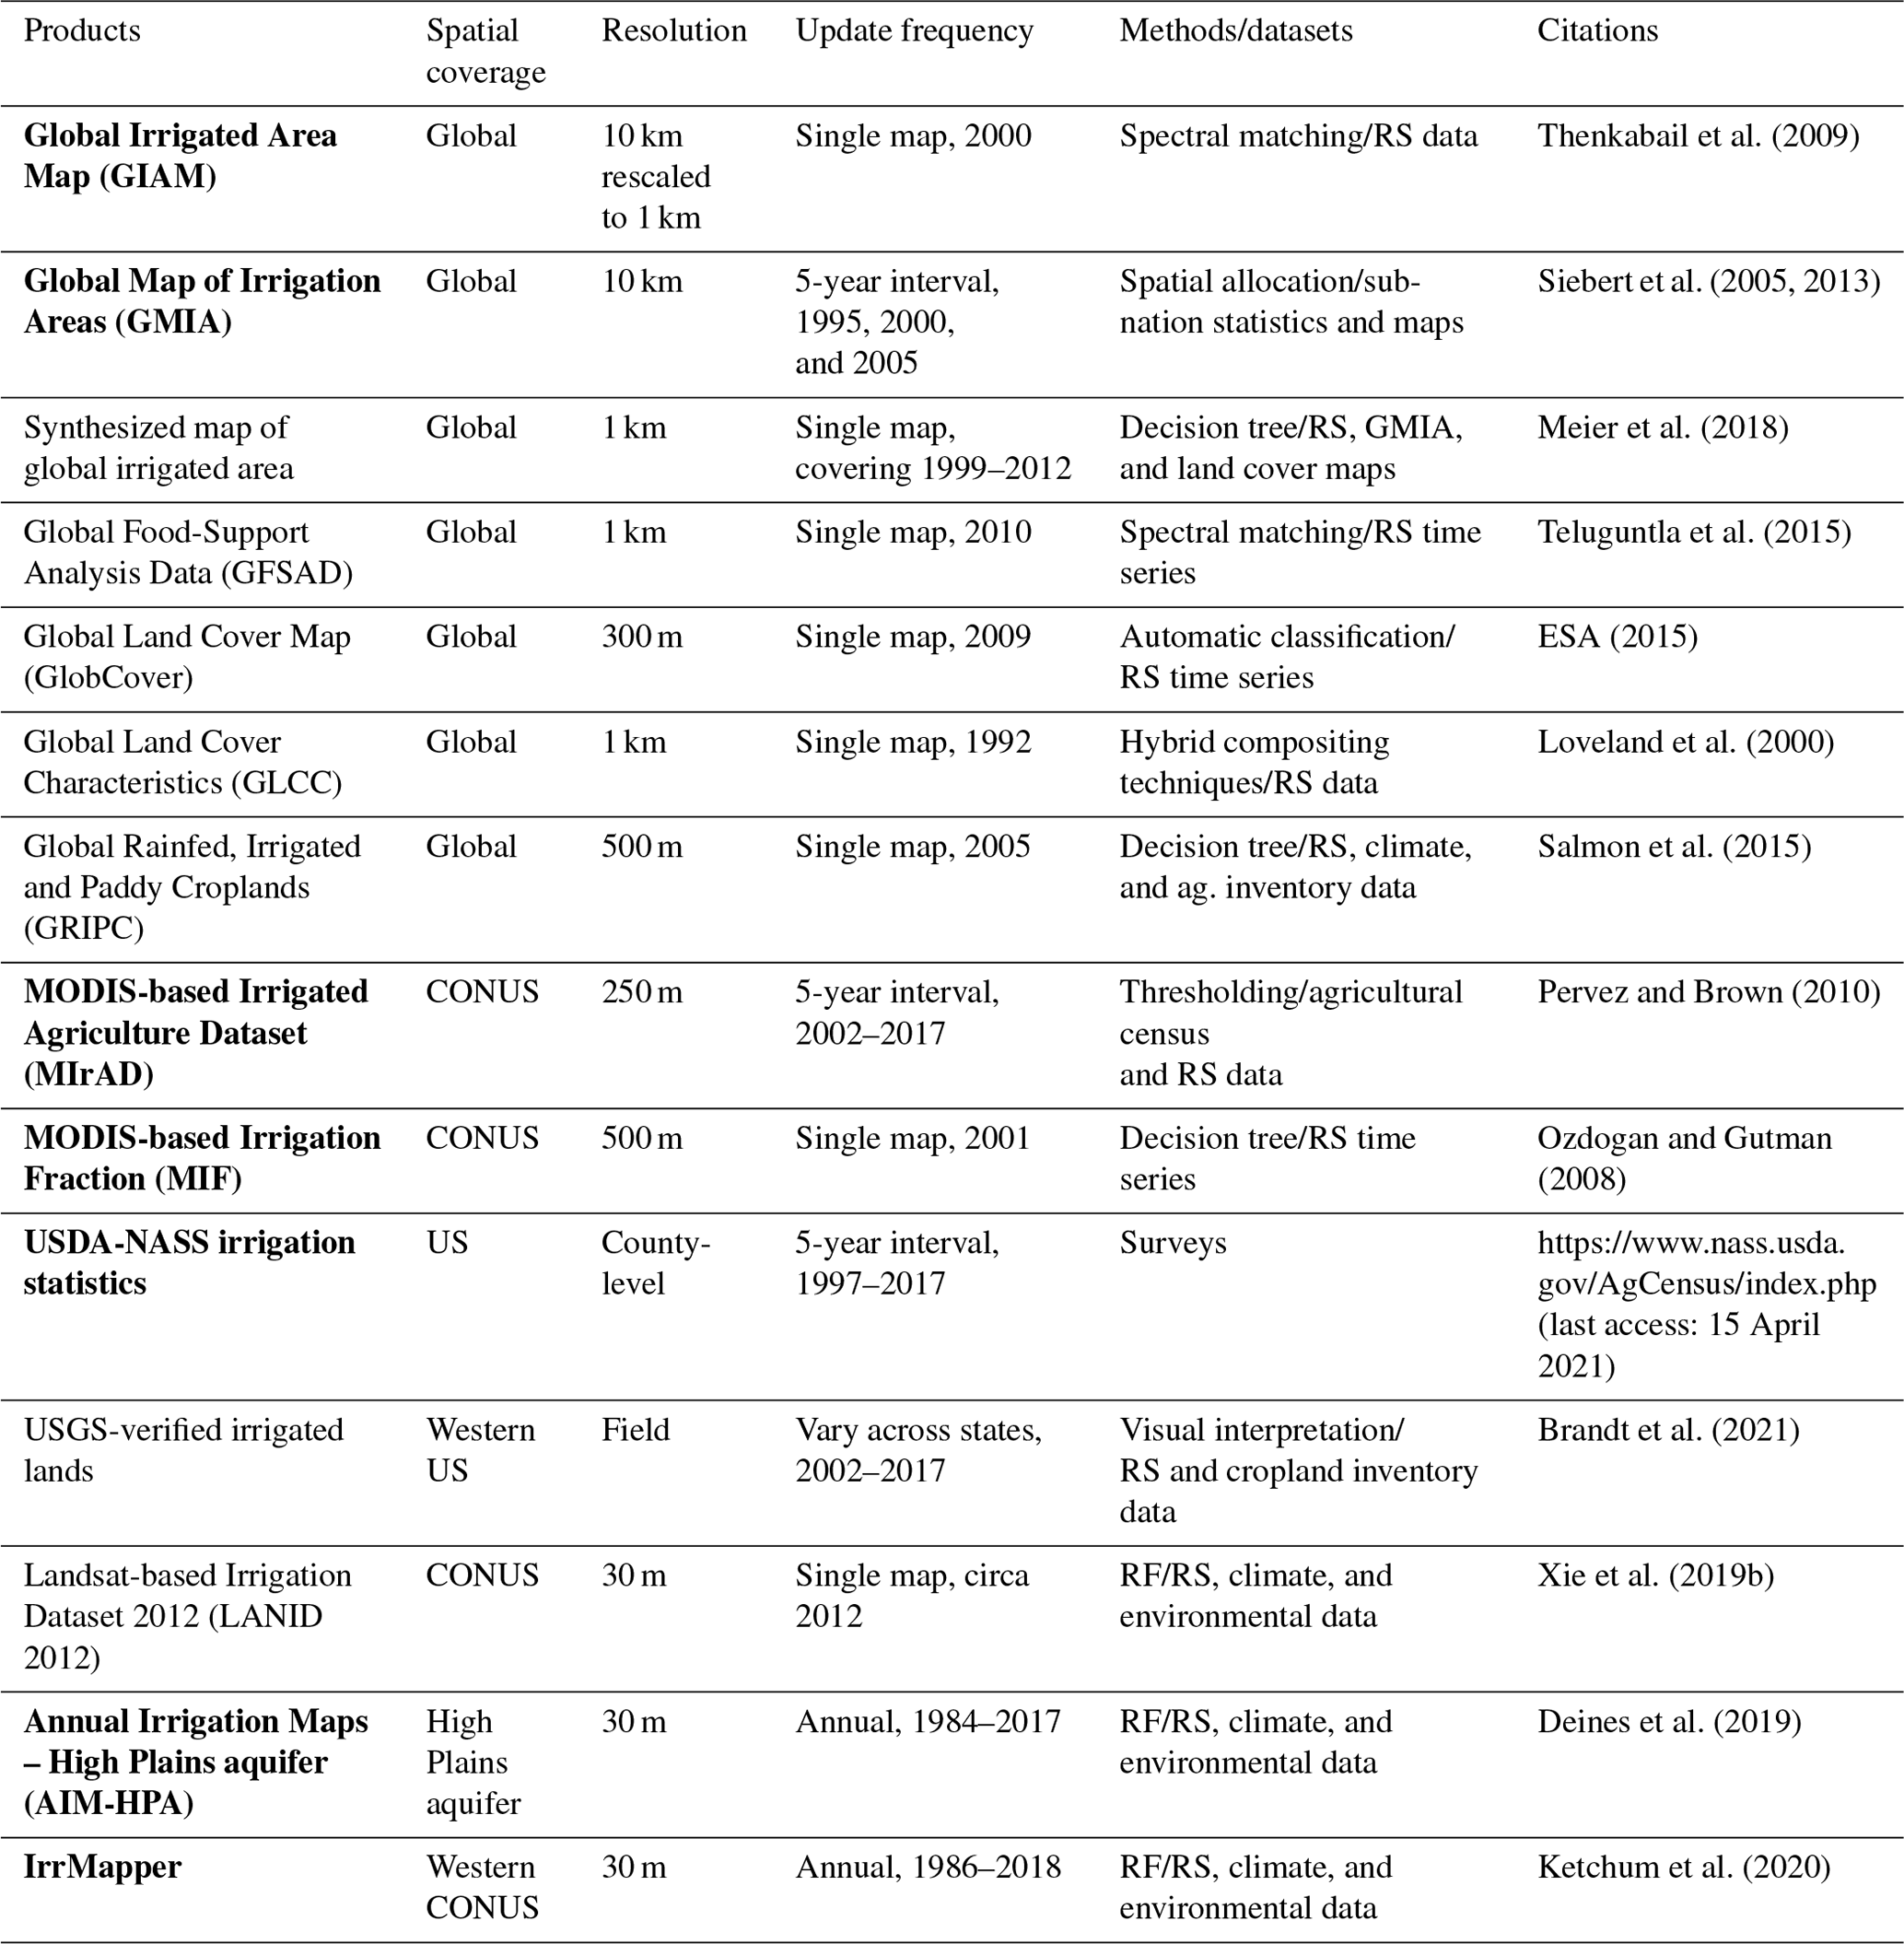
Despite the growing importance of field-level irrigation information to a wide array of research questions and applications, currently available irrigation maps that cover the entire or part of the conterminous US (CONUS) suffer from limitations related to spatial resolution, update frequency, geographical coverage, and mapping accuracy (Table 1). For example, the spatial resolution of all nationwide maps (except for LANID-US 2012) ranges from 250 m to kilometers, which is problematic for many local applications that require accurate field characterization (Wardlow and Callahan, 2014; Deines et al., 2017; Ozdogan and Gutman, 2008; Xie et al., 2019b; Brown and Pervez, 2014). Just as importantly, all these nationwide irrigation maps are infrequently updated and mapped at either a single date or at intervals of 5 years to decades (e.g., Shrestha et al., 2021; Brown and Pervez, 2014; Ozdogan and Gutman, 2008). Due to annual crop rotations, fallow practices, and climate variation, however, irrigation use and decision making are extremely dynamic. Accordingly, more timely information is needed to understand changes in irrigation and the associated impacts including water use and availability.
Recent years have witnessed unprecedented development of land use/cover mapping owing to the increasing availability of high- to moderate-resolution remote sensing data and improvement of computing capacity (e.g., emergence of cloud computing platforms). While annual continental to global products of some land use/cover types have been created in a near-operational manner (e.g., forest, water, and urban) (Hansen et al., 2013; Pekel et al., 2016; Gong et al., 2020), frequent fine-scale irrigation mapping remains challenging due to the cryptic nature of the irrigation signal and the lack of ground reference data needed to train and validate machine learning and other classifiers. The data gaps are particularly problematic in the Midwestern and eastern US, where more abundant water resources have led to less concern and monitoring of irrigated land use.
This paper presents the newly created annual 30 m resolution irrigation maps and their comparisons with existing products. The maps (named LANID – Landsat-based Irrigation Dataset) cover the CONUS for the period of 1997–2017 and build upon a past effort of mapping for the year 2012 (Xie et al., 2019b), with key improvements in training sample generation, classification design, and accuracy assessment (Xie and Lark, 2021b). The maps presented here also include a newly mapped component – irrigated pasture and hay – that was not explicitly included in the preliminary version presented in Xie and Lark (2021b). In addition to the LANID maps, we present the collected ground truth data, which are particularly important for irrigation mapping efforts that require such a dataset to train or validate machine learning algorithms, especially where it has not been available in the humid eastern US. Additional products include maps of irrigation frequency, maximum extent, irrigation trends, and formerly and intermittently irrigated areas. In the following sections, we briefly review the methods used to generate these data and then present our maps and their comparisons with existing products that cover the entire US.
Our new LANID product contains 21 annual maps that characterize irrigation status of croplands, pasture, and hay across the CONUS for the years from 1997 to 2017. We first created annual maps of irrigated croplands (i.e., LANID_V1) using a supervised decision tree classification based on a novel training sample generation method and satellite-derived and environmental variables (see details in Xie and Lark, 2021b). Because LANID_V1 does not explicitly include irrigated pasture and hay, which is an important component of total irrigation, particularly in the western US, we addressed this limitation by applying the same machine learning method but using different mask layers and areal reference for training sample generation and classification (Fig. 1). The maximum extent of pasture and hay for the west was derived from the USGS National Land Cover Database (NLCD) and USDA Cropland Data Layer (CDL), identifying pixels that had been classified as pasture–hay in NLCD or non-alfalfa hay in CDL within any year between 1992 and 2017. To reduce competition between this pasture and hay mask and the one used for irrigated cropland mapping, we removed those pixels that had been classified as irrigated cropland in LANID_V1. The county-level areal reference of irrigated pasture and hay was calculated as the deficit of LANID_V1-based irrigated cropland area compared to USDA-NASS-reported area, which includes all types of irrigated agriculture.
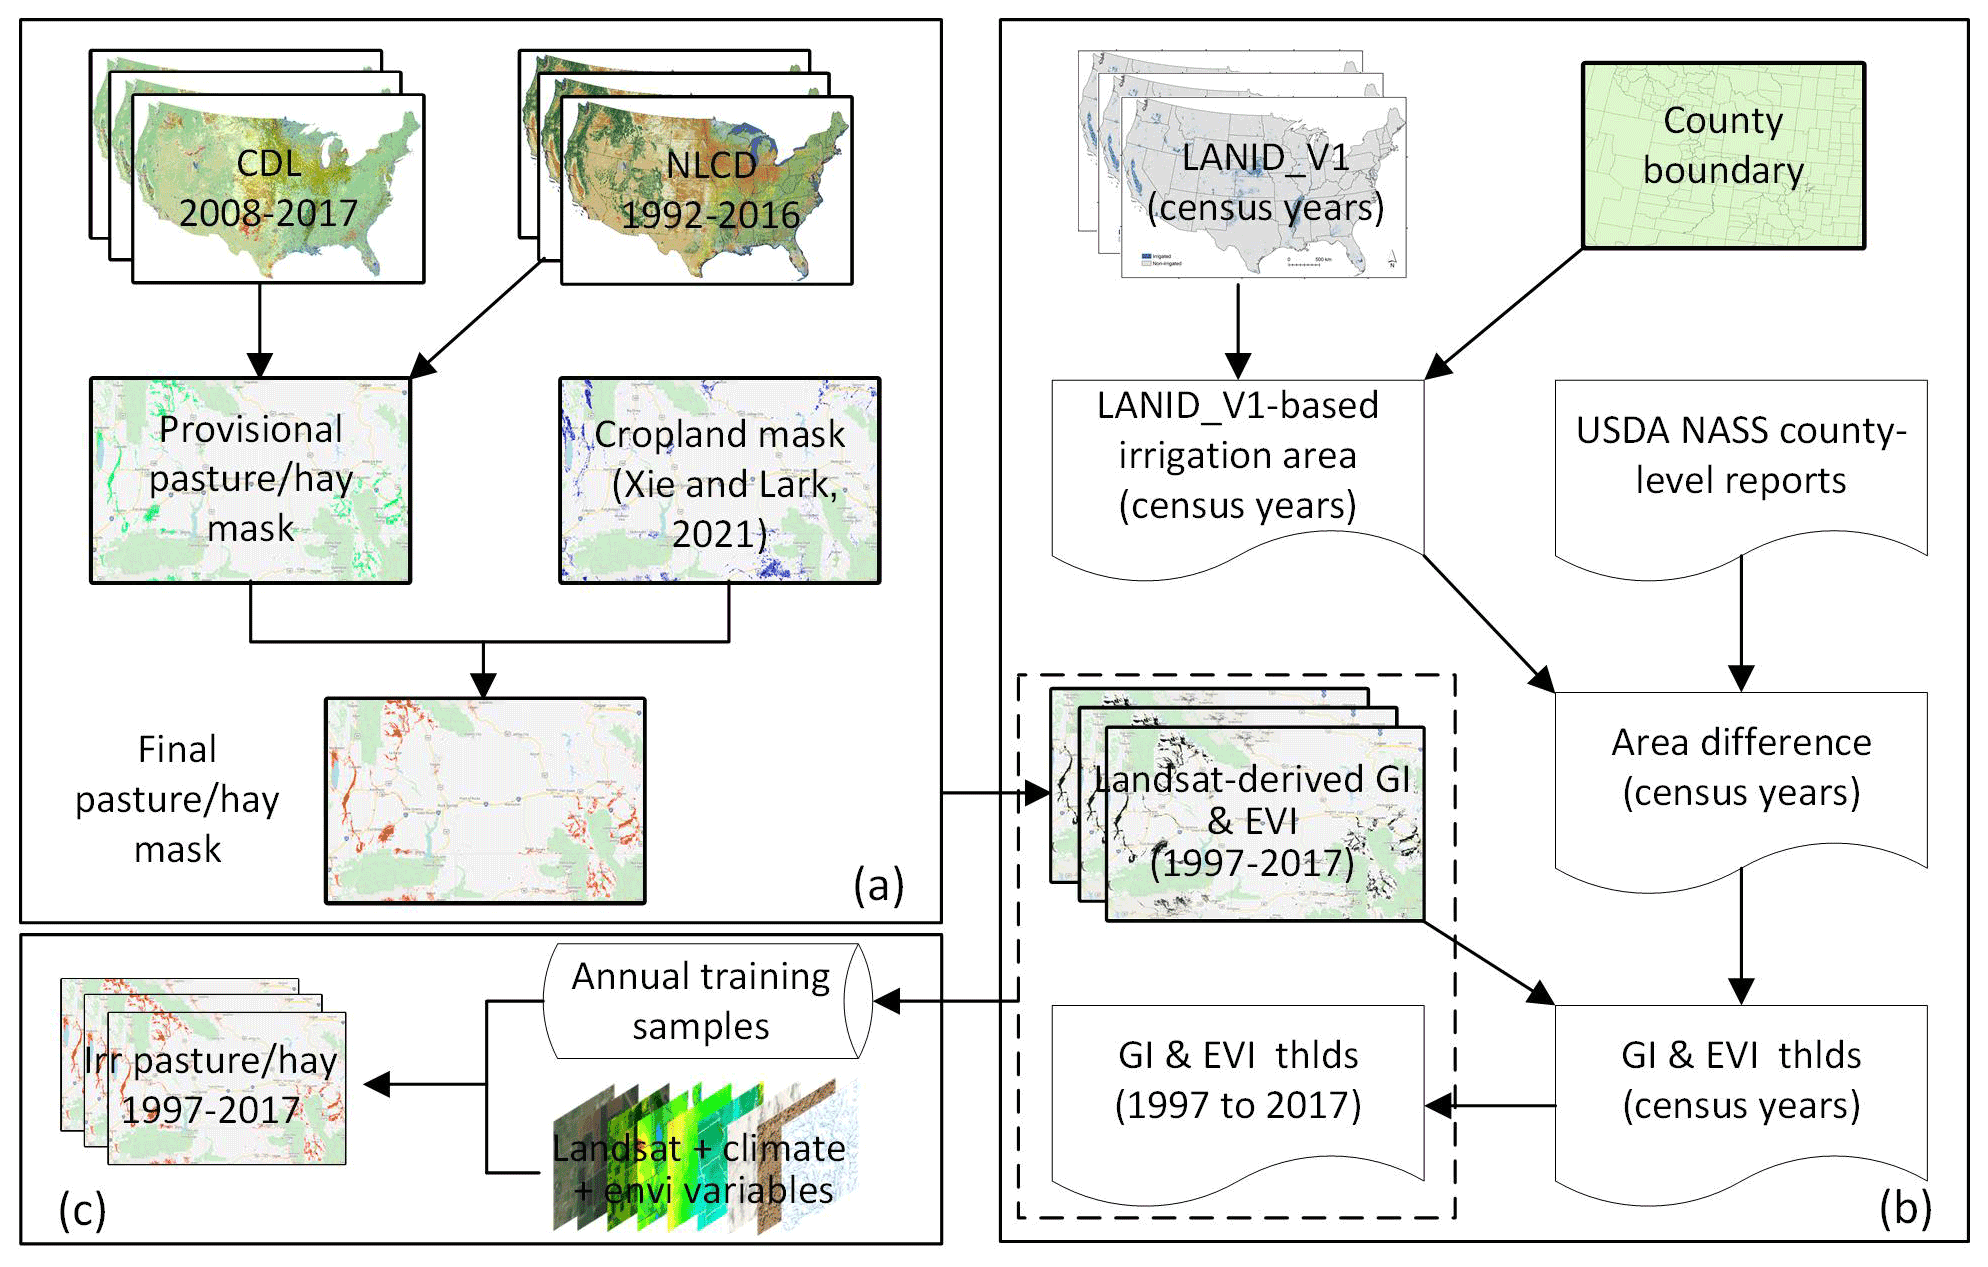
Figure 1Flowchart of mapping irrigated pasture and hay in western US (a) generating the maximum extent of pasture–hay, (b) creating training samples, and (c) classification. Cropland mask refers to the maximum extent of non-pasture–hay cultivated land created in Xie and Lark (2021b).
A key element of the LANID methodology is a novel way to generate training samples covering the entire country. To account for climate difference and mapping complexity, the CONUS was divided into western and eastern states based on a climatic transition near the 100th meridian, and training data were created corresponding to each region (Fig. 2). We used an automated method to generate training samples for the western states. For the years when USDA-NASS county-level irrigation statistics are available (i.e., 1997, 2002, 2007, 2012, and 2017), we adopted the thresholding method proposed by Xie et al. (2019b) to automate training sample generation, which assumed that irrigated lands appear greener than those that are rainfed. For non-census years, optimal thresholds were estimated based on relationships of crop greenness between non-census and census years. The calibrated and estimated thresholds were used to segment yearly maximum Landsat-based greenness index (GI) and enhanced vegetation index (EVI) to derive two intermediate irrigation maps per year, which were overlaid to identify consistent classification as potential training samples. As a result, the generated potential training samples were evenly distributed across the western CONUS on a yearly basis.
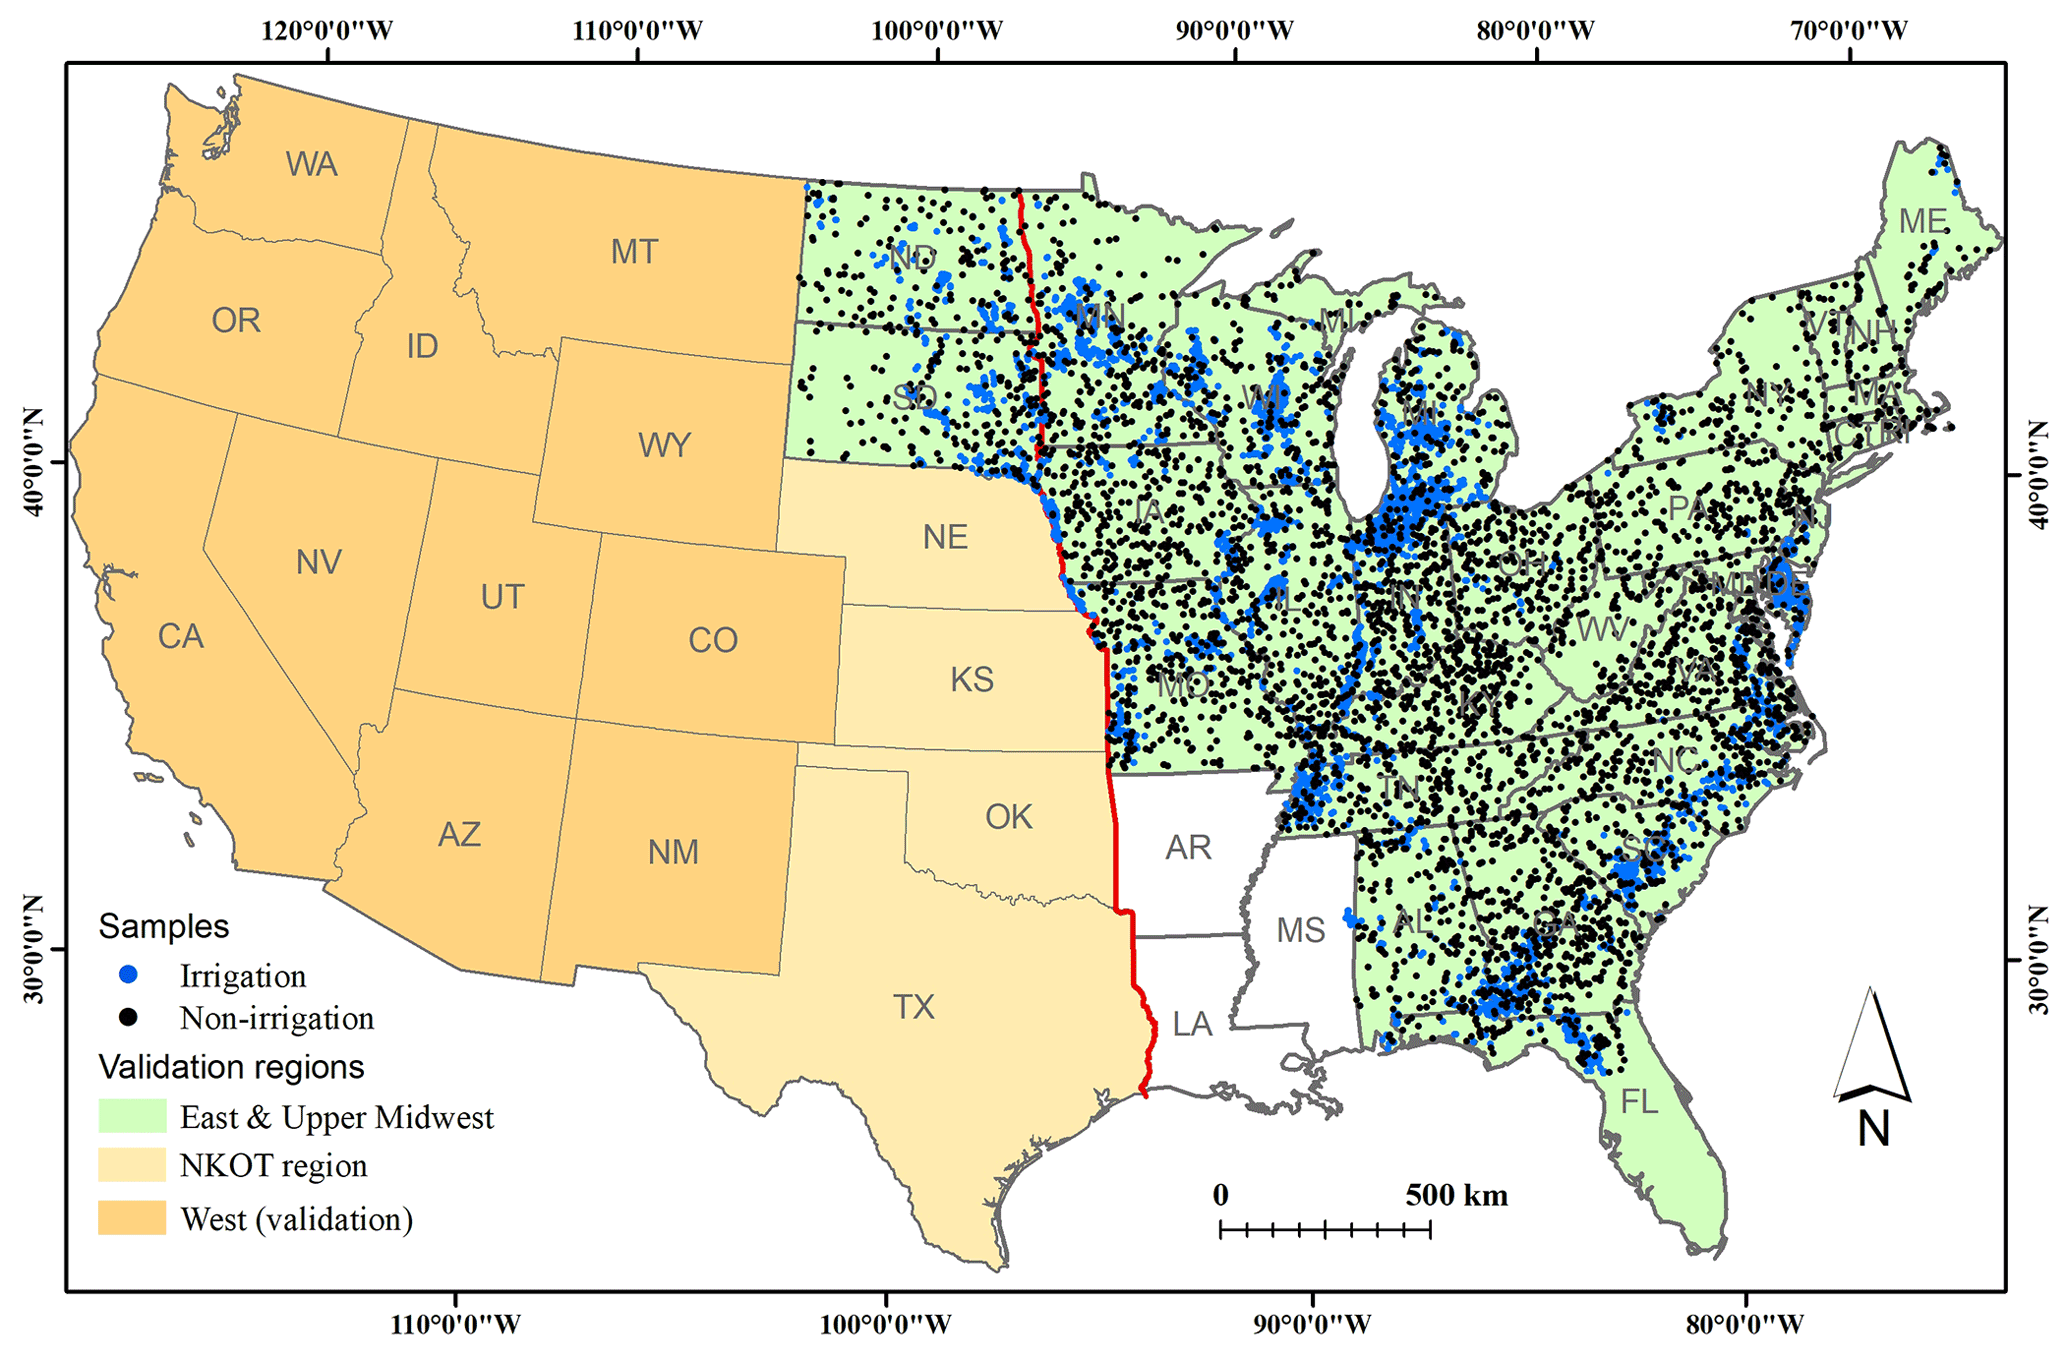
Figure 2Map evaluation and comparison design and the distribution of test sample locations across the eastern CONUS. The NKOT region refers to Nebraska, Kansas, Oklahoma, and Texas, which covers the majority of the High Plains aquifer. The red solid line represents the west–east division for classification only.
For the relatively humid eastern states, we visually collected samples through interpretation of multi-temporal very high-resolution images, street views, and time-series Landsat data on Google Earth and Google Earth Engine, based on the appearance of irrigation infrastructure such as wells, pipes, center pivot towers, and circular field patterns. Detailed methods of sample generation are described in Xie and Lark (2021b).
The predictors generally consist of two categories – satellite data and environmental variables (Xie and Lark, 2021b). The primary satellite-derived variables were calculated from all available Landsat images within each year, including yearly maximum, median, and range composites of GI, EVI, and normalized difference water index (NDWI). Annual and late-season (1 May to 15 October) sum of MODIS-derived indices (i.e., EVI and land surface temperature) were also used as additional variables. Environmental variables included annual and late-season sum of irrigation-relevant climate variables (i.e., precipitation, temperature, partial pressure of water vapor), elevation and slope, soil water content, and distance to major rivers (Deines et al., 2017, 2019; Xu et al., 2019; Xie et al., 2019b). Altogether, there were 32 input features (25 for the years 1997–2000 when MODIS products were not available).
Classification was implemented on Google Earth Engine, a cloud-computing platform that enables rapid accessing and processing of vast numbers of satellite images, climate data, and geophysical products (Gorelick et al., 2017). The classification was conducted annually per county using the widely used random forest classifier (Breiman, 2001). The county-level classifications were mosaicked to create an initial nationwide time-series irrigation map, followed by logic and spatial filtering to remove possible false classification (see details in Xie and Lark, 2021b).
Comprehensive assessment of nationwide irrigation maps is not possible without adequate ground truth data, especially for the eastern US. Therefore, accuracy of many published irrigation maps covering CONUS have been poorly evaluated. We compared our LANID maps to existing nationwide irrigation-specific maps, including two binary maps (i.e., MIrAD and GIAM) and two maps of irrigation fraction (i.e., MIF and GMIA areal percentage equipped for irrigation) (Table 1). Other global maps that include irrigation-related classes, such as Global Land Cover Map and GFSAD, are not shown because they are not irrigation-specific and substantially under-represent irrigation extent across the CONUS. In addition to coarser-resolution nationwide maps, we also compared our maps with recently available 30 m resolution maps for the High Plains aquifers and the 11 western states, i.e., AIM-HPA and IrrMapper, respectively.
Map evaluation and comparison were conducted by using test samples from two sources that cover the majority area of the CONUS – a published reference dataset from Ketchum et al. (2020) and an additional independent dataset that we collected for this study. The test samples from Ketchum et al. (2020) were collected through visual interpretation of field parcels based on irrigation clues from very high resolution images and crop greenness. The dataset has approximately 100 000 sample points, covering 11 western states (Fig. 2) for the whole study period of 1997–2017. Our independently collected validation samples (approximately 10 000 locations) covered the remaining areas except for Arkansas, Louisiana, and Mississippi. Lastly, we evaluated LANID's capability to detect irrigation change from pixel to state scales.
4.1 Irrigation samples across the eastern US
To validate our maps, we collected approximately 10 000 irrigation and rainfed samples for the east (∼5000 for each category) (Fig. 2). Each irrigation sample records a center pivot location and the presence of irrigation infrastructure during 1997–2017 (Fig. 3). In addition, we measured the radius of each center pivot irrigation system, i.e., the distance from its center to its field boundary. Note that the length of corner arms (designed for corner irrigation) was not measured (e.g., Field 1 in Fig. 3). Stable non-irrigation samples record the locations with clear evidence of no irrigation infrastructure during the entire mapping period. The average pivot radius for all samples collected in the eastern CONUS was 330 m, but distributed bimodally around approximately 200 and 400 m, which correspond respectively to broader rectangular circumscribed crop fields of 40 and 160 acres (16.19 and 64.75 ha), respectively.
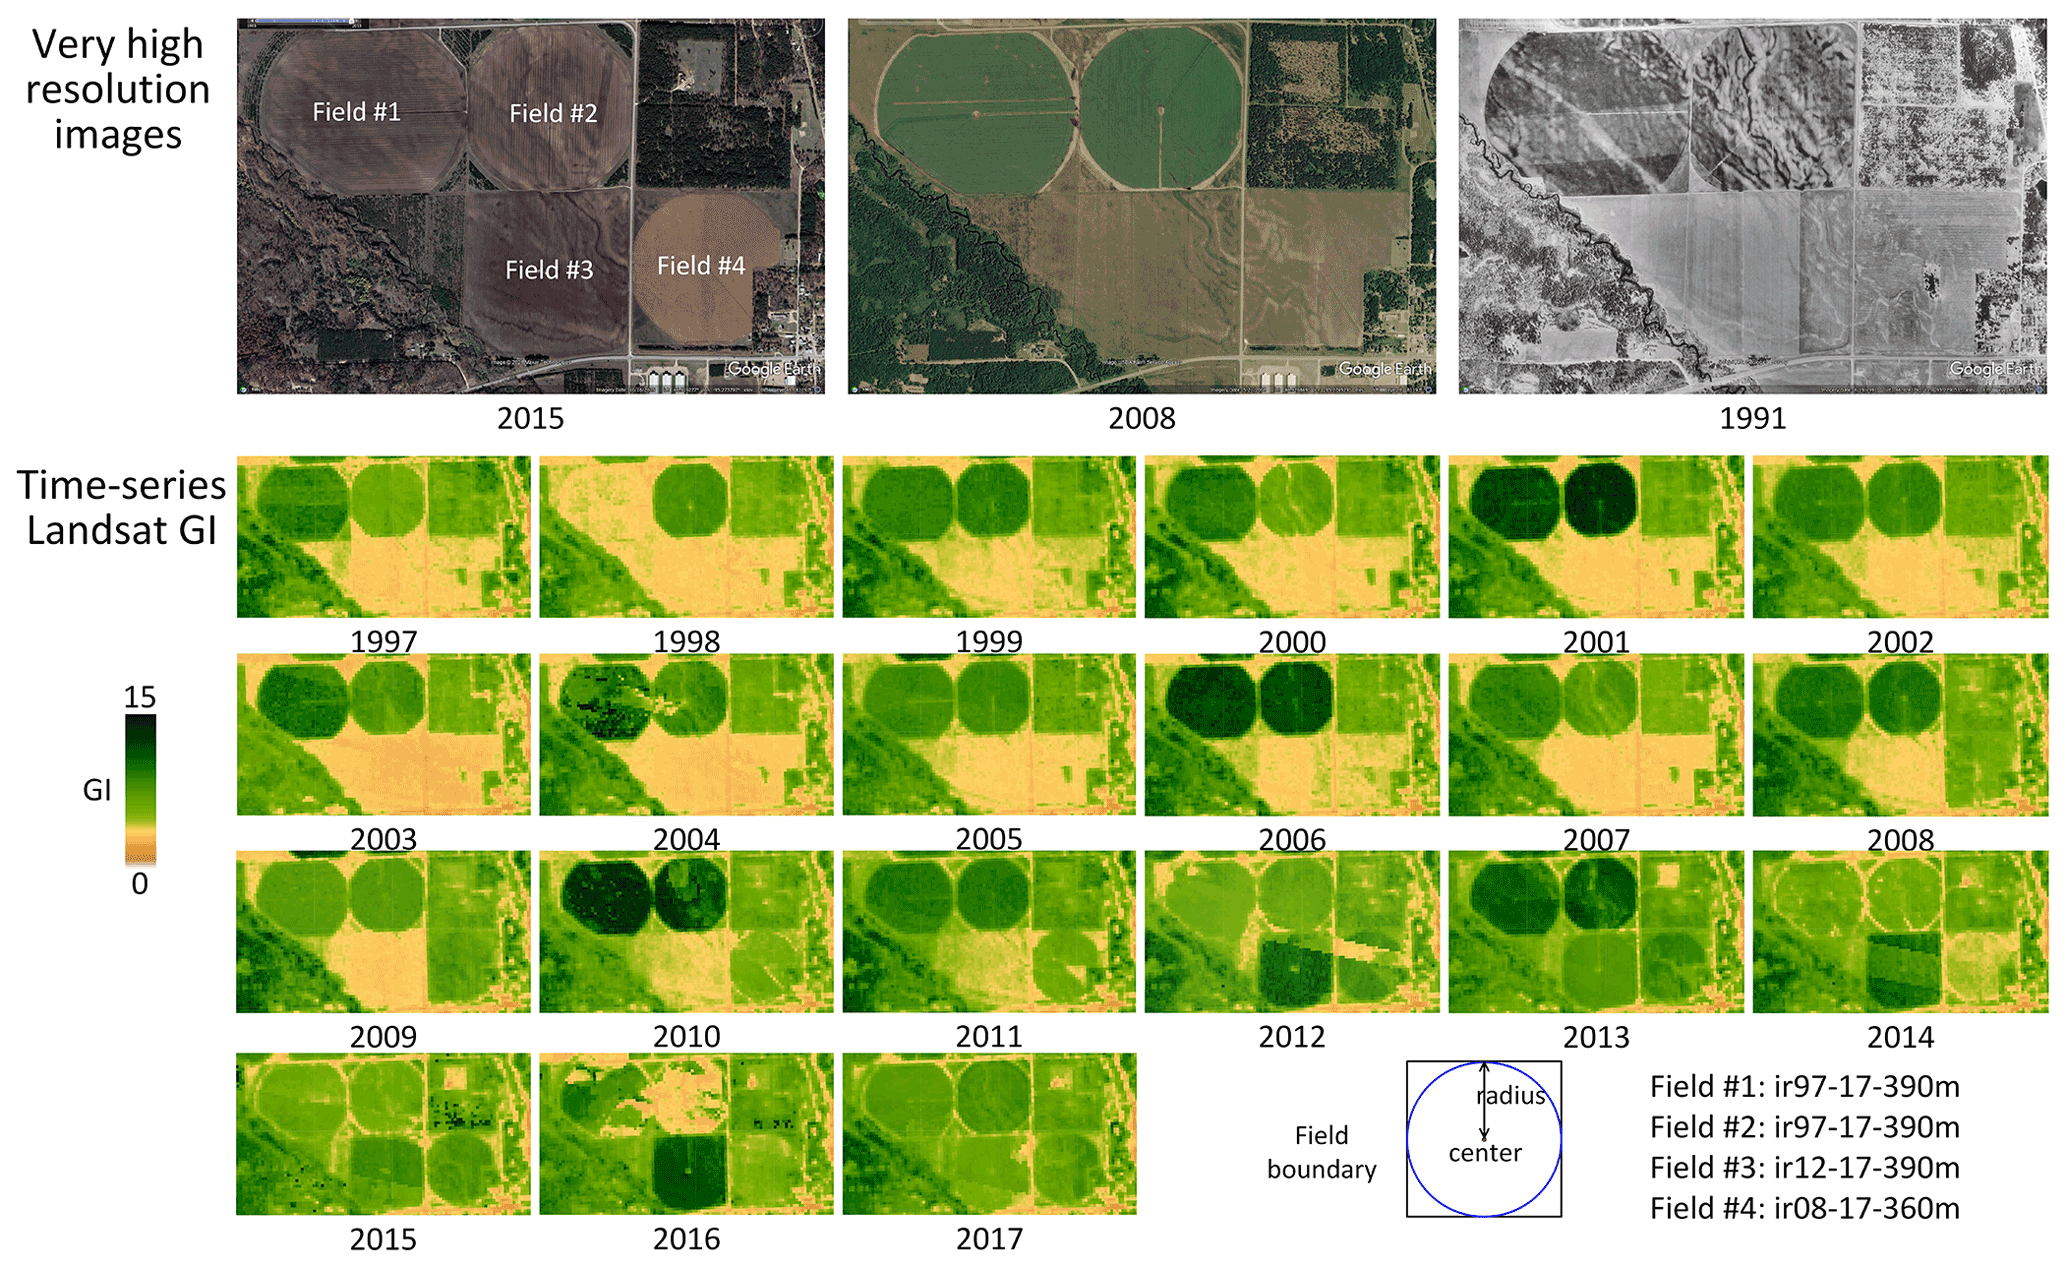
Figure 3Demonstration of center-pivot irrigation field collection using very high-resolution time series (© Google Earth Pro 2021) and Landsat images. GI: greenness index.
4.2 Irrigation trends and changes
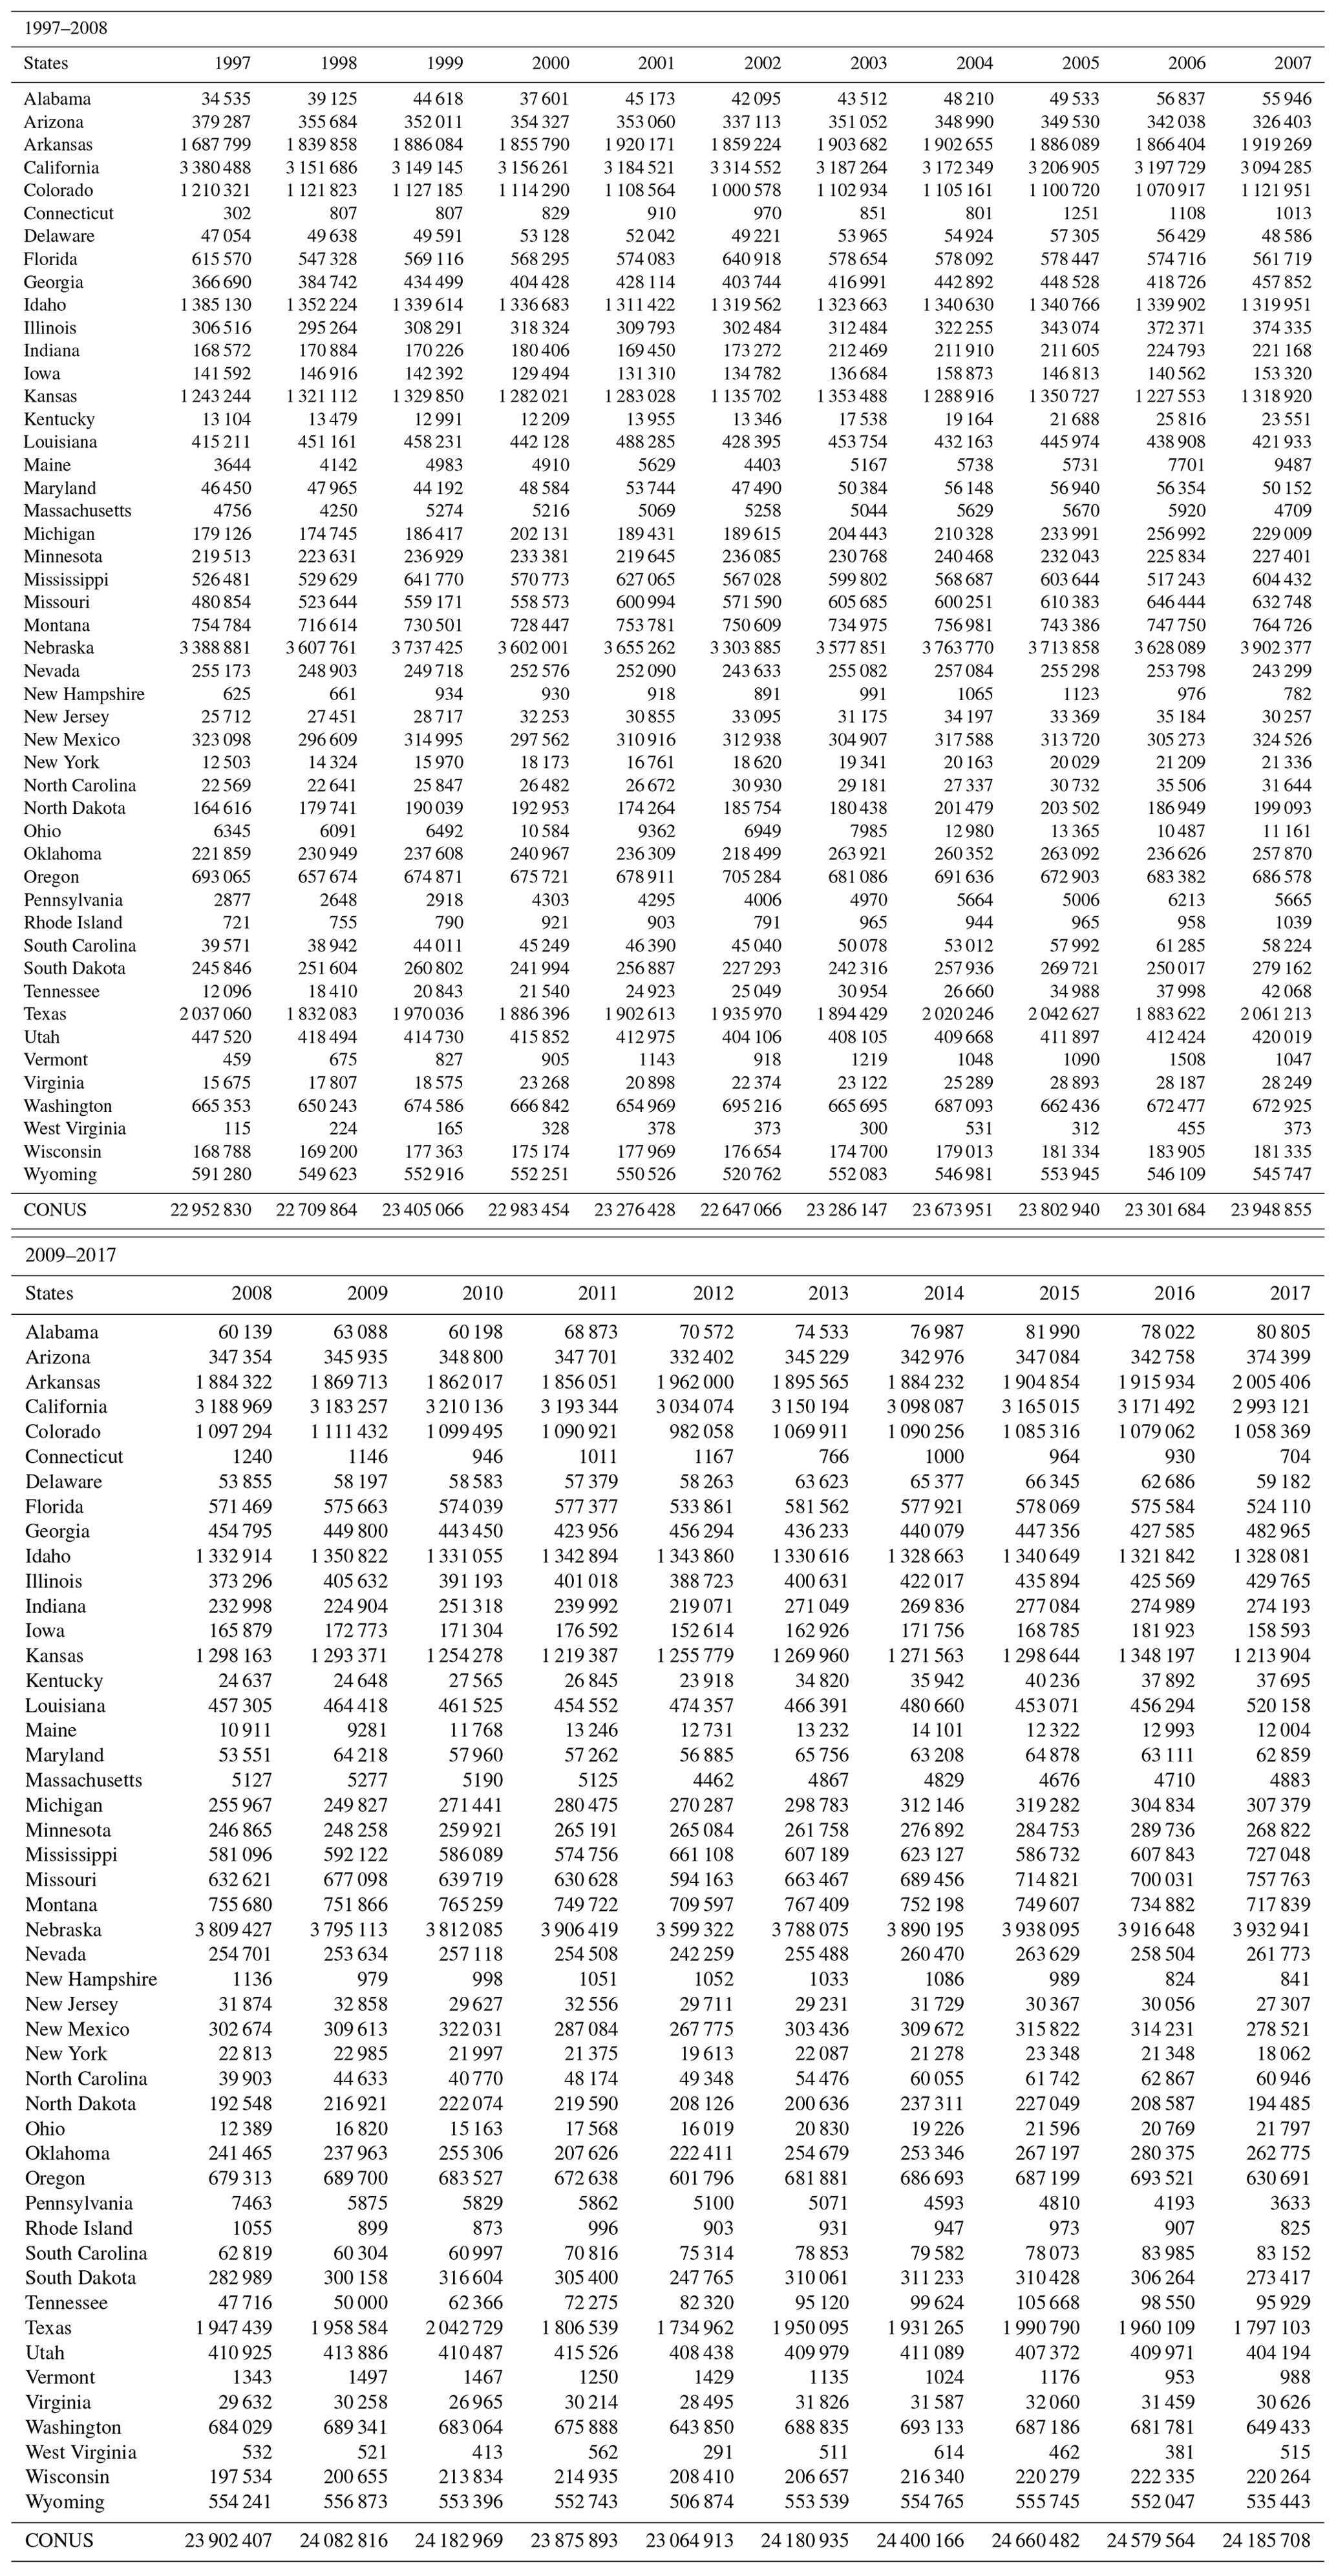
Our LANID reveals a steady increase in irrigated area throughout the CONUS, although there are some years with exceptional lower values – for example, 2012 and 2002, years in which there was significant drought (Fig. 4) (Otkin et al., 2018). Overall, irrigation area has increased by around 1.5×10⁶ ha (Mha) during the period, from ∼23 Mha before 2000 to ∼24.5 Mha in 2016 with an average annual increase of ∼80 000 ha. Consistent with earlier findings, the Central Valley of California, the High Plains portion of Texas, south-central Florida, and select western states (e.g., Utah, Colorado, Idaho, and Wyoming) experienced substantial irrigation loss during the period (per-state plots in Fig. 4). In contrast, irrigation increased in states across the Midwest (including Nebraska, North Dakota, and South Dakota), the Mississippi Alluvial Plain, and the East Coast. The largest gains occurred in Nebraska, Missouri, Michigan, Illinois, Arkansas, Mississippi, and Indiana, where irrigated area grew by over 100 000 ha per state.

Figure 4LANID-derived annual irrigation area by state, 1997–2017. The red line shows the east–west division in this study based on a climatic transition near the 100th meridian. Annual irrigation area per state is provided in Table A1.
Our LANID-derived irrigation changes agree well with USDA-NASS census-reported values (with R2 from 0.81 to 0.96), indicating that LANID and the USDA-NASS data are consistent in their detection of irrigation change at both county and state scales. Relative to the NASS data, however, our LANID maps predict slightly greater irrigated extent at the national level and slightly fewer net changes at both state and county levels, especially for the eastern CONUS (Fig. 5).
Aggregating the annual LANID maps to a finer but still intermediate 6 km resolution can reveal more localized trends than state- or county-level data allow, while also accommodating for the field-level stochasticity and variations that often occur within a single farm or shared water source (Fig. 6). Such a resolution is particularly helpful for identifying small pockets of change with countervailing trends that would otherwise be masked or undetected. For example, we found outlier locations of irrigation loss in the Mississippi Alluvial Plain and of irrigation gain in the central and southern High Plains aquifer.
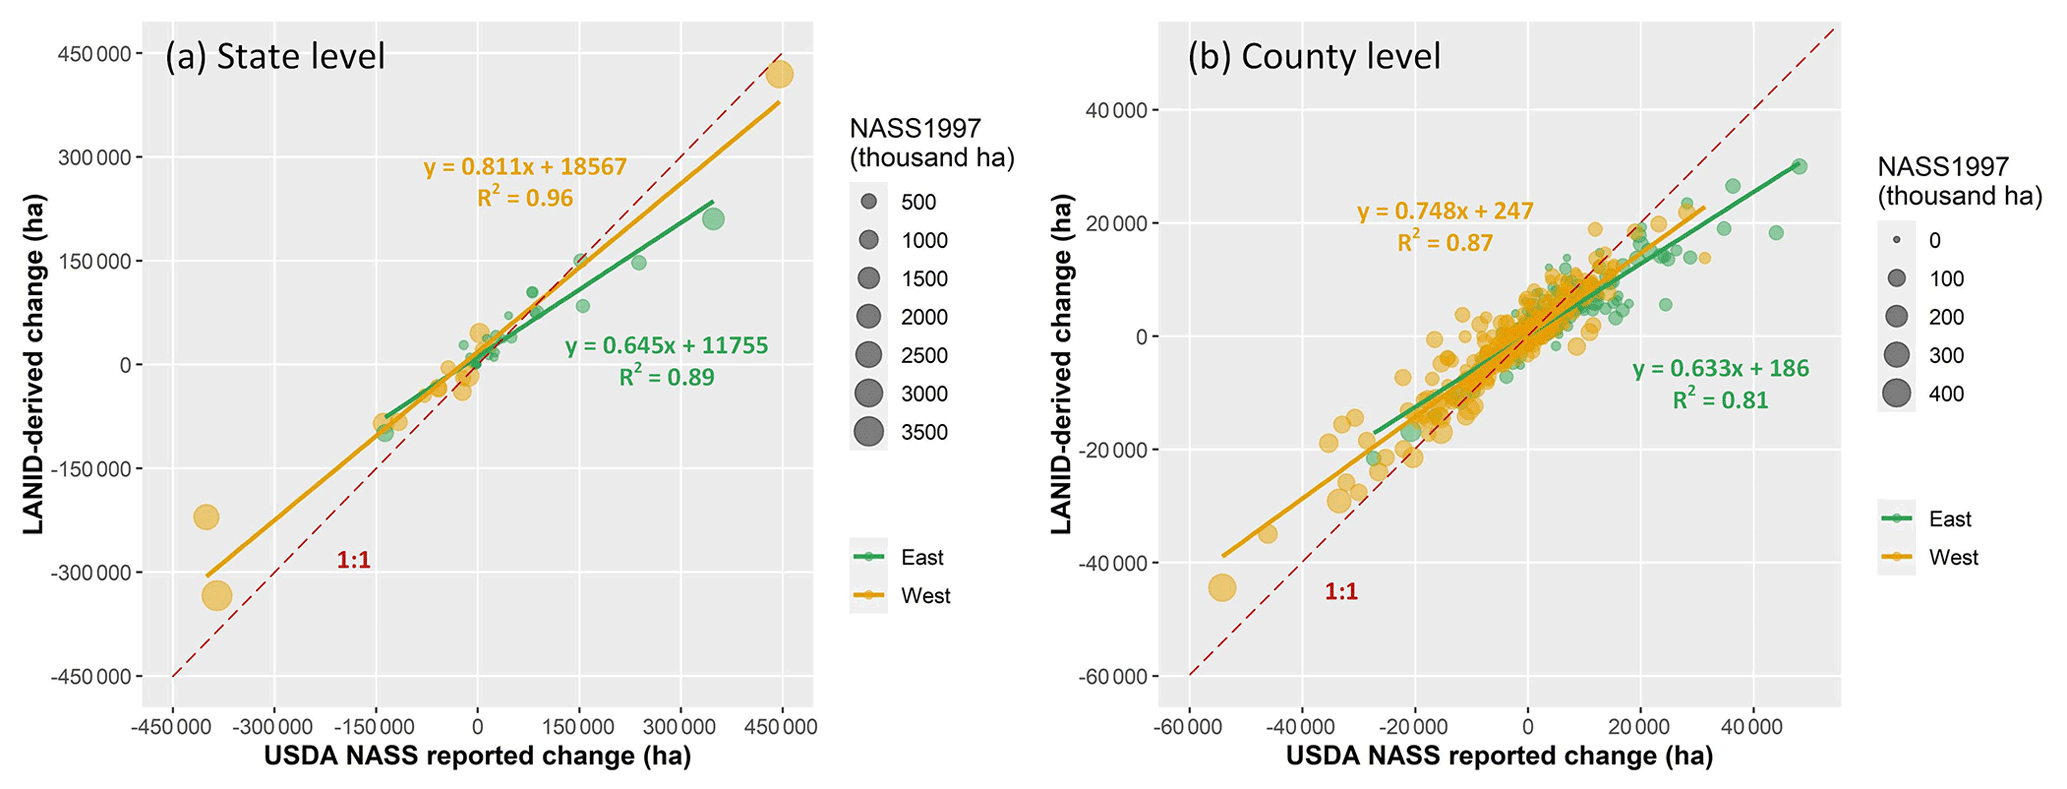
Figure 5LANID-derived irrigation changes vs. USDA-NASS-reported area at the state (a) and county (b) scales. Irrigation change was calculated as the difference between mean area of the years 2012 and 2017 and that of 1997 and 2002 (i.e., mean(irArea2012+irArea2017) − mean(irArea1997+irArea2002), where irAreayr refers to irrigation area of year). The USDA-NASS-reported values of 1997 are shown to represent irrigation area at the starting point of the study period.
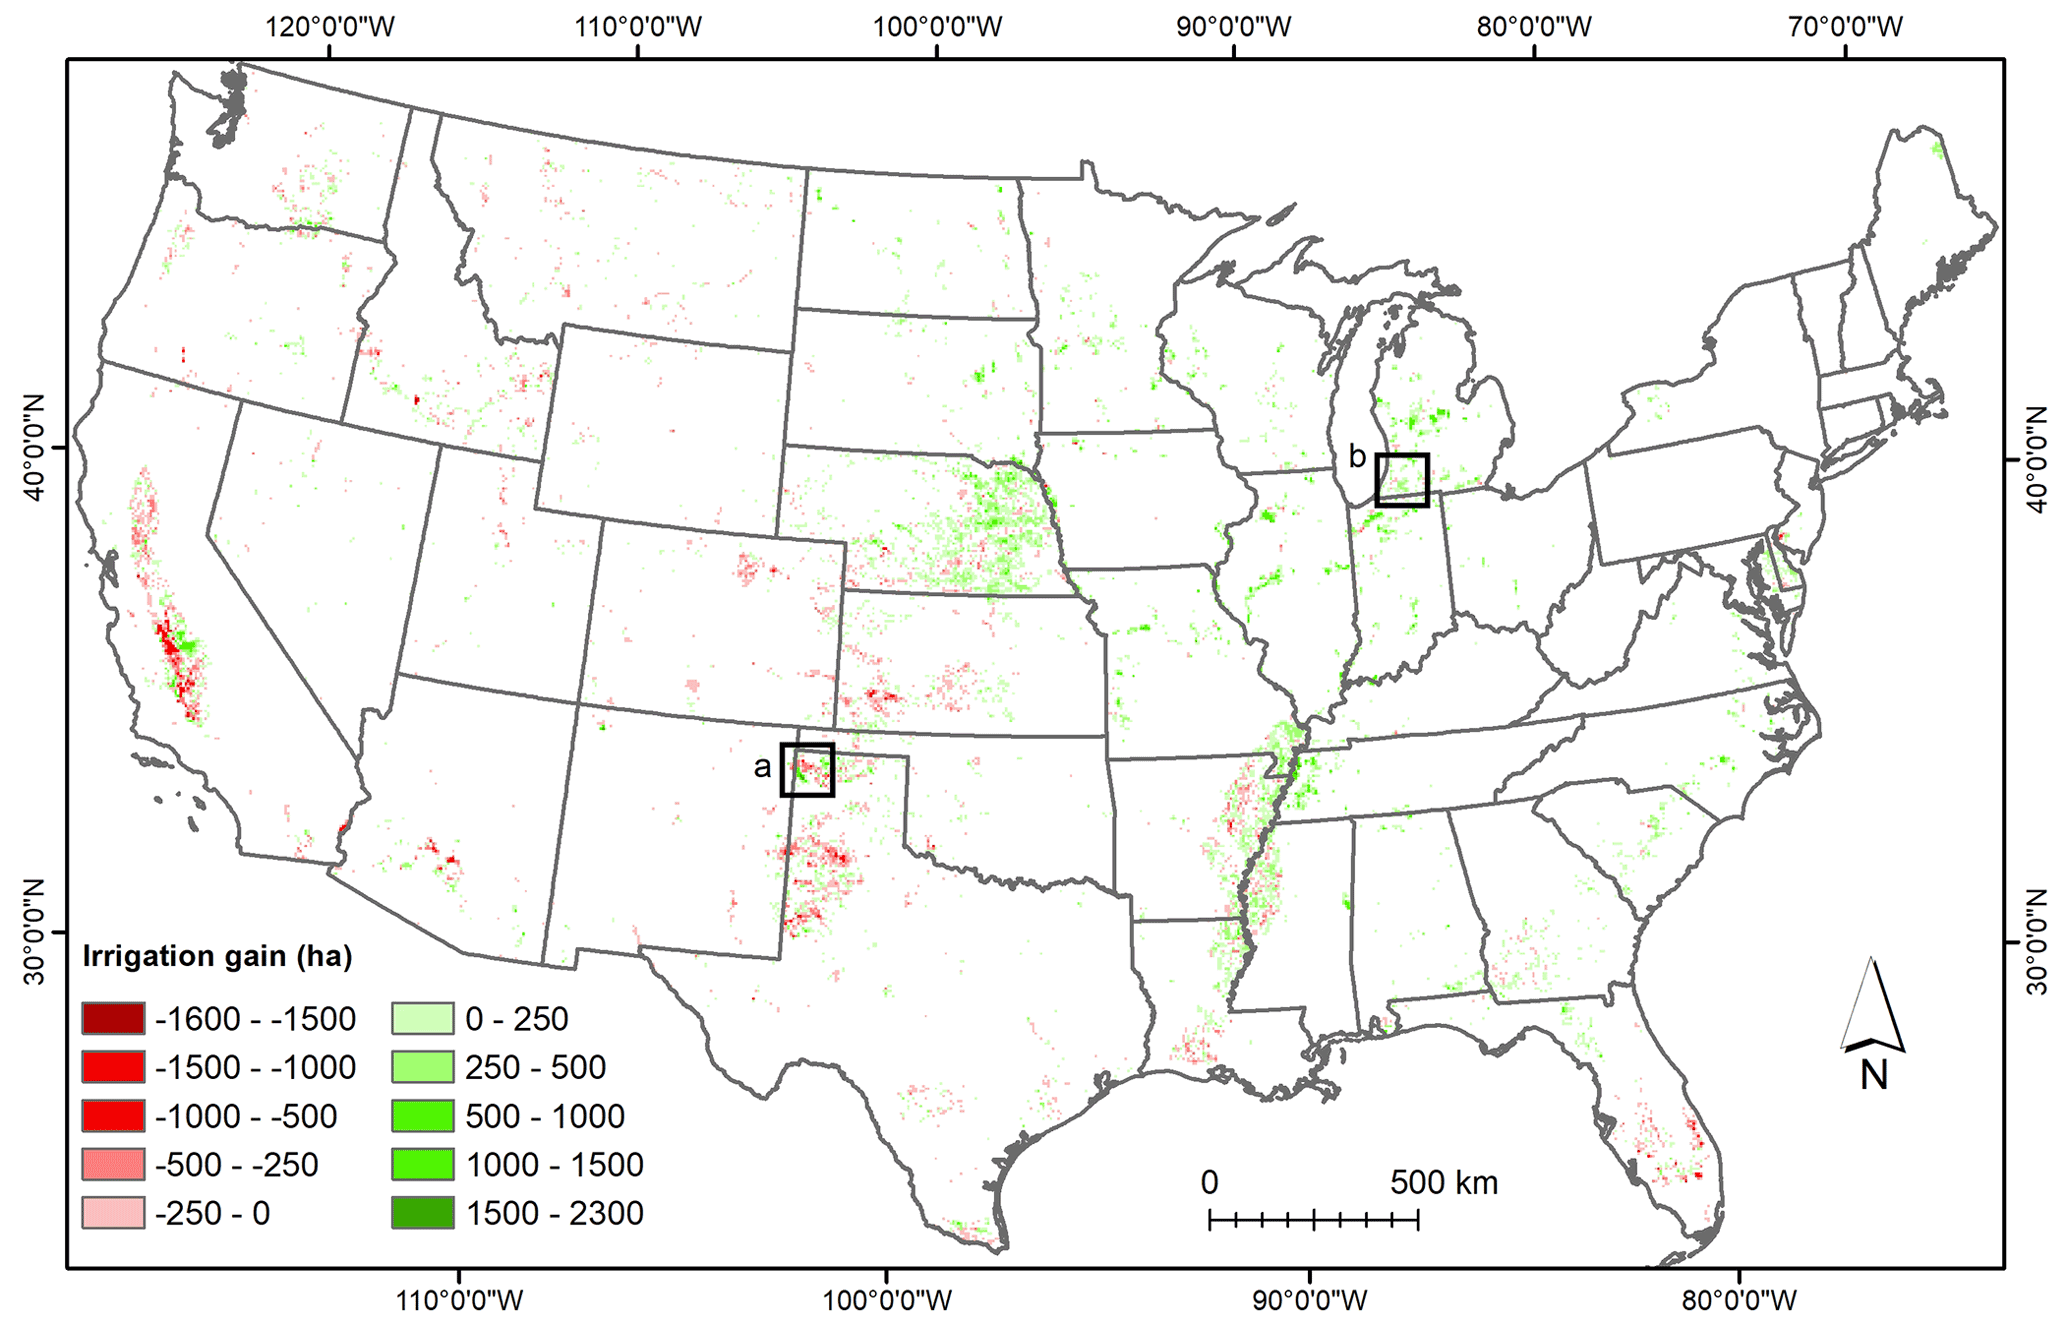
Figure 6LANID-derived irrigation gain from 1998–2007 to 2008–2017 at the 6 km×6 km scale. Per-grid value is calculated as the difference between mean irrigation area of 1998–2007 and that of 2008–2017 (i.e., meanIrArea2008−2017 − meanIrArea1998−2007, where irArea is LANID-aggregated irrigation area within a 6 km×6 km grid). Grids with absolute change <2.5 % are shown as background.
Ultimately, when applied at the highest resolution, our LANID maps can be used to reliably characterize irrigation dynamics at the sub-field- to field-level with overall accuracy and kappa index of 81 % and 0.62, respectively (Table 2). For instance, sub-field to field level expansions, losses, and interannual variations in irrigation that are detectable from LANID can be clearly observed in north Texas (Fig. 7a). Although such a level of change detection in more humid areas is not as effective as more arid states due to a weaker contrast between irrigated and rainfed fields, LANID still provides a reasonable and accurate characterization of irrigation change through time there as well, as shown in the example in Michigan (Fig. 7b).
Table 2Accuracy of change detection using LANID maps. Change is defined as frequency difference between the two sub-periods (i.e., 1998–2007 and 2008–2017) greater than 3, and the stable class refers to the value smaller than or equal to 3. Note non-agriculture is excluded from the stable class.
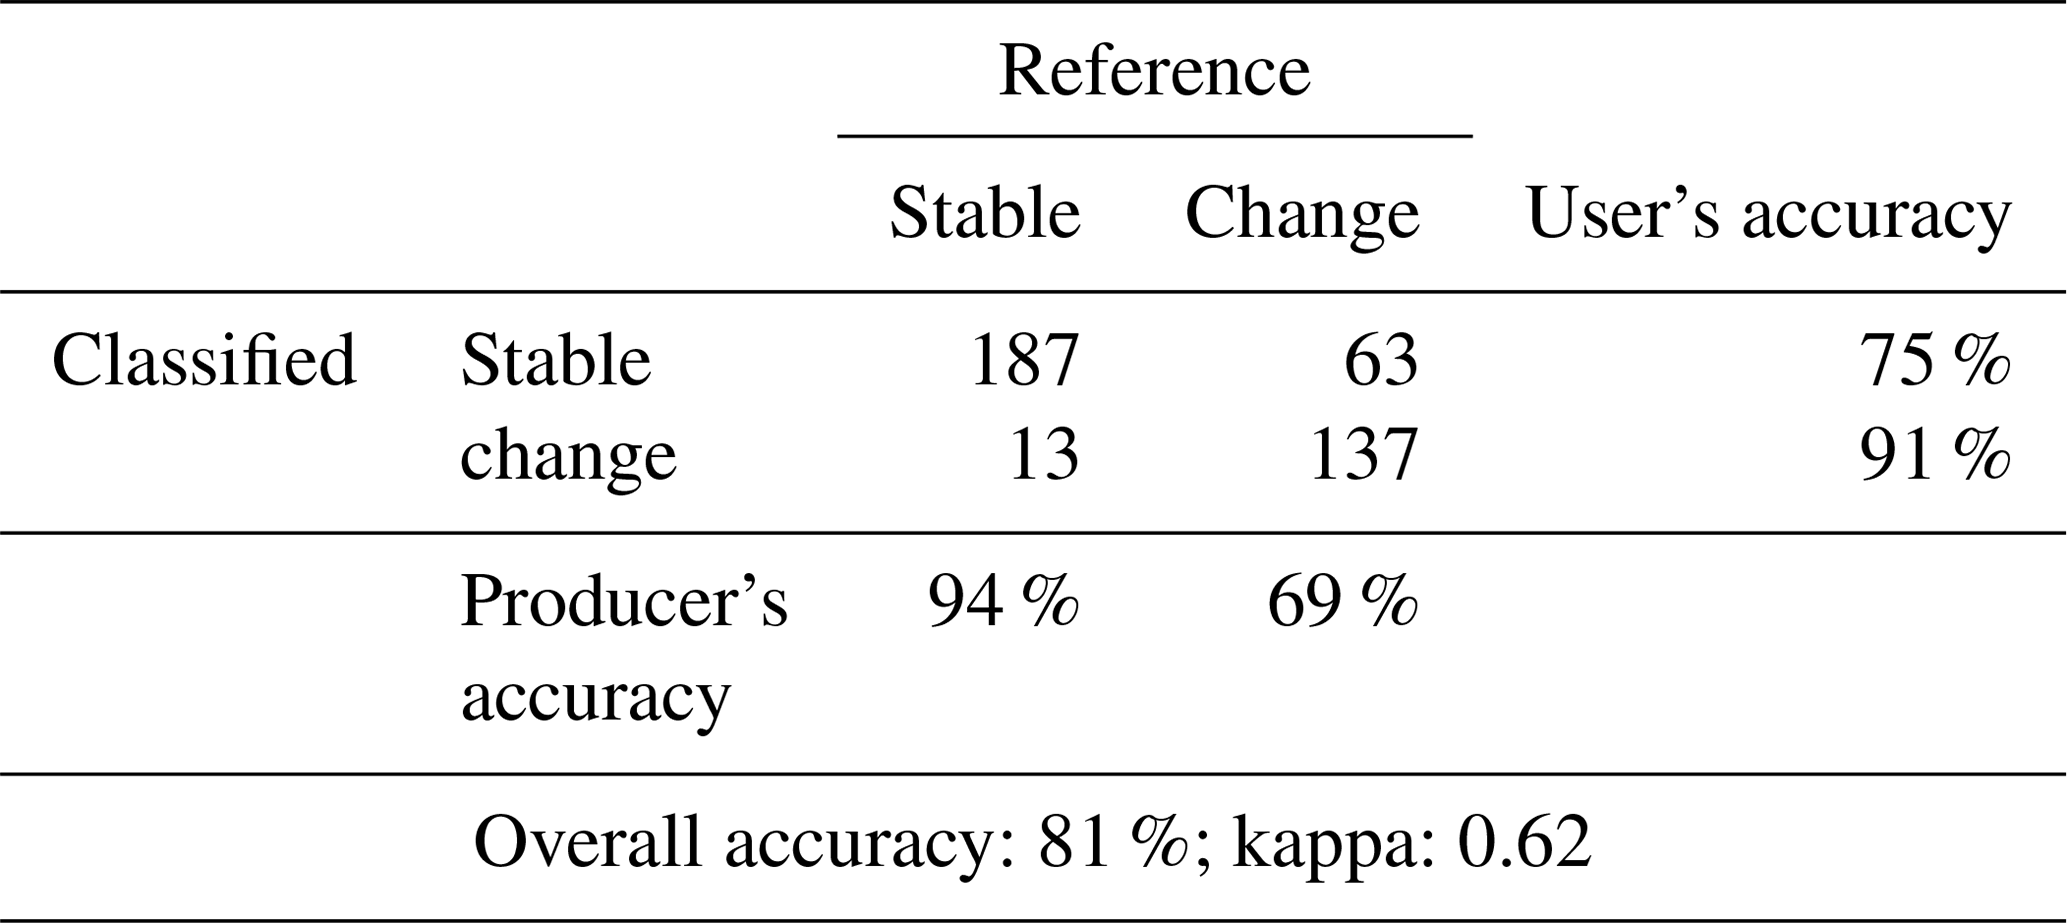
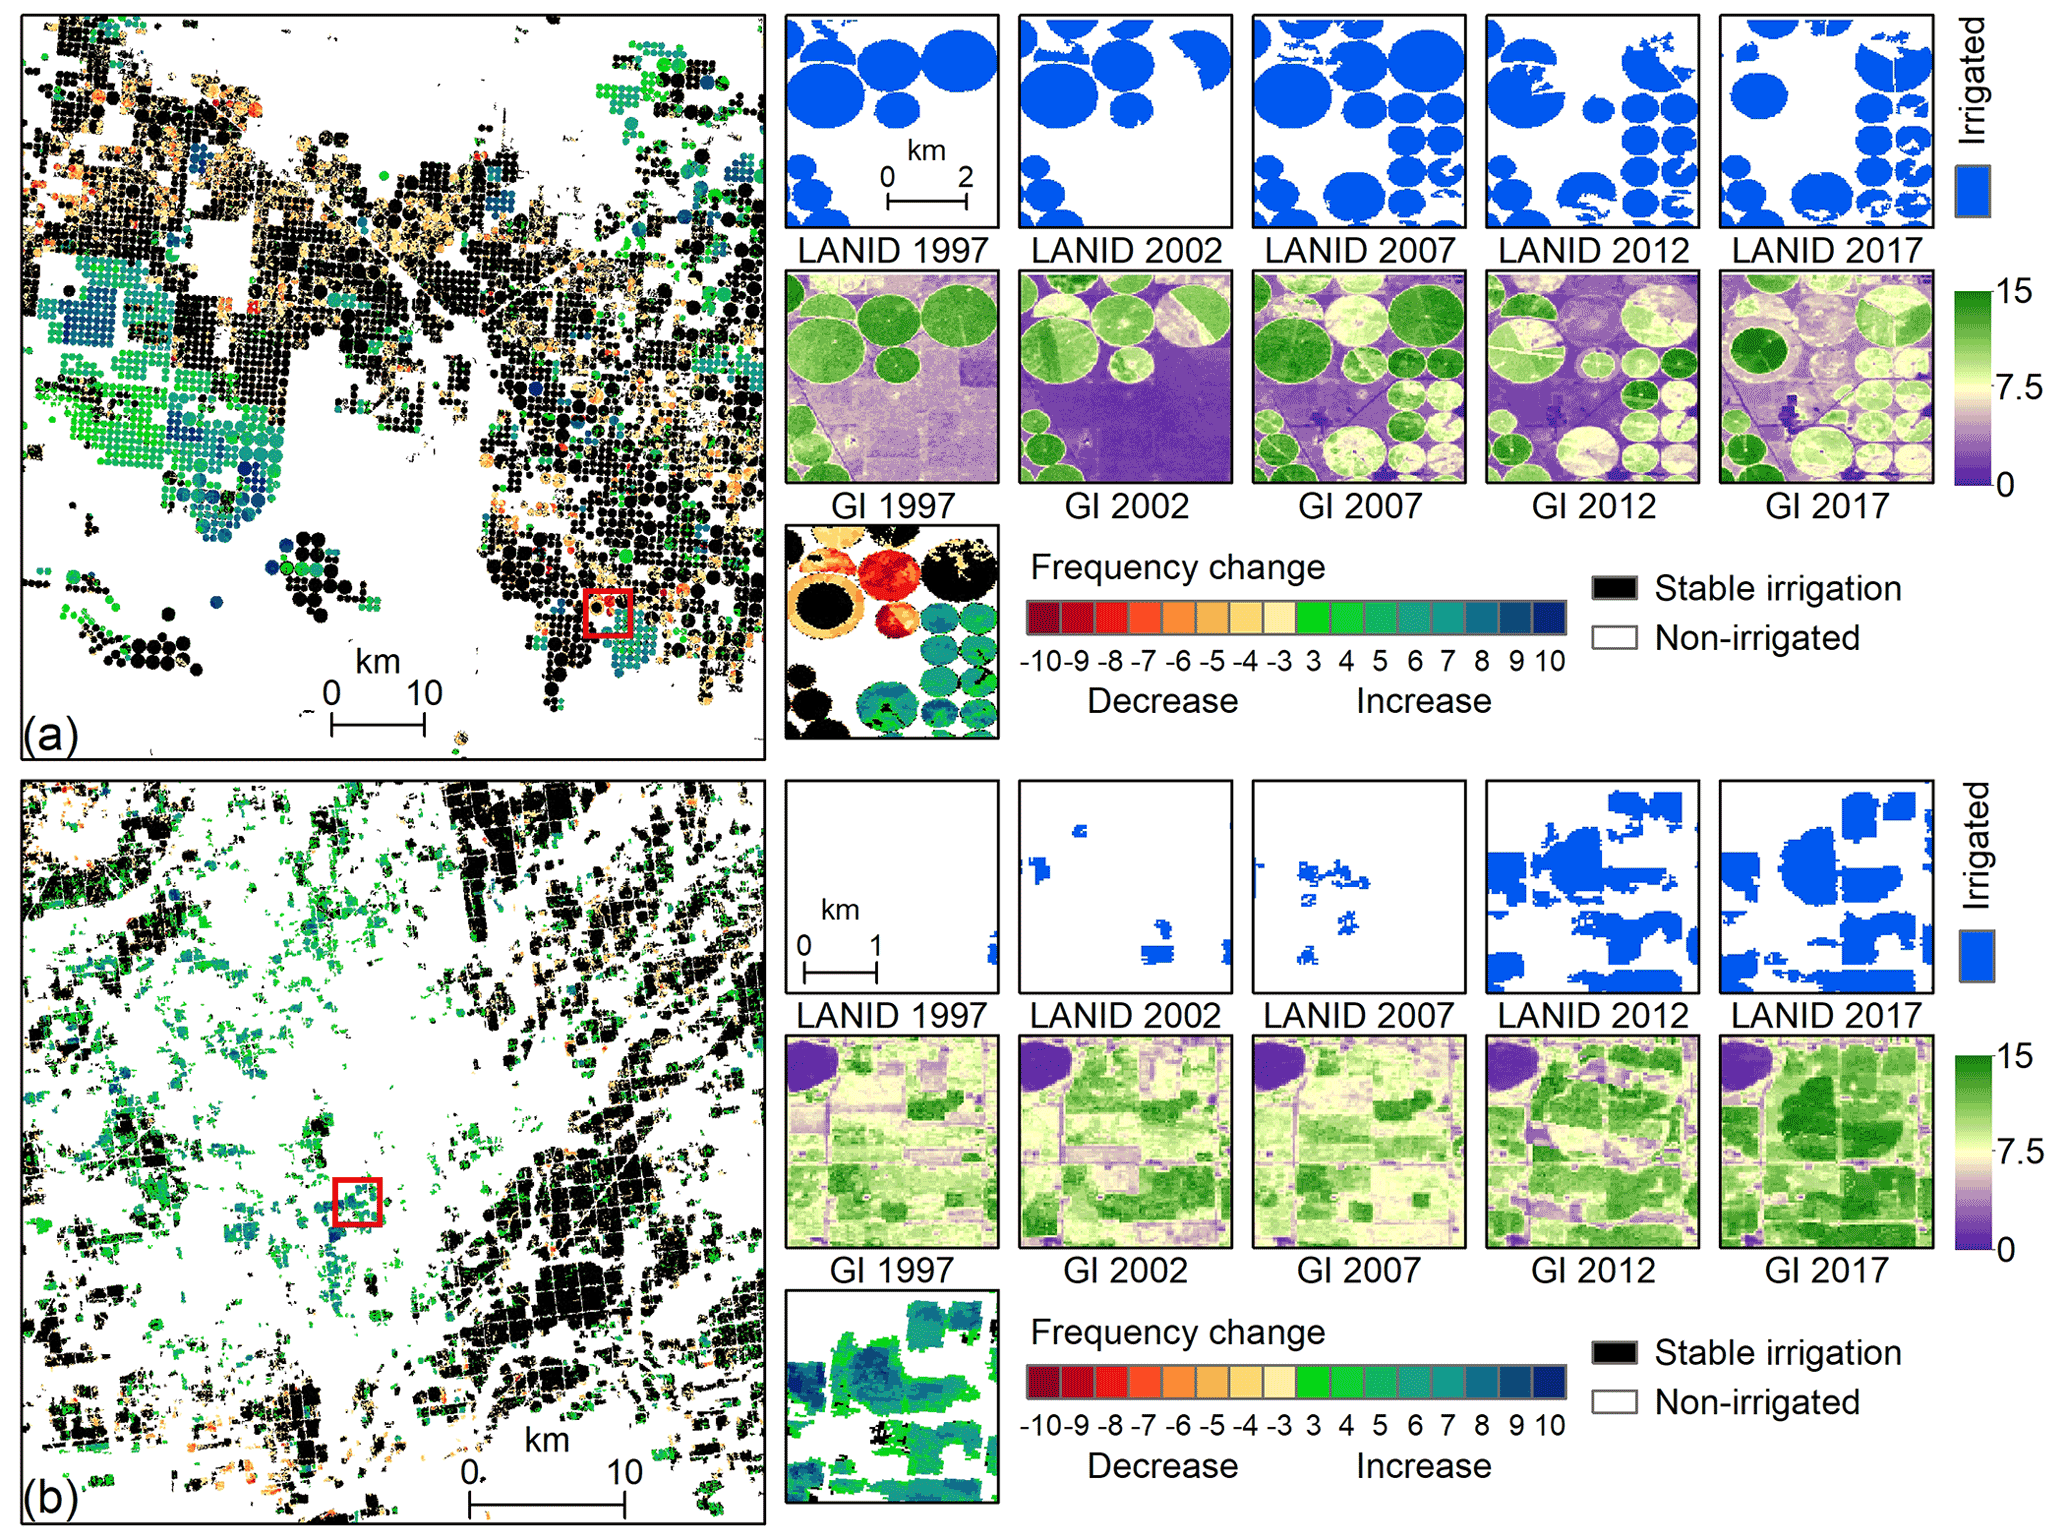
Figure 7Demonstration of LANID-derived field-level irrigation frequency change for the northern Texas (a) and southwestern Michigan (b) (highlighted in Fig. 6). Frequency change refers to the difference of number of years irrigated between 1998–2007 and that between 2008–2017 (i.e., irFreq2008−2017 − irFreq1998−2007, where irFreq is the number of years irrigated).
4.3 Irrigated pasture and hay
This study provides the first complete mapping and delineation of irrigated pasture and hay for the western US (Fig. 8). In this region, forage and fodder crops provide valuable feed for livestock, and irrigation is often necessary to cultivate certain species or attain viable yields. This contrasts with pasture and hay in the eastern states, where annual precipitation and soil moisture are typically sufficient for robust production of grass-based forage and fodder. Areas of irrigated pasture and hay have a pattern of land use distinct from that of irrigated croplands, as well as unique implications for water use and the environment.

Figure 8Distribution of irrigated pasture and hay derived from LANID_V2 (presented in this study) in the western CONUS. The overview shows irrigation frequency (i.e., the number of years a pixel is irrigated during 1997–2017). The highlighted areas in the red rectangles represent areas of intensively irrigated pasture and hay that were not completely mapped in LANID_V1. Panels (a) and (b) are examples of local views for western Wyoming and northeastern Nevada, respectively.
Compared to the first version of LANID, which did not explicitly include irrigated pasture–hay, we found an average of 0.34 Mha more irrigated land (i.e., more irrigated pasture and hay included in LANID_V2 compared to LANID_V1) for the years 2013 to 2017 and a similarly larger amount (0.36 Mha) since the start of the study period. This increase in irrigated extent is lower than that of the USDA census of Agriculture's estimate of 1 Mha of irrigated pasture – the only other spatial (but coarse) estimate of such irrigated land use (Sanderson et al., 2012). The difference between our annual estimates and that of the census data likely reflects the fact that a large portion of irrigated pasture and hay (especially alfalfa) had already been mapped in the first version of LANID. To confirm this, we further calculated a direct estimate of only irrigated pasture–hay as all irrigated pixels classified as pasture or hay in the NLCD or CDL and estimated an average area of 1.39 Mha across the years 2008, 2011, 2013, and 2016. This estimate is 0.39 Mha higher than the 1 Mha reported by the Census of Agricultural but includes both pasture and hay, whereas the census estimate is for pasture only.
4.4 Maximum extent, frequency, and formerly and intermittently irrigated land
Across all types of irrigation – including cultivated cropland and pasture and hay – a total of 38.5 Mha of land was irrigated at least one time between 1997 and 2017, representing the maximum irrigated extent in the US for our study period (Fig. 9a and Table 3). Of these areas, just 24.2 Mha (62.8 %) was irrigated in 2017, and this annual utilization percentage ranged from 58.8 % to 64.0 % over the full study period. Across all pixels within the maximum irrigated extent, the mean annual irrigated frequency was 12.9 out of 21 years (Fig. 9b). The distribution of irrigated frequency suggests many areas consist of stable, persistent irrigation but that there also exists a substantial amount of land with intermittent irrigation use. Those pixels with the very lowest irrigation frequency likely reflect locations where irrigation ceased very early in the study period or was first initiated very late in the study period, and/or areas of potential misclassification.

Figure 9The maximum irrigation extent (lands that have been irrigated at least once) and irrigation frequency (the number of irrigated years) across the CONUS for the period 1997–2017. The inset in (b) shows the area of each frequency value.
Table 3Statistics of irrigation area (in 106 ha) across the CONUS for the period 1997–2017.
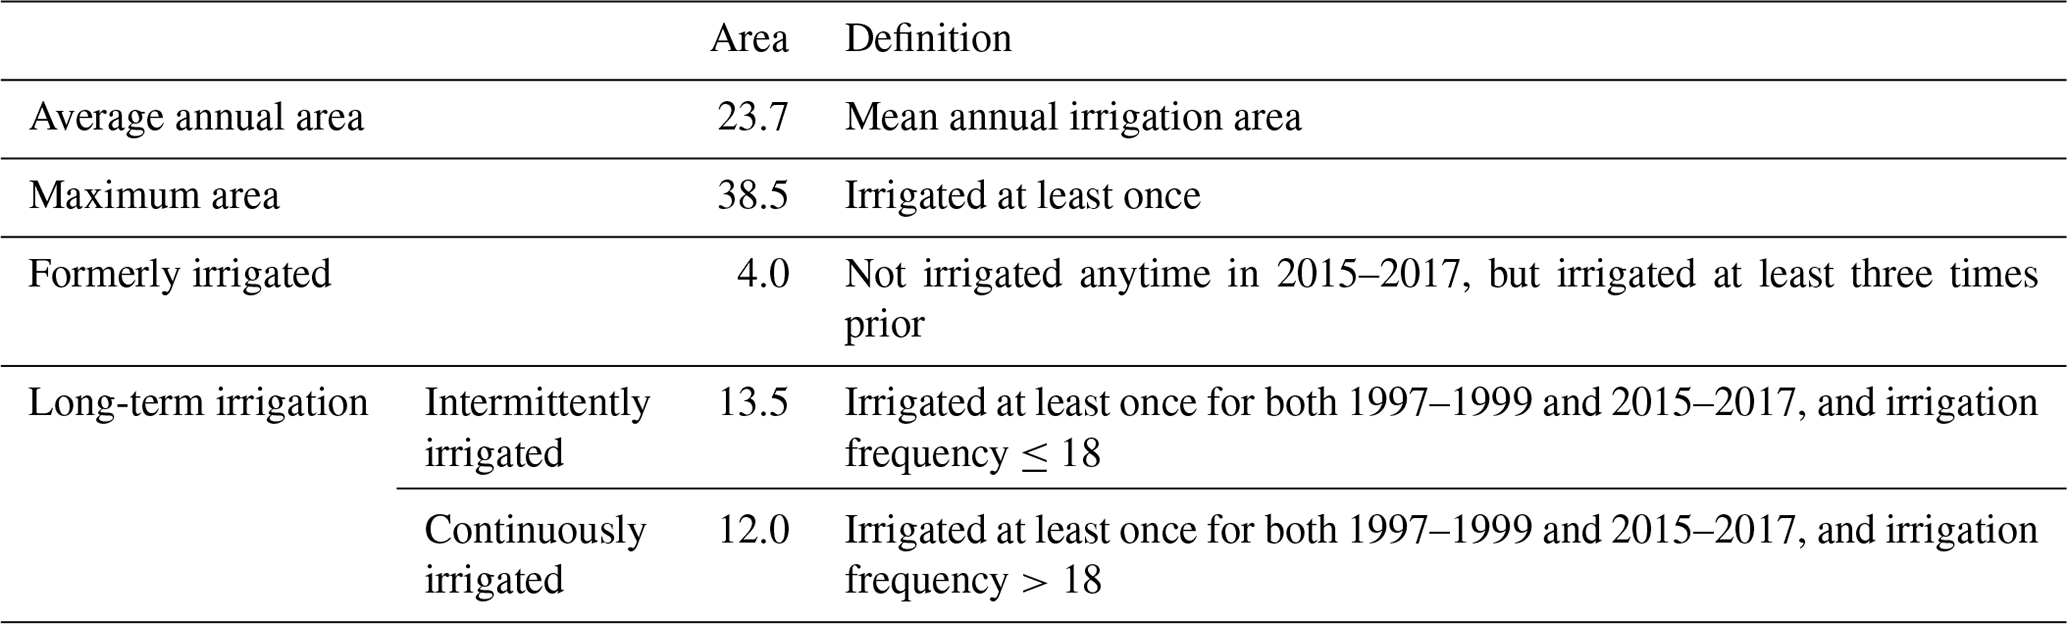
Looking at the subset of lands that are no longer irrigated, we found 4 Mha of formerly irrigated land (i.e., not irrigated anytime in the most recent 3 years, 2015–2017, but that was irrigated at least three times prior) (Table 3). This formerly irrigated land is primarily distributed across the western states (as shown in Fig. 6) and may reflect areas where insufficient water availability has limited the ongoing use, or where salination of soils, socioeconomic drivers, or other superseding factors have resulted in a cessation of irrigated agriculture. Of these formerly irrigated areas, 71.6 % remains in crop production under rainfed conditions, primarily planted for corn (13.2 %), soybeans (12.3 %), and spring–winter wheat (12.2 %) as of 2017. The remaining locations have either been abandoned from cultivated crop production altogether (26.3 %) or converted to urban use (2.1 %). Those areas for which an irrigated crop is no longer viable may represent an opportunity for farmers to transition to grassland-based agriculture (Deines et al., 2020), for example via the introduction of pasture for livestock grazing or the harvesting of biomass for use as forage or cellulosic bioenergy feedstock (Robertson et al., 2017). As climate change and decreasing freshwater availability continue to strain water resources, the total area of formerly irrigated lands is likely to increase, thereby creating even further opportunity and greater need for alternative drought-resistant agricultural opportunities, such as those afforded by perennial feedstock production.
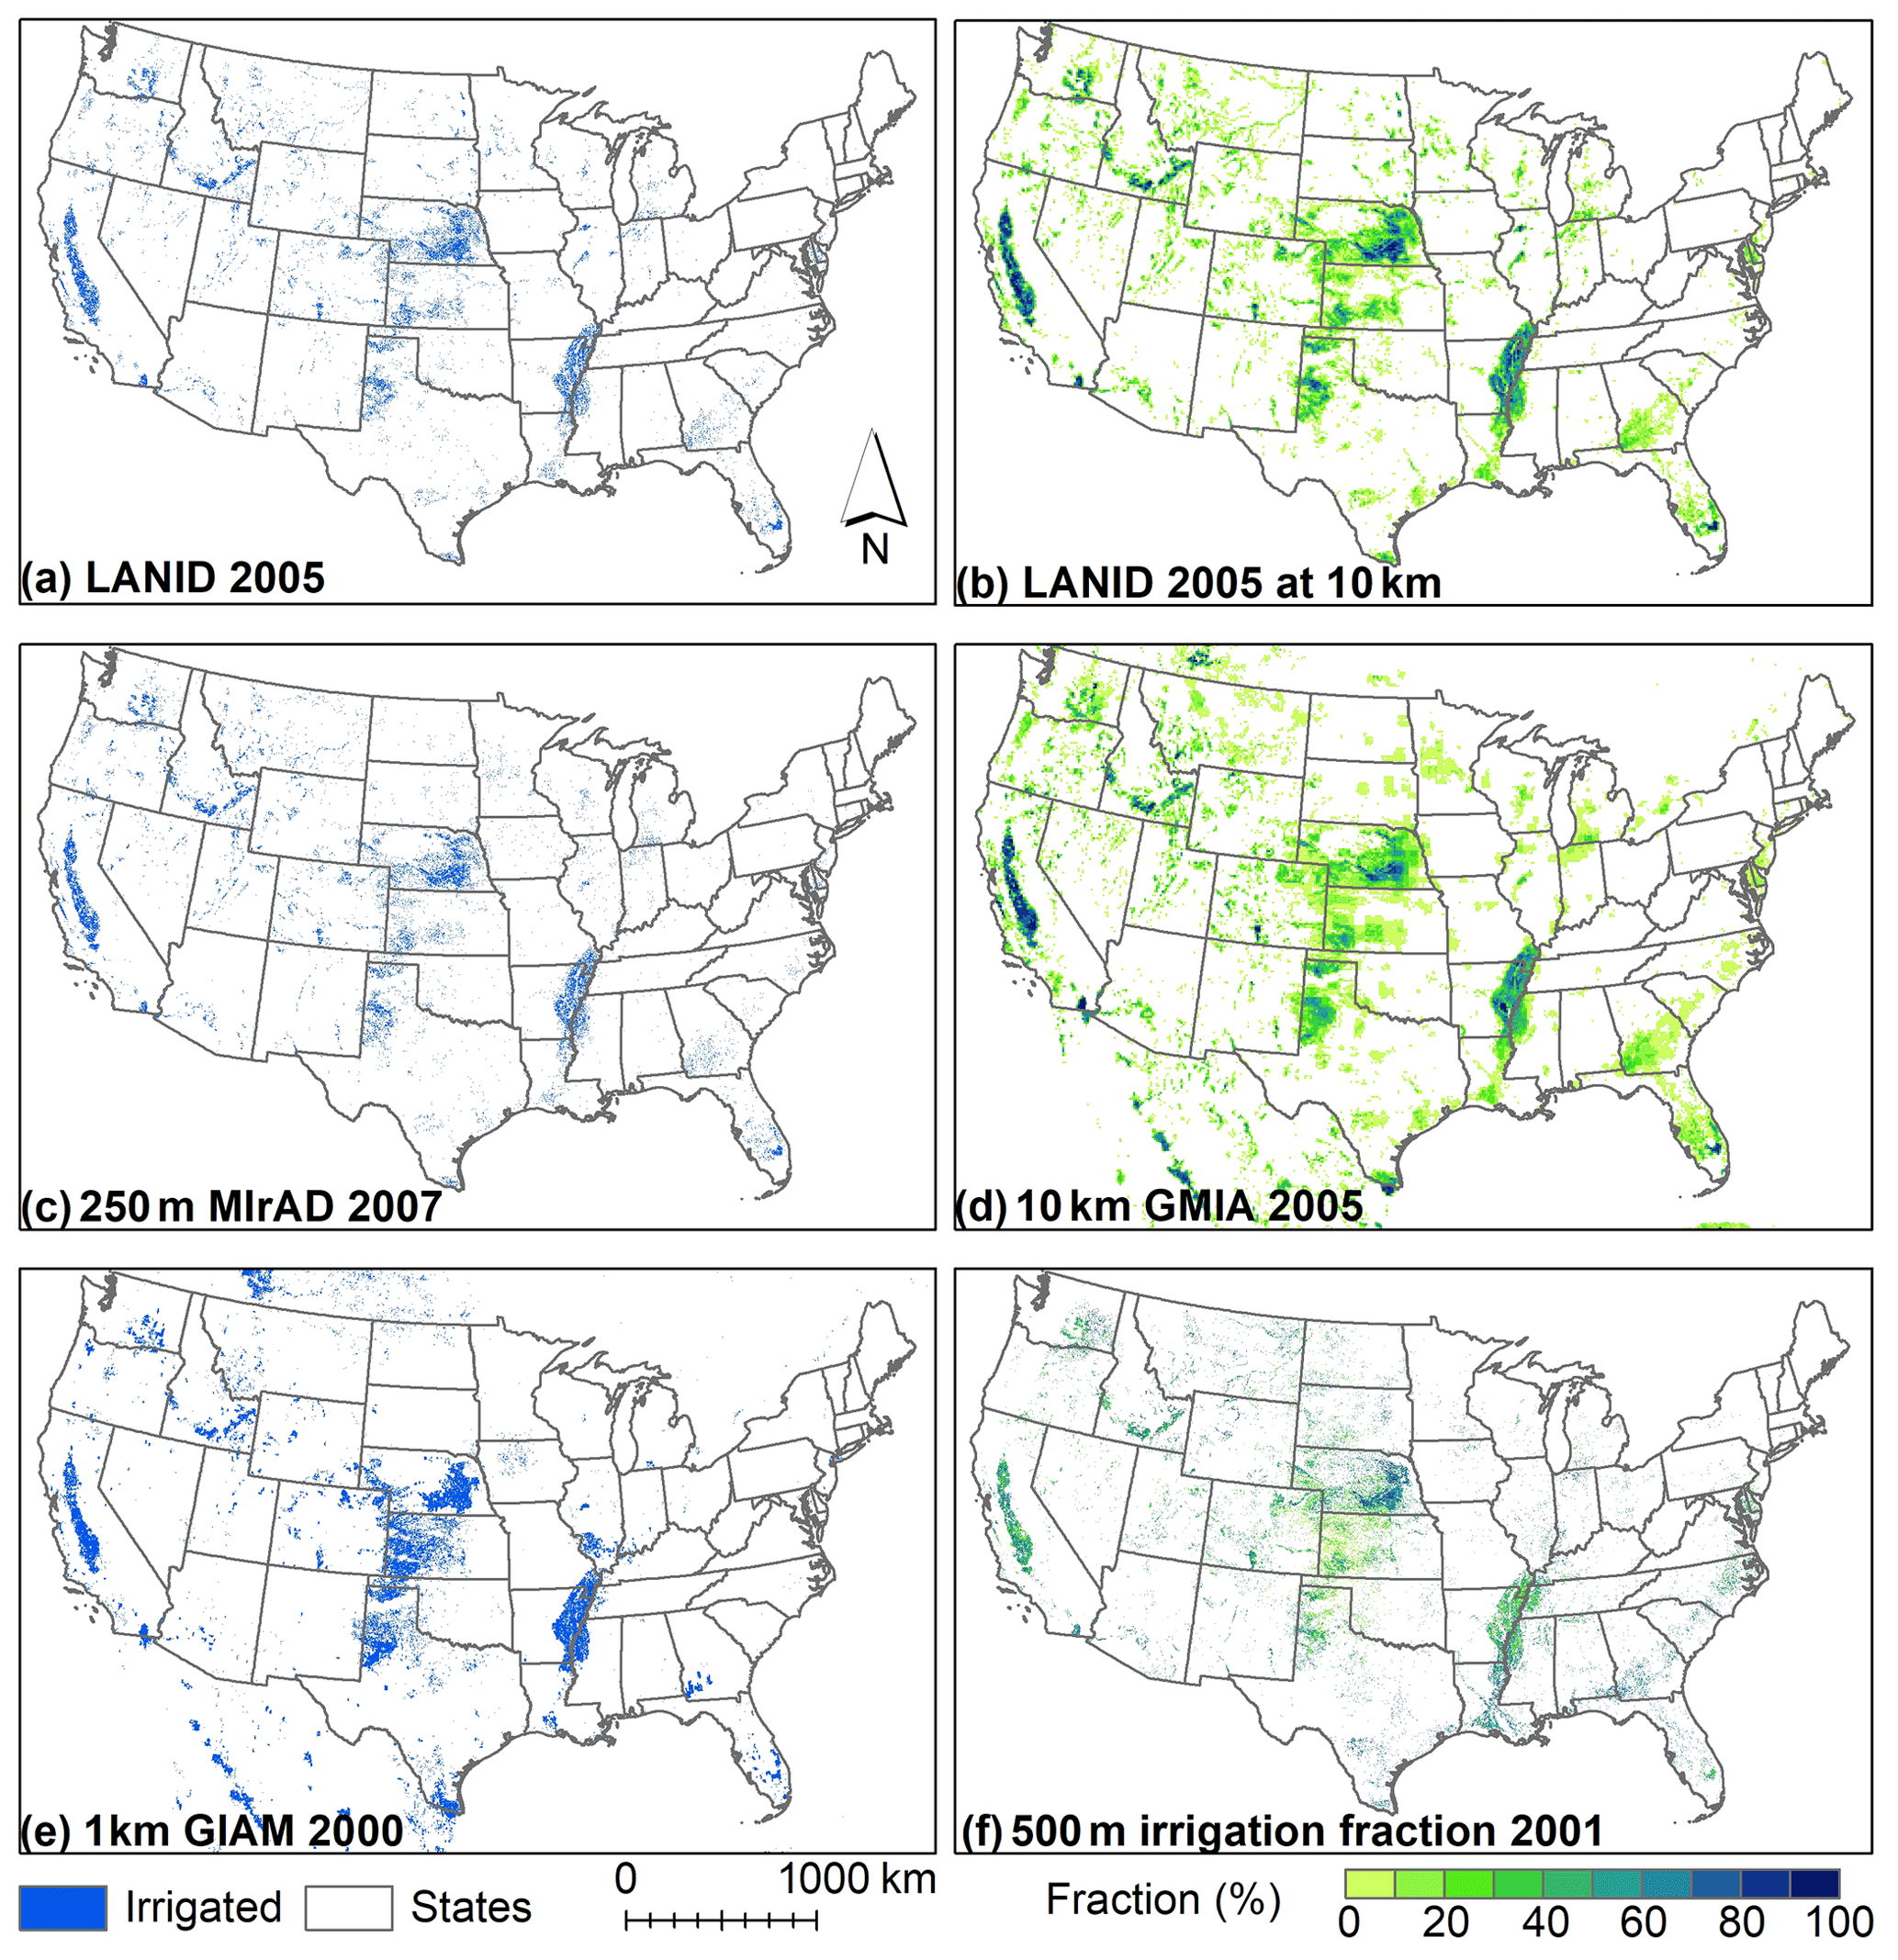
Figure 10Nationwide views of different irrigation mapping products. LANID 2005 is aggregated to 1 (a) and 10 km (d) resolution for comparison purposes. The LANID-derived irrigation frequency refers to the number of years a pixel is classified as “irrigated”.
In addition to those locations where irrigation has ceased completely, we observed a substantial amount of land where irrigation remained active in the most recent years but where its use across time was discontinuous. For example, we found 25.5 Mha of land across the CONUS that had been irrigated spanning the whole study period (i.e., irrigated at least once for both 1997–1999 and 2015–2017), where over half of that subset (i.e., 13.5 Mha) could be best described as intermittently irrigated (frequency ≤ 18) (Table 3). As opposed to those locations with continuous annual irrigation use or where irrigation has ceased altogether, these intermittently irrigated lands appear to remain in irrigated agriculture today yet rely on such irrigation use just 67 % (median value) of the time across the 21-year study period. While further investigation is needed to better characterize these areas of partial irrigation use over time, it may be possible that they represent locations where irrigation is only supplemental (e.g., used only in dry years or when needed), shared among a single water source but rotated among multiple nearby fields, or used only in years with sufficient water availability or water application rights and allocations. Similar to formerly irrigated lands, these locations of intermittent irrigation application may present areas of opportunity or economic need for alternative rainfed agriculture in non-irrigated years. In such cases, drought-tolerant annual crops like forage or energy sorghum could potentially provide economic opportunities for producers and limited further strain on local hydrology (Enciso et al., 2015; Mullet et al., 2014; Cui et al., 2018).
4.5 Comparisons with existing products
Figure 10 presents the nationwide view of a single year LANID as well as other irrigation-specific products. The 30 m LANID 2005 map was aggregated to 10 km resolution (Fig. 10b) for comparing with other coarser-resolution maps. Across broad scales, all maps show similar irrigation hotspots of the High Plains aquifer, the Central Valley aquifer, the Mississippi Alluvial Plain, the Snake River aquifer, and the East Coast. While it might be reasonable to conclude that all these coarse-resolution maps can capture similar irrigation patterns at the national scale, regional views emphasize the details that are uniquely captured by LANID. For instance, LANID identifies fewer irrigated pixels at the eastern Columbia Plateau aquifer than other maps, especially compared to MIF and GIAM (Fig. 11). In another example of the High Plains aquifer, GIAM and MIF substantially overestimate irrigation extent in western and central Kansas compared to both LANID and MIrAD (Fig. 12). Among all comparison products, MIrAD provides the most similarity of irrigation patterns as LANID in the arid to semi-arid west and Midwest.

Figure 11Product comparison at the Columbia Plateau Aquifer in northern Oregon and southern Washington. In addition to the original 30 m LANID (a), the map is aggregated to 1 and 10 km resolution for panels (d) and (g). Panels (h–i) show the location highlighted in (a) (red rectangle).
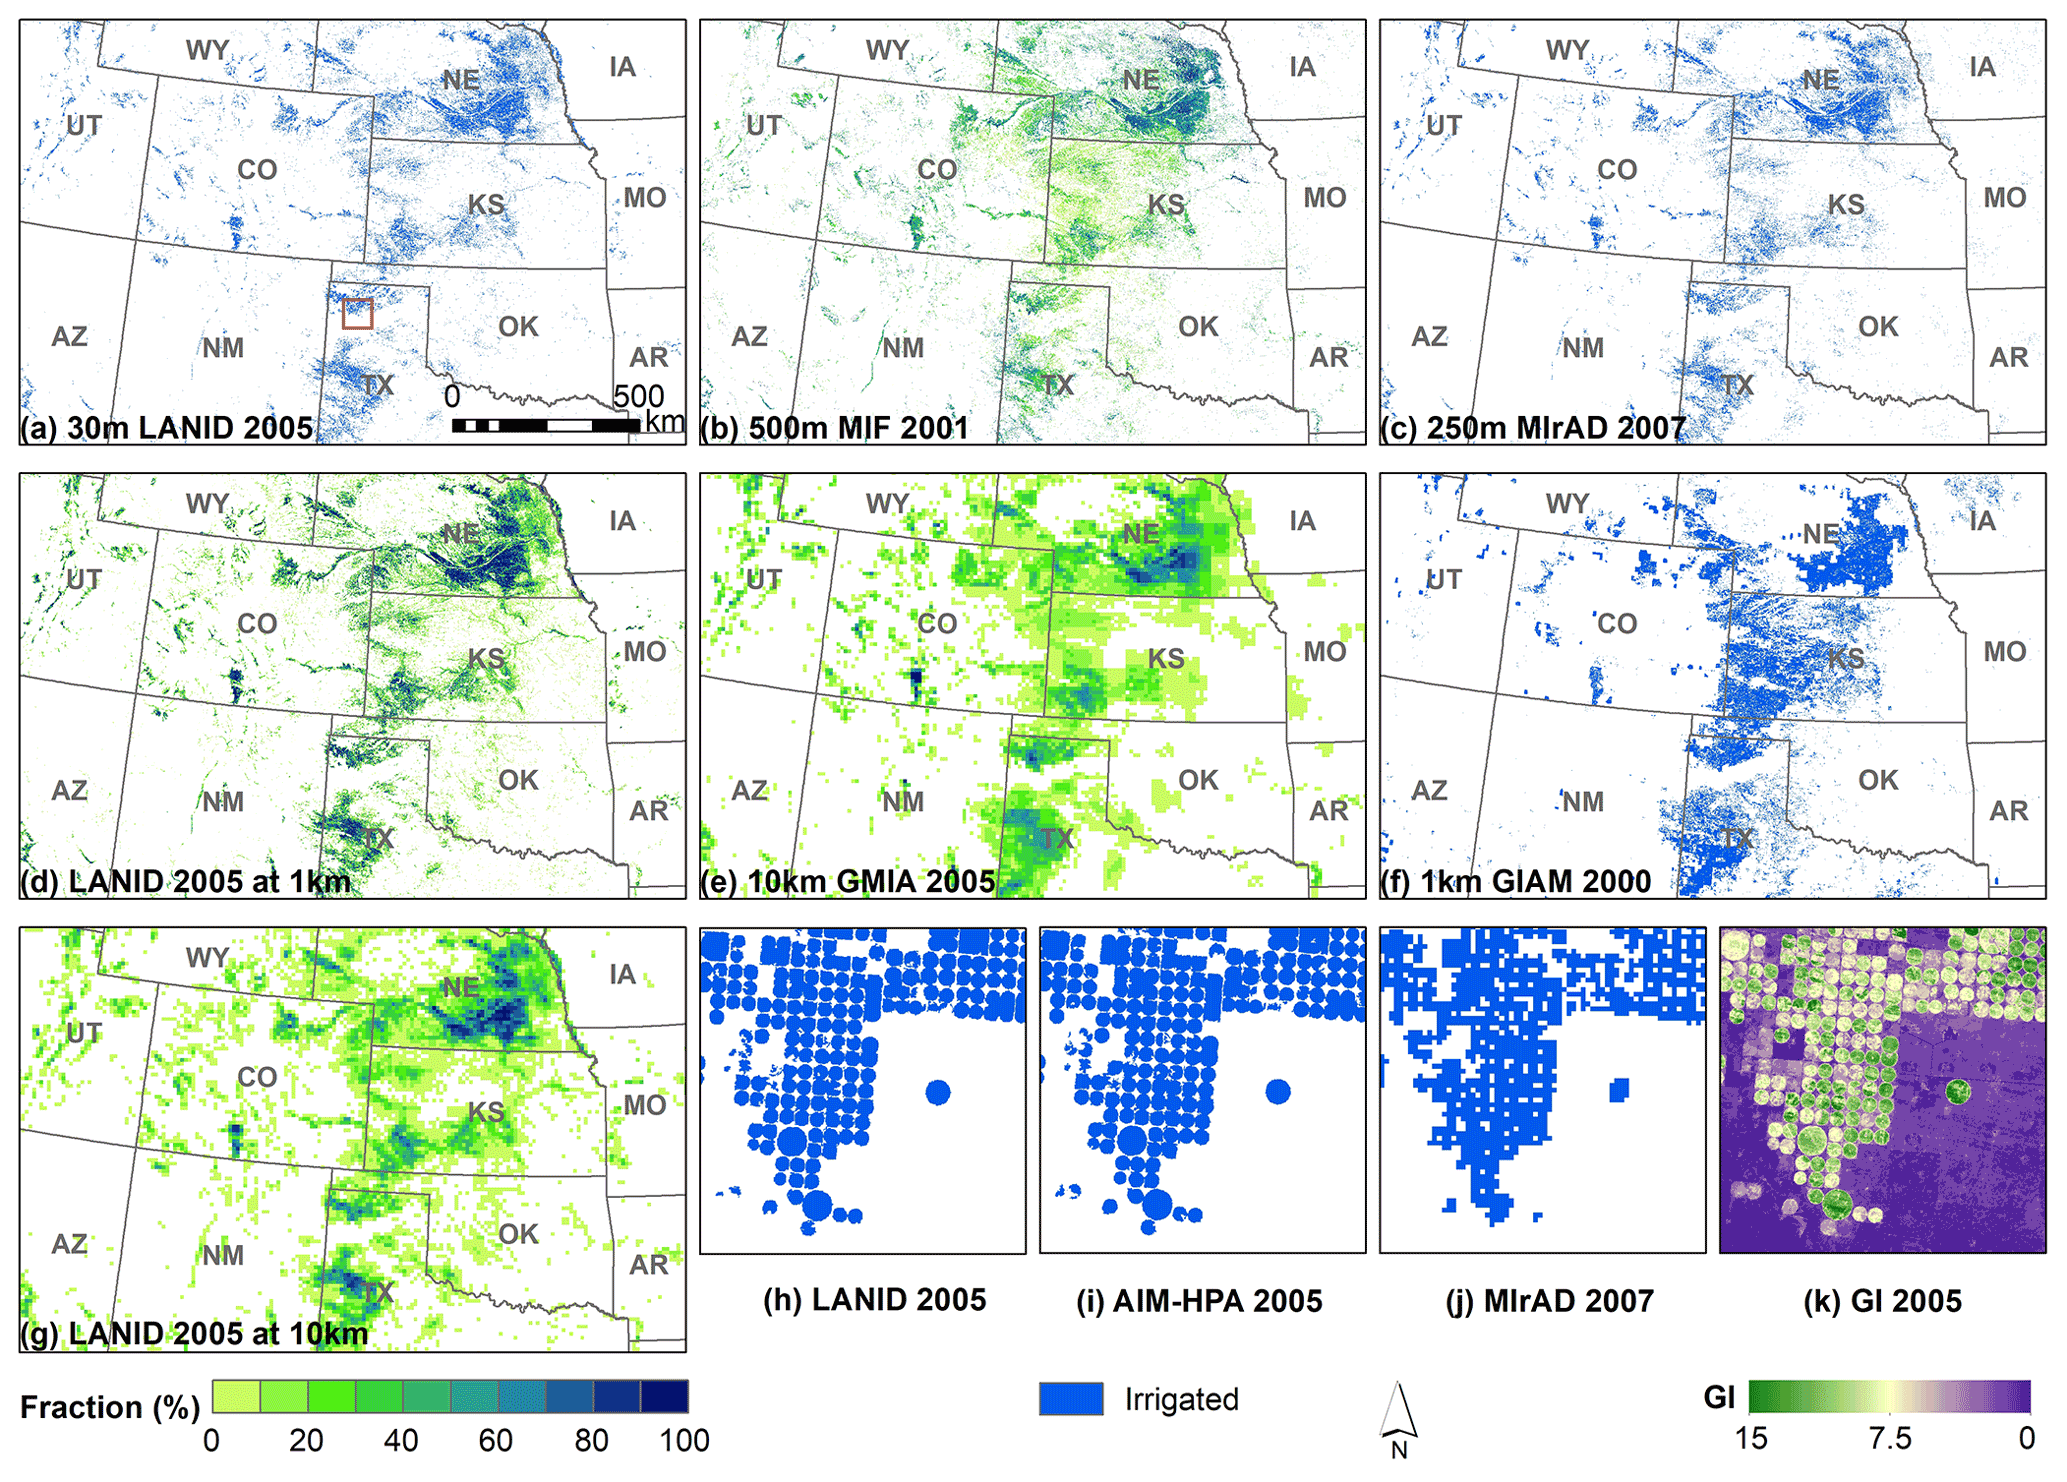
Figure 12Product comparison at the High Plains aquifer. In addition to the original 30 m LANID (a), the map is aggregated to 1 and 10 km resolution for panels (d) and (g). Panels (h–i) show the location highlighted in (a) (red rectangle).
In more humid areas like the upper Midwest, our LANID map captures patterns that are considerably misclassified by other maps (Fig. 13). For example, GIAM and MIF omit the majority of irrigated fields in the region; MIrAD shows a clear administrative boundary effect and near-random distribution of irrigation within each county. At 10 km resolution, GMIA provides similar patterns as LANID but exaggerates the overall irrigation extent.
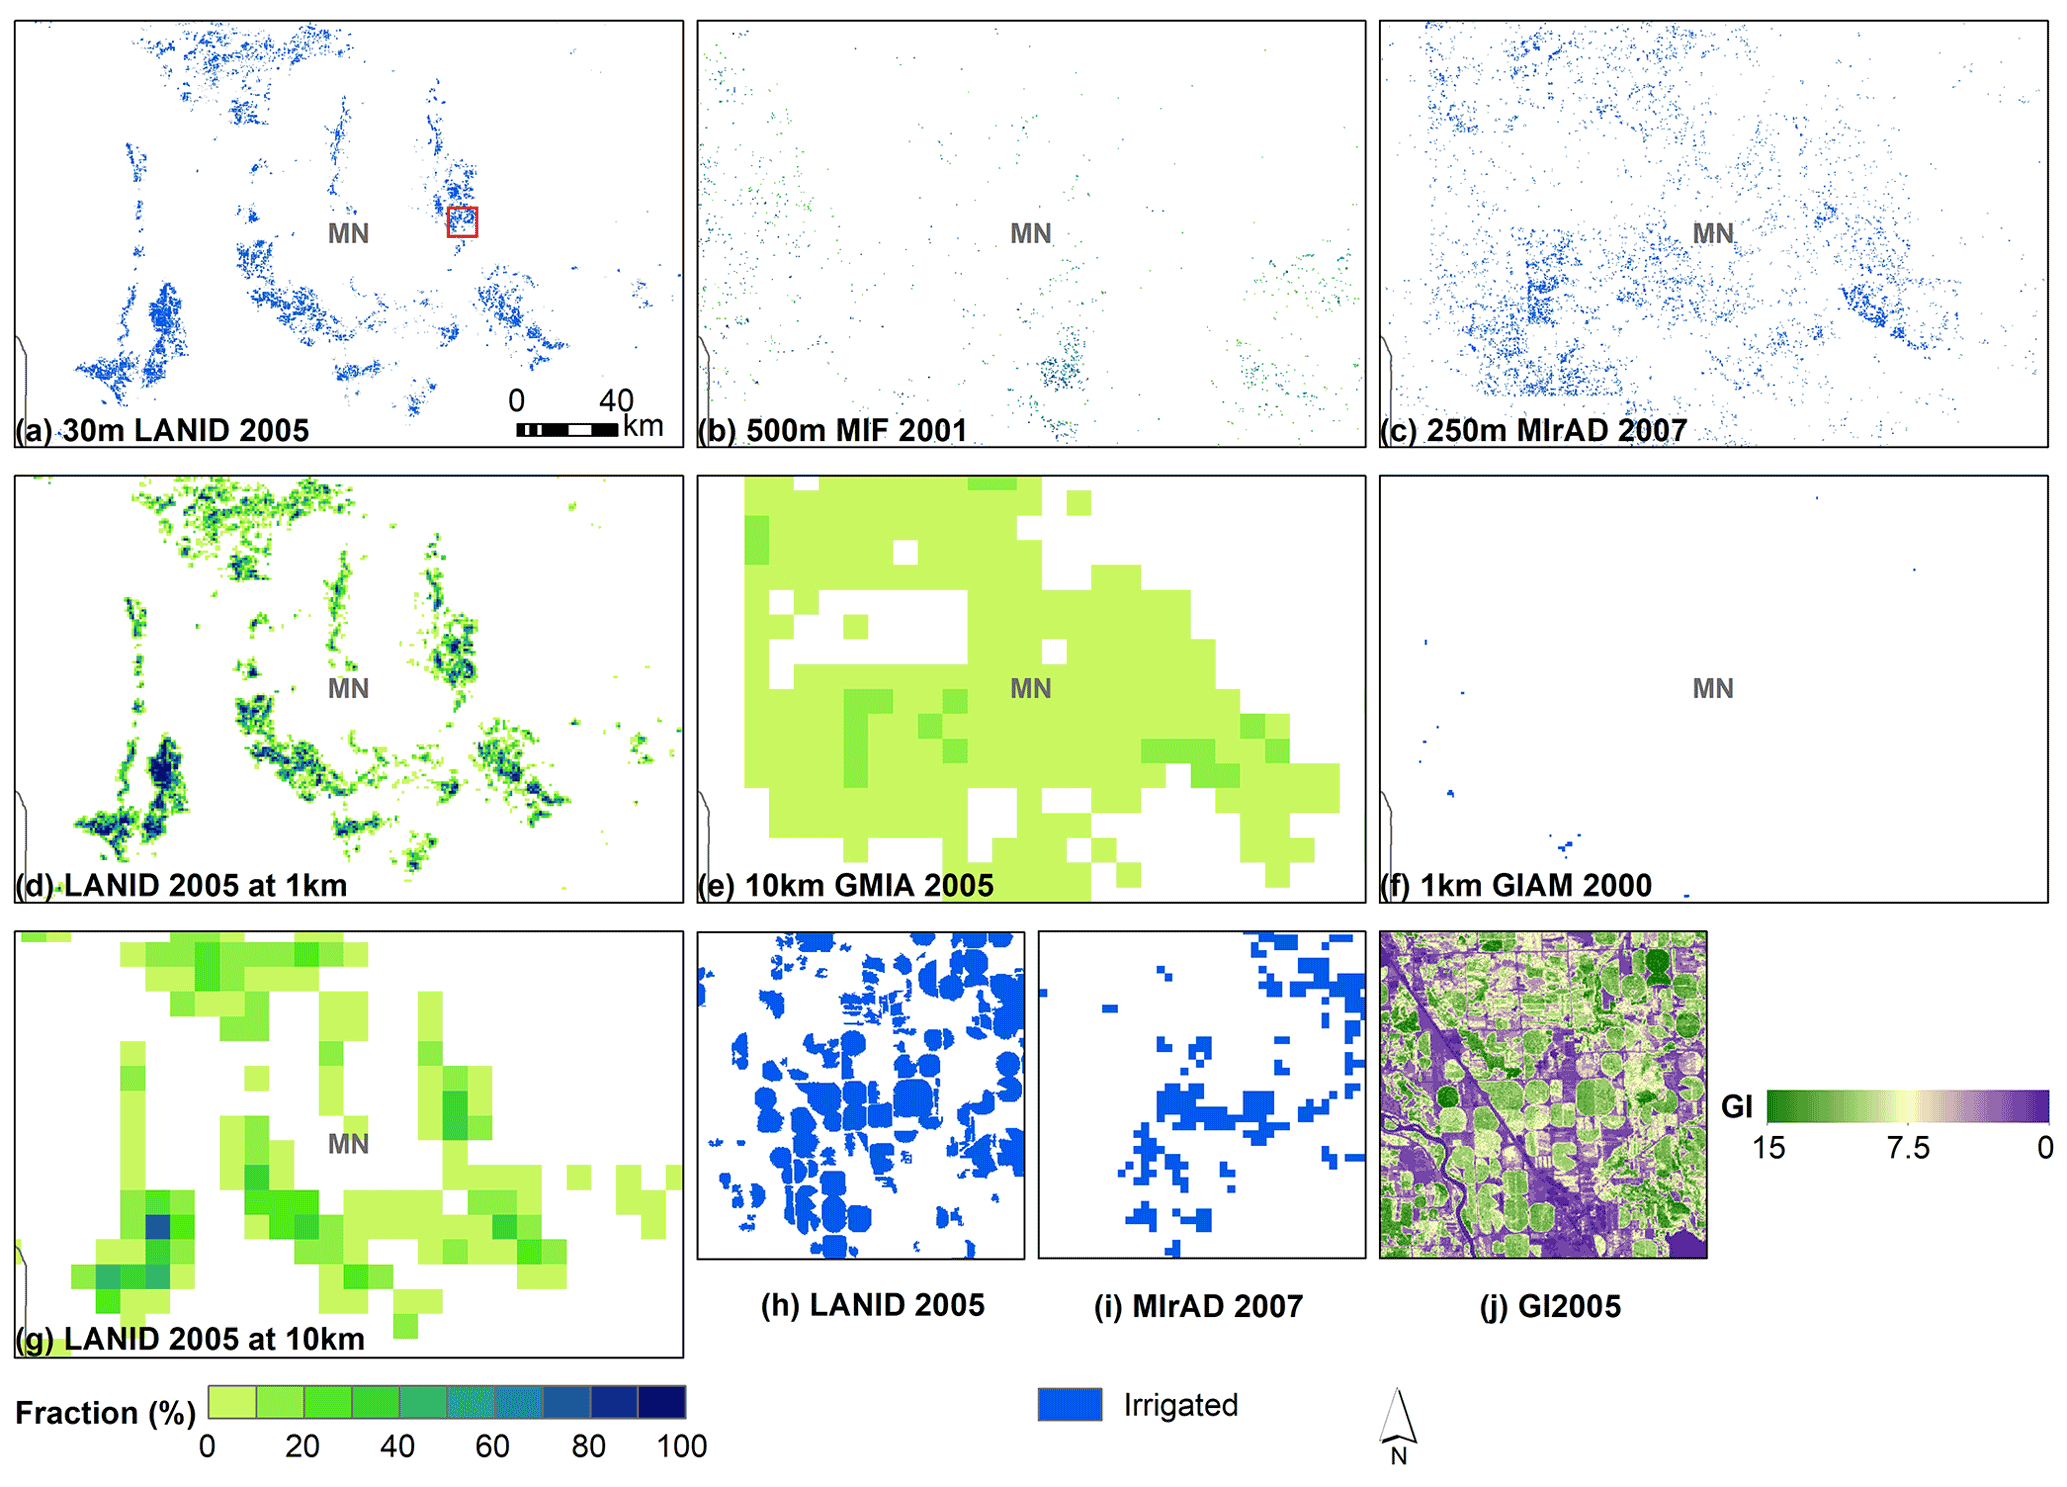
Figure 13Product comparison in central Minnesota. In addition to the original 30 m LANID (a), the map is aggregated to 1 and 10 km resolution for panels (d) and (g). Panels (h–i) show the location highlighted in (a) (red rectangle).
Locally, LANID shows a substantial improvement of spatial detail compared to other maps. For example, boundaries of center pivot and rectangular fields are clearly recognizable in LANID, while they are obscured even on the 250 m resolution MIrAD (insets (h) and (j) of Figs. 11 and 12). It is also evident that LANID shows comparable spatial details as other regional maps IrrMapper and AIM-HPA (inset (i) of Figs. 11 and 12) while still offering consistent and comprehensive coverage across the CONUS.
At the state level, our LANID estimates are consistent with USDA-NASS-reported data (Fig. 14b), although the agreement is weaker than that of products like MIrAD and GMIA, which both rely directly and exclusively on census data as areal reference (not shown in the figure). In contrast, MIF underestimates irrigated area at the state level (Fig. 14c), whereas GIAM substantially overestimates irrigation extent, especially for the states with reported area greater than 106 ha (Fig. 14d).
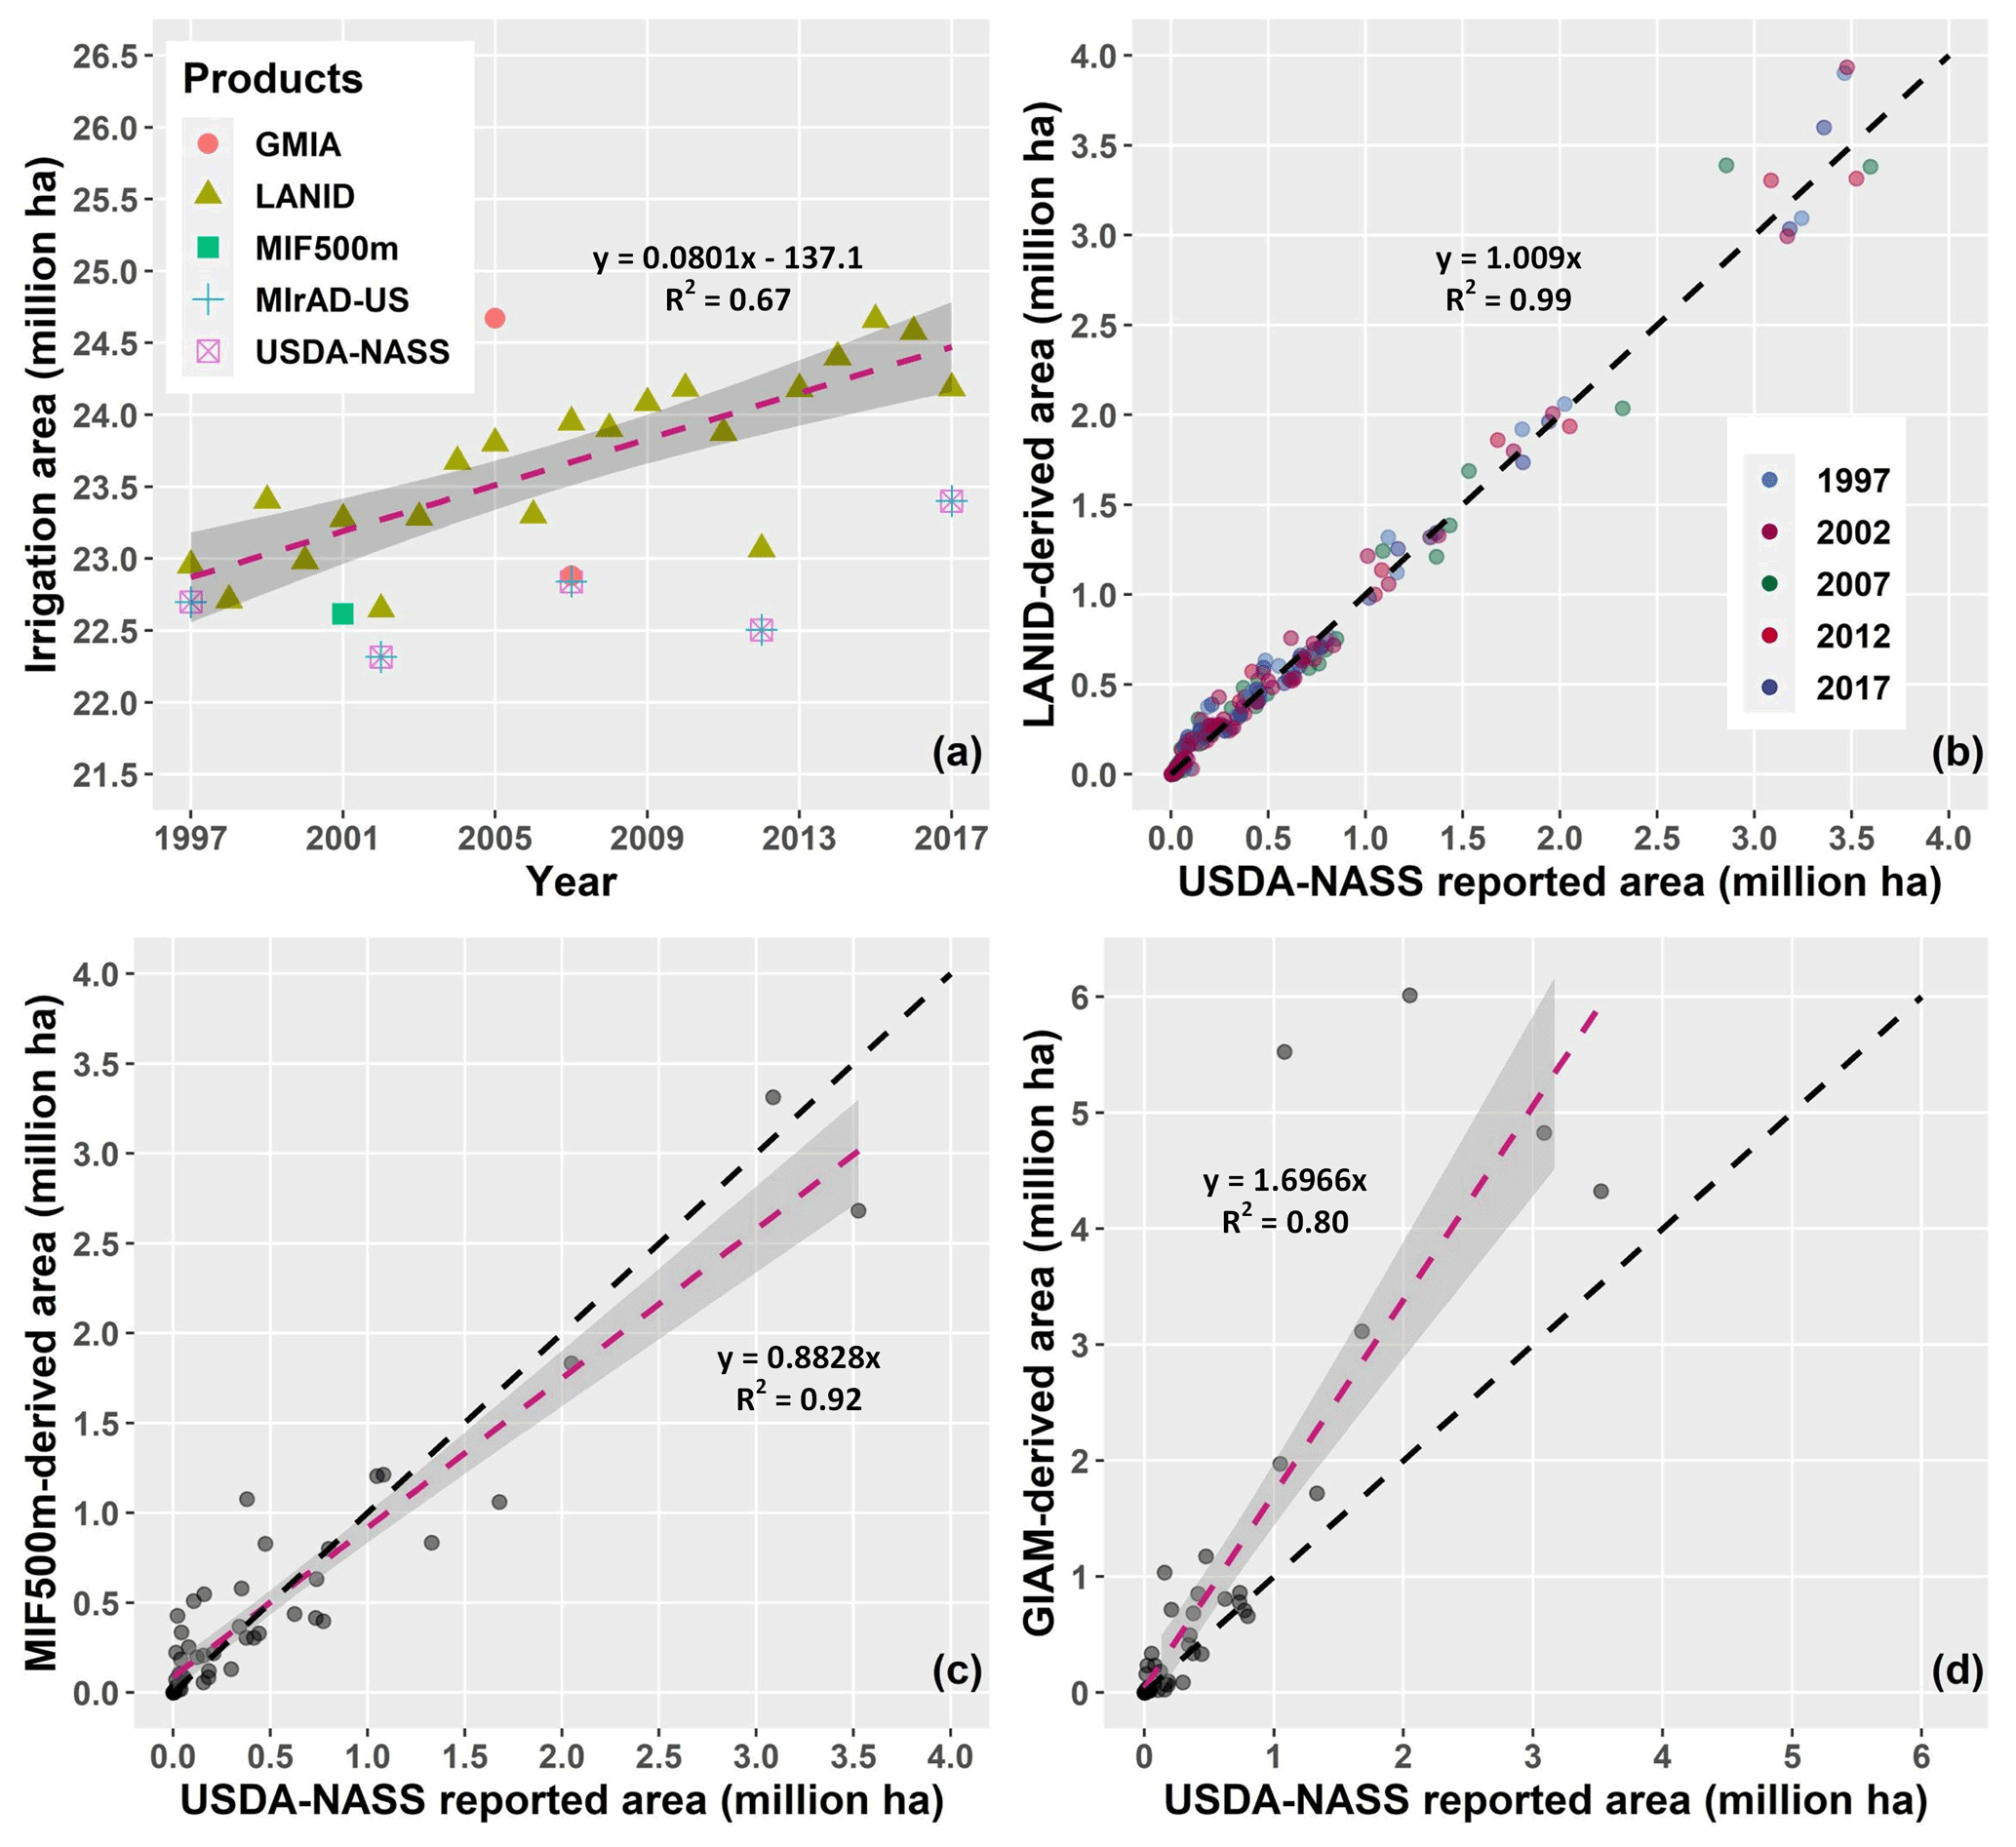
Figure 14Comparisons of irrigated area between products at the nation (a) and state (b–d) levels. (a) LANID-derived nationwide irrigation trend (dashed pink line) and irrigated area of other products. (b) USDA-NASS-reported vs. LANID-estimated irrigation area for 5 census years. (c) USDA-NASS-reported (2002) vs. MODIS-estimated (2001) irrigated area (adapted from Ozdogan and Gutman, 2008). (d) USDA-NASS reported (2002) vs. GIAM-estimated (2000) irrigated area. Note the GIAM-estimated nationwide irrigated area (39×106 ha) is not shown in (a) due to its exceptionally high value. State-level comparisons between USDA-NASS and MIrAD-US and GMIA are not demonstrated because both products used census data as reference.
Table 4Confusion table of pixel-wise accuracy assessment. The overall accuracy, omission error (1 – producer's accuracy), and commission error (1 – user's accuracy) are in percent. Accuracy values are averaged if multiple-year assessment was conducted. Parenthetical numbers represent the standard deviation.
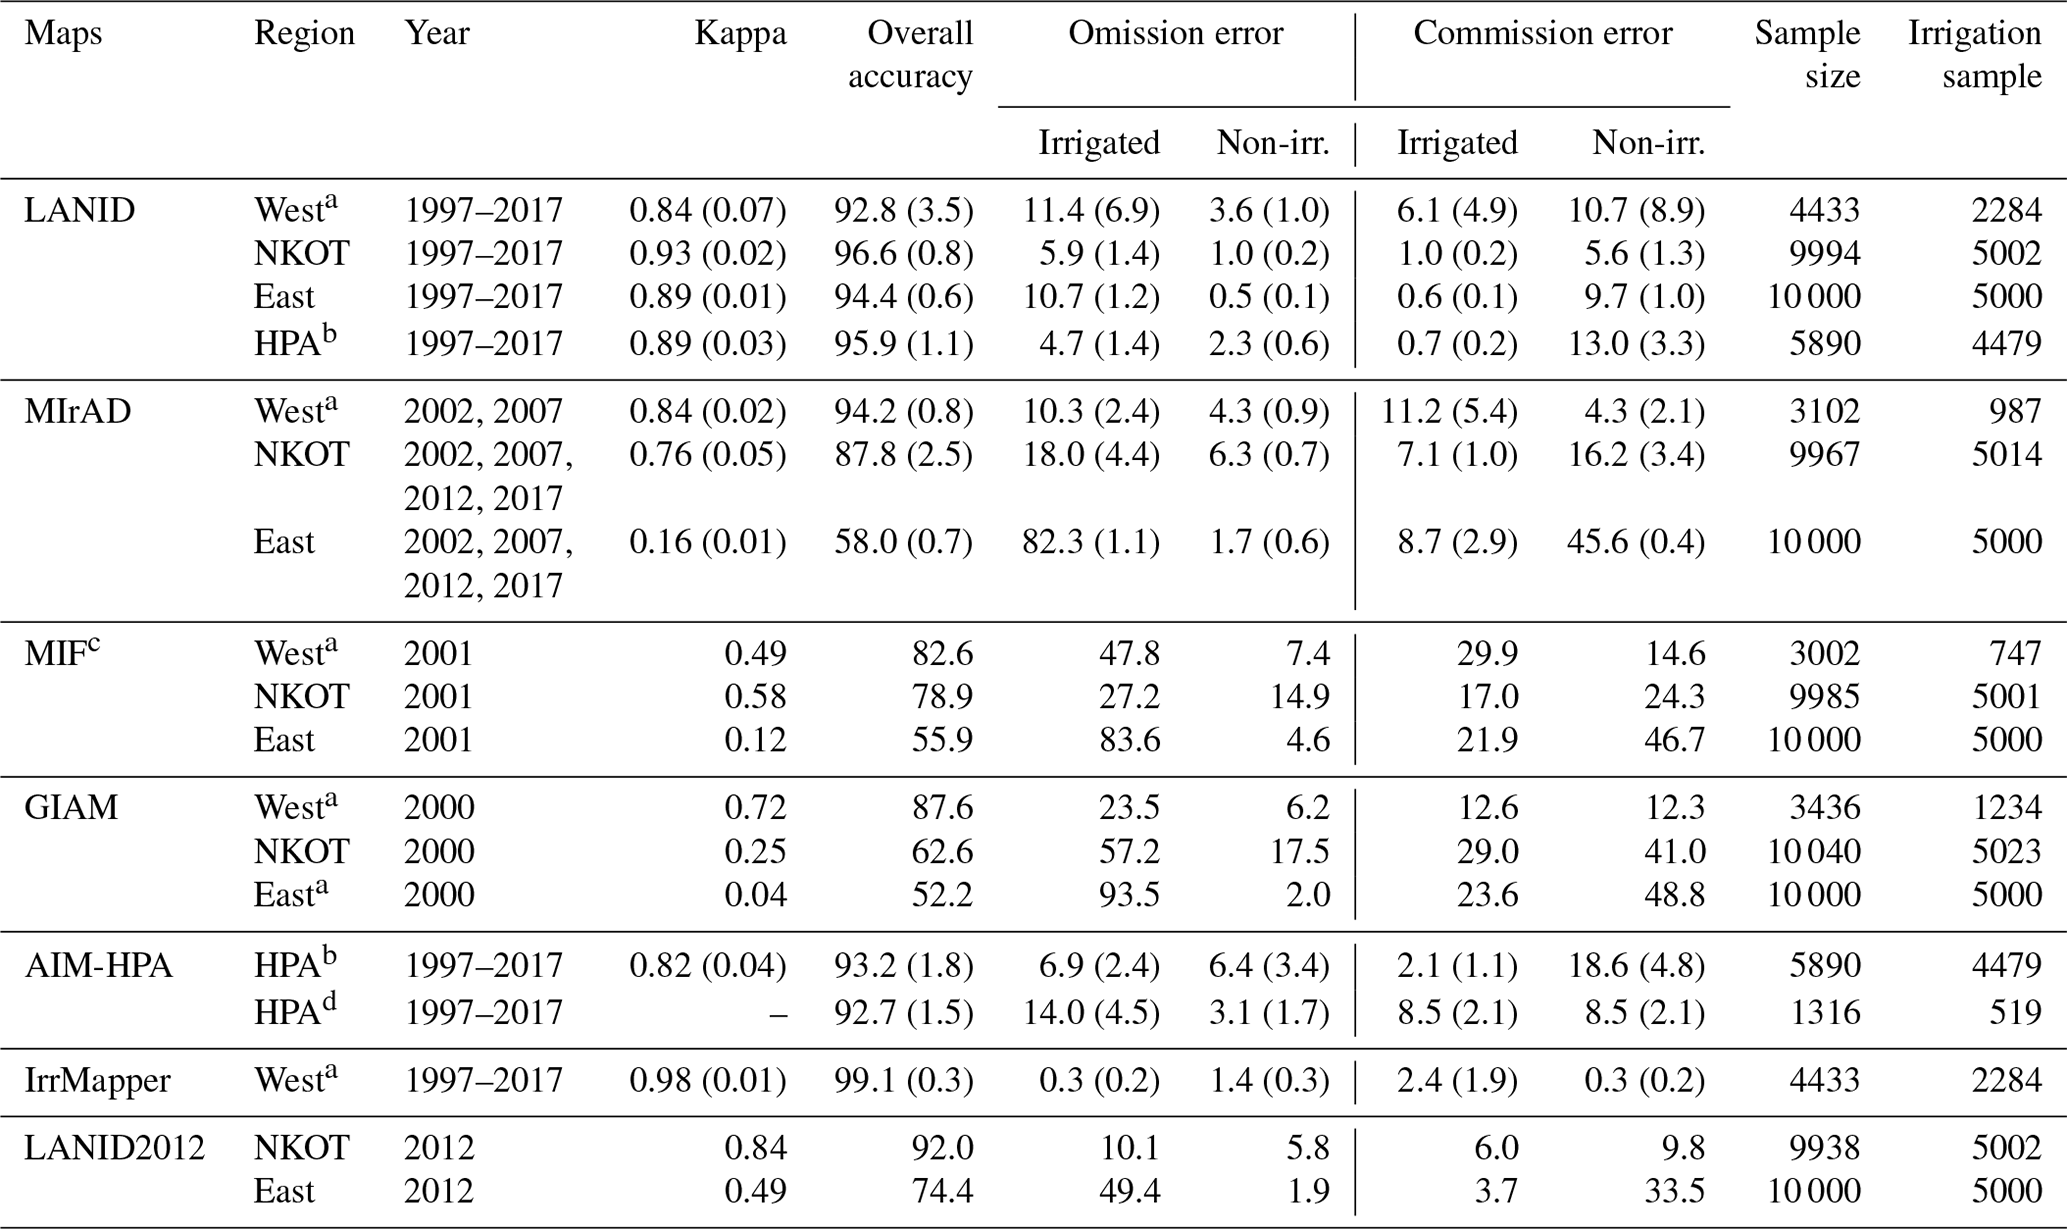
a Validation samples from Ketchum et al. (2020). Test samples for the years 1999, 2004, 2005, 2012, 2015, and 2017 were not used because of limited irrigated samples. b Validation samples from this study. c Irrigated pixels were set as a fraction greater than 20 %. d Accuracy assessment reported by Deines et al. (2019). NKOT: Nebraska, Kansas, Oklahoma, and Texas.
The results of pixel-based assessment further reveal the advantages of LANID over other nationwide maps (Table 4). We find that the overall accuracy is generally high for the NKOT region (i.e., Nebraska, Kansas, Oklahoma, and Texas) across all nationwide maps except for GIAM, with mean accuracy ranging from 78.9 % (MIF) to over 95 % (the LANID maps). Similarly, all maps show relatively high overall accuracy for the 11 western states, with values ranging from 82.6 % of MIF to 94.2 % of MIrAD. Despite these maps' reasonable accuracy in the west and even Midwest, they incorrectly assign a considerable number of rainfed fields as irrigated possibly due to coarse resolution and their difficulty separating them in some areas such as the Columbia Plateau aquifer (Fig. 11). For example, GIAM captures many low-density pixels in the west (Fig. 15c); MIF overestimates the locations with irrigation fraction between 0 % and 60 % (Fig. 15b); MIrAD maps irrigated pixels with a median fraction around 80 % (Fig. 15a).
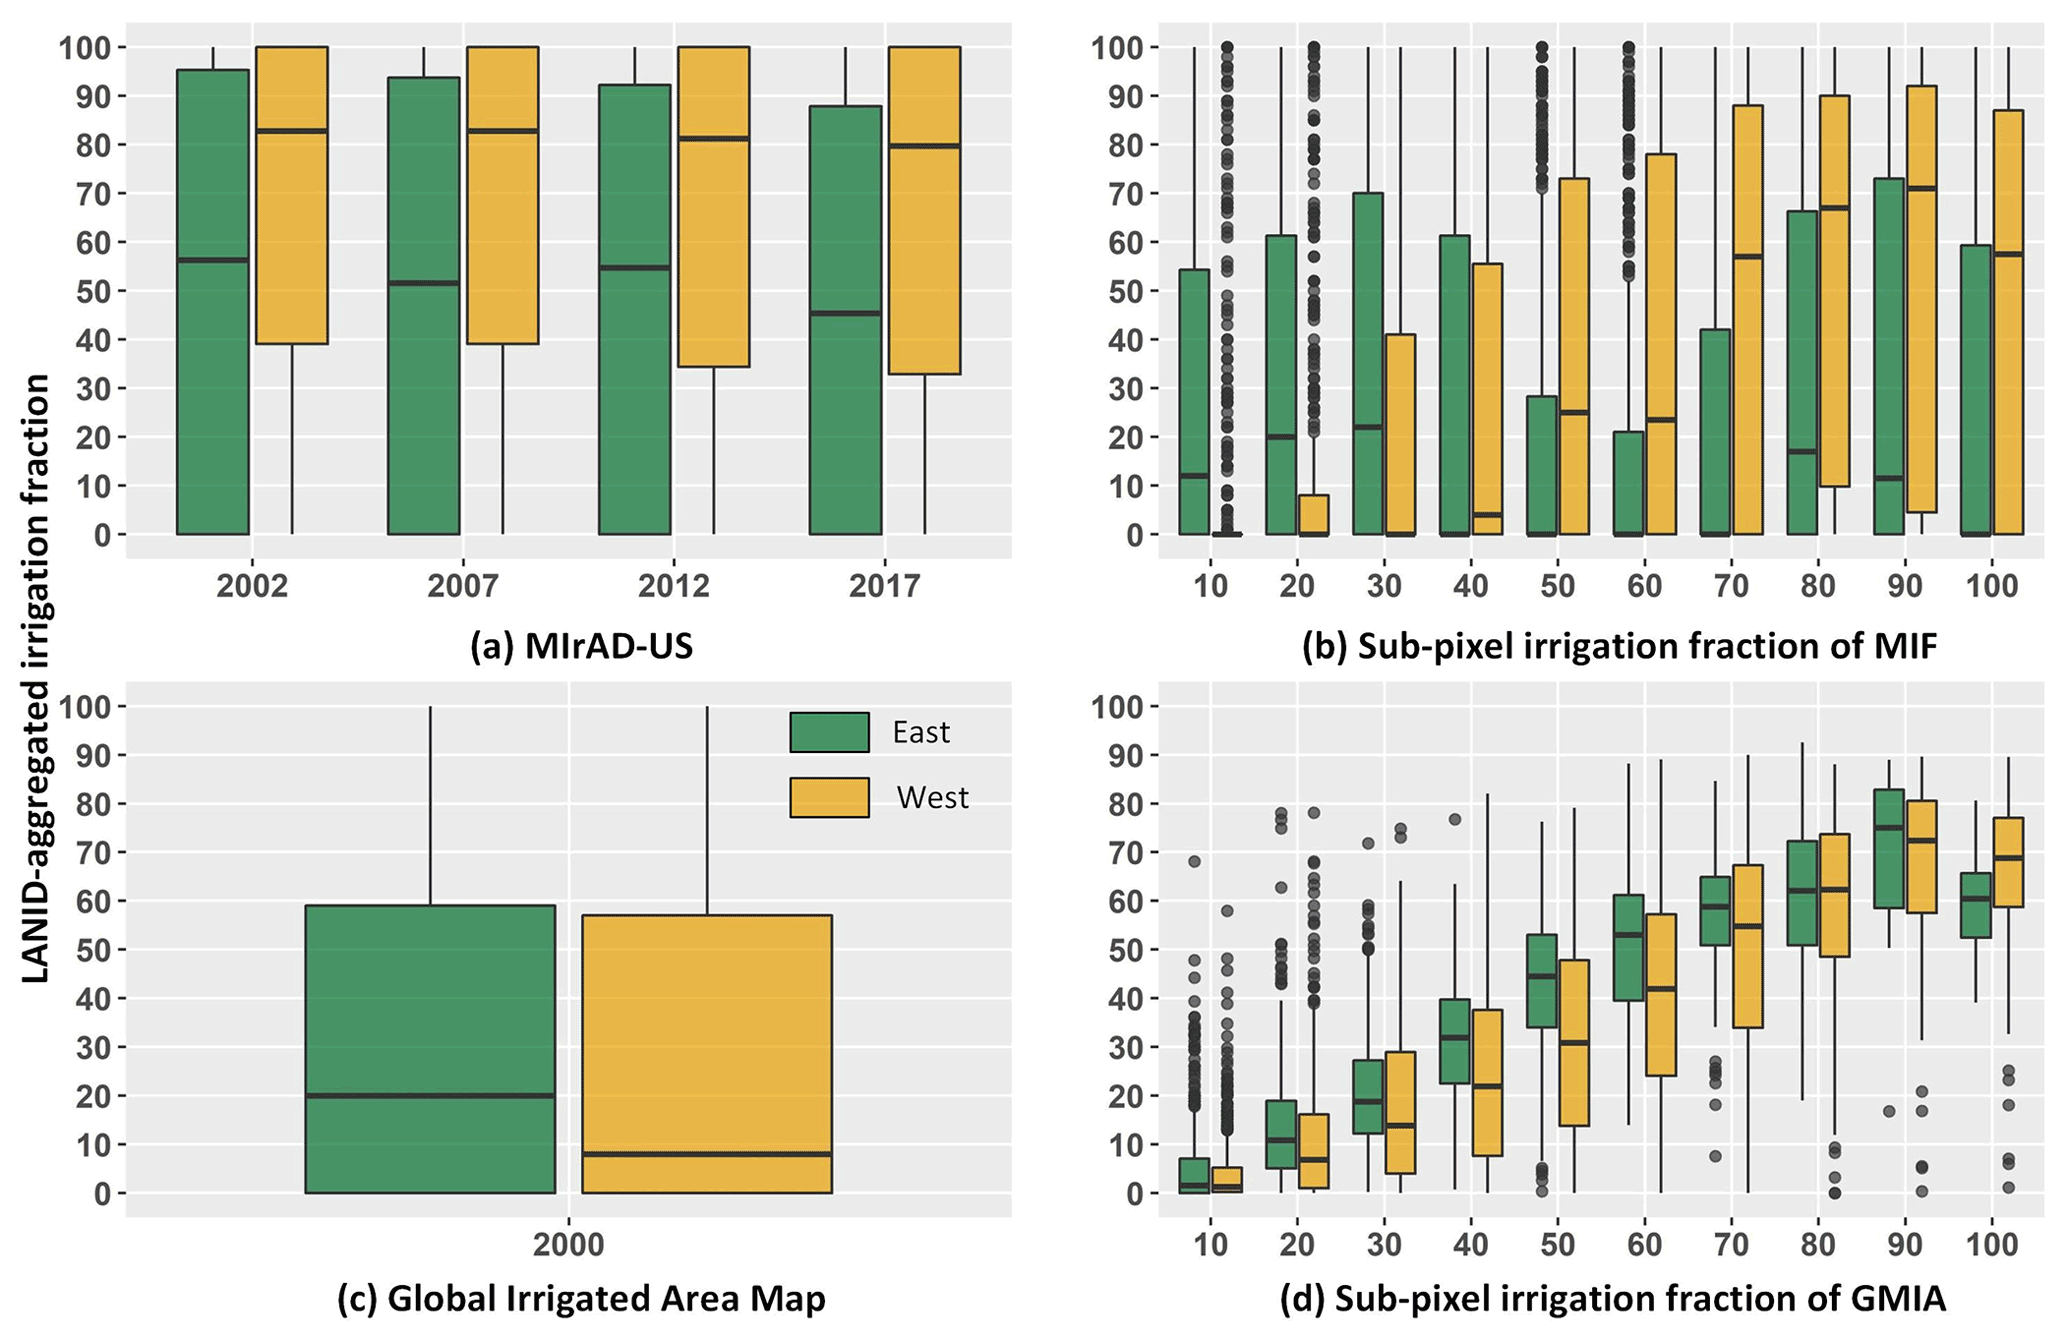
Figure 15Box plots showing irrigation fraction mapped in each product using LANID as reference. The western and eastern CONUS (separated by red line in Fig. 2) are shown as brown and green, respectively. The 30 m LANID maps were aggregated as an irrigation fraction to match the spatial resolution of each product (e.g., 250 m for MIrAD). For binary maps MIrAD and GIAM, 5000 irrigated samples were stratified for both west and east; 50 samples were selected for each irrigation fraction from 1 % to 100 % (with increments of 1 %) in MIF and GMIA. The numbers on the horizontal axes of (b) and (d) refer to the maximum value of each bin.
In the eastern US, our LANID maps stand out with overall accuracy of 94.4 % – on par with their performance in the western US – whereas other maps show accuracy below 60 %. The extremely low accuracy of MIrAD, MIF, and GIAM in the east is attributable to their missing of most irrigated cropland as well as frequent false identification of rainfed cropland as irrigated (see Fig. 13 as an example), as characterized by omission error rates of over 80 % and commission error rates of over 45 % for the “irrigated” and “non-irrigated” classes, respectively. As a result, MIrAD maps irrigated pixels in the east that have a median irrigated fraction of about 50 % according to LANID (Fig. 15a); GIAM misclassifies a substantial number of low-density pixels (Fig. 15c); MIF substantially overestimates the locations with an irrigation fraction beyond 30 % (Fig. 15b).
We also compared our maps to AIM-HPA (i.e., Annual Irrigation Maps – High Plains aquifer) (Deines et al., 2019), a dataset with the same spatial and temporal resolution as LANID but covering only the High Plains aquifer. In this region, LANID performs comparably to the HPA-specific dataset, with overall accuracy of 95.9 % vs. 93.2 %, respectively, and kappa values of 0.89 vs. 0.82.
For a broader region with the 11 western states, our LANID maps show 92.8 % congruence (kappa of 0.84) with the reference data from IrrMapper (Ketchum et al., 2020) compared to a 99.1 % (kappa of 0.98) congruence of the IrrMapper product with its reference data. Such results follow in part from the methods of reference data utilization, as IrrMapper used 60 % of the validation data used in our comparison for its classifier training. Further differences between LANID and IrrMapper may stem from differences in sampled data and irrigated class definition. For example, the IrrMapper point-based irrigation samples were stratified from verified fields that were digitized in years different from the time of irrigation verification, such that they likely capture permanently irrigated croplands well but may potentially include fields that are partially irrigated or fallowed in any given year. In addition, IrrMapper's reference irrigation samples appear to include both irrigated croplands and other grass-like lands, such as irrigated turfgrass and groundwater- or fluvially subsidized grasslands and wetlands. This broader and more variable pool of reference data may thus help explain additional observed differences, such as occasionally less distinct field boundaries in IrrMapper compared with LANID and GI (e.g., left-hand portions of Fig. 11h–k) as well as the slightly higher apparent accuracy of MIrAD (which relies only on vegetation greenness) compared to LANID in the west when assessed against the IrrMapper reference data (Table 4). Thus, while overall performances of LANID and other datasets are similar in overlapping regions like the HPA and the western states, differences in each product's intent and class specificity will likely dictate preferences for specific user applications.
5.1 Uncertainty, limitations, and future improvements
Both qualitative and quantitative assessments show extensive improvements of LANID compared to other currently available nationwide maps in terms of spatial detail and temporal frequency. Despite the advances, caution is still needed, especially when applying the dataset at the scale of individual fields in the eastern US. For example, mapping accuracy in the Mississippi Alluvial Plain region is uncertain due to the absence of reference data and the difficulty of collecting aerial ground truth in the area. In addition, map accuracy in the humid east is slightly lower than in the arid and semi-arid west. The quality of maps might also vary over time due to availability of clear Landsat observations. For instance, fewer Landsat images in 2012 constrained map quality, and scan-off effects of the ETM+ sensor might remain in some areas.
We took several post-classification steps to improve mapping accuracy, which also introduces limitations to LANID. First, our minimum mapping unit of 5 acres (2.02 ha) (i.e., 23 Landsat pixels) improved mapping confidence but also excluded smaller irrigated fields, such as fragmented irrigated vegetable fields often found in suburban and peri-urban areas. Second, the assumption that fields equipped with irrigation systems tend to be cropped and irrigated frequently could have incorrectly masked out some irrigated fields historically under long-term and frequent fallow conditions (e.g., irrigated – long-term fallow conditions – irrigated). Lastly, our current version of LANID covers only the period of 1997 to 2017, which might be problematic for users who want maps outside the study period. However, we hope to regularly update the existing dataset in the future to include the most recent years of available imagery, and, if able, extend the time series back in time through the duration of the Landsat record.
Given these uncertainties and limitations, future generations of LANID could benefit from the following improvements. First, we anticipate using our temporally extendable methodology to routinely update LANID, such that coverage could extend prior to 1997 and up to the most recent year. Efforts could also be made to enhance spatial detail (e.g., 10 m resolution) and mapping accuracy, particularly in the humid eastern US where contrasts between irrigated and rainfed crops are obscure. This is practical for recent years when both the revisit frequency and spatial resolution of satellite observations are greatly improved. Lastly, implementation of an irrigation-specific change detection algorithm could help improve the identification and consistency of monitoring variations in irrigation over time.
5.2 Potential applications
Our annual 30 m resolution nationwide LANID maps may be valuable to local, state, and regional water governance bodies, agribusinesses, and the research community for a variety of applications including water use estimation, risk assessment, use as model input, and more.
Our LANID maps could benefit water and agricultural managers by providing insights into irrigation changes (e.g., expansion and abandonment) at geographic and temporal scales relevant to decision-making. Our field-scale, wall-to-wall data will enable local and regional water management organizations, which may not otherwise have sufficient data or resources, to make better decisions that influence regional water availability. For example, state-level water managers and engineers who need to plan how much water to allocate for agriculture could utilize our irrigation distribution and change information to estimate demand. Policy makers may also use LANID to navigate future decision making and to evaluate federal agricultural, bioenergy, and conservation policies (Mccarthy et al., 2020; Lark, 2020).
Our dataset may also be useful for agribusinesses and entities across agricultural supply chains. For example, our maps could be used by companies that seek to reduce risk from water scarcity within their supply chains or lower the water footprint of their sourced products (Brauman et al., 2020). Additional applications may include business decision-making and financial investment (Turral et al., 2010), precise field-level water use estimation and solutions (Sadler et al., 2005), and crop yield prediction and its water resilience (Troy et al., 2015).
A key informant and collaborator in the development of our LANID maps has been the USGS, and the produced outputs may help support several ongoing USGS efforts, such as the National Water Census's efforts to provide water budgets at the watershed level (USGS, 2020a), the National Water-Use Information Program (NWUIP) dissemination of water use data (USGS, 2020b), and the Water Availability and Use Science Program (WAUSP) assessments of regional groundwater availability (USGS, 2020c). The research community within USGS also has high-priority goals to improve quantification of crop consumptive water use and project future water use. Our improved estimates of irrigation location, extent, and dynamics could help refine evapotranspiration estimates of irrigated croplands, thereby improving estimates of agricultural water use from field to aquifer scales and further supporting the ongoing expansion of detailed water use estimates across the continental US (Senay et al., 2016, 2017).
We also hope that our dataset will serve several needs in the broader research community, especially for those who study hydrology, agriculture, and the environment from local to nationwide scales. For example, our 30 m resolution irrigation data could be used to potentially improve the classification accuracy of or add irrigation status to existing USGS and USDA land cover maps (Brown et al., 2020; Lark et al., 2021; Wickham et al., 2021), investigate the relationships among irrigation changes and cropland expansion and abandonment (Lark et al., 2020; Yin et al., 2020), or explore the competition and biophysical interactions between irrigated agriculture and urban expansion (Xie et al., 2019a; Van Vliet, 2019; Bren D'amour et al., 2017). Users of previous coarser-resolution irrigation datasets will also benefit from the improvements in spatial detail, product frequency, and map accuracy. Existing nationwide irrigation datasets like MIrAD have been accessed by hundreds of users in academia and government via the USGS EROS website (Brown and Pervez, 2014). These data have been incorporated into studies to evaluate trends in ground and surface water quality, model evapotranspiration, and energy–water exchange at the surface boundary layer, and they reveal locations at risk of unsustainable irrigation (Brown and Pervez, 2014; Pryor et al., 2016; Seyoum and Milewski, 2016; Jin et al., 2011; Zaussinger et al., 2019). Our 30 m data products will enhance similar types of applications and enable many others through the improved spatial and temporal resolution. To this extent, several organizations have begun using our previously published LANID 2012 for further research and development activities, despite there being only 1 of the presently described 21 annual years of data available; such applications should be further enabled by the current full suite of products and time periods.
Lastly, our collected samples could help generate new threads of irrigation maps for the eastern US. Because insufficient ground reference data have long been a bottleneck to producing accurate classifiers for irrigation mapping, our verified locations could facilitate the development and evaluation of new models for irrigation detection, especially when other constraints are becoming relieved due to increasingly available high- to moderate-resolution remote sensing images, development of machine learning algorithms, and open access of cloud computing platforms.
Our annual LANID maps, their byproducts (i.e., maximum irrigation extent, irrigation frequency, and per-pixel irrigation trends), ∼10 000 manually collected ground reference data, and metadata can be accessed via https://doi.org/10.5281/zenodo.5548555 (Xie and Lark, 2021a). All maps use the Albers equal-area conical projection at 30 m resolution except for the map of irrigation trends of 6 km.
This paper presents the only annual, nationwide fine-resolution maps of irrigation extent for the US, which are available for each year from 1997–2017, and offer several improvements over other products. The increased resolution of the described LANID dataset sets a new standard in spatial detail at the CONUS extent, while the increased mapping frequency and multidecadal coverage enable characterization of irrigation dynamics. Our accuracy assessment shows that the LANID maps provide the most realistic depiction of irrigation extent across the country, with performance that matches or exceeds existing regional datasets.
Moving forward, the LANID maps provide a foundation for refined representations of irrigation distribution and dynamics across the US. It is clear from recent research efforts that high-quality, frequently updated data on fine-scale irrigation extent are immensely valuable for both the research and application user communities. With these needs in mind, our future intents and interests surrounding LANID may focus on (1) routinely updating annual maps after 2017, (2) providing finer-resolution maps of irrigation extent (e.g., 10 m) by fusing multi-source imagery, and (3) improving mapping accuracy in the eastern CONUS.
Table A1The LANID-derived state-level irrigated area (in hectares) of each year between 1997 and 2017.
YX created the dataset, wrote the original draft, and reviewed and edited the manuscript. HKG reviewed and edited the manuscript. TJL acquired funding and reviewed and edited the manuscript. All authors have reviewed and agreed on the published version of the paper.
The contact author has declared that neither they nor their co-authors have any competing interests.
Any use of trade, firm, or product names is for descriptive purposes only and does not imply endorsement by the US government.
Publisher's note: Copernicus Publications remains neutral with regard to jurisdictional claims in published maps and institutional affiliations.
The authors would like to thank members of the USGS Water Budget and Estimation Project for sharing verified irrigation data, feedback and ideas for mapping, and insights regarding data use for water estimation. We also appreciate the comments from the anonymous reviewers and editors and their helpful suggestions.
This research has been supported by the US Geological Survey (grant no. G19AC00080) and the US Department of Energy (grant no. DE-SC0018409).
This paper was edited by David Carlson and reviewed by two anonymous referees.
Brandt, J. T., Caldwell, R. R., Haynes, J. V., Painter, J. A., and Read, A. L.: Verified Irrigated Agricultural Lands for the United States, 2002–17, U.S. Geological Survey data release [data set], https://doi.org/10.5066/P9NAWU1U, 2021.
Brauman, K. A., Goodkind, A. L., Kim, T., Pelton, R. E. O., Schmitt, J., and Smith, T. M.: Unique water scarcity footprints and water risks in US meat and ethanol supply chains identified via subnational commodity flows, Environ. Res. Lett., 15, 105018, https://doi.org/10.1088/1748-9326/ab9a6a, 2020.
Breiman, L.: Random forests, Mach. Learn., 45, 5–32, 2001.
Bren d'Amour, C., Reitsma, F., Baiocchi, G., Barthel, S., Guneralp, B., Erb, K. H., Haberl, H., Creutzig, F., and Seto, K. C.: Future urban land expansion and implications for global croplands, P. Natl. Acad. Sci. USA, 114, 8939–8944, https://doi.org/10.1073/pnas.1606036114, 2017.
Brown, J. F. and Pervez, M. S.: Merging remote sensing data and national agricultural statistics to model change in irrigated agriculture, Agr. Syst., 127, 28–40, https://doi.org/10.1016/j.agsy.2014.01.004, 2014.
Brown, J. F., Tollerud, H. J., Barber, C. P., Zhou, Q., Dwyer, J. L., Vogelmann, J. E., Loveland, T. R., Woodcock, C. E., Stehman, S. V., Zhu, Z., Pengra, B. W., Smith, K., Horton, J. A., Xian, G., Auch, R. F., Sohl, T. L., Sayler, K. L., Gallant, A. L., Zelenak, D., Reker, R. R., and Rover, J.: Lessons learned implementing an operational continuous United States national land change monitoring capability: The Land Change Monitoring, Assessment, and Projection (LCMAP) approach, Remote Sens. Environ., 238, 111356, https://doi.org/10.1016/j.rse.2019.111356, 2020.
Cui, X., Kavvada, O., Huntington, T., and Scown, C. D.: Strategies for near-term scale-up of cellulosic biofuel production using sorghum and crop residues in the US, Environ. Res. Lett., 13, 124002, 2018.
Deines, J. M., Kendall, A. D., and Hyndman, D. W.: Annual Irrigation Dynamics in the U. S. Northern High Plains Derived from Landsat Satellite Data, Geophys. Res. Lett., 44, 9350–9360, https://doi.org/10.1002/2017gl074071, 2017.
Deines, J. M., Kendall, A. D., Crowley, M. A., Rapp, J., Cardille, J. A., and Hyndman, D. W.: Mapping three decades of annual irrigation across the US High Plains Aquifer using Landsat and Google Earth Engine, Remote Sens. Environ., 233, 111400, 2019.
Deines, J. M., Schipanski, M. E., Golden, B., Zipper, S. C., Nozari, S., Rottler, C., Guerrero, B., and Sharda, V.: Transitions from irrigated to dryland agriculture in the Ogallala Aquifer: Land use suitability and regional economic impacts, Agr. Water Manage., 233, 106061, https://doi.org/10.1016/j.agwat.2020.106061, 2020.
Dieter, C. A., Maupin, M. A., Caldwell, R. R., Harris, M. A., Ivahnenko, T. I., Lovelace, J. K., Barber, N. L., and Linsey, K. S.: Estimated use of water in the United States in 2015, U.S. Geological Survey, Circular 1441, 65 pp., https://doi.org/10.3133/cir1441, 2018.
Enciso, J., Jifon, J., Ribera, L., Zapata, S., and Ganjegunte, G.: Yield, water use efficiency and economic analysis of energy sorghum in South Texas, Biomass Bioenerg., 81, 339–344, 2015.
ESA: Climate Change Initiative Land Cover, http://maps.elie.ucl.ac.be/CCI/viewer/index.php (last access: 15 April 2021), 2015.
Gong, P., Li, X., Wang, J., Bai, Y., Chen, B., Hu, T., Liu, X., Xu, B., Yang, J., Zhang, W., and Zhou, Y.: Annual maps of global artificial impervious area (GAIA) between 1985 and 2018, Remote Sens. Environ., 236, 111510, https://doi.org/10.1016/j.rse.2019.111510, 2020.
Gorelick, N., Hancher, M., Dixon, M., Ilyushchenko, S., Thau, D., and Moore, R.: Google earth engine: planetary-scale geospatial analysis for everyone, Remote Sens. Environ., 202, 18–27, https://doi.org/10.1016/j.rse.2017.06.031, 2017.
Hansen, M. C., Potapov, P. V., Moore, R., Hancher, M., Turubanova, S., Tyukavina, A., Thau, D., Stehman, S., Goetz, S., and Loveland, T. R.: High-resolution global maps of 21st-century forest cover change, Science, 342, 850–853, 2013.
Jin, Y., Randerson, J. T., and Goulden, M. L.: Continental-scale net radiation and evapotranspiration estimated using MODIS satellite observations, Remote Sens. Environ., 115, 2302–2319, 2011.
Ketchum, D., Jencso, K., Maneta, M. P., Melton, F., Jones, M. O., and Huntington, J.: IrrMapper: A Machine Learning Approach for High Resolution Mapping of Irrigated Agriculture Across the Western U.S., Remote Sens., 12, 2328, https://doi.org/10.3390/rs12142328, 2020.
Lark, T. J.: Protecting our prairies: Research and policy actions for conserving America's grasslands, Land Use Policy, 97, 104727, https://doi.org/10.1016/j.landusepol.2020.104727, 2020.
Lark, T. J., Salmon, J. M., and Gibbs, H. K.: Cropland expansion outpaces agricultural and biofuel policies in the United States, Environ. Res. Lett., 10, 044003, https://doi.org/10.1088/1748-9326/10/4/044003, 2015.
Lark, T. J., Spawn, S. A., Bougie, M., and Gibbs, H. K.: Cropland expansion in the United States produces marginal yields at high costs to wildlife, Nat. Commun., 11, 4295, https://doi.org/10.1038/s41467-020-18045-z, 2020.
Lark, T. J., Schelly, I. H., and Gibbs, H. K.: Accuracy, Bias, and Improvements in Mapping Crops and Cropland across the United States Using the USDA Cropland Data Layer, Remote Sens., 13, 968, https://doi.org/10.3390/rs13050968, 2021.
Loveland, T. R., Reed, B. C., Brown, J. F., Ohlen, D. O., Zhu, Z., Yang, L., and Merchant, J. W.: Development of a global land cover characteristics database and IGBP DISCover from 1 km AVHRR data, Int. J. Remote Sens., 21, 1303–1330, 2000.
McCarthy, B., Anex, R., Wang, Y., Kendall, A. D., Anctil, A., Haacker, E. M. K., and Hyndman, D. W.: Trends in Water Use, Energy Consumption, and Carbon Emissions from Irrigation: Role of Shifting Technologies and Energy Sources, Environ. Sci. Technol., 54, 15329–15337, https://doi.org/10.1021/acs.est.0c02897, 2020.
McDonald, R. I., Green, P., Balk, D., Fekete, B. M., Revenga, C., Todd, M., and Montgomery, M.: Urban growth, climate change, and freshwater availability, P. Natl. Acad. Sci. USA, 108, 6312–6317, 2011.
Meier, J., Zabel, F., and Mauser, W.: A global approach to estimate irrigated areas – a comparison between different data and statistics, Hydrol. Earth Syst. Sci., 22, 1119–1133, https://doi.org/10.5194/hess-22-1119-2018, 2018.
Mullet, J., Morishige, D., McCormick, R., Truong, S., Hilley, J., McKinley, B., Anderson, R., Olson, S. N., and Rooney, W.: Energy Sorghum – a genetic model for the design of C4 grass bioenergy crops, J. Exp. Bot., 65, 3479–3489, 2014.
Otkin, J. A., Svoboda, M., Hunt, E. D., Ford, T. W., Anderson, M. C., Hain, C., and Basara, J. B.: Flash Droughts: A Review and Assessment of the Challenges Imposed by Rapid-Onset Droughts in the United States, B. Am. Meteorol. Soc., 99, 911–919, https://doi.org/10.1175/bams-d-17-0149.1, 2018.
Ozdogan, M. and Gutman, G.: A new methodology to map irrigated areas using multi-temporal MODIS and ancillary data: An application example in the continental US, Remote Sens. Environ., 112, 3520–3537, https://doi.org/10.1016/j.rse.2008.04.010, 2008.
Ozdogan, M., Rodell, M., Beaudoing, H. K., and Toll, D. L.: Simulating the Effects of Irrigation over the United States in a Land Surface Model Based on Satellite-Derived Agricultural Data, J. Hydrometeorol., 11, 171–184, https://doi.org/10.1175/2009jhm1116.1, 2010.
Pekel, J. F., Cottam, A., Gorelick, N., and Belward, A. S.: High-resolution mapping of global surface water and its long-term changes, Nature, 540, 418–422, https://doi.org/10.1038/nature20584, 2016.
Pervez, M. S. and Brown, J. F.: Mapping Irrigated Lands at 250 m Scale by Merging MODIS Data and National Agricultural Statistics, Remote Sens., 2, 2388–2412, https://doi.org/10.3390/rs2102388, 2010.
Pryor, S., Sullivan, R., and Wright, T.: Quantifying the roles of changing albedo, emissivity, and energy partitioning in the impact of irrigation on atmospheric heat content, J. Appl. Meteorol. Clim., 55, 1699–1706, 2016.
Robertson, G. P., Hamilton, S. K., Barham, B. L., Dale, B. E., Izaurralde, R. C., Jackson, R. D., Landis, D. A., Swinton, S. M., Thelen, K. D., and Tiedje, J. M.: Cellulosic biofuel contributions to a sustainable energy future: Choices and outcomes, Science, 356, eaal2324, https://doi.org/10.1126/science.aal2324, 2017.
Rosegrant, M. W., Ringler, C., and Zhu, T.: Water for Agriculture: Maintaining Food Security under Growing Scarcity, Annu. Rev. Env. Resour., 34, 205–222, https://doi.org/10.1146/annurev.environ.030308.090351, 2009.
Sadler, E., Evans, R., Stone, K., and Camp, C.: Opportunities for conservation with precision irrigation, J. Soil Water Conserv., 60, 371–378, 2005.
Salmon, J. M., Friedl, M. A., Frolking, S., Wisser, D., and Douglas, E. M.: Global rain-fed, irrigated, and paddy croplands: A new high resolution map derived from remote sensing, crop inventories and climate data, Int. J. Appl. Earth Obs., 38, 321–334, https://doi.org/10.1016/j.jag.2015.01.014, 2015.
Sanderson, M. A., Jolley, L. W., and Dobrowolski, J. P.: Pastureland and hayland in the USA: Land resources, conservation practices, and ecosystem services, Conservation outcomes from pastureland and hayland practices: Assessment, recommendations, and knowledge gaps, Allen Press, Lawrence, KS, 25–40, 2012.
Seager, R., Ting, M., Li, C., Naik, N., Cook, B., Nakamura, J., and Liu, H.: Projections of declining surface-water availability for the southwestern United States, Nat. Clim. Change, 3, 482–486, https://doi.org/10.1038/nclimate1787, 2012.
Senay, G. B., Friedrichs, M., Singh, R. K., and Velpuri, N. M.: Evaluating Landsat 8 evapotranspiration for water use mapping in the Colorado River Basin, Remote Sens. Environ., 185, 171–185, 2016.
Senay, G. B., Schauer, M., Friedrichs, M., Velpuri, N. M., and Singh, R. K.: Satellite-based water use dynamics using historical Landsat data (1984–2014) in the southwestern United States, Remote Sens. Environ., 202, 98–112, 2017.
Seto, K. C., Guneralp, B., and Hutyra, L. R.: Global forecasts of urban expansion to 2030 and direct impacts on biodiversity and carbon pools, P. Natl. Acad. Sci. USA, 109, 16083–16088, https://doi.org/10.1073/pnas.1211658109, 2012.
Seyoum, W. M. and Milewski, A. M.: Monitoring and comparison of terrestrial water storage changes in the northern high plains using GRACE and in-situ based integrated hydrologic model estimates, Adv. Water Resour., 94, 31–44, 2016.
Shrestha, D., Brown, J. F., Benedict, T. D., and Howard, D. M.: Exploring the Regional Dynamics of U. S. Irrigated Agriculture from 2002 to 2017, Land, 10, 394, https://doi.org/10.3390/land10040394, 2021.
Siebert, S., Döll, P., Hoogeveen, J., Faures, J.-M., Frenken, K., and Feick, S.: Development and validation of the global map of irrigation areas, Hydrol. Earth Syst. Sci., 9, 535–547, https://doi.org/10.5194/hess-9-535-2005, 2005.
Siebert, S., Henrich, V., Frenken, K., and Burke, J.: Global map of irrigation areas version 5, Rheinische Friedrich-Wilhelms-University, Bonn, Germany/Food and Agriculture Organization of the United Nations, Rome, Italy, 2013.
Teluguntla, P. G., Thenkabail, P. S., Xiong, J., Gumma, M. K., Giri, C., Milesi, C., Ozdogan, M., Congalton, R., Tilton, J., and Sankey, T. T.: Global Cropland Area Database (GCAD) derived from remote sensing in support of food security in the Twenty-First Century: Current achievements and future possibilities, Taylor & Francis, Boca Raton, Florida, USA, 2015.
Thenkabail, P. S., Biradar, C. M., Noojipady, P., Dheeravath, V., Li, Y., Velpuri, M., Gumma, M., Gangalakunta, O. R. P., Turral, H., and Cai, X.: Global irrigated area map (GIAM), derived from remote sensing, for the end of the last millennium, Int. J. Remote Sens., 30, 3679–3733, 2009.
Troy, T. J., Kipgen, C., and Pal, I.: The impact of climate extremes and irrigation on US crop yields, Environ. Res. Lett., 10, 054013, https://doi.org/10.1088/1748-9326/10/5/054013, 2015.
Turral, H., Svendsen, M., and Faures, J. M.: Investing in irrigation: Reviewing the past and looking to the future, Agr. Water Manage., 97, 551–560, 2010.
USDA: https://www.ers.usda.gov/topics/farm-practices-management/irrigation-water-use/background/, last access: 15 June 2021.
USDA-NASS: 2017 Census of Agriculture, Summary and State Data, Geographic Area Series, Part 51, AC-17–A-51, US Department of Agriculture, Washington D.C., USA, 2019.
USDA-NASS: https://www.usda.gov/media/blog/2021/02/11/usda-invests-data-agricultural-irrigation-improvements, last access: 15 June 2021.
USGS: National Water Census, available at: https://www.usgs.gov/mission-areas/water-resources/science/national-water-census-water-use (last access: 15 June 2021), 2020a.
USGS: USGS Water Use Data for the Nation, available at: https://waterdata.usgs.gov/nwis/wu (last access: 15 June 2021), 2020b
USGS: Water Availability and Use Science Program, available at: https://www.usgs.gov/water-resources/water-availability-and-use-science-program (last access: 15 June 2021), 2020c.
van Vliet, J.: Direct and indirect loss of natural area from urban expansion, Nature Sustainability, 2, 755–763, https://doi.org/10.1038/s41893-019-0340-0, 2019.
Wardlow, B. D. and Callahan, K.: A multi-scale accuracy assessment of the MODIS irrigated agriculture data-set (MIrAD) for the state of Nebraska, USA, GISci. Remote Sens., 51, 575–592, 2014.
Wickham, J., Stehman, S. V., Sorenson, D. G., Gass, L., and Dewitz, J. A.: Thematic accuracy assessment of the NLCD 2016 land cover for the conterminous United States, Remote Sens. Environ., 257, 112357, https://doi.org/10.1016/j.rse.2021.112357, 2021.
Xie, Y. and Lark, T. J.: LANID-US: Landsat-based Irrigation Dataset for the United States, Zenodo [data set], https://doi.org/10.5281/zenodo.5548555, 2021a.
Xie, Y. and Lark, T. J.: Mapping annual irrigation from Landsat imagery and environmental variables across the conterminous United States, Remote Sens. Environ., 260, 1–17, https://doi.org/10.1016/j.rse.2021.112445, 2021b.
Xie, Y., Weng, Q., and Fu, P.: Temporal variations of artificial nighttime lights and their implications for urbanization in the conterminous United States, 2013–2017, Remote Sens. Environ., 225, 160–174, https://doi.org/10.1016/j.rse.2019.03.008, 2019a.
Xie, Y., Lark, T. J., Brown, J. F., and Gibbs, H. K.: Mapping irrigated cropland extent across the conterminous United States at 30 m resolution using a semi-automatic training approach on Google Earth Engine, ISPRS J. Photogramm., 155, 136–149, https://doi.org/10.1016/j.isprsjprs.2019.07.005, 2019b.
Xu, T., Deines, J., Kendall, A., Basso, B., and Hyndman, D.: Addressing Challenges for Mapping Irrigated Fields in Subhumid Temperate Regions by Integrating Remote Sensing and Hydroclimatic Data, Remote Sens., 11, 370, https://doi.org/10.3390/rs11030370, 2019.
Yin, H., Brandão, A., Buchner, J., Helmers, D., Iuliano, B. G., Kimambo, N. E., Lewińska, K. E., Razenkova, E., Rizayeva, A., Rogova, N., Spawn, S. A., Xie, Y., and Radeloff, V. C.: Monitoring cropland abandonment with Landsat time series, Remote Sens. Environ., 246, 111873, https://doi.org/10.1016/j.rse.2020.111873, 2020.
Zaussinger, F., Dorigo, W., Gruber, A., Tarpanelli, A., Filippucci, P., and Brocca, L.: Estimating irrigation water use over the contiguous United States by combining satellite and reanalysis soil moisture data, Hydrol. Earth Syst. Sci., 23, 897–923, https://doi.org/10.5194/hess-23-897-2019, 2019.