the Creative Commons Attribution 4.0 License.
the Creative Commons Attribution 4.0 License.
 | 19 Nov 2021
Multi-resolution dataset for photovoltaic panel segmentation from satellite and aerial imagery
Hou Jiang
Jun Qin
Tang Liu
Yujun Liu
Chenghu Zhou
In the context of global carbon emission reduction, solar photovoltaic (PV) technology is experiencing rapid development. Accurate localized PV information, including location and size, is the basis for PV regulation and potential assessment of the energy sector. Automatic information extraction based on deep learning requires high-quality labeled samples that should be collected at multiple spatial resolutions and under different backgrounds due to the diversity and variable scale of PVs. We established a PV dataset using satellite and aerial images with spatial resolutions of 0.8, 0.3, and 0.1 m, which focus on concentrated PVs, distributed ground PVs, and fine-grained rooftop PVs, respectively. The dataset contains 3716 samples of PVs installed on shrub land, grassland, cropland, saline–alkali land, and water surfaces, as well as flat concrete, steel tile, and brick roofs. The dataset is used to examine the model performance of different deep networks on PV segmentation. On average, an intersection over union (IoU) greater than 85 % is achieved. In addition, our experiments show that direct cross application between samples with different resolutions is not feasible and that fine-tuning of the pre-trained deep networks using target samples is necessary. The dataset can support more work on PV technology for greater value, such as developing a PV detection algorithm, simulating PV conversion efficiency, and estimating regional PV potential. The dataset is available from Zenodo on the following website: https://doi.org/10.5281/zenodo.5171712 (Jiang et al., 2021).
- Article
(16957 KB) - Full-text XML
- BibTeX
- EndNote


Fossil fuels used by our society have caused unprecedented levels of carbon dioxide (CO2) with widespread climate impacts that threaten human survival and development (Chu and Majumdar, 2012; Shin et al., 2021). Therefore, governments around the world intensively made commitments to reduce greenhouse gas emissions and formulated schedules for carbon peak and neutrality. For example, the US government announced the goal of achieving carbon neutrality by 2050, and the Chinese government promised to achieve carbon peak by 2030 and carbon neutrality by 2060. To achieve this, a variety of techniques have been developed to generate electricity from renewable energy sources (Moutinho and Robaina, 2016), of which solar energy has attracted increasing attention because of its endless availability and environmental friendliness (Kabir et al., 2018).
The photovoltaic (PV) market has experienced rapid growth over the past two decades owing to the reduced cost of PV modules and support programs from governments (La Monaca and Ryan, 2017; Yan et al., 2019). Between 2000 and 2020, worldwide installed capacity increased from 4 W to 714 GW, consistently exceeding expectations (IRENA, 2021). Utility-scale PV plants usually need a large ground installation area and thus face the land use competition with other human activities (Majumdar and Pasqualetti, 2019; Sacchelli et al., 2016). Adverse impacts regarding the availability of land resources and land erosion are encountered in PV-installed regions (Hernandez et al., 2015; Rabaia et al., 2021), which encourages regular monitoring of PV plants during their working lifetime. Distributed solar PVs are installed on marginal agricultural lands (Martins et al., 2007), building rooftops (Bódis et al., 2019), water surfaces (Liu et al., 2019), and other unused lands to minimize potential ecological and environmental impacts. In contrast to utility-scale PVs, distributed PVs generate power in isolation; hence, it is necessary to adopt grid-connected technology to integrate them into electrical networks for achieving the greatest benefits (Zambrano-Asanza et al., 2021). To help with PV integration and monitoring, there are strong interests among governments and utility decision-makers in obtaining localized information of existing PVs, such as the location, size, capacity, and power output (Rico Espinosa et al., 2020; Yao and Hu, 2017). Traditional methods, such as in situ survey and bottom-up reporting, are generally time-consuming and incomplete. In addition, the obtained results lack the desired geospatial precision and may be outdated due to the rapid growth of PVs. Therefore, frequent data collection is necessary, and an efficient data acquisition method is required.
With the advance of spatiotemporal resolution of onboard sensors, satellite and aerial photography can provide up-to-date images of specific ground targets, making them an ideal source for obtaining accurate PV information (Perez et al., 2001; Peters et al., 2018; Wang et al., 2018). PV panels can be detected and segmented from satellite or aerial images by designing representative features (e.g., color, spectrum, geometry, and texture). However, these features vary with different atmospheric conditions, light circumstances, satellite sensors, observation scales, and surroundings, leading to the defects of the generalization ability in extended applications (Ji et al., 2019, 2020; Wang et al., 2018). Deep learning has been favored in recent years in view of its success in object detection and image classification. Several convolutional neural networks (CNNs) have been proposed to localize solar PVs from satellite imagery and estimate their sizes (Golovko et al., 2017; House et al., 2018; Liang et al., 2020; Malof et al., 2015). For example, Yu et al. (2018) utilized the transfer learning to train a CNN classifier for PV identification and then added an additional CNN branch directly connected to the intermediate layers for PV segmentation. Apart from the structure of deep networks, the quality of labeled samples largely determines the final accuracy of obtained information (Ball et al., 2017; Reichstein et al., 2019). Researchers have spent a huge amount of time on building benchmark datasets generated from aerial or satellite imagery (Ji et al., 2019; Li et al., 2020; Xia et al., 2018). However, to date, there are no open-source datasets available for PVs and no relevant studies evaluating the generalization ability of deep learning from aerial data to satellite data, and vice versa.
To meet the requirements of deep learning for labeled samples, we built a PV dataset from satellite and aerial imagery at three different spatial resolutions (i.e., 0.8, 0.3, and 0.1 m). We tested the effectiveness of our datasets in extracting multi-scale PVs using the coarse satellite samples (0.8 m) for concentrated PVs, the medium aerial samples (0.3 m) for distributed ground PVs, and the high-resolution unmanned aerial vehicle (UAV) samples (0.1 m) for fine-grained rooftop PVs. In addition, we evaluated the feasibility of deep networks for cross applications between satellite and aerial samples. Our dataset will contribute to a variety of PV applications in the future.
All PV samples are collected in Jiangsu Province, China, covering a total area of 107 200 km2 (Fig. 1a). Located in the lower reaches of the Yangtze River and Huaihe River, the province is very flat, averaging only 12.3 m above sea level. The land terrain is mostly made up of low lands and flat plains, with hills and mountains in the southwest and north (Fig. 1b). With the continuous economic development and population growth, the energy demand in Jiangsu Province is increasing rapidly. The government was committed to energy transition by improving energy efficiency and promoting the use of green energy. A number of policies were introduced to popularize solar PVs. Due to the shortage of land resources, most of the installed PVs in Jiangsu Province are distributed in areas where land competition is not fierce (e.g., sparse shrubs, low-density grasslands, reservoirs, ponds, saline–alkali lands, and rooftops), which makes it convenient to collect various PVs with different backgrounds.
The sizes of distributed PVs typically vary from a few panels to several hectares depending on the area of available background land. It is difficult to identify all these PVs from a single data source; hence, we used satellite and aerial images with different spatial resolutions to collect PV samples at various scales. Gaofen-2 and Beijing-2 satellite images are used to prepare samples of large-scale PVs. Gaofen-2 is part of the CHEOS (China High Resolution Earth Observation System) family and is capable of acquiring images with a ground sampling distance (GSD) of 0.81 m in panchromatic and 3.24 m in multispectral bands. The Beijing-2 satellite constellation consists of three satellites and can provide images with a GSD of 0.80 m in the panchromatic band and 3.2 m in the blue, green, red, and near-infrared bands. Aerial imagery with a GSD of 0.3 m is used to collect samples of distributed ground PVs. The aerial photography was conducted by the Provincial Geomatics Center of Jiangsu in 2018, covering the whole of Jiangsu Province. UAV images are used to collect rooftop PV samples. The UAV flight was carried out in Hai'an County (yellow box in Fig. 1b), where the development of rooftop PVs is relatively advanced. Ground control point (GCP) data obtained by continuous operating reference stations were used for georeferencing. The final orthophotos have a GSD of 0.1 m and location accuracy of approximately 0.02 m. Figure 1c–d illustrate the appearance of two rooftop PVs in different images. In the Gaofen-2 image, the PVs take up only a dozen pixels that are mixed with surrounding rooftops (Fig. 1c). It is difficult to distinguish the PVs from the background, let alone get their exact position and size. In contrast, PV detection becomes slightly easier in the aerial photograph (Fig. 1d), but obtaining accurate PV boundaries is still difficult. In the UAV image (Fig. 1e), we can clearly recognize the PVs, obtain their boundaries, and even count how many panels each PV is composed of. This example illustrates the necessity of using multi-resolution images to build PV datasets that meet the needs of a variety of applications.
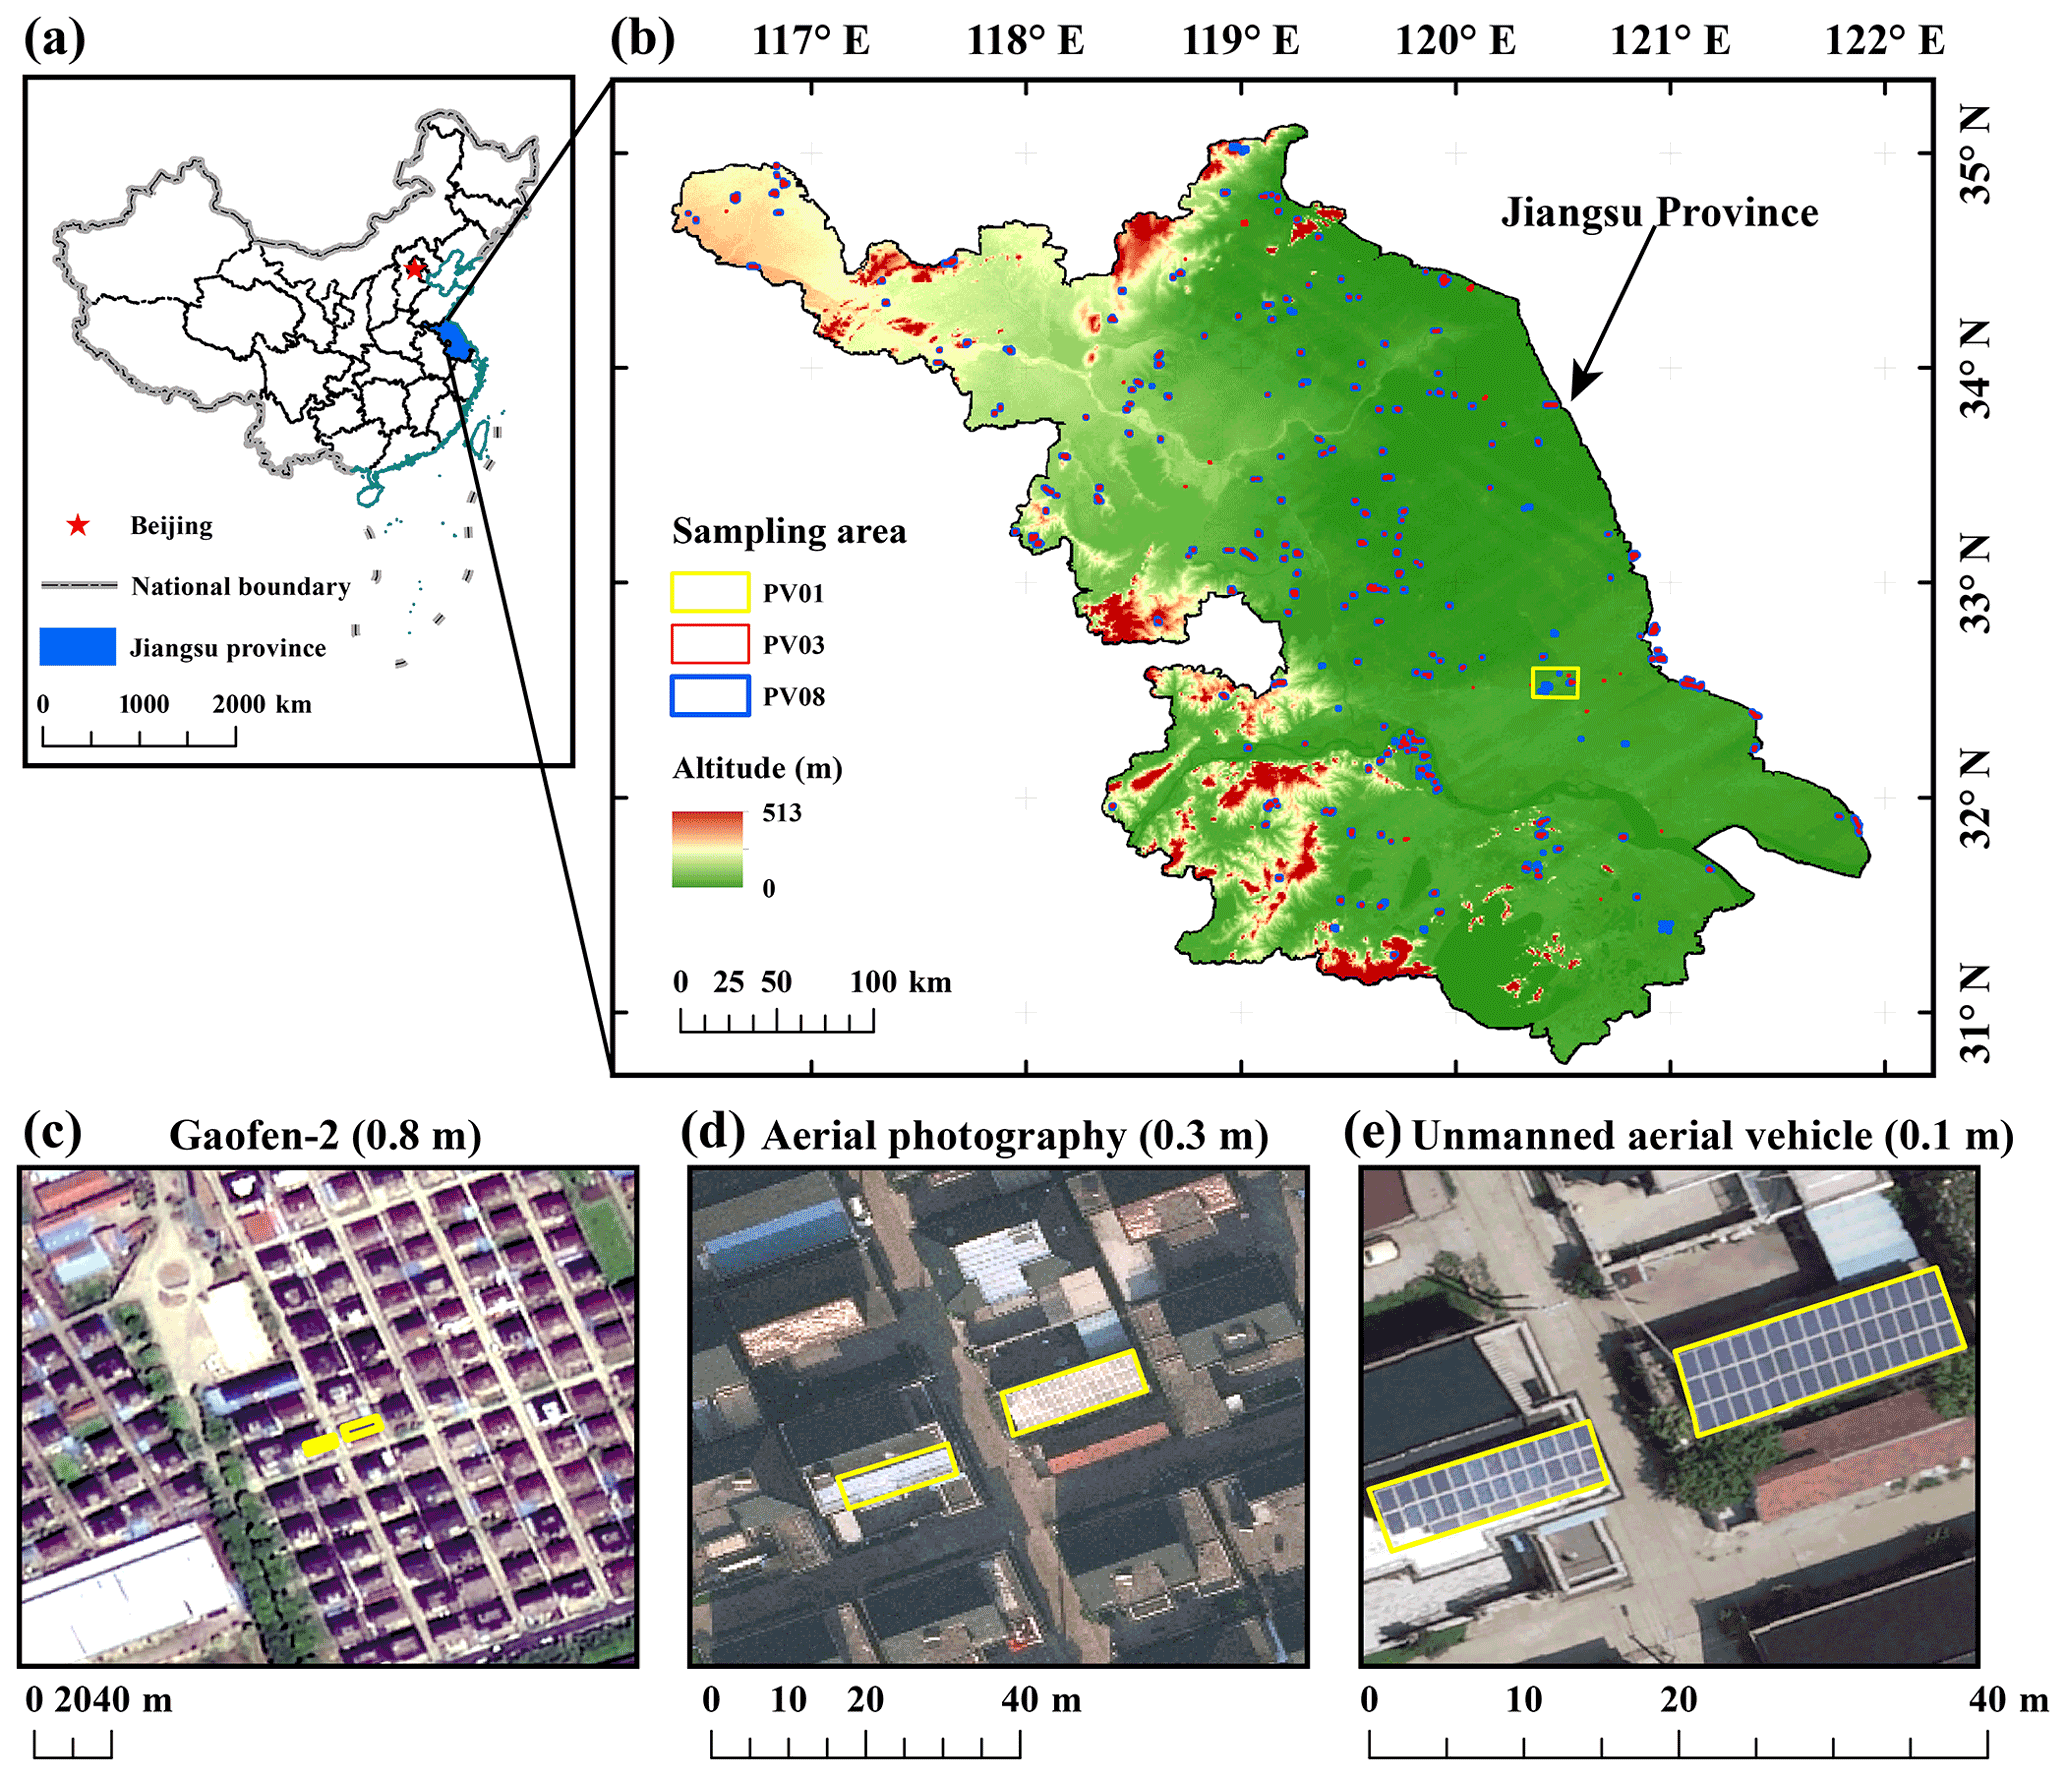
Figure 1Map of the study area and data sources. (a) The location of Jiangsu Province; (b) spatial distribution of all sampling areas; (c) Gaofen-2 satellite image with a spatial resolution of 0.8 m; (d) image from aerial photography with a spatial resolution of 0.3 m; and (e) image from unmanned aerial vehicle with a spatial resolution of 0.1 m. The yellow boxes in panels (c–e) represent the same rooftop PVs.
The schematic workflow to generate PV samples is shown in Fig. 2. The main procedures are described in the following:
-
Data pre-processing. To obtain high-quality PV samples, a series of pre-processing methods were applied to the original satellite and aerial images. We first checked the raw data and removed images with lots of clouds, noise, and bright spots. Geometric correction was undertaken to eliminate the spatial distortions in original images, and additional orthorectification was used for aerial images to minimize the perspective (tilt) and relief (terrain) effects. The adaptive pan sharpening method (Song et al., 2016) was utilized to improve the spatial resolution of multi-spectral images by fusing the panchromatic band. We also performed block adjustment on multi-temporal images to ensure that they have the same location accuracy. Finally, we use histogram equalization to adjust the hue component of the images.
-
Sample organization. Our PV dataset includes three groups of PV samples collected at different spatial resolutions (Table 1), namely PV08 from Gaofen-2 and Beijing-2 imagery, PV03 from aerial photography, and PV01 from UAV orthophotos. PV08 contains rooftop and ground PV samples. Ground samples in PV03 are divided into five categories according to their background land use type: shrub land, grassland, cropland, saline–alkali land, and water surface. Rooftop samples in PV01 are divided into three categories according to their background roof type: flat concrete, steel tile, and brick.
-
Image annotation. Due to the differences in the shape, size, and direction of various PVs, we used polygonal annotations, that is, drawing lines by placing points around the outer edges of each PV panel. The inner space surrounded by the points was then assigned a predefined code in Table 1 to indicate the category to which it belongs. The annotators worked in pairs to ensure that each PV panel was annotated twice. After getting the initial annotations, a third annotator would merge the two annotations and check one by one to fix the potential errors. Finally, a supervisor was responsible for checking the quality of all annotations, including location and category. Figure 3 shows some examples of PV panels and their annotations.
-
Sample making. The shapefile of polygonal annotations was converted to a raster that has the same spatial resolution as satellite or aerial images. The raster and original red, green, and blue (RGB) images were then seamlessly cropped into tiles at a fixed size by referring to the sampling grids. Tiles containing a single category of PVs were paired with corresponding image blocks to form a complete sample (refer to the example in Fig. 2). We prepared PV08 and PV03 samples at the size of 1024 × 1024 pixels, while PV01 samples were prepared at the size of 256 × 256 pixels. The numbers of each category are listed in Table 1.
One concern of our dataset is the representativeness of the samples because the changes in geographic context will inevitably affect the performance of deep learning models. We compared the samples from Gaofen-2 and Beijing-2 images and found that PV panels exhibit similar characteristics in high-resolution imagery and that the main difference comes from the background. Therefore, we collected samples covering as many backgrounds as possible to ensure the representativeness. Besides, some skills (e.g., transferring learning, cross-domain feature representation) in the deep learning community can be adopted to enhance the generalization ability of deep networks trained by our dataset, which is beyond the discussion of this study. In the following, we introduce some applications of deep learning to illustrate the quality and value of our dataset.
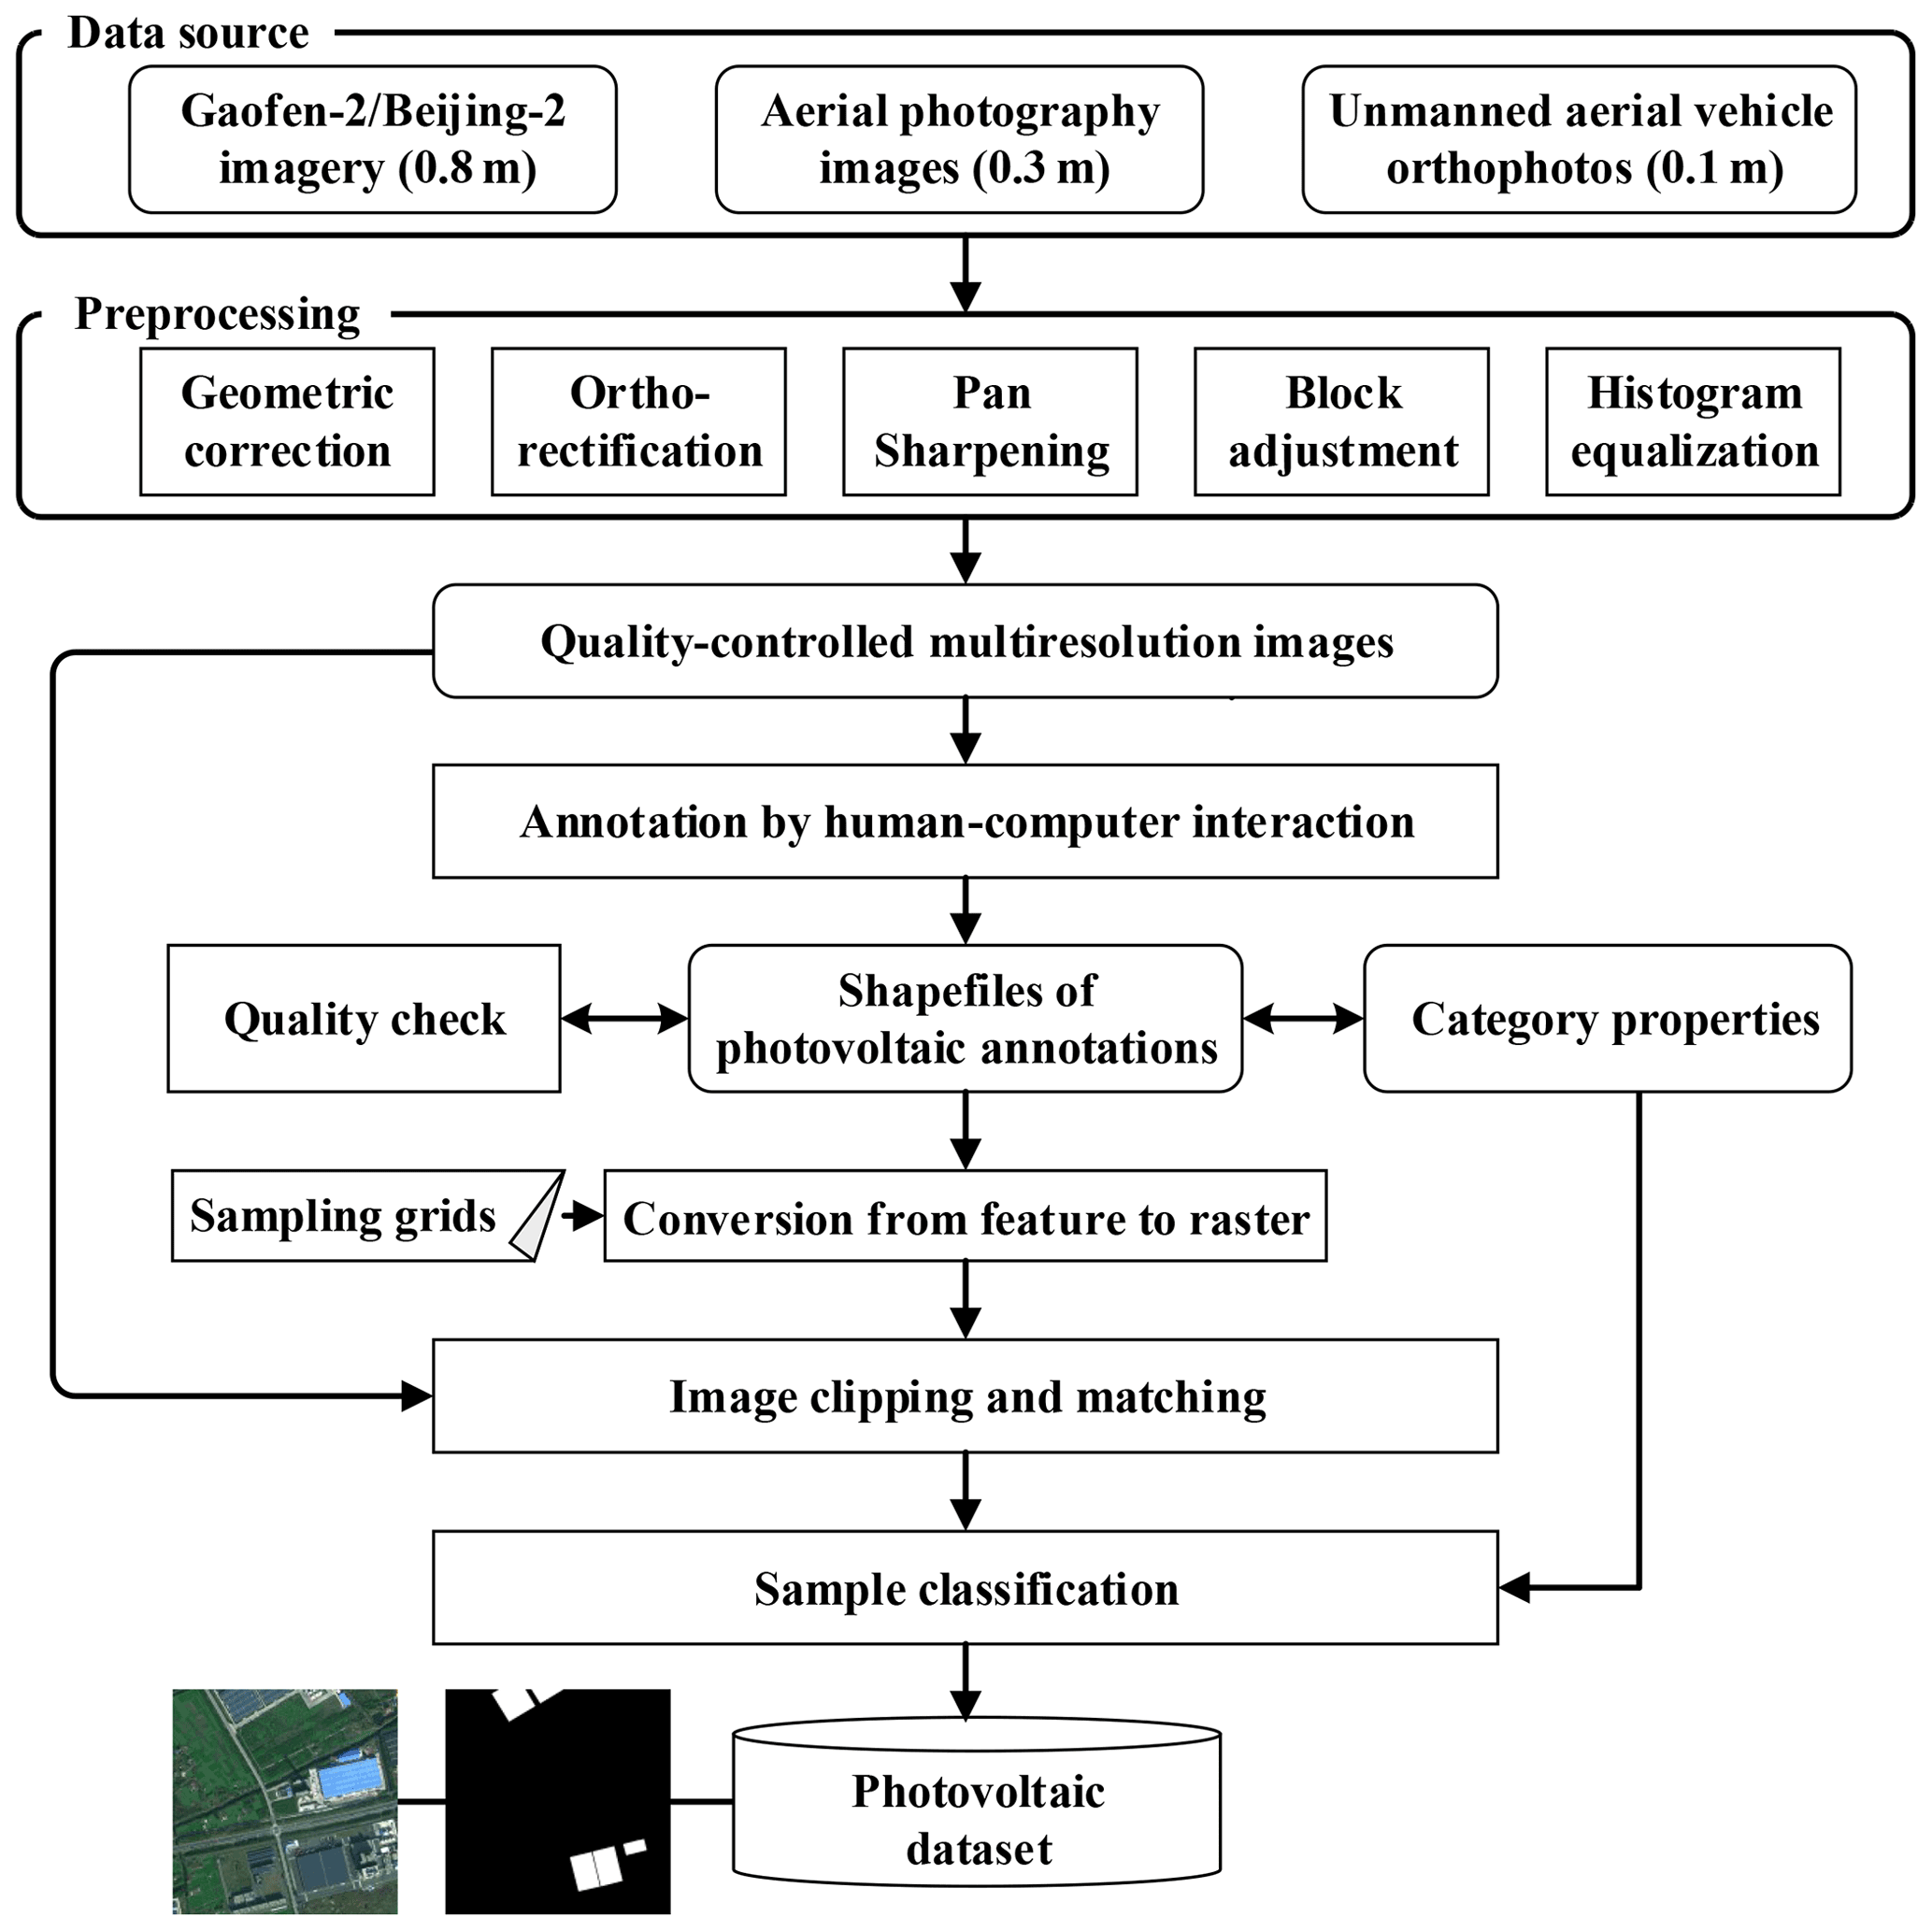
Figure 2Flowchart to generate PV samples.
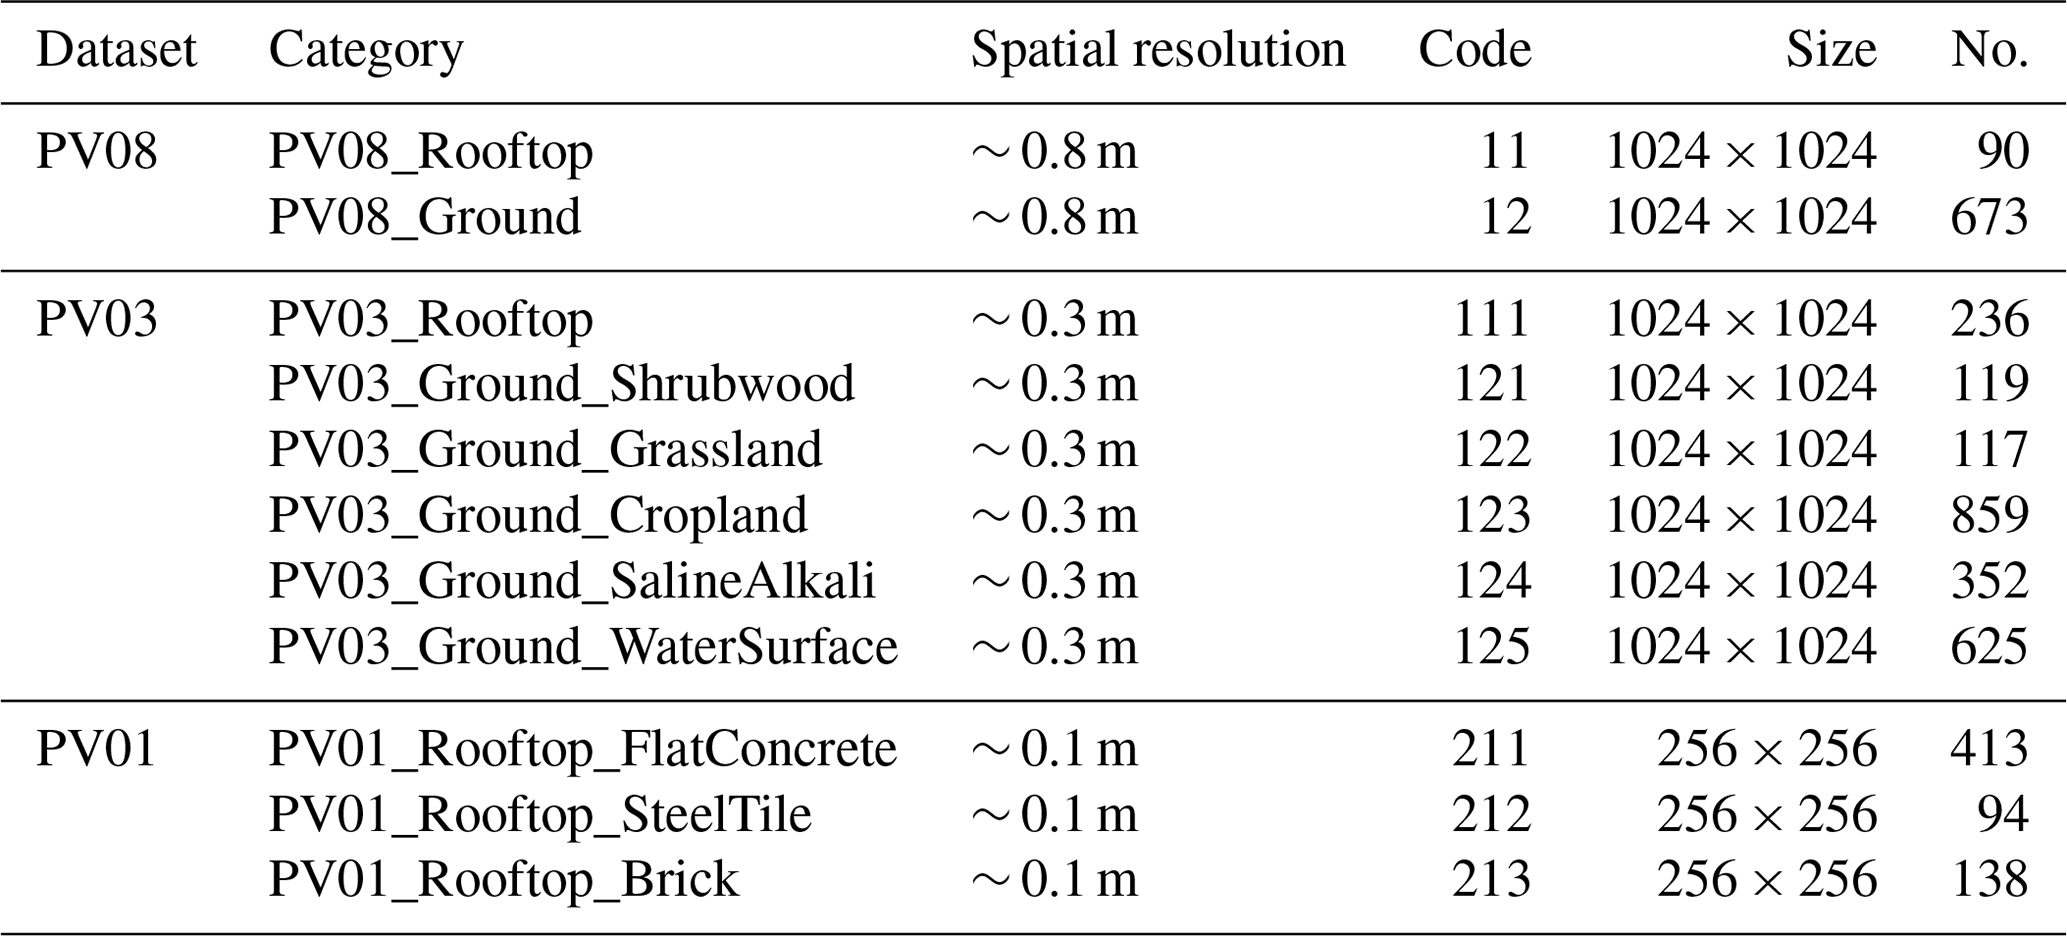
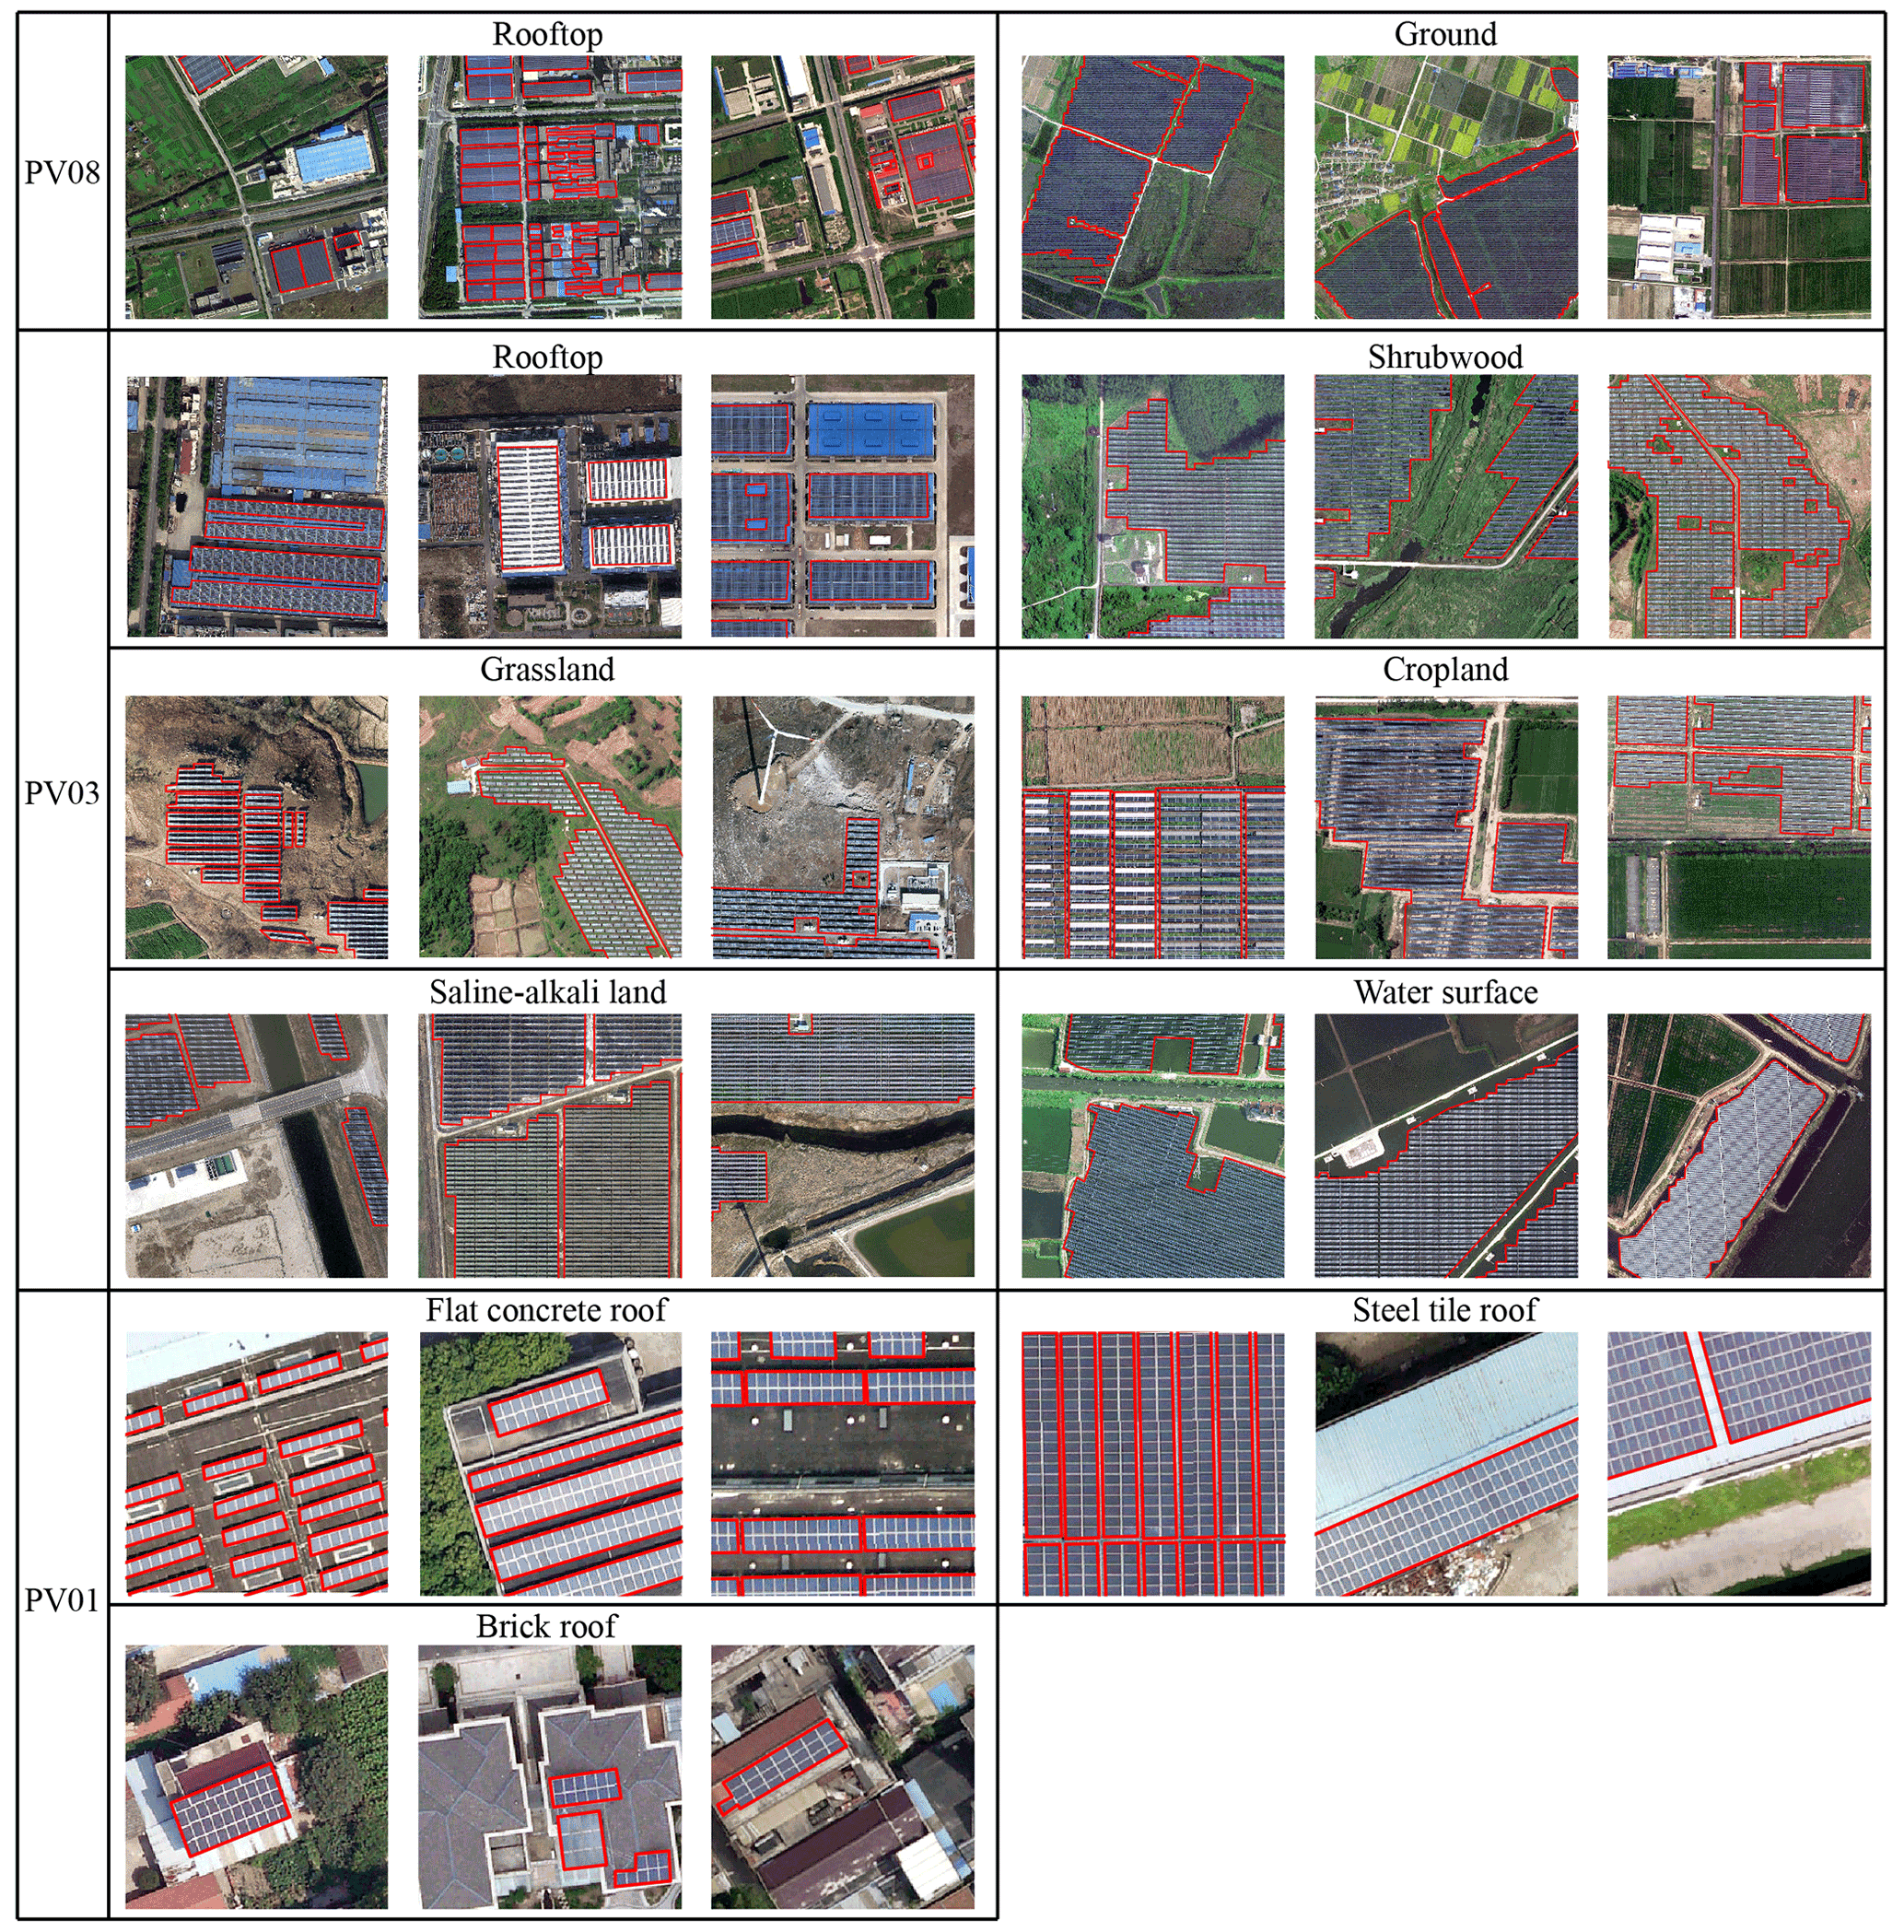
Figure 3Examples of PV panels and their annotations. Red boxes indicate the boundaries of PV panels.
4.1 PV segmentation using deep networks
To examine the possibility of extracting multi-scale PVs from complex backgrounds based on our dataset, we carried out a group of segmentation experiments using deep learning. We compared the performance of three deep networks, including U-Net (Ronneberger et al., 2015), RefineNet (Lin et al., 2017), and DeepLab v3+ (Chen et al., 2018). The U-Net consists of a contracting path (encoder) to capture context and a symmetric expanding path (decoder) that enables precise localization. The feature map of the encoder is combined with the up-sampling feature map of the decoder through skip connection to generate the final segmentation map. The RefineNet is a multi-path refinement network which exploits all information available along the down-sampling process to enable high-resolution prediction. The high-level semantic features are refined using low-level fine-grained features. In addition, a chained residual pooling is introduced into individual residual connections to capture background context. The DeepLab v3+ combines the advantages from a spatial pyramid pooling module and encoder–decoder structure. The former is capable of encoding multi-scale contextual information, while the latter can enhance the ability to capture object boundaries.
The experiments were conducted on PV08, PV03, and PV01 datasets. For each sub-category (e.g., PV08_Rooftop, PV08_Ground), all samples were separated into 80 % training set (from which 20 % of the samples were used for validation) and 20 % testing set. The Adam optimizer was used for training, and an early stopping mechanism was adopted to prevent overfitting. The final segmentation results were evaluated using five indicators, including accuracy, precision, recall, F1 score, and intersection over union (IoU). Accuracy refers to the ratio of PVs and background correctly classified by the model to the sum of PVs and background in the image. Precision is the ratio of PVs correctly identified by the model to the total number of PVs identified by the model, describing the reliability of PV segmentation results. The recall equals the ratio of PVs correctly identified by the model to the actual total number of PVs. F1 score () is a weighted average of precision and recall, providing a comprehensive evaluation of PV extraction results. IoU is the ratio of the intersection to the union between PVs identified by the model and the actual number of PVs. The evaluation accuracy of PV segmentation results is summarized in Table 2. It is noted that different networks were compared under equal conditions, and additional techniques (e.g., data augmentation, class weight) were not taken into account.
Table 2Segmentation accuracy in terms of different evaluation indices. The best values are marked in bold.

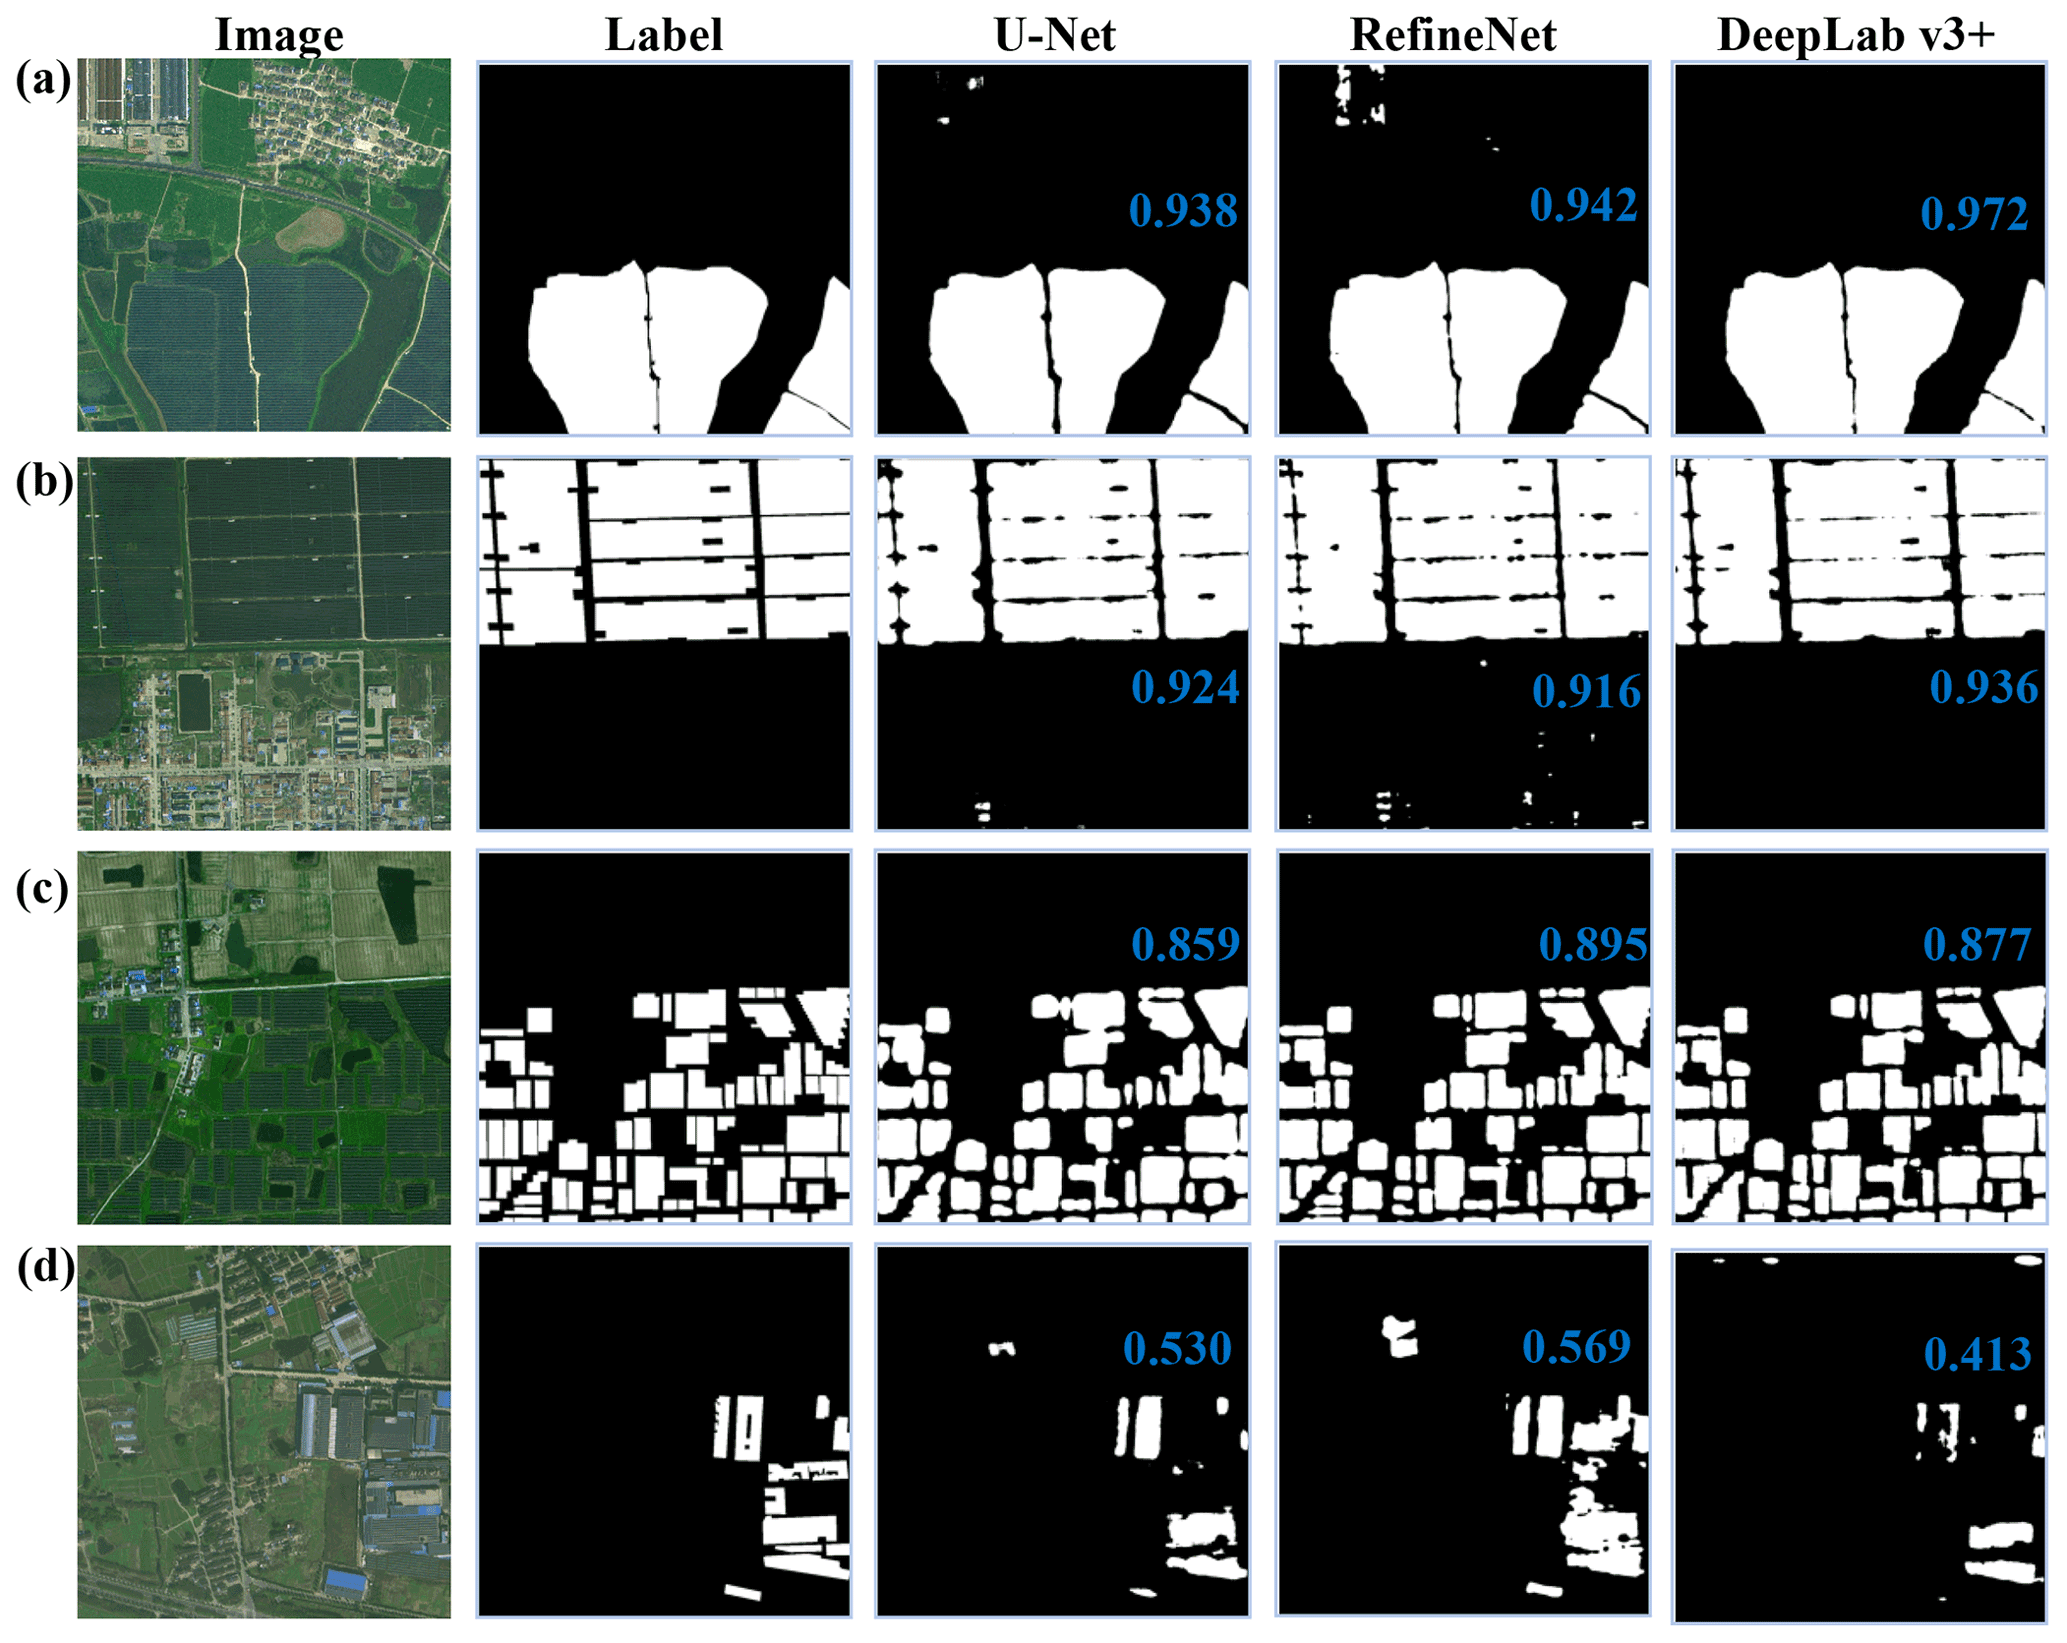
Figure 4Segmentation results of PVs in PV08 dataset. We show examples of concentrated ground PVs (a, b), distributed ground PVs (c), and distributed rooftop PVs (d). IoU of each segmentation result is marked in blue within the image.
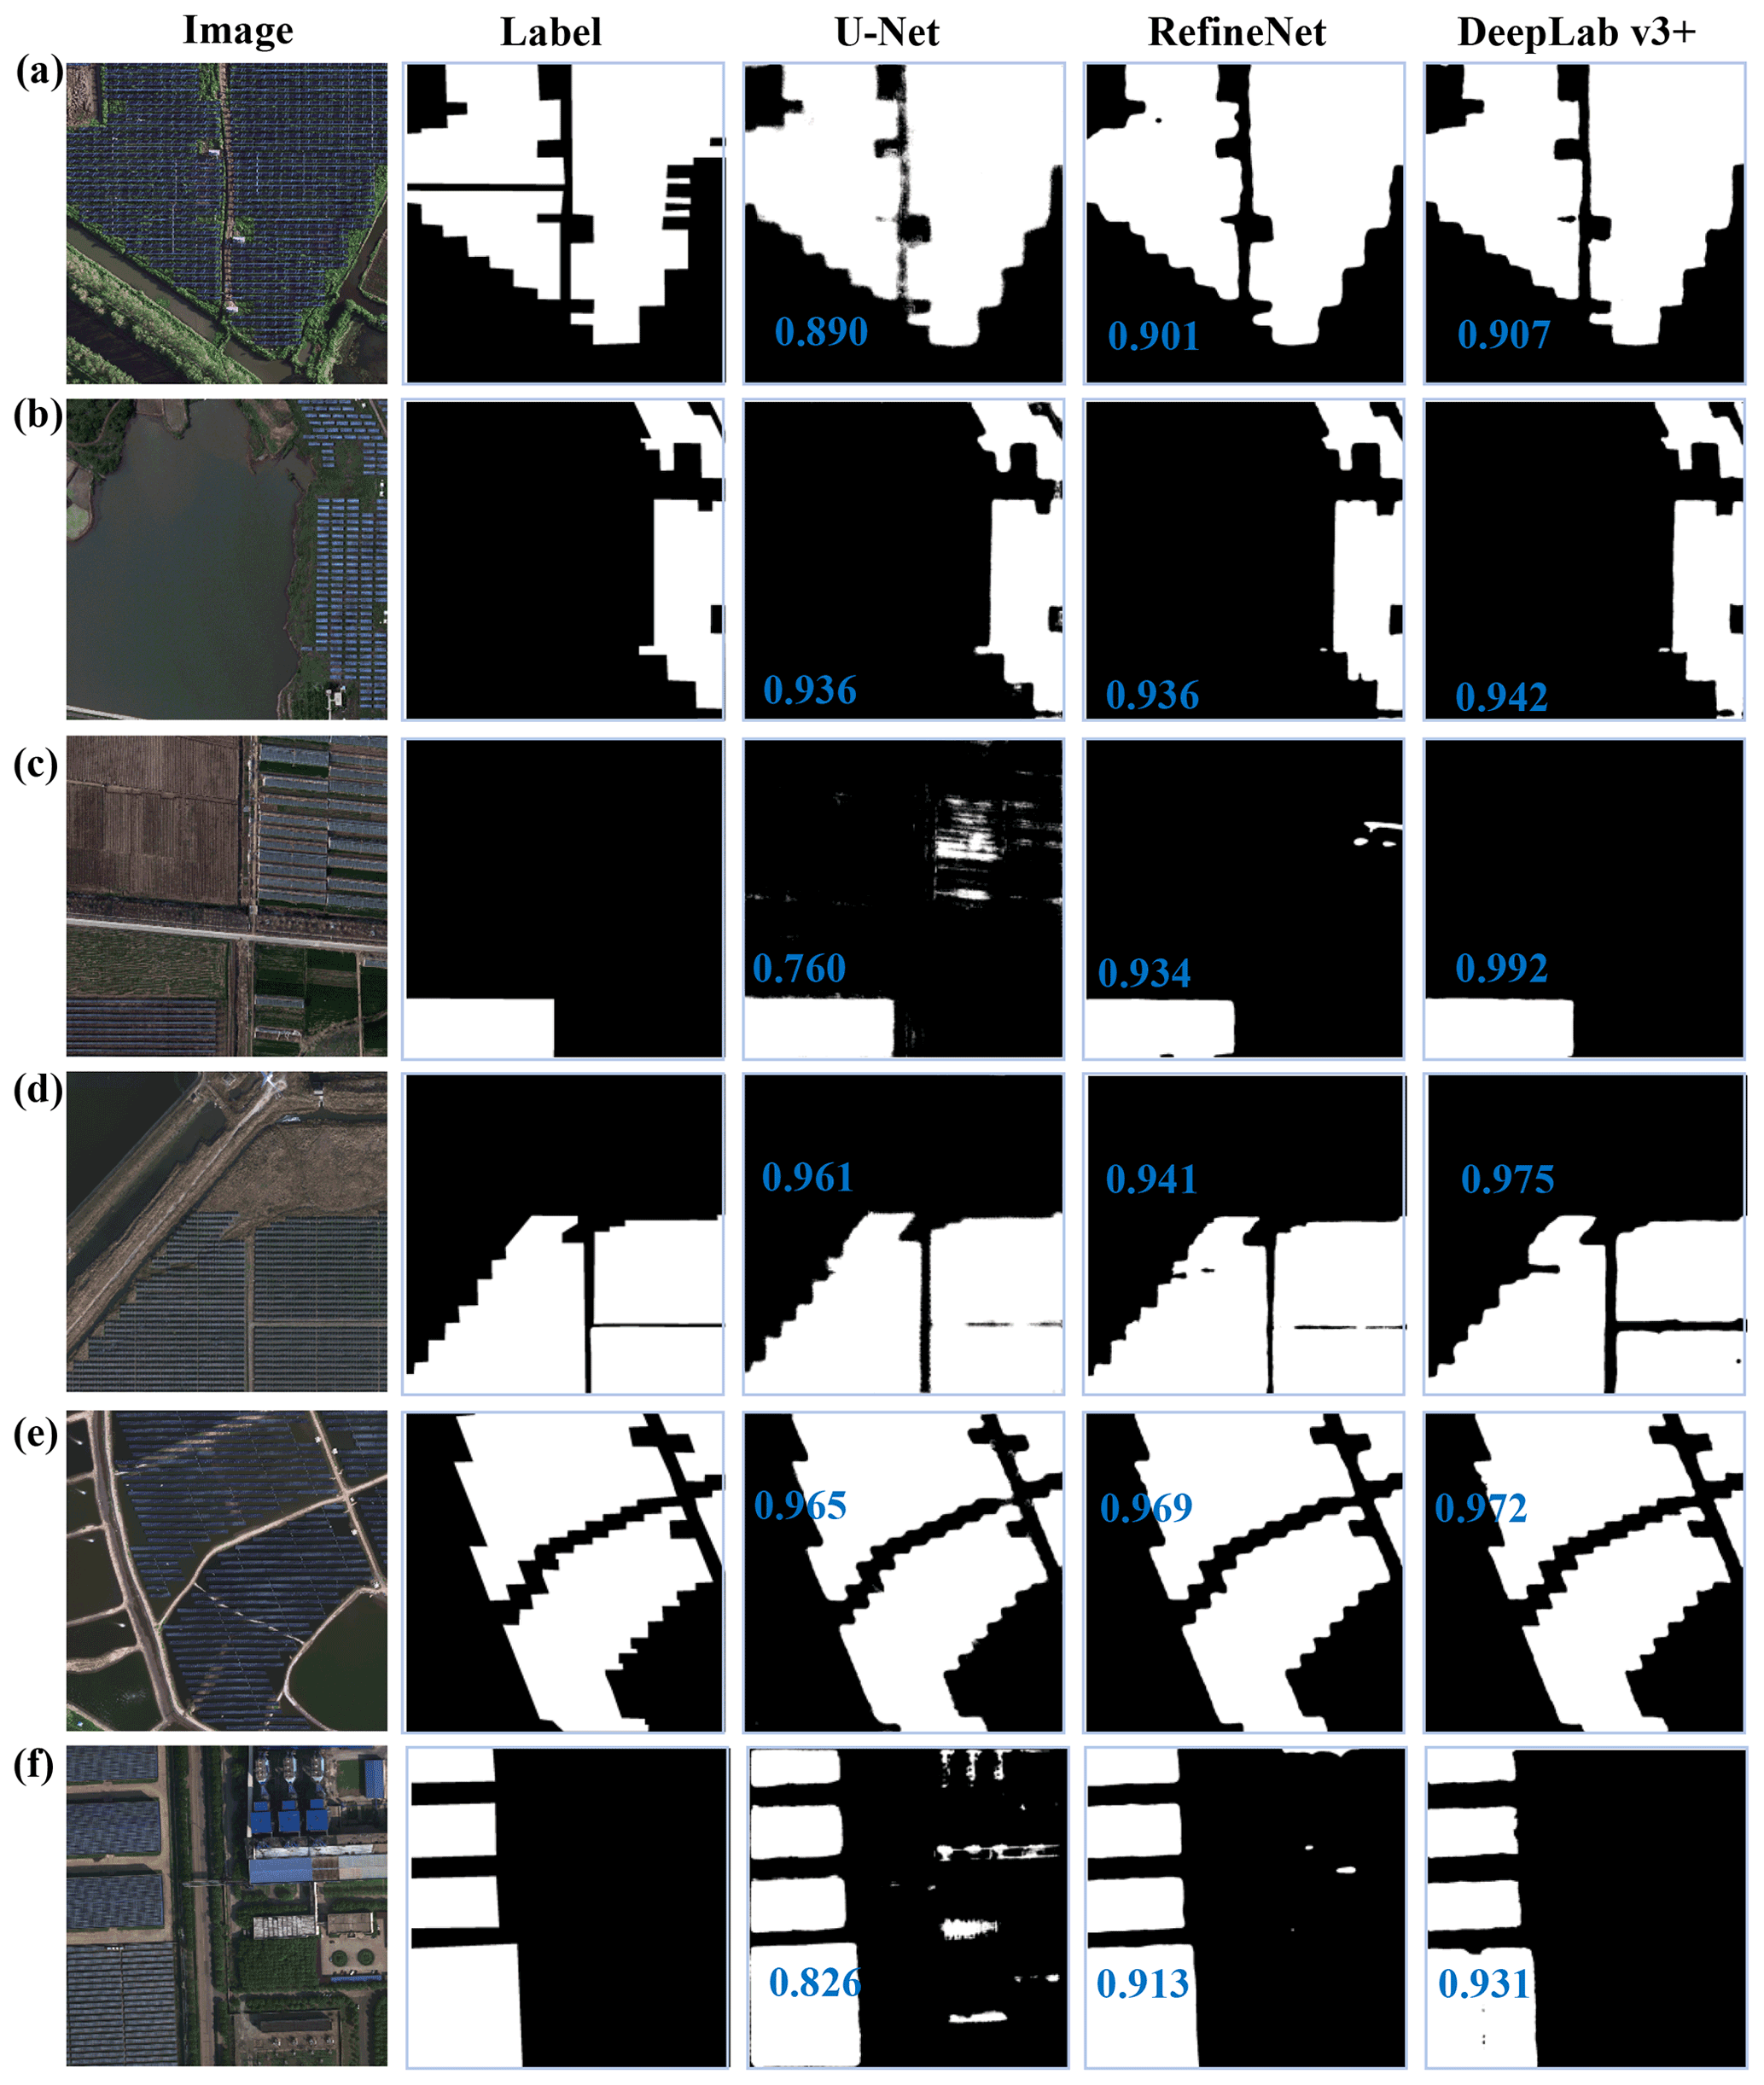
Figure 5Segmentation results of PVs in PV03 dataset. Examples correspond to PVs on shrub land (a), grassland (b), cropland (c), saline–alkali land (d), water surface (e), and rooftop (f). IoU of each segmentation result is marked in blue within the image.
Overall, DeepLab v3+ achieved the highest accuracy across all three datasets, followed by RefineNet and U-Net. The disparity among different models was relatively small at coarse spatial resolution (approximately 2 % in terms of IoU), but the advantage of the complex network became obvious as the spatial resolution increases (IoU difference reaches 5 % for PV03 and 8 % for PV01). The reasonable explanation is that in coarse satellite images the blurred boundaries between PVs and background prevent the complex networks from acquiring more useful information. Figures 4–6 show some examples which help us in understanding the effects of network structure and image resolution on the final segmentation results. With respect to the results of DeepLab v3+, some parts of PVs were lost (e.g., Figs. 4d, 5d, and 6c), and the gaps between adjacent PVs were wider than they actually were (e.g., Figs. 4b, 5d, and 6b). In contrast, RefineNet and U-Net misclassified portions with similar characteristics to PVs (e.g., Figs. 4a, b, d, 5a, c, f, and 6b and c). The phenomena suggest that DeepLab v3+ tends to ensure the extracted PVs are reliable, while RefineNet and U-Net try to identify as many PVs as possible. This explains why the precision of DeepLab v3+ was superior to those of RefineNet and U-Net, but the recall was the opposite (Table 2).
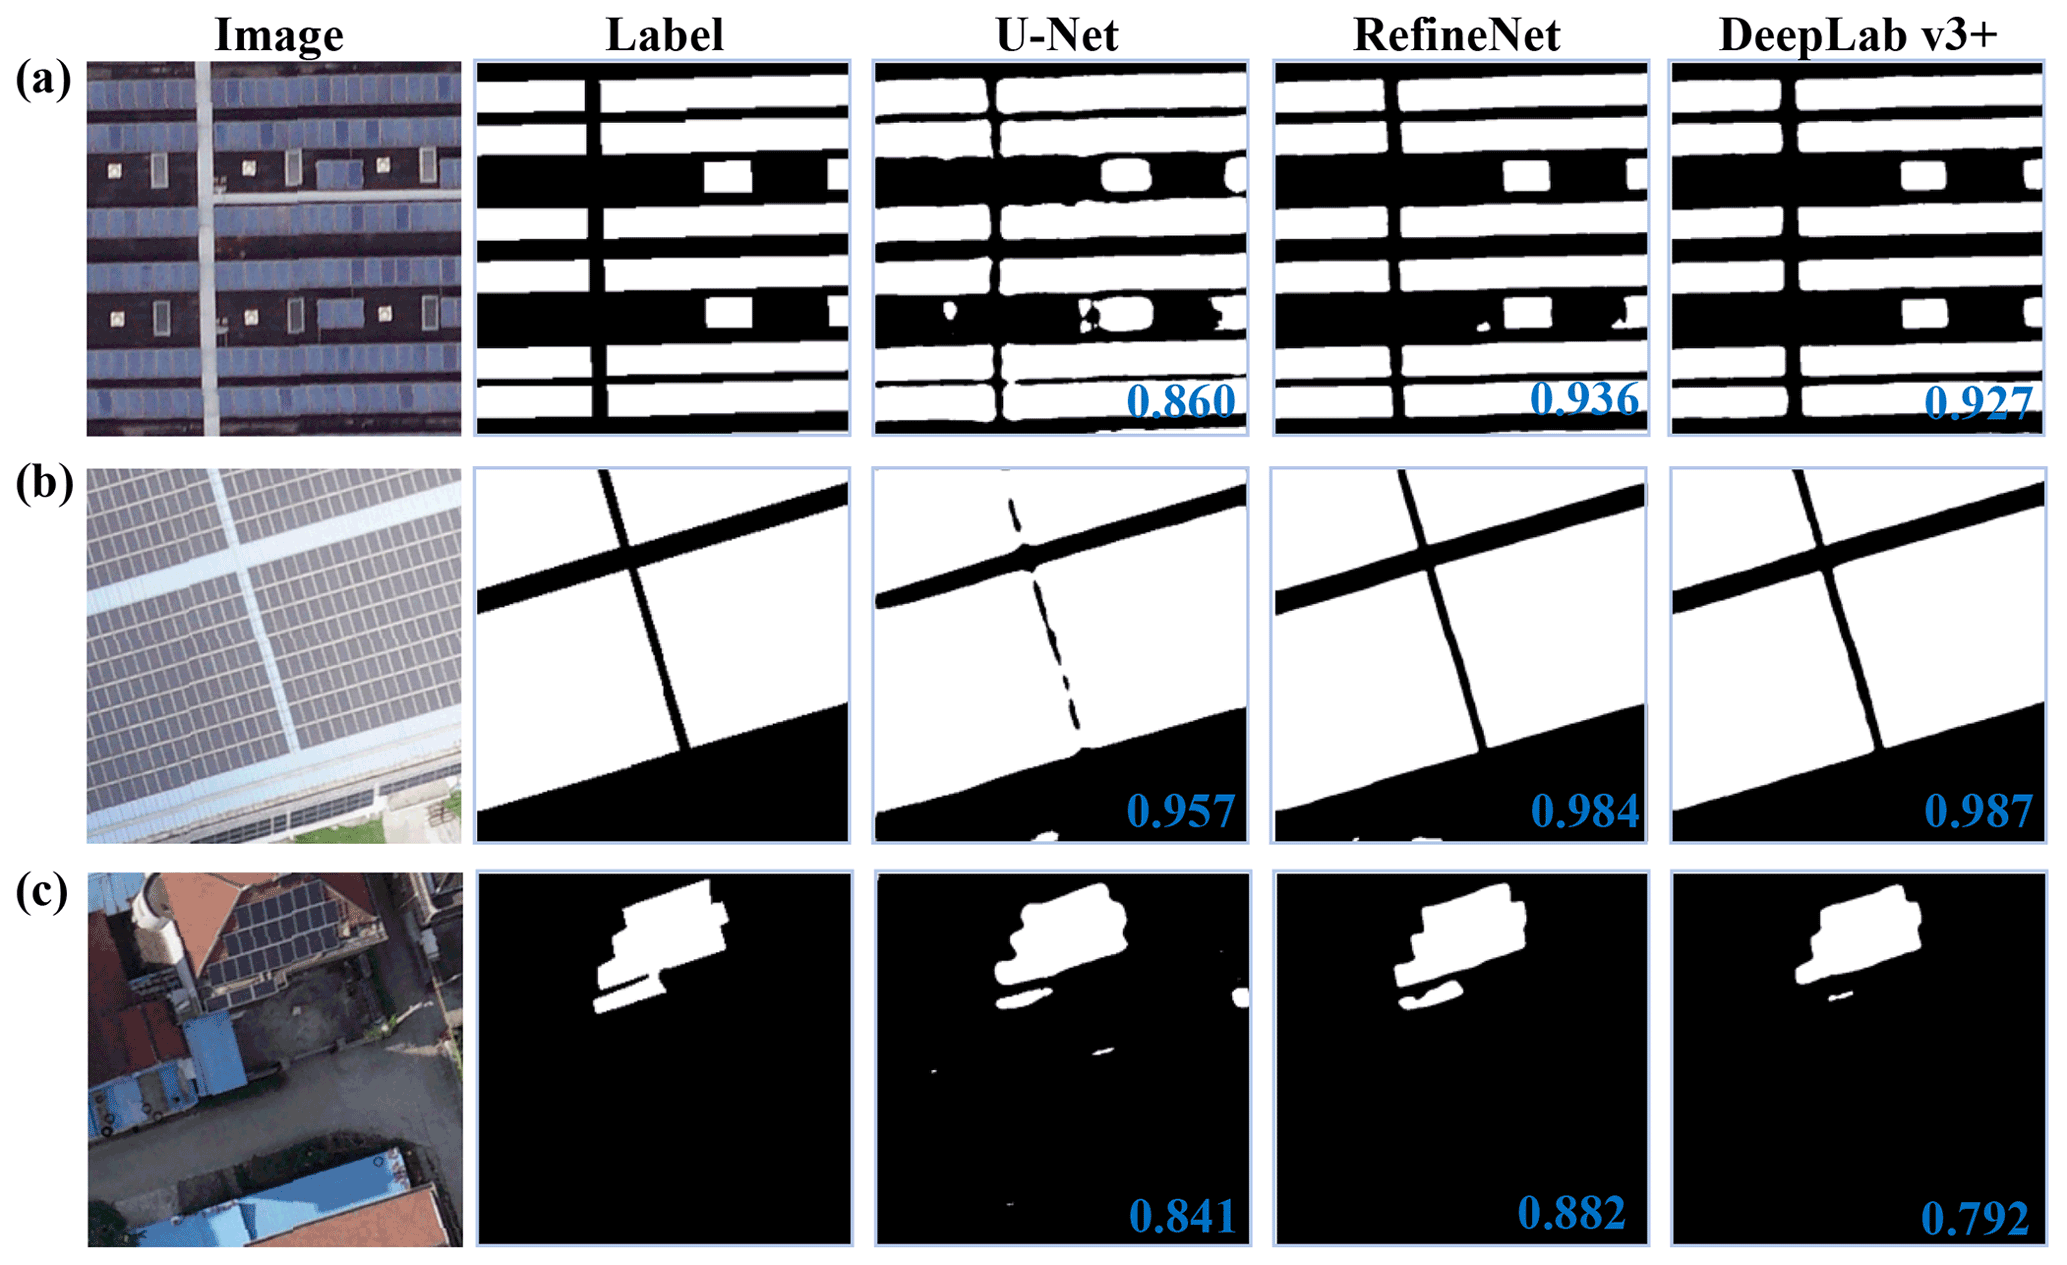
Figure 6Segmentation results of PVs in PV01 dataset. Examples correspond to PVs on flat concrete (a), steel tile (b), and brick (c) roofs. IoU of each segmentation result is marked in blue within the image.
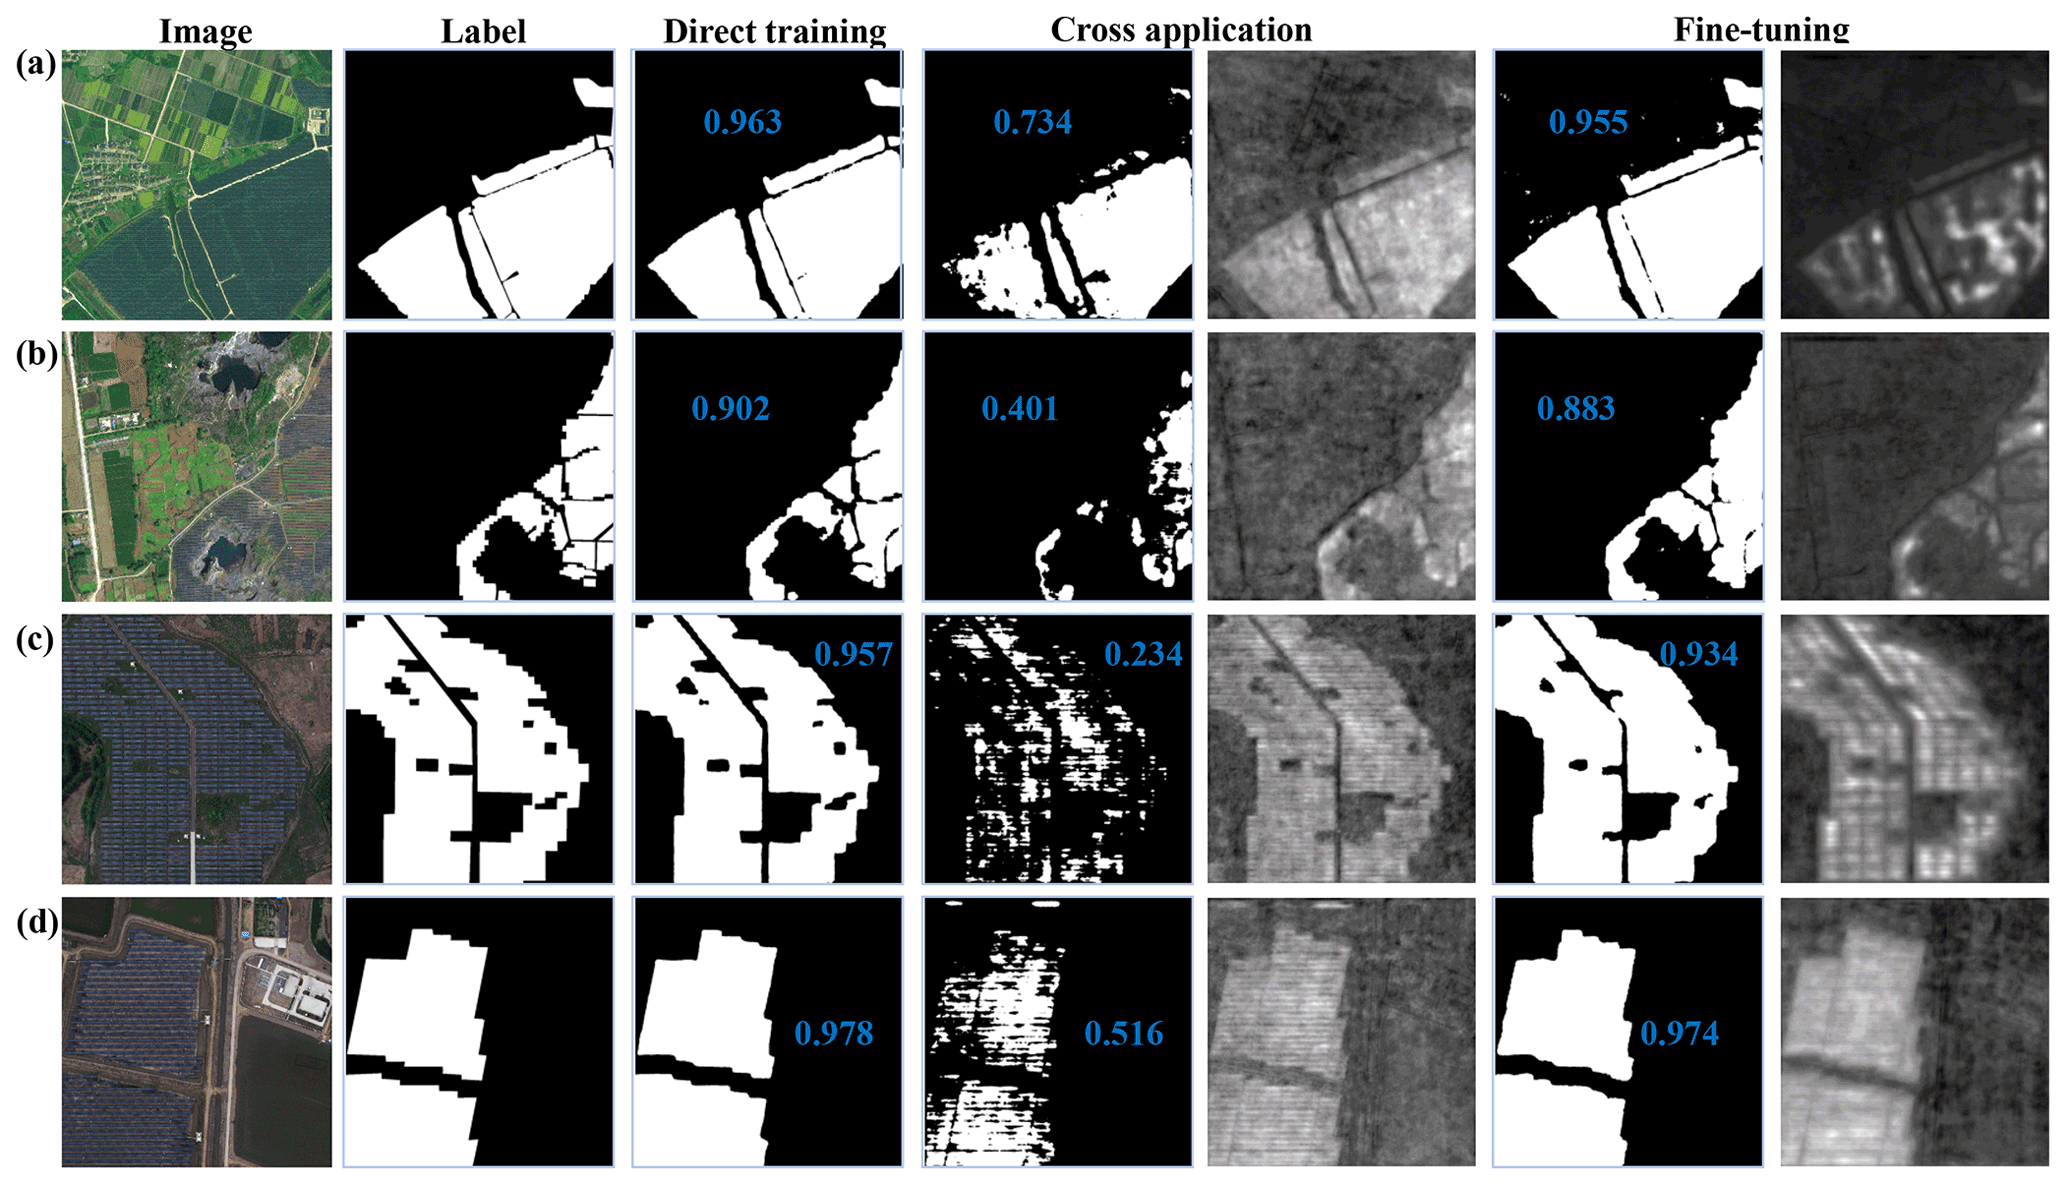
Figure 7Cross application of ground PV samples. Segmentation results of DeepLab v3+ from direct training, cross application, and fine-tuning are shown for PVs in the PV08 (a, b) and PV03 (c, d) datasets. Feature map for cross application and fine-tuning is displayed on the right of the corresponding segmentation result. IoU of each segmentation result is marked in blue within the image.
Utility-scale PVs account for approximately 88 % of the samples in PV08. The unbalance of training samples led to the difference in segmentation accuracy (higher for utility-scale PVs while lower for distributed PVs; Fig. 4), except that the spatial resolution was responsible for the poor performance on distributed PVs (Fig. 4c–d) that were mixed with background in the 0.8 m satellite images. We may conclude that PV08 samples are only suitable for large-scale PV extraction, and higher resolution is required for distributed PVs. Intuitively, the texture of distributed PVs becomes clear in the 0.3 m aerial images, and the contrast to the background is significant, making it easy to distinguish PVs from various backgrounds. The average IoU of DeepLab v3+ reached 0.900, 0.884, 0.920, 0.903, 0.911, and 0.926 for PVs on shrub land, grassland, cropland, saline–alkali land, water surface, and rooftop, respectively, which revealed that the segmentation accuracy was slightly affected by the background land types. PVs on flat concrete and steel tile roofs occupy the entire roof of large buildings, such as factories, shopping malls, business centers, and urban residential buildings, and thus seem “large scale” in the UAV images with a spatial resolution of 0.1 m. On average, DeepLab v3+ achieved an IoU of 0.873 for flat concrete PVs and 0.927 for steel tile PVs. In contrast, PVs on brick roofs of rural residential building and urban villas usually consist of several panels because of the limited area available for PV installations. These “small-scale” PVs may share the same feature with surrounding roofs or shadows, thus the segmentation accuracy was reduced to 0.850 in terms of IoU. Based on the above analysis, we recommend PV08 for extracting concentrated PVs, PV03 for distributed ground PVs, and PV01 for distributed rooftop PVs.
Table 3Segmentation accuracy of DeepLab v3+ trained by different strategies. The best values are marked in bold.
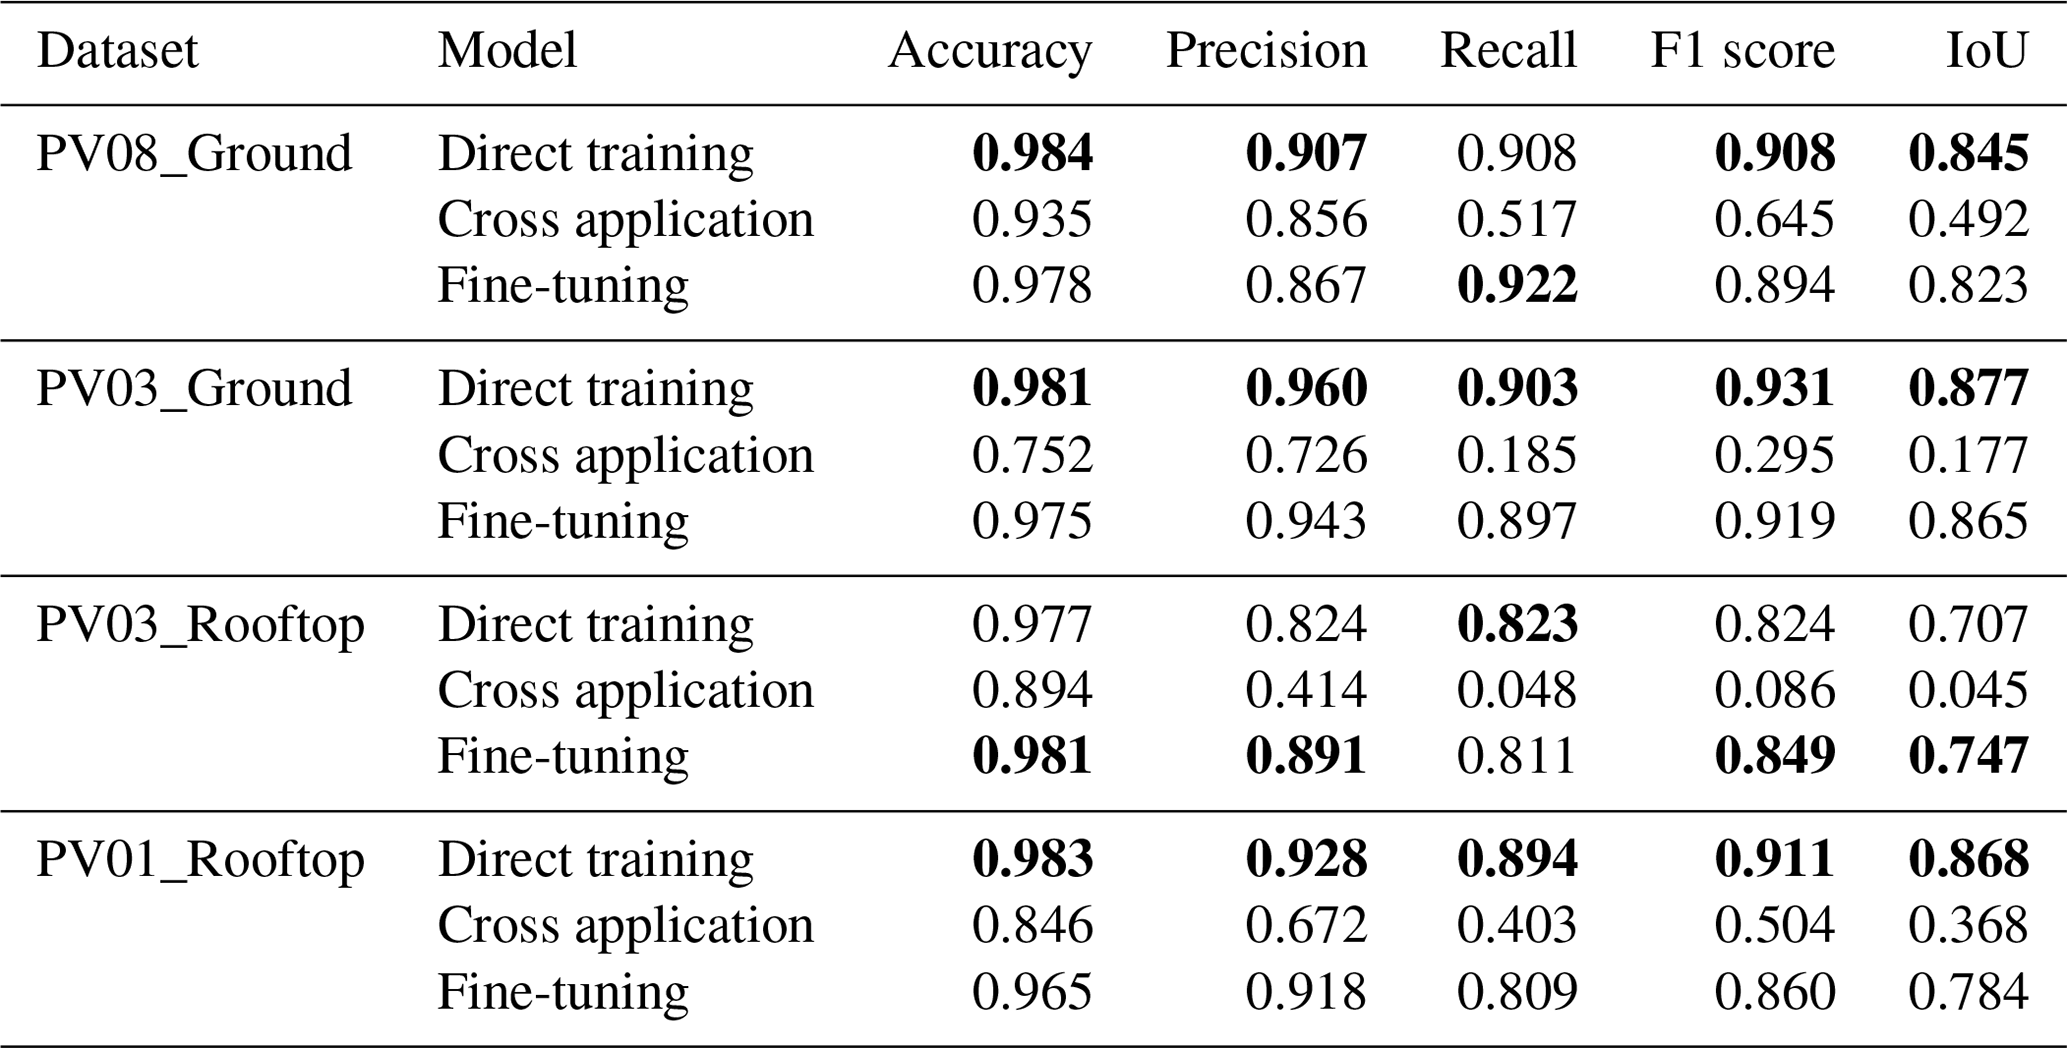
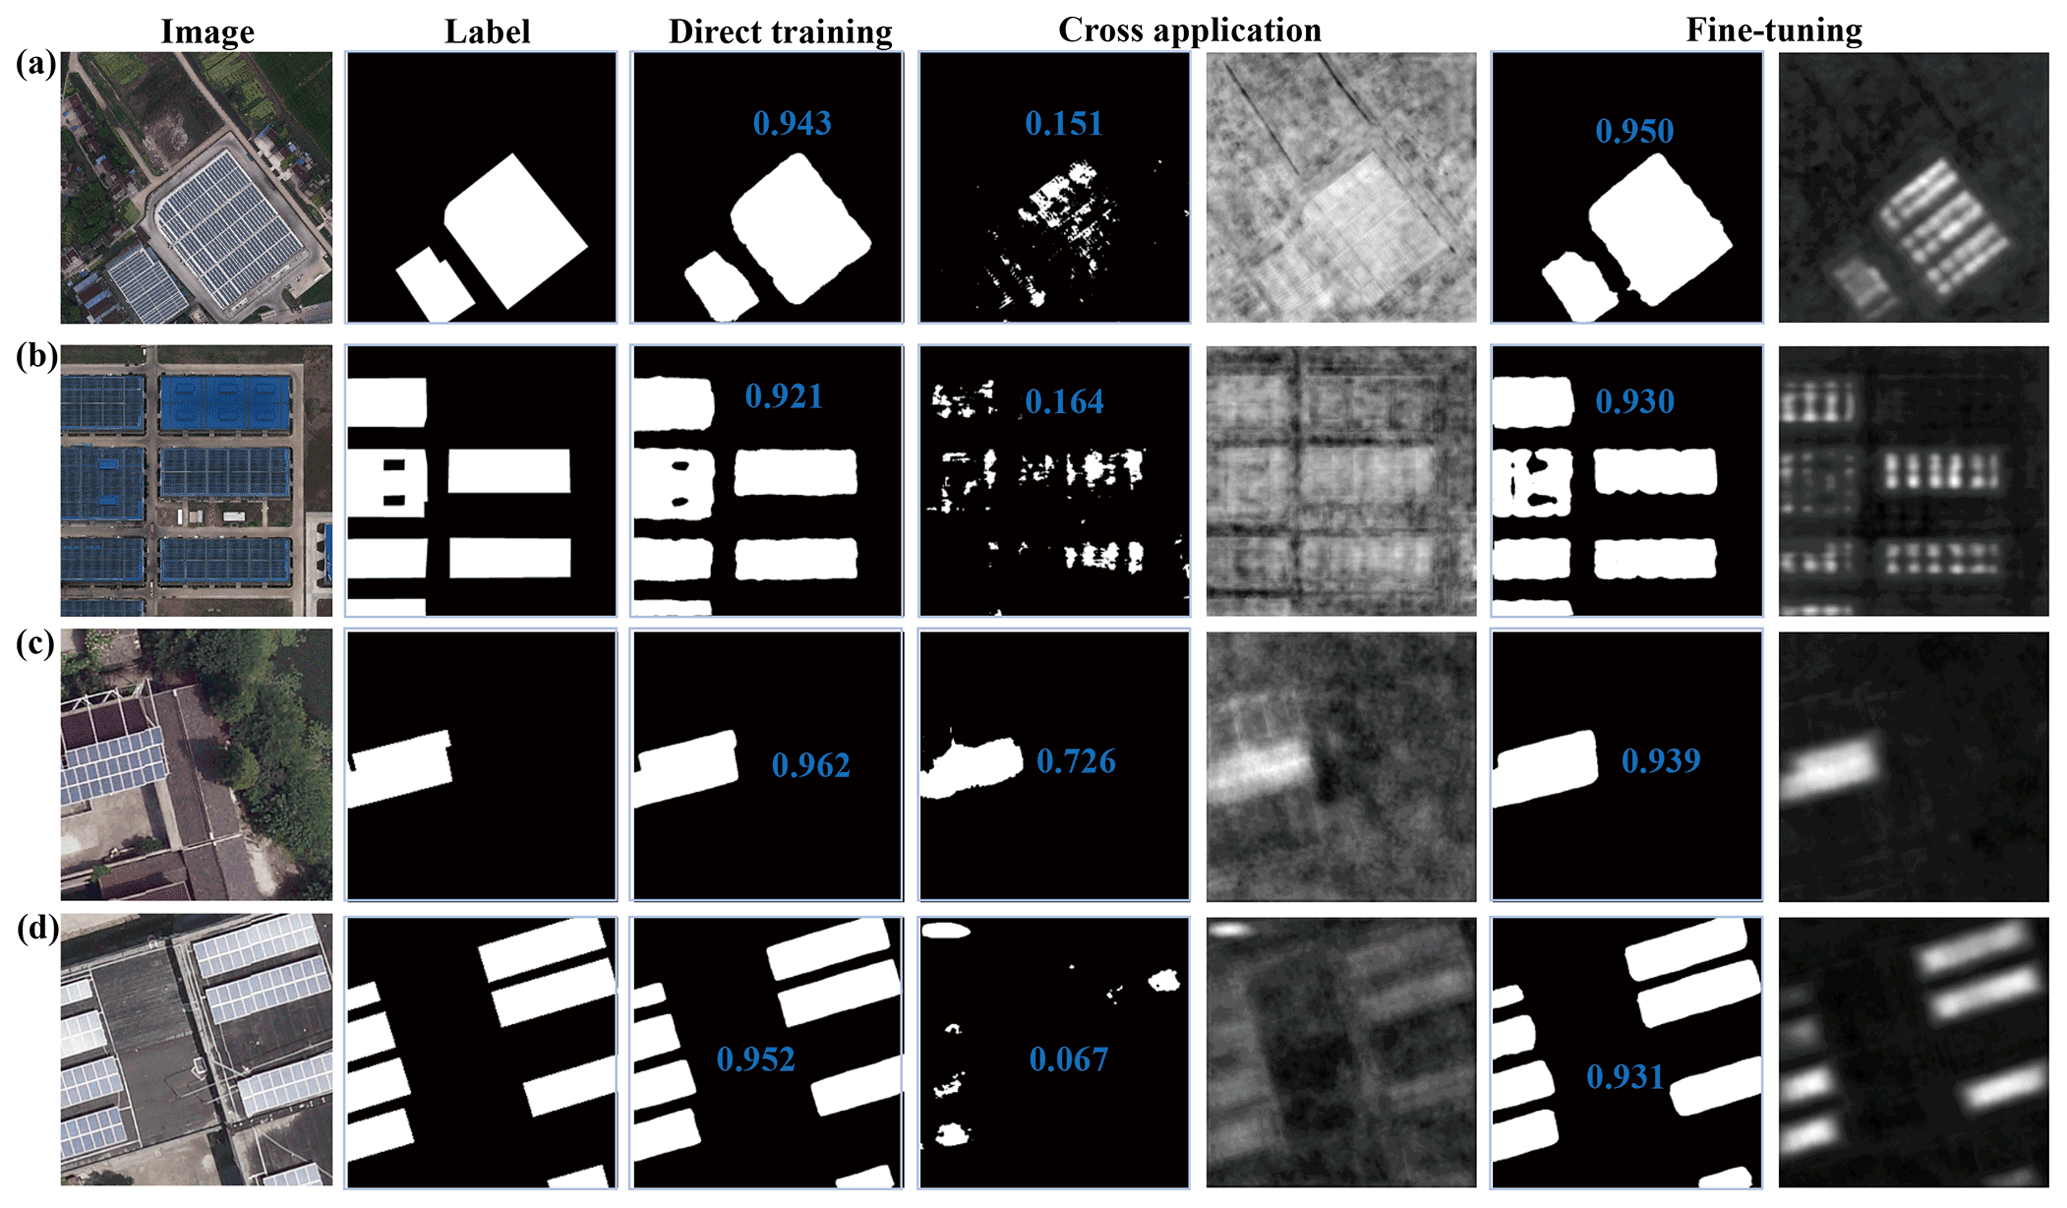
Figure 8Cross application of rooftop PV samples. Segmentation results of DeepLab v3+ from direct training, cross application, and fine-tuning are shown for PVs in the PV03 (a, b) and PV01 (c, d) datasets. Feature map for cross application and fine-tuning is displayed on the right of the corresponding segmentation result. IoU of each segmentation result is marked in blue within the image.
4.2 Cross application at different resolutions
The generalization capability of deep learning is critical to automatic information extraction. This section investigates the feasibility of cross application between PV samples with different spatial resolutions, including between PV08_Ground and PV03_Ground, and between PV03_Rooftop and PV01_Rooftop. We compared the segmentation results of DeepLab v3+ from direct training, cross application, and fine-tuning. Taking the experiment between PV08_Ground and PV03_Ground as an example, direct training means that DeepLab v3+ trained on PV08 (PV03) samples was applied to PV08 (PV03) samples; cross application means that the model was trained on PV03 (PV08) samples but applied to PV08 (PV03) samples; and fine-tuning means that the model was first pre-trained on PV03 (PV08) samples, then fine-tuned (fine-tuning process lasted 10 epochs) using PV08 (PV03) samples, and finally applied to PV08 (PV03) samples. The training set accounts for 80 % of the whole dataset, and the testing set is the remaining 20 %, but only 20 % of the samples from the training set of the target PV dataset are randomly selected for fine-tuning.
According to Table 3, the segmentation accuracy of cross application was terrible with extremely low recall and IoU. After fine-tuning, the accuracy increased rapidly to a level comparable to direct training. Some examples are given in Figs. 7–8, where the feature maps indicating the probability that each pixel belongs to PVs are illustrated for cross application and fine-tuning experiments. It can be seen that during cross application, the model captured the main feature of PVs, but the difference between PVs and background was not significant. Through fine-tuning, the differences were enhanced; hence, PVs could be easily segmented. Our experiments demonstrate that there are inherent defects in the cross application at different resolutions, but these defects can be compensated for by fine-tuning the target dataset. The fine-tuning approach avoids the time consumption of direct training and the huge investment of building complete datasets with various resolutions.
The PV dataset is freely available from the Zenodo website at https://doi.org/10.5281/zenodo.5171712 (Jiang et al., 2021). There are three compressed folders, namely PV08.zip, PV03.zip, and PV01.zip, for PV samples collected at the spatial resolutions of 0.8, 0.3, and 0.1 m, respectively. The original images are named as “PV0*_XXXXXX_ YYYYYYY.bmp”, and corresponding labels are named as “PV0*_XXXXXX_YYYYYYY_label.bmp” (* can be the number 8, 3, or 1). The central location (latitude, longitude) of each image equals (XX.XXXX, YY.YYYYY). For each label, “0” indicates the background, while the target PV is recorded as the code listed in Table 1.
This study built a multi-resolution dataset for PV panel segmentation, including PV08 from Gaofen-2 and Beijing-2 satellite images with a spatial resolution of 0.8 m, PV03 from aerial images with a spatial resolution of 0.3 m, and PV01 from UAV images with a spatial resolution of 0.1 m. Samples cover a variety of PVs installed on different lands (i.e., shrub land, grassland, cropland, saline–alkali land, and water surface) and various rooftops (i.e., flat concrete, steel tile, and brick), ranging in size from dozens of panels to several hectares. To the best of our knowledge, this is the first open PV dataset with multiple spatial resolutions.
Based on the dataset, we investigated the performance of different deep networks on PV segmentation and evaluated the feasibility of cross application between different resolutions. It is recommended to use PV08 for concentrated PVs, PV03 for distributed ground PVs, and PV01 for distributed rooftop PVs so as to achieve the best segmentation results with IoU values of 0.845, 0.871, and 0.868, respectively. It is also proved that direct cross applications do not work well, and fine-tuning of pre-trained network using the target samples is essential. Besides, this dataset may contribute to a diversity of other research and applications related to PVs. For example, the segmentation networks are generally sensitive to the observational size and shape in the receptive field; hence, it is valuable to quantitatively explore the general guidelines on selecting image resolutions and input sample sizes for PVs with different sizes. Whether a network can be established to combine images with different resolutions to achieve synchronous identification or segmentation of multi-scale PVs is also of great interest.
HJ and LY designed the study and wrote the original manuscript. HJ, YL, and TL annotated and classified the samples. HJ, LY, and NL designed the PV segmentation method and carried out the experiments. HJ, JQ, and TL carried out the validation. HJ, LY, NL, JQ, and CZ interpreted the results, edited the manuscript, and produced the figures.
The contact author has declared that neither they nor their co-authors have any competing interests.
Publisher's note: Copernicus Publications remains neutral with regard to jurisdictional claims in published maps and institutional affiliations.
This work was supported by the National Natural Science Foundation of China (no. 41771380) and the Key Special Project for Introduced Talents Team of Southern Marine Science and Engineering Guangdong Laboratory (no. GML2019ZD0301). We are grateful to the Provincial Geomatics Center of Jiangsu for their assistance in processing satellite and aerial images, the GitHub user Attila94 for sharing RefineNet code (https://github.com/Attila94/refinenet-keras, last access: 8 August 2021), and the GitHub user sunlinlin-aragon for sharing DeepLab v3+ code (https://github.com/sunlinlin-aragon/DeepLabV3_Plus-Tensorflow2.0, last access: 8 August 2021).
This research has been supported by the National Natural Science Foundation of China (grant no. 41771380), and the Key Special Project for Introduced Talents Team of Southern Marine Science and Engineering Guangdong Laboratory (grant no. GML2019ZD0301).
This paper was edited by David Carlson and reviewed by three anonymous referees.
Ball, J. E., Anderson, D. T., and Chan, C. S.: Comprehensive survey of deep learning in remote sensing: theories, tools, and challenges for the community, J. Appl. Remote Sens., 11, 042609, https://doi.org/10.1117/1.JRS.11.042609, 2017.
Bódis, K., Kougias, I., Jäger-Waldau, A., Taylor, N., and Szabó, S.: A high-resolution geospatial assessment of the rooftop solar photovoltaic potential in the European Union, Renew. Sust. Energ. Rev., 114, 109309, https://doi.org/10.1016/j.rser.2019.109309, 2019.
Chen, L. C., Zhu, Y., Papandreou, G., Schroff, F., and Adam, H.: Encoder-Decoder with Atrous Separable Convolution for Semantic Image Segmentation, in: Computer Vision – ECCV 2018, edited by: Ferrari, V., Hebert, M., Sminchisescu, C., and Weiss, Y., Springer, Cham, Germany, 833–851, https://doi.org/10.1007/978-3-030-01234-2_49, 2018.
Chu, S. and Majumdar, A.: Opportunities and challenges for a sustainable energy future, Nature, 488, 294–303, https://doi.org/10.1038/nature11475, 2012.
Golovko, V., Bezobrazov, S., Kroshchanka, A., Sachenko, A., Komar, M., and Karachka, A.: Convolutional neural network based solar photovoltaic panel detection in satellite photos, 2017 9th IEEE International Conference on Intelligent Data Acquisition and Advanced Computing Systems: Technology and Applications (IDAACS), Bucharest, Romania, 21–23 September 2017, 14–19, https://doi.org/10.1109/IDAACS.2017.8094501, 2017.
Hernandez, R. R., Hoffacker, M. K., Murphy-Mariscal, M. L., Wu, G. C., and Allen, M. F.: Solar energy development impacts on land cover change and protected areas, P. Natl. Acad. Sci. USA, 112, 13579, https://doi.org/10.1073/pnas.1517656112, 2015.
House, D., Lech, M., and Stolar, M.: Using deep learning to identify potential roof spaces for solar panels, 2018 12th International Conference on Signal Processing and Communication Systems (ICSPCS), Cairns, Australia, 17–19 December 2018, 1–6, https://doi.org/10.1109/ICSPCS.2018.8631725, 2018.
IRENA: Renewable capacity statistics 2021, International Renewable Energy Agency (IRENA), Abu Dhabi, 2021.
Ji, S., Wei, S., and Lu, M.: Fully convolutional networks for multisource building extraction from an open aerial and satellite imagery data set, IEEE T. Geosci. Remote, 57, 574–586, https://doi.org/10.1109/TGRS.2018.2858817, 2019.
Ji, S., Zhang, Z., Zhang, C., Wei, S., Lu, M., and Duan, Y.: Learning discriminative spatiotemporal features for precise crop classification from multi-temporal satellite images, Int. J. Remote Sens., 41, 3162–3174, https://doi.org/10.1080/01431161.2019.1699973, 2020.
Jiang, H., Yao, L., and Liu, Y.: Multi-resolution dataset for photovoltaic panel segmentation from satellite and aerial imagery, Zenodo [data set], https://doi.org/10.5281/zenodo.5171712, 2021.
Kabir, E., Kumar, P., Kumar, S., Adelodun, A. A., and Kim, K.-H.: Solar energy: Potential and future prospects, Renew. Sust. Energ. Rev., 82, 894–900, https://doi.org/10.1016/j.rser.2017.09.094, 2018.
La Monaca, S. and Ryan, L.: Solar PV where the sun doesn't shine: Estimating the economic impacts of support schemes for residential PV with detailed net demand profiling, Energ. Policy, 108, 731–741, https://doi.org/10.1016/j.enpol.2017.05.052, 2017.
Li, K., Wan, G., Cheng, G., Meng, L., and Han, J.: Object detection in optical remote sensing images: A survey and a new benchmark, ISPRS J. Photogramm., 159, 296–307, https://doi.org/10.1016/j.isprsjprs.2019.11.023, 2020.
Liang, S., Qi, F., Ding, Y., Cao, R., Yang, Q., and Yan, W.: Mask R-CNN based segmentation method for satellite imagery of photovoltaics generation systems, 2020 39th Chinese Control Conference (CCC), Shenyang, China, 27–29 July 2020, 5343–5348, https://doi.org/10.23919/CCC50068.2020.9189474, 2020.
Lin, G., Milan, A., Shen, C., and Reid, I.: RefineNet: Multi-path Refinement Networks for High-Resolution Semantic Segmentation, in: 2017 IEEE Conference on Computer Vision and Pattern Recognition (CVPR), Honolulu, Hawaii, USA, 21–26 July 2017, 5168–5177, https://doi.org/10.1109/CVPR.2017.549, 2017.
Liu, L., Sun, Q., Li, H., Yin, H., Ren, X., and Wennersten, R.: Evaluating the benefits of Integrating Floating Photovoltaic and Pumped Storage Power System, Energ. Convers. Manage., 194, 173–185, https://doi.org/10.1016/j.enconman.2019.04.071, 2019.
Majumdar, D. and Pasqualetti, M. J.: Analysis of land availability for utility-scale power plants and assessment of solar photovoltaic development in the state of Arizona, USA, Renew. Energ., 134, 1213–1231, https://doi.org/10.1016/j.renene.2018.08.064, 2019.
Malof, J. M., Rui, H., Collins, L. M., Bradbury, K., and Newell, R.: Automatic solar photovoltaic panel detection in satellite imagery, 2015 International Conference on Renewable Energy Research and Applications (ICRERA), 1428–1431, Palermo, Italy, 22–25 November 2015, https://doi.org/10.1109/ICRERA.2015.7418643, 2015.
Martins, F. R., Pereira, E. B., and Abreu, S. L.: Satellite-derived solar resource maps for Brazil under SWERA project, Sol. Energy, 81, 517–528, https://doi.org/10.1016/j.solener.2006.07.009, 2007.
Moutinho, V. and Robaina, M.: Is the share of renewable energy sources determining the CO2 kWh and income relation in electricity generation?, Renew. Sust. Energ. Rev., 65, 902–914, https://doi.org/10.1016/j.rser.2016.07.007, 2016.
Perez, R., Kmiecik, M., Herig, C., and Renné, D.: Remote monitoring of PV performance using geostationary satellites, Sol. Energy, 71, 255–261, https://doi.org/10.1016/S0038-092X(01)00050-0, 2001.
Peters, I. M., Liu, H., Reindl, T., and Buonassisi, T.: Global prediction of photovoltaic field performance differences using open-source satellite data, Joule, 2, 307–322, https://doi.org/10.1016/j.joule.2017.11.012, 2018.
Rabaia, M. K. H., Abdelkareem, M. A., Sayed, E. T., Elsaid, K., Chae, K.-J., Wilberforce, T., and Olabi, A. G.: Environmental impacts of solar energy systems: A review, Sci. Total Environ., 754, 141989, https://doi.org/10.1016/j.scitotenv.2020.141989, 2021.
Reichstein, M., Camps-Valls, G., Stevens, B., Jung, M., Denzler, J., Carvalhais, N., and Prabhat: Deep learning and process understanding for data-driven Earth system science, Nature, 566, 195–204, https://doi.org/10.1038/s41586-019-0912-1, 2019.
Rico Espinosa, A., Bressan, M., and Giraldo, L. F.: Failure signature classification in solar photovoltaic plants using RGB images and convolutional neural networks, Renew. Energ., 162, 249–256, https://doi.org/10.1016/j.renene.2020.07.154, 2020.
Ronneberger, O., Fischer, P., and Brox, T.: U-Net: Convolutional Networks for Biomedical Image Segmentation, in: Medical Image Computing and Computer-Assisted Intervention – MICCAI 2015, edited by: Navab N., Hornegger J., Wells W., and Frangi A., Springer, Cham, Germany, 234–241, https://doi.org/10.1007/978-3-319-24574-4_28, 2015.
Sacchelli, S., Garegnani, G., Geri, F., Grilli, G., Paletto, A., Zambelli, P., Ciolli, M., and Vettorato, D.: Trade-off between photovoltaic systems installation and agricultural practices on arable lands: An environmental and socio-economic impact analysis for Italy, Land Use Policy, 56, 90–99, https://doi.org/10.1016/j.landusepol.2016.04.024, 2016.
Shin, H., Hansen, K. U., and Jiao, F.: Techno-economic assessment of low-temperature carbon dioxide electrolysis, Nat. Sustain., 4, 911–919, https://doi.org/10.1038/s41893-021-00739-x, 2021.
Song, Y., Wu, W., Liu, Z., Yang, X., Liu, K., and Lu, W.: An Adaptive Pansharpening Method by Using Weighted Least Squares Filter, IEEE Geosci. Remote. Sens. Lett., 13, 18–22, https://doi.org/10.1109/LGRS.2015.2492569, 2016.
Wang, M., Cui, Q., Sun, Y., and Wang, Q.: Photovoltaic panel extraction from very high-resolution aerial imagery using region–line primitive association analysis and template matching, ISPRS J. Photogramm., 141, 100–111, https://doi.org/10.1016/j.isprsjprs.2018.04.010, 2018.
Xia, G., Bai, X., Ding, J., Zhu, Z., Belongie, S., Luo, J., Datcu, M., Pelillo, M., and Zhang, L.: DOTA: A large-scale dataset for object detection in aerial images, 2018 IEEE/CVF Conference on Computer Vision and Pattern Recognition, Salt Lake City, USA, 18–23 June 2018, 3974–3983, https://doi.org/10.1109/CVPR.2018.00418, 2018.
Yan, J. Y., Yang, Y., Campana, P. E., and He, J. J.: City-level analysis of subsidy-free solar photovoltaic electricity price, profits and grid parity in China, Nat. Energy, 4, 709–717, https://doi.org/10.1038/s41560-019-0441-z, 2019.
Yao, Y. and Hu, Y.: Recognition and location of solar panels based on machine vision, 2017 2nd Asia-Pacific Conference on Intelligent Robot Systems (ACIRS), Wuhan, China, 16–19 June 2017, 7–12, https://doi.org/10.1109/ACIRS.2017.7986055, 2017.
Yu, J., Wang, Z., Majumdar, A., and Rajagopal, R.: DeepSolar: A Machine Learning Framework to Efficiently Construct a Solar Deployment Database in the United States, Joule, 2, 2605–2617, https://doi.org/10.1016/j.joule.2018.11.021, 2018.
Zambrano-Asanza, S., Quiros-Tortos, J., and Franco, J. F.: Optimal site selection for photovoltaic power plants using a GIS-based multi-criteria decision making and spatial overlay with electric load, Renew. Sust. Energ. Rev., 143, 110853, https://doi.org/10.1016/j.rser.2021.110853, 2021.