the Creative Commons Attribution 4.0 License.
the Creative Commons Attribution 4.0 License.
 | 05 Nov 2021
BAWLD-CH4: a comprehensive dataset of methane fluxes from boreal and arctic ecosystems
Ruth K. Varner
David Bastviken
Patrick Crill
Sally MacIntyre
Merritt Turetsky
Katey Walter Anthony
Anthony D. McGuire
David Olefeldt
Methane (CH4) emissions from the boreal and arctic region are globally significant and highly sensitive to climate change. There is currently a wide range in estimates of high-latitude annual CH4 fluxes, where estimates based on land cover inventories and empirical CH4 flux data or process models (bottom-up approaches) generally are greater than atmospheric inversions (top-down approaches). A limitation of bottom-up approaches has been the lack of harmonization between inventories of site-level CH4 flux data and the land cover classes present in high-latitude spatial datasets. Here we present a comprehensive dataset of small-scale, surface CH4 flux data from 540 terrestrial sites (wetland and non-wetland) and 1247 aquatic sites (lakes and ponds), compiled from 189 studies. The Boreal–Arctic Wetland and Lake Methane Dataset (BAWLD-CH4) was constructed in parallel with a compatible land cover dataset, sharing the same land cover classes to enable refined bottom-up assessments. BAWLD-CH4 includes information on site-level CH4 fluxes but also on study design (measurement method, timing, and frequency) and site characteristics (vegetation, climate, hydrology, soil, and sediment types, permafrost conditions, lake size and depth, and our determination of land cover class). The different land cover classes had distinct CH4 fluxes, resulting from definitions that were either based on or co-varied with key environmental controls. Fluxes of CH4 from terrestrial ecosystems were primarily influenced by water table position, soil temperature, and vegetation composition, while CH4 fluxes from aquatic ecosystems were primarily influenced by water temperature, lake size, and lake genesis. Models could explain more of the between-site variability in CH4 fluxes for terrestrial than aquatic ecosystems, likely due to both less precise assessments of lake CH4 fluxes and fewer consistently reported lake site characteristics. Analysis of BAWLD-CH4 identified both land cover classes and regions within the boreal and arctic domain, where future studies should be focused, alongside methodological approaches. Overall, BAWLD-CH4 provides a comprehensive dataset of CH4 emissions from high-latitude ecosystems that are useful for identifying research opportunities, for comparison against new field data, and model parameterization or validation. BAWLD-CH4 can be downloaded from https://doi.org/10.18739/A2DN3ZX1R (Kuhn et al., 2021).
- Article
(12607 KB) - Full-text XML
- Companion paper
-
Supplement
(351 KB) - BibTeX
- EndNote
- Included in Encyclopedia of Geosciences


Methane (CH4) is a strong climate forcing trace gas that is naturally produced and emitted from wetlands and lakes, which are abundant in northern regions (Matthews and Fung, 1987; Lehner and Döll, 2004; Messager et al., 2016). Current estimates of CH4 fluxes from the northern boreal and arctic region (∼ > 50∘) range between 9 and 53 Tg CH4 yr−1 from wetlands (Spahni et al., 2011; McGuire et al., 2012; Zhu et al., 2013; Bruhwiler et al., 2014; Treat et al., 2018; Watts et al., 2014; Thompson et al., 2018; Peltola et al., 2019; Saunois et al., 2020) and between 12 and 24 Tg CH4 yr−1 from lakes (Bastviken et al., 2011; Wik et al., 2016a; Tan et al., 2016; Walter Anthony et al., 2016; Matthews et al., 2020; Saunois et al., 2020). Combined, CH4 emissions from northern ecosystems make up a significant but uncertain portion of fluxes from natural sources (232 to 367 Tg CH4 yr−1 for averaged bottom-up and top-down global estimates, respectively; Saunois et al., 2020). One reason for the large range of high-latitude CH4 emissions estimates is the consistently lower estimates based on top-down approaches compared to bottom-up approaches. Top-down approaches use atmospheric observations of CH4 concentrations with atmospheric inverse modelling frameworks to estimate regional CH4 budgets (e.g., Bruhwiler et al., 2014; Thompson et al., 2018), while bottom-up approaches merge land cover datasets and empirical CH4 flux inventories or process-based models to scale emissions across regional scales (e.g., Wik et al., 2016a; Treat et al., 2018; Peltola et al., 2019). A key issue for bottom-up approaches is the lack of differentiation among different wetland and lake types despite clear evidence indicating differences in both the magnitude and drivers of CH4 fluxes among wetland and lake types (Olefeldt et al., 2013; Turetsky et al., 2014; Wik et al., 2016a; Treat et al., 2018).
Net CH4 flux to the atmosphere depends on a suite of physical and biological controls linked to microbial production, oxidation, and transport via diffusion, ebullition, and plant-mediated processes (Bastviken et al., 2004; Whalen, 2005). While the basic underlying CH4 processes are the same across all ecosystems, the dominance of different production, oxidation, and transport pathways varies within and among terrestrial (wetlands and non-wetlands) and lentic open-water aquatic ecosystems (lakes and ponds), leading to a wide range of reported CH4 fluxes at the site level with differences of up to 4 orders of magnitude (Olefeldt et al., 2013; Wik et al., 2016a; Treat et al., 2018). Furthermore, drier terrestrial sites may drawdown, or uptake, CH4 out of the atmosphere (Treat et al., 2018). Despite the wide range in reported CH4 fluxes, key overarching controls on emissions from wetlands and aquatic ecosystems have been identified through the work of syntheses (Olefeldt et al., 2013; Wik et al., 2016a; Treat et al., 2018), suggesting that different ecosystems can be partitioned based on a handful of key CH4-emitting characteristics.
For terrestrial ecosystems, CH4 fluxes across the boreal–arctic region are primarily linked to permafrost conditions and hydrology (Olefeldt et al., 2013; Treat et al., 2018), which encompass other important controls on CH4 emissions. For example, permafrost condition and hydrology can be directly linked to water table position and redox conditions (Moore et al., 1994; von Fischer et al., 2010; Olefeldt et al., 2017), which in turn influence plant composition (i.e., plant function types including graminoids, Sphagnum mosses, shrubs, and trees; Olefeldt et al., 2013; Bridgham et al., 2013), microbial community composition (McCalley et al., 2014), productivity (Christensen et al., 2003), and organic matter availability (Wagner et al., 2003; Christensen et al., 2003). Both permafrost condition and hydrology can further be used as an indication of soil temperature with typically colder conditions in drier soils and permafrost-dominated landscapes (Olefeldt et al., 2017). Methane fluxes are typically highest from graminoid-dominant wetlands such as marshes and fens, which are frequently inundated. Inundation, in turn, enhances primary productivity (Ström et al., 2012), creates a soil habitat conducive to CH4-producing microbes (Woodcroft et al., 2018), and facilitates transport CH4 through aerenchymatous roots and stems (Chanton et al., 1993; Ström and Christensen, 2007). Conversely, CH4 fluxes are typically low from permafrost bogs and bogs which tend to have colder (in the case of permafrost bogs) and drier soil conditions (Beylea and Baird, 2006; Andersen et al., 2011), which are less conducive to the presence of graminoid species and promote the consumption of CH4 through oxidation (Bartlett et al., 1992; Moosavi and Crill, 1997).
Methane fluxes from aquatic ecosystems (lakes and ponds) are highly influenced by lake morphology (Rasilo et al., 2015; Holgerson and Raymond, 2016) and lake genesis (Wik et al., 2016a), including underlying permafrost conditions (Walter et al., 2006), which are associated with other key controls and CH4 fluxes. Lake morphology influences sediment temperature, macrophyte presence (Marinho et al., 2015; Wik et al., 2018), and turbulent transfer (MacIntyre et al., 2018). Lake morphology, permafrost condition, and lake genesis all determine organic substrate availability in sediments (Walter et al., 2006; Wik et al., 2016a) and trophic status (Bastviken et al., 2004; DelSontro et al., 2016). For example, peatland lakes and ponds, which form through degradation and permafrost thaw processes in peatlands, are relatively high CH4 emitters (Matveev et al., 2016; Kuhn et al., 2018; Burke et al., 2019). These waterbodies are underlain by organic-rich sediments and are typically small and shallow and less likely to be seasonally stratified, allowing for rapid sediment warming and carbon mineralization (Matveev et al., 2016). Glacial and post-glacial waterbodies, on the other hand, have relatively low CH4 fluxes due to deeper water columns, which limit ebullition by creating cooler sediment temperatures and greater hydrostatic pressures for bubbles to overcome (Bastviken et al., 2004; DelSontro et al., 2016). These waterbodies also tend to have mineral-rich sediments with typically less labile organic substrates (Schnurrenberger et al., 2003; DelSontro et al., 2016; Wik et al., 2016a). Therefore, while there are many physical and biogeochemical controls on aquatic CH4 fluxes, size and lake genesis can be useful proxies for many of these underlying factors.
There are various methodologies used to measure surface CH4 fluxes from terrestrial and aquatic ecosystems. Two approaches used in both terrestrial and aquatic ecosystems include micrometeorological eddy covariance (EC) techniques and chamber measurement techniques. Eddy covariance measurements are collected at high temporal frequencies from towers and typically cover a footprint of 100–10 000 m2. The near-continuous nature of EC measurements provides valuable insight into the temporal patterns and drivers of CH4 fluxes; however, towers are geographically limited across the boreal–arctic region, and it can be difficult to attribute flux transport pathways and specific source areas at fine spatial scales (Knox et al., 2019; Delwiche et al., 2021). Conversely, static chamber measurements cover small spatial areas that allow for detailed assessments of environmental controls on fluxes (Bäckstrand et al., 2008; Olefeldt et al., 2013). Chamber-based methods quantify fluxes by calculating the change in chamber headspace concentration over a set time, which varies based on extraction methods (i.e., syringe, automated chamber, or portable gas analyzer). While chamber-based techniques have drawbacks, including surface disturbance, typically low sampling frequency and high labour intensity, they are easily installed, can capture environmental controls of CH4 fluxes at a sub-metre scale, and are cheaper options compared to installing and maintaining EC towers. Thus, we focus mostly on chamber-based flux measurements in this synthesis because they have been performed at many sites across the boreal and arctic region and represent more of the geographic variation across the region.
In aquatic ecosystems, turbulence-driven modelling approaches, inverted funnels (i.e., bubbles traps), and ice bubble surveys (IBSs) are additionally used to quantify fluxes. Modelling approaches calculate net hydrodynamic flux (herein referred to as diffusion) to the atmosphere by determining the concentration of dissolved CH4 in the water column and an estimate of the gas transfer velocity k (see Sect. 2.4 for more information). Bubble traps capture the volume of bubble gas released from sediments; ebullitive flux can be estimated by using the concentration of CH4 found in the bubble (Wik et al., 2013). Finally, IBSs are used to quantify the spatial abundance and types of bubble formations trapped within lake ice over the winter (Walter Anthony et al., 2010). Importantly, these surface-based methods can be used to assess controls of CH4 exchange at scales of individual ponds, lakes, and portions of open-water wetlands, providing key insights into the environmental processes controlling CH4 flux to the atmosphere (Olefeldt et al., 2013; Wik et al., 2016a).
Here we expanded, updated, and merged previous CH4 flux syntheses for northern wetlands (Olefeldt et al., 2013) and lakes (Wik et al., 2016a) to create a small-scale (sub-metre), surface-based dataset for CH4 fluxes collected from 189 studies across the boreal–arctic region. The dataset was built in parallel with a CH4-specific land cover dataset for the circumpolar north – the Boreal–Arctic Wetland and Lake Dataset (BAWLD; Olefeldt et al., 2021a, b) – allowing for flux observations and spatial distribution of land cover features to be classified under the same criteria at a pan-arctic scale. This dataset includes surface-based fluxes and associated environmental drivers from aquatic, wetland, and upland (i.e., non-wetland) ecosystems and can be utilized by both field researchers and the modelling community. The boreal–arctic region represents a potentially globally significant, but still highly unknown source of CH4. This dataset can be used to help constrain boreal–arctic flux estimates, compare field results, identify new research opportunities, or build and test models. This dataset includes and uniformly classifies lake, wetland, and upland (non-wetland) surface CH4 flux data for the circumpolar north (Kuhn et al., 2021). We show CH4 flux distributions and environmental drivers from various terrestrial (wetland and upland) and aquatic ecosystems across the north, compare the results to previous CH4 flux syntheses, highlight key gaps in the data, and suggest future research directions.
The dataset is composed of two parts, including (1) terrestrial ecosystems (vegetated wetland and non-wetland ecosystems) and (2) lentic open-water aquatic ecosystems (lakes, ponds, and open-water pools, hereafter referred to as “aquatic ecosystems”). This synthesis does not include lotic systems (streams and rivers), which are already synthesized in Stanley et al. (2016). The datasets for terrestrial and aquatic ecosystems are reported as separate components due to differences between both the drivers of CH4 fluxes and data collection methods. The terrestrial dataset extends the work by Olefeldt et al. (2013), who compiled CH4 flux estimates for wetlands in the permafrost zones designated by Brown et al. (2002). Our dataset expands on this initial work to include flux data from non-permafrost and non-wetland sites throughout the arctic and boreal region (Olson et al., 2001) and flux data from studies between 2012 and February 2020. We updated the initial dataset to include separate entries for individual sites that reported flux and water table data for multiple years. We expanded the number of site year flux estimates in the original terrestrial dataset by 83 % and expanded the number of independent studies by 86 %, leading to a total of 555 warm-season (∼ May through October, depending on the location) flux estimates and 121 studies (Fig. 1a). The aquatic dataset extends the work by Wik et al. (2016a), which is a compilation of CH4 flux data for lakes and ponds north of 50∘ N. We expand on this initial work to include studies between 2016 and February 2020. Additionally, we updated the original aquatic dataset to include the within-lake location for ebullition measurements and the equation used to model the gas velocity coefficient k. We expanded the number of lakes in the dataset by 71 % and the number of studies by 66 %, summing to a total of 1251 lakes and 68 independent studies (Fig. 1b). Finally, each terrestrial and aquatic site was reclassified into a new land cover classification, further explained below.
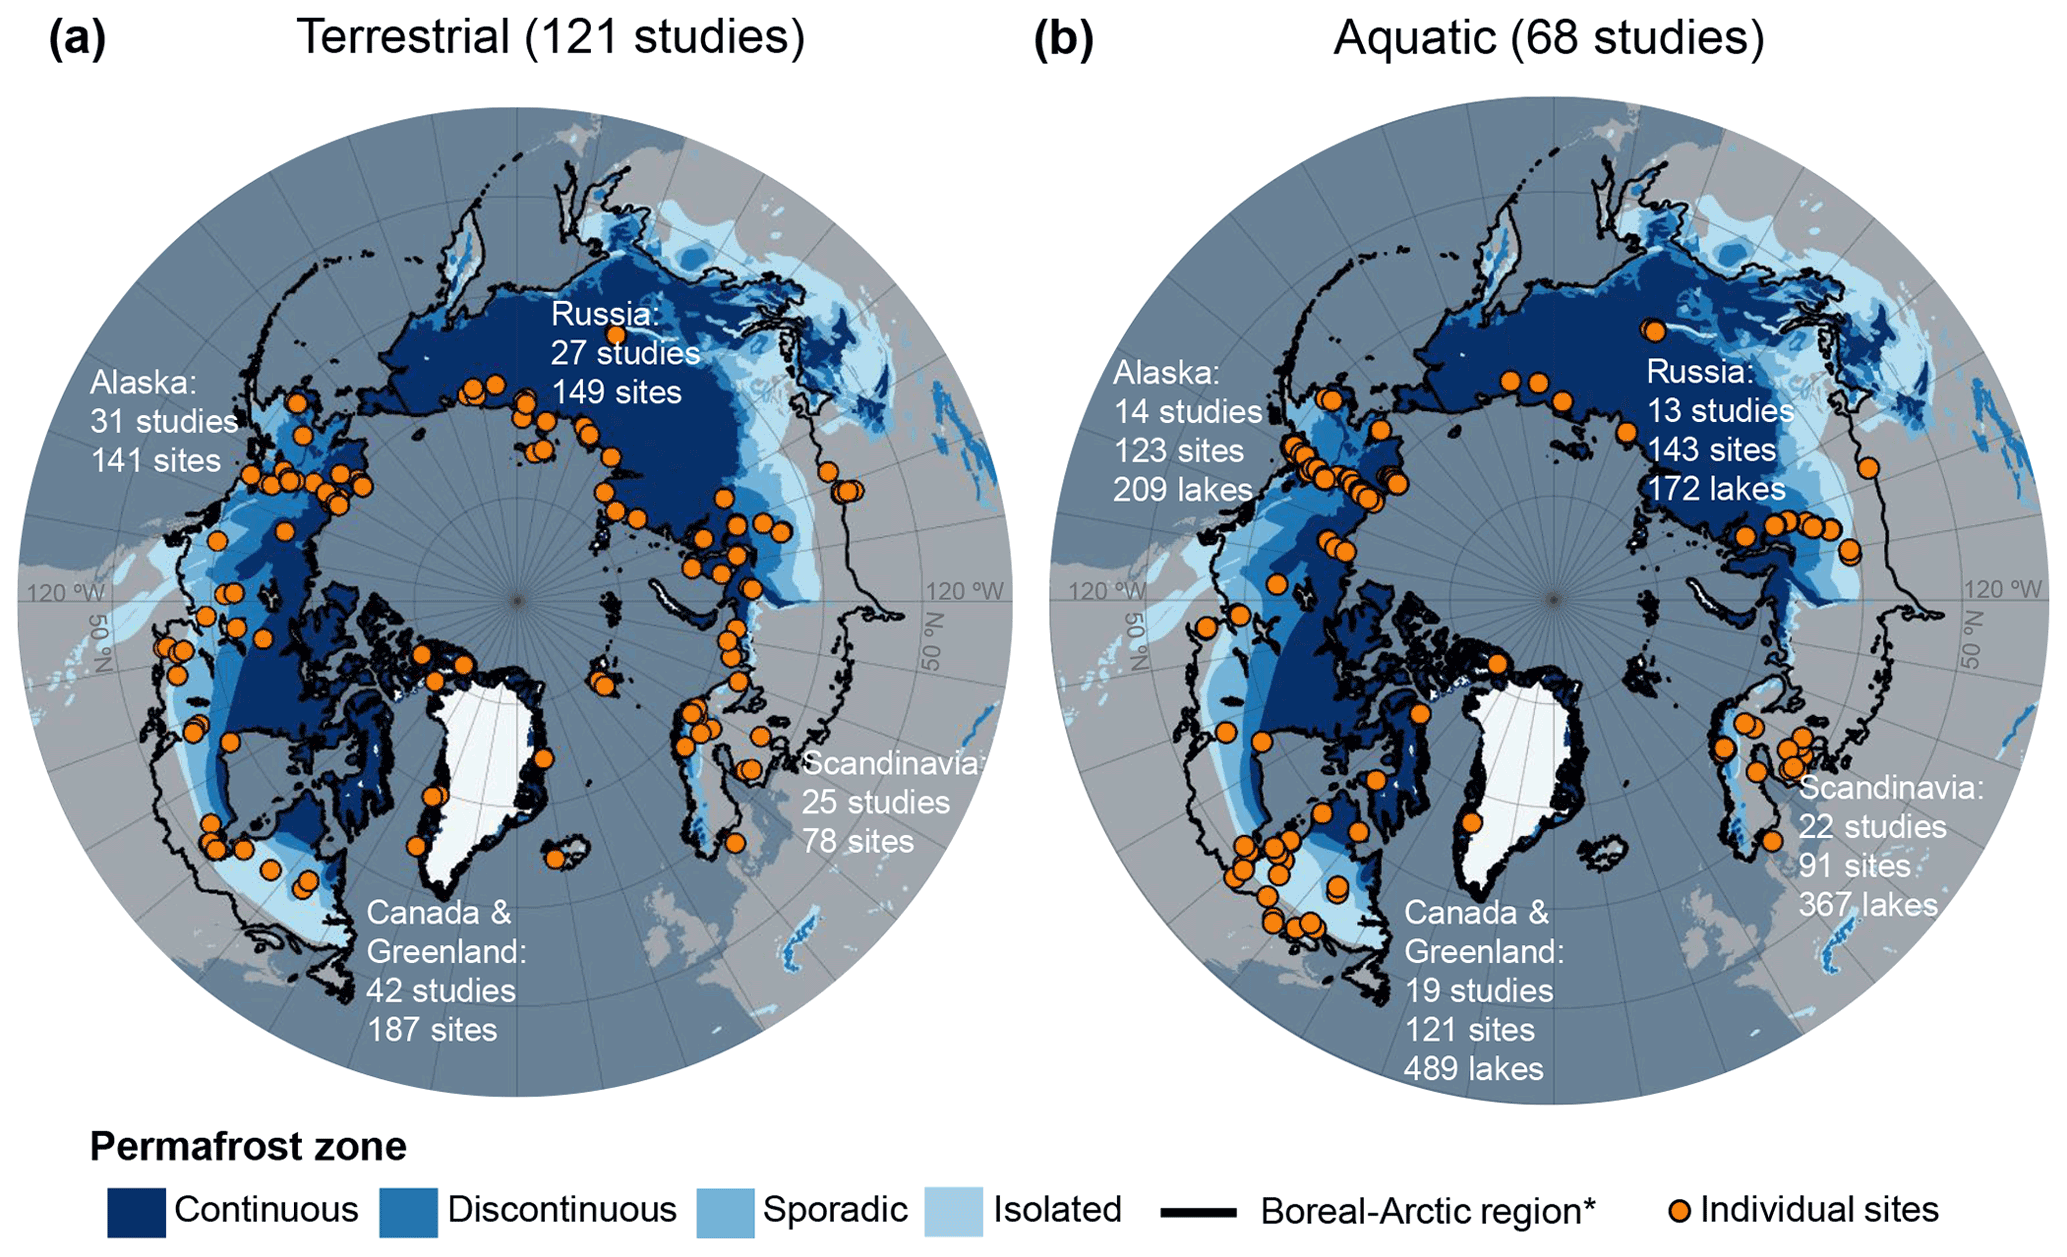
Figure 1Maps of the individual sites (orange circles) incorporated in BAWLD-CH4. (a) Sites included in the terrestrial flux dataset. (b) Sites included in the aquatic flux dataset. The number of “sites” in the terrestrial dataset represents site years, which in some cases represent multiple years of data from one site or data from the same site reported by different studies. “Sites” in the aquatic dataset represent the reported average fluxes for one or multiple lakes. In some cases, studies reported one mean value for multiple lakes; therefore the number of lakes and the number of sites is not the same. * Boreal–arctic region boundary from Olson et al. (2001). Permafrost zones are from Brown et al. (2002). Continental shoreline base layers are from Wessel and Smith (1996).
2.1 The Boreal–Arctic Wetland and Lake Dataset
2.1.1 Land cover classification
Land cover classes in the Boreal–Arctic Wetland and Lake Dataset (BAWLD; Olefeldt et al., 2021a, b) were chosen and defined to enable upscaling of CH4 fluxes at large spatial scales. As such, we aimed to include as few classes as possible to facilitate large-scale mapping while still having sufficient classes to allow separation among groups of ecosystems with similarities in hydrology, ecology, and biogeochemistry and therefore net CH4 fluxes. The BAWLD land cover classification is hierarchical, with four upland classes, five wetland classes, seven lentic aquatic classes, and three lotic aquatic classes. As mentioned previously, fluxes from lotic ecosystems (streams and rivers) are not included in this dataset but are covered by Stanley et al. (2016).
2.1.2 Wetland classes
Wetlands are defined by having a water table near or above the land surface for sufficient time to cause the development of wetland soils (either mineral soils with redoximorphic features or organic soils with > 40 cm peat) and the presence of plant species with adaptations to wet environments (Canada Committee on Ecological (Biophysical) Land Classification et al., 1997; Jorgenson et al., 2001; Hugelius et al., 2020). Wetland classifications for boreal and arctic biomes can focus on either small-scale wetland classes that have distinct hydrological regimes, vegetation composition, and biogeochemistry or on larger-scale wetland complexes that are comprised of distinct patterns of smaller wetland and open-water classes (Glaser et al., 2004; Masing et al., 2010; Gunnarsson and Löfroth, 2014; Terentieva et al., 2016). While larger-scale wetland complexes are easier to identify through remote sensing techniques (e.g., patterned fens comprised of higher-elevation ridges and inundated hollows), our classification focuses on wetland classes due to greater homogeneity of hydrological, ecological, and biogeochemical characteristics that regulate CH4 fluxes (Heiskanen et al., 2021).
Several boreal countries identify four main wetland classes, differentiated primarily based on hydrodynamic characterization: bogs, fens, marshes, and swamps (Canada Committee on Ecological (Biophysical) Land Classification et al., 1997; Masing et al., 2010; Gunnarsson and Löfroth, 2014). The BAWLD classification follows this general framework but further uses the presence or absence of permafrost as a primary characteristic for classification and excludes a distinct swamp class, yielding five classes: Bogs, Fens, Marshes, Permafrost Bogs, and Tundra Wetlands (see Figs. 2 and 3). The swamp class was omitted due to the wide range of moisture and nutrient conditions of swamps as well as the limited number of studies of swamp CH4 fluxes. We instead included swamp ecosystems in expanded descriptions of Bogs, Fens, and Marshes. The presence or absence of near-surface permafrost was used as a primary characteristic to distinguish between Permafrost Bogs and Bogs and to distinguish Tundra Wetlands from Marshes and Fens. The presence or absence of near-surface permafrost is considered key for controlling CH4 emissions given its influence on hydrology and for the potential of permafrost thaw and thermokarst collapse to cause rapid non-linear shifts to CH4 emissions (Bubier et al., 1995; Turetsky et al., 2002; Malhotra and Roulet, 2015; Fig. 3). Finally, while some classifications include shallow (e.g., 2 m depth), open-water ecosystems within the definition of wetlands (Canada Committee on Ecological (Biophysical) Land Classification et al., 1997; Gunnarsson and Löfroth, 2014), we have included all open-water ecosystems without emergent vegetation within the lake classes (see below) due to the strong influence of emergent vegetation in controlling CH4 emissions (Juutinen et al., 2003).

Figure 2Conceptual diagram of the terrestrial land cover classes and their CH4-emitting characteristics including permafrost conditions, hydrology, organic layer depth, and associated nutrient and vegetation characteristics. Numbers within the brackets represent the interquartile (IQR) flux ranges. Arrows are scaled based on mean flux values. See Sect. 3.2 for a detailed breakdown of terrestrial fluxes.
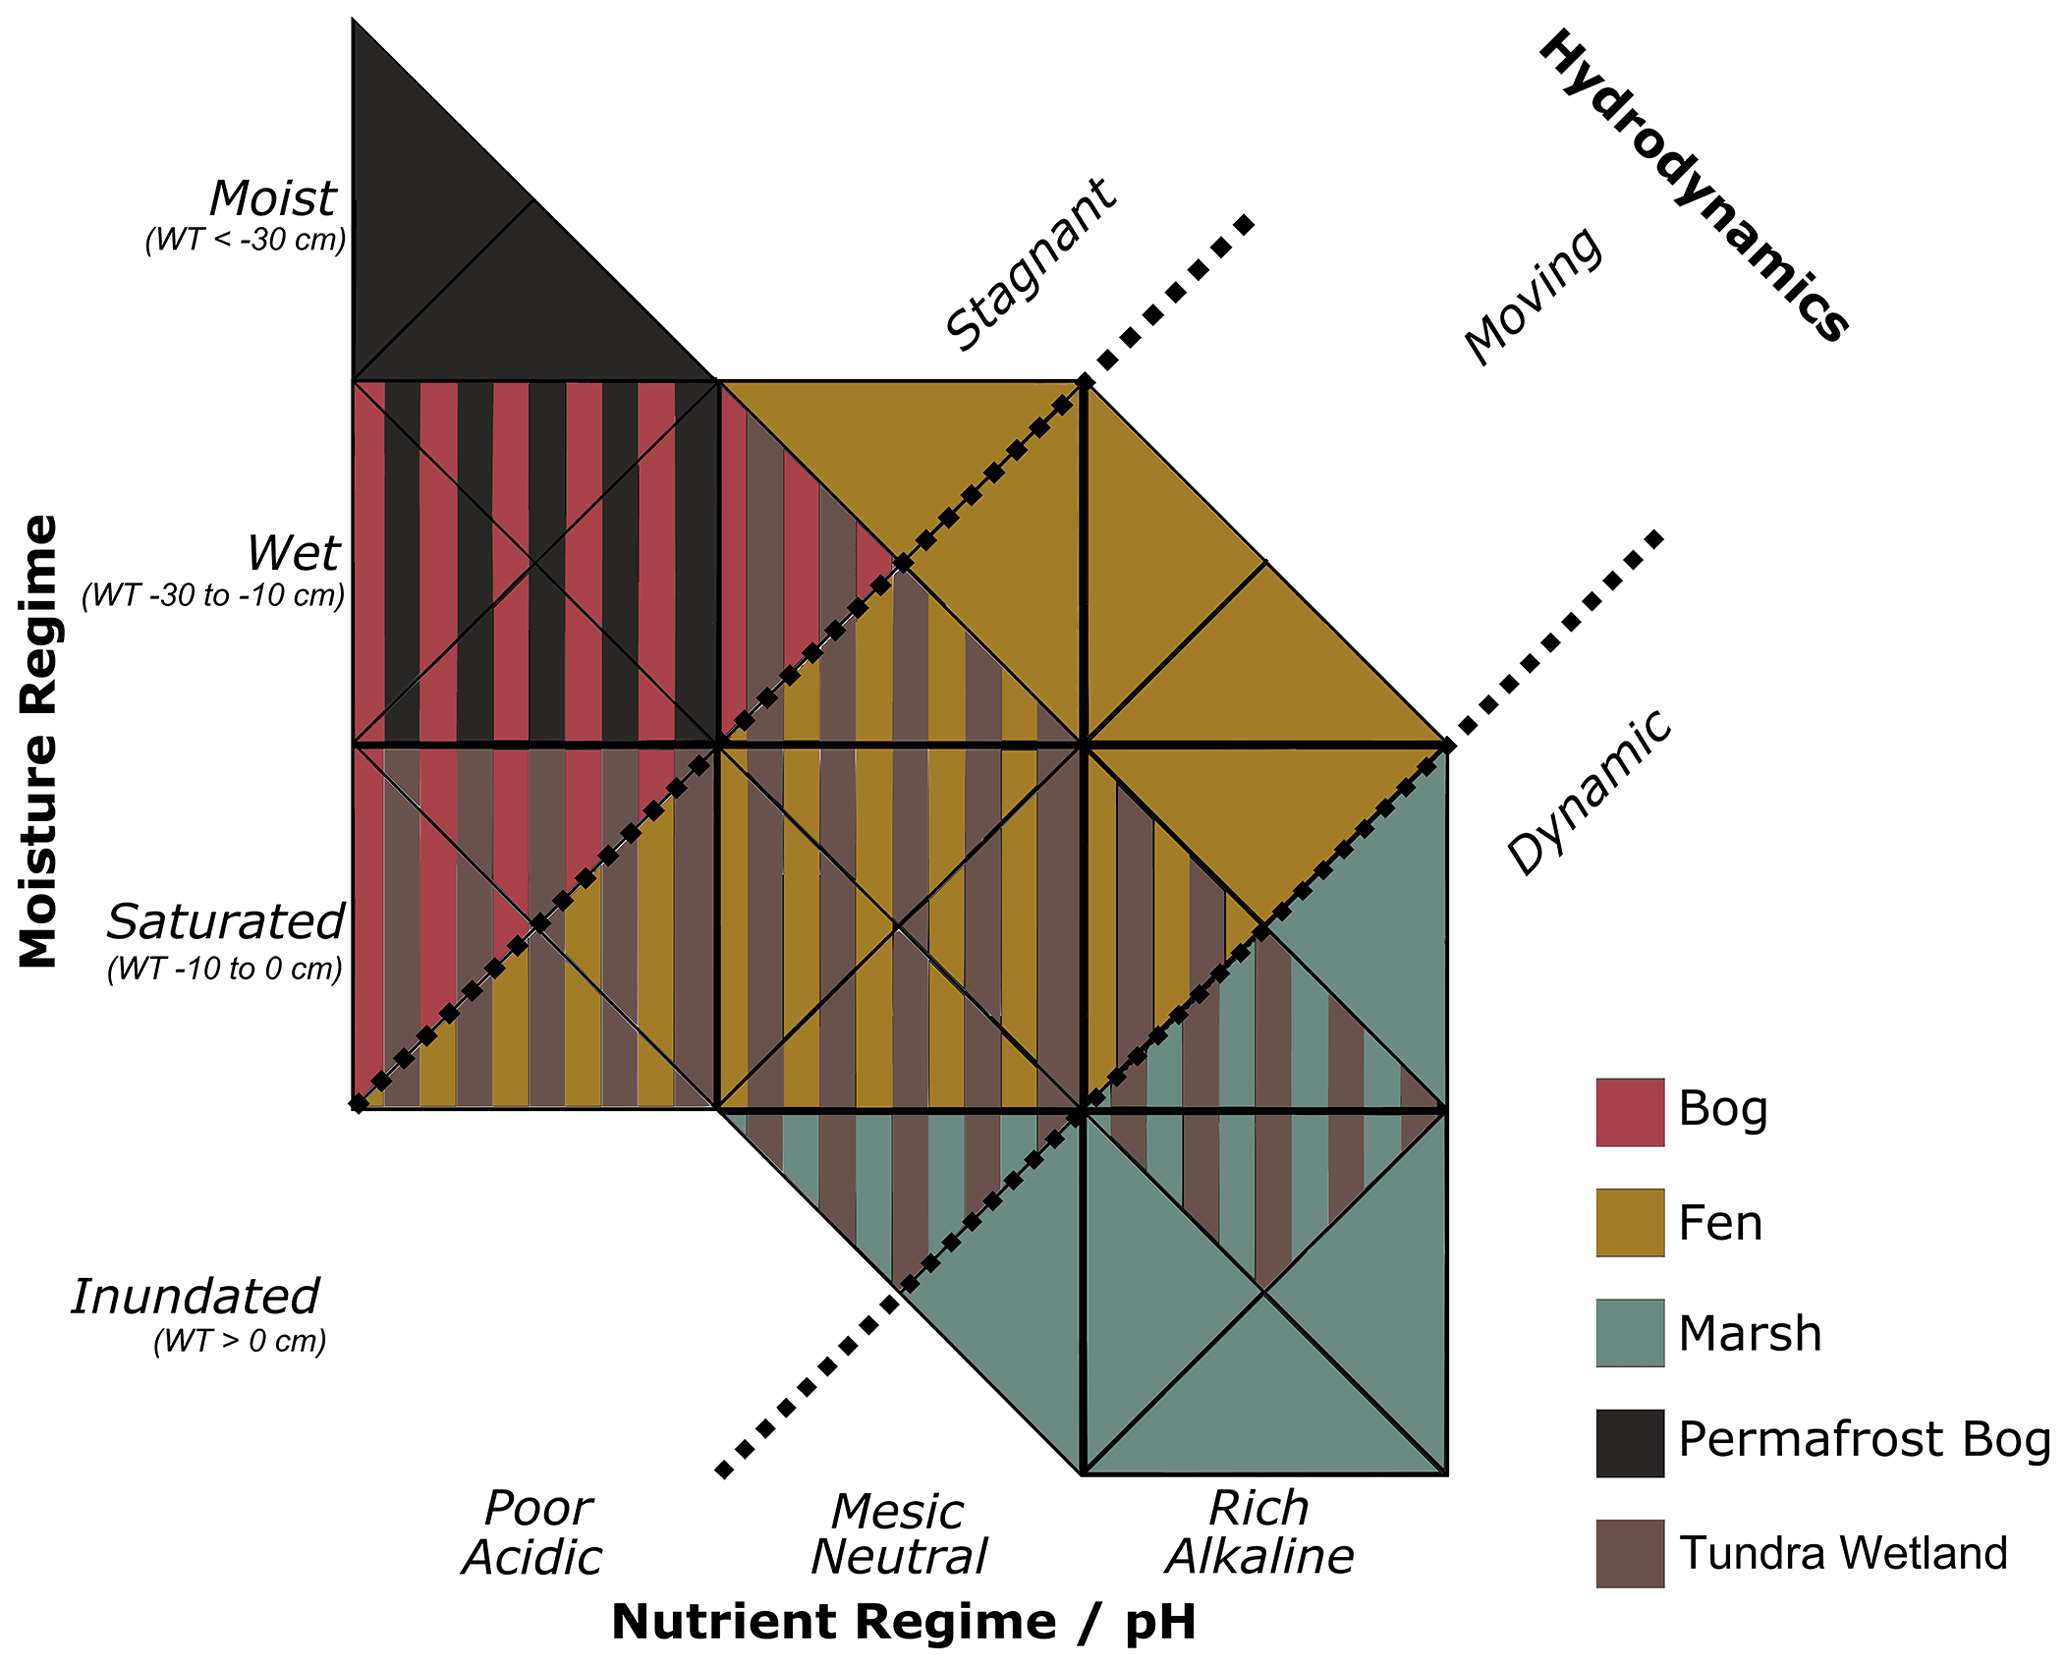
Figure 3Definitions of the five wetland classes in BAWLD along axes of moisture regime and nutrient regime.
Bogs are described as ombrotrophic peatland ecosystems, i.e., only dependent on precipitation and snowmelt for water inputs. Peat thickness is at least 40 cm, with maximum thickness > 10 m. The peat profile is not affected by permafrost, although in some climatically colder settings there may be permafrost below the peat profile. Bogs are wet to saturated ecosystems, often with small-scale (< 10 m) microtopographic variability, with stagnant water and a water table that rarely is above the surface or more than 50 cm below the surface (Fig. 3). Bogs have low pH (< 5), low concentrations of dissolved ions, and low nutrient availability, resulting from a lack of hydrological connectivity to surrounding mineral soils. Vegetation is commonly dominated by Sphagnum mosses, lichens, and woody shrubs and can be either treed or treeless (Beaulne et al., 2021). Our description of Bogs also includes what is commonly classified as treed swamps, which generally represent ecotonal transitions between peatlands and upland forests (Canada Committee on Ecological (Biophysical) Land Classification et al., 1997).
Fens are described as minerotrophic peatland ecosystems, i.e., hydrologically connected to surrounding mineral soils through surface water or groundwater inputs. A Fen peat profile is at least 40 cm thick (Gorham, 1991), although maximum peat thickness is generally less than for bogs. The peat profile is not affected by permafrost. Fens are wet to saturated ecosystems, with generally slow-moving water (Fig. 3). Fens have widely ranging nutrient regimes and levels of dissolved ions depending on the degree and type of hydrological connectivity to their surroundings, ranging from poor fens to rich fens. Vegetation largely depends on wetness and nutrient availability, where more nutrient-poor fens can have Sphagnum mosses, shrubs, and trees, while rich fens are dominated by brown mosses, graminoids (sedges, rushes), herbaceous plants, and sometimes coniferous or deciduous trees (e.g., willows, birch, larch). Our description of Fens also includes what is commonly classified as shrubby swamps, which often are associated with riparian ecotones and lake shorelines.
Marshes are minerotrophic wetlands with dynamic hydrology and often high nutrient availability (Fig. 3). Vegetation is dominated by emergent macrophytes, including tall graminoids such as rushes, reeds, grasses, and sedges – some of which can persist in settings with > 1.5 m of standing water. Marshes are saturated to inundated wetlands, often with highly fluctuating water levels as they generally are located along shorelines of lakes or coasts, along streams and rivers, or on floodplains and deltas. It is common for marshes to exhibit both flooded and dry periods. Dry periods facilitate the decomposition of organic matter and can prevent the build-up of peat. As such, Marshes generally have mineral soils, although some settings allow for the accumulation of highly humified organic layers – sometimes indicating ongoing succession towards a peatland ecosystem. Salinity can vary depending on water sources, with brackish to saline conditions in some areas of groundwater discharge or in coastal settings.
Permafrost Bogs are peatland ecosystems, although the peat thickness in cold climates is often relatively shallow. Permafrost Bogs have a seasonally thawed active layer that is 30 to 70 cm thick, with the remainder of the peat profile perennially frozen (i.e., permafrost). Excess ground ice and ice expansion often elevate Permafrost Bogs up to a few metres above their surroundings, and as such, they are ombrotrophic and relatively well drained (Fig. 3). Permafrost Bogs have moist to wet soil conditions, often with a water table that follows the base of the seasonally developing thawed soil layer. Ombrotrophic conditions cause nutrient-poor conditions, and the vegetation is dominated by lichens, Sphagnum mosses, woody shrubs, and sometimes stunted coniferous trees. Permafrost Bogs are often interspersed in a fine-scale mosaic (10 to 100 m) with other wetland classes, e.g., Bogs and Fens. Common Permafrost Bog landforms include palsas, peat plateaus, and the elevated portions of high- and low-centre polygonal peatlands.
Tundra Wetlands are treeless ecosystems with saturated to inundated conditions, most commonly with near-surface permafrost (Fig. 3). Tundra Wetlands can have either mineral soils or shallow organic soils and generally receive surface or near-surface waters from their surroundings as permafrost conditions preclude connectivity to deeper groundwater sources. Vegetation is dominated by short emergent vegetation, including sedges and grasses, with mosses and shrubs in slightly drier sites. Tundra Wetlands have a lower maximum depth of standing water than Marshes due to the shorter vegetation. Tundra Wetlands can be found in basin depressions; in low-centre polygonal wetlands; and along rivers, deltas, lake shorelines, and on floodplains in regions of continuous permafrost. Despite the name, limited wetlands with these characteristics (hydrology, permafrost conditions, and vegetation) can also be found within the continuous permafrost zone in boreal and sub-arctic regions (Virtanen et al., 2016).
2.1.3 Upland and other classes
Upland and other classes in BAWLD – Glaciers, Rocklands, Dry Tundra, and Boreal Forests – have in common that they are neither wetlands nor aquatic ecosystems. Glaciers are assumed to have neutral CH4 fluxes; however, to our knowledge there are no published studies with field data from the glacier surface. There are a handful of studies that highlight lateral CH4 export and emission from glacial outflows and termini (Christiansen and Jørgensen, 2018; Burns et al., 2018; Lamarche-Gagnon et al., 2019); however due to both limited atmospheric flux measurements and information on the spatial distributions of termini features and difficulties in mapping their areas at the circumpolar scale, we did not include these fluxes. Fluxes from glacial outflows and streams are considered to be riverine fluxes, and our flux synthesis does not include riverine fluxes. Rocklands are also expected to have very low CH4 fluxes (Oh et al., 2020), potentially with more frequent CH4 uptake than release. No sites included in the database were described as Rocklands. There are five sites described as high polar desert or desert tundra, which were included as Dry Tundra sites (Emmerton et al., 2014).
The Dry Tundra class includes both lowland arctic tundra and alpine tundra, both treeless ecosystems dominated by graminoid or shrub vegetation. Dry Tundra ecosystems generally have near-surface permafrost, with seasonally thawed active layers between 20 and 150 cm depending on climate, soil texture, and landscape position (Heikkinen et al., 2004; van der Molen et al., 2007). Near-surface permafrost in Dry Tundra prevents vertical drainage, but lateral drainage ensures predominately oxic soil conditions. A water table is either absent or close to the base of the seasonally thawing active layer. Dry Tundra is differentiated from Permafrost Bogs by having thinner organic soil (< 40 cm) and from Tundra Wetlands by their drained soils (average water table position > 5 cm below soil surface).
Boreal Forests are treed ecosystems with non-wetland soils. Coniferous trees are dominant, but the class also includes deciduous trees in warmer climates and landscape positions. Boreal Forests may have permafrost or non-permafrost ground, where the absence of permafrost often allows for better drainage. Overall, it is rare for anoxic conditions to occur in Boreal Forest soils, and CH4 uptake is prevalent, although low CH4 emissions have been observed during brief periods during snowmelt or following summer storms (Matson et al., 2009) or conveyed through tree stems and shoots (Machacova et al., 2016). The Boreal Forest class also includes the few agricultural and pasture ecosystems within the boreal biome.
2.1.4 Aquatic classes
Lakes in BAWLD include all lentic open-water ecosystems (herein referred to as aquatic ecosystems), regardless of surface area and depth of standing water. It is common in ice-rich permafrost lowlands and peatlands for open waterbodies to have shallow depths, often less than 2 m, even when surface areas are up to hundreds of square kilometres in size (Grosse et al., 2013). While small, shallow open-water pools often are included in definitions of wetlands (Canada Committee on Ecological (Biophysical) Land Classification et al., 1997; Gunnarsson and Löfroth, 2014; Treat et al., 2018), we include them here within the lake classes as controls on net CH4 emissions depend strongly on the presence or absence of emergent macrophytes (Juutinen et al., 2003). Further classification of lakes in BAWLD is based on lake size and lake genesis, where lake genesis influences lake bathymetry and sediment characteristics (Fig. 4). Previous global spatial inventories of lakes include detailed information on size and location of individual larger lakes (Downing et al., 2012; Messager et al., 2016) but do not include open-water ecosystems < 0.1 km2 in size and do not differentiate between lakes of different genesis (e.g., tectonic, glacial, organic, and yedoma lakes). Small waterbodies are disproportionately abundant in some high-latitude environments (Muster et al., 2019), have high emissions of CH4 (Holgerson and Raymond, 2016), and therefore require explicit classification apart from larger waterbodies. Furthermore, lake genesis and sediment type have been shown to influence net CH4 flux from lakes (Wik et al., 2016a). In BAWLD we thus differentiate between large (> 10 km2), midsize (0.1 to 10 km2), and small (< 0.1 km2) lake classes and further differentiate between three lake types for midsize and small lakes: peatland, yedoma, and glacial lakes (Fig. 4).
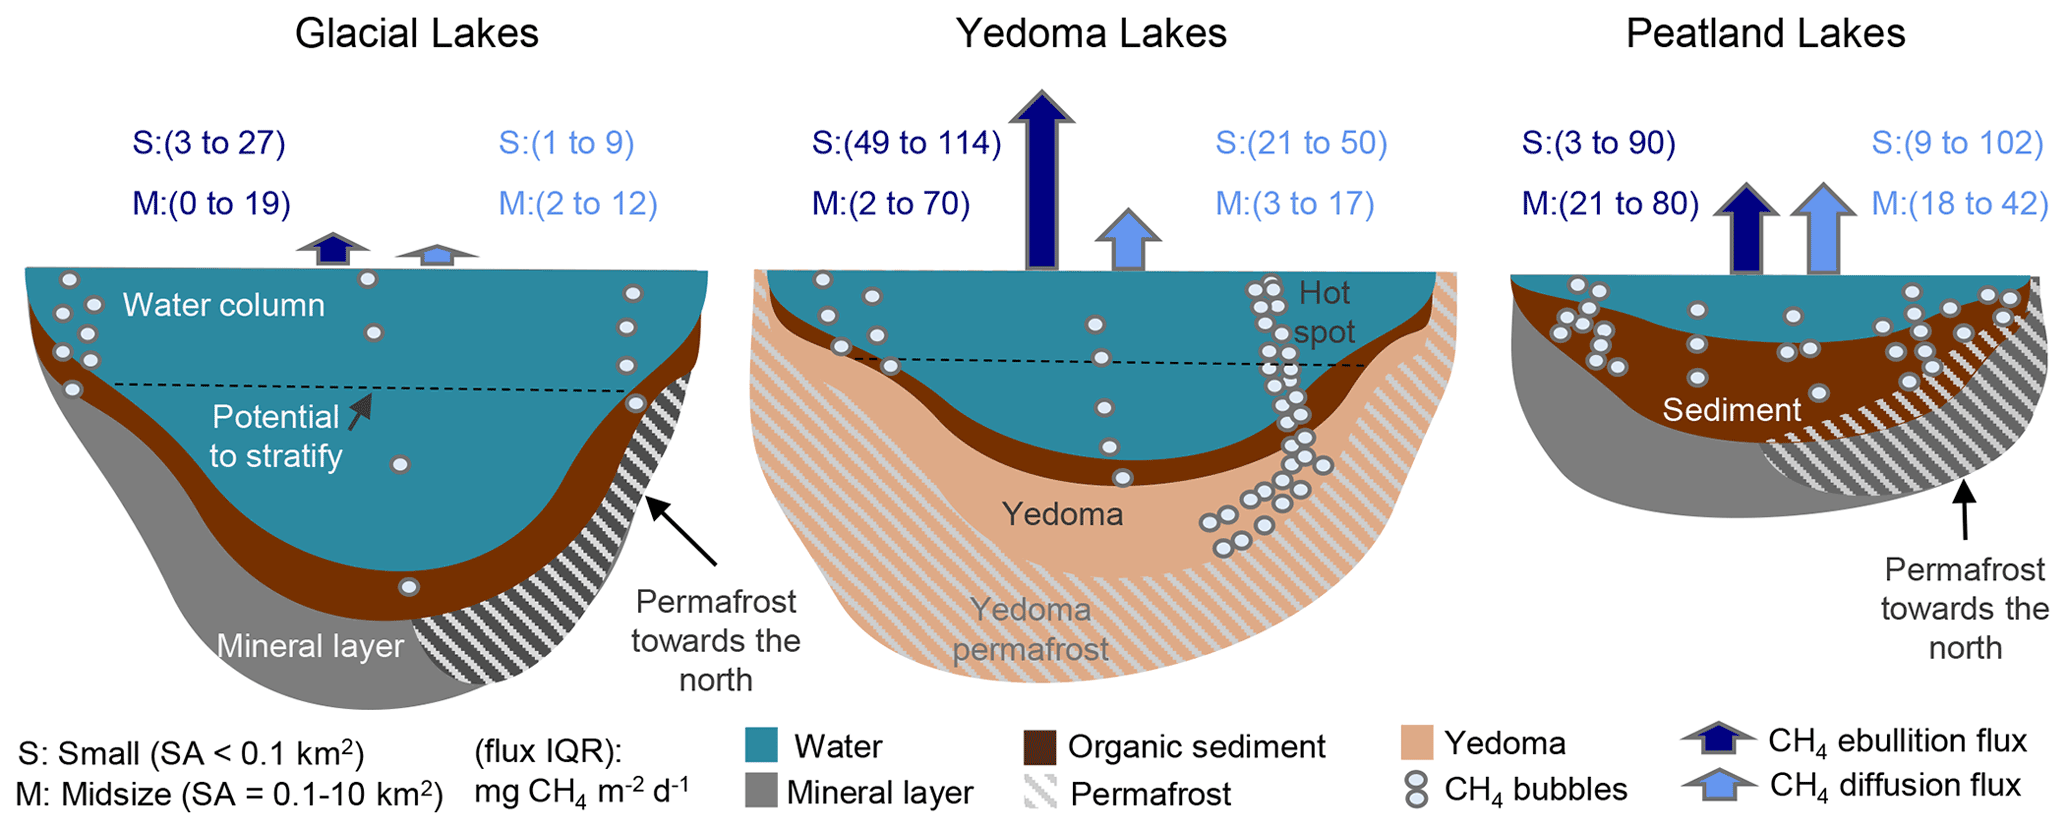
Figure 4Conceptual diagram of the aquatic land cover classes. Key differences between the three overarching lake genesis “types” and their CH4-emitting characteristics are shown, including sediment type, permafrost conditions, and water column depth. Fluxes (interquartile ranges, IQRs) for each class size within the overarching types are shown above the lakes for both diffusive and ebullitive transport pathways. Arrows are scaled based on mean flux values. See Sect. 3.3 for a detailed breakdown of aquatic fluxes. Large Lakes are not shown.
Small and Midsize Peatland Lakes are described as lakes with thick organic sediments that are mainly found adjacent to or surrounded by peatlands or in lowland tundra regions with organic-rich soils. Small Peatland Lakes include the numerous small pools often found in extensive peatlands and lowland tundra regions, e.g., including the open-water parts of string fens and polygonal peatlands. Peatland Lakes generally form as a result of interactions between local hydrology and the accumulation of peat, which can create open-water pools and lakes (Garneau et al., 2018; Harris et al., 2020) but can also form in peatlands as a result of permafrost dynamics (Sannel and Kuhry, 2011; Liljedahl et al., 2016). As such, these lakes with thick organic sediments are often shallow and have a relatively low shoreline development index. Peatland Lakes typically have dark waters with high concentrations of dissolved organic carbon.
Small and Midsize Yedoma Lakes are exclusive to non-glaciated regions of eastern Siberia, Alaska, and the Yukon, where yedoma deposits accumulated during the Pleistocene (Strauss et al., 2017). Yedoma permafrost soils are ice-rich and contain fine-grained, organic-rich loess that was deposited by wind and accumulated upwards in parallel with permafrost aggradation, thus limiting decomposition and facilitating organic matter burial (Schirrmeister et al., 2013). Notable thermokarst features, including lakes, often develop when yedoma permafrost thaws, causing labile organic matter to become available for microbial mineralization (Walter Anthony et al., 2016). Small Yedoma Lakes are thus more likely to have actively thawing and expanding lake edges where CH4 emissions can be extremely high, largely driven by hot spot ebullition emissions (Walter Anthony et al., 2016; Fig. 4). Century-scale development of yedoma lakes can shift the main source of CH4 production from yedoma deposits to new organic-rich sediment that accumulated from allochthonous and autochthonous sources, resulting in such lakes here being considered as Peatland Lakes.
Small and Midsize Glacial Lakes include all lakes with organic-poor sediments – predominately those formed through glacial or post-glacial processes, e.g., kettle lakes and bedrock depressions. However, due to similarities in CH4 emissions and controls thereof, we also include all other lakes with organic-poor sediments within these classes. Glacial Lakes typically have rocky bottoms or mineral sediments with limited organic content. Lakes in this class are abundant on the Canadian Shield and in Scandinavia but can be found throughout the boreal and tundra biomes. Many Glacial Lakes have a high shoreline development index, with irregular, elongated shapes. Generally, Glacial Lakes are deeper than lakes in the other classes when comparing lakes with similar lake areas and are more likely to stratify seasonally than peatland lakes (Fig. 4).
Large Lakes are greater than 10 km2 in surface area. Most Large Lakes are glacial or structural and tectonic in origin. Lake genesis is not considered for further differentiation within this land cover class.
2.2 Terrestrial Methane Flux Dataset
The Terrestrial Methane Flux Dataset includes warm-season (∼ May–October depending on the location) fluxes and was compiled using data from studies published before February 2020. We identified relevant studies using (1) JSTOR™, Google Scholar™, and Web of Science™ searches with the terms (peatland OR wetland OR bog OR fen OR marsh OR upland) AND (north* OR boreal OR arctic OR sub-arctic) AND (methane OR CH4 OR greenhouse gas*); (2) references from published studies; and (3) contributions of unpublished data (n=2). If multiple, yearly CH4 flux and water table measurements were reported from one site or if multiple studies reported fluxes from the same site, the data were entered as separate individual lines and were considered each their own “site”. Sites that underwent manipulations (soil temperature, water table, nutrients, etc.) were not included in the dataset; however, any control or undisturbed sites included within manipulation studies were included. Sites that had recently experienced disturbance from thermokarst processes were included. Winter flux measurements from terrestrial sites were excluded from this dataset (winter and ice-out emissions from aquatic ecosystems are included; see Sect. 2.3). A comprehensive synthesis of seasonal winter estimates of CH4 emissions from northern terrestrial ecosystems is presented in Treat et al. (2018).
The terrestrial dataset includes predominantly chamber measurements (n=519) at the sub-metre scale, which allows for a detailed representation of specific land cover classes (i.e., one land cover class per chamber measurement). However, a handful of eddy covariance measurements were included if the authors could clearly partition fluxes based on specific land cover classes (n=36). For more information on EC-based CH4 synthesis, we direct the readers to the FLUXNET-CH4 Community Product (Knox et al., 2019; Delwiche et al., 2021) and additional FLUXNET resources (https://fluxnet.org, last access: 15 April 2021). We grouped chamber measurements from specific studies by “site”, which we defined as surfaces with similar vegetation composition (dominant, present, absent) and physical characteristics (including water table position, permafrost conditions, organic layer depth, soil moisture, and pH) within proximity to each other (typically 1–100 m radius). In most cases, chambers and sites were already classified by these standards; however, sometimes it was necessary to combine or split chamber measurements presented by the authors into our site and classifications. By combining and splitting sites this way, we were able to classify sites into BAWLD land cover classes. Average daily warm-season fluxes were then calculated from the average CH4 flux from each site over the study's measurement period.
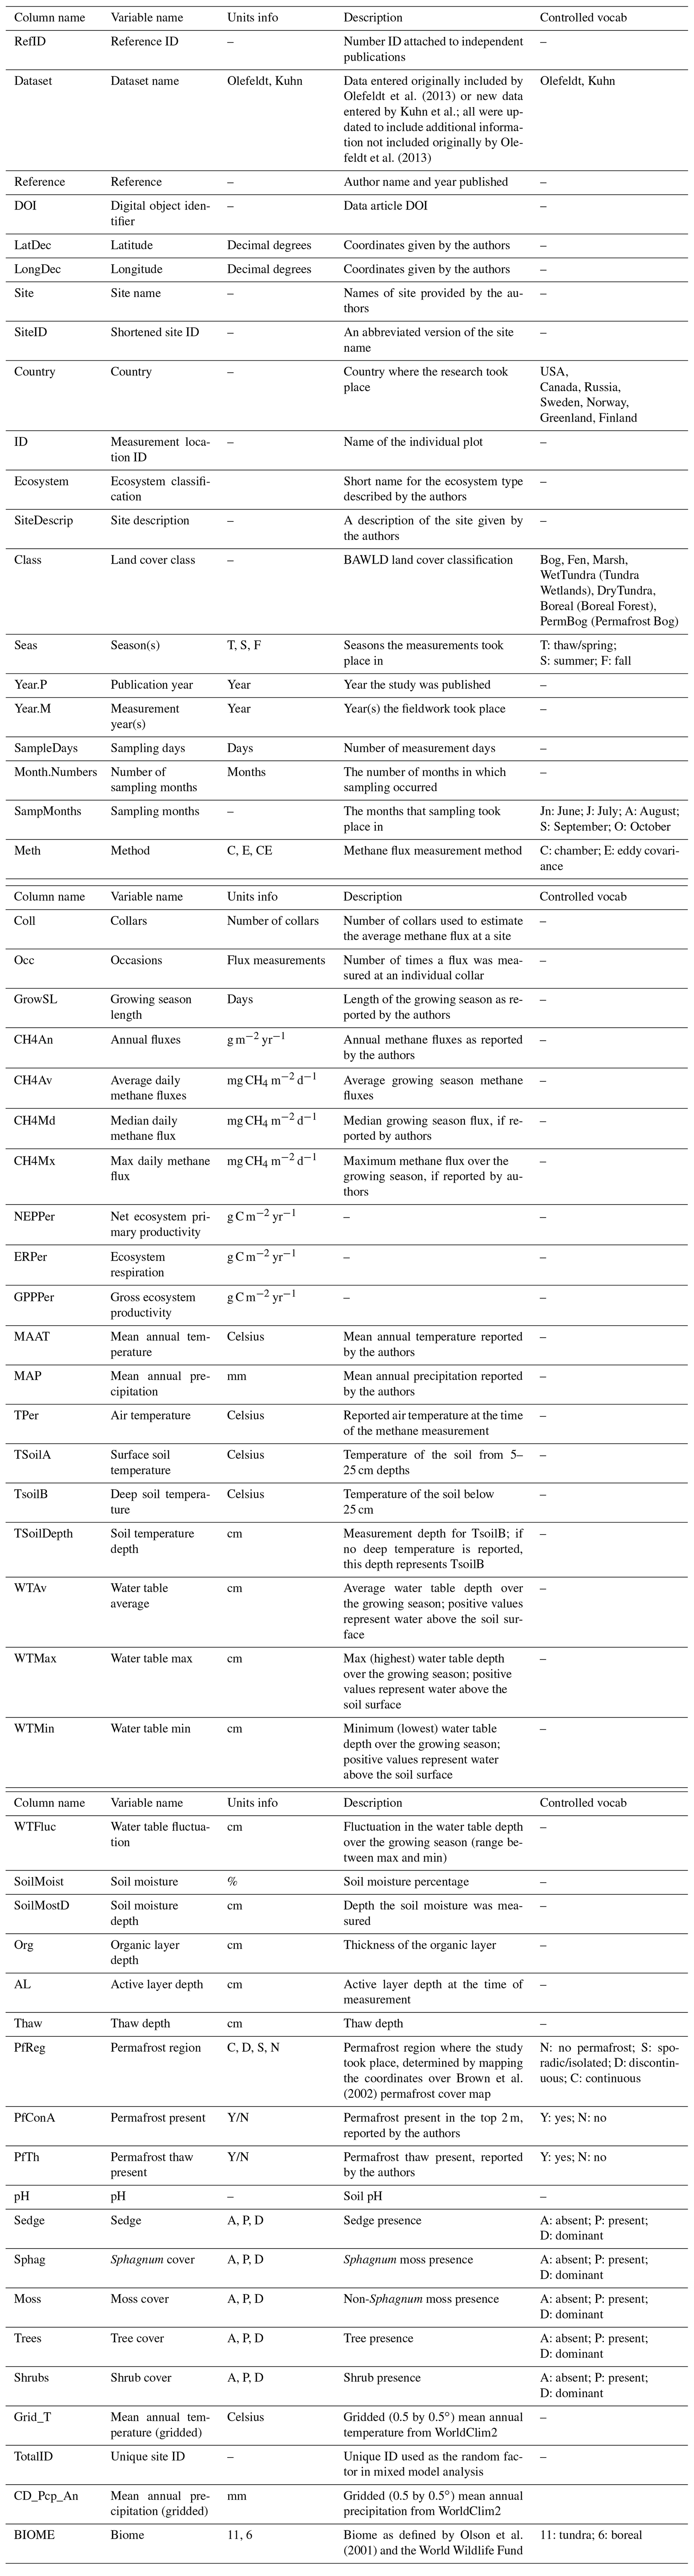
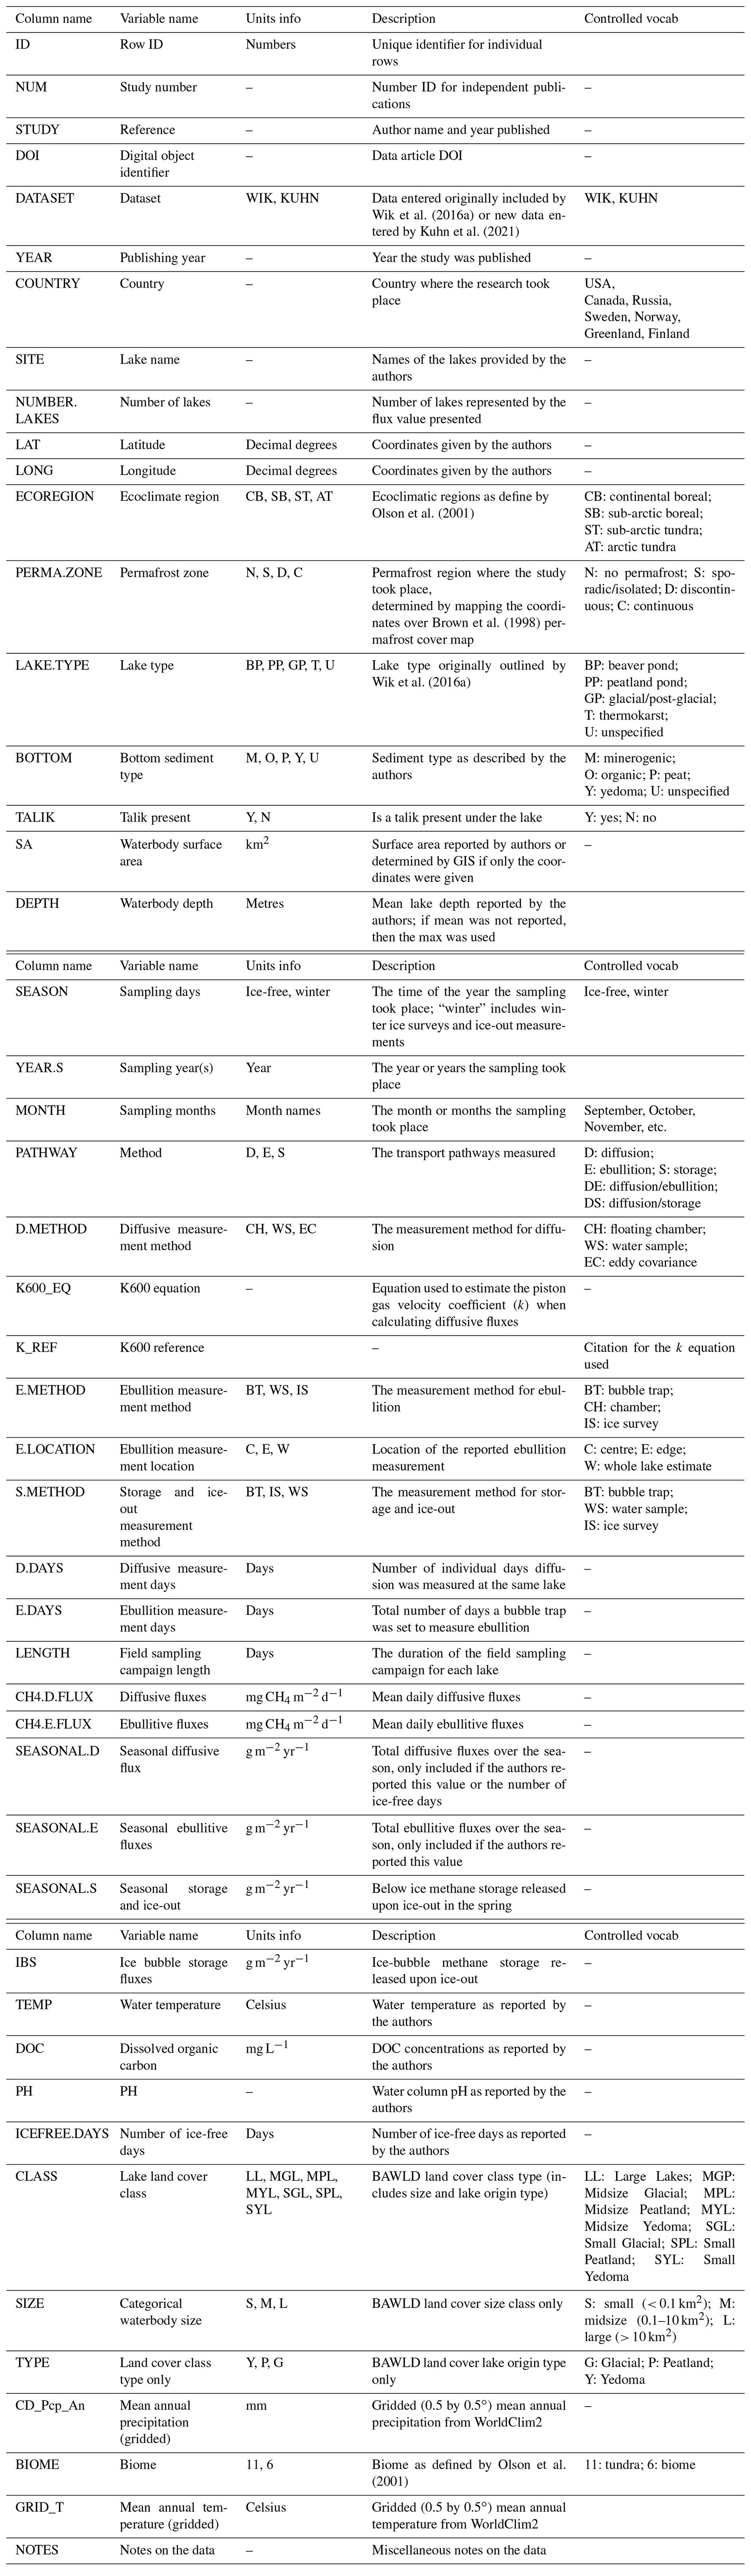
In addition to CH4 flux data, we extracted various site descriptors and categorical and continuous environmental variables (See Table 1 for detailed attribute information and additional variables not discussed here). For all sites, we included information on the site name (Site), location (LatDec/LongDec, Country), the months measurements were taken (SampMonths), the flux measurement method (Meth), the author's description of the site (SiteDescrip), and vegetation composition. Most studies did not classify land cover types with similar BAWLD criteria; therefore we assigned BAWLD land cover classifications. Permafrost zone was assigned according to Brown et al. (2002). When reported by the authors, we also extracted continuous variables including mean annual air temperature (MAAT), mean annual precipitation (MAP), growing season length, net ecosystem productivity (NEP), ecosystem respiration (ER), gross ecosystem photosynthesis (GPPPer), air temperature (TPer), soil temperature at 0–5 cm (TSoilA) and at 5–25 cm (TSoilB), water table depth (WTAv), organic layer depth (Org), active layer depth (AL), pH, and soil moisture (SoilMoist), all averaged over the same period as the flux measurements. The categorical variables collected include absence or presence of permafrost within the top 2 m (PfConA), permafrost thaw (PfTh), and vegetation composition (absent, present, dominant) for graminoid (Carex spp. and Eriophorum spp.; referred to as “Sedge” in the dataset), Sphagnum moss (Sphag), non-Sphagnum moss (Moss), tree, and shrub species. Vegetation composition of the functional plant type was considered dominant if that type made up greater than 50 % of the reported biomass or areal coverage or was one of only two species present at the site. Trees were assigned as the dominant vegetation type if the canopy was described as closed. Gridded (0.5 by 0.5∘) climate variables including mean annual temperature (referred to as GRID_T) and mean annual precipitation (CD_Pcp_An) were extracted from WorldClim2 (http://www.worldclim.com/version2, last access: 15 April 2021).
2.3 Aquatic Methane Flux Dataset
The Aquatic Methane Flux Dataset includes ice-free season (∼ May–October depending on the location) and winter and ice-out fluxes and was compiled using data from studies published before February 2020. We identified new studies using (1) JSTOR™, Google Scholar™, and Web of Science™ searches with the terms (lake* OR pond*) AND (north* OR boreal OR arctic OR sub-arctic) AND (methane OR CH4 OR greenhouse gas*); (2) references from published studies; and (3) contributions of unpublished data (n=1). If multiple, yearly measurements were given for one site by the same study, we averaged the flux values (following the initial protocol taken by Wik et al., 2016a). If different studies reported fluxes from the same lake, then these data were reported as separate entries. In instances where ice-free season fluxes and storage and ice-out fluxes were reported for the same lake, those data were entered on separate lines, but the number of lakes was designated as NA for the winter measurement so as to not add to the total lake count. We defined sites based on reported average CH4 fluxes. For example, some studies reported one average flux value for a group of lakes, and this was considered one “site”; however, the number of lakes was noted. Studies that only reported CH4 concentrations and not a flux estimate were not included.
Like the terrestrial dataset, the aquatic dataset focuses on small-scale measurement techniques that allow for flux estimates to be attributed to one specific land cover class. Therefore, ice-free season diffusive fluxes included in this dataset were measured using dissolved CH4 concentrations and modelling approaches (n=254) or floating chambers (n=181), while ebullitive fluxes were measured by bubble trap (n=187) or floating chamber (n=34). Diffusive modelling approaches include an estimate of the gas transfer coefficient, k. Gas transfer velocity estimates are commonly calculated using equations (e.g., Cole and Caraco, 1998). However, more recent efforts with EC systems, chambers, and either calculation or measurement of the near-surface turbulence that enables flux across the air–water interface indicated that fluxes calculated using the wind-based model of Cole and Caraco (1998) of gas transfer velocities underestimate fluxes from non-sheltered and sheltered waterbodies by a factor of 2 to 4 (Heiskanen et al., 2014; Mammarella et al., 2015; MacIntyre et al., 2020). Highly sheltered waterbodies, such as small lakes surrounded by trees, may be an exception and can have reduced mean lake k values (Markfort et al., 2010). While we do not recalculate fluxes in this synthesis, we indicate which k calculations were used so that future studies can easily identify and recalculate fluxes when required. Only a handful of eddy covariance (EC) measurements (n=5) were included in the dataset. We included a limited number of EC measurements due to difficulties that most studies had in attributing the fluxes to lakes specifically. We classified all EC fluxes as diffusive fluxes as it is hard to separate between ebullition and diffusion within this measurement technique; however, for this reason, EC measurements were excluded from statistical analysis for ice-free season fluxes.
We further delineated aquatic fluxes by transport pathway including ebullition (bubbles), diffusion (hydrodynamic flux), and winter storage and ice-out flux. Ebullition and diffusion measurements were averaged over the ice-free season to represent a mean daily flux estimate across a lake. In some cases, if measurements were only taken from one zone of the lake (i.e., just lake edge or just lake centre) we averaged the fluxes and assumed whole-lake fluxes. Some studies only reported a seasonal ice-free flux estimate. If they also reported the number of days in the ice-free season, we then calculated the average daily flux rate. Storage and ice-out flux includes the annual release of CH4 that accumulates within and under the ice over the winter and is released during spring turnover and includes estimates from ice bubble surveys (IBSs). Our storage flux estimate does not include estimates of fall circulation fluxes, wherein CH4 that is stored in the deep portion of the water column is released upon seasonal turnover of the water column (Karlsson et al., 2013; Sepulveda-Jauregui et al., 2015). We also include an estimate of the ice-free season ebullition and diffusive fluxes if provided by the authors or if the authors provided the number of ice-free days. Note that flux measurements that include the transport of CH4 through littoral vascular plants were not included as aquatic fluxes, but as Marsh or Tundra Wetland fluxes within the terrestrial dataset.
In addition to aquatic CH4 flux data, we also collected various site descriptors and categorical and continuous environmental variables (see Table 2 for detailed attribute information and additional variables not discussed here). For all sites we extracted information about the site name and location (latitude and longitude and country), the number of lakes for a reported flux estimate, sampling season (SEASON) and within-lake sampling location (E.LOCATION), sampling pathway (PATHWAY), the general sampling dates (YEAR/MONTH), and the number of times sampled (D.DAYS/E.DAYS). When available, we added a column for the equation used to estimate the gas transfer velocity constant (k) using modelling approaches (K600_EQ). Categorical variables included lake sediment type (BOTTOM), permafrost zone (PERMA.ZONE), presence of talik (TALIK), ecoregion (ECOREGION), and the original lake types outlined by Wik et al. (2016a) (LAKE.TYPE). BAWLD-specific categorical variables include the overarching lake genesis type (TYPE), binned waterbody size (SIZE), and BAWLD land cover class (CLASS). BAWLD land cover classes were assigned based on author descriptions of the waterbodies. If the authors did not provide information indicating the lake type, we used the coordinates provided to find the waterbody on Google Earth™ and used yedoma permafrost (Strauss et al., 2017) and organic soil maps (Hugelius et al., 2014) to determine the land cover class. In a handful of cases, the land cover class could not be determined, and we left the “class” field blank. When reported, we extracted the following continuous variables: surface area (SA), waterbody depth (DEPTH), water temperature (TEMP), dissolved organic carbon concentration (DOC), and pH. Gridded (0.5 by 0.5∘) climate variables including mean annual temperature (GRID_T) and mean annual precipitation (CD_Pcp_An) were extracted from WorldClim2 (http://www.worldclim.com/version2, last access: 15 April 2021).
2.4 Statistics
All statistical analyses were performed in R statistical software (Version 1.1.383; https://www.r-project.org, last access: 10 April 2021). We tested for significant relationships between log-transformed warm-season (terrestrial sites) or ice-free season (aquatic sites) average CH4 fluxes and several covariates using a combination of linear regression and linear mixed-effects models when necessary (R Package 3.3.3; Lme4 Package; Bates et al., 2014). To include sites with CH4 uptake or near-zero fluxes we added a constant of 10 (terrestrial fluxes) or 1 (aquatic fluxes) before log transformation. Mixed-effects modelling was used when a given model included sites with multiple yearly measurements or if multiple studies reported fluxes from the same site (R “nmle” package; Pinheiro et al., 2017). In these cases, site ID was included as a random effect in the analysis to help account for lack of independence across repeated measurements and to weight potential biases (as in Treat et al., 2018). Almost no studies in the terrestrial or aquatic datasets provided information on all the variables; therefore, individual statistical analyses have different sample sizes. However, the same subset of data was used to select the best-performing mixed models (n=206 and n=149 for the terrestrial and diffusive aquatic mixed models, respectively). The significance of individual predictor variables in the mixed models was evaluated using forward model selection. Model performance was conducted using the size-corrected Akaike information criterion (AICc; “AICcmodavg” package; Mazerolle and Mazerolle, 2015), wherein a decrease in AICc by 2 or more is an indication of a superior model (as in Olefeldt et al., 2013; Dieleman et al., 2020). All models were tested against each other and the null model. The null model only included the random effects. Non-parametric Tukey's honestly significant difference (HSD) post hoc tests were performed to assess differences in median fluxes among sub-categories if the overall model was determined significant. All aquatic diffusive and ebullitive fluxes were analyzed separately. Eddy covariance CH4 flux estimates for aquatic ecosystems (n=5) were not included in the statistical analysis since ebullitive and diffusive fluxes could not be partitioned. We modelled the temperature dependence (Q10) of CH4 fluxes following Rasilo et al. (2015).
2.5 Limitations
Due to limitations of the studies where we extracted data from, some parts of the annual period are not considered in our dataset. Thus, this dataset focuses on small-scale, surface-based spatial patterns in CH4 fluxes associated with specific land cover classes and does not represent temporal patterns in fluxes. For both terrestrial and aquatic datasets, we extracted data on the average CH4 fluxes over warm periods or ice-free periods. While we do include an estimate of ice-out and winter fluxes from aquatic ecosystems, our dataset does not include autumnal turnover fluxes from aquatic ecosystems, which may represent a substantial portion of annual emissions (Fernández et al., 2014; Klaus et al., 2018). Nor do we include shoulder season or winter fluxes from terrestrial ecosystems, which can represent substantial components of the annual flux (Zona et al., 2016; Treat et al., 2018). Furthermore, our data extraction methods were not designed to assess inter-annual changes in fluxes as this dataset compiles the data of multiple studies over a large range of years (1986–2020). Despite data limitations, the datasets represent an important step forward regarding the spatial variability in fluxes among different land cover types.
3.1 Summary statistics
In total, we extracted 555 site year CH4 estimates from terrestrial (wetland and non-wetland) ecosystems. Most reported fluxes (site years) were from Canada and Greenland (34 %), followed by Russia (27 %), Alaska (25 %), and Scandinavia (14 %) (Fig. 1a). Terrestrial fluxes followed a bimodal distribution, split by net positive fluxes (82 % of all reported fluxes) and net uptake or zero-emission (18 % of all reported fluxes; Fig. 5a). The median number of measurement days per site year flux for chamber measurements was 10, and the median number of collars per site measurement was 5 (Fig. 6a). Of the site year fluxes reported from aquatic ecosystems, there were 441 diffusive estimates and 175 ebullitive ice-free season estimates as well as 125 estimates of winter and ice-out fluxes (including storage, winter ebullition, ice bubble surveys, or a combination of the three). Aquatic sites were distributed throughout the boreal–arctic region with a greater density of sites in Alaska and eastern Canada (Fig. 1b). Diffusive fluxes showed a unimodal distribution, while ebullition showed bimodal peaks near 100 and 0 mg CH4 m−2 d−1 (Fig. 5b, c). The median number of measurement days per site year flux was 3 and 15 for diffusion and ebullition, respectively (Fig. 6b, c). Winter and ice-out fluxes were reported as annual estimates and are shown in Table 5.
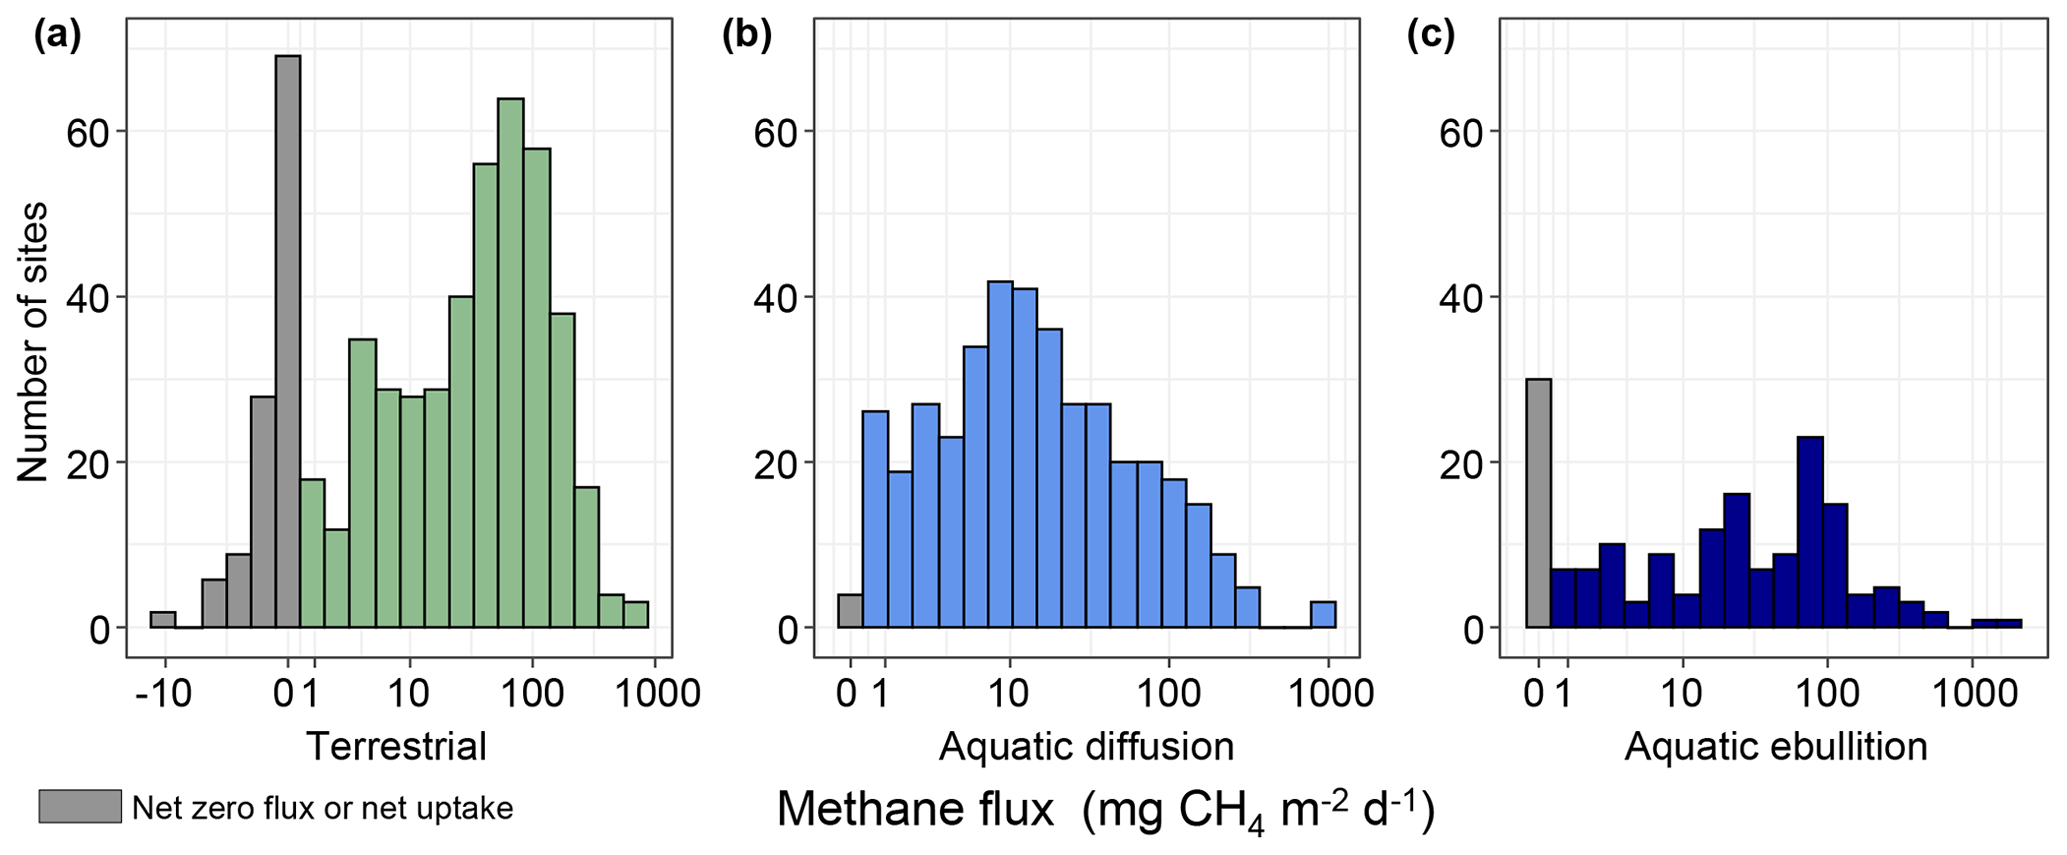
Figure 5Histograms of site-specific average CH4 fluxes. (a) Terrestrial fluxes. (b) Aquatic diffusive fluxes. (c) Aquatic ebullitive fluxes. Grey bars represent net zero or net uptake fluxes.
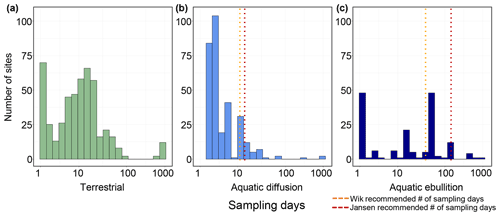
Figure 6Histograms for the number of sampling days contributing to the average warm-season or ice-free season flux value. (a) Terrestrial flux sampling days. (b) Aquatic diffusion flux sampling days. (c) Aquatic ebullition sampling days. The dotted orange lines in (b) and (c) represent the number of recommended sampling days needed to arrive at a flux estimate within 20 % accuracy (11 d for diffusion and 39 d for ebullition; Wik et al., 2016b). The dotted red lines represent an updated estimate of the number of sampling days needed including 14 and 135 d for diffusion and ebullition, respectively (Jansen et al., 2020).
3.2 Correlations with terrestrial fluxes
Of the continuous variables, water table (WTAv) and soil temperature (TSoilA at 5–25 cm) were significantly and linearly correlated with CH4 (WTAv: χ2=121, P<0.0001, R2m=0.28, df = 380; TSoilA: χ2=54.6, P<0.0001, R2=0.21, df = 283), and gross primary productivity (GPP) was logarithmically correlated with CH4 (χ2=5.8, P=0.016, R2m=0.15; df = 56; Fig. 7). However, given the relatively low sample size for GPP (n=57), we do not include GPP in mixed model analyses. The temperature sensitivity (Q10) for all terrestrial emissions was 2.8 (Table S1 in the Supplement). Of the categorical variables, there was no difference between the different permafrost zones (χ2=0.88, P=0.83, df = 539), but CH4 fluxes were higher from sites without permafrost present in the top 2 m (χ2=16.37, P<0.0001, df = 482; Fig. 8). For vegetation composition, sites dominated by shrubs had lower fluxes than those sites with shrubs present or absent (χ2=34.66, P<0.001, df = 2; Fig. 8). The strongest relationship between vegetation composition and CH4 flux was emergent graminoid cover. Sites with dominant graminoid composition had higher fluxes than sites where graminoids were present or absent (χ2=148.95, P<0.0001, df = 2; Fig. 8). The best explanatory model for terrestrial CH4 emissions was an additive model that included site-level predictors of water table, soil temperature, and graminoid cover alongside the broader classification of land cover class (R2m=0.69; P<0.0001, df = 224; Table S2). There was no effect on model performance using interactive effects (DeltaAICc = 0.84); however, the R2m did increase to 0.73 (Table S2). Notably, on their own, individual models with just the site-level predictors or with just land cover type explained close to the same amount of variation in CH4 fluxes (R2m=0.55 and 0.54, respectively). Methane uptake fluxes, when analyzed separately, were positively correlated with thaw depth (i.e., more uptake with greater thaw depths; R2m=0.55, χ2=19.61, P<0.0001, df = 22; Fig. S1 in the Supplement). No other continuous variables were correlated with CH4 uptake; however, sites where shrubs were present had significantly higher uptake than sites where shrubs were absent or dominant (Tukey's post hoc, P<0.001 for both, df = 2; Fig. S2).
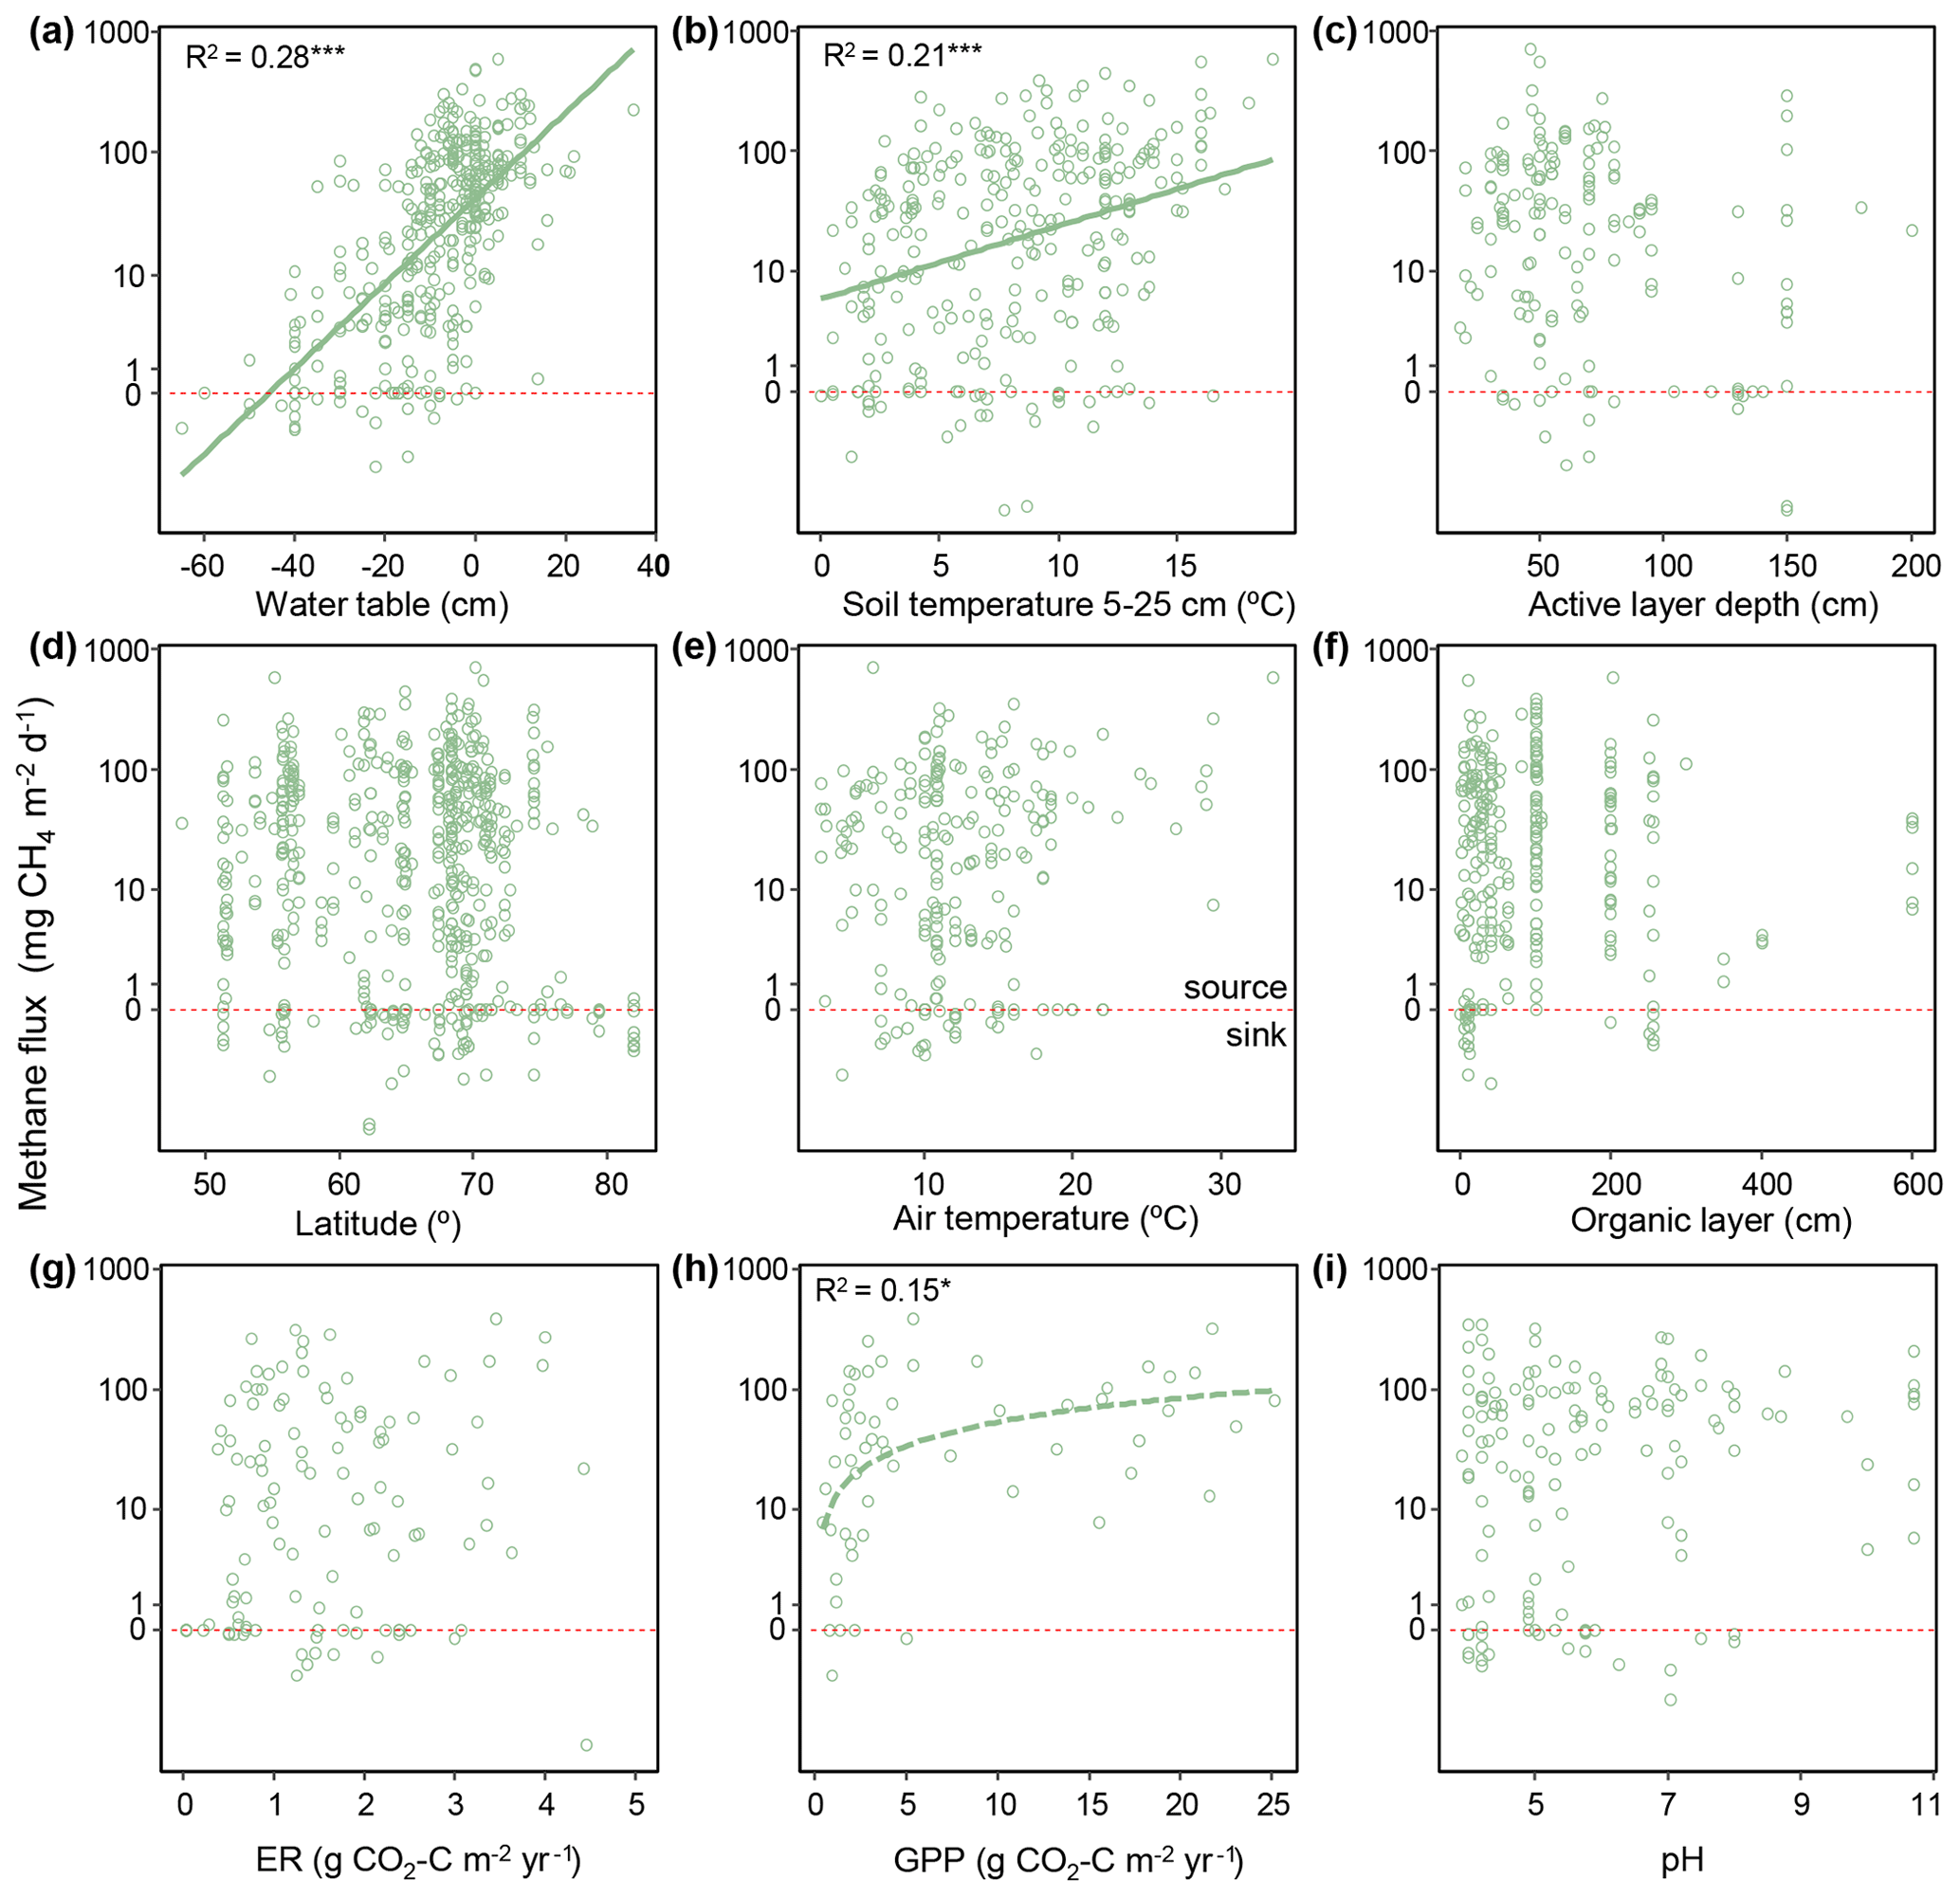
Figure 7Relationships between site-averaged warm-season CH4 flux and environmental variables. Environmental variables include water table, soil temperature at 2–25 cm depth, active layer depth, latitude, air temperature, organic layer thickness, ecosystem respiration (ER), gross primary productivity (GPP), and soil pH. Regression lines and R2 values are shown for significant relationships. Note the log scale. CH4 flux was linearly related to water table and soil temperature and was logarithmically related to GPP (dotted line). Points below the dotted red line represent net uptake fluxes. * P<0.05, P<0.01, P<0.001.
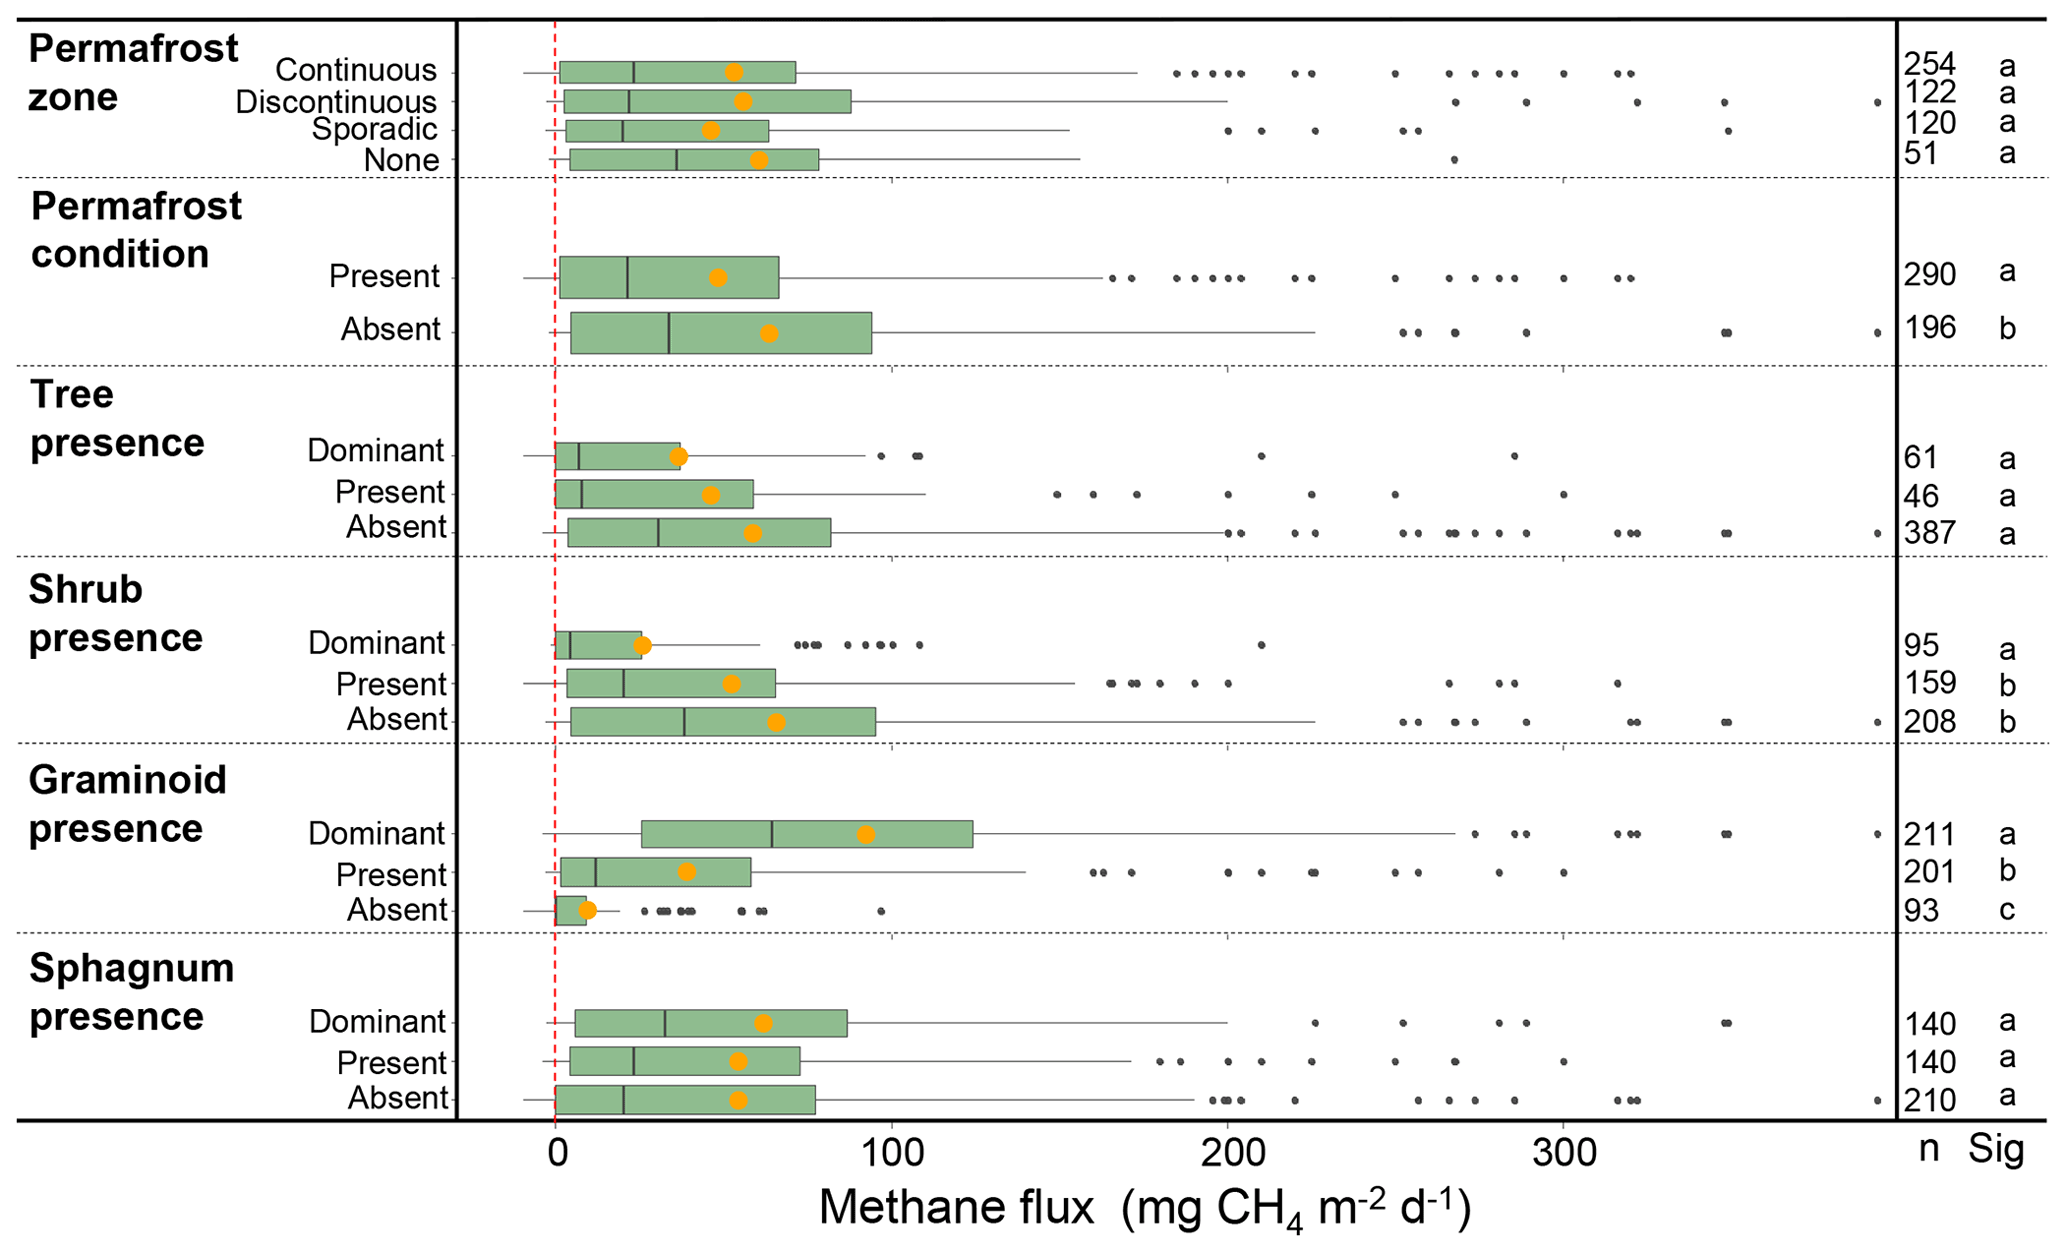
Figure 8Warm-season CH4 fluxes classified by categorical variables. Orange circles represent mean flux values. The number of sites for each category is represented in the column to the right (n), and statistical differences among the categories are indicated by the letters (Sig), wherein bars with the same letters are not significantly different. Permafrost zones are from Brown et al. (2002). Permafrost condition represents the presence of permafrost in the top 2 m as reported by the authors. See text for definitions used to classify vegetation cover. Outlier fluxes greater than 380 are not shown.
There were significant differences in fluxes among the BAWLD terrestrial land cover classes (χ2=253.69, P<0.001, df = 6; Fig. 9a, Table 3). Median fluxes were highest from Marshes, Tundra Wetlands, and Fens (mean water table = +2, −0.4, and −6 cm, respectively). Median fluxes from Bogs were lower than the Marshes, Tundra Wetlands, and Fens but higher than Permafrost Bogs, Dry Tundra, and Boreal Forests. Permafrost Bogs were the only wetland class that fell into the lowest-emitting group of classes. However, the frozen and elevated nature of Permafrost Bogs typically leads to lower-water-table conditions more like Dry Tundra and Boreal Forests (mean water table = −22, −15, and −40 cm, respectively). However, it must be noted that in most Boreal Forest sites the water table is not in the top 2 m; therefore water table is not commonly measured or reported. The mean water table depth presented here is likely an overestimate that represents wetter Boreal Forest sites that had measurable water tables in the top 2 m. Boreal Forest ecosystems were the only class to have negative median CH4 flux for the entire class (net uptake). Permafrost Bogs and Dry Tundra classes also included net uptake site year CH4 estimates (n=17 and 31, respectively). One Wetland Tundra site in the Canadian High Arctic had net CH4 uptake for 1 of the 3 years it was measured (Emmerton et al., 2014). Notably, the apparent temperature sensitivity from the drier terrestrial sites (Boreal Forest, Dry Tundra, and Permafrost Bogs: Q10=3.7) was higher than from the wet terrestrial sites (Marshes, Tundra Wetlands, Bogs, and Fens: Q10=2.8).

Figure 9Relationship between methane flux and BAWLD land cover classes. (a) Terrestrial fluxes per class. (b) Aquatic fluxes including diffusion and ebullition per class. Orange dots represent the arithmetic mean flux values, and black lines represent median flux values. Boxes represent 25th and 75th percentiles. Outlier fluxes over 380 are not shown. The letters represent significant differences in fluxes among classes, wherein bars with the same letters are not significantly different.
Table 3Characteristics of BAWLD terrestrial classes based on environmental variables. The number of sites (site years) and contributing studies are shown for each class. Also shown are the mean, median, and quartiles for site-average CH4 flux, water table, soil temperature between 5 and 25 cm (TSoilB), sedge cover, pH, ecosystem respiration (ER), and gross primary productivity (GPP). * In some cases, one study contributed flux data for multiple classes.

3.3 Correlations with aquatic fluxes
Diffusive CH4 fluxes from aquatic ecosystems were negatively correlated with the continuous variables logged surface area (χ2=73.0, P<0.0001, R2m=0.20, df = 235; Fig. 10a), logged waterbody depth (χ2=23.5, P<0.0001, R2m=0.09, df = 275; Fig. 10b), and latitude (F=54.6, P<0.0001, R2=0.13, df = 361; Fig. 10c) and positively correlated with DOC (F=71.7, P<0.0001, R2=0.21, df = 261; Fig. 10d) and water temperature (F=57.2, P<0.001, R2=0.19, df = 236; Fig. 10e). The apparent Q10 for diffusive emissions was 4.3 (Table S1). Diffusive CH4 fluxes were highest from the sporadic permafrost zone (χ2= 17.2, P=0.002, df = 3; Fig. 11). Furthermore, diffusive fluxes were significantly higher from small lakes compared to midsize and large lakes (χ2=30.5, P<0.0001, df = 2; Fig. 11) and from lakes with peaty or organic-rich sediments compared to lakes with Yedoma and Glacial sediment types (χ2=103.9, P<0.0001, df = 2; Fig. 11). The best explanatory model for diffusive CH4 fluxes was an additive model including an interaction between lake surface area (continuous) and type (i.e., overarching lake genesis) alongside water temperature as predictor variables (F=14.9, P<0.0001, adj.R2=0.41, df = 149; Table S3). Land cover class on its own explained 25 % of the flux variation (F=22.8, P<0.0001, df = 149).
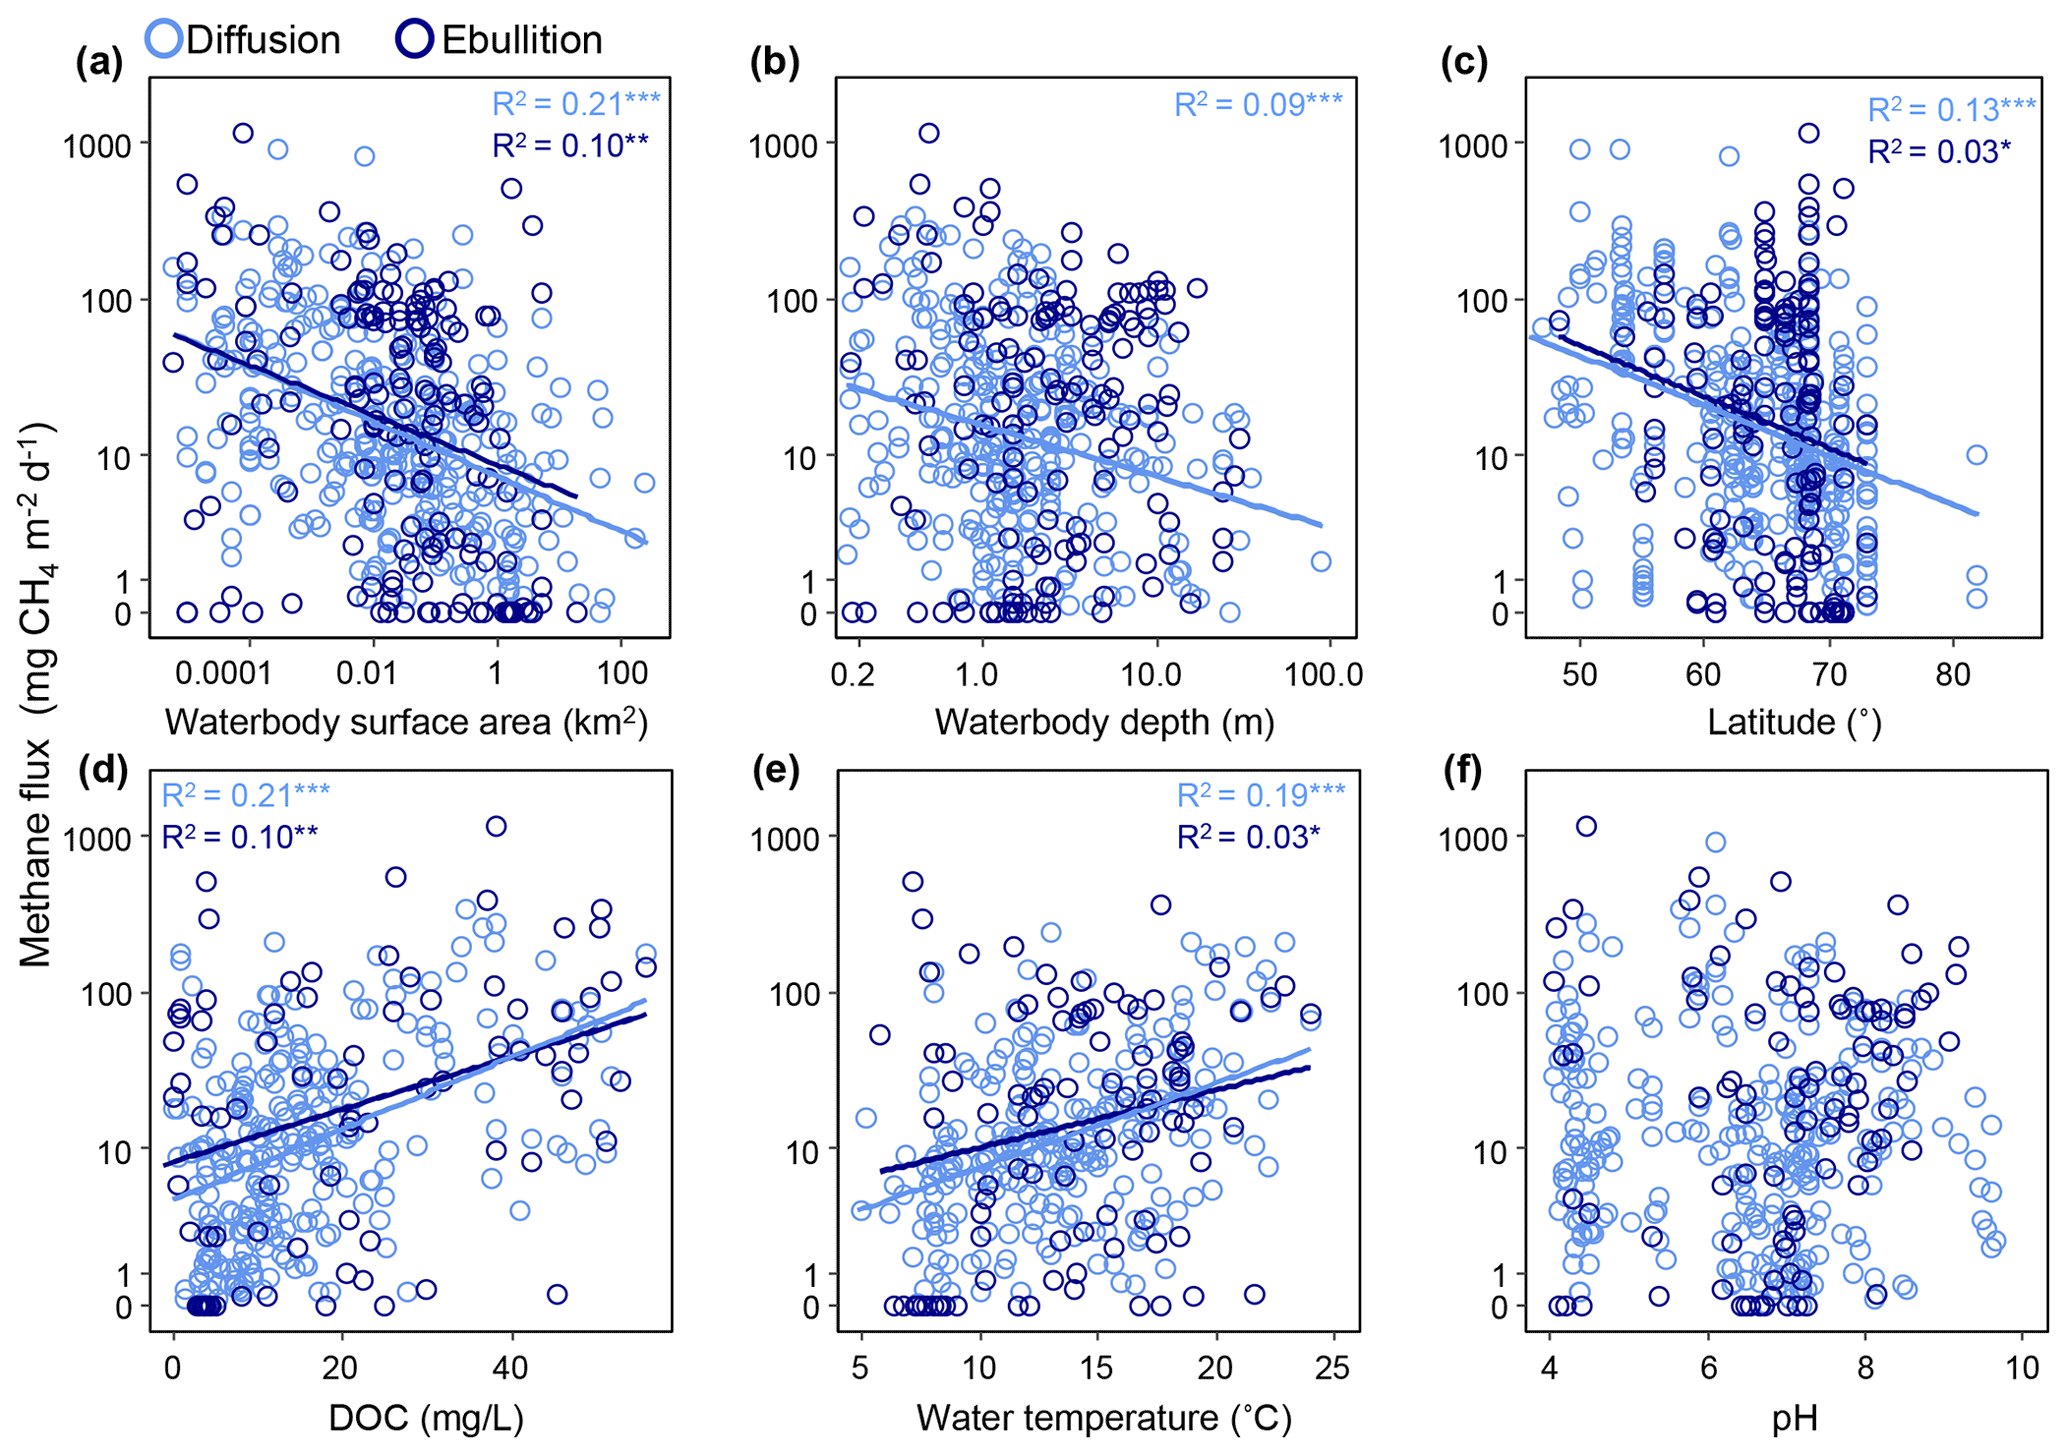
Figure 10Relationships between site-averaged ice-free diffusive and ebullitive CH4 fluxes (note the log scale) and environmental variables. Environmental variables include surface area, waterbody depth, latitude, dissolved organic carbon (DOC) concentration, water temperature, and pH. Regression lines and R2 values are shown for significant relationships. Log diffusive CH4 flux was linearly related to surface area, depth, latitude, water temperature, and DOC. Log ebullitive fluxes were linearly related to surface area, latitude, DOC, and water temperature. * P<0.05, P<0.01, P<0.001.
Ebullitive CH4 fluxes from aquatic ecosystems were positively correlated with logged DOC (F=12.25, P=0.0008, adj.R2=0.14, df = 71; Fig. 10d), negatively correlated with surface area (F=13.88, P=0.0003, adj.R2=0.08, df = 164; Fig. 10a) and latitude (F=5.38, P=0.02, adj.R2=0.03, df = 160; Fig. 10c), and weakly correlated with water temperature (F=5.55, P=0.02, adj.R2=0.06, df = 67; Fig. 10e). The apparent Q10 for ebullitive emissions was 2.4 (Table S1). There was no apparent relationship with lake depth and ebullitive fluxes (F=0.02, P=0.91, df = 151; Fig. 10b). There were no differences in ebullitive emissions between the permafrost zones with the exception of lower ebullitive emissions from the continuous zone compared to the sporadic zone (Tukey's HSD, P < 0.001; Fig. 11). Like diffusive fluxes, ebullitive fluxes were higher from the small lake classes compared to midsize lakes (Wilcoxon rank sum, P=0.0006; note that Large Lakes did not have a large enough sample size (n=1) to be included in the post hoc analysis). Finally, ebullitive fluxes were similarly higher from Peatland and Yedoma lakes compared to Glacial Lakes (Tukey's HSD, P=0.006 and 0.001, respectively). The best explanatory model for ebullitive fluxes using a subset of the data with complete information for predictor variables of interest (i.e., SA, log.CH4.E.FLUX.plus1, SITE, CLASS, SIZE, DOC, TYPE, LAT, GRID_T) included just waterbody surface area (continuous) as a predictor variable (F=19.85, P=0.0001, adj.R2=0.21, df = 68).
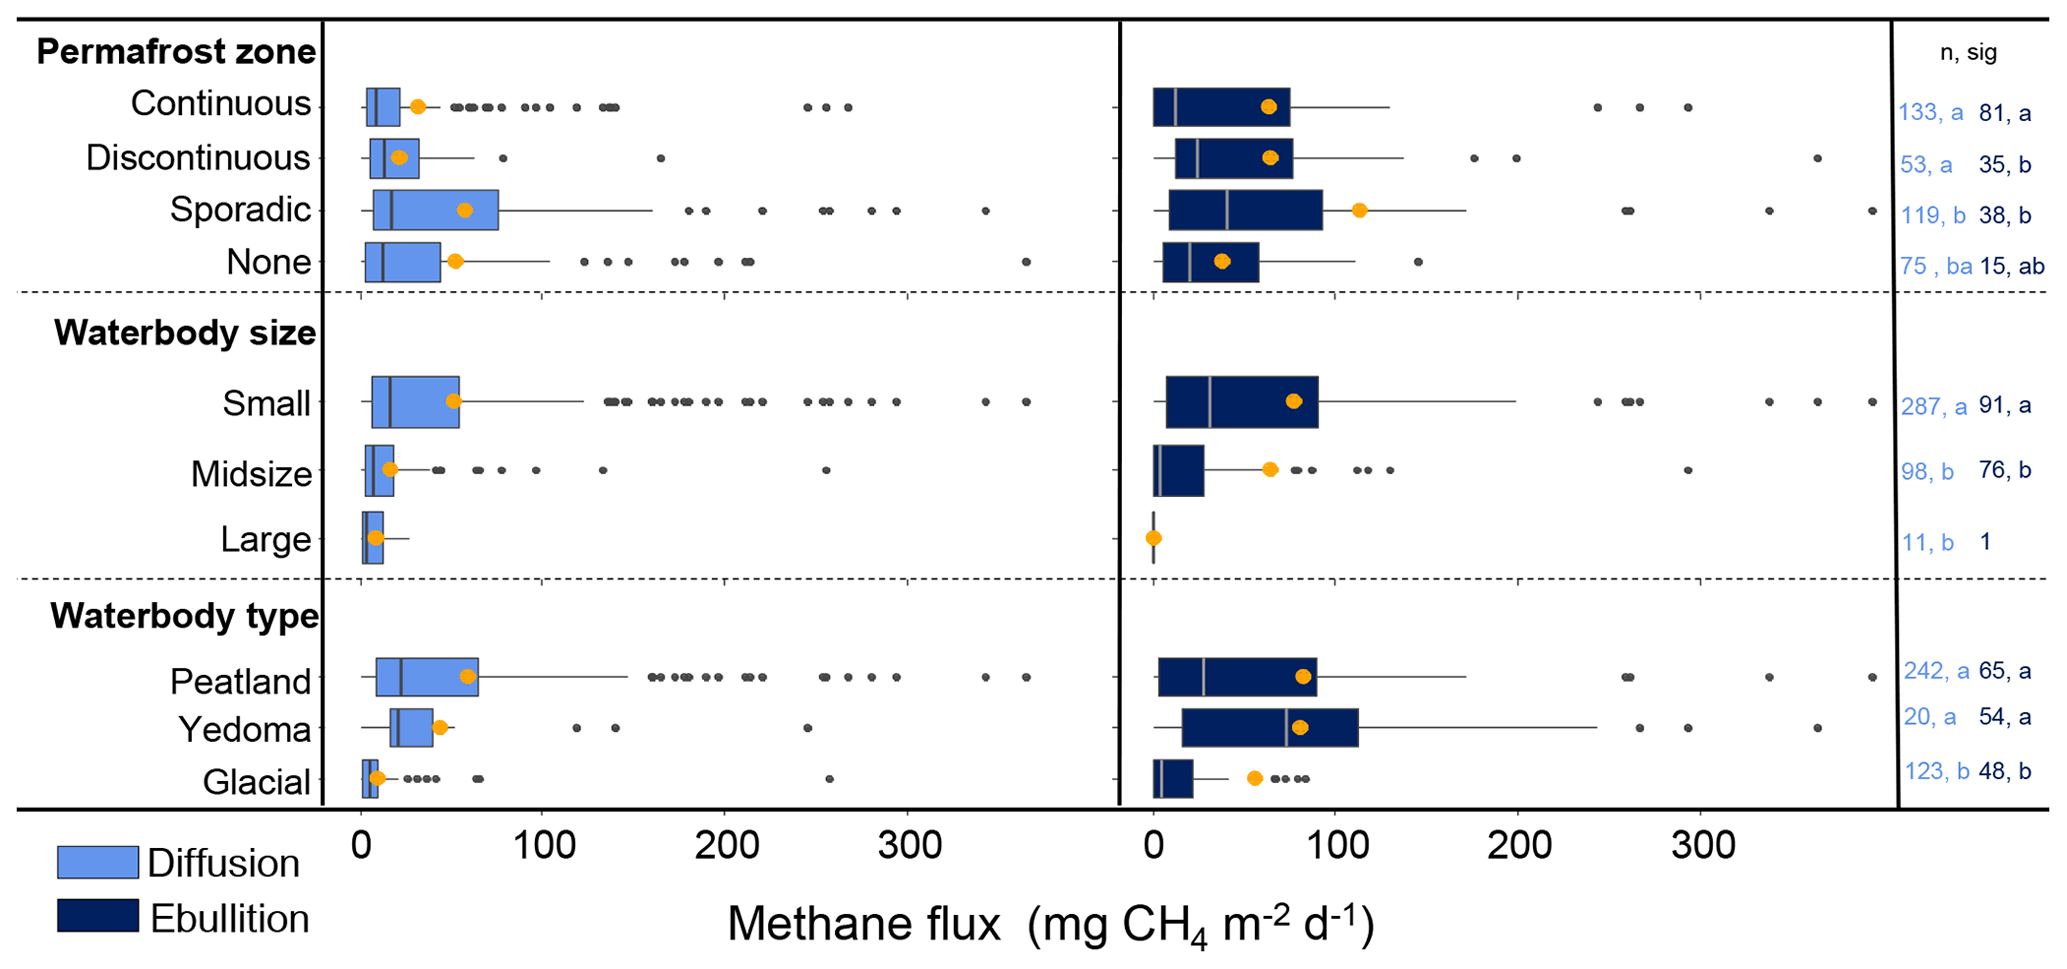
Figure 11Ice-free season diffusion (left) and ebullitive (right) CH4 fluxes as described by categorical variables. Orange circles represent mean flux values. The number of sites for each category is represented in the column to the right (n) in the representative colours for diffusion (light blue) and ebullition (dark blue). The letters (sig) indicate statistical differences among the categories, wherein bars with the same letters are not significantly different. Lake size represents binned surface areas for < 0.1 km2 (small), 0.1–10 km2 (midsize), and > 10 km2 (large). Lake type represents the BAWLD classification of waterbody types including Peatland, Yedoma, and Glacial Lakes. Fluxes higher than 380 are not shown.
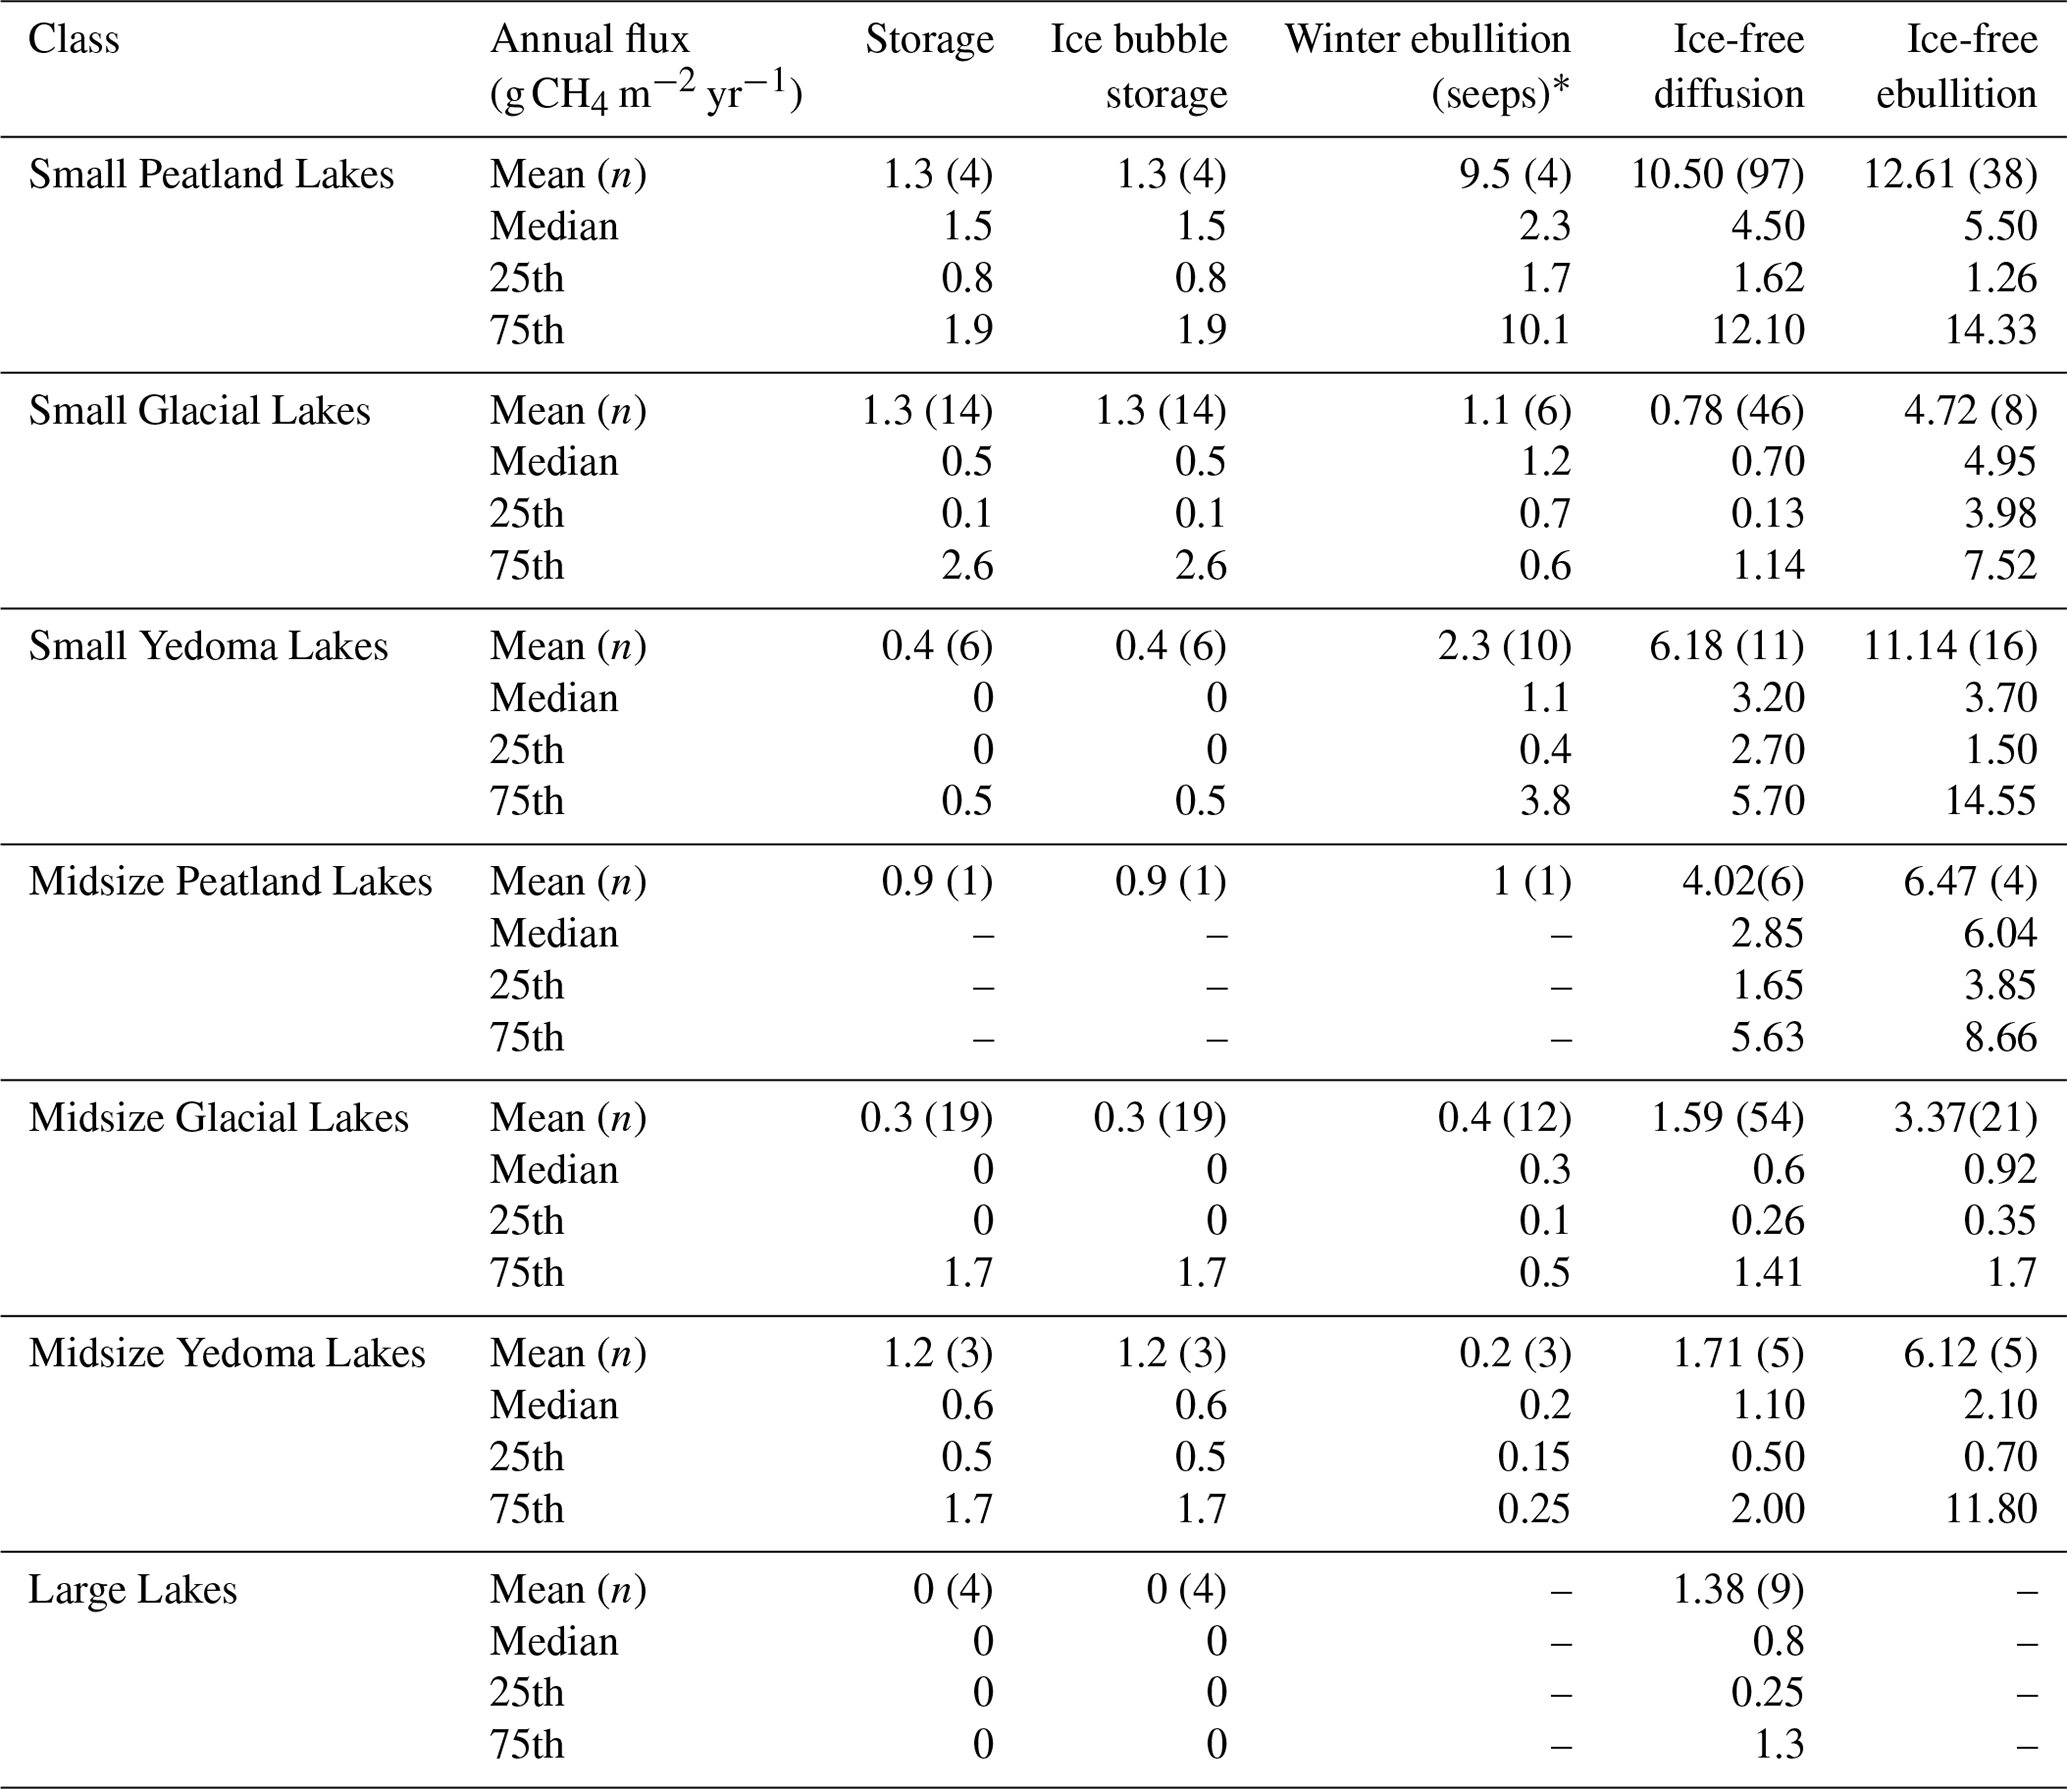
There were clear differences in diffusive CH4 fluxes among the aquatic class types, but few differences were observed for ebullitive fluxes. Diffusive fluxes were higher from the Peatland and Yedoma Lake classes (both small and midsize), associated with organic-rich sediments, compared to mineral-rich glacial and large lakes (χ2=119.8, P<0.001, df = 6; Fig. 9b, Table 4). While ebullition fluxes appear to follow a similar trend to diffusive fluxes, the only significant difference was between Small Yedoma Lakes and Midsize Glacial Lakes (Tukey's HSD, P<0.001; Fig. 9b). However, the lack of statistical differences found for ebullition between lake classes may in part be due to fewer and more variable ebullition measurements compared to diffusion (Table 4). Reported winter ice-out emission estimates (including storage flux and ice bubble survey (IBS) flux) were scarce in comparison to reported ice-free season emissions. Small Glacial Lakes and Midsize Glacial Lakes had the most reported winter ice-out emission estimates (n=20 and 31, respectively). Average winter emissions (storage flux + IBS) generally were lower than annual estimates of ice-free diffusive and ebullitive emissions (Table 5); however, statistical tests were not performed across all the classes due to low sample sizes from some of the classes. Winter ebullition estimates (i.e., direct ebullition emission to the atmosphere from seeps during the ice-cover winter season) were not included in winter emission sums because of the non-uniform spatial nature of these emission types (Sepulveda-Jauregui et al., 2015; Wik et al., 2016a) but are shown in Table 5. In the future, more estimates of winter emissions from aquatic systems are needed to more accurately estimate total annual emissions.
Table 4Characteristics of the BAWLD aquatic classes based on CH4 and environmental variables. The number of sites and contributing studies are shown for each class and flux pathway. Also shown are the mean, median, and quartiles for site-average diffusive and ebullitive CH4 flux, waterbody surface area, waterbody depth, and dissolved organic carbon concentrations (DOC). * In some cases, one study contributed flux data for multiple classes and pathway types. One ebullition outlier point (flux = 1815 mg CH4 m2 d−1) was excluded from the Midsize Glacial class as it was influenced by beaver activity (Sepulveda-Jauregui et al., 2015).
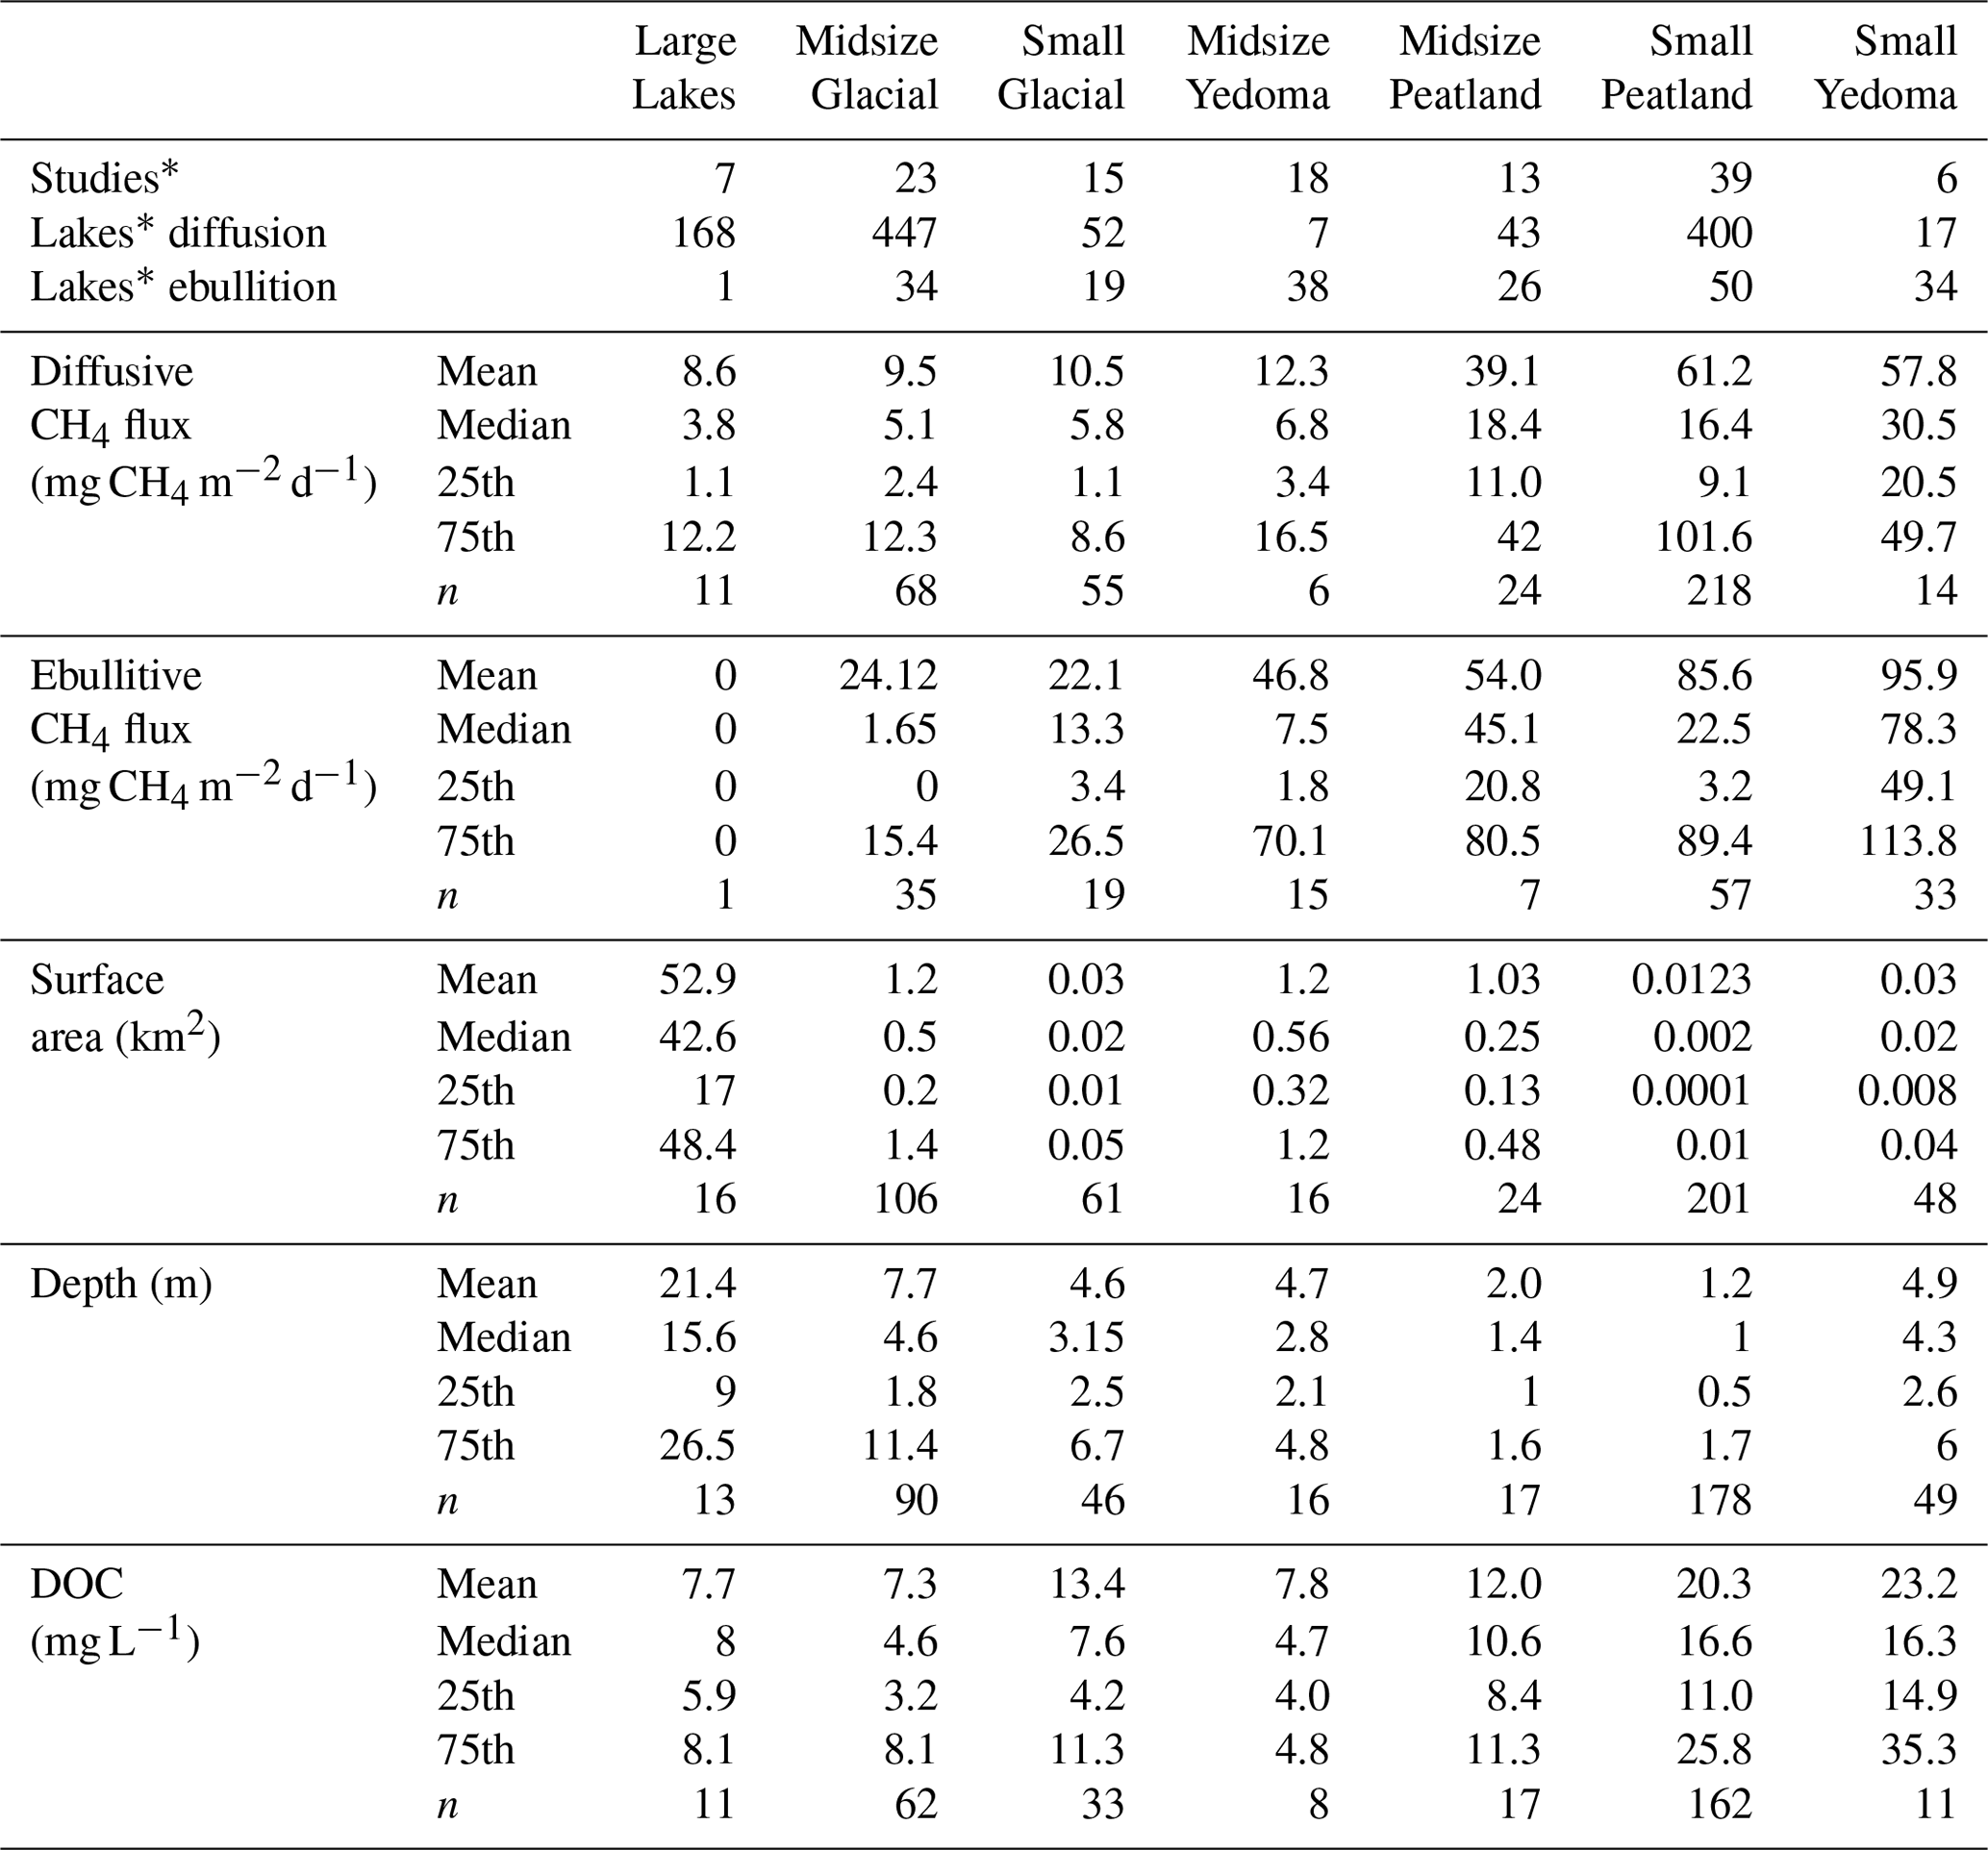
Table 5Winter fluxes, including storage, ice bubble storage (IBS), and winter ebullition for each class type. Annual estimates of ice-free diffusion and ebullition are included for comparison. * Winter ebullition from constant seeps not included in sum of winter and ice-out emissions.
3.4 Joint analysis of terrestrial and aquatic fluxes
We performed joint analysis of fluxes from both the aquatic and terrestrial datasets with regional predictor variables (Class, MAAT, MAP, Permafrost Zone, and Biome) using mixed models to assess the potential for universal drivers across all boreal–arctic ecosystems. The best model included class and MAAT (χ2=345.6, P<0.0001, R2m=0.47, df = 18: Table S4). However, class alone explained 44 % of the variation in fluxes (compared to 47 % in the best model; Table S4), suggesting that ecosystem classification based on CH4-emitting characteristics, alongside corresponding spatial extent, is one of the most important variables to consider when scaling CH4 fluxes across the boreal–arctic region.
4.1 Flux variation largely explained by land cover classes
In this review, we assessed the controls on CH4 emissions from 189 studies across terrestrial and aquatic ecosystems in the boreal–arctic region. A central component to this study was the inclusion of new land cover classes split by CH4-emitting characteristics common across terrestrial and aquatic ecosystems, respectively. Terrestrial classes were split by permafrost conditions and hydrology (and vegetation and nutrient conditions therein), whereas aquatic classes were split by size and lake genesis (i.e., type). We found that much of the observed CH4 flux variability from terrestrial and aquatic ecosystems could be explained by this land cover classification system (Fig. 9). When modelling fluxes for both aquatic and terrestrial ecosystems together with regional-level predictors (variables assigned to sites based on the gridded product including biome, permafrost zone, MAAT, and MAP), land cover class explained most of the variation (44 %), with significant but small contributions in explained variation from gridded MAAT (3 % of 47 % total variation explained; Table S2). This suggests that spatial differences in land cover classes are the most important consideration for estimating CH4 flux at this scale, with some influence of MAAT.
For terrestrial fluxes alone, land cover class as a predictor variable explained 55 % of the flux variation. Site-level predictors, including water table, temperature, and vegetation conditions, explained 54 % of the variation in the fluxes when analysed separately. The best model for terrestrial fluxes included these site-level variables and land cover class and explained 69 %–73 % of the variation (depending on additive or interactive effects; Table S2). This model likely performed better than land cover class on its own because the extra information added from the continuous soil temperature and water table variables captured the variation in these conditions within each class. While permafrost presence came out as a non-significant term in our best model (Table S2), the effects of permafrost presence and absence, including confounding temperature effects, were already intertwined into the land cover classes.
For aquatic ecosystems, the best models for diffusive and ebullitive fluxes contained different predictor variables. The best model for diffusive fluxes explained 41 % of CH4 flux variability and included an interactive effect between surface area and lake type (Peatland, Yedoma, and Glacial) and water temperature. Land cover classes (i.e., lake types split by small and midsize categorical sizes) did not come out as significant in this model because the continuous variable of surface area captures the size variation within each lake type. However, land cover class modelled on its own explained 25 % of the flux variation. The significant effect of surface area is consistent with previous global synthesis efforts that found that small waterbodies tend to have higher CH4 fluxes, likely due to the compounding effects of higher substrate availability and warmer temperatures compared to larger waterbodies (Holgerson and Raymond, 2016; DelSontro et al., 2018). Notably, previous synthesis efforts also found that waterbody depth was a significant predictor variable of diffusive fluxes (Wik et al., 2016a; Li et al., 2020). While depth did not come out as significant in our model, the effect of waterbody depth is taken into account with the lake types. For example, we found that diffusive fluxes are typically higher from Peatland Lake types compared to Glacial Lakes, which have average depths of 1.6 and 6.7 m, respectively. Waterbody depth is also an important factor contributing to waterbody temperature (i.e., warmer waters in shallower waterbodies); thus the effect of waterbody depth may also be confounded with that of the temperature variable.
The best model for ebullition contained waterbody surface area as a predictor and explained 21 % of the variation in the fluxes. Previous synthesis efforts have linked ebullition fluxes to both temperature (Aben et al., 2017) and waterbody depth (Wik et al., 2016a). There are a few potential explanations as to why we did not find similar relationships between ebullition and temperature or waterbody depth. First, Aben et al. (2017) include global data that encompass sites across broad temperature ranges from the north to the tropics. It is possible that the range of temperatures represented by our dataset is not wide enough to capture this relationship. It is also possible that the summary data collected, including average temperature and average flux over the ice-free season, are too coarse to show a relationship. It is likely that temperature and depth influence is clearer over time and space in each respective waterbody and that a higher resolution of data would show these relationships. Regarding waterbody depth, it is also possible that in the absence of detailed surveys, estimated mean and max depths may be less reliable. The effects of depth may also be confounded with surface area as the two metrics are highly correlated (Fig. S5). While this dataset represents one of the largest collections of ebullitive emissions from northern lakes so far, this emission pathway is still largely underrepresented, and waterbody depth and temperature are not always reported with the flux estimates. Furthermore, we collected information on surface water temperature for this dataset because it was the most widely available temperature metric. Sediment temperature is a better metric to collect in hand with ebullition due to production and transport directly from the sediments (Wik et al., 2013; Aben et al., 2017). Future studies should work to report sediment temperature and water column temperature alongside their flux measurements.
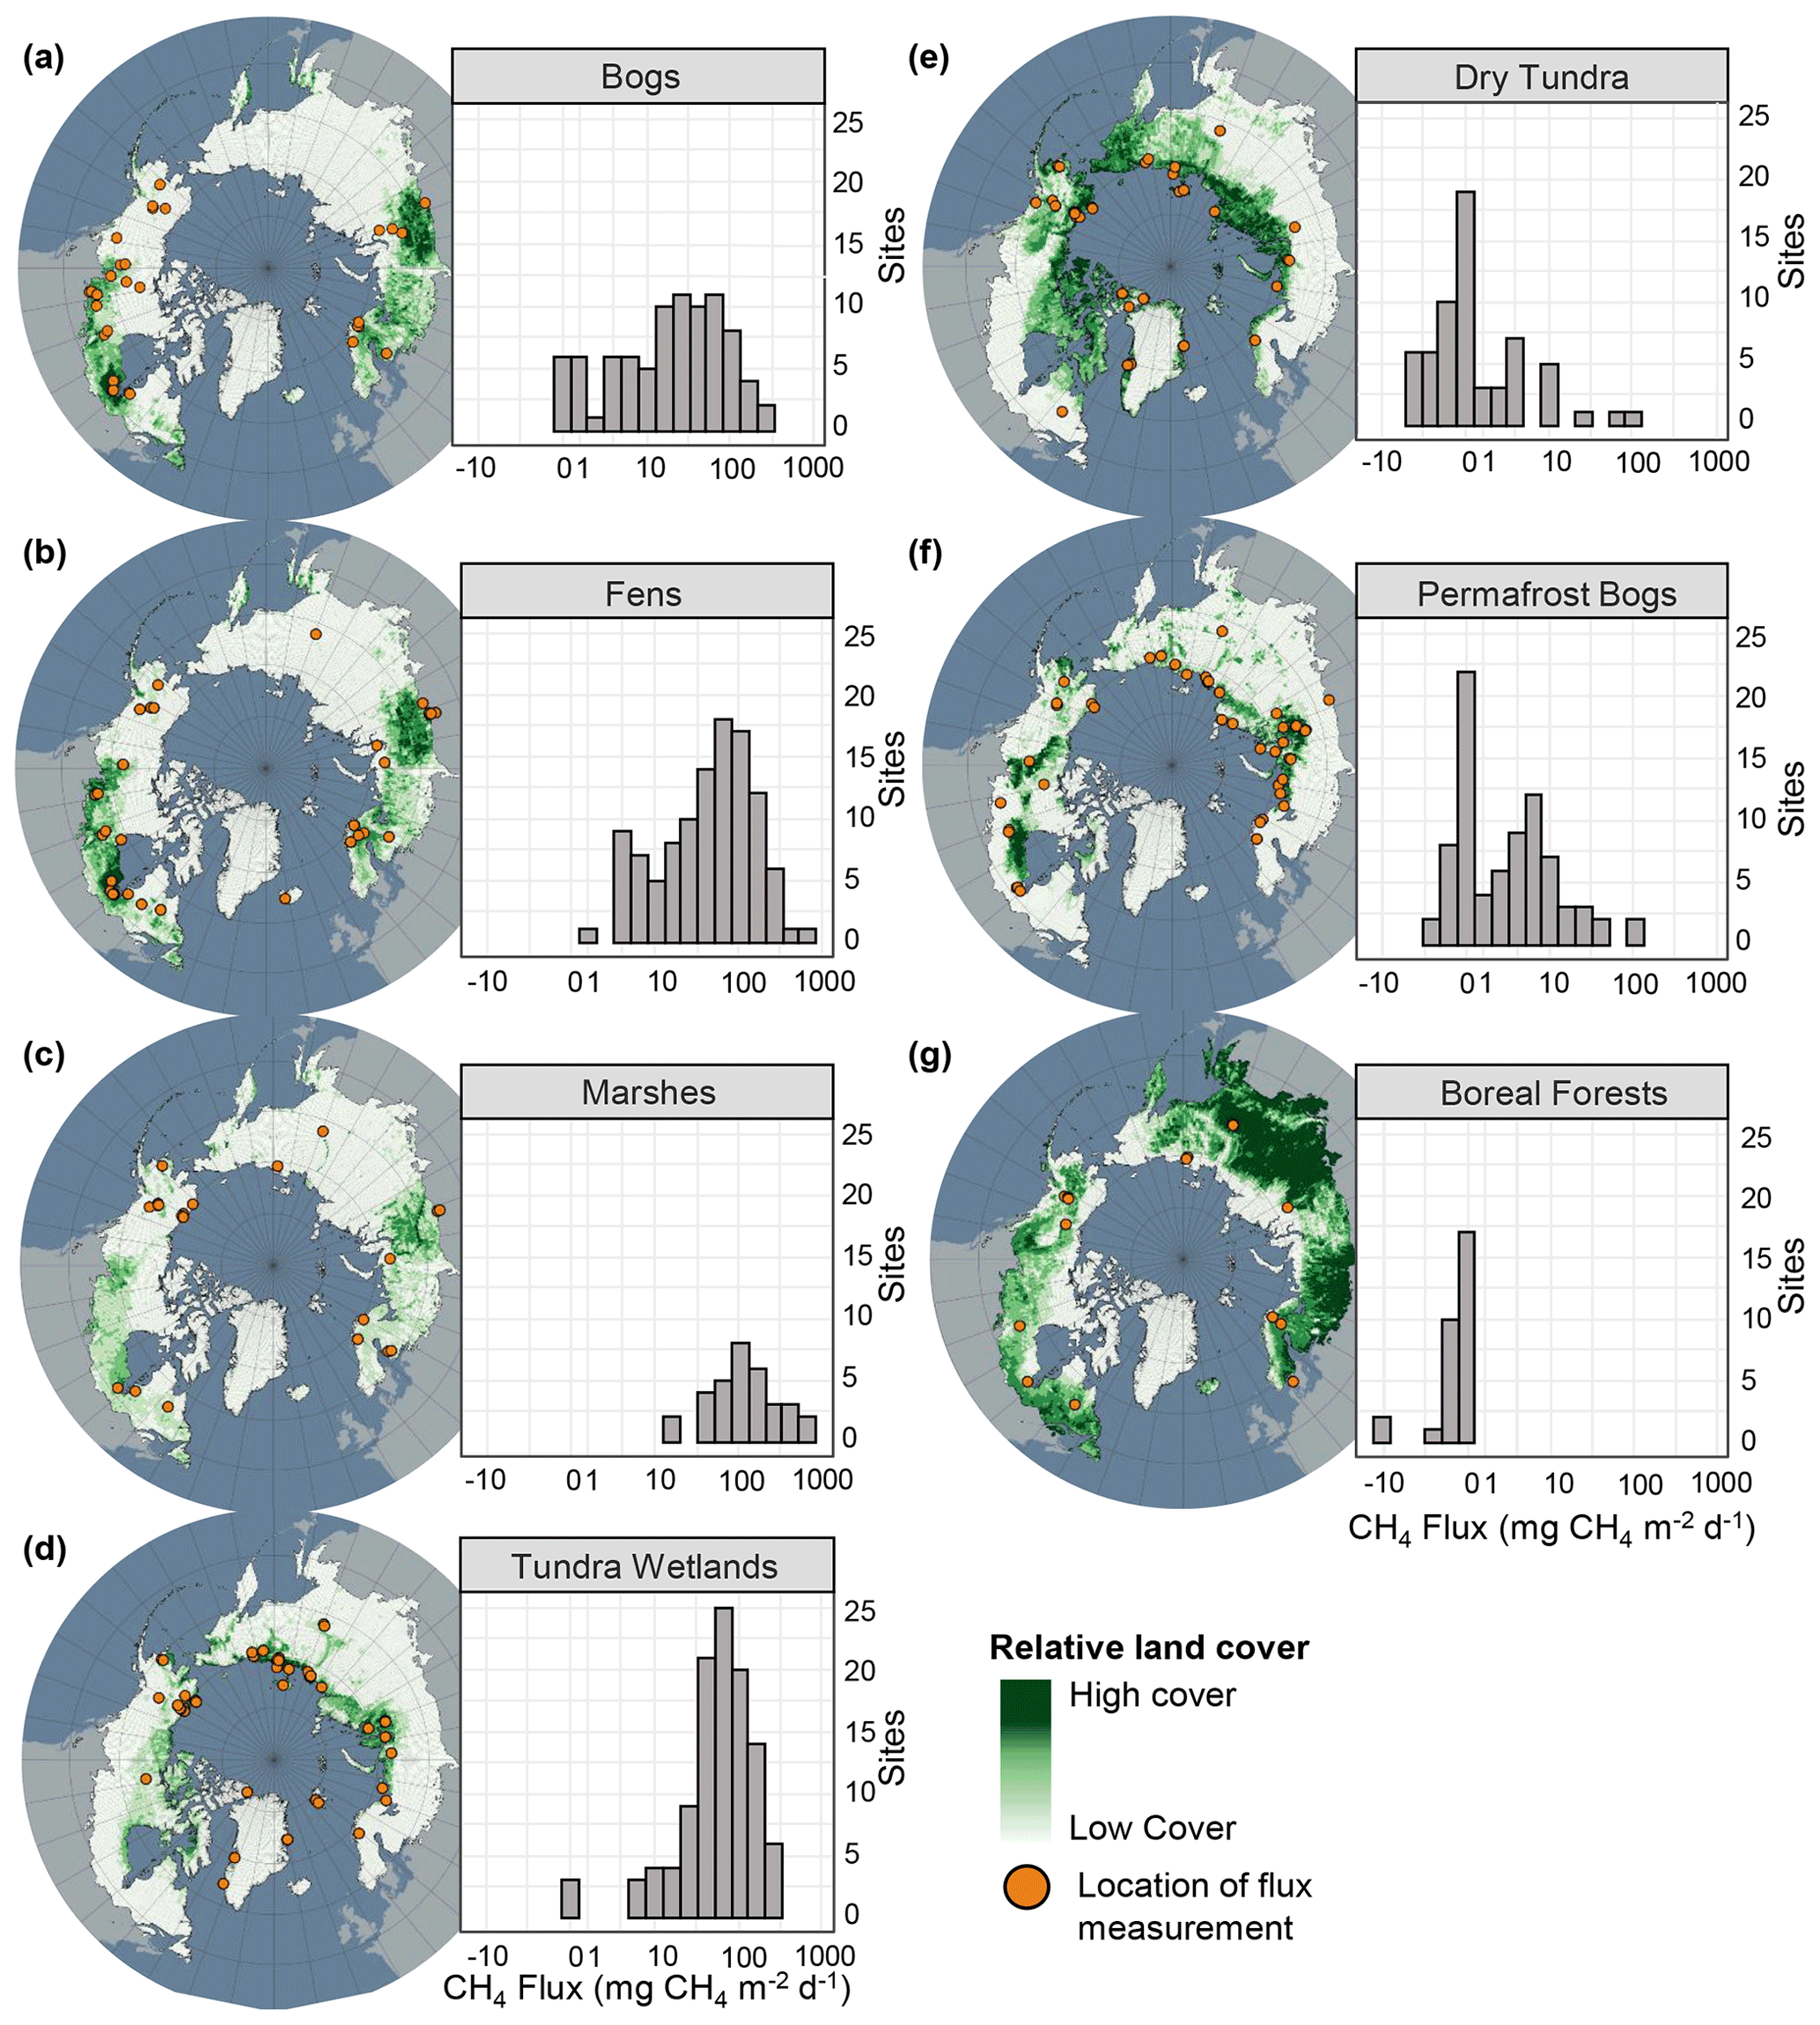
Figure 12Geographical distribution and flux frequencies and for each terrestrial class. Relative land cover for each type is represented in green on the map. Site locations are represented by orange circles. Note the log scale for CH4 flux. Land cover distributions from Olefeldt et al. (2021a, b). Histograms of non-transformed flux data can be found in Fig. S3.
4.2 Directions for future research
While our small-scale, surface CH4 flux datasets for northern ecosystems are the most extensive datasets compiled to date for the boreal–arctic region, we identified key gaps in the data and areas of improvement that future studies should focus on. While the geographical gaps represented in Fig. 1a suggest widespread geographic under-representation of terrestrial ecosystems, especially across central Russia and the Canadian territories of Nunavut and Northwest Territories, these regions are comprised primarily of Boreal Forest and Dry Tundra ecosystems, respectively (Fig. 12e, g). Study sites for many of the other land cover types, for example, Bogs and Fens, were relatively well distributed across the boreal and arctic region (Fig. 12a, b). However, to assess how well or poorly represented a land cover class is, class area and flux magnitude must also be considered (Fig. 13a). For example, Fens are a high-emitting land cover class and are spatially abundant, leading to a high total flux contribution across the study region (∼ 41 %, Fig. 13a); however, the relative number of Fen sites represented in the available literature is not proportional to the total flux contribution (∼ 26 %). This, alongside the large spread of reported flux magnitudes (Fig. 9a), suggests that future studies should focus on Fens to better constrain the flux magnitude. Conversely, Permafrost Bogs are low contributors to the total wetland flux (∼ 4 %), and sites are well represented throughout the literature (∼ 19 %), suggesting that fewer direct flux measurements are needed from these ecosystems.
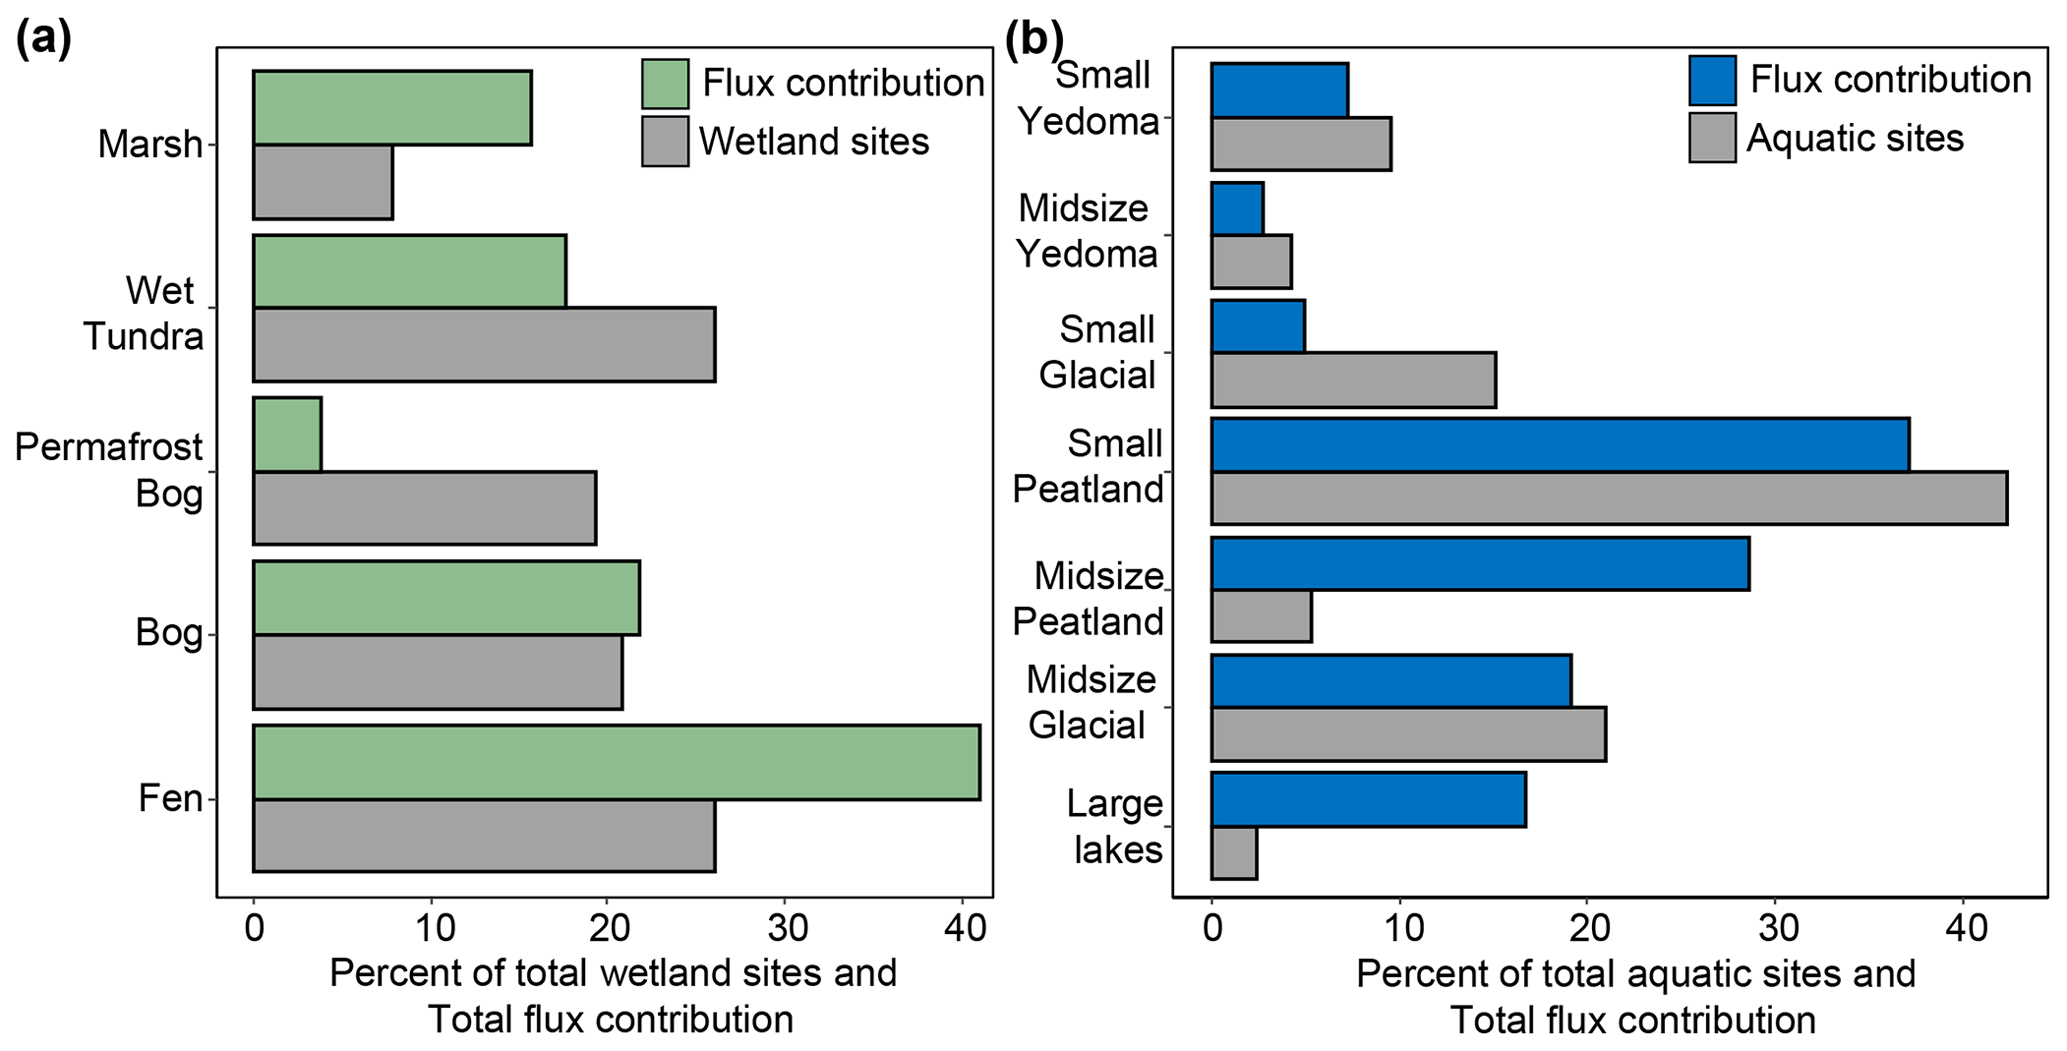
Figure 13Relative total flux contribution (mean flux ⋅ total class area) for each land cover shown with the relative contribution of flux measurements for each class. (a) Wetland classes. (b) Aquatic classes. The bars represent the percent of total flux contribution and percent of reported flux sites for each class. Aquatic flux contributions represent average ebullition + average diffusion fluxes.
For aquatic ecosystems, there are key data gaps in geography and flux pathway representation with relatively few measurements of ebullition and ice-out fluxes compared to diffusive fluxes. Geographically there are very few flux measurements from Midsize Glacial Lakes and Large Lakes in the western Canadian Shield (Fig. 14a, d), despite this region containing the most lakes per unit area throughout the north (Messager et al., 2016). Notably, Large Lakes are the least represented of all the aquatic classes (∼ 2.4 % of measurements) but could potentially contribute ∼ 17 % of the total flux, mostly from diffusive emissions. Interestingly, while Small Peatland Lakes are well represented (∼ 42 % of measurements and 37 % of potential total flux contribution), Midsize Peatland Lakes are under-represented (∼ 5 % of measurements) compared to their estimated flux contribution (∼ 28 %). Thus, Large Lakes and Midsize Peatland Lakes may be important focal points for future research; however, more empirical scaling-based uncertainty analyses should be explored.
There are fewer ebullition measurements compared to diffusive flux measurements from aquatic ecosystems (21 % and 79 % of ice-free fluxes, respectively). Average ebullitive fluxes were greater than diffusive estimates for all the land cover classes except Large Lakes (Fig. 7b) and thus represent an important component of total CH4 fluxes from these systems; however, none of the models performed in this study could explain a large amount of the variation in ebullitive fluxes. More ebullition measurements, across all the land cover classes, will help to constrain our understanding of CH4 transport mechanisms and drivers. However, it is important to note that more representative ice-free season flux estimates are needed for both ebullition and diffusion. Wik et al. (2016b) suggest that ∼ 11 diffusive day flux measurements and ∼ 39 ebullition day flux measurements are required to calculate a mean ice-free flux estimate within 20% of the true value. A total of 86 % of diffusive estimates were under the recommended 11 d mark, and 58 % of ebullition estimates were below the recommended 39 d mark (Fig. 5b, c). Jansen et al. (2020) posit that an even higher frequency of sampling is required (14–22 and 135 d for diffusion and ebullition, respectively). Further, Wik et al. (2016b) recommend that in addition to the number of sampling days, measurements should be distributed spatially across the waterbody using a depth-stratified approach including ∼ 3 and ∼ 11 locations for diffusion and ebullition, respectively. While we did not collect data on the number of sampling locations across each waterbody, it is likely that many of the average fluxes included the dataset also represent spatially undersampled measurements. Undersampling potentially reduces the accuracy of mean CH4 flux estimates, leading to the relatively poor fitness and explanatory power of the aquatic regression analysis in this study compared to the terrestrial models' performances. This is especially true for ebullitive emissions, which were poorly explained by the reported predictor variables available for this dataset. Calculation of mean ice-free fluxes from a greater number of flux measurements is an important step forward towards better constraining CH4 fluxes from aquatic ecosystems. Finally, there are very few flux estimates for lakes over the shoulder seasons and winter and ice-out compared to the ice-free season (Table 5). While shoulder season flux estimates, including autumnal turnover, were not included in this dataset, only 7 % of the lakes in this synthesis had winter and ice-out measurements collected. Winter and ice-out emissions could potentially contribute a significant portion of annual fluxes from aquatic ecosystems (Karlsson et al., 2013; Sepulveda-Jauregui et al., 2015) and therefore represent an important gap in CH4 flux data.
The BAWLD-CH4 flux dataset is available for download at the Arctic Data Center at https://doi.org/10.18739/A2DN3ZX1R (Kuhn et al., 2021). The companion land cover spatial dataset is also available at the Arctic Data Center at https://doi.org/10.18739/A2C824F9X (Olefeldt et al., 2021a).
Methane fluxes from northern ecosystems represent an important component of the global CH4 cycle (Saunois et al., 2020). BAWLD-CH4 is a comprehensive flux dataset that uniquely represents flux data from both terrestrial and aquatic ecosystems across the boreal–arctic region. BAWLD-CH4 has many potential applications including benchmarking for process-based models, use in empirical scaling models, and informing future research directions. Importantly, we show that land cover class, split CH4-emitting ecosystem characteristics, is a significant flux predictor variable across terrestrial and aquatic ecosystems, and we suggest that future studies should scale CH4 emissions based on CH4-emitting land cover characteristics. We show that while land cover class explains most of the flux variation for wetland and aquatic ecosystems when analyzed jointly, MAAT significantly explains ∼ 3 % of the variation, which has important implications for future scaling efforts. Finally, we found that a higher percentage of terrestrial CH4 fluxes could be explained by land cover class and site-level variables than for diffusive and ebullitive fluxes from aquatic ecosystems (73 % vs. 41 % and 21 %, respectively). Undersampling of aquatic ecosystems is likely responsible for the lower explained variation observed in our models compared to terrestrial ecosystems. Future studies should increase the number of sampling days for both diffusive and ebullitive fluxes from aquatic ecosystems to arrive at more representative ice-free flux estimates and total CH4 emissions from the boreal–arctic region.
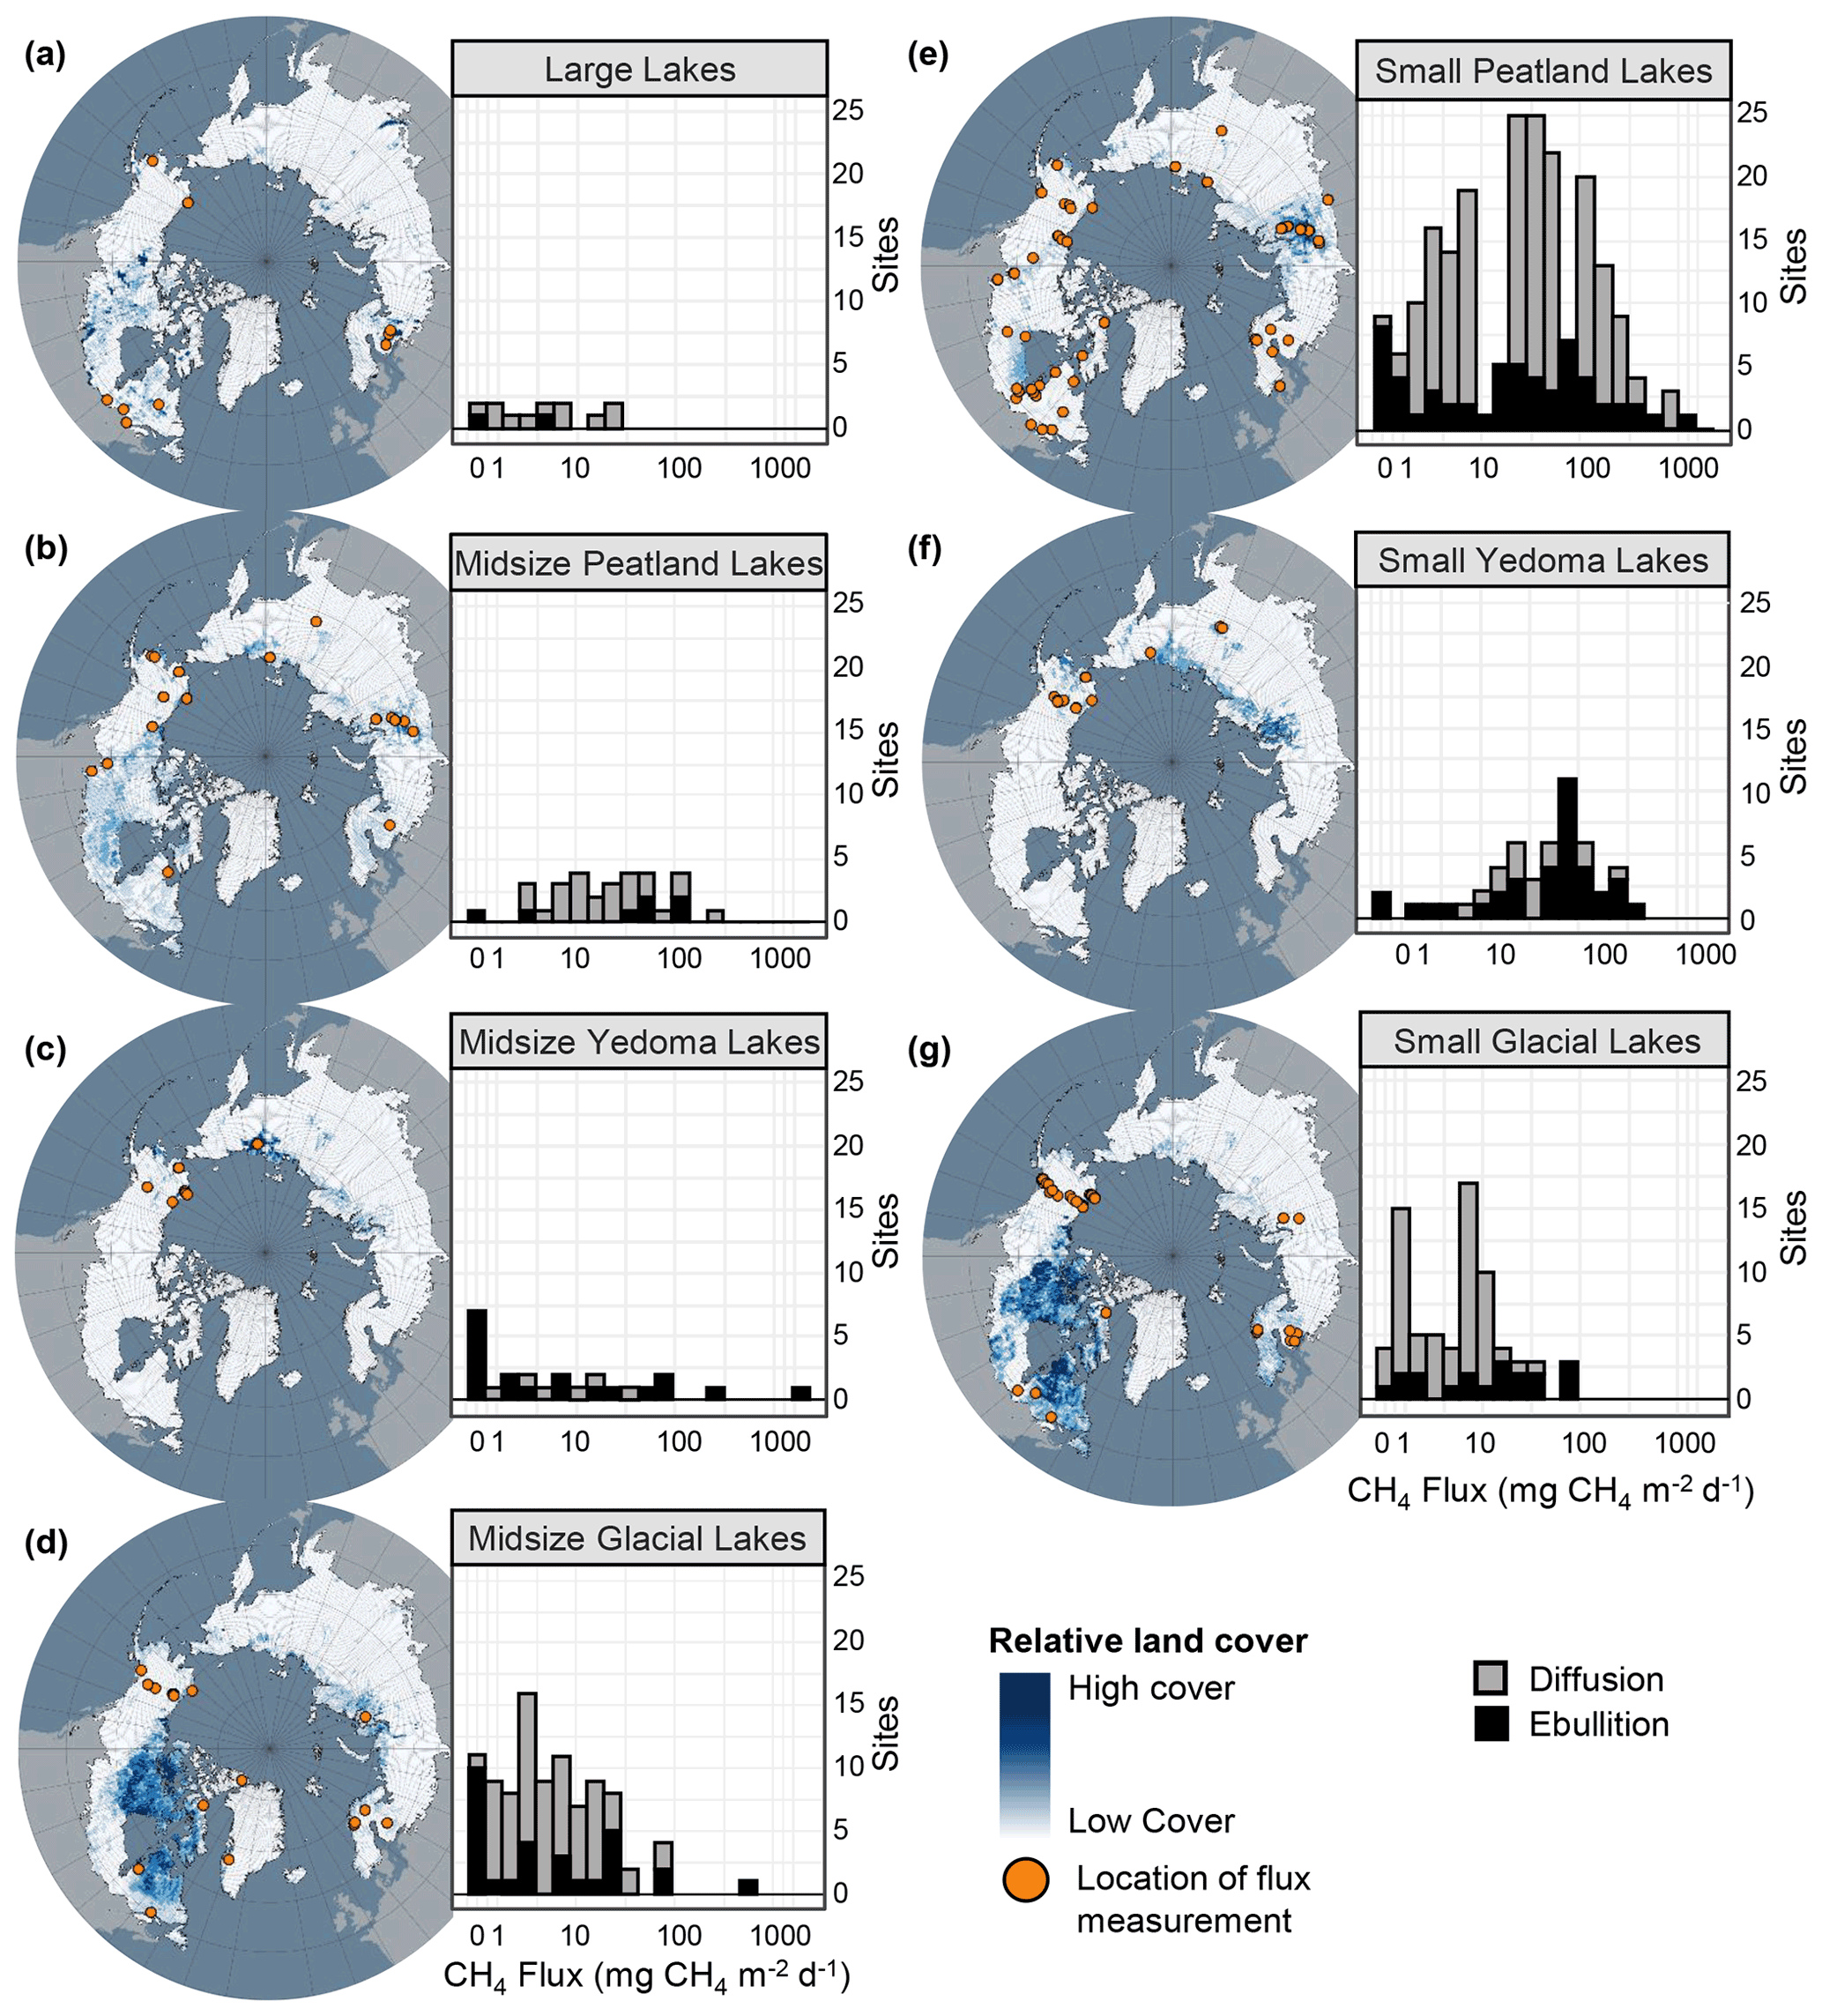
Figure 14Flux frequencies and geographical distribution for each aquatic class. Relative land cover for each class type is represented in blue on the map. Site locations are represented by orange circles. Note the log scale for CH4 flux. Land cover distributions from Olefeldt et al. (2021a, b). Histograms of non-transformed flux data are shown in Fig. S4.
The supplement related to this article is available online at: https://doi.org/10.5194/essd-13-5151-2021-supplement.
MAK and DO conceived of the land cover classifications and project idea. DO, ADM, PC, and MT contributed to the original wetland flux dataset and conceptual ideas updated in this work. RKV, DB, SM, and KWA contributed to the original lake flux dataset and ideas updated in this work. MAK compiled and updated the flux databases, analyzed the data, and created the figures. MAK wrote the manuscript. All authors contributed to data interpretation and commented on and improved the manuscript.
The contact author has declared that neither they nor their co-authors have any competing interests.
Publisher’s note: Copernicus Publications remains neutral with regard to jurisdictional claims in published maps and institutional affiliations.
The Permafrost Carbon Network provided coordination support and is funded by the NSF PLR Arctic System Science Research Networking Activities (RNA) Permafrost Carbon Network: Synthesizing Flux Observations for Benchmarking Model Projections of Permafrost Carbon Exchange (grant no. 1931333; 2019–2023). We thank Claire Treat, Tonya DelSontro, Avni Malhotra, Gustaf Hugelius, Guido Grosse, and Jennifer Watts for comments on an early draft of the figures and data analysis.
McKenzie A. Kuhn received support from the Vanier Canada Graduate Scholarship and the W. Garfield Weston Foundation. David Olefeldt received funding from the Campus Alberta Innovates Program and the National Science and Engineering Research Council of Canada (NSERC) Discovery grant (RGPIN-2016-04688). Ruth K. Varner was supported by the US National Aeronautics and Space Administration (NNX17AK10G) and US Department of Energy (DE-SC0016440). David Bastviken was funded by H2020 ERC (grant 725546, METLAKE), the Swedish Research Council VR (grant 2016-04829), and FORMAS (grant 2018-01794).
This paper was edited by David Carlson and reviewed by two anonymous referees.
Aben, R. C., Barros, N., Van Donk, E., Frenken, T., Hilt, S., Kazanjian, G., Lamers, L. P., Peeters, E. T., Roelofs, J. G., de Senerpont Domis, L. N., and Stephan, S.: Cross continental increase in methane ebullition under climate change, Nat. Commun., 8, 1682, https://doi.org/10.1038/s41467-017-01535-y, 2017.
Andersen, R., Poulin, M., Borcard, D., Laiho, R., Laine, J., Vasander, H., and Tuittila, E. T.: Environmental control and spatial structures in peatland vegetation, J. Veg. Sci., 22, 878–890, 2011.
Bäckstrand, K., Crill, P. M., Mastepanov, M., Christensen, T. R., and Bastviken, D.: Total hydrocarbon flux dynamics at a subarctic mire in northern Sweden, J. Geophys. Res.-Biogeo., 113, G03026, https://doi.org/10.1029/2008JG000703, 2008.
Bartlett, K. B., Crill, P. M., Sass, R. L., Harriss, R. C., and Dise, N. B.: Methane emissions from tundra environments in the Yukon-Kuskokwim Delta, Alaska, J. Geophys. Res.-Atmos., 97, 16645–16660, https://doi.org/10.1029/91JD00610, 1992.
Bastviken, D., Ejlertsson, J., and Tranvik, L.: Measurement of methane oxidation in lakes: a comparison of methods, Environ. Sci. Technol., 36, 3354–3361, https://doi.org/10.1021/es010311p, 2002.
Bastviken, D., Tranvik, L. J., Downing, J. A., Crill, P. M., and Enrich-Prast, A.: Freshwater methane fluxes offset the continental carbon sink, Science, 331, 50–50, https://doi.org/10.1126/science.1196808, 2011.
Bates, D., Mächler, M., Bolker, B., and Walker, S.: Fitting linear mixed-effects models using lme4, arXiv [preprint], arXiv:1406.5823, 23 June 2014.
Beaulne, J., Garneau, M., Magnan, G., and Boucher, É.: Peat deposits store more carbon than trees in forested peatlands of the boreal biome, Sci. Rep.-UK, 11, 2657, https://doi.org/10.1038/s41598-021-82004-x, 2021.
Belyea, L. R. and Baird, A. J.: Beyond “the limits to peat bog growth”: Cross‐scale feedback in peatland development, Ecol. Monogr., 76, 299–322, https://doi.org/10.1890/0012-9615(2006)076[0299:BTLTPB]2.0.CO;2, 2006.
Bridgham, S. D., Cadillo-Quiroz, H., Keller, J. K., and Zhuang, Q.: Methane fluxes from wetlands: biogeochemical, microbial, and modeling perspectives from local to global scales, Glob. Change Biol., 19, 1325–1346, https://doi.org/10.1111/gcb.12131, 2013.
Brown, J., Ferrians, O., Heginbottom, J. A., and Melnikov, E.: Circum-Arctic Map of Permafrost and Ground-Ice Conditions, Version 2. Boulder, Colorado USA, NSIDC: National Snow and Ice Data Center [data set], https://doi.org/10.7265/skbg-kf16, 2002.
Bruhwiler, L., Dlugokencky, E., Masarie, K., Ishizawa, M., Andrews, A., Miller, J., Sweeney, C., Tans, P., and Worthy, D.: CarbonTracker-CH4: an assimilation system for estimating emissions of atmospheric methane, Atmos. Chem. Phys., 14, 8269–8293, https://doi.org/10.5194/acp-14-8269-2014, 2014.
Bubier, J. L., Moore, T. R., Bellisario, L., Comer, N. T., and Crill, P. M.: Ecological controls on methane fluxes from a northern peatland complex in the zone of discontinuous permafrost, Manitoba, Canada, Global Biogeochem. Cy., 9, 455–470, https://doi.org/10.1029/95GB02379, 1995.
Burke, S. A., Wik, M., Lang, A., Contosta, A. R., Palace, M., Crill, P. M., and Varner, R. K.: Long‐term measurements of methane ebullition from thaw ponds, J. Geophys. Res.-Biogeo., 124, 2208–2221, 2019.
Burns, R., Wynn, P.M., Barker, P., McNamara, N., Oakley, S., Ostle, N., Stott, A. W., Tuffen, H., Zhou, Z., Tweed, F. S., and Chesler, A.: Direct isotopic evidence of biogenic methane production and efflux from beneath a temperate glacier, Sci. Rep.-UK, 8, 17118, https://doi.org/10.1038/s41598-018-35253-2, 2018.
Canada Committee on Ecological (Biophysical) Land Classification, National Wetlands Working Group, Warner, B. G., and Rubec, C. D. A.: The Canadian wetland classification system, Wetlands Research Branch, University of Waterloo, Waterloo, Ont., 1997.
Chanton, J. P., Whiting, G. J., Happell, J. D., and Gerard, G.: Contrasting rates and diurnal patterns of methane emission from emergent aquatic macrophytes, Aquat. Bot., 46, 111–128, https://doi.org/10.1016/0304-3770(93)90040-4, 1993.
Christensen, T. R., Ekberg, A., Ström, L., Mastepanov, M., Panikov, N., Öquist, M., Svensson, B. H., Nykänen, H., Martikainen, P. J., and Oskarsson, H.: Factors controlling large scale variations in methane emissions from wetlands, Geophys. Res. Lett., 30, https://doi.org/10.1029/2002GL016848, 2003.
Christiansen, J. R. and Jørgensen, C. J.: First observation of direct methane emission to the atmosphere from the subglacial domain of the Greenland Ice Sheet, Sci. Rep.-UK, 8, 16623, https://doi.org/10.1038/s41598-018-35054-7, 2018.
Cole, J. J. and Caraco, N. F.: Atmospheric exchange of carbon dioxide in a low-wind oligotrophic lake measured by the addition of SF6, Limnol. Oceanogr., 43, 647–656, https://doi.org/10.4319/lo.1998.43.4.0647, 1998.
DelSontro, T., Boutet, L., St-Pierre, A., del Giorgio, P. A., and Prairie, Y. T.: Methane ebullition and diffusion from northern ponds and lakes regulated by the interaction between temperature and system productivity, Limnol. Oceanogr., 61, S62–S77, https://doi.org/10.1002/lno.10335, 2016.
DelSontro, T., Beaulieu, J. J., and Downing, J. A.: Greenhouse gas emissions from lakes and impoundments: Upscaling in the face of global change, Limnol. Oceanogr., 3, 64–75, https://doi.org/10.1002/lol2.10073, 2018.
Delwiche, K. B., Knox, S. H., Malhotra, A., Fluet-Chouinard, E., McNicol, G., Feron, S., Ouyang, Z., Papale, D., Trotta, C., Canfora, E., Cheah, Y.-W., Christianson, D., Alberto, Ma. C. R., Alekseychik, P., Aurela, M., Baldocchi, D., Bansal, S., Billesbach, D. P., Bohrer, G., Bracho, R., Buchmann, N., Campbell, D. I., Celis, G., Chen, J., Chen, W., Chu, H., Dalmagro, H. J., Dengel, S., Desai, A. R., Detto, M., Dolman, H., Eichelmann, E., Euskirchen, E., Famulari, D., Fuchs, K., Goeckede, M., Gogo, S., Gondwe, M. J., Goodrich, J. P., Gottschalk, P., Graham, S. L., Heimann, M., Helbig, M., Helfter, C., Hemes, K. S., Hirano, T., Hollinger, D., Hörtnagl, L., Iwata, H., Jacotot, A., Jurasinski, G., Kang, M., Kasak, K., King, J., Klatt, J., Koebsch, F., Krauss, K. W., Lai, D. Y. F., Lohila, A., Mammarella, I., Belelli Marchesini, L., Manca, G., Matthes, J. H., Maximov, T., Merbold, L., Mitra, B., Morin, T. H., Nemitz, E., Nilsson, M. B., Niu, S., Oechel, W. C., Oikawa, P. Y., Ono, K., Peichl, M., Peltola, O., Reba, M. L., Richardson, A. D., Riley, W., Runkle, B. R. K., Ryu, Y., Sachs, T., Sakabe, A., Sanchez, C. R., Schuur, E. A., Schäfer, K. V. R., Sonnentag, O., Sparks, J. P., Stuart-Haëntjens, E., Sturtevant, C., Sullivan, R. C., Szutu, D. J., Thom, J. E., Torn, M. S., Tuittila, E.-S., Turner, J., Ueyama, M., Valach, A. C., Vargas, R., Varlagin, A., Vazquez-Lule, A., Verfaillie, J. G., Vesala, T., Vourlitis, G. L., Ward, E. J., Wille, C., Wohlfahrt, G., Wong, G. X., Zhang, Z., Zona, D., Windham-Myers, L., Poulter, B., and Jackson, R. B.: FLUXNET-CH4: a global, multi-ecosystem dataset and analysis of methane seasonality from freshwater wetlands , Earth Syst. Sci. Data, 13, 3607–3689, https://doi.org/10.5194/essd-13-3607-2021, 2021.
Dieleman, C. M., Rogers, B. M., Potter, S., Veraverbeke, S., Johnstone, J. F., Laflamme, J., Solvik, K., Walker, X. J., Mack, M. C., and Turetsky, M. R.: Wildfire combustion and carbon stocks in the southern Canadian boreal forest: Implications for a warming world, Glob. Change Biol., 26, 6062–6079, https://doi.org/10.1111/gcb.15158, 2020.
Downing, J. A., Cole, J. J., Duarte, C. M., Middelburg, J. J., Melack, J. M., Prairie, Y. T., Kortelainen, P., Striegl, R. G., McDowell, W. H., and Tranvik, L. J.: Global abundance and size distribution of streams and rivers, Inland Waters, 2, 229–236, https://doi.org/10.5268/IW-2.4.502, 2012.
Emmerton, C. A., St. Louis, V. L., Lehnherr, I., Humphreys, E. R., Rydz, E., and Kosolofski, H. R.: The net exchange of methane with high Arctic landscapes during the summer growing season, Biogeosciences, 11, 3095–3106, https://doi.org/10.5194/bg-11-3095-2014, 2014.
Fernández, E. J., Peeters, F., and Hofmann, H.: Importance of the autumn overturn and anoxic conditions in the hypolimnion for the annual methane emissions from a temperate lake, Environ. Sci. Technol., 48, 7297–7304, https://doi.org/10.1021/es4056164, 2014.
Garneau, M., Tremblay, L., and Magnan, G.: Holocene pool formation in oligotrophic fens from boreal Québec in northeastern Canada, Holocene, 28, 396–407, https://doi.org/10.1177/0959683617729439, 2018.
Glaser, P. H., Siegel, D. I., Reeve, A. S., Janssens, J. A., and Janecky, D. R.: Tectonic drivers for vegetation patterning and landscape evolution in the Albany River region of the Hudson Bay Lowlands, J. Ecol., 92, 1054–1070, https://doi.org/10.1111/j.0022-0477.2004.00930.x, 2004.
Gorham, E.: Northern peatlands: role in the carbon cycle and probable responses to climatic warming, Ecol. Appl., 1, 182–195, https://doi.org/10.2307/1941811, 1991.
Grosse, G., Jones, B., and Arp, C.: 8.21 Thermokarst Lakes, Drainage, and Drained Basins, in: Treatise on Geomorphology, edited by: Shroder, J. F., Academic Press, San Diego, 325–353, https://doi.org/10.1016/B978-0-12-374739-6.00216-5, 2013.
Gunnarsson, U. and Löfroth, M.: The Swedish wetland survey: compiled excerpts from the national final report, Swedish Environmental Protection Agency, Stockholm, 2014.
Harris, L. I., Roulet, N. T., and Moore, T. R.: Mechanisms for the Development of Microform Patterns in Peatlands of the Hudson Bay Lowland, Ecosystems, 23, 741–767, https://doi.org/10.1007/s10021-019-00436-z, 2020.
Heikkinen, J. E., Virtanen, T., Huttunen, J. T., Elsakov, V., and Martikainen, P. J.: Carbon balance in East European tundra, Global Biogeochem. Cy., 18, GB1023, https://doi.org/10.1029/2003GB002054, 2004.
Heiskanen, J. J., Mammarella, I., Haapanala, S., Pumpanen, J., Vesala, T., MacIntyre, S., and Ojala, A.: Effects of cooling and internal wave motions on gas transfer coefficients in a boreal lake, Tellus B, 66, 22827, https://doi.org/10.3402/tellusb.v66.22827, 2014.
Heiskanen, L., Tuovinen, J.-P., Räsänen, A., Virtanen, T., Juutinen, S., Lohila, A., Penttilä, T., Linkosalmi, M., Mikola, J., Laurila, T., and Aurela, M.: Carbon dioxide and methane exchange of a patterned subarctic fen during two contrasting growing seasons, Biogeosciences, 18, 873–896, https://doi.org/10.5194/bg-18-873-2021, 2021.
Holgerson, M. and Raymond, P.: Large contribution to inland water CO2 and CH4 fluxes from very small ponds, Nat. Geosci., 9, 222–226, https://doi.org/10.1038/ngeo2654, 2016.
Hugelius, G., Strauss, J., Zubrzycki, S., Harden, J. W., Schuur, E. A. G., Ping, C.-L., Schirrmeister, L., Grosse, G., Michaelson, G. J., Koven, C. D., O'Donnell, J. A., Elberling, B., Mishra, U., Camill, P., Yu, Z., Palmtag, J., and Kuhry, P.: Estimated stocks of circumpolar permafrost carbon with quantified uncertainty ranges and identified data gaps, Biogeosciences, 11, 6573–6593, https://doi.org/10.5194/bg-11-6573-2014, 2014.
Hugelius, G., Loisel, J., Chadburn, S., Jackson, R. B., Jones, M., MacDonald, G., Marushchak, M., Olefeldt, D., Packalen, M., Siewert, M. B., and Treat, C.: Large stocks of peatland carbon and nitrogen are vulnerable to permafrost thaw, P. Natl. Acad. Sci. USA, 117, 20438–20446, https://doi.org/10.1073/pnas.1916387117, 2020.
Jansen, J., Thornton, B. F., Wik, M., MacIntyre, S., and Crill, P. M.: Temperature proxies as a solution to biased sampling of lake methane fluxes, Geophys. Res. Lett., 47, e2020GL088647, https://doi.org/10.1029/2020GL088647, 2020.
Jorgenson, M. T., Racine, C. H., Walters, J. C., and Osterkamp, T. E.: Permafrost Degradation and Ecological Changes Associated with a Warming Climate in Central Alaska, Climatic Change, 48, 551–579, https://doi.org/10.1023/A:1005667424292, 2001.
Juutinen, S., Alm, J., Larmola, T., Huttunen, J. T., Morero, M., Martikainen, P. J., and Silvola, J.: Major implication of the littoral zone for methane release from boreal lakes, Global Biogeochem. Cy., 17, 1117, https://doi.org/10.1029/2003GB002105, 2003.
Karlsson, J., Giesler, R., Persson, J., and Lundin, E.: High emission of carbon dioxide and methane during ice thaw in high latitude lakes, Geophys. Res. Lett., 40, 1123–1127, https://doi.org/10.1002/grl.50152, 2013.
Klaus, M., Bergström, A. K., Jonsson, A., Deininger, A., Geibrink, E., and Karlsson, J.: Weak response of greenhouse gas emissions to whole lake N enrichment, Limnol. Oceanogr., 63, S340–S353, https://doi.org/10.1002/lno.10743, 2018.
Knox, S. H., Jackson, R. B., Poulter, B., McNicol, G., Fluet-Chouinard, E., Zhang, Z., Hugelius, G., Bousquet, P., Canadell, J. G., Saunois, M., and Papale, D.: FLUXNET-CH4 synthesis activity: Objectives, observations, and future directions, B. Am. Meteorol. Soc., 100, 2607–2632, https://doi.org/10.1175/BAMS-D-18-0268.1, 2019.
Kuhn, M., Lundin, E. J., Giesler, R., Johansson, M., and Karlsson, J.: Emissions from thaw ponds largely offset the carbon sink of northern permafrost wetlands, Sci. Rep.-UK, 8, 1–7, https://doi.org/10.1038/s41598-018-27770-x, 2018.
Kuhn, M., Varner, R. K., Bastviken, D., Crill, P., MacIntyre, S., Turetsky, M., Walter Anthony, K., McGuire, D., and Olefeldt, D.: BAWLD-CH4: Methane Fluxes from Boreal and Arctic Ecosystems, Arctic Data Center [data set], https://doi.org/10.18739/A2DN3ZX1R, 2021.
Lamarche-Gagnon, G., Wadham, J. L., Lollar, B. S., Arndt, S., Fietzek, P., Beaton, A. D., Tedstone, A. J., Telling, J., Bagshaw, E. A., Hawkings, J. R., and Kohler, T. J.: Greenland melt drives continuous export of methane from the ice-sheet bed, Nature, 565, 73–77, https://doi.org/10.1038/s41586-018-0800-0, 2019.
Lehner, B. and Döll, P.: Development and validation of a global database of lakes, reservoirs and wetlands, J. Hydrol., 296, 1–22, https://doi.org/10.1016/j.jhydrol.2004.03.028, 2004.
Li, M., Peng, C., Zhu, Q., Zhou, X., Yang, G., Song, X., and Zhang, K.: The significant contribution of lake depth in regulating global lake diffusive methane emissions, Water Res., 172, 115465, https://doi.org/10.1016/j.watres.2020.115465, 2020.
Liljedahl, A. K., Boike, J., Daanen, R. P., Fedorov, A. N., Frost, G. V., Grosse, G., Hinzman, L. D., Iijma, Y., Jorgenson, J. C., Matveyeva, N., Necsoiu, M., Raynolds, M. K., Romanovsky, V. E., Schulla, J., Tape, K. D., Walker, D. A., Wilson, C. J., Yabuki, H., and Zona, D.: Pan-Arctic ice-wedge degradation in warming permafrost and its influence on tundra hydrology, Nat. Geosci., 9, 312–318, https://doi.org/10.1038/ngeo2674, 2016.
Machacova, K., Bäck, J., Vanhatalo, A., Halmeenmäki, E., Kolari, P., Mammarella, I., Pumpanen, J., Acosta, M., Urban, O., and Pihlatie, M.: Pinus sylvestris as a missing source of nitrous oxide and methane in boreal forest, Sci. Rep.-UK, 6, 23410, https://doi.org/10.1038/srep23410, 2016.
MacIntyre, S., Crowe, A. T., Cortés, A., and Arneborg, L.: Turbulence in a small arctic pond, Limnol. Oceanogr., 63, 2337–2358, https://doi.org/10.1002/lno.10941, 2018.
MacIntyre, S., Bastviken, D., Arneborg, L., Crow, A. T., Karlsson, J., Andersson, A., Galfalk, M., Rutgersson, A., Podgrajsek, E., and Melack, J. M.: Turbulence in a small boreal lake: Consequences for air-water gas exchange, Limnol. Oceanogr., 9999, 1–28, https://doi.org/10.1002/lno.11645, 2020.
Malhotra, A. and Roulet, N. T.: Environmental correlates of peatland carbon fluxes in a thawing landscape: do transitional thaw stages matter?, Biogeosciences, 12, 3119–3130, https://doi.org/10.5194/bg-12-3119-2015, 2015.
Mammarella, I., Nordbo, A., Rannik, Ü., Haapanala, S., Levula, J., Laakso, H., Ojala, A., Peltola, O., Heiskanen, J., Pumpanen, J., and Vesala, T.: Carbon dioxide and energy fluxes over a small boreal lake in Southern Finland, J. Geophys. Res.-Biogeo., 120, 1296–1314, https://doi.org/10.1002/2014JG002873, 2015.
Marinho, C. C., Palma-Silva, C., Albertoni, E. F., Giacomini, I. B., Barros, M. P. F., Furlanetto, L. M., and de Assis Esteves, F.: Emergent macrophytes alter the sediment composition in a small, shallow subtropical lake: Implications for methane flux, Am. J. Plant Sci., 6, 315, https://doi.org/10.4236/ajps.2015.62036, 2015.
Markfort, C. D., Perez, A. L. S., Thill, J. W., Jaster, D. A., Porte-Agel, F., and Stefan, H. G.: Wind sheltering of a lake by a tree canopy or bluff topography, Water Resour. Res., 46, W03530, https:/doi.org/10.1029/2009WR007759, 2010.
Masing, V., Botch, M., and Läänelaid, A.: Mires of the former Soviet Union, Wetlands Ecol. Manage., 18, 397–433, https://doi.org/10.1007/s11273-008-9130-6, 2010.
Matson, A., Pennock, D., and Bedard-Haughn, A.: Methane and nitrous oxide emissions from mature forest stands in the boreal forest, Saskatchewan, Canada, Forest Ecol. Manage., 258, 1073–1083, https://doi.org/10.1016/j.foreco.2009.05.034, 2009.
Matthews, E. and Fung, I.: Methane flux from natural wetlands: Global distribution, area, and environmental characteristics of sources, Global Biogeochem. Cy., 1, 61–86, https://doi.org/10.1029/GB001i001p00061, 1987.
Matthews, E., Johnson, M. S., Genovese, V., Du, J., and Bastviken, D.: Methane flux from high latitude lakes: methane-centric lake classification and satellite-driven annual cycle of fluxes, Sci. Rep.-UK, 10, 1–9, https://doi.org/10.1038/s41598-020-68246-1, 2020.
Matveev, A., Laurion, I., Deshpande, B. N., Bhiry, N., and Vincent, W. F.: High methane fluxes from thermokarst lakes in subarctic peatlands, Limnol. Oceanogr., 61, S150–S164, https://doi.org/10.1002/lno.10311, 2016.
Mazerolle, M. J. and Mazerolle, M. M. J.: Package “AICcmodavg” AICcmodavg; model selection and multimodel inference based on(Q) AIC©, CRAN R Project, 2015.
McCalley, C. K., Woodcroft, B. J., Hodgkins, S. B., Wehr, R. A., Kim, E. H., Mondav, R., Crill, P. M., Chanton, J. P., Rich, V. I., Tyson, G. W., and Saleska, S. R.: Methane dynamics regulated by microbial community response to permafrost thaw, Nature, 514, 478–481, https://doi.org/10.1038/nature13798, 2014.
McGuire, A. D., Christensen, T. R., Hayes, D., Heroult, A., Euskirchen, E., Kimball, J. S., Koven, C., Lafleur, P., Miller, P. A., Oechel, W., Peylin, P., Williams, M., and Yi, Y.: An assessment of the carbon balance of Arctic tundra: comparisons among observations, process models, and atmospheric inversions, Biogeosciences, 9, 3185–3204, https://doi.org/10.5194/bg-9-3185-2012, 2012.
Messager, M. L., Lehner, B., Grill, G., Nedeva, I., and Schmitt, O.: Estimating the volume and age of water stored in global lakes using a geo-statistical approach, Nat. Commun., 7, 13603, https://doi.org/10.1038/ncomms13603, 2016.
Moore, T. R., Heyes, A., and Roulet, N. T.: Methane fluxes from wetlands, southern Hudson Bay lowland, J. Geophys. Res.-Atmos., 99, 1455–1467, https://doi.org/10.1029/93JD02457, 1994.
Moosavi, S. C. and Crill, P. M.: Controls on CH4 and CO2 emissions along two moisture gradients in the Canadian boreal zone, J. Geophys. Res.-Atmos., 102, 29261–29277, https://doi.org/10.1029/96JD03873, 1997.
Muster, S., Riley, W. J., Roth, K., Langer, M., Cresto Aleina, F., Koven, C. D., Lange, S., Bartsch, A., Grosse, G., Wilson, C. J., Jones, B. M., and Boike, J.: Size Distributions of Arctic Waterbodies Reveal Consistent Relations in Their Statistical Moments in Space and Time, Front. Earth Sci., 7, 5, https://doi.org/10.3389/feart.2019.00005, 2019.
Oh, Y., Zhuang, Q., Liu, L., Welp, L. R., Lau, M. C., Onstott, T. C., Medvigy, D., Bruhwiler, L., Dlugokencky, E. J., Hugelius, G., and D'Imperio, L.: Reduced net methane emissions due to microbial methane oxidation in a warmer Arctic, Nat. Clim. Change, 10, 317–321, https://doi.org/10.1038/s41558-020-0734-z, 2020.
Olefeldt, D., Turetsky, M. R., Crill, P. M., and McGuire, A. D.: Environmental and physical controls on northern terrestrial methane fluxes across permafrost zones, Glob. Change Biol., 19, 589–603, https://doi.org/10.1111/gcb.12071, 2013.
Olefeldt, D., Euskirchen, E. S., Harden, J., Kane, E., McGuire, A. D., Waldrop, M. P., and Turetsky, M. R.: A decade of boreal rich fen greenhouse gas fluxes in response to natural and experimental water table variability, Glob. Change Biol., 23, 2428–2440, https://doi.org/10.1111/gcb.13612, 2017.
Olefeldt, D., Hovemyr, M., Kuhn, M. A., Bastviken, D., Bohn, T., Connolly, J., Crill, P., Euskirchen, E., Finklestein, S., Genet, H., Grosse, G., Harris, L., Heffernan, L., Helbig, M., Hugelius, G., Hutchins, R., Juutinen, S., Lara, M., Malhotra, A., Manies, K., McGuire, A. D., Natali, S., O'Donnell, S., Parmentier, F. J., Räsänen, A., Schaedel, C., Sonnentag, O., Strack, M., Tank, S., Treat, C., Varner, R. K, Virtanen, T., Warren, R., and Watts, J. D.: The fractional land cover estimates from the Boreal-Arctic Wetland and Lake Dataset (BAWLD), Arctic Data Center [data set], https://doi.org/10.18739/A2C824F9X, 2021a.
Olefeldt, D., Hovemyr, M., Kuhn, M. A., Bastviken, D., Bohn, T. J., Connolly, J., Crill, P., Euskirchen, E. S., Finkelstein, S. A., Genet, H., Grosse, G., Harris, L. I., Heffernan, L., Helbig, M., Hugelius, G., Hutchins, R., Juutinen, S., Lara, M. J., Malhotra, A., Manies, K., McGuire, A. D., Natali, S. M., O'Donnell, J. A., Parmentier, F.-J. W., Räsänen, A., Schädel, C., Sonnentag, O., Strack, M., Tank, S. E., Treat, C., Varner, R. K., Virtanen, T., Warren, R. K., and Watts, J. D.: The Boreal–Arctic Wetland and Lake Dataset (BAWLD), Earth Syst. Sci. Data, 13, 5127–5149, https://doi.org/10.5194/essd-13-5127-2021, 2021b.
Olson, D. M., Dinerstein, E., Wikramanayake, E. D., Burgess, N. D., Powell, G. V., Underwood, E. C., D'amico, J. A., Itoua, I., Strand, H. E., Morrison, J. C., and Loucks, C. J.: Terrestrial Ecoregions of the World: A New Map of Life on Earth: A new global map of terrestrial ecoregions provides an innovative tool for conserving biodiversity, BioScience, 51, 933–938, https://doi.org/10.1641/0006-3568(2001)051[0933:TEOTWA]2.0.CO;2, 2001.
Peltola, O., Vesala, T., Gao, Y., Räty, O., Alekseychik, P., Aurela, M., Chojnicki, B., Desai, A. R., Dolman, A. J., Euskirchen, E. S., Friborg, T., Göckede, M., Helbig, M., Humphreys, E., Jackson, R. B., Jocher, G., Joos, F., Klatt, J., Knox, S. H., Kowalska, N., Kutzbach, L., Lienert, S., Lohila, A., Mammarella, I., Nadeau, D. F., Nilsson, M. B., Oechel, W. C., Peichl, M., Pypker, T., Quinton, W., Rinne, J., Sachs, T., Samson, M., Schmid, H. P., Sonnentag, O., Wille, C., Zona, D., and Aalto, T.: Monthly gridded data product of northern wetland methane emissions based on upscaling eddy covariance observations, Earth Syst. Sci. Data, 11, 1263–1289, https://doi.org/10.5194/essd-11-1263-2019, 2019.
Pinheiro, J., Bates, D., DebRoy, S., Sarkar, D., Heisterkamp, S., Van., Willigen, B., and Maintainer, R: Package “nlme”. Linear and Nonlinear Mixed Effects Models, version 3-1, CRAN R Project, 2017.
Rasilo, T., Prairie, Y. T., and del Giorgio, P. A.: Large-scale patterns in summer diffusive CH4 fluxes across boreal lakes, and contribution to diffusive C fluxes, Glob. Change Biol., 21, 1124–1139, https://doi.org/10.1111/gcb.12741, 2015.
Sannel, A. B. K. and Kuhry, P.: Warming-induced destabilization of peat plateau/thermokarst lake complexes, J. Geophys. Res.-Biogeo., 116, G03035, https://doi.org/10.1029/2010JG001635, 2011.
Saunois, M., Stavert, A. R., Poulter, B., Bousquet, P., Canadell, J. G., Jackson, R. B., Raymond, P. A., Dlugokencky, E. J., Houweling, S., Patra, P. K., Ciais, P., Arora, V. K., Bastviken, D., Bergamaschi, P., Blake, D. R., Brailsford, G., Bruhwiler, L., Carlson, K. M., Carrol, M., Castaldi, S., Chandra, N., Crevoisier, C., Crill, P. M., Covey, K., Curry, C. L., Etiope, G., Frankenberg, C., Gedney, N., Hegglin, M. I., Höglund-Isaksson, L., Hugelius, G., Ishizawa, M., Ito, A., Janssens-Maenhout, G., Jensen, K. M., Joos, F., Kleinen, T., Krummel, P. B., Langenfelds, R. L., Laruelle, G. G., Liu, L., Machida, T., Maksyutov, S., McDonald, K. C., McNorton, J., Miller, P. A., Melton, J. R., Morino, I., Müller, J., Murguia-Flores, F., Naik, V., Niwa, Y., Noce, S., O'Doherty, S., Parker, R. J., Peng, C., Peng, S., Peters, G. P., Prigent, C., Prinn, R., Ramonet, M., Regnier, P., Riley, W. J., Rosentreter, J. A., Segers, A., Simpson, I. J., Shi, H., Smith, S. J., Steele, L. P., Thornton, B. F., Tian, H., Tohjima, Y., Tubiello, F. N., Tsuruta, A., Viovy, N., Voulgarakis, A., Weber, T. S., van Weele, M., van der Werf, G. R., Weiss, R. F., Worthy, D., Wunch, D., Yin, Y., Yoshida, Y., Zhang, W., Zhang, Z., Zhao, Y., Zheng, B., Zhu, Q., Zhu, Q., and Zhuang, Q.: The Global Methane Budget 2000–2017, Earth Syst. Sci. Data, 12, 1561–1623, https://doi.org/10.5194/essd-12-1561-2020, 2020.
Schirrmeister, L., Froese, D., Tumskoy, V., Grosse, G., and Wetterich, S.: Yedoma: Late Pleistocene ice-rich syngenetic permafrost of Beringia, Encyclopedia of Quaternary Science, 2nd Edn., 542–552, https://doi.org/10.1016/B978-0-444-53643-3.00106-0, 2013.
Schnurrenberger, D., Russell, J., and Kelts, K.: Classification of lacustrine sediments based on sedimentary components, J. Paleolimnol., 29, 141–154, https://doi.org/10.1023/A:1023270324800, 2003.
Sepulveda-Jauregui, A., Walter Anthony, K. M., Martinez-Cruz, K., Greene, S., and Thalasso, F.: Methane and carbon dioxide emissions from 40 lakes along a north–south latitudinal transect in Alaska, Biogeosciences, 12, 3197–3223, https://doi.org/10.5194/bg-12-3197-2015, 2015.
Spahni, R., Wania, R., Neef, L., van Weele, M., Pison, I., Bousquet, P., Frankenberg, C., Foster, P. N., Joos, F., Prentice, I. C., and van Velthoven, P.: Constraining global methane emissions and uptake by ecosystems, Biogeosciences, 8, 1643–1665, https://doi.org/10.5194/bg-8-1643-2011, 2011.
Stanley, E. H., Casson, N. J., Christel, S. T., Crawford, J. T., Loken, L. C., and Oliver, S. K.: The ecology of methane in streams and rivers: patterns, controls, and global significance, Ecol. Monogr., 86, 146–171, https://doi.org/10.1890/15-1027, 2016.
Strauss, J., Schirrmeister, L., Grosse, G., Fortier, D., Hugelius, G., Knoblauch, C., Romanovsky, V., Schädel, C., von Deimling, T. S., Schuur, E. A., and Shmelev, D.: Deep Yedoma permafrost: A synthesis of depositional characteristics and carbon vulnerability, Earth-Sci. Rev., 172, 75–86, https://doi.org/10.1016/j.earscirev.2017.07.007, 2017.
Ström, L. and Christensen, T. R.: Below ground carbon turnover and greenhouse gas exchanges in a sub-arctic wetland, Soil Biol. Biochem., 39, 1689–1698, https://doi.org/10.1016/j.soilbio.2007.01.019, 2007.
Ström, L., Tagesson, T., Mastepanov, M., and Christensen, T. R.: Presence of Eriophorum scheuchzeri enhances substrate availability and methane flux in an Arctic wetland, Soil Biol. Biochem., 45, 61–70, https://doi.org/10.1016/j.soilbio.2011.09.005, 2012.
Tan, Z., Zhuang, Q., Henze, D. K., Frankenberg, C., Dlugokencky, E., Sweeney, C., Turner, A. J., Sasakawa, M., and Machida, T.: Inverse modeling of pan-Arctic methane emissions at high spatial resolution: what can we learn from assimilating satellite retrievals and using different process-based wetland and lake biogeochemical models?, Atmos. Chem. Phys., 16, 12649–12666, https://doi.org/10.5194/acp-16-12649-2016, 2016.
Thompson, R. L., Nisbet, E. G., Pisso, I., Stohl, A., Blake, D., Dlugokencky, E. J., Helmig, D., and White, J. W. C.: Variability in atmospheric methane from fossil fuel and microbial sources over the last three decades, Geophys. Res. Lett., 45, 11499–11508, https://doi.org/10.1029/2018GL078127, 2018.
Terentieva, I. E., Glagolev, M. V., Lapshina, E. D., Sabrekov, A. F., and Maksyutov, S.: Mapping of West Siberian taiga wetland complexes using Landsat imagery: implications for methane emissions, Biogeosciences, 13, 4615–4626, https://doi.org/10.5194/bg-13-4615-2016, 2016.
Treat, C. C., Bloom, A. A., and Marushchak, M. E.: Nongrowing season methane fluxes – a significant component of annual fluxes across northern ecosystems, Glob. Change Biol., 24, 3331–3343, https://doi.org/10.1111/gcb.14137, 2018.
Turetsky, M. R., Wieder, R. K., and Vitt, D. H.: Boreal peatland C fluxes under varying permafrost regimes, Soil Biol. Biochem., 34, 907–912, https://doi.org/10.1016/S0038-0717(02)00022-6, 2002.
Turetsky, M. R., Kotowska, A., Bubier, J., Dise, N. B., Crill, P., Hornibrook, E. R., Minkkinen, K., Moore, T. R., Myers-Smith, I. H., Nykänen, H., and Olefeldt, D.: A synthesis of methane fluxes from 71 northern, temperate, and subtropical wetlands, Glob. Change Biol., 20, 2183–2197, https://doi.org/10.1111/gcb.12580, 2014.
van der Molen, M. K., van Huissteden, J., Parmentier, F. J. W., Petrescu, A. M. R., Dolman, A. J., Maximov, T. C., Kononov, A. V., Karsanaev, S. V., and Suzdalov, D. A.: The growing season greenhouse gas balance of a continental tundra site in the Indigirka lowlands, NE Siberia, Biogeosciences, 4, 985–1003, https://doi.org/10.5194/bg-4-985-2007, 2007.
Virtanen, R., Oksanen, L., Oksanen, T., Cohen, J., Forbes, B. C., Johansen, B., Käyhkö, J., Olofsson, J., Pulliainen, J., and Tømmervik, H.: Where do the treeless tundra areas of northern highlands fit in the global biome system: toward an ecologically natural subdivision of the tundra biome, Ecol. Evol., 6, 143–158, https://doi.org/10.1002/ece3.1837, 2016.
von Fischer, J. C., Rhew, R. C., Ames, G. M., Fosdick, B. K., and von Fischer, P. E.: Vegetation height and other controls of spatial variability in methane fluxes from the Arctic coastal tundra at Barrow, Alaska, J. Geophys. Res.-Biogeo., 115, G00I03, https://doi.org/10.1029/2009JG001283, 2010.
Wagner, D., Kobabe, S., Pfeiffer, E. M., and Hubberten, H. W.: Microbial controls on methane fluxes from a polygonal tundra of the Lena Delta, Siberia, Permafrost. Periglac., 14, 173–185, https://doi.org/10.1002/ppp.443, 2003.
Walter, K. M., Zimov, S. A., Chanton, J. P., Verbyla, D., and Chapin, F. S.: Methane bubbling from Siberian thaw lakes as a positive feedback to climate warming, Nature, 443, 71–75, https://doi.org/10.1038/nature05040, 2006.
Walter Anthony, K. M., Vas, D. A., Brosius, L., Chapin III, F. S., Zimov, S. A., and Zhuang, Q.: Estimating methane emissions from northern lakes using ice-bubble surveys, Limnol. Oceanogr.: Methods, 8, 592–609, https://doi.org/10.4319/lom.2010.8.0592, 2010.
Walter Anthony, K., Daanen, R., Anthony, P., von Deimling, T. S., Ping, C. L., Chanton, J. P., and Grosse, G.: Methane fluxes proportional to permafrost carbon thawed in Arctic lakes since the 1950s, Nat. Geosci., 9, 679–682, https://doi.org/10.1038/ngeo2795, 2016.
Watts, J. D., Kimball, J. S., Bartsch, A., and McDonald, K. C.: Surface water inundation in the boreal-Arctic: potential impacts on regional methane fluxes, Environ. Res. Lett., 9, 075001, https://doi.org/10.1088/1748-9326/9/7/075001, 2014.
Wessel, P. and Smith, W. H. F.: A global, self-consistent, hierarchical, high-resolution shoreline database, J. Geophys. Res., 101, 8741–8743, https://doi.org/10.1029/96JB00104, 1996.
Whalen, S. C.: Biogeochemistry of methane exchange between natural wetlands and the atmosphere, Environ. Eng. Sci., 22, 73–94, https://doi.org/10.1089/ees.2005.22.73, 2005.
Wik, M., Crill, P. M., Varner, R. K., and Bastviken, D.: Multiyear measurements of ebullitive methane flux from three subarctic lakes, J. Geophys. Res.-Biogeosci., 118, 1307–1321, https://doi.org/10.1002/jgrg.20103, 2013.
Wik, M., Thornton, B. F., Bastviken, D., Uhlbäck, J., and Crill, P. M.: Biased sampling of methane release from northern lakes: A problem for extrapolation, Geophys. Res. Lett., 43, 1256–1262, https://doi.org/10.1002/2015GL066501, 2016a.
Wik, M., Varner, R. K., Anthony, K. W., MacIntyre, S., and Bastviken, D.: Climate-sensitive northern lakes and ponds are critical components of methane release, Nat. Geosci., 9, 99–105, https://doi.org/10.1038/ngeo2578, 2016b.
Wik, M., Johnson, J. E., Crill, P. M., DeStasio, J. P., Erickson, L., Halloran, M. J., Fahnestock, M. F., Crawford, M. K., Phillips, S. C., and Varner, R. K.: Sediment characteristics and methane ebullition in three subarctic lakes, J. Geophys. Res.-Biogeo., 123, 2399–2411, https://doi.org/10.1029/2017JG004298, 2018.
Woodcroft, B. J., Singleton, C. M., Boyd, J. A., Evans, P. N., Emerson, J. B., Zayed, A. A., Hoelzle, R. D., Lamberton, T. O., McCalley, C. K., Hodgkins, S. B., and Wilson, R. M.: Genome-centric view of carbon processing in thawing permafrost, Nature, 560, 49–54, https://doi.org/10.1038/s41586-018-0338-1, 2018.
Zhu, X., Zhuang, Q., Qin, Z., Glagolev, M., and Song, L.: Estimating wetland methane fluxes from the northern high latitudes from 1990 to 2009 using artificial neural networks, Global Biogeochem. Cy., 27, 592–604, https://doi.org/10.1002/gbc.20052, 2013.
Zona, D., Gioli, B., Commane, R., Lindaas, J., Wofsy, S. C., Miller, C. E., Dinardo, S. J., Dengel, S., Sweeney, C., Karion, A., and Chang, R. Y. W.: Cold season fluxes dominate the Arctic tundra methane budget, P. Natl. Acad. Sci. USA, 113, 40–45, https://doi.org/10.1073/pnas.1516017113, 2016.
- Article
(12607 KB) - Full-text XML