the Creative Commons Attribution 4.0 License.
the Creative Commons Attribution 4.0 License.
 | 05 Nov 2021
The Boreal–Arctic Wetland and Lake Dataset (BAWLD)
Mikael Hovemyr
McKenzie A. Kuhn
David Bastviken
Theodore J. Bohn
John Connolly
Patrick Crill
Eugénie S. Euskirchen
Sarah A. Finkelstein
Hélène Genet
Guido Grosse
Lorna I. Harris
Liam Heffernan
Manuel Helbig
Gustaf Hugelius
Ryan Hutchins
Sari Juutinen
Mark J. Lara
Avni Malhotra
Kristen Manies
A. David McGuire
Susan M. Natali
Jonathan A. O'Donnell
Frans-Jan W. Parmentier
Aleksi Räsänen
Christina Schädel
Oliver Sonnentag
Maria Strack
Suzanne E. Tank
Claire Treat
Ruth K. Varner
Tarmo Virtanen
Rebecca K. Warren
Jennifer D. Watts
Methane emissions from boreal and arctic wetlands, lakes, and rivers are expected to increase in response to warming and associated permafrost thaw. However, the lack of appropriate land cover datasets for scaling field-measured methane emissions to circumpolar scales has contributed to a large uncertainty for our understanding of present-day and future methane emissions. Here we present the Boreal–Arctic Wetland and Lake Dataset (BAWLD), a land cover dataset based on an expert assessment, extrapolated using random forest modelling from available spatial datasets of climate, topography, soils, permafrost conditions, vegetation, wetlands, and surface water extents and dynamics. In BAWLD, we estimate the fractional coverage of five wetland, seven lake, and three river classes within 0.5 × 0.5∘ grid cells that cover the northern boreal and tundra biomes (17 % of the global land surface). Land cover classes were defined using criteria that ensured distinct methane emissions among classes, as indicated by a co-developed comprehensive dataset of methane flux observations. In BAWLD, wetlands occupied 3.2 × 10⁶ km2 (14 % of domain) with a 95 % confidence interval between 2.8 and 3.8 × 10⁶ km2. Bog, fen, and permafrost bog were the most abundant wetland classes, covering ∼ 28 % each of the total wetland area, while the highest-methane-emitting marsh and tundra wetland classes occupied 5 % and 12 %, respectively. Lakes, defined to include all lentic open-water ecosystems regardless of size, covered 1.4 × 10⁶ km2 (6 % of domain). Low-methane-emitting large lakes (>10 km2) and glacial lakes jointly represented 78 % of the total lake area, while high-emitting peatland and yedoma lakes covered 18 % and 4 %, respectively. Small (<0.1 km2) glacial, peatland, and yedoma lakes combined covered 17 % of the total lake area but contributed disproportionally to the overall spatial uncertainty in lake area with a 95 % confidence interval between 0.15 and 0.38 × 10⁶ km2. Rivers and streams were estimated to cover 0.12 × 10⁶ km2 (0.5 % of domain), of which 8 % was associated with high-methane-emitting headwaters that drain organic-rich landscapes. Distinct combinations of spatially co-occurring wetland and lake classes were identified across the BAWLD domain, allowing for the mapping of “wetscapes” that have characteristic methane emission magnitudes and sensitivities to climate change at regional scales. With BAWLD, we provide a dataset which avoids double-accounting of wetland, lake, and river extents and which includes confidence intervals for each land cover class. As such, BAWLD will be suitable for many hydrological and biogeochemical modelling and upscaling efforts for the northern boreal and arctic region, in particular those aimed at improving assessments of current and future methane emissions. Data are freely available at https://doi.org/10.18739/A2C824F9X (Olefeldt et al., 2021).
- Article
(5125 KB) - Full-text XML
- Companion paper
-
Supplement
(11241 KB) - BibTeX
- EndNote


Emissions of methane (CH4) from abundant wetlands, lakes, and rivers located in boreal and arctic regions are expected to substantially increase this century due to rapid climate warming and associated permafrost thaw (Walter Anthony et al., 2018; Ito, 2019; Hugelius et al., 2020; Schneider von Deimling et al., 2015; Zhang et al., 2017). However, predicting future CH4 emissions is highly uncertain as estimates of present-day CH4 emissions from boreal and arctic regions are poorly constrained, ranging between 21 and 77 Tg CH4 yr−1 (Saunois et al., 2020; Peltola et al., 2019; Wik et al., 2016; Treat et al., 2018; McGuire et al., 2012; Watts et al., 2014; Thompson et al., 2018; Zhu et al., 2015; Tan et al., 2016; Walter Anthony et al., 2016). Estimates of high-latitude CH4 emissions vary between approaches, with generally lower estimates from atmospheric inversions (top-down estimates) than from field-measured CH4 emissions data paired with land cover data (bottom-up estimates) (Saunois et al., 2020; McGuire et al., 2012). Low accuracy of high-latitude land cover datasets for wetland and lake distributions and their classification represents a key source of uncertainty for estimates of high-latitude CH4 emissions and may contribute to the discrepancies between bottom-up and top-down estimates. A limitation of many currently available land cover datasets is an insufficient differentiation between wetland, lake, and river classes that are known to have distinct CH4 emissions (Bruhwiler et al., 2021; Bohn et al., 2015; Marushchak et al., 2016; Melton et al., 2013).
There are several challenges when using remote sensing approaches to map distinct wetland, lake, and river classes at the circumpolar scale. Many small or narrow wetland ecosystems with high methane CH4 emissions are located along lake shorelines, along stream networks, or in polygonal tundra terrain and are thus difficult to map as image resolution can be inadequate (Wickland et al., 2020; Cooley et al., 2017; Virtanen and Ek, 2014; Liljedahl et al., 2016). Wetland detection can further be complicated by the presence of tree species in wetlands, e.g., Scots pine (Pinus sylvestris), black spruce (Picea mariana), and tamarack (Larix laricina), that are also found in non-wetland boreal forests, making differentiation of treed wetlands from non-wetland forests difficult. Using spectral signatures to differentiate and map distinct wetland classes can further be difficult due to seasonal variation in inundation or phenology, poor differentiation between ecosystems (e.g., similarities between different peatland classes), or high spectral diversity within classes due to shifts in vegetation along subtle environmental gradients (Räsänen and Virtanen, 2019; Vitt and Chee, 1990; Chasmer et al., 2020). Vegetation composition and spectral signatures of wetland classes can also vary between different high-latitude regions, e.g., with shifts in dominant tree and shrub species between North America and Eurasia (Raynolds et al., 2019), and be influenced for decades by wildfires (Chen et al., 2021; Helbig et al., 2016). Active microwave remote sensing can help detect inundated wetlands and saturated soils but has limitations due to its computational requirements, coarse resolution, and issues with detecting rarely inundated peatlands (Beck et al., 2021; Duncan et al., 2020). Accurate mapping of wetlands that includes differentiation among distinct wetland classes requires substantial ground truthing, something which has only been done consistently at local and regional scales (Terentieva et al., 2016; Chasmer et al., 2020; Bryn et al., 2018; Lara et al., 2018; Canadian Wetland Inventory Technical Committee, 2016). Similar issues arise for lakes, rivers, and streams. While larger lakes and rivers have been mapped with high precision (Messager et al., 2016; Linke et al., 2019), the highest CH4 emissions are generally from ponds, pools, and low-order streams that are too small to be accurately detected by anything other than very high-resolution imagery (Muster et al., 2017). Statistical approaches are often used to model the distribution and abundance of small open-water ecosystems, yielding large uncertainties (Holgerson and Raymond, 2016; Cael and Seekell, 2016; Muster et al., 2019). Remote sensing approaches are also inadequate in assessing other key variables known to influence lake CH4 emissions, including lake genesis, depth, and sediment characteristics (Messager et al., 2016; Brosius et al., 2021; Smith et al., 2007; Lara and Chipman, 2021). Another key issue is that wetlands and lakes often are mapped separately, allowing for potential double-counting of ecosystems in both wetland and lake inventories (Thornton et al., 2016; Saunois et al., 2020).
Emissions of CH4 from boreal and arctic ecosystems range from uptake to some of the highest emissions observed globally (Turetsky et al., 2014; Knox et al., 2019; Glagolev et al., 2011; St Pierre et al., 2019). Net ecosystem CH4 emissions are a balance between microbial CH4 production (methanogenesis) and oxidation (methanotrophy), a balance further influenced by the dominant transport pathway: diffusion, ebullition, and plant-mediated transport (Bridgham et al., 2013; Bastviken et al., 2004). For wetlands, defined as ecosystems with temporally or permanently saturated soils and biota adapted to anoxic conditions, CH4 emissions in boreal and arctic regions are primarily influenced by water table position, soil temperatures, and vegetation composition and productivity (Olefeldt et al., 2013; Treat et al., 2018). Marshes and tundra wetlands are characterized by frequent or permanent inundation and dominant graminoid vegetation that enhance methanogenesis and facilitate plant-mediated transport and thus generally have high CH4 emissions (Knoblauch et al., 2015; Juutinen et al., 2003). Conversely, peat-forming bogs and fens generally have a water table at or below the soil surface, and their vegetation is more dominated by mosses, lichens, and shrubs, resulting in typically low to moderate CH4 emissions (Bubier et al., 1995; Pelletier et al., 2007). Permafrost conditions in peatlands can cause the surface to be elevated and dry, with cold soil conditions where methanogenesis is inhibited, leading to low CH4 emissions or even uptake (Bäckstrand et al., 2008; Glagolev et al., 2011). Non-wetland boreal forests and tundra ecosystems generally have net CH4 uptake as methanotrophy outweighs any methanogenesis (Lau et al., 2015; Juncher Jørgensen et al., 2015; Whalen et al., 1992). The transition from terrestrial to aquatic ecosystems is not always well defined, and several wetland classification systems consider shallow, open-water ecosystems as a distinct wetland class (Rubec, 2018). The transition from vegetated to open-water ecosystems is however associated with shifts in apparent primary controls of CH4 emissions, including a shift towards increased importance of ebullition (Bastviken et al., 2004). For lakes, when defined to include all lentic open-water ecosystems regardless of size (e.g., including peatland ponds), spatial variability in CH4 emissions is primarily linked to water depth and the quantity and origin of the organic matter of the sediment (Heslop et al., 2020; Li et al., 2020). As such, lake CH4 emissions are generally higher for smaller lakes and for lakes with organic-rich sediments (Wik et al., 2016; Holgerson and Raymond, 2016), which are extremely abundant in many high-latitude regions (Muster et al., 2017). The CH4 emitted from streams and rivers is largely derived from the soils that are drained, and as such emissions generally are higher in smaller streams draining wetland-rich watersheds (Wallin et al., 2018; Stanley et al., 2016). It is overall likely that studies of CH4 emissions from boreal and arctic ecosystems have focused disproportionally on sites with higher CH4 emissions (Olefeldt et al., 2013). A focus on high-emitting sites is warranted for understanding site-level controls on CH4 emissions but may potentially cause bias of bottom-up CH4 scaling approaches if they lack appropriate differentiation between various wetland and lake classes in land cover datasets.
There is currently no spatial dataset available that has information on the distribution and abundance of wetland, lake, and river classes defined specifically for the purpose of estimating boreal and arctic CH4 emissions. However, a large number of spatial datasets have partial, but relevant, information. This includes circumpolar spatial data of soil types (Hugelius et al., 2013; Strauss et al., 2017), vegetation (Olson et al., 2001; Walker et al., 2005), surface water extent and dynamics (Pekel et al., 2016), lake sizes and numbers (Messager et al., 2016), topography (Gruber, 2012), climate (Fick and Hijmans, 2017), permafrost conditions (Gruber, 2012; Brown et al., 2002), river networks (Linke et al., 2019), and previous estimates of total wetland cover (Matthews and Fung, 1987; Bartholomé and Belward, 2005). By integrating quantitative spatial data with expert knowledge it is possible to model new spatial data for specific purposes (Olefeldt et al., 2016). Researchers with interests in the boreal and arctic have considerable knowledge of the presence and relative abundance of typical wetland and lake classes in various high-latitude regions, along with the ability to interpret satellite imagery and the judgement to define parsimonious land cover classes suitable for CH4 scaling.
Here we present the Boreal–Arctic Wetland and Lake Dataset (BAWLD), an expert-knowledge-based land cover dataset. A companion dataset with chamber and small-scale observations of CH4 emissions (BAWLD-CH4) is presented in Kuhn et al. (2021), and it uses the same land cover classes as BAWLD. The land cover classes were developed to distinguish between classes with distinct CH4 emissions and include five wetland, seven lake, and three river classes. In BAWLD, coverage of each wetland, lake, and river class within 0.5∘ grid cells was modelled through random forest regressions based on expert assessment data and available relevant spatial data. The approach aims to reduce issues with bias in representativeness of empirical data, to reduce issues of overlaps in wetland and lake extents, and to allow for the partitioning of uncertainty in CH4 emissions to CH4 emission magnitudes or areal extents of different land cover classes. As such, BAWLD will facilitate improved bottom-up estimates of high-latitude CH4 emissions and will be suitable for use in process-based models and as an a priori input to inverse modelling approaches. The land cover dataset will be suitable for further uses, especially for questions related to high-latitude hydrology and biogeochemistry. Lastly, BAWLD allows for the definition of “wetscapes”, regions with distinct co-occurrences of specific wetland and lake classes and which thus can be used to understand regional responses to climate change and as a way to visualize the landscape diversity of the boreal and arctic domain.
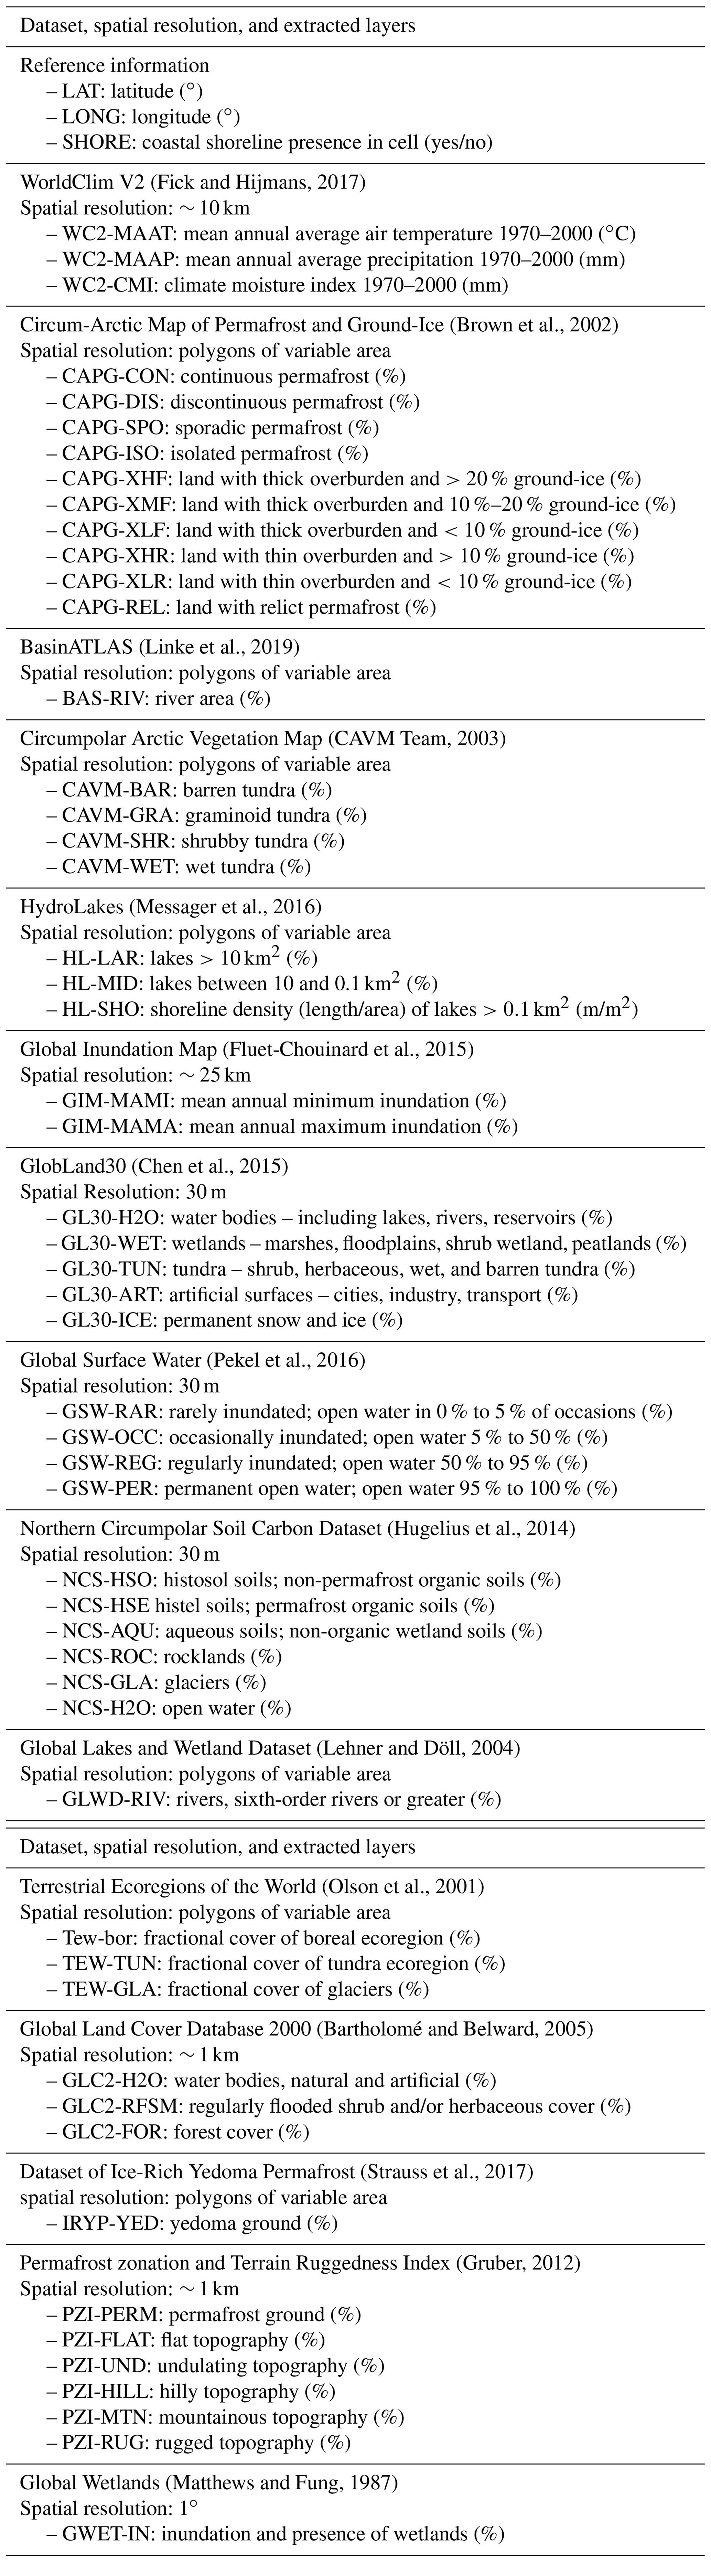
Table 1Description of data sources and layers extracted into the BAWLD 0.5∘ grid cell network.
2.1 Study domain and harmonization of available spatial data
The BAWLD domain includes all of the northern boreal and tundra ecoregions and also areas of rock and ice at latitudes >50∘ N (Olson et al., 2001). The BAWLD domain thus covers 25.5 × 10⁶ km2, or 17 % of the global land surface. Although northern peat-forming wetlands can also be found in temperate ecoregions, our decision to define the southern limit of BAWLD by the transition from boreal to temperate ecoregions was based on the greater human footprint and the increased biogeographic diversity of temperate ecoregions, which would require additional land cover classes (Venter et al., 2016). A network of 0.5∘ grid cells, cropped along coasts and at the transition from boreal to temperate ecoregions, was created for the BAWLD domain.
Grid cells in BAWLD were populated with data from 15 publicly available spatial datasets, yielding 53 variables with spatial information (Table 1). Most datasets that were included have data at higher resolution than the 0.5∘ BAWLD grid cells; hence information was averaged for each grid cell. For datasets where the spatial resolution was coarser or where spatial data were not aligned with the 0.5∘ grid cells, data were first apportioned into BAWLD grid cells before area-weighted averages were calculated. Climate data from the WorldClim2 (WC2) dataset (Fick and Hijmans, 2017) were averaged for each grid cell, including “mean annual air temperature”, “mean annual precipitation”, and “climate moisture index”. Information on soils and permafrost conditions were summarized as fractional coverage within each grid cell and included “permafrost extent” from the Permafrost Zonation and Terrain Ruggedness Index (PZI) dataset (Gruber, 2012); permafrost zonation, ground ice content, and overburden thickness from the Circum-Arctic Map of Permafrost and Ground-Ice (CAPG) dataset (Brown et al., 2002); “yedoma ground” from the Ice-Rich Yedoma Permafrost (IRYP) dataset (Strauss et al., 2017); and non-permafrost peat “histosol”, permafrost peat “histel”, and “aqueous” wetland soils from the Northern Circumpolar Soil Carbon Database (NCSCD; hereafter NCS) (Hugelius et al., 2013). Four independent datasets provided information on wetland coverage, although without further differentiation between distinct wetland classes: the “regularly flooded shrub and/or herbaceous cover” area from the Global Land Cover Database 2000 (GLC2) (Bartholomé and Belward, 2005), the “wetlands” area in the GlobLand30 (GL30) dataset (Chen et al., 2015), and the “inundation and presence of wetlands” area from the Global Wetlands (GWET) dataset (Matthews and Fung, 1987) and the Circumpolar Arctic Vegetation Map (CAVM) dataset (Walker et al., 2005). Two datasets provided information of the extent of forested regions – the GLC2 and the Terrestrial Ecoregions of the World (TEW) dataset (Olson et al., 2001) – while three datasets provided information on the extents of tundra vegetation: the CAVM, the GL30, and the TEW. Three datasets provided information on extent of glaciers and permanent snow: the NCS, the GL30, and the TEW. The NCS dataset also provided information about the extents of “rocklands”, while the PZI dataset had extents of topographic ruggedness (“flat”, “undulating”, “hilly”, “mountainous”, and “rugged”). Information on river extents was found in two datasets: the “river area” in the BasinATLAS (BAS) dataset (Linke et al., 2019) and “rivers” in the Global Lakes and Wetland (GLW) dataset, which includes sixth-order rivers and greater (Lehner and Döll, 2004). Inundation dynamics was provided by two datasets, with “mean annual minimum” and “mean annual maximum” inundation in the Global Inundation Map (GIM) dataset (Fluet-Chouinard et al., 2015) and an analysis of temporal inundation from the Global Surface Water (GSW) dataset (Pekel et al., 2016), where we defined inundation of individual 30 m pixels as being inundated “rarely” (>0 % to 5 % of all available Landsat images), “occasionally” (5 % to 50 %), “regularly” (50 % to 95 %), or “permanently” (95 % to 100 %). Four datasets included information about static extents of open water, including “open water” in NCS; “water bodies” in GL30; “water bodies” in GLC2; and information about lakes in the Hydrolakes (HL) dataset (Messager et al., 2016), where we differentiated between the area of “large lakes” (lakes >10 km2) and “midsize lakes” (lakes between 0.1 and 10 km2). High-latitude data were not available for the GL30 (>82∘ N) and HL (>80∘ N) datasets and were coded as missing data. Regions outside the spatial extents of the CAVM, CAPG, and IRYP datasets were coded as 0 as it suggested absence of tundra vegetation, permafrost, and yedoma soils.
2.2 Land cover classes in BAWLD
The land cover classification in BAWLD was constructed with the goal to enable upscaling of CH4 fluxes for large spatial extents. As such, we aimed to include as few classes as possible to facilitate large-scale mapping while still including classes that allow for separation among ecosystems with distinct hydrology, ecology, biogeochemistry, and thus net CH4 fluxes. The BAWLD land cover classification is hierarchical, with five wetland classes, seven lake classes, and three river classes, along with four other classes: glaciers, dry tundra, boreal forest, and rocklands. The class descriptions (see Kuhn et al., 2021, for further details) were provided to all experts for their land cover assessments and thus effectively serve as the BAWLD class definitions.
2.2.1 Wetland classes
Wetlands are defined by having a water table near or above the land surface for sufficient time to cause the development of wetland soils (either mineral soils with redoximorphic features or organic soils with >40 cm peat) and the presence of plant species with adaptations to wet environments (Hugelius et al., 2020; Canada Committee on Ecological (Biophysical) Land Classification et al., 1997; Jorgenson et al., 2001). Wetland classifications for boreal and arctic biomes can focus either on small-scale wetland classes that have distinct hydrological regimes, vegetation composition, and biogeochemistry or on larger-scale wetland complexes that are comprised of distinct patterns of smaller wetland and open-water classes (Gunnarsson et al., 2014; Terentieva et al., 2016; Masing et al., 2010; Glaser et al., 2004). While larger-scale wetland complexes are easier to identify through remote sensing techniques (e.g., patterned fens comprised of higher-elevation ridges and inundated hollows), our classification focuses on wetland classes due to greater homogeneity of hydrological, ecological, and biogeochemical characteristics that regulate CH4 fluxes (Heiskanen et al., 2021).
Several boreal countries identify four main wetland classes, differentiated primarily based on hydrodynamic characterization: bogs, fens, marshes, and swamps (Gunnarsson et al., 2014; Canada Committee on Ecological (Biophysical) Land Classification et al., 1997; Masing et al., 2010). The BAWLD classification follows this general framework but further uses the presence or absence of permafrost as a primary characteristic for classification and excludes a distinct swamp class, yielding five classes: Bogs, Fens, Marshes, Permafrost Bogs, and Tundra Wetlands (Fig. 1). A swamp class was omitted due to the wide range of moisture and nutrient conditions of swamps as well as the limited number of studies of swamp CH4 fluxes (Kuhn et al., 2021). We instead included swamp ecosystems in expanded descriptions of Bogs, Fens, and Marshes. The presence or absence of near-surface permafrost was used as a primary characteristic to distinguish between Permafrost Bogs and Bogs and to distinguish Tundra Wetlands from Marshes and Fens. The presence or absence of near-surface permafrost is considered key for controlling CH4 emissions given its influence on hydrology and for the potential of permafrost thaw and thermokarst collapse to cause rapid non-linear shifts in CH4 emissions (Bubier et al., 1995; Turetsky et al., 2002; Malhotra and Roulet, 2015). Detailed descriptions and definitions of Bogs, Fens, Marshes, Permafrost Bogs, and Tundra Wetlands for the purpose of BAWLD can be found in Kuhn et al. (2021). Differences in moisture regimes, nutrient and pH regimes, hydrodynamics, permafrost conditions (Fig. 1), and vegetation lead to distinct vegetation assemblages among the wetland classes. While each class has large variability in CH4 emissions, there are clear differences between most classes, with Permafrost Bogs < Bogs < Fens = Tundra Wetlands < Marshes (Kuhn et al., 2021).
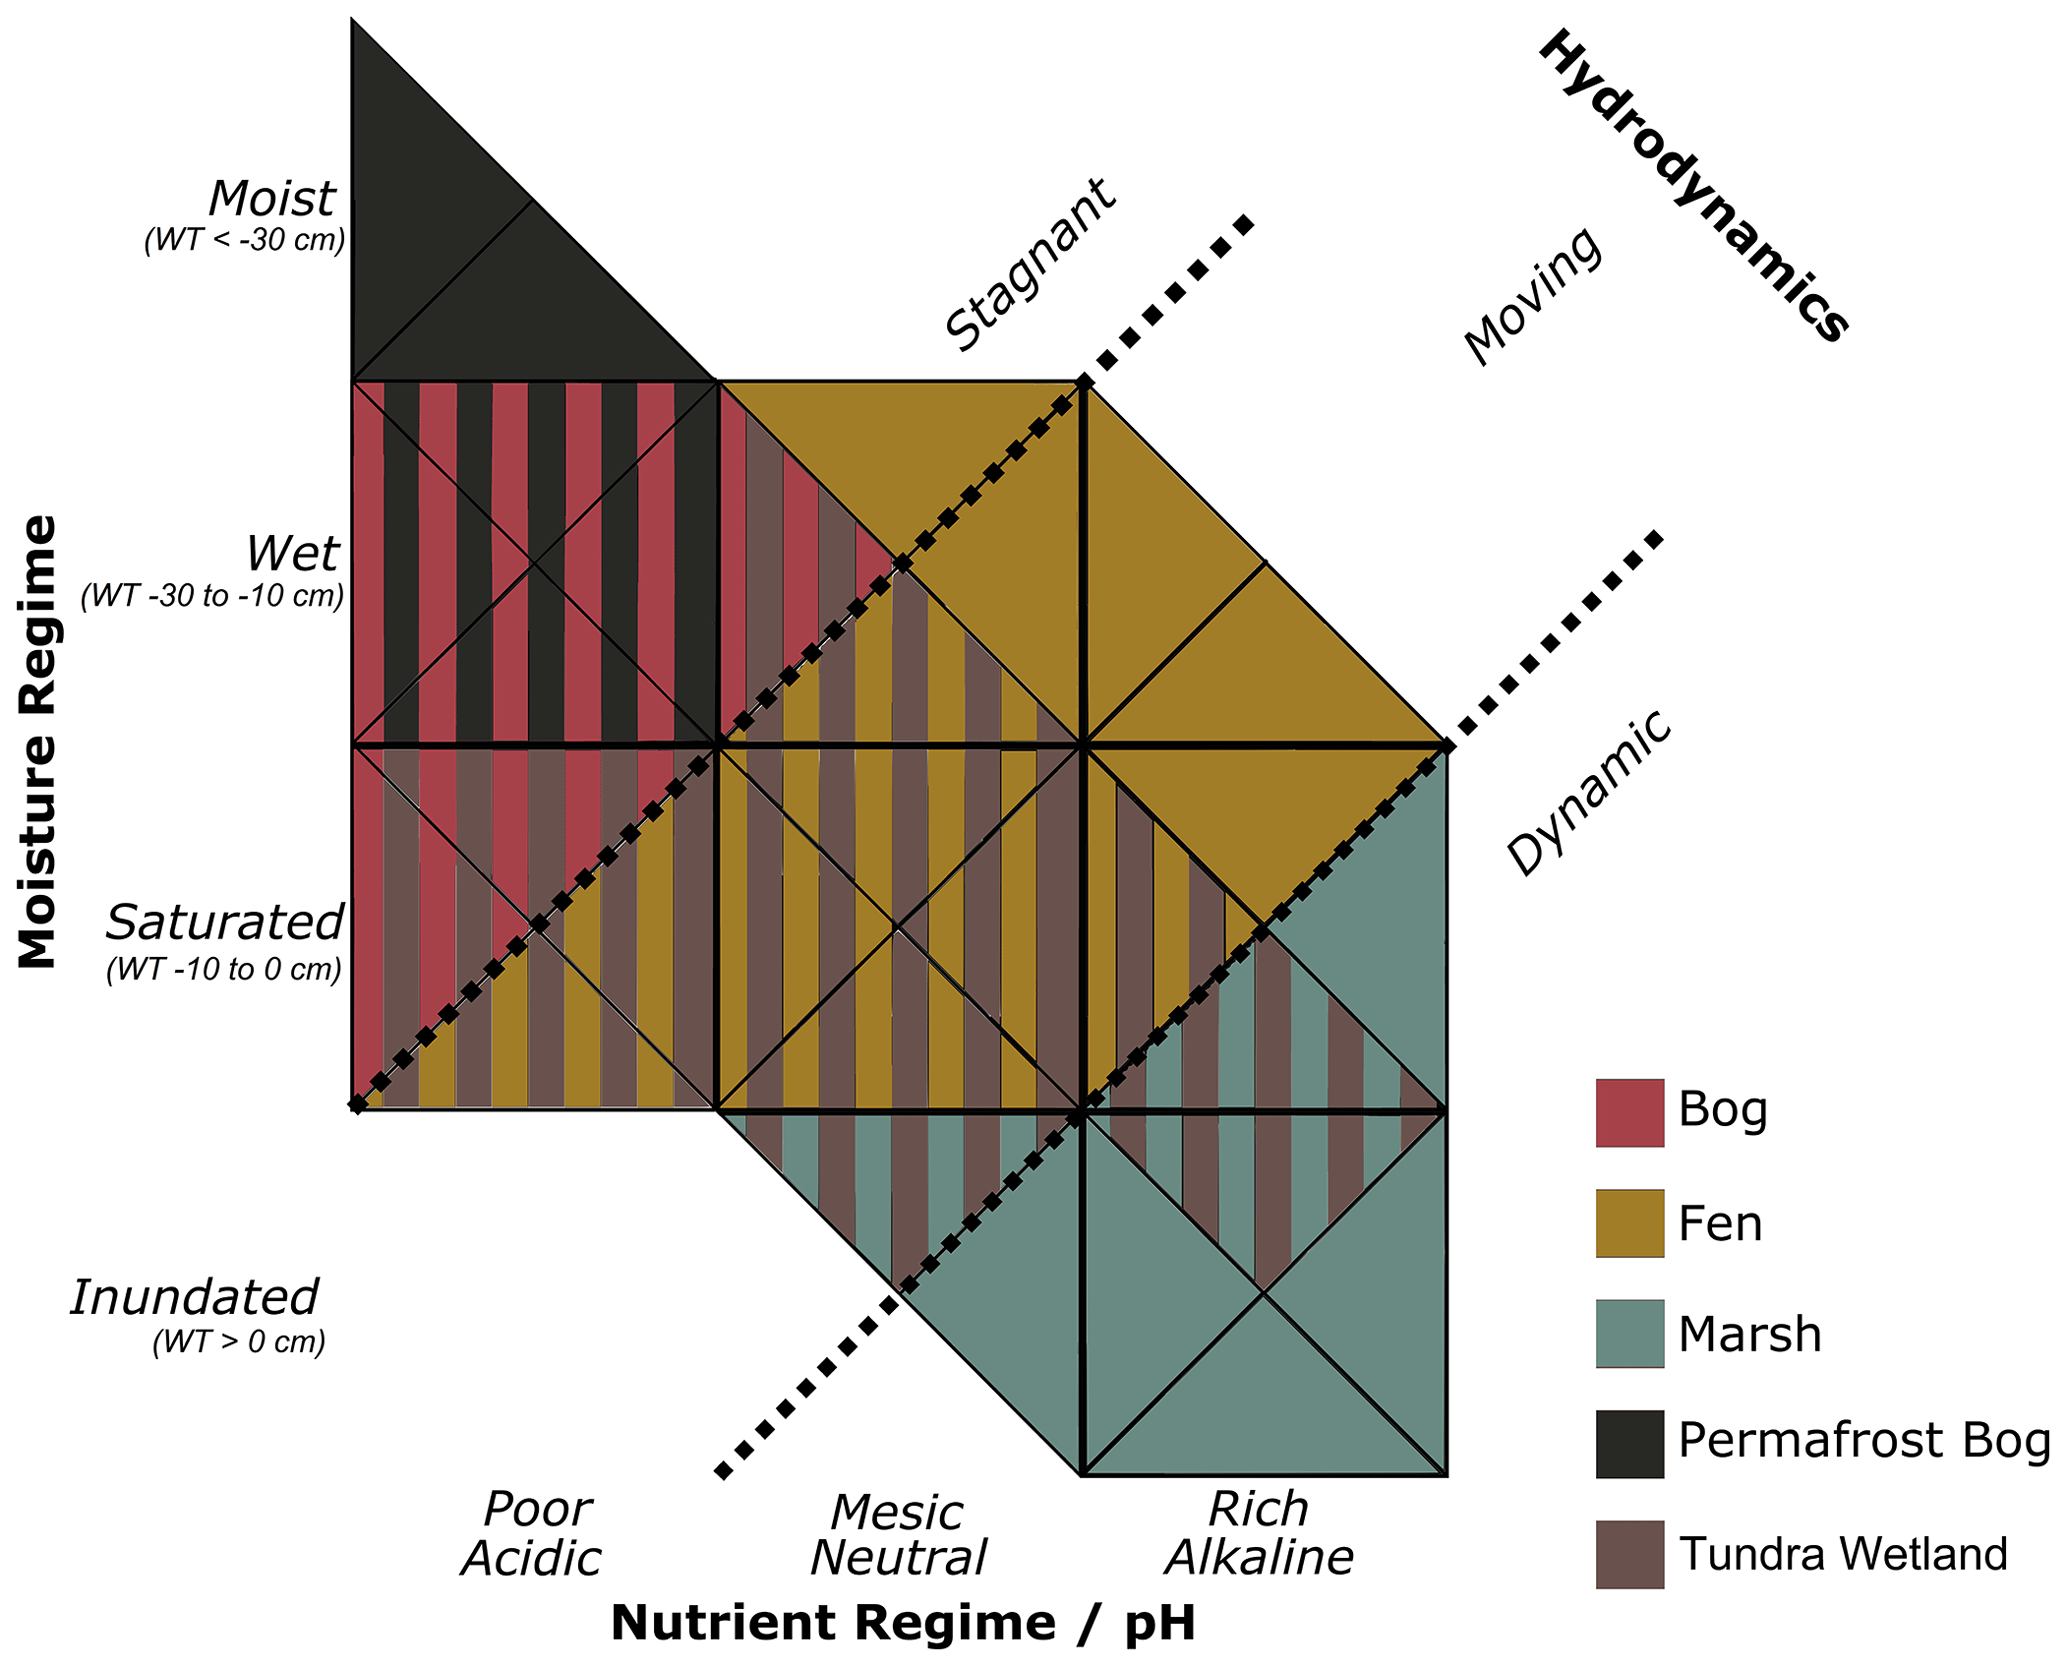
Figure 1Descriptions of wetland classes in BAWLD as distinguished based on the moisture regime, the nutrient and pH regime, hydrodynamics, and the presence/absence of permafrost.
2.2.2 Lake classes
Lakes in BAWLD are considered to include all lentic open-water ecosystems, regardless of surface area and depth of standing water. It is common in tundra lowlands and peatland regions for open-water bodies to have shallow depths, often less than 2 m, even when surface areas are up to hundreds of square kilometres in size (Grosse et al., 2013). While small, shallow open-water bodies often are included in definitions of wetlands (Canada Committee on Ecological (Biophysical) Land Classification et al., 1997; Gunnarsson et al., 2014; Treat et al., 2018), we include them here within the lake classes as controls on net CH4 emissions depend strongly on the presence or absence of emergent macrophytes (Juutinen et al., 2003). Further classification of lakes in BAWLD is based on lake size and lake genesis, where lake genesis influences lake bathymetry and sediment characteristics. Previous global spatial inventories of lakes include detailed information on size and location of individual lakes (Messager et al., 2016; Downing et al., 2012) but do not include open-water ecosystems <0.1 km2 in size and do not differentiate between lakes of different genesis (e.g., tectonic, glacial, organic, and yedoma lakes). Small water bodies are disproportionately abundant in some high-latitude environments (Muster et al., 2019), have high emissions of CH4 (Holgerson and Raymond, 2016), and therefore require explicit classification apart from larger water bodies. Furthermore, lake genesis and sediment type haven been shown to influence net CH4 flux from lakes (Wik et al., 2016). In BAWLD we thus differentiate between large (>10 km2), midsize (0.1 to 10 km2), and small (<0.1 km2) lake classes and further differentiate between three lake types for midsize and small lakes: peatland, yedoma, and glacial lakes. Detailed descriptions of the seven lake classes in BAWLD can be found in Kuhn et al. (2021), where it is also shown that net CH4 emissions (combined ebullitive and diffusive emissions) vary among classes with large Lakes < Midsize Glacial Lakes = Small Glacial Lakes < Midsize Yedoma Lakes < Midsize Peatland Lakes < Small Peatland Lakes = Small Yedoma Lakes.
2.2.3 River classes
We include three river classes in BAWLD: Large Rivers, Small Organic-Rich Rivers, and Small Organic-Poor Rivers. Large rivers are described as sixth-Strahler-order rivers or greater and generally have river widths > ∼ 75 m (Downing et al., 2012; Lehner and Döll, 2004). Small Organic-Rich Rivers include all first- to fifth-order streams and rivers that drain peatlands or other wetland soils, thus being associated with high concentrations of dissolved organic carbon and high supersaturation of CH4. Conversely, Small Organic-Poor Rivers drain regions with fewer wetlands and organic-rich soils and generally have lower concentrations of dissolved organic carbon and dissolved CH4.
2.2.4 Other classes
Four additional classes are included in BAWLD: Glaciers, Rocklands, Dry Tundra, and Boreal Forests. Glaciers include both glaciers and other permanent snow and ice on land. Rocklands include areas with very poor soil formation and where vegetation is largely absent. Rocky outcrops in shield landscapes, slopes of mountains, and high-arctic barren landscapes are included in the class. The Rocklands class also includes artificial surfaces such as roads and towns. Glaciers and Rocklands are considered to be close to neutral with respect to CH4 emissions. The Dry Tundra class includes both lowland arctic tundra and alpine tundra, both treeless ecosystems dominated by graminoid or shrub vegetation. Dry Tundra ecosystems generally have near-surface permafrost, with seasonally thawed active layers between 20 and 150 cm depending on climate, soil texture, and landscape position (van der Molen et al., 2007; Heikkinen et al., 2004). Near-surface permafrost in Dry Tundra prevents vertical drainage, but lateral drainage ensures predominately oxic soil conditions. A water table is either absent or close to the base of the seasonally thawing active layer. Dry Tundra is differentiated from Permafrost Bogs by having thinner organic soil (<40 cm) and from Tundra Wetlands by their drained soils. Dry Tundra generally have net CH4 uptake, but low CH4 emissions are sometimes found (Kuhn et al., 2021). Boreal Forests are treed ecosystems with non-wetland soils. Coniferous trees are dominant, but the class also includes deciduous trees in warmer climates and landscape positions. Boreal Forests may have permafrost or non-permafrost ground, where absence of permafrost often allows for better drainage. Overall, it is rare for anoxic conditions to occur in Boreal Forest soils, and CH4 uptake is prevalent, although low CH4 emissions have been observed during brief periods during snowmelt or following summer storms (Matson et al., 2009) or conveyed through tree stems and shoots (Machacova et al., 2016). The Boreal Forest class also includes the few agricultural and pasture ecosystems within the boreal biome.
2.3 Expert assessment
Expert assessments can be used to inform various environmental assessments and are particularly useful to assess levels of uncertainty and to provide data that cannot be obtained through other means (Olefeldt et al., 2016; Loisel et al., 2021; Abbott et al., 2016; Sayedi et al., 2020). We solicited an expert assessment to aid in the modelling of fractional coverage of the 19 land cover classes within each BAWLD grid cell. Researchers associated with the Permafrost Carbon Network (http://www.permafrostcarbon.org, last access: 30 October 2021) with expertise from wetland, lake, and/or river ecosystems within the BAWLD domain were invited to participate. We also included a few additional referrals to suitable experts outside the Permafrost Carbon Network. A total of 29 researchers completed the expert assessment and are included as co-authors of the BAWLD dataset. Each expert was asked to identify a region within the BAWLD domain for which they considered themselves familiar. Experts were then assigned 10 random cells from their region of familiarity and 10 cells distributed across the BAWLD domain that allowed for an overall balanced distribution of training cells (Fig. S1 in the Supplement). No cell was assessed more than once, and in total ∼ 3 % of the area of the BAWLD domain was included in the expert assessment. Each expert was asked to assess the percent coverage of each of the 19 land cover classes within their 20 training cells. To guide their assessment, each expert was provided step-by-step instructions, plus information on the definitions of each land cover class and a KML file with the data extracted from available spatial datasets for each grid cell (Table 1). Experts were asked to use their knowledge of typical wetland and lake classes within specific high-latitude regions, their ability to interpret satellite imagery as provided by Google Earth, and their judgement of the quality and relevance of available spatial datasets to make their assessments of fractional cover. The information provided to experts to carry out the assessment is provided in the Supplement.
2.4 Random forest model and uncertainty analysis
Random forest regression models were created to predict the percent coverage of all 19 individual BAWLD land cover classes, along with three additional models for total wetland, lake, and river coverage. The regression models used the expert assessment of land cover fractional extent as the response variables. Each land cover class was at first modelled separately, which was followed by minor adjustments, described below, that ensured that the total land cover within each cell added up to 100 %. All statistical analysis and modelling were done using R 4.0.2 (R Core Team, 2020) and the packages Boruta (v7.0.0; Kursa and Rudnicki, 2010), caret (v6.0-86; Kuhn, 2020), randomForest (v4.6-14; Liaw and Wiener, 2002), and factoextra (v1.0.7; Kassambara and Mundt, 2020).
Table 2Summary of random forest models for each land cover class in BAWLD.
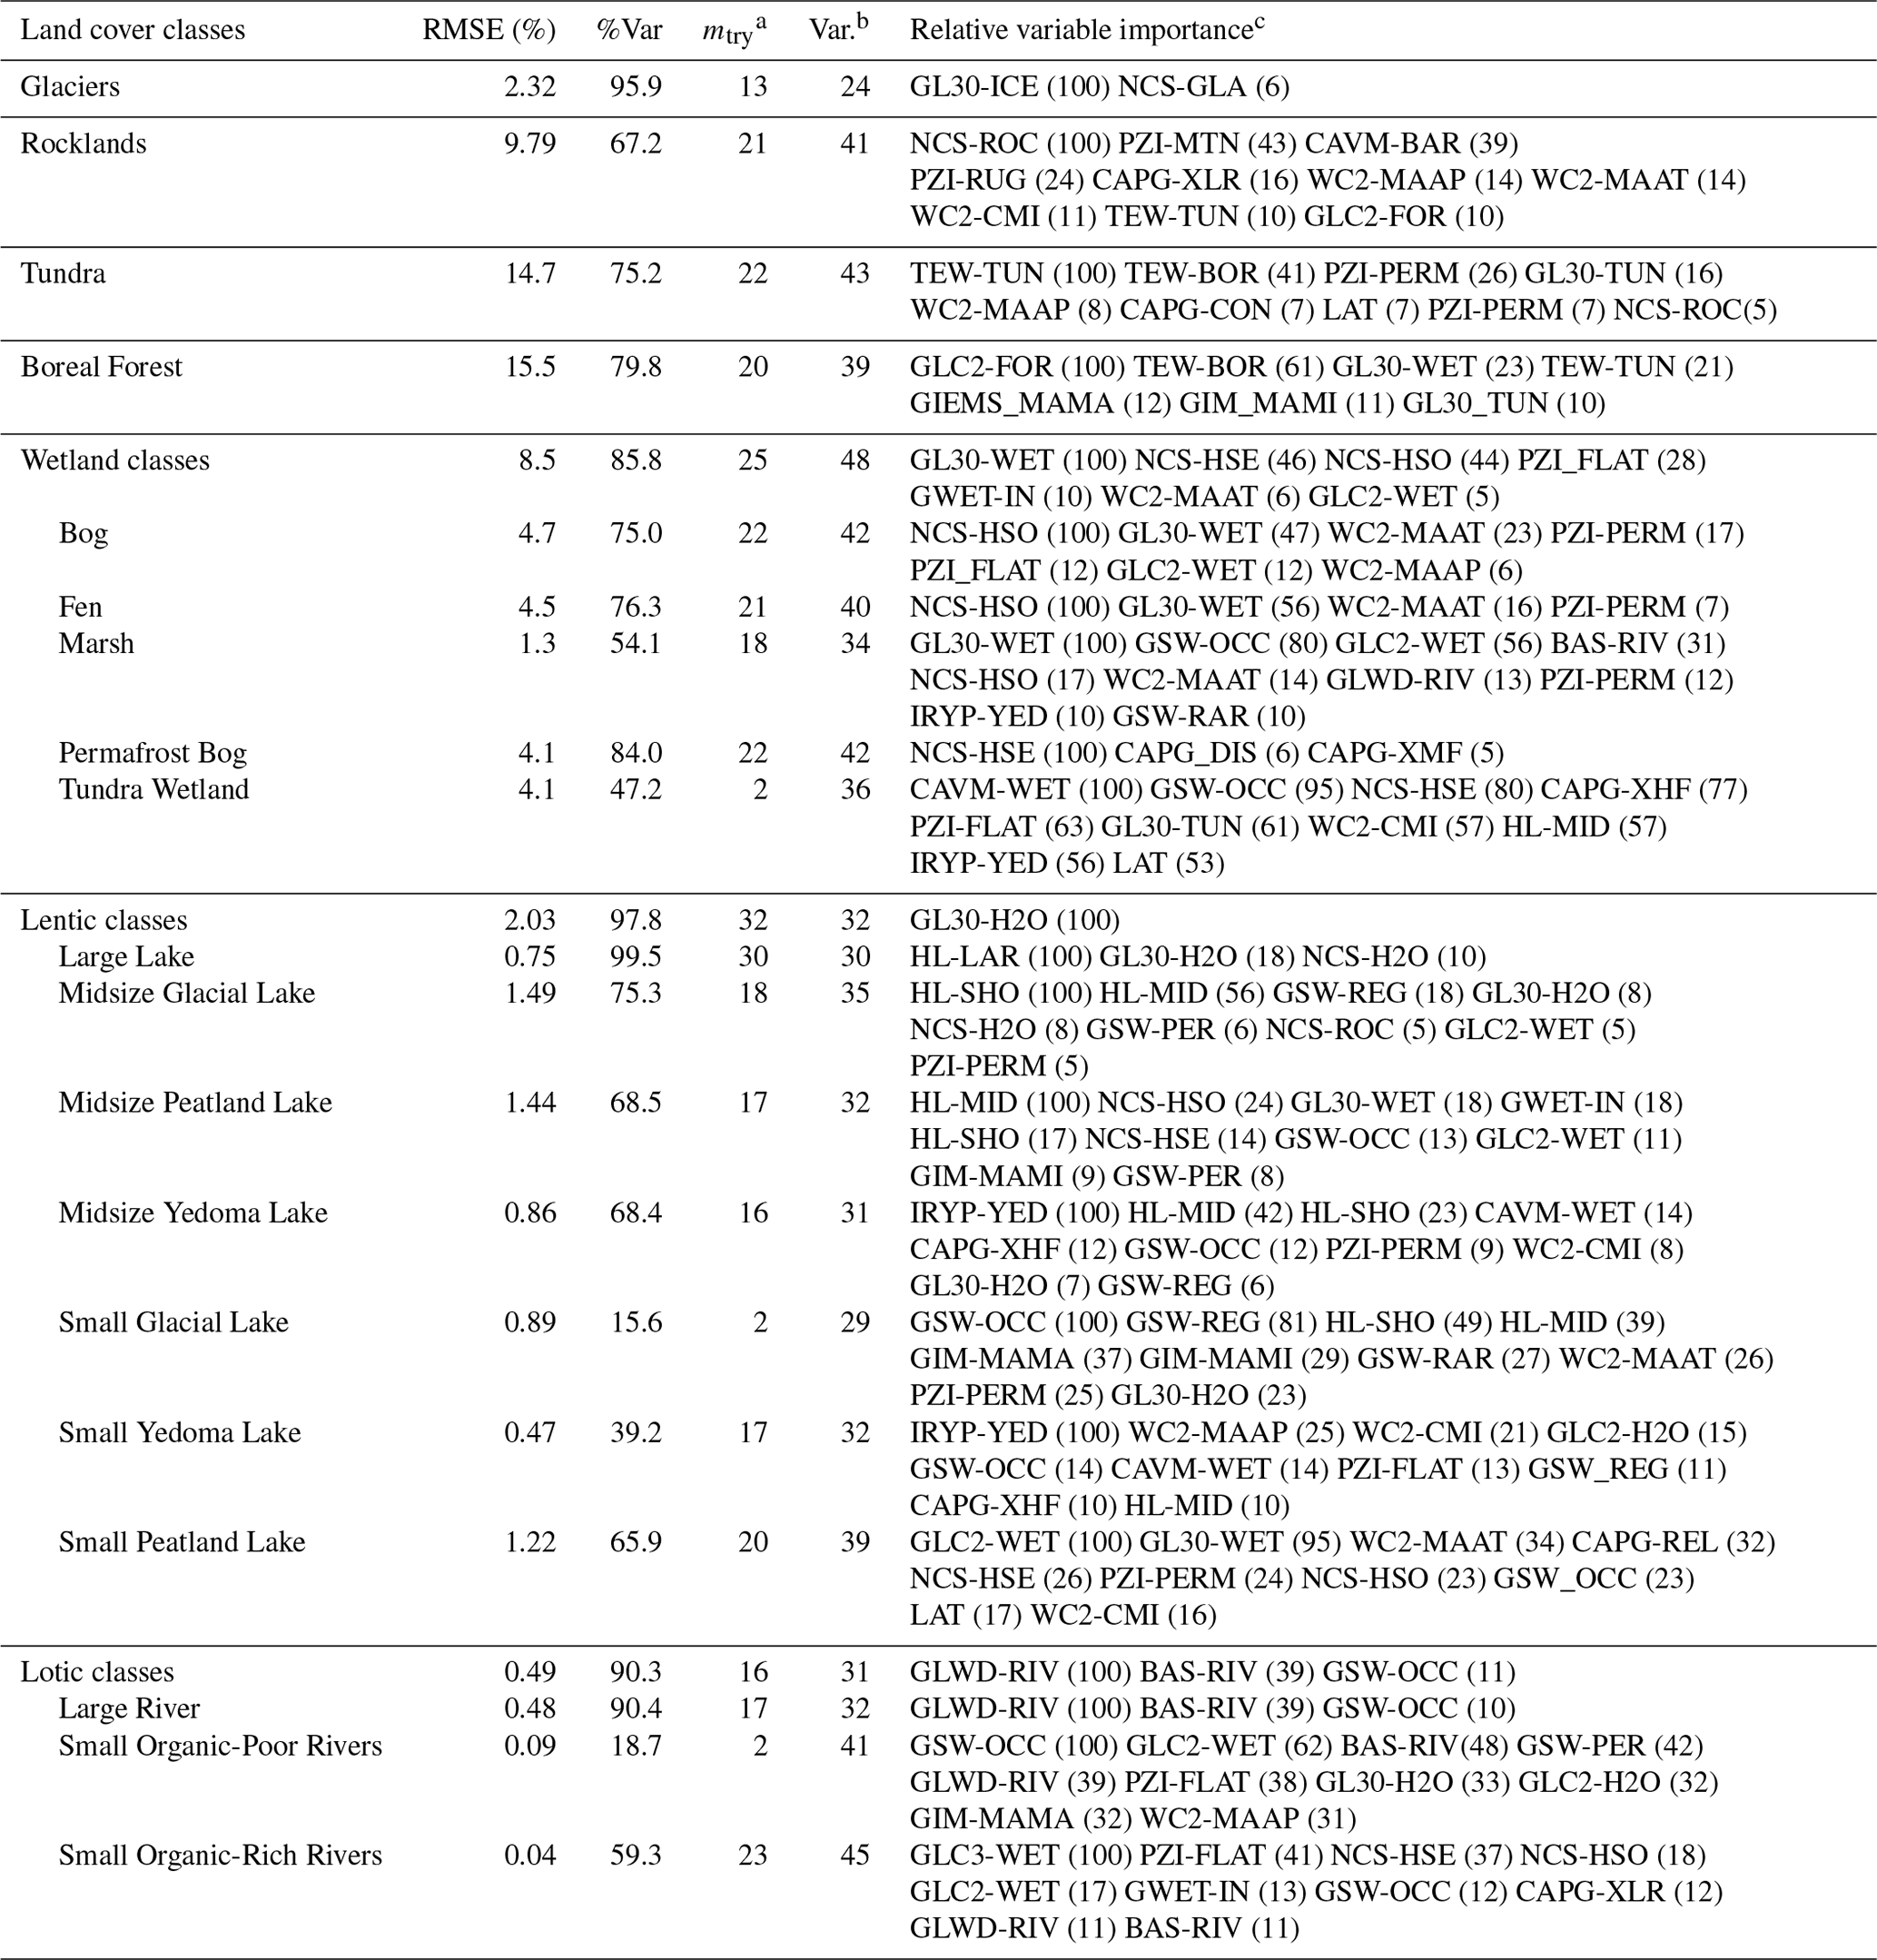
a mtry is a fitted variable which decides how many variables were randomly chosen at each split in the random forest analysis. b Var. indicates the number of variables that were included (out of 53) in the random forest analysis after the Boruta automatic feature selection. c Relative variable importance – the most influential variable in the random forest analysis is assigned a 100 % rating, and the importance of other variables is relative to this. See Table 1 for full descriptions of the variables. Here we list either all variables with >5 % influence or the top 10 variables.
Prior to running the random forest analyses, we performed an automatic feature selection using a Boruta algorithm (Kursa and Rudnicki, 2010). The Boruta algorithm completed 150 runs for each land cover class, after which subsets of the 53 possible data variables (Table 1) were deemed important and selected for inclusion in subsequent random forest models (Table 2). The random forest models (Kuhn, 2020; Liaw and Wiener, 2002) then used boot-strapped samples (i.e., the expert assessments of land cover fractional grid cell coverages) to grow 500 decision trees (ntree), with a subset of randomized data variables as predictors at each tree node (mtry). We used a 10-fold cross-validation with five repetitions providing mtry as a tuneable parameter for model training. The random forest model output included the root mean square error (RMSE), the percent of the expert assessment variability that was explained (%Var), and relative variable importance (Table 2). Relative variable importance assigns a 100 % importance to the variable with the most influence on the model and then ranks all other variables relative to the influence of that variable. A bias correction (Song, 2015) was applied to the predicted data of land cover class coverages as the models were found to overestimate low coverages and underestimate high coverages. After the bias correction, all bias-adjusted predictions <0 % were set to 0 %, while those >100 % were set to 100 % (for examples of the bias correction, see Fig. S2). Next, we ensured that the combined coverage of all 19 land cover classes within each grid cell added up to 100 % by applying a proportional adjustment. In order to estimate the 5th and 95th percentile confidence bounds of the land cover predictions, we repeated the random forest analysis, as outlined above, an additional 20 times for each class. Each new run completely excluded 20 % of the expert assessments, and the data were reshuffled four times. Each grid cell thus had 21 predictions of coverage for each of the 19 land cover classes and for the cumulative wetland, lake, and river coverages, and the variability in these predictions were used to define the 5th and 95th percentile confidence bounds.
While each cell in BAWLD has a distinct land cover combination, we were also interested in identifying cells with similarities in their land cover compositions to distinguish between regions of the boreal and arctic domain that represent characteristic landscapes. We carried out a k-means clustering (Kassambara and Mundt, 2020) to group grid cells with similarities in their predicted land cover compositions. The k-means clustering was based on within-cluster sum of squares, and we evaluated resulting maps with between 10 and 20 distinct classes. Using 15 clusters was deemed to balance the within-cluster sum of squares and interpretability of the resulting map. We henceforth refer to these clusters as “wetscapes” as each cluster was defined largely by the relative dominance (or absence) of different wetland, lake, and river classes.
2.5 Evaluation against regional wetland datasets
We evaluated the predictions of wetland coverage in BAWLD against four independent, high-resolution regional land cover datasets. These four datasets were chosen as they included more than one wetland class, thus enabling evaluation against both total wetland coverage and subsets of wetland classes. Two of these datasets were specifically aimed at mapping of wetlands, including Ducks Unlimited Canada's wetland inventories for western Canada as part of the Canadian Wetland Inventory (CWI; Canadian Wetland Inventory Technical Committee, 2016) and wetland mapping of the West Siberian Lowlands (WSL) (Terentieva et al., 2016). The other two datasets, the 2016 National Land Cover Database (NLCD) of Alaska (Homer et al., 2020) and the 2018 CORINE Land Cover (CLC) (Büttner, 2014) of northern Europe, represent more general land cover datasets. Data from these four datasets were summarized for each BAWLD grid cell where there was complete coverage. Data filtration was done for the CWI to remove cells if >10 % of the cell was classified as burned, cloud, or shadow. There were few cases where there were equivalent wetland classes in BAWLD and these four regional datasets, and as such comparisons were generally made between groups of wetland classes that were considered generally comparable. Similar evaluations were not possible for the lake classes as there are no regional or circumpolar spatial datasets with information on lake genesis or sediment type.
The fractional land cover estimates of the Boreal–Arctic Wetland and Lake Dataset (BAWLD) are freely available online at https://doi.org/10.18739/A2C824F9X (Olefeldt et al., 2021) and include both the central estimates and the 95 % high and low estimates of each land cover class in each grid cell.
3.1 Wetlands
Wetlands were predicted to cover a total of 3.2 × 10⁶ km2, or 12.5 % of the BAWLD domain. The wetland area was dominated by Fens (29 % of total wetland area), Bogs (28 %), and Permafrost Bogs (27 %), while Marshes and Tundra Wetlands, which have relatively higher CH4 emissions, covered 5 % and 12 % of the wetland area, respectively (Table 3). This estimate of total wetland area was greater than previously mapped within the BAWLD domain in GLC2 at 0.9 × 10⁶ km2 (Bartholomé and Belward, 2005), GL30 at 1.4 × 10⁶ km2 (Chen et al., 2015), and GWET at 2.3 × 10⁶ km2 (Matthews and Fung, 1987) but similar to the area of wetland soils in NCS (sum of “histosols”, “histels”, and “aqueous” soil coverage) at 3.0 × 10⁶ km2 (Hugelius et al., 2014). Differences between BAWLD and other estimates of wetland area likely stem partially from differences in wetland definitions, where, for example, definitions of wetlands in GLC2 and GL30 likely do not include wooded bogs, fens, and permafrost bogs. While estimates of total wetland area GWET and in the NCS were closer to BAWLD, there were differences in the spatial distribution. Wetland cover in BAWLD was generally greater than in GWET and NCS in regions with low wetland cover. This likely reflects the ability of experts to infer the presence of small or transitional wetlands that may otherwise be underestimated when mapped using other methodologies. Conversely, wetland cover in BAWLD was generally lower than in GWET and NCS in regions with high wetland cover. This was likely due to differences in definitions, especially the exclusion of all open-water ecosystems from wetlands in BAWLD. For example, it was common in the West Siberian Lowlands for the summed coverage of wetland soils in NCS and the “open-water” coverage in GL30 to be substantially greater than 100 %, suggesting that NCS included peatland pools and small ponds within its wetland soil coverage. Overall, the predictive random forest model of total wetland coverage was able to explain 86 % of the variability in the expert assessments, and it was primarily influenced by the area of “wetlands” in GLC30 and the wetland soil categories in NCS, followed by the coverage of “flat topography” in PZI (Gruber, 2012) (Table 2).
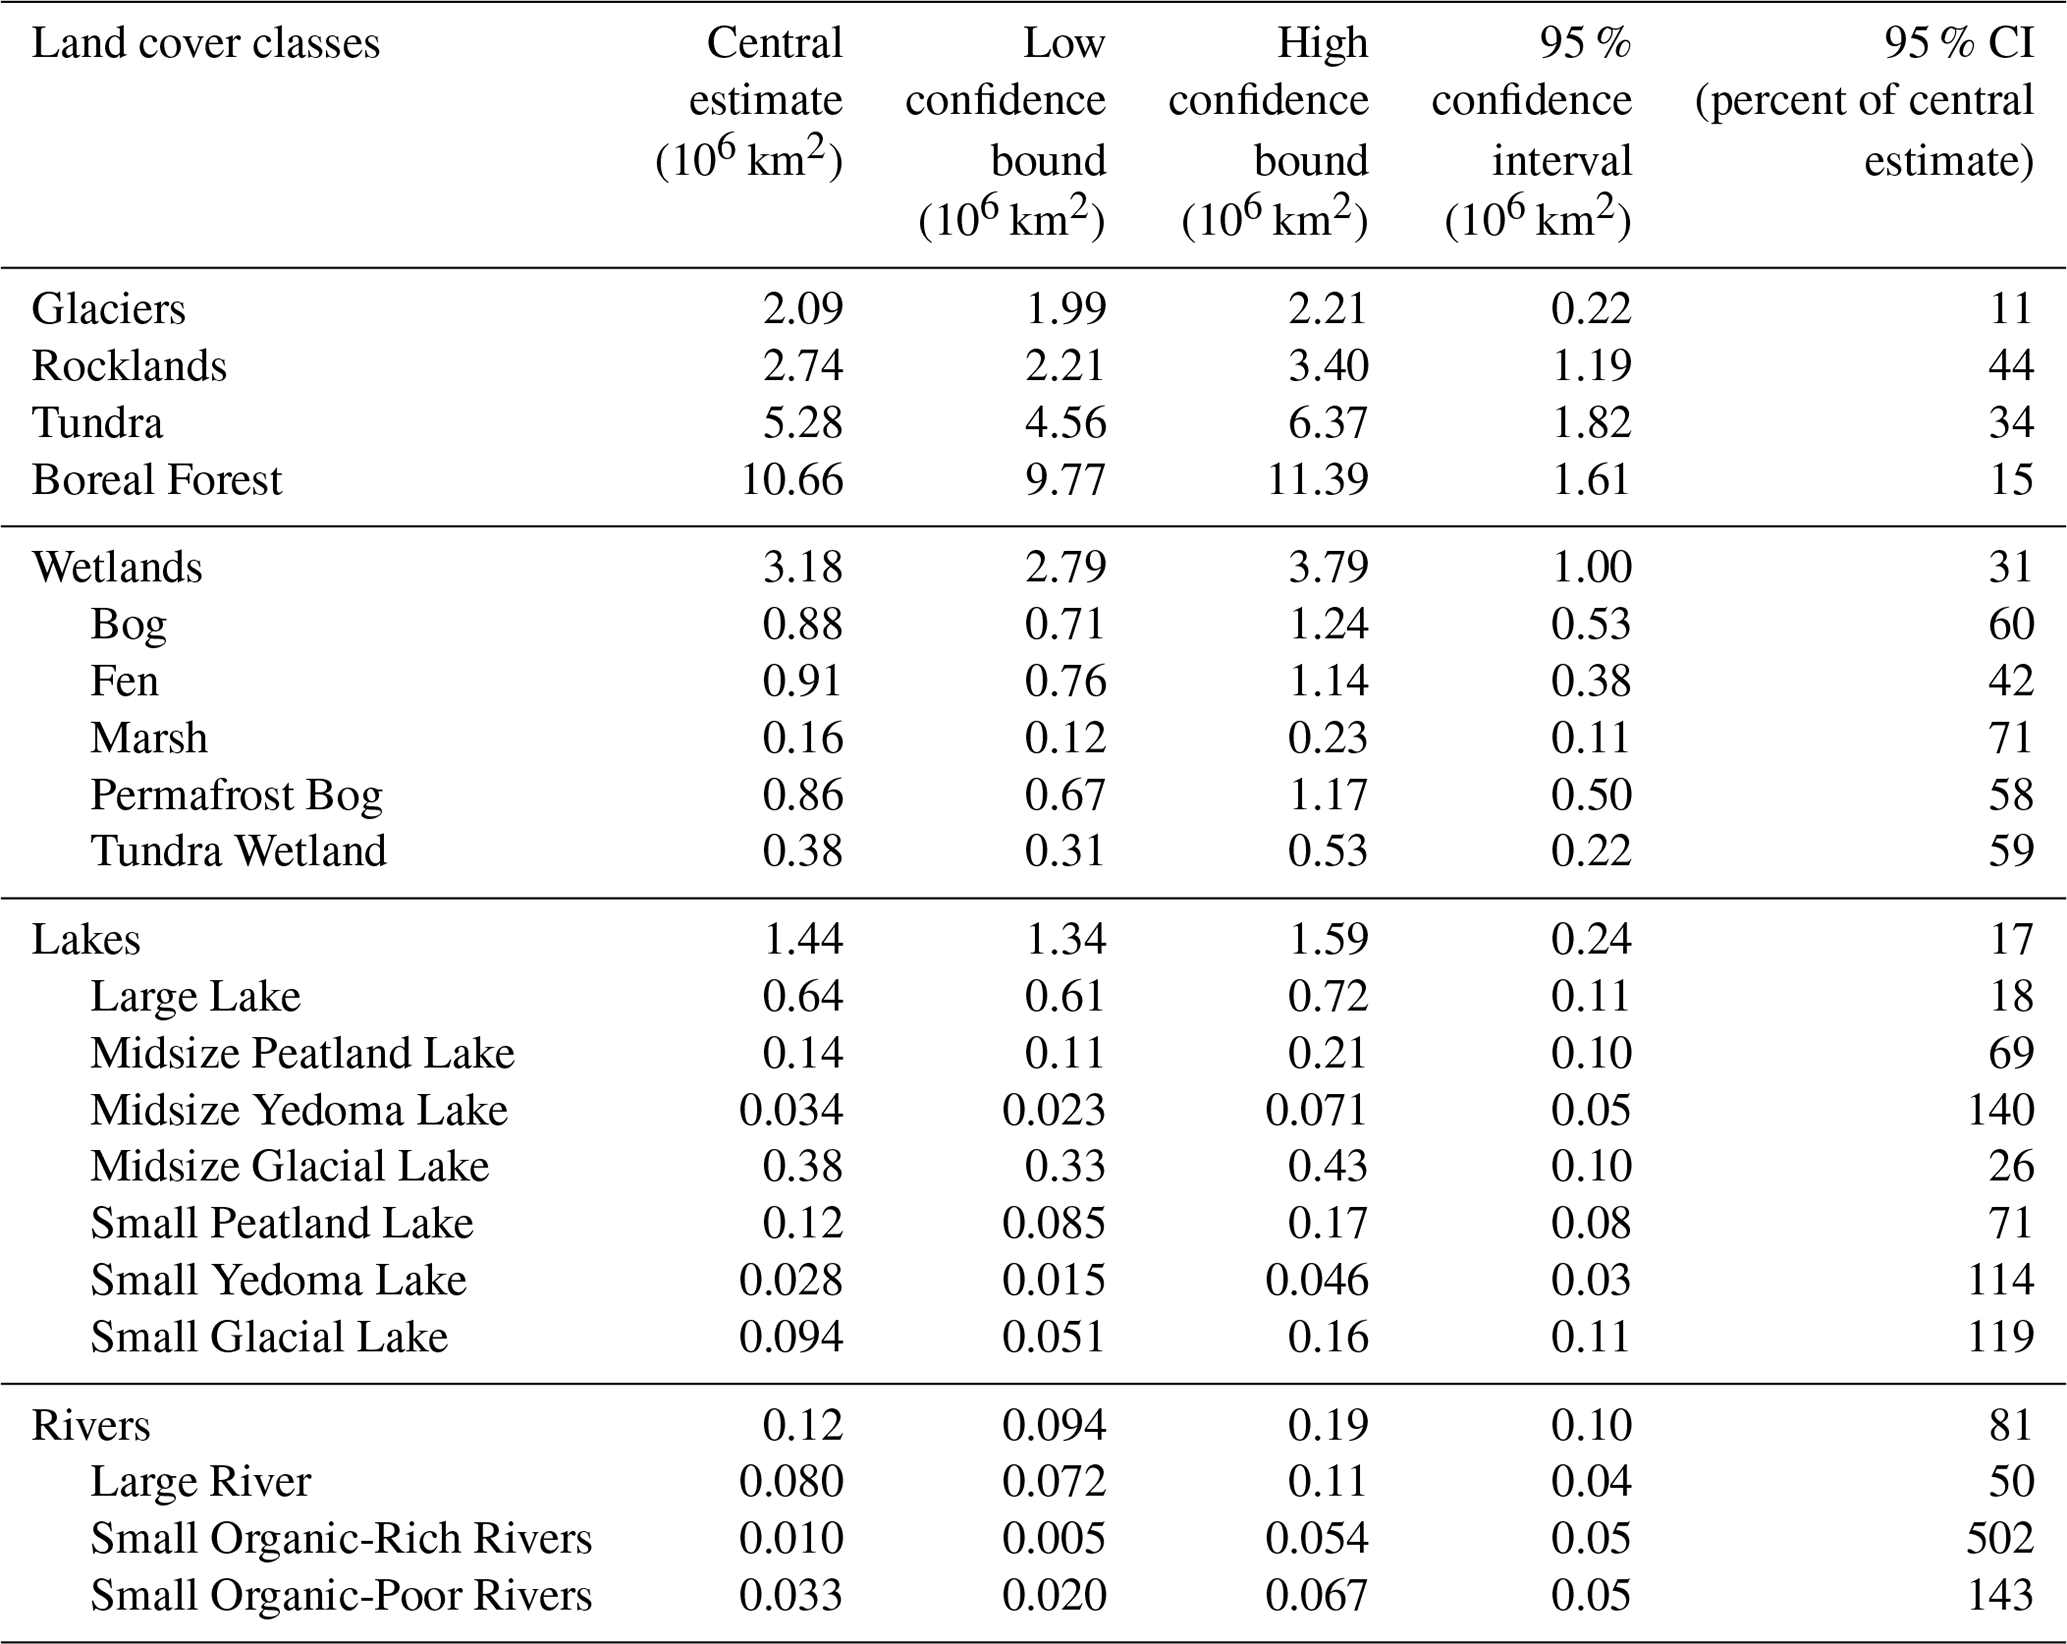
Table 3Summary of central estimates, 95 % low and high confidence bounds, and the range of the 95 % confidence interval expressed as a percent of the central estimate for each of the land cover classes within the BAWLD domain.
The predictive random forest models for individual wetland classes differed both in terms of how much of the variability in the expert assessment data was explained and in terms of which spatial data were most influential (Table 2). The model for Permafrost Bog coverage explained 84 % of the variability in the expert assessments and was very strongly influenced by “histel” distribution in the NCS (Hugelius et al., 2014). Predictive models explained ∼ 75 % of the variability in the expert assessments for Bogs and Fens separately (Table 2) but 87 % when considered jointly. This shows that the available predictor variables were less suitable for modelling Bogs and Fens separately than jointly, which could partly be due to lower agreement among experts in assessments of Bog and Fen coverages compared to their sum. This would not be surprising as bogs and fens (and swamps) occur along hydrological and nutrient gradients and can have vegetation characteristics that make them difficult to distinguish. Models for Bogs and Fens were both strongly influenced by the “histosol” distribution in NCS, with secondary influences from the area of “wetlands” in GL30, “permafrost extent” in PZI, and “mean annual air temperature” in WC2. Predictive models for Marsh and Tundra Wetlands explained less of the variability in expert assessments, at 54 % and 47 %, respectively. The predictive models for Marsh and Tundra Wetlands were influenced by variables that indicate a transition between terrestrial and aquatic ecosystems, e.g., area of “occasional inundation” in GSW, “rivers” in BAS, and “midsize lakes” in HL, but then differed in the influence of climate and permafrost conditions.

Figure 2Predicted distribution of wetland classes across the BAWLD domain: (a) Bog, (b) Fen, (c) Marsh, (d) Permafrost Bog, and (e) Tundra Wetland.
Each wetland class had a distinct spatial distribution (Fig. 2). Bogs and Fens were the dominant wetland classes in relatively warmer climates, with high densities in the West Siberian Lowlands, Hudson Bay Lowlands, and the Mackenzie River Basin. While Bogs and Fens had similarities in their spatial distributions, there was also a relative shift in dominance from Bogs to Fens in relatively colder and drier climates (Fig. S3). These trends are supported by bog-to-fen transitions observed both within and between regions (Packalen et al., 2016; Vitt et al., 2000a; Väliranta et al., 2017) but may not be universal (Kremenetski et al., 2003). Marshes were also found in warmer climates and largely associated with Bogs and Fens but with a more evenly spread distribution. The highest abundance of Marsh coverage was predicted for the Ob River floodplains, a region with very few field studies of CH4 emissions (Terentieva et al., 2019; Glagolev et al., 2011). Bogs, Fens, and Marshes all decreased in abundance in colder climates, with Permafrost Bogs becoming more abundant than Bogs when mean annual temperatures were below −2.5 ∘C, corresponding to findings from western Canada, Fennoscandia, and the West Siberian Lowlands (Vitt et al., 2000b; Seppälä, 2011; Terentieva et al., 2016). Tundra Wetlands became dominant over Fens and Marshes when mean annual air temperatures were below −5.5 ∘C (Fig. 3). Tundra Wetlands were predicted to be most abundant in the lowland regions across the Arctic Ocean coast, with especially high abundance in northern Alaska, eastern Siberia, and on the Yamal and Gydan peninsulas in western Siberia.
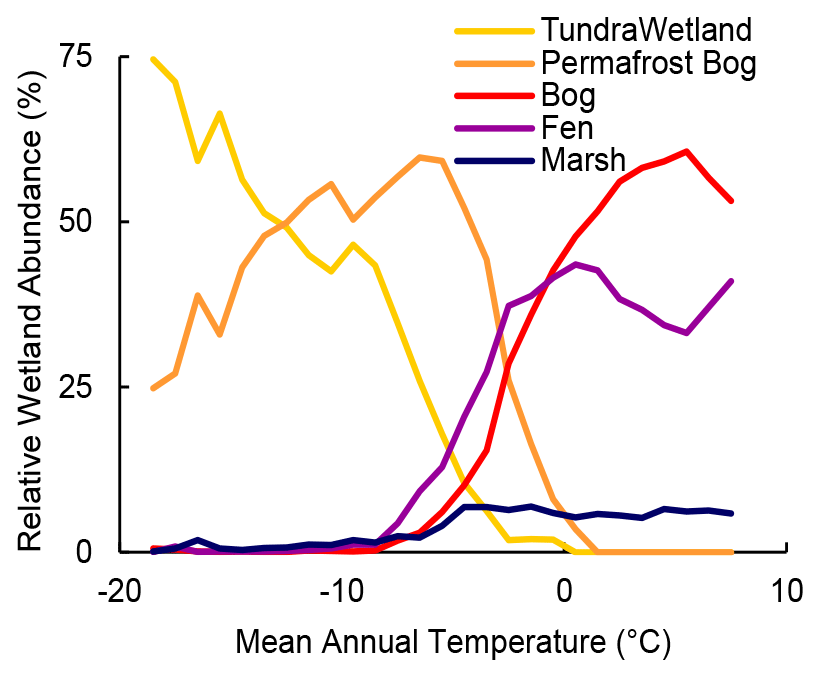
Figure 3Relative abundance of the five wetland classes across a gradient of mean annual temperatures.
We found good agreement between the distribution of wetlands in BAWLD and that of four independent regional spatial datasets (Figs. 4, S4). The best agreements for total wetland cover were between BAWLD and the two datasets dedicated specifically to wetland mapping, with R2 of 0.76 with the WSL dataset and 0.72 with the CWI dataset. There were also strong relationships between BAWLD and the WSL dataset for the distribution of specific wetland classes, for both drier wetland classes (“ridge” + “ryam” + “palsa” vs. Permafrost Bog + Bog) and wetter classes (“fen” + “hollow” vs. Fen). When comparing “wet hollow” of the WSL dataset and Marsh in BAWLD there were discrepancies, but they were primarily attributed to the explicit exclusion of the Ob River floodplains in the WSL dataset (Fig. S4). For the wettest classes, we had only a weak relationship (R2=0.19) between the CWI “marsh” class and the sum of the BAWLD Marsh and Tundra Wetland classes, but the overall average abundance for comparable grid cells was similar, at 1.4 % and 2.2 %, respectively. Agreements between BAWLD and the NLCD and CLC datasets were lower, especially for the relatively drier wetland classes (Fig. S4). Lower agreement between BAWLD and some classes of regional wetland datasets should not be interpreted to demonstrate poor accuracy of BAWLD as differences can be due to class definitions, large mapping units, and relatively low accuracy of the non-wetland-specific regional datasets.
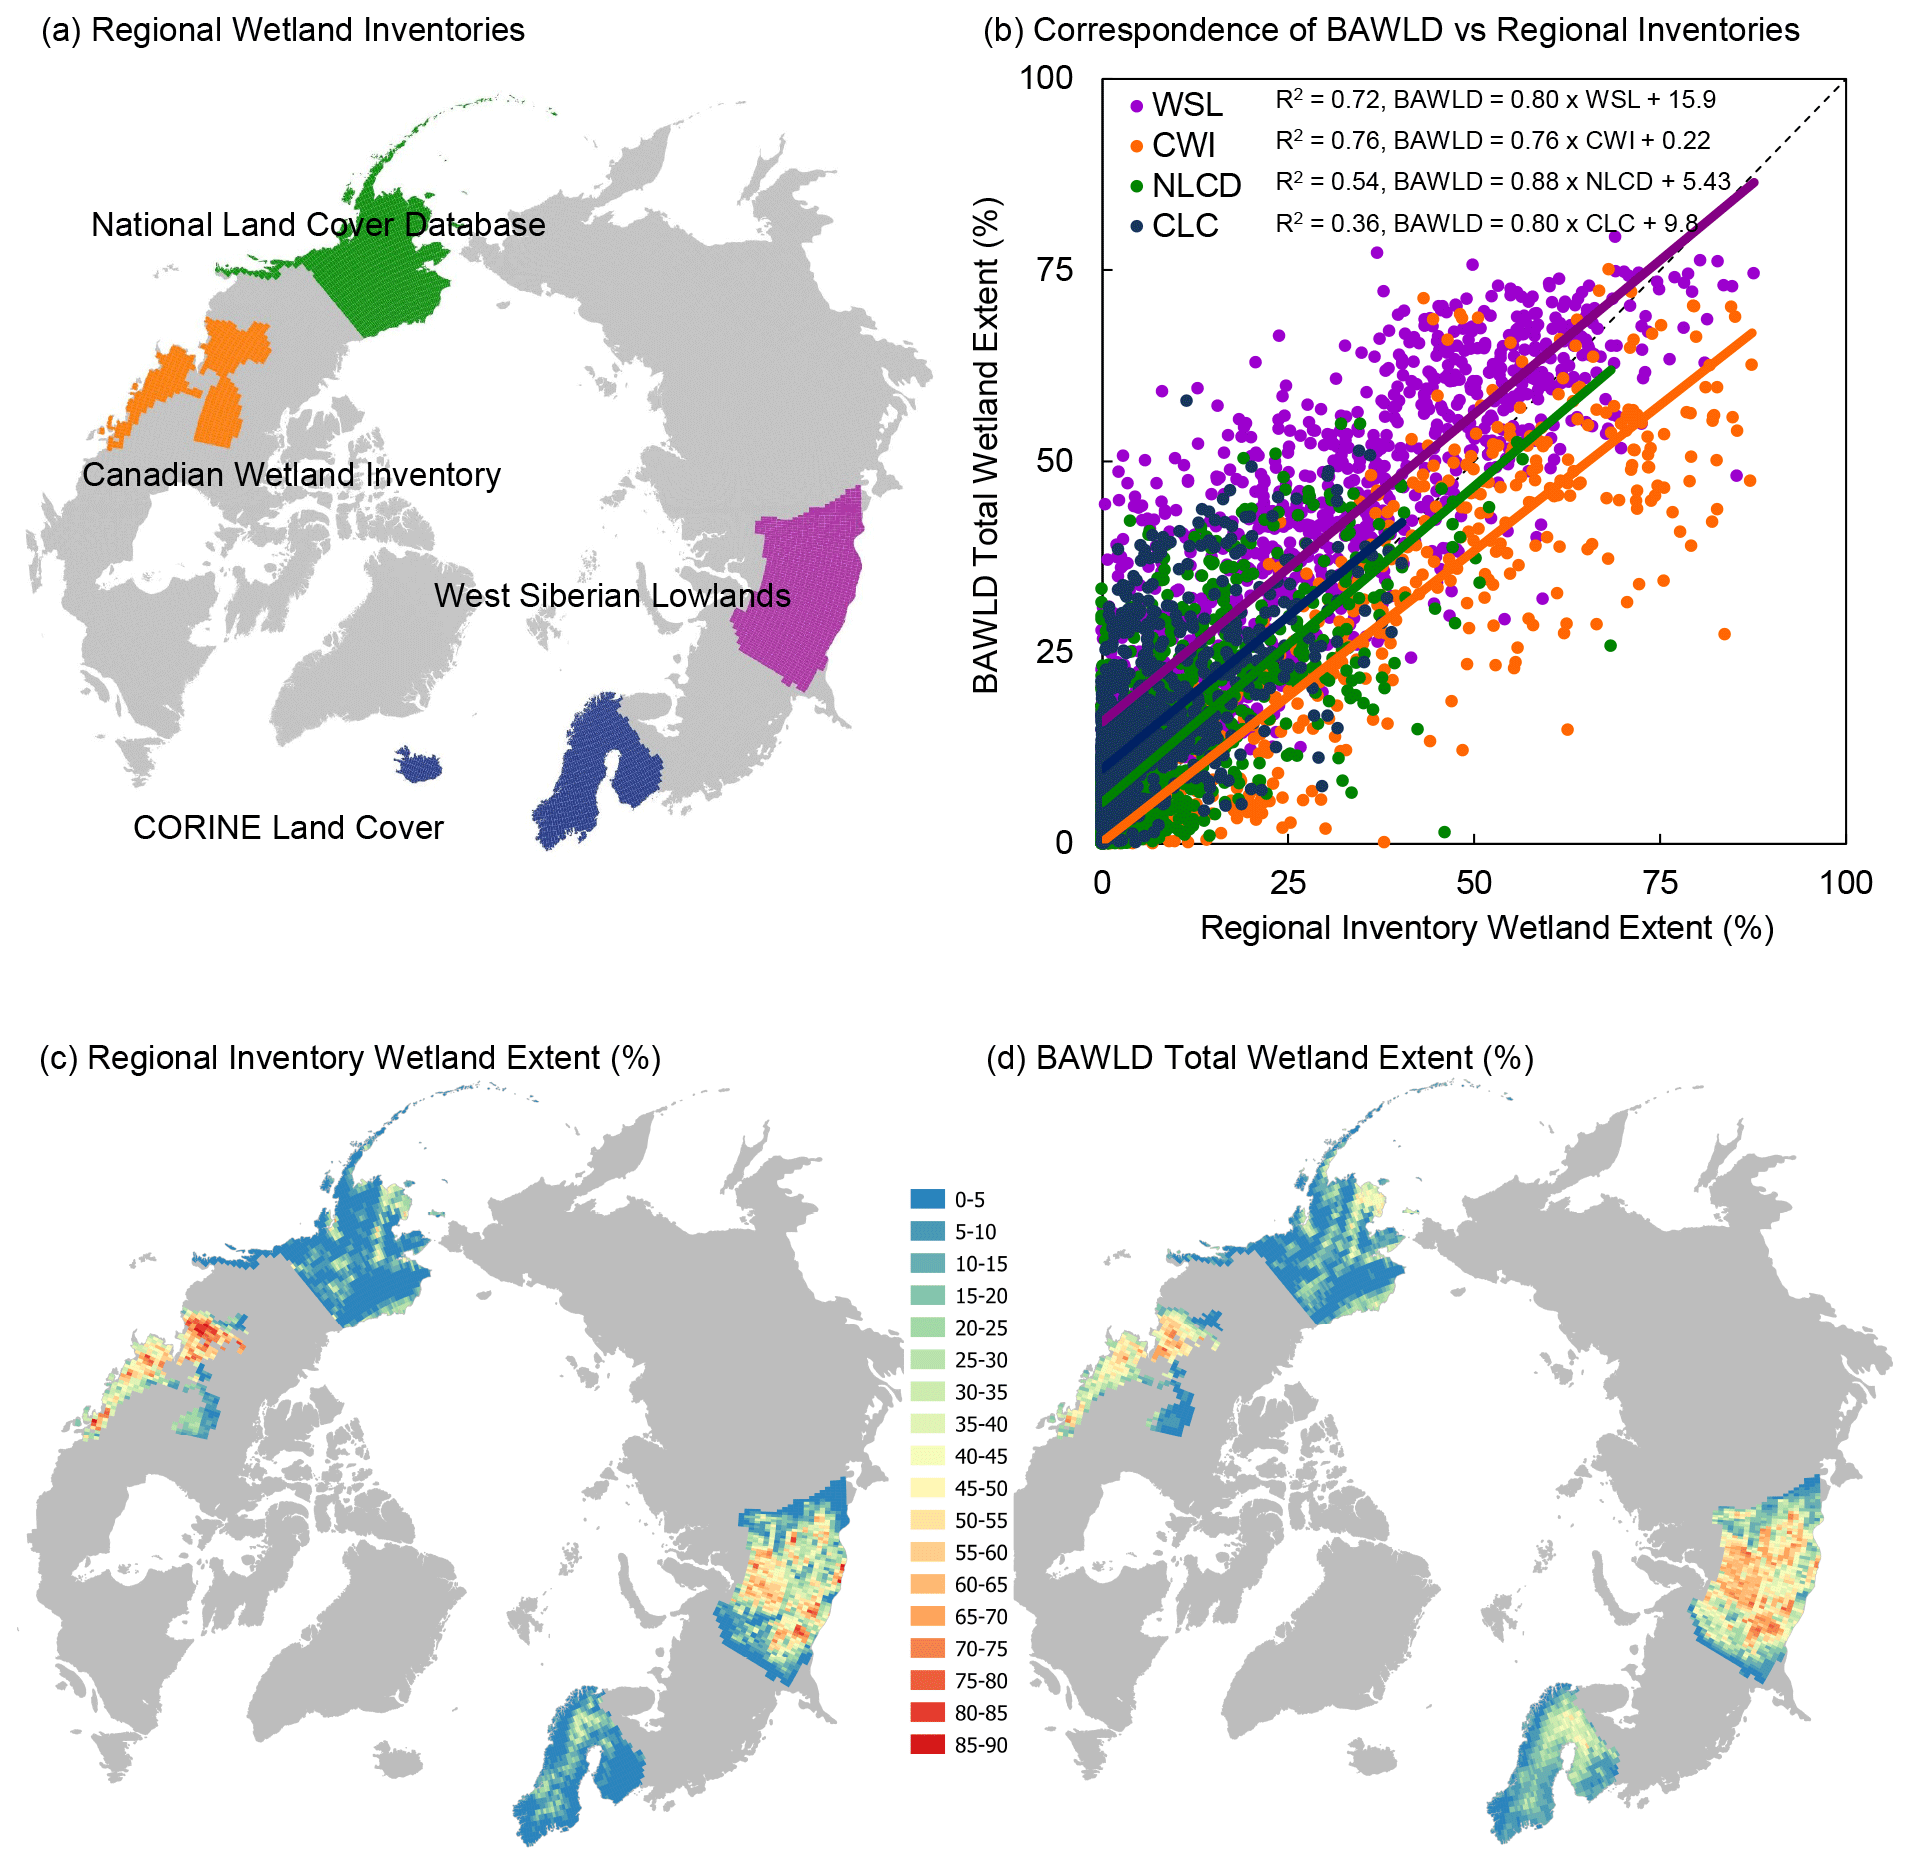
Figure 4Comparison of total wetland extent between BAWLD and four regional independent wetland inventories: the National Land Cover Database (NLCD), the Canadian Wetland Inventory (CWI), the wetland mapping of the West Siberian Lowlands (WSL), and the CORINE Land Cover (CLC) dataset. (a) Spatial extents of the regional datasets, (b) correlations between grid cell wetland coverages in BAWLD and the regional datasets, (c) spatial distribution of total wetland coverages in the four regional datasets, (d) spatial distribution of total wetland coverage in BAWLD for grid cells corresponding with the regional datasets.
The 95 % confidence intervals for predictions of abundance varied both between wetland classes and among regions (Table 3, Figs. S5, S6). The confidence interval for total wetland area was between 2.8 and 3.8 × 10⁶ km2, i.e., a range that represented 31 % of the central estimate. The range of the confidence interval depends both on how much consensus there is among experts in their assessments and how well the available spatial datasets used in the random forest modelling can explain the expert assessments. The considerable range of the confidence interval for wetlands likely stems from a combination of these two components. The confidence interval for total area of individual wetland classes varied between representing 42 % (Fens) and 71 % (Marshes) of respective central estimates. The absolute range of confidence intervals for individual cells generally increased with higher central estimates of abundances, but the range of confidence intervals decreased if expressed as a percent of the central estimate (Fig. S7).
3.2 Lakes
Lakes were predicted to cover a total of 1.44 × 10⁶ km2, or 5.6 % of the BAWLD domain. Large Lakes had the greatest lake area (44 % of total lake area), followed by Midsize Glacial Lakes (26 %) and Midsize Peatland Lakes (10 %) (Table 3). The lake classes with the highest CH4 emissions, Small Yedoma Lakes and Small Peatland Lakes, jointly covered 10 % of the total lake area. The total predicted lake area in BAWLD was higher than the area of lakes in HL (1.20 × 10⁶ km2), which only includes lakes >0.1 km2 and was similar to the area of “open water” in GL30 (1.43 × 10⁶ km2). The “open-water” class in the GL30 dataset is, however, based on Landsat 30 m resolution data and thus excludes very small open-water areas, while it includes both lentic and lotic open water. The 95 % confidence interval for the total lake area in BAWLD was 0.24 × 10⁶ km2, or 17 % of the central estimate.
The predictive models for the three midsize lake classes each explained between 69 % and 75 % of the variability in expert assessments, while a model for the sum of the three midsize lake classes explained 99.1 %. The predictive model for the sum of the three midsize lake classes was almost exclusively influenced by the area of “midsize lakes” in HL, while the three midsize lake classes were differentiated through further influences by the area of “yedoma ground” (Midsize Yedoma Lakes), by the area of “histosols” and “histels” in NCS, and “wetlands” in GL30 (Midsize Peatland Lakes) and by “shoreline length” in HL (Midsize Glacial Lakes). The influence of “shoreline length” for Midsize Glacial Lakes shows that experts associated glacial lakes with high shoreline development and peatland and yedoma lakes with low shoreline development. Despite similarities in how much of the expert assessments were explained by the predictive models (69 %–75 %), the extrapolation to the BAWLD domain led to large differences in the 95 % confidence interval, which represented only 26 % of the central estimate for Midsize Glacial Lakes while representing 69 % and 140 % for Midsize Peatland and Midsize Yedoma Lakes, respectively (Table 3, Fig. S8). Midsize Glacial Lakes were predominately predicted to have high abundances on the Canadian Shield and in Fennoscandia, while Midsize Yedoma Lakes were associated with the lowland, coastal tundra regions of northeastern Siberia and Alaska, and Midsize Peatland Lakes were especially common in the West Siberian Lowlands but also common in the peatland regions of the Hudson Bay Lowlands, the Mackenzie River Basin, and in coastal lowland regions (Fig. 5).

Figure 5Predicted distributions of lake and river classes within the BAWLD domain: (a) Large Lakes, (b) Midsize Glacial Lakes, (c) Midsize Peatland Lakes, (d) Midsize Yedoma Lakes, (e) Small Glacial Lakes, (f) Small Peatland Lakes, (g) Small Yedoma Lakes, (h) Large Rivers, (i) Small Organic-Rich Rivers, (j) Small Organic-Poor Rivers.
Small Glacial, Yedoma, and Peatland Lakes were jointly estimated to cover 0.9 % of the BAWLD domain. The predictive models explained 16 %, 39 %, and 66 % of the variability in the expert assessments, respectively (Table 2). The relatively lower predictive power for small lakes was not unexpected given the lack of information on the smallest open-water systems in the available spatial data, the variable abundance of very small open-water systems among landscapes (Muster et al., 2019), and a lower relative consensus among experts when assessing classes with generally small fractional coverages. Models for all three small lake classes were influenced by the area of “occasional inundation” in GSW but were then differentiated by variables largely similar to those that were characteristic of the corresponding midsize lake classes (Table 2). The predicted distributions of the small lake classes were also largely similar to that of the corresponding midsize lake type classes (Fig. 5). The overall predicted area of small lakes was 0.24 × 10⁶ km2, representing 17 % of the total lake area. The combined 95 % uncertainty for the three classes ranged between 0.15 and 0.38 × 10⁶ km2 (Table 3, Fig. S8), suggesting that small lakes represent between 11 and 26 % of the total lake area. Previous assessments have estimated that open-water ecosystems < 0.1 km2 represent between 21 and 31 % of global lake area (Holgerson and Raymond, 2016) but relied on assumptions in the statistical modelling which may lead to bias for boreal and arctic regions (Cael and Seekell, 2016; Muster et al., 2019).
3.3 Rivers
Rivers were predicted to cover a total of 0.12 × 10⁶ km2, or 0.47 % of the BAWLD domain. Large Rivers accounted for 65 % of the total river area in BAWLD. These estimates were similar to global assessments, where streams and rivers have been estimated to cover between 0.30 % and 0.56 % of the land area, with 65 % of the river area consisting of large rivers of sixth or greater stream order (Downing et al., 2012). The predictive model for Large Rivers was strongly influenced by the area of “large rivers” in GLWD, but experts consistently made lower assessments which led to an overall 15 % lower area of Large Rivers compared to the area of rivers in GLWD within the BAWLD domain.
Small Organic-Poor and Small Organic-Rich Rivers were estimated to represent 27 % and 8 %, respectively, of the total river area. The predictive models for the Small Organic-Poor and Organic-Rich Rivers explained 19 % and 59 % of the expert assessments and were distinctly influenced by the area of “occasional inundation” in GSW and “wetlands” in GLC30, respectively. The estimated area of small rivers varied among experts, reflecting difficulties in consistent assessments among experts for land cover classes with low extents (<1 % in most grid cells). The distributions of expert assessments for small river areas were non-normal, leading to a long upper tail for the 95 % confidence interval (Fig. S9). For example, the low, central, and high estimates for the area of Small Organic-Rich Rivers were 0.005, 0.10, and 0.54 × 10⁶ km2, respectively. The predicted distributions showed that the Small Organic-Rich Rivers class was closely associated with the distribution of the BAWLD wetland classes, while Small Organic-Poor Rivers dominated elsewhere, with especially high abundances in regions with higher mean annual precipitation (Fig. 5).
3.4 Other classes
Boreal Forest, Dry Tundra, Rocklands, and Glaciers were predicted to cover 10.7, 5.3, 2.7, and 2.1 × 10⁶ km2, respectively, within the BAWLD domain (Fig. S10). The predictive models explained between 96 % (Glaciers) and 67 % (Rocklands) of the variability in expert assessments. While the predictive models for Glaciers were almost exclusively influenced by the area of “permanent snow and ice” in GL30, several variables influenced predictions of Rocklands – including area of “rocklands” in NCS, “mountainous” and “rugged” terrain in PZI, and “barrens” in CAVM. The predictive models for Boreal Forest and Tundra suggested that the transition between these classes was strongly influenced by the area “forest” in GLC2 and by the distinction between “tundra” and “boreal” terrestrial ecoregions in TEW.
3.5 Wetscapes
We defined “wetscapes” as regions with characteristic composition of specific wetland, lake, and river classes. Our clustering analysis distinguished 15 typical wetscapes within the BAWLD domain (Fig. 6), each defined by the relative presence or absence of the 19 BAWLD classes (Table S1). Visualizing the distribution of wetscapes provides information on regions that are likely to have similarities in the magnitude, seasonality, and climatic controls over CH4 emissions.
Three wetscapes common in boreal regions were differentiated based on the abundance of non-permafrost wetlands. The Sparse, Common, and Dominant Boreal Wetlands wetscapes all had limited lake coverage (<6 % on average) but had 15 %, 35 %, and 60 % combined coverages of Bogs, Fens, and Marshes, respectively. The Dominant Boreal Wetlands wetscape was almost exclusive to the non-permafrost regions of the Hudson Bay Lowlands and the West Siberian Lowlands. The Common Boreal Wetlands wetscape was more widespread, found adjacent to the core areas of the Hudson Bay Lowlands and the West Siberian Lowlands but also in the Mackenzie River Basin, northern Finland, European Russia, and in the Kamchatka Lowlands. The Sparse Boreal Wetlands wetscape was widespread in Sweden, Finland, European Russia, and the southern boreal regions of Canada outside of Yukon. Emissions of CH4 from these regions are likely dominated by wetlands rather than lakes, with main sensitivity to climate change being altered water balance (Tarnocai, 2006; Olefeldt et al., 2017; Olson et al., 2013).
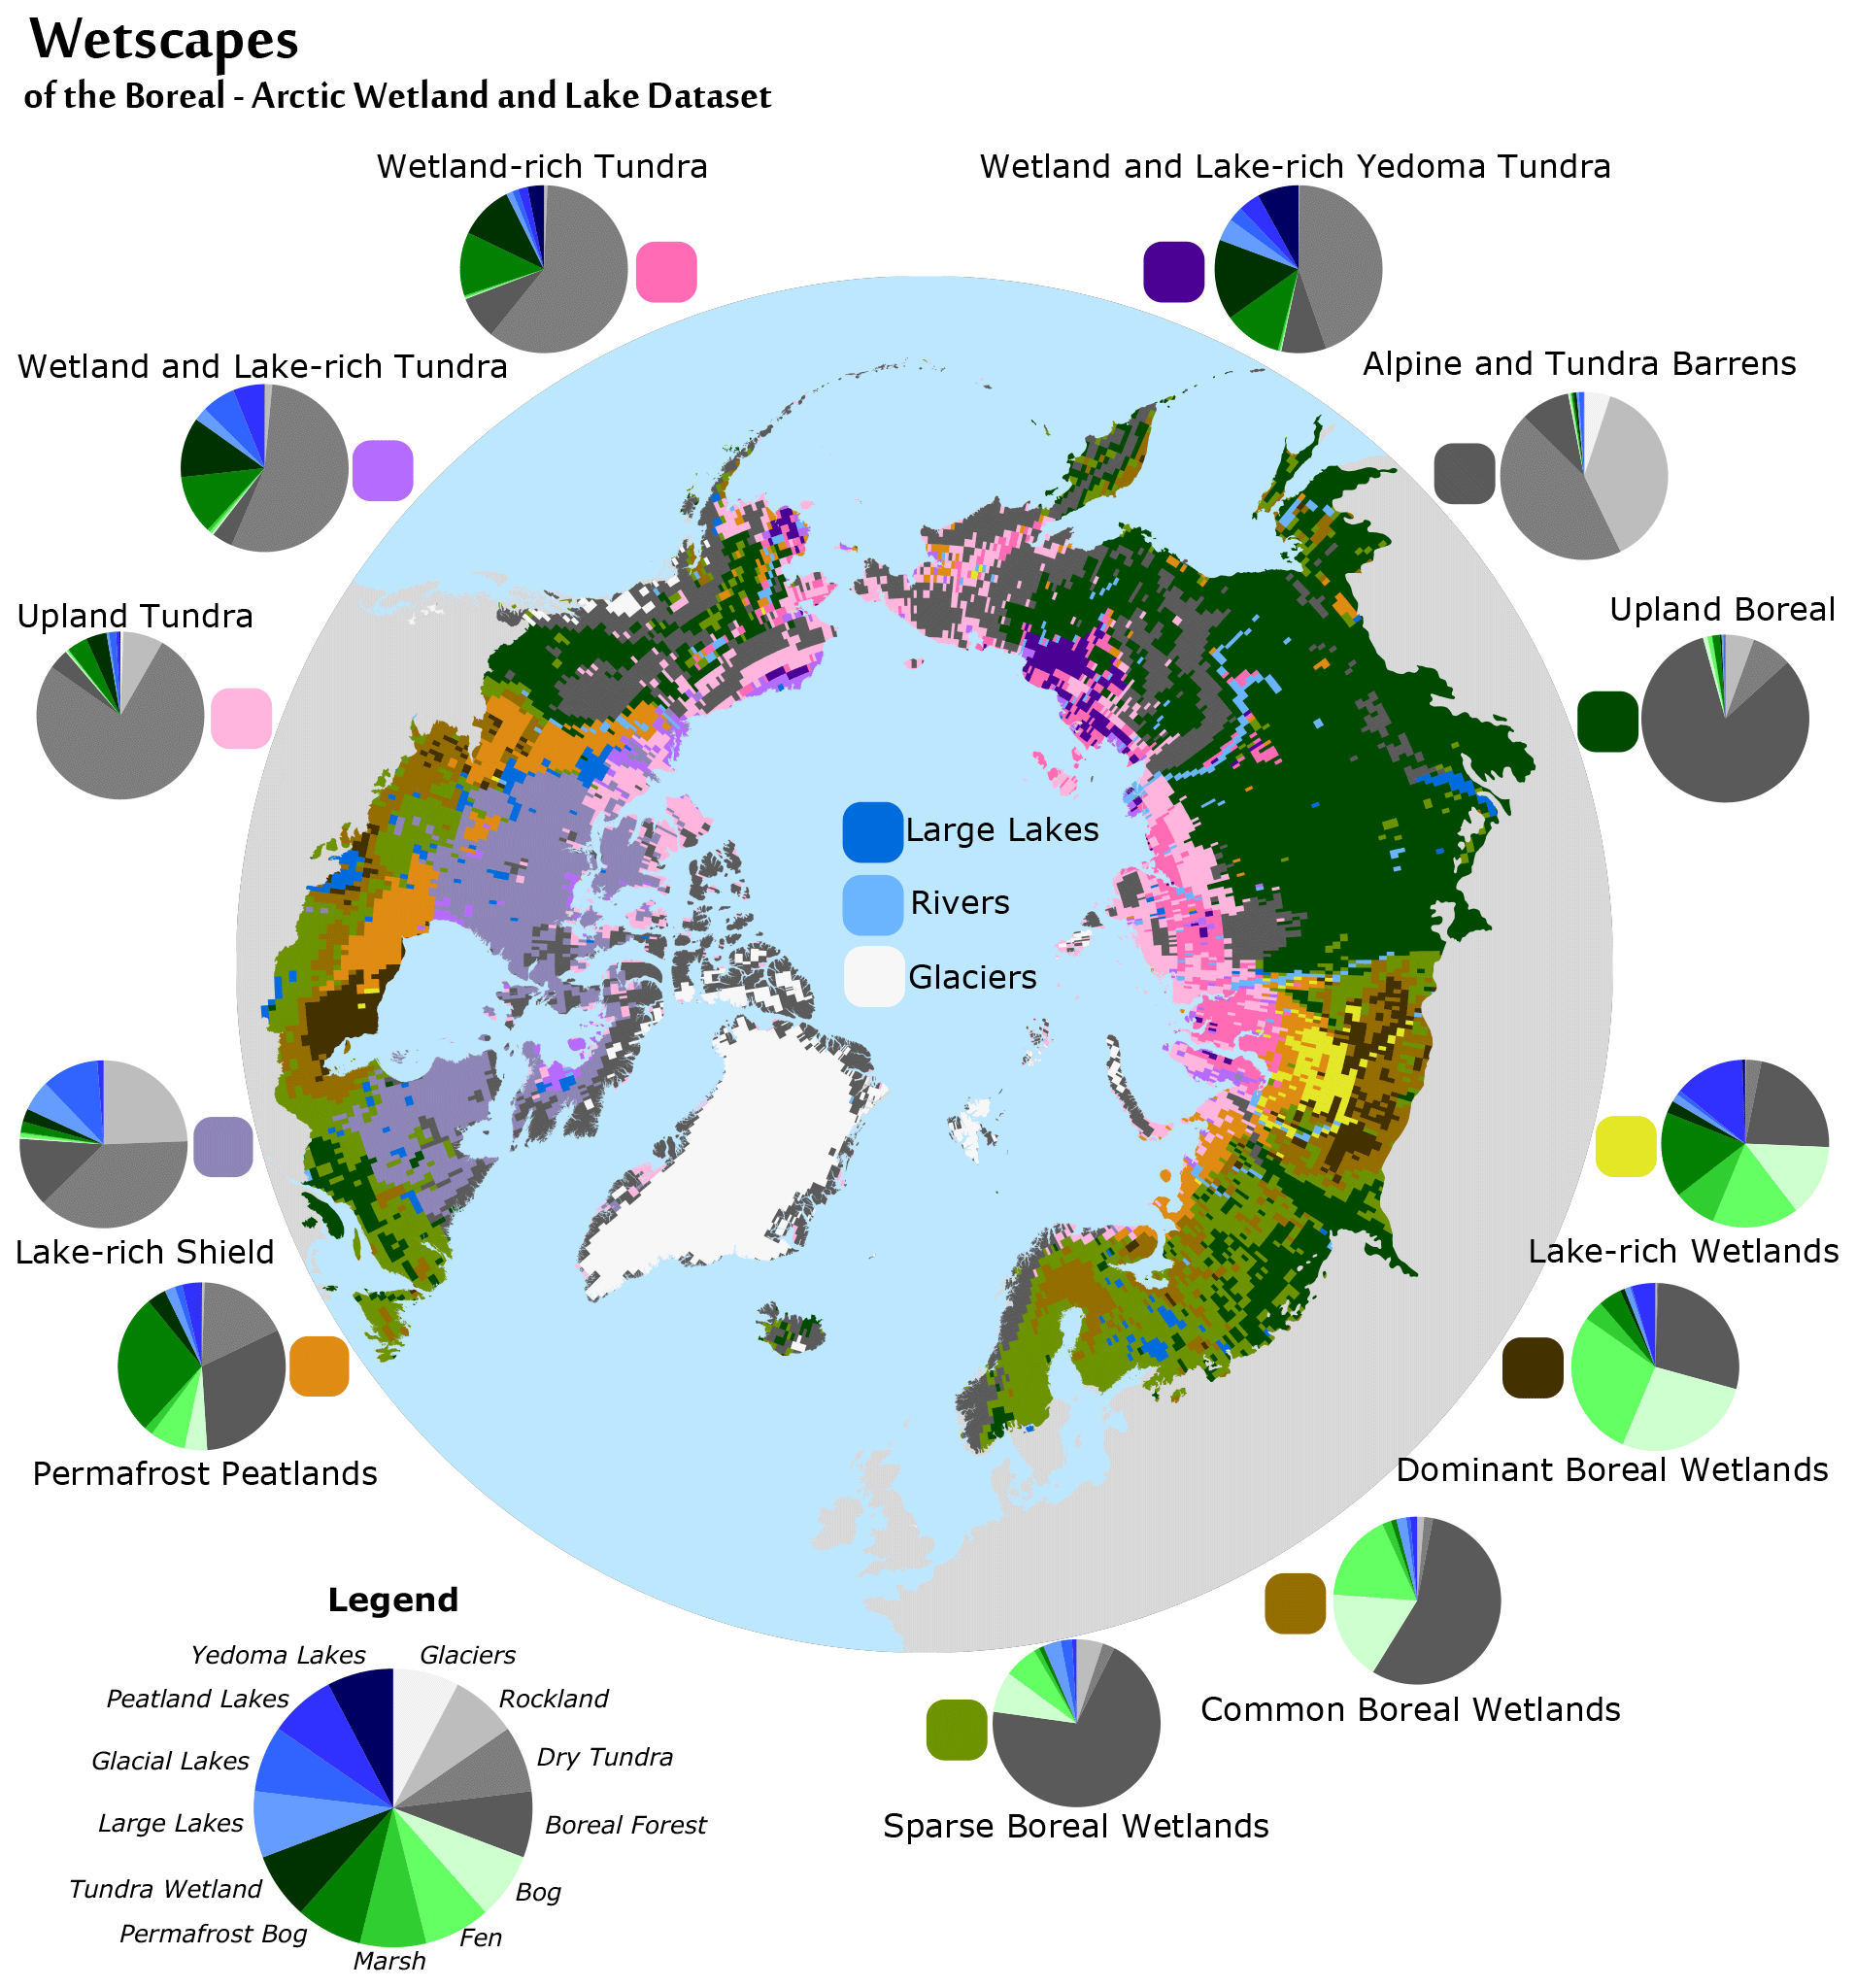
Figure 6Wetscapes of the Boreal–Arctic Wetland and Lake Dataset. Wetscapes are defined by their characteristic composition of the BAWLD land cover classes and thus group regions with similar abundances (or absences) of specific wetland, lake, and river classes. The 15 wetscapes have their average land cover composition indicated by pie charts, with the legend shown in the bottom left. For clarity, the small and midsized lake classes were combined for glacial, peatland, and yedoma lakes, and the river classes were omitted from the pie charts. No land cover pie charts are shown for the Large Lakes, Rivers, and Glaciers wetscapes.
The Lake-Rich Peatlands and the Permafrost Peatlands wetscapes were both found in lowland regions with discontinuous permafrost, near the boreal-to-tundra transition. The Lake-Rich Peatlands wetscape was almost exclusively found in the West Siberian Lowlands, north of the Ob River. This wetscape was characterized by roughly equal abundances of Bogs, Fens, and Permafrost Bogs (each 14 %–16 %), along with 8 % Marshes, 9 % Small Peatland Lakes, and 5 % Midsize Peatland Lakes. It is notable that this wetscape, with the highest coverages of high-CH4-emitting marshes and peatland lakes, has no presence in North America. The Permafrost Peatlands wetscape was conversely primarily found in the Hudson Bay Lowlands and the Mackenzie River Basin, with additional coverage along the Arctic Ocean coast in European Russia, in interior Alaska, and in the Anadyr Lowlands of far-eastern Russia. This wetscape had the greatest abundance of Permafrost Bogs (27 %), with less contribution from other wetland classes (16 %) and relatively low abundance of lakes (7 %). The Lake-Rich Peatlands wetscape likely has the highest regional CH4 emissions, while the Permafrost Peatlands wetscape likely has low to moderate emissions. However, CH4 emissions from both these wetscapes are likely highly sensitive to climate change due to the rapid ongoing and future permafrost thaw that causes expansion of thermokarst lakes and non-permafrost wetlands at the expense of Permafrost Bogs (Bäckstrand et al., 2008; Turetsky et al., 2002).
Three wetscapes were found in lowland tundra regions and varied in relative dominance of different wetland and lake classes. Wetland-Rich Tundra had 23 % wetlands but only 7 % lakes and was found on the Gydan and Taymyr peninsulas in northern Siberia, with minor extents in far-eastern Siberia and in Alaska. Wetland- and Lake-Rich Tundra had similar wetland cover (24 %) but twice the coverage of lakes (15 %), split equally between glacial and peatland lakes. It was found on the Alaska North Slope along with minor extents on the Yamal Peninsula, the Mackenzie River Delta, and on sections of Baffin Island. Lastly, the Wetland- and Lake-Rich Yedoma Tundra was characterized by the highest abundance of yedoma lakes (8 %) and a total wetland and lake coverage of 46 % and was primarily found in the Kolyma Lowlands, with minor extents in the Yukon–Kuskokwim Delta and on the Alaska North Slope. These regions may have sensitive CH4 emissions, particularly associated with thermokarst lake expansion where highly labile yedoma sediments fuel high CH4 production (Walter Anthony et al., 2016).
The remaining seven wetscapes are likely to have overall low CH4 emissions, or even net uptake, resulting from either the dominance of low-CH4-emitting classes or the relative absence of wetland and lake classes. The Dry Tundra wetscape was common in regions of undulating topography of northernmost Siberia, the Alaska North Slope, and the western Canadian arctic and was characterized by relatively low abundances of wetlands (9 %) and lakes (3 %). The Lake-Rich Shield wetscape was exclusive to the Canadian Shield, and although it had a high abundance of lakes (18 %), these were almost completely dominated by low-CH4-emitting large lakes and glacial lakes. The Upland Boreal wetscape dominates boreal regions of Siberia but is also found in the Yukon, Alaska, and Quebec and was defined by having <5 % wetlands and 0.5 % lakes. The Alpine and Tundra Barrens wetscape had <2 % wetlands and ∼ 1.5 % lakes and dominates the Greenland coast; the high-latitude polar deserts of the Canadian Arctic Archipelago; and the mountain ranges in Fennoscandia, Alaska, Yukon, and eastern Siberia. Lastly, the Glaciers, Large Lakes, and Large Rivers wetscapes were defined by the dominance of the namesake BAWLD classes.
The fractional land cover estimates from the Boreal–Arctic Wetland and Lake Dataset (BAWLD) are freely available at the Arctic Data Center (Olefeldt et al., 2021): https://doi.org/10.18739/A2C824F9X. The dataset is provided as an ESRI shapefile (.shp) and as a Keyhole Markup Language (.kml) file.
The Boreal–Arctic Wetland and Lake Dataset (BAWLD) was developed to provide improved estimates of areal extents of five wetland classes, seven lentic ecosystem classes, and three lotic ecosystem classes by leveraging expert knowledge along with available spatial data. By differentiating between wetland, lake, and river classes with distinct characteristics, BAWLD will be suitable to support large-scale modelling of high-latitude hydrological and biogeochemical impacts of climate change. In particular, BAWLD has been developed with the aim to facilitate improved modelling of current and future CH4 emissions. For example, a companion dataset of empirical CH4 data (BAWLD-CH4) (Kuhn et al., 2021) was co-developed with BAWLD, ensuring that the land cover classification was meaningful for the separation of classes based on distinct magnitudes and controls of CH4 emissions. Future assessments of boreal–arctic CH4 emissions based on combined use of the BAWLD and BAWLD-CH4 datasets will thus provide several refinements compared to previous bottom-up estimates. In the future, higher-spatial-resolution circumpolar wetland maps could be produced with machine learning models and predictors calculated from multiple remote sensing data sources, such as Sentinel-1 synthetic aperture radar (SAR), optical Sentinel-2 and Landsat 8, and ArcticDEM topographic data. However, the production of such maps would require spatially extensive field inventory data, thorough expert assessment, or accurate local wetland maps as training and validation data. By being based on expert assessment and an existing spatial dataset rather than a remote sensing approach, BAWLD was able to provide predictions for abundance of high-CH4-emitting wetland and lake classes that have limited extents but disproportionate influences on regional and overall CH4 emission (i.e., account for landscape CH4 hotspots). Using BAWLD for upscaling of CH4 emissions will reduce issues of representativeness of empirical data for upscaling, reduce the risk of overlap between wetland and lake classes, and allow for more rigorous uncertainty analysis.
The supplement related to this article is available online at: https://doi.org/10.5194/essd-13-5127-2021-supplement.
This study was conceived by DO. The GIS work was done by MH. The information sent to experts to complete the expert assessment was compiled by DO, MH, and MAK. All co-authors completed the expert assessment. The random forest modelling was led by DO, with input from TB, AR, and MJL. Data analysis and visualizations were led by DO with input from all co-authors. The manuscript was written by DO with contributions from all co-authors.
The contact author has declared that neither they nor their co-authors have any competing interests.
Publisher’s note: Copernicus Publications remains neutral with regard to jurisdictional claims in published maps and institutional affiliations.
This project was supported by the Permafrost Carbon Network.
Financial support to David Olefeldt was provided the National Science and Engineering Research Council of Canada (NSERC) Discovery grant (RGPIN-2016-04688) and the Campus Alberta Innovates Program. Claire Treat was supported by the ERC (no.851181) and the Helmholtz Impulse and Networking Fund. Avni Malhotra was supported by the Gordon and Betty Moore Foundation (grant GBMF5439, 839; Stanford University). David Bastviken was supported by the ERC (no.725546), the Swedish Research Council VR (no.2016-04829), and FORMAS (no.2018-01794). Frans-Jan W. Parmentier was supported by the Norwegian Research Council under grant agreement 274711 and the Swedish Research Council under registration no. 2017-05268. Guido Grosse was supported through the BMBF KoPf Synthesis project (03F0834B). Jennifer D. Watts was supported by NASA Earth Science (NNH17ZDA001N). Mark J. Lara was supported by NSF-EnvE (no.1928048). Maria Strack was supported by the Natural Sciences and Engineering Research Council of Canada (NSERC) through the Canada Research Chairs program. Ruth K. Varner was supported by the National Aeronautics and Space Administration IDS program (NASA grant NNX17AK10G). Sarah A. Finkelstein was supported by the Natural Sciences and Engineering Research Council of Canada. Suzanne E. Tank was supported by funding from the Campus Alberta Innovates Program. Ducks Unlimited Canada's wetland inventories were funded by various partnering organizations: Environment and Climate Change Canada, Canadian Space Agency, Government of Alberta, Government of Saskatchewan, US Forest Service, US Fish and Wildlife Service, PEW Charitable Trusts, Canadian Boreal Initiative, Alberta-Pacific Forest Industries Inc., Mistik Management Ltd., Louisiana-Pacific, Forest Products Association of Canada, Weyerhaeuser, Lakeland Industry and Community, Encana, Imperial Oil, Devon Energy Corporation, Shell Canada Energy, Suncor Foundation, Treaty 8 Tribal Corporation (“Akaitcho”), and Dehcho First Nations. The Permafrost Carbon Network provided coordination support and is funded by the NSF PLR Arctic System Science Research Networking Activities (RNA) Permafrost Carbon Network: Synthesizing Flux Observations for Benchmarking Model Projections of Permafrost Carbon Exchange (grant no. 1931333 (2019–2023)).
This paper was edited by David Carlson and reviewed by three anonymous referees.
Abbott, B. W., Jones, J. B., Schuur, E. A. G., III, F. S. C., Bowden, W. B., Bret-Harte, M. S., Epstein, H. E., Flannigan, M. D., Harms, T. K., Hollingsworth, T. N., Mack, M. C., McGuire, A. D., Natali, S. M., Rocha, A. V., Tank, S. E., Turetsky, M. R., Vonk, J. E., Wickland, K. P., Aiken, G. R., Alexander, H. D., Amon, R. M. W., Benscoter, B. W., Yves Bergeron, Bishop, K., Blarquez, O., Bond-Lamberty, B., Breen, A. L., Buffam, I., Yihua Cai, Carcaillet, C., Carey, S. K., Chen, J. M., Chen, H. Y. H., Christensen, T. R., Cooper, L. W., Cornelissen, J. H. C., Groot, W. J. de, DeLuca, T. H., Dorrepaal, E., Fetcher, N., Finlay, J. C., Forbes, B. C., French, N. H. F., Gauthier, S., Girardin, M. P., Goetz, S. J., Goldammer, J. G., Gough, L., Grogan, P., Guo, L., Higuera, P. E., Hinzman, L., Hu, F. S., Gustaf Hugelius, Jafarov, E. E., Jandt, R., Johnstone, J. F., Karlsson, J., Kasischke, E. S., Gerhard Kattner, Kelly, R., Keuper, F., Kling, G. W., Kortelainen, P., Kouki, J., Kuhry, P., Hjalmar Laudon, Laurion, I., Macdonald, R. W., Mann, P. J., Martikainen, P. J., McClelland, J. W., Ulf Molau, Oberbauer, S. F., Olefeldt, D., Paré, D., Parisien, M.-A., Payette, S., Changhui Peng, Pokrovsky, O. S., Rastetter, E. B., Raymond, P. A., Raynolds, M. K., Rein, G., Reynolds, J. F., Robards, M., Rogers, B. M., Schädel, C., Schaefer, K., Schmidt, I. K., Anatoly Shvidenko, Sky, J., Spencer, R. G. M., Starr, G., Striegl, R. G., Teisserenc, R., Tranvik, L. J., Virtanen, T., Welker, J. M., and Zimov, S.: Biomass offsets little or none of permafrost carbon release from soils, streams, and wildfire: an expert assessment, Environ. Res. Lett., 11, 034014, https://doi.org/10.1088/1748-9326/11/3/034014, 2016.
Bäckstrand, K., Crill, P. M., Mastepanov, M., Christensen, T. R., and Bastviken, D.: Total hydrocarbon flux dynamics at a subarctic mire in northern Sweden, J. Geophys. Res.-Biogeo., 113, G03026, https://doi.org/10.1029/2008JG000703, 2008.
Bartholomé, E. and Belward, A. S.: GLC2000: a new approach to global land cover mapping from Earth observation data, Int. J. Remote Sens., 26, 1959–1977, https://doi.org/10.1080/01431160412331291297, 2005.
Bastviken, D., Cole, J., Pace, M., and Tranvik, L.: Methane emissions from lakes: Dependence of lake characteristics, two regional assessments, and a global estimate, Global Biogeochem. Cy., 18, GB4009, https://doi.org/10.1029/2004GB002238, 2004.
Beck, H. E., Pan, M., Miralles, D. G., Reichle, R. H., Dorigo, W. A., Hahn, S., Sheffield, J., Karthikeyan, L., Balsamo, G., Parinussa, R. M., van Dijk, A. I. J. M., Du, J., Kimball, J. S., Vergopolan, N., and Wood, E. F.: Evaluation of 18 satellite- and model-based soil moisture products using in situ measurements from 826 sensors, Hydrol. Earth Syst. Sci., 25, 17–40, https://doi.org/10.5194/hess-25-17-2021, 2021.
Bohn, T. J., Melton, J. R., Ito, A., Kleinen, T., Spahni, R., Stocker, B. D., Zhang, B., Zhu, X., Schroeder, R., Glagolev, M. V., Maksyutov, S., Brovkin, V., Chen, G., Denisov, S. N., Eliseev, A. V., Gallego-Sala, A., McDonald, K. C., Rawlins, M. A., Riley, W. J., Subin, Z. M., Tian, H., Zhuang, Q., and Kaplan, J. O.: WETCHIMP-WSL: intercomparison of wetland methane emissions models over West Siberia, Biogeosciences, 12, 3321–3349, https://doi.org/10.5194/bg-12-3321-2015, 2015.
Bridgham, S. D., Cadillo-Quiroz, H., Keller, J. K., and Zhuang, Q.: Methane emissions from wetlands: biogeochemical, microbial, and modeling perspectives from local to global scales, Glob. Change Biol., 19, 1325–1346, https://doi.org/10.1111/gcb.12131, 2013.
Brosius, L. S., Anthony, K. M. W., Treat, C. C., Lenz, J., Jones, M. C., Bret-Harte, M. S., and Grosse, G.: Spatiotemporal patterns of northern lake formation since the Last Glacial Maximum, Quaternary Sci. Rev., 253, 106773, https://doi.org/10.1016/j.quascirev.2020.106773, 2021.
Brown, J., Ferrians, O., Heginbottom, J. A., and Melnikov, E.: Circum-Arctic Map of Permafrost and Ground-Ice Conditions, Version 2. Boulder, Colorado USA, NSIDC, National Snow and Ice Data Center, https://doi.org/10.7265/skbg-kf16, 2002.
Bruhwiler, L., Parmentier, F.-J. W., Crill, P., Leonard, M., and Palmer, P. I.: The Arctic Carbon Cycle and Its Response to Changing Climate, Curr. Clim. Change Rep., 7, 14–34, https://doi.org/10.1007/s40641-020-00169-5, 2021.
Bryn, A., Strand, G.-H., Angeloff, M., and Rekdal, Y.: Land cover in Norway based on an area frame survey of vegetation types, Norwegian J. Geogr., 72, 131–145, https://doi.org/10.1080/00291951.2018.1468356, 2018.
Bubier, J. L., Moore, T. R., Bellisario, L., Comer, N. T., and Crill, P. M.: Ecological controls on methane emissions from a Northern Peatland Complex in the zone of discontinuous permafrost, Manitoba, Canada, Global Biogeochem. Cy., 9, 455–470, https://doi.org/10.1029/95GB02379, 1995.
Büttner, G.: CORINE Land Cover and Land Cover Change Products, in: Land Use and Land Cover Mapping in Europe: Practices & Trends, edited by: Manakos, I. and Braun, M., Springer Netherlands, Dordrecht, 55–74, https://doi.org/10.1007/978-94-007-7969-3_5, 2014.
Cael, B. B. and Seekell, D. A.: The size-distribution of Earth's lakes, Sci. Rep.-UK, 6, 29633, https://doi.org/10.1038/srep29633, 2016.
Canada Committee on Ecological (Biophysical) Land Classification, National Wetlands Working Group, Warner, B. G., and Rubec, C. D. A.: The Canadian wetland classification system, Wetlands Research Branch, University of Waterloo, Waterloo, Ont., 1997.
Canadian Wetland Inventory Technical Committee: Canadian Wetland Inventory (Data Model), version 7.0, prepared by the Canadian Wetland Inventory Technical Committee, available at: http://www.ducks.ca/initiatives/canadian-wetland-inventory/ (last access: 31 October 2021), 2016.
CAVM Team: Circumpolar Arctic Vegetation Map (1 : 7,500,000 scale), Conservation of Arctic Flora and Fauna (CAFF) Map No. 1, U.S. Fish and Wildlife Service, Anchorage, Alaska, ISBN: 0-9767525-0-6, ISBN-13: 978-0-9767525-0-9, 2003.
Chasmer, L., Mahoney, C., Millard, K., Nelson, K., Peters, D., Merchant, M., Hopkinson, C., Brisco, B., Niemann, O., Montgomery, J., Devito, K., and Cobbaert, D.: Remote Sensing of Boreal Wetlands 2: Methods for Evaluating Boreal Wetland Ecosystem State and Drivers of Change, Remote Sens., 12, 1321, https://doi.org/10.3390/rs12081321, 2020.
Chen, J., Chen, J., Liao, A., Cao, X., Chen, L., Chen, X., He, C., Han, G., Peng, S., Lu, M., Zhang, W., Tong, X., and Mills, J.: Global land cover mapping at 30 m resolution: A POK-based operational approach, ISPRS J. Photogramm., 103, 7–27, https://doi.org/10.1016/j.isprsjprs.2014.09.002, 2015.
Chen, Y., Hu, F. S., and Lara, M. J.: Divergent shrub-cover responses driven by climate, wildfire, and permafrost interactions in Arctic tundra ecosystems, Glob. Change Biol., 27, 652–663, https://doi.org/10.1111/gcb.15451, 2021.
Cooley, S. W., Smith, L. C., Stepan, L., and Mascaro, J.: Tracking Dynamic Northern Surface Water Changes with High-Frequency Planet CubeSat Imagery, Remote Sens., 9, 1306, https://doi.org/10.3390/rs9121306, 2017.
Downing, J. A., Cole, J. J., Duarte, C. M., Middelburg, J. J., Melack, J. M., Prairie, Y. T., Kortelainen, P., Striegl, R. G., McDowell, W. H., and Tranvik, L. J.: Global abundance and size distribution of streams and rivers, Inland Waters, 2, 229–236, https://doi.org/10.5268/IW-2.4.502, 2012.
Duncan, B. N., Ott, L. E., Abshire, J. B., Brucker, L., Carroll, M. L., Carton, J., Comiso, J. C., Dinnat, E. P., Forbes, B. C., Gonsamo, A., Gregg, W. W., Hall, D. K., Ialongo, I., Jandt, R., Kahn, R. A., Karpechko, A., Kawa, S. R., Kato, S., Kumpula, T., Kyrölä, E., Loboda, T. V., McDonald, K. C., Montesano, P. M., Nassar, R., Neigh, C. S. R., Parkinson, C. L., Poulter, B., Pulliainen, J., Rautiainen, K., Rogers, B. M., Rousseaux, C. S., Soja, A. J., Steiner, N., Tamminen, J., Taylor, P. C., Tzortziou, M. A., Virta, H., Wang, J. S., Watts, J. D., Winker, D. M., and Wu, D. L.: Space-Based Observations for Understanding Changes in the Arctic-Boreal Zone, Rev. Geophys., 58, e2019RG000652, https://doi.org/10.1029/2019RG000652, 2020.
Fick, S. E. and Hijmans, R. J.: WorldClim 2: new 1-km spatial resolution climate surfaces for global land areas, Int. J. Climatol., 37, 4302–4315, https://doi.org/10.1002/joc.5086, 2017.
Fluet-Chouinard, E., Lehner, B., Rebelo, L.-M., Papa, F., and Hamilton, S. K.: Development of a global inundation map at high spatial resolution from topographic downscaling of coarse-scale remote sensing data, Remote Sens. Environ., 158, 348–361, https://doi.org/10.1016/j.rse.2014.10.015, 2015.
Glagolev, M., Kleptsova, I., Filippov, I., Maksyutov, S., and Machida, T.: Regional methane emission from West Siberia mire landscapes, Environ. Res. Lett., 6, 045214, https://doi.org/10.1088/1748-9326/6/4/045214, 2011.
Glaser, P. H., Siegel, D. I., Reeve, A. S., Janssens, J. A., and Janecky, D. R.: Tectonic drivers for vegetation patterning and landscape evolution in the Albany River region of the Hudson Bay Lowlands, J. Ecol., 92, 1054–1070, https://doi.org/10.1111/j.0022-0477.2004.00930.x, 2004.
Grosse, G., Jones, B., and Arp, C.: 8.21 Thermokarst Lakes, Drainage, and Drained Basins, in: Treatise on Geomorphology, edited by: Shroder, J. F., Academic Press, San Diego, 325–353, https://doi.org/10.1016/B978-0-12-374739-6.00216-5, 2013.
Gruber, S.: Derivation and analysis of a high-resolution estimate of global permafrost zonation, The Cryosphere, 6, 221–233, https://doi.org/10.5194/tc-6-221-2012, 2012.
Gunnarsson, U., Löfroth, M., and Sandring, S.: The Swedish wetland survey: compiled excerpts from the national final report, Swedish Environmental Protection Agency, Stockholm, 37 pp., 2014.
Heikkinen, J. E. P., Virtanen, T., Huttunen, J. T., Elsakov, V., and Martikainen, P. J.: Carbon balance in East European tundra, Global Biogeochem. Cy., 18, GB1023, https://doi.org/10.1029/2003GB002054, 2004.
Heiskanen, L., Tuovinen, J.-P., Räsänen, A., Virtanen, T., Juutinen, S., Lohila, A., Penttilä, T., Linkosalmi, M., Mikola, J., Laurila, T., and Aurela, M.: Carbon dioxide and methane exchange of a patterned subarctic fen during two contrasting growing seasons, Biogeosciences, 18, 873–896, https://doi.org/10.5194/bg-18-873-2021, 2021.
Helbig, M., Pappas, C., and Sonnentag, O.: Permafrost thaw and wildfire: Equally important drivers of boreal tree cover changes in the Taiga Plains, Canada, Geophys. Res. Lett., 43, 1598–1606, https://doi.org/10.1002/2015GL067193, 2016.
Heslop, J. K., Walter Anthony, K. M., Winkel, M., Sepulveda-Jauregui, A., Martinez-Cruz, K., Bondurant, A., Grosse, G., and Liebner, S.: A synthesis of methane dynamics in thermokarst lake environments, Earth-Sci. Rev., 210, 103365, https://doi.org/10.1016/j.earscirev.2020.103365, 2020.
Holgerson, M. A. and Raymond, P. A.: Large contribution to inland water CO2 and CH4 emissions from very small ponds, Nat. Geosci., 9, 222–226, https://doi.org/10.1038/ngeo2654, 2016.
Homer, C., Dewitz, J., Jin, S., Xian, G., Costello, C., Danielson, P., Gass, L., Funk, M., Wickham, J., Stehman, S., Auch, R., and Riitters, K.: Conterminous United States land cover change patterns 2001–2016 from the 2016 National Land Cover Database, ISPRS J. Photogramm., 162, 184–199, https://doi.org/10.1016/j.isprsjprs.2020.02.019, 2020.
Hugelius, G., Tarnocai, C., Broll, G., Canadell, J. G., Kuhry, P., and Swanson, D. K.: The Northern Circumpolar Soil Carbon Database: spatially distributed datasets of soil coverage and soil carbon storage in the northern permafrost regions, Earth Syst. Sci. Data, 5, 3–13, https://doi.org/10.5194/essd-5-3-2013, 2013.
Hugelius, G., Strauss, J., Zubrzycki, S., Harden, J. W., Schuur, E. A. G., Ping, C.-L., Schirrmeister, L., Grosse, G., Michaelson, G. J., Koven, C. D., O'Donnell, J. A., Elberling, B., Mishra, U., Camill, P., Yu, Z., Palmtag, J., and Kuhry, P.: Estimated stocks of circumpolar permafrost carbon with quantified uncertainty ranges and identified data gaps, Biogeosciences, 11, 6573–6593, https://doi.org/10.5194/bg-11-6573-2014, 2014.
Hugelius, G., Loisel, J., Chadburn, S., Jackson, R. B., Jones, M., MacDonald, G., Marushchak, M., Olefeldt, D., Packalen, M., Siewert, M. B., Treat, C., Turetsky, M., Voigt, C., and Yu, Z.: Large stocks of peatland carbon and nitrogen are vulnerable to permafrost thaw, P. Natl. Acad. Sci. USA, 117, 20438–20446, https://doi.org/10.1073/pnas.1916387117, 2020.
Ito, A.: Methane emission from pan-Arctic natural wetlands estimated using a process-based model, 1901–2016, Polar Sci., 21, 26–36, https://doi.org/10.1016/j.polar.2018.12.001, 2019.
Jorgenson, M. T., Racine, C. H., Walters, J. C., and Osterkamp, T. E.: Permafrost Degradation and Ecological Changes Associated with a Warming Climate in Central Alaska, Climatic Change, 48, 551–579, https://doi.org/10.1023/A:1005667424292, 2001.
Juncher Jørgensen, C., Lund Johansen, K. M., Westergaard-Nielsen, A., and Elberling, B.: Net regional methane sink in High Arctic soils of northeast Greenland, Nat. Geosci., 8, 20–23, https://doi.org/10.1038/ngeo2305, 2015.
Juutinen, S., Alm, J., Larmola, T., Huttunen, J. T., Morero, M., Martikainen, P. J., and Silvola, J.: Major implication of the littoral zone for methane release from boreal lakes, Global Biogeochem. Cy., 17, https://doi.org/10.1029/2003GB002105, 2003.
Kassambara, A. and Mundt, F.: factoextra: Extract and Visualize the Results of Multivariate Data Analyses, R package version 1.0.7, available at: https://CRAN.R-project.org/package=factoextra (last access: 31 October 2021), 2020.
Knoblauch, C., Spott, O., Evgrafova, S., Kutzbach, L., and Pfeiffer, E.-M.: Regulation of methane production, oxidation, and emission by vascular plants and bryophytes in ponds of the northeast Siberian polygonal tundra, J. Geophys. Res.-Biogeo., 120, 2525–2541, https://doi.org/10.1002/2015JG003053, 2015.
Knox, S. H., Jackson, R. B., Poulter, B., McNicol, G., Fluet-Chouinard, E., Zhang, Z., Hugelius, G., Bousquet, P., Canadell, J. G., Saunois, M., Papale, D., Chu, H., Keenan, T. F., Baldocchi, D., Torn, M. S., Mammarella, I., Trotta, C., Aurela, M., Bohrer, G., Campbell, D. I., Cescatti, A., Chamberlain, S., Chen, J., Chen, W., Dengel, S., Desai, A. R., Euskirchen, E., Friborg, T., Gasbarra, D., Goded, I., Goeckede, M., Heimann, M., Helbig, M., Hirano, T., Hollinger, D. Y., Iwata, H., Kang, M., Klatt, J., Krauss, K. W., Kutzbach, L., Lohila, A., Mitra, B., Morin, T. H., Nilsson, M. B., Niu, S., Noormets, A., Oechel, W. C., Peichl, M., Peltola, O., Reba, M. L., Richardson, A. D., Runkle, B. R. K., Ryu, Y., Sachs, T., Schäfer, K. V. R., Schmid, H. P., Shurpali, N., Sonnentag, O., Tang, A. C. I., Ueyama, M., Vargas, R., Vesala, T., Ward, E. J., Windham-Myers, L., Wohlfahrt, G., and Zona, D.: FLUXNET-CH4 Synthesis Activity: Objectives, Observations, and Future Directions, B. Am. Meteorol. Soc., 100, 2607–2632, https://doi.org/10.1175/BAMS-D-18-0268.1, 2019.
Kremenetski, K. V., Velichko, A. A., Borisova, O. K., MacDonald, G. M., Smith, L. C., Frey, K. E., and Orlova, L. A.: Peatlands of the Western Siberian lowlands: current knowledge on zonation, carbon content and Late Quaternary history, Quaternary Sci. Rev., 22, 703–723, https://doi.org/10.1016/S0277-3791(02)00196-8, 2003.
Kuhn, M.: caret: Classification and Regression Training, R package version 6.0-86, available at: https://CRAN.R-project.org/package=caret (last access: 31 October 2021), 2020.
Kuhn, M. A., Varner, R. K., Bastviken, D., Crill, P., MacIntyre, S., Turetsky, M., Walter Anthony, K., McGuire, A. D., and Olefeldt, D.: BAWLD-CH4: a comprehensive dataset of methane fluxes from boreal and arctic ecosystems, Earth Syst. Sci. Data, 13, 5151–5189, https://doi.org/10.5194/essd-13-5151-2021, 2021.
Lara, M. J. and Chipman, M. L.: Periglacial Lake Origin Influences the Likelihood of Lake Drainage in Northern Alaska, Remote Sens., 13, 853, https://doi.org/10.3390/rs13050852, 2021.
Lara, M. J., Nitze, I., Grosse, G., and McGuire, A. D.: Tundra landform and vegetation productivity trend maps for the Arctic Coastal Plain of northern Alaska, Sci. Rep., 5, 180058, https://doi.org/10.1038/sdata.2018.58, 2018.
Lau, M. C. Y., Stackhouse, B. T., Layton, A. C., Chauhan, A., Vishnivetskaya, T. A., Chourey, K., Ronholm, J., Mykytczuk, N. C. S., Bennett, P. C., Lamarche-Gagnon, G., Burton, N., Pollard, W. H., Omelon, C. R., Medvigy, D. M., Hettich, R. L., Pfiffner, S. M., Whyte, L. G., and Onstott, T. C.: An active atmospheric methane sink in high Arctic mineral cryosols, ISME J., 9, 1880–1891, https://doi.org/10.1038/ismej.2015.13, 2015.
Lehner, B. and Döll, P.: Development and validation of a global database of lakes, reservoirs and wetlands, J. Hydrol., 296, 1–22, https://doi.org/10.1016/j.jhydrol.2004.03.028, 2004.
Li, M., Peng, C., Zhu, Q., Zhou, X., Yang, G., Song, X., and Zhang, K.: The significant contribution of lake depth in regulating global lake diffusive methane emissions, Water Res., 172, 115465, https://doi.org/10.1016/j.watres.2020.115465, 2020.
Liaw, A. and Wiener, M.: Classification and Regression by randomForest, R News, 2, 18–22, 2002.
Liljedahl, A. K., Boike, J., Daanen, R. P., Fedorov, A. N., Frost, G. V., Grosse, G., Hinzman, L. D., Iijma, Y., Jorgenson, J. C., Matveyeva, N., Necsoiu, M., Raynolds, M. K., Romanovsky, V. E., Schulla, J., Tape, K. D., Walker, D. A., Wilson, C. J., Yabuki, H., and Zona, D.: Pan-Arctic ice-wedge degradation in warming permafrost and its influence on tundra hydrology, Nat. Geosci., 9, 312–318, https://doi.org/10.1038/ngeo2674, 2016.
Linke, S., Lehner, B., Ouellet Dallaire, C., Ariwi, J., Grill, G., Anand, M., Beames, P., Burchard-Levine, V., Maxwell, S., Moidu, H., Tan, F., and Thieme, M.: Global hydro-environmental sub-basin and river reach characteristics at high spatial resolution, Sci. Data, 6, 283, https://doi.org/10.1038/s41597-019-0300-6, 2019.
Loisel, J., Gallego-Sala, A. V., Amesbury, M. J., Magnan, G., Anshari, G., Beilman, D. W., Benavides, J. C., Blewett, J., Camill, P., Charman, D. J., Chawchai, S., Hedgpeth, A., Kleinen, T., Korhola, A., Large, D., Mansilla, C. A., Müller, J., van Bellen, S., West, J. B., Yu, Z., Bubier, J. L., Garneau, M., Moore, T., Sannel, A. B. K., Page, S., Väliranta, M., Bechtold, M., Brovkin, V., Cole, L. E. S., Chanton, J. P., Christensen, T. R., Davies, M. A., De Vleeschouwer, F., Finkelstein, S. A., Frolking, S., Gałka, M., Gandois, L., Girkin, N., Harris, L. I., Heinemeyer, A., Hoyt, A. M., Jones, M. C., Joos, F., Juutinen, S., Kaiser, K., Lacourse, T., Lamentowicz, M., Larmola, T., Leifeld, J., Lohila, A., Milner, A. M., Minkkinen, K., Moss, P., Naafs, B. D. A., Nichols, J., O'Donnell, J., Payne, R., Philben, M., Piilo, S., Quillet, A., Ratnayake, A. S., Roland, T. P., Sjögersten, S., Sonnentag, O., Swindles, G. T., Swinnen, W., Talbot, J., Treat, C., Valach, A. C., and Wu, J.: Expert assessment of future vulnerability of the global peatland carbon sink, Nat. Clim. Change, 11, 70–77, https://doi.org/10.1038/s41558-020-00944-0, 2021.
Machacova, K., Bäck, J., Vanhatalo, A., Halmeenmäki, E., Kolari, P., Mammarella, I., Pumpanen, J., Acosta, M., Urban, O., and Pihlatie, M.: Pinus sylvestris as a missing source of nitrous oxide and methane in boreal forest, Sci. Rep.-UK, 6, 23410, https://doi.org/10.1038/srep23410, 2016.
Malhotra, A. and Roulet, N. T.: Environmental correlates of peatland carbon fluxes in a thawing landscape: do transitional thaw stages matter?, Biogeosciences, 12, 3119–3130, https://doi.org/10.5194/bg-12-3119-2015, 2015.
Marushchak, M. E., Friborg, T., Biasi, C., Herbst, M., Johansson, T., Kiepe, I., Liimatainen, M., Lind, S. E., Martikainen, P. J., Virtanen, T., Soegaard, H., and Shurpali, N. J.: Methane dynamics in the subarctic tundra: combining stable isotope analyses, plot- and ecosystem-scale flux measurements, Biogeosciences, 13, 597–608, https://doi.org/10.5194/bg-13-597-2016, 2016.
Masing, V., Botch, M., and Läänelaid, A.: Mires of the former Soviet Union, Wetlands Ecol. Manage., 18, 397–433, https://doi.org/10.1007/s11273-008-9130-6, 2010.
Matson, A., Pennock, D., and Bedard-Haughn, A.: Methane and nitrous oxide emissions from mature forest stands in the boreal forest, Saskatchewan, Canada, Forest Ecol. Manage., 258, 1073–1083, https://doi.org/10.1016/j.foreco.2009.05.034, 2009.
Matthews, E. and Fung, I.: Methane emission from natural wetlands: Global distribution, area, and environmental characteristics of sources, Global Biogeochem. Cy., 1, 61–86, https://doi.org/10.1029/GB001i001p00061, 1987.
McGuire, A. D., Christensen, T. R., Hayes, D., Heroult, A., Euskirchen, E., Kimball, J. S., Koven, C., Lafleur, P., Miller, P. A., Oechel, W., Peylin, P., Williams, M., and Yi, Y.: An assessment of the carbon balance of Arctic tundra: comparisons among observations, process models, and atmospheric inversions, Biogeosciences, 9, 3185–3204, https://doi.org/10.5194/bg-9-3185-2012, 2012.
Melton, J. R., Wania, R., Hodson, E. L., Poulter, B., Ringeval, B., Spahni, R., Bohn, T., Avis, C. A., Beerling, D. J., Chen, G., Eliseev, A. V., Denisov, S. N., Hopcroft, P. O., Lettenmaier, D. P., Riley, W. J., Singarayer, J. S., Subin, Z. M., Tian, H., Zürcher, S., Brovkin, V., van Bodegom, P. M., Kleinen, T., Yu, Z. C., and Kaplan, J. O.: Present state of global wetland extent and wetland methane modelling: conclusions from a model inter-comparison project (WETCHIMP), Biogeosciences, 10, 753–788, https://doi.org/10.5194/bg-10-753-2013, 2013.
Messager, M. L., Lehner, B., Grill, G., Nedeva, I., and Schmitt, O.: Estimating the volume and age of water stored in global lakes using a geo-statistical approach, Nat. Commun., 7, 13603, https://doi.org/10.1038/ncomms13603, 2016.
Kursa, M. B. and Rudnicki, W. R.: Feature Selection with the Boruta Package, J. Stat. Softw., 36, 1–13, http://www.jstatsoft.org/v36/i11/ (last access: 31 October 2021), 2010.
Muster, S., Roth, K., Langer, M., Lange, S., Cresto Aleina, F., Bartsch, A., Morgenstern, A., Grosse, G., Jones, B., Sannel, A. B. K., Sjöberg, Y., Günther, F., Andresen, C., Veremeeva, A., Lindgren, P. R., Bouchard, F., Lara, M. J., Fortier, D., Charbonneau, S., Virtanen, T. A., Hugelius, G., Palmtag, J., Siewert, M. B., Riley, W. J., Koven, C. D., and Boike, J.: PeRL: a circum-Arctic Permafrost Region Pond and Lake database, Earth Syst. Sci. Data, 9, 317–348, https://doi.org/10.5194/essd-9-317-2017, 2017.
Muster, S., Riley, W. J., Roth, K., Langer, M., Cresto Aleina, F., Koven, C. D., Lange, S., Bartsch, A., Grosse, G., Wilson, C. J., Jones, B. M., and Boike, J.: Size Distributions of Arctic Waterbodies Reveal Consistent Relations in Their Statistical Moments in Space and Time, Front. Earth Sci., 7, 5, https://doi.org/10.3389/feart.2019.00005, 2019.
Olefeldt, D., Turetsky, M. R., Crill, P. M., and McGuire, A. D.: Environmental and physical controls on northern terrestrial methane emissions across permafrost zones, Glob. Change Biol., 19, 589–603, https://doi.org/10.1111/gcb.12071, 2013.
Olefeldt, D., Goswami, S., Grosse, G., Hayes, D., Hugelius, G., Kuhry, P., McGuire, A. D., Romanovsky, V. E., Sannel, A. B. K., Schuur, E. A. G., and Turetsky, M. R.: Circumpolar distribution and carbon storage of thermokarst landscapes, Nat. Commun., 7, 13043, https://doi.org/10.1038/ncomms13043, 2016.
Olefeldt, D., Euskirchen, E. S., Harden, J., Kane, E., McGuire, A. D., Waldrop, M. P., and Turetsky, M. R.: A decade of boreal rich fen greenhouse gas fluxes in response to natural and experimental water table variability, Glob. Change Biol., 23, 2428–2440, https://doi.org/10.1111/gcb.13612, 2017.
Olefeldt, D., Hovemyr, M., Kuhn, M. A., Bastviken, D., Bohn, T. J., Connolly, J., Crill, P., Euskirchen, E. S., Finkelstein, S. A., Genet, H., Grosse, G., Harris, L. I., Heffernan, L., Helbig, M., Hugelius, G., Hutchins, R., Juutinen, S., Lara, M. J., Malhotra, A., Manies, K., McGuire, A. D., Natali, S. M., O'Donnell, J. A., Parmentier, F.-J. W., Räsänen, A., Schädel, C., Sonnentag, O., Strack, M., Tank, S. E., Treat, C., Varner, R. K., Virtanen, T., Warren, R. K., and Watts, J. D.: The fractional land cover estimates from the Boreal-Arctic Wetland and Lake Dataset (BAWLD), Arctic Data Center, https://doi.org/10.18739/A2C824F9X, 2021.
Olson, D. M., Dinerstein, E., Wikramanayake, E. D., Burgess, N. D., Powell, G. V. N., Underwood, E. C., D'amico, J. A., Itoua, I., Strand, H. E., Morrison, J. C., Loucks, C. J., Allnutt, T. F., Ricketts, T. H., Kura, Y., Lamoreux, J. F., Wettengel, W. W., Hedao, P., and Kassem, K. R.: Terrestrial Ecoregions of the World: A New Map of Life on Earth: A new global map of terrestrial ecoregions provides an innovative tool for conserving biodiversity, BioScience, 51, 933–938, https://doi.org/10.1641/0006-3568(2001)051[0933:TEOTWA]2.0.CO;2, 2001.
Olson, D. M., Griffis, T. J., Noormets, A., Kolka, R., and Chen, J.: Interannual, seasonal, and retrospective analysis of the methane and carbon dioxide budgets of a temperate peatland, J. Geophys. Res.-Biogeo., 118, 226–238, https://doi.org/10.1002/jgrg.20031, 2013.
Packalen, M. S., Finkelstein, S. A., and McLaughlin, J. W.: Climate and peat type in relation to spatial variation of the peatland carbon mass in the Hudson Bay Lowlands, Canada, J. Geophys. Res.-Biogeo., 121, 1104–1117, https://doi.org/10.1002/2015JG002938, 2016.
Pekel, J.-F., Cottam, A., Gorelick, N., and Belward, A. S.: High-resolution mapping of global surface water and its long-term changes, Nature, 540, 418–422, https://doi.org/10.1038/nature20584, 2016.
Pelletier, L., Moore, T. R., Roulet, N. T., Garneau, M., and Beaulieu-Audy, V.: Methane fluxes from three peatlands in the La Grande Rivière watershed, James Bay lowland, Canada, J. Geophys. Res.-Biogeo., 112, G01018, https://doi.org/10.1029/2006JG000216, 2007.
Peltola, O., Vesala, T., Gao, Y., Räty, O., Alekseychik, P., Aurela, M., Chojnicki, B., Desai, A. R., Dolman, A. J., Euskirchen, E. S., Friborg, T., Göckede, M., Helbig, M., Humphreys, E., Jackson, R. B., Jocher, G., Joos, F., Klatt, J., Knox, S. H., Kowalska, N., Kutzbach, L., Lienert, S., Lohila, A., Mammarella, I., Nadeau, D. F., Nilsson, M. B., Oechel, W. C., Peichl, M., Pypker, T., Quinton, W., Rinne, J., Sachs, T., Samson, M., Schmid, H. P., Sonnentag, O., Wille, C., Zona, D., and Aalto, T.: Monthly gridded data product of northern wetland methane emissions based on upscaling eddy covariance observations, Earth Syst. Sci. Data, 11, 1263–1289, https://doi.org/10.5194/essd-11-1263-2019, 2019.
Räsänen, A. and Virtanen, T.: Data and resolution requirements in mapping vegetation in spatially heterogeneous landscapes, Remote Sens. Environ., 230, 111207, https://doi.org/10.1016/j.rse.2019.05.026, 2019.
Raynolds, M. K., Walker, D. A., Balser, A., Bay, C., Campbell, M., Cherosov, M. M., Daniëls, F. J. A., Eidesen, P. B., Ermokhina, K. A., Frost, G. V., Jedrzejek, B., Jorgenson, M. T., Kennedy, B. E., Kholod, S. S., Lavrinenko, I. A., Lavrinenko, O. V., Magnússon, B., Matveyeva, N. V., Metúsalemsson, S., Nilsen, L., Olthof, I., Pospelov, I. N., Pospelova, E. B., Pouliot, D., Razzhivin, V., Schaepman-Strub, G., Šibík, J., Telyatnikov, M. Yu., and Troeva, E.: A raster version of the Circumpolar Arctic Vegetation Map (CAVM), Remote Sens. Environ., 232, 111297, https://doi.org/10.1016/j.rse.2019.111297, 2019.
R Core Team: R: A language and environment for statistical computing. R Foundation for Statistical Computing, Vienna, Austria, available at: https://www.R-project.org/ (last access: 31 October 2021), 2020.
Rubec, C.: The Canadian Wetland Classification System, in: The Wetland Book: I: Structure and Function, Management, and Methods, edited by: Finlayson, C. M., Everard, M., Irvine, K., McInnes, R. J., Middleton, B. A., van Dam, A. A., and Davidson, N. C., Springer Netherlands, Dordrecht, 1577–1581, https://doi.org/10.1007/978-90-481-9659-3_340, 2018.
Saunois, M., Stavert, A. R., Poulter, B., Bousquet, P., Canadell, J. G., Jackson, R. B., Raymond, P. A., Dlugokencky, E. J., Houweling, S., Patra, P. K., Ciais, P., Arora, V. K., Bastviken, D., Bergamaschi, P., Blake, D. R., Brailsford, G., Bruhwiler, L., Carlson, K. M., Carrol, M., Castaldi, S., Chandra, N., Crevoisier, C., Crill, P. M., Covey, K., Curry, C. L., Etiope, G., Frankenberg, C., Gedney, N., Hegglin, M. I., Höglund-Isaksson, L., Hugelius, G., Ishizawa, M., Ito, A., Janssens-Maenhout, G., Jensen, K. M., Joos, F., Kleinen, T., Krummel, P. B., Langenfelds, R. L., Laruelle, G. G., Liu, L., Machida, T., Maksyutov, S., McDonald, K. C., McNorton, J., Miller, P. A., Melton, J. R., Morino, I., Müller, J., Murguia-Flores, F., Naik, V., Niwa, Y., Noce, S., O'Doherty, S., Parker, R. J., Peng, C., Peng, S., Peters, G. P., Prigent, C., Prinn, R., Ramonet, M., Regnier, P., Riley, W. J., Rosentreter, J. A., Segers, A., Simpson, I. J., Shi, H., Smith, S. J., Steele, L. P., Thornton, B. F., Tian, H., Tohjima, Y., Tubiello, F. N., Tsuruta, A., Viovy, N., Voulgarakis, A., Weber, T. S., van Weele, M., van der Werf, G. R., Weiss, R. F., Worthy, D., Wunch, D., Yin, Y., Yoshida, Y., Zhang, W., Zhang, Z., Zhao, Y., Zheng, B., Zhu, Q., Zhu, Q., and Zhuang, Q.: The Global Methane Budget 2000–2017, Earth Syst. Sci. Data, 12, 1561–1623, https://doi.org/10.5194/essd-12-1561-2020, 2020.
Sayedi, S. S., Abbott, B. W., Thornton, B. F., Frederick, J. M., Vonk, J. E., Overduin, P., Schädel, C., Schuur, E. A. G., Bourbonnais, A., Demidov, N., Gavrilov, A., He, S., Hugelius, G., Jakobsson, M., Jones, M. C., Joung, D., Kraev, G., Macdonald, R. W., McGuire, A. D., Mu, C., O'Regan, M., Schreiner, K. M., Stranne, C., Pizhankova, E., Vasiliev, A., Westermann, S., Zarnetske, J. P., Zhang, T., Ghandehari, M., Baeumler, S., Brown, B. C., and Frei, R. J.: Subsea permafrost carbon stocks and climate change sensitivity estimated by expert assessment, Environ. Res. Lett., 15, 124075, https://doi.org/10.1088/1748-9326/abcc29, 2020.
Schneider von Deimling, T., Grosse, G., Strauss, J., Schirrmeister, L., Morgenstern, A., Schaphoff, S., Meinshausen, M., and Boike, J.: Observation-based modelling of permafrost carbon fluxes with accounting for deep carbon deposits and thermokarst activity, Biogeosciences, 12, 3469–3488, https://doi.org/10.5194/bg-12-3469-2015, 2015.
Seppälä, M.: Synthesis of studies of palsa formation underlining the importance of local environmental and physical characteristics, Quaternary Res., 75, 366–370, https://doi.org/10.1016/j.yqres.2010.09.007, 2011.
Smith, L. C., Sheng, Y., and MacDonald, G. M.: A first pan-Arctic assessment of the influence of glaciation, permafrost, topography and peatlands on northern hemisphere lake distribution, Permafrost Periglac., 18, 201–208, https://doi.org/10.1002/ppp.581, 2007.
Song, J.: Bias corrections for Random Forest in regression using residual rotation, J. Korean Stat. Soc., 44, 321–326, https://doi.org/10.1016/j.jkss.2015.01.003, 2015.
Stanley, E. H., Casson, N. J., Christel, S. T., Crawford, J. T., Loken, L. C., and Oliver, S. K.: The ecology of methane in streams and rivers: patterns, controls, and global significance, Ecol. Monogr., 86, 146–171, https://doi.org/10.1890/15-1027, 2016.
St Pierre, K. A., Danielsen, B. K., Hermesdorf, L., D'Imperio, L., Iversen, L. L., and Elberling, B.: Drivers of net methane uptake across Greenlandic dry heath tundra landscapes, Soil Biol. Biochem., 138, 107605, https://doi.org/10.1016/j.soilbio.2019.107605, 2019.
Strauss, J., Schirrmeister, L., Grosse, G., Fortier, D., Hugelius, G., Knoblauch, C., Romanovsky, V., Schädel, C., Schneider von Deimling, T., Schuur, E. A. G., Shmelev, D., Ulrich, M., and Veremeeva, A.: Deep Yedoma permafrost: A synthesis of depositional characteristics and carbon vulnerability, Earth-Sci. Rev., 172, 75–86, https://doi.org/10.1016/j.earscirev.2017.07.007, 2017.
Tan, Z., Zhuang, Q., Henze, D. K., Frankenberg, C., Dlugokencky, E., Sweeney, C., Turner, A. J., Sasakawa, M., and Machida, T.: Inverse modeling of pan-Arctic methane emissions at high spatial resolution: what can we learn from assimilating satellite retrievals and using different process-based wetland and lake biogeochemical models?, Atmos. Chem. Phys., 16, 12649–12666, https://doi.org/10.5194/acp-16-12649-2016, 2016.
Tarnocai, C.: The effect of climate change on carbon in Canadian peatlands, Global Planet. Change, 53, 222–232, https://doi.org/10.1016/j.gloplacha.2006.03.012, 2006.
Terentieva, I. E., Glagolev, M. V., Lapshina, E. D., Sabrekov, A. F., and Maksyutov, S.: Mapping of West Siberian taiga wetland complexes using Landsat imagery: implications for methane emissions, Biogeosciences, 13, 4615–4626, https://doi.org/10.5194/bg-13-4615-2016, 2016.
Terentieva, I. E., Sabrekov, A. F., Ilyasov, D., Ebrahimi, A., Glagolev, M. V., and Maksyutov, S.: Highly Dynamic Methane Emission from the West Siberian Boreal Floodplains, Wetlands, 39, 217–226, https://doi.org/10.1007/s13157-018-1088-4, 2019.
Thompson, R. L., Nisbet, E. G., Pisso, I., Stohl, A., Blake, D., Dlugokencky, E. J., Helmig, D., and White, J. W. C.: Variability in Atmospheric Methane From Fossil Fuel and Microbial Sources Over the Last Three Decades, Geophys. Res. Lett., 45, 11499-11508, https://doi.org/10.1029/2018GL078127, 2018.
Thornton, B. F., Wik, M., and Crill, P. M.: Double-counting challenges the accuracy of high-latitude methane inventories, Geophys. Res. Lett., 43, 12569–12577, https://doi.org/10.1002/2016GL071772, 2016.
Treat, C. C., Bloom, A. A., and Marushchak, M. E.: Nongrowing season methane emissions – a significant component of annual emissions across northern ecosystems, Glob. Change Biol., 24, 3331–3343, https://doi.org/10.1111/gcb.14137, 2018.
Turetsky, M. R., Wieder, R. K., and Vitt, D. H.: Boreal peatland C fluxes under varying permafrost regimes, Soil Biol. Biochem., 34, 907–912, https://doi.org/10.1016/S0038-0717(02)00022-6, 2002.
Turetsky, M. R., Kotowska, A., Bubier, J., Dise, N. B., Crill, P., Hornibrook, E. R. C., Minkkinen, K., Moore, T. R., Myers-Smith, I. H., Nykänen, H., Olefeldt, D., Rinne, J., Saarnio, S., Shurpali, N., Tuittila, E.-S., Waddington, J. M., White, J. R., Wickland, K. P., and Wilmking, M.: A synthesis of methane emissions from 71 northern, temperate, and subtropical wetlands, Glob. Change Biol., 20, 2183–2197, https://doi.org/10.1111/gcb.12580, 2014.
Väliranta, M., Salojärvi, N., Vuorsalo, A., Juutinen, S., Korhola, A., Luoto, M., and Tuittila, E.-S.: Holocene fen–bog transitions, current status in Finland and future perspectives, Holocene, 27, 752–764, https://doi.org/10.1177/0959683616670471, 2017.
van der Molen, M. K., van Huissteden, J., Parmentier, F. J. W., Petrescu, A. M. R., Dolman, A. J., Maximov, T. C., Kononov, A. V., Karsanaev, S. V., and Suzdalov, D. A.: The growing season greenhouse gas balance of a continental tundra site in the Indigirka lowlands, NE Siberia, Biogeosciences, 4, 985–1003, https://doi.org/10.5194/bg-4-985-2007, 2007.
Venter, O., Sanderson, E. W., Magrach, A., Allan, J. R., Beher, J., Jones, K. R., Possingham, H. P., Laurance, W. F., Wood, P., Fekete, B. M., Levy, M. A., and Watson, J. E. M.: Sixteen years of change in the global terrestrial human footprint and implications for biodiversity conservation, Nat. Commun., 7, 12558, https://doi.org/10.1038/ncomms12558, 2016.
Virtanen, T. and Ek, M.: The fragmented nature of tundra landscape, International Journal of Applied Earth Observation and Geoinformation, Int. J. Appl. Earth Obs., 27, 4–12, https://doi.org/10.1016/j.jag.2013.05.010, 2014.
Vitt, D. H. and Chee, W.-L.: The relationships of vegetation to surface water chemistry and peat chemistry in fens of Alberta, Canada, Vegetatio, 89, 87–106, https://doi.org/10.1007/BF00032163, 1990.
Vitt, D. H., Halsey, L. A., Bauer, I. E., and Campbell, C.: Spatial and temporal trends in carbon storage of peatlands of continental western Canada through the Holocene, Can. J. Earth Sci., 37, 12, https://doi.org/10.1139/e99-097, 2000a.
Vitt, D. H., Halsey, L. A., and Zoltai, S. C.: The changing landscape of Canada's western boreal forest: the current dynamics of permafrost, Can. J. Forest Res., 30, 283–287, https://doi.org/10.1139/x99-214, 2000b.
Walker, D. A., Raynolds, M. K., Daniëls, F. J. A., Einarsson, E., Elvebakk, A., Gould, W. A., Katenin, A. E., Kholod, S. S., Markon, C. J., Melnikov, E. S., Moskalenko, N. G., Talbot, S. S., Yurtsev, B. A., and the other members of the CAVM Team: The Circumpolar Arctic vegetation map, 16, 267–282, https://doi.org/10.1111/j.1654-1103.2005.tb02365.x, 2005.
Wallin, M. B., Campeau, A., Audet, J., Bastviken, D., Bishop, K., Kokic, J., Laudon, H., Lundin, E., Löfgren, S., Natchimuthu, S., Sobek, S., Teutschbein, C., Weyhenmeyer, G. A., and Grabs, T.: Carbon dioxide and methane emissions of Swedish low-order streams – a national estimate and lessons learnt from more than a decade of observations, Limnol. Oceanogr.-Lett., 3, 156–167, https://doi.org/10.1002/lol2.10061, 2018.
Walter Anthony, K., Daanen, R., Anthony, P., Schneider von Deimling, T., Ping, C.-L., Chanton, J. P., and Grosse, G.: Methane emissions proportional to permafrost carbon thawed in Arctic lakes since the 1950s, Nat. Geosci., 9, 679–682, https://doi.org/10.1038/ngeo2795, 2016.
Walter Anthony, K., Schneider von Deimling, T., Nitze, I., Frolking, S., Emond, A., Daanen, R., Anthony, P., Lindgren, P., Jones, B., and Grosse, G.: 21st-century modeled permafrost carbon emissions accelerated by abrupt thaw beneath lakes, Nat. Commun., 9, 3262, https://doi.org/10.1038/s41467-018-05738-9, 2018.
Watts, J. D., Kimball, J. S., Bartsch, A., and McDonald, K. C.: Surface water inundation in the boreal-Arctic: potential impacts on regional methane emissions, Environ. Res. Lett., 9, 075001, https://doi.org/10.1088/1748-9326/9/7/075001, 2014.
Whalen, S. C., Reeburgh, W. S., and Barber, V. A.: Oxidation of methane in boreal forest soils: a comparison of seven measures, Biogeochemistry, 16, 181–211, https://doi.org/10.1007/BF00002818, 1992.
Wickland, K. P., Jorgenson, M. T., Koch, J. C., Kanevskiy, M., and Striegl, R. G.: Carbon Dioxide and Methane Flux in a Dynamic Arctic Tundra Landscape: Decadal-Scale Impacts of Ice Wedge Degradation and Stabilization, Geophys. Res. Lett., 47, e2020GL089894, https://doi.org/10.1029/2020GL089894, 2020.
Wik, M., Varner, R. K., Anthony, K. W., MacIntyre, S., and Bastviken, D.: Climate-sensitive northern lakes and ponds are critical components of methane release, Nat. Geosci., 9, 99–105, https://doi.org/10.1038/ngeo2578, 2016.
Zhang, Z., Zimmermann, N. E., Stenke, A., Li, X., Hodson, E. L., Zhu, G., Huang, C., and Poulter, B.: Emerging role of wetland methane emissions in driving 21st century climate change, P. Natl. Acad. Sci. USA, 114, 9647–9652, https://doi.org/10.1073/pnas.1618765114, 2017.
Zhu, Q., Peng, C., Chen, H., Fang, X., Liu, J., Jiang, H., Yang, Y., and Yang, G.: Estimating global natural wetland methane emissions using process modelling: spatio-temporal patterns and contributions to atmospheric methane fluctuations, Global Ecol. Biogeogr., 24, 959–972, https://doi.org/10.1111/geb.12307, 2015.