the Creative Commons Attribution 4.0 License.
the Creative Commons Attribution 4.0 License.
 | 03 Nov 2021
The dataset of walled cities and urban extent in late imperial China in the 15th–19th centuries
Qiaofeng Xue
Xiaobin Jin
Yinong Cheng
Xuhong Yang
Yinkang Zhou
Long-term urban extent data are highly desirable for understanding urban land use patterns. However, urban observation data based on remote sensing are typically confined to recent decades. In this study, we advance in this arena by reconstructing the walled cities for China that extend from the 15th century to the 19th century based on multiple historical documents. Cities in late imperial China (the Ming and the Qing dynasties, 1368–1911) generally had city walls, and these walls were usually built around the built-up urban area. By restoring the extent of the city walls, it is helpful to explore the urban extent in this period. Firstly, we collected the years of construction or reconstruction of city walls from the historical data. Specifically, the period in which the size of the city wall remains unchanged is recorded as a lifetime of it. Secondly, a specialization on the extent of the city wall could be conducted based on the urban morphology method and a variety of documentation, including the historical literature materials, the military topographic maps of the first half of the 20th century, and the remote sensing images of the 1970s. The correlation and integration of the lifetime and the spatial data led to the creation of the China City Wall Areas Dataset (CCWAD) for the late imperial period. Based on the proximity to the time of most of the city walls, we selected six representative years (i.e., 1400, 1537, 1648, 1708, 1787, and 1866) from CCWAD to produce the China Urban Extent Dataset (CUED) for the 15th–19th centuries. These datasets are available at https://doi.org/10.6084/m9.figshare.14112968.v3 (Xue et al., 2021).
- Article
(9605 KB) - Full-text XML
-
Supplement
(56 KB) - BibTeX
- EndNote


As cities are one of the most obvious phenomena on the Earth's surface arising from human activities, human productivity has increased significantly since the industrial revolution, which has led to the expansion of population and the acceleration of urbanization (Mumford, 1968; Sanchez-Rodriguez et al., 2005). The rapidly expanding built-up urban area has serious impacts on regional and global changes by modifying the characteristics of the underlying surface while exacerbating human activities such as fossil fuel combustion (Seto et al., 2012; Rodriguez et al., 2018). With complex interactions happening in global environmental changes, the evolution of urban scale and spatial distribution is an important part of global change research (Solecki et al., 2013; Seto and Ramankutty, 2016; Goldewijk et al., 2017; Bai et al., 2018; Kuang et al., 2021). Long-term data on historical urbanization trends and patterns will be conducive to contextualize the current urbanization, as well as to predict future trajectories of its process. In particularly, China has a history of urban construction for thousands of years, and it is also one of the countries with a relatively fast urbanization process in the world today (Gong et al., 2019; Liu et al., 2020). However, China's industrial revolution did not start until the end of the 19th century, while the pattern of cities in late imperial China in the Ming and Qing dynasties (1368–1911) laid the foundation for Chinese cities in modern time (Skinner, 1977).
The data used for the study in the historical period must take into account the availability and integrity even though there are many methods and indicators to assess the level of urbanization. The widely used data are the statistical material about the population and area of cities for the study of urbanization before the industrial revolution (Doxiadis, 1970). Significantly, population is an effective indicator of the level of urbanization for most current studies to estimate the historical urbanization levels (Chandler, 1987; Reba et al., 2016; Leyk et al., 2020). However, in the case of late imperial China, population is not fully applicable to the study of China's urbanization during the Ming and Qing dynasties for obvious limitations of and flaws in the data when the data on urban population usually originated from the regional level which included cities; thus few separate statistical data on the number of urban residents could be found, although the official demographics of China during this period were detailed and generally credible (Ho, 1959; Perkins, 1969; Cao, 2001a). For example, William Skinner (1977) used population as the key indicator to measure the urbanization of China in the 19th century. However, since China did not have reliable urban population data (UPD) until 1953, Skinner had to work backward in time, extrapolating better, more recent data to somewhat earlier dates and building up a consistent time series culminating in the fairly hard data for 1953. Skinner selected 1893 as the representative year and created a comprehensive file of over 2500 data cards designed to cover every city and town. Based on this database of more than 150 attributes (mainly including administrative level, circumference of city wall, postal status, population estimates, trade statistics, and steamship or rail traffic), cities were classified. Then he defined the urban population class intervals so that the upper boundary of each class was twice the lower boundary, and the following series was used: 1000, 2000, 4000, 8000, 16 000, 32 000, and so on. Finally, Skinner estimated the urbanization process of China in the 19th century. It is acceptable to use data of the 1950s to study the urbanization in the 19th century, but for longer-term research, the credibility and operability of this approach will be greatly reduced. In summary, the flaws in the original materials have led to a great controversy over the different versions of estimates on Chinese urban population during this period (Li, 1997; Cao, 2000; Cao, 2001b).
Another way to explore the urbanization process in the historical period is the restoration of the urban extents or the built-up areas of cities (He et al., 2002; Hedefalk et al., 2017; Lin et al., 2017; Qin et al., 2019; Uhl et al., 2021). However, before the popularization of scientific cartography in the 20th century, maps in China generally lacked the basis of surveying and mapping (Yee et al., 1994; Cheng, 2019) and could not be used to restore the built-up urban areas in the late imperial period precisely. In addition, there was a lack of statistical data on urban area in late imperial China. Therefore, researchers generally use alternatives to represent the built-up areas of Chinese cities in the late imperial period, and one of the most commonly used indicators is the extent of city walls (Skinner, 1977; He et al., 2002; Qin et al., 2019).
How can the extent of a city wall represent the urban extent? Here we must begin by attempting to summarize the city wall building history that existed in imperial China. The city wall is considered to be one of the basic symbols of ancient Chinese cities (Chang, 1986). But to be specific, cities in China were not always walled. In addition, the characteristics of city walls in different eras were not the same. During the 3rd to 10th centuries, small cities in China generally had no walls. Even regional capital cities only built small-scale city walls called Zi-cheng (Zi means small and Cheng means city wall). The Zi-cheng was built around the government and military barracks, just like castles in medieval Europe. Residential areas, markets, schools, and religious buildings were all outside the Zi-cheng (Lu, 2011). From the 10th to 13th centuries, there were some large-scale city walls built around residential areas, but they were generally confined to a few important cities. During the Mongolian-ruled Yuan Dynasty (13–14th centuries), many city walls were deliberately torn down. Only in the Ming and the Qing dynasties (14–19th centuries) did cities generally build large-scale walls to protect governments, temples, granaries, residences, and certain natural resources against invasion, tribal uprising, and peasant rebellion. According to many previous studies (Chang, 1970; Kostof, 1992; Knapp, 2000), city walls in this period were usually slightly larger than the built-up area of the city, and as the suburban areas grew, new and larger city walls were often built. Thus, the city wall in the Ming and Qing periods could be regarded as the urban fixation line which reflected the extent of the city. On the other hand, the Ming period and the first century of the Qing witnessed the extensive construction of city walls. A total of 80 % of cities in China had walls in the 15th century, and in the 16th century, 95 % of cities were walled (see the details in Sect. 5 below). Through the study of the extent of the city wall, it will help us to reconstruct the urban extent in late imperial China in the 15–19th centuries.
Historical materials in the Ming and the Qing dynasties in China recorded the length and construction time of the city wall of each administrative city above the county level in detail, which provided reliable information for restoring the scale of the city walls. Researchers have estimated the built-up area of Chinese cities in the late imperial period by converting the perimeter of the city wall into the area of the city wall (Skinner, 1977; He et al., 2002; Cheng, 2007). However, due to the shape of the city, walls were often irregular, and their construction years were different from each other; the mentioned built-up urban area estimation often produces large errors. In addition, the differences between the extent of the city wall and the built-up urban area have not been much discussed. There is still a lack of city wall and urban extent datasets with high resolution and definite age for late imperial China.
The aim of this project was to collect multiple historical data sources related to the city walls of late imperial China, digitize them, and make the China City Wall Areas Dataset (CCWAD) and China Urban Extent Dataset (CUED) for the late imperial period in the 15th–19th centuries. We used a similar method to produce a dataset of urban extent areas in Northwest China in the Ming and the Qing dynasties (Xue et al., 2018), and in this new database, we improved the research methods and extended the study area across China. Firstly, based on the historical urban morphology theory (Conzen, 1969), we restored the extent and construction time of walls of each administrative city in the Ming (1368–1643) and the Qing (1644–1911) dynasties and made the CCWAD product. Then, we analyzed the years and sites of the construction of the city walls, and we found six representative years that could illustrate the general level of urban extent in China of this period. Based on this strategy, we developed the product of the CUED for 1400, 1537, 1648, 1708, 1787, and 1866 across China. These datasets provide a foundation for understanding cities in the traditional agricultural society, and they will also be helpful in current and future research and practices in urban environmental and cultural sustainability.
This research is aimed at the cities in China in the 15th–19th centuries. The definition of a city is the same as the general research practice of ancient Chinese cities, namely administrative cities, including county, Zhou, Fu, and Ting. In addition, the military cities of the Ming Dynasty, Wei and Suo, and the Eight Banner cities of Manchu of the Qing Dynasty were added.
The research period consisted of the Ming and the Qing dynasties, and there were some differences in the territory of the two dynasties. In order to explore the temporal and spatial characteristics of late imperial China's urban extent, the study area is divided into five sub-regions based on landform types, local socioeconomic history, and ethnic distribution, as shown in Fig. 1. (I) Northeast China mainly covers the area to the east of Daxing'anling mountain and the north of the Great Wall of the Ming Dynasty. This region was sparsely populated until the influx of large numbers of immigrants in the 18th–19th century, and a number of cities were established at the end of the 19th century and the beginning of the 20th century. (II) Inner Mongolia was to the north of the Great Wall and was inhabited by Mongolian herdsmen in the 15th–19th centuries. (III) The traditional agricultural area was densely populated, with many cities and a long history. (IV) Xinjiang was located in the continental interior, and the population was concentrated in oases. It became the territory of the Qing Dynasty after the mid-18th century. (V) Qinghai–Tibet Plateau is mainly located on the Qinghai–Tibet Plateau, which is the highest-elevation plateau in the world. There were some historic cities on the edge of the plateau, but the administrative cities within it were established very late.
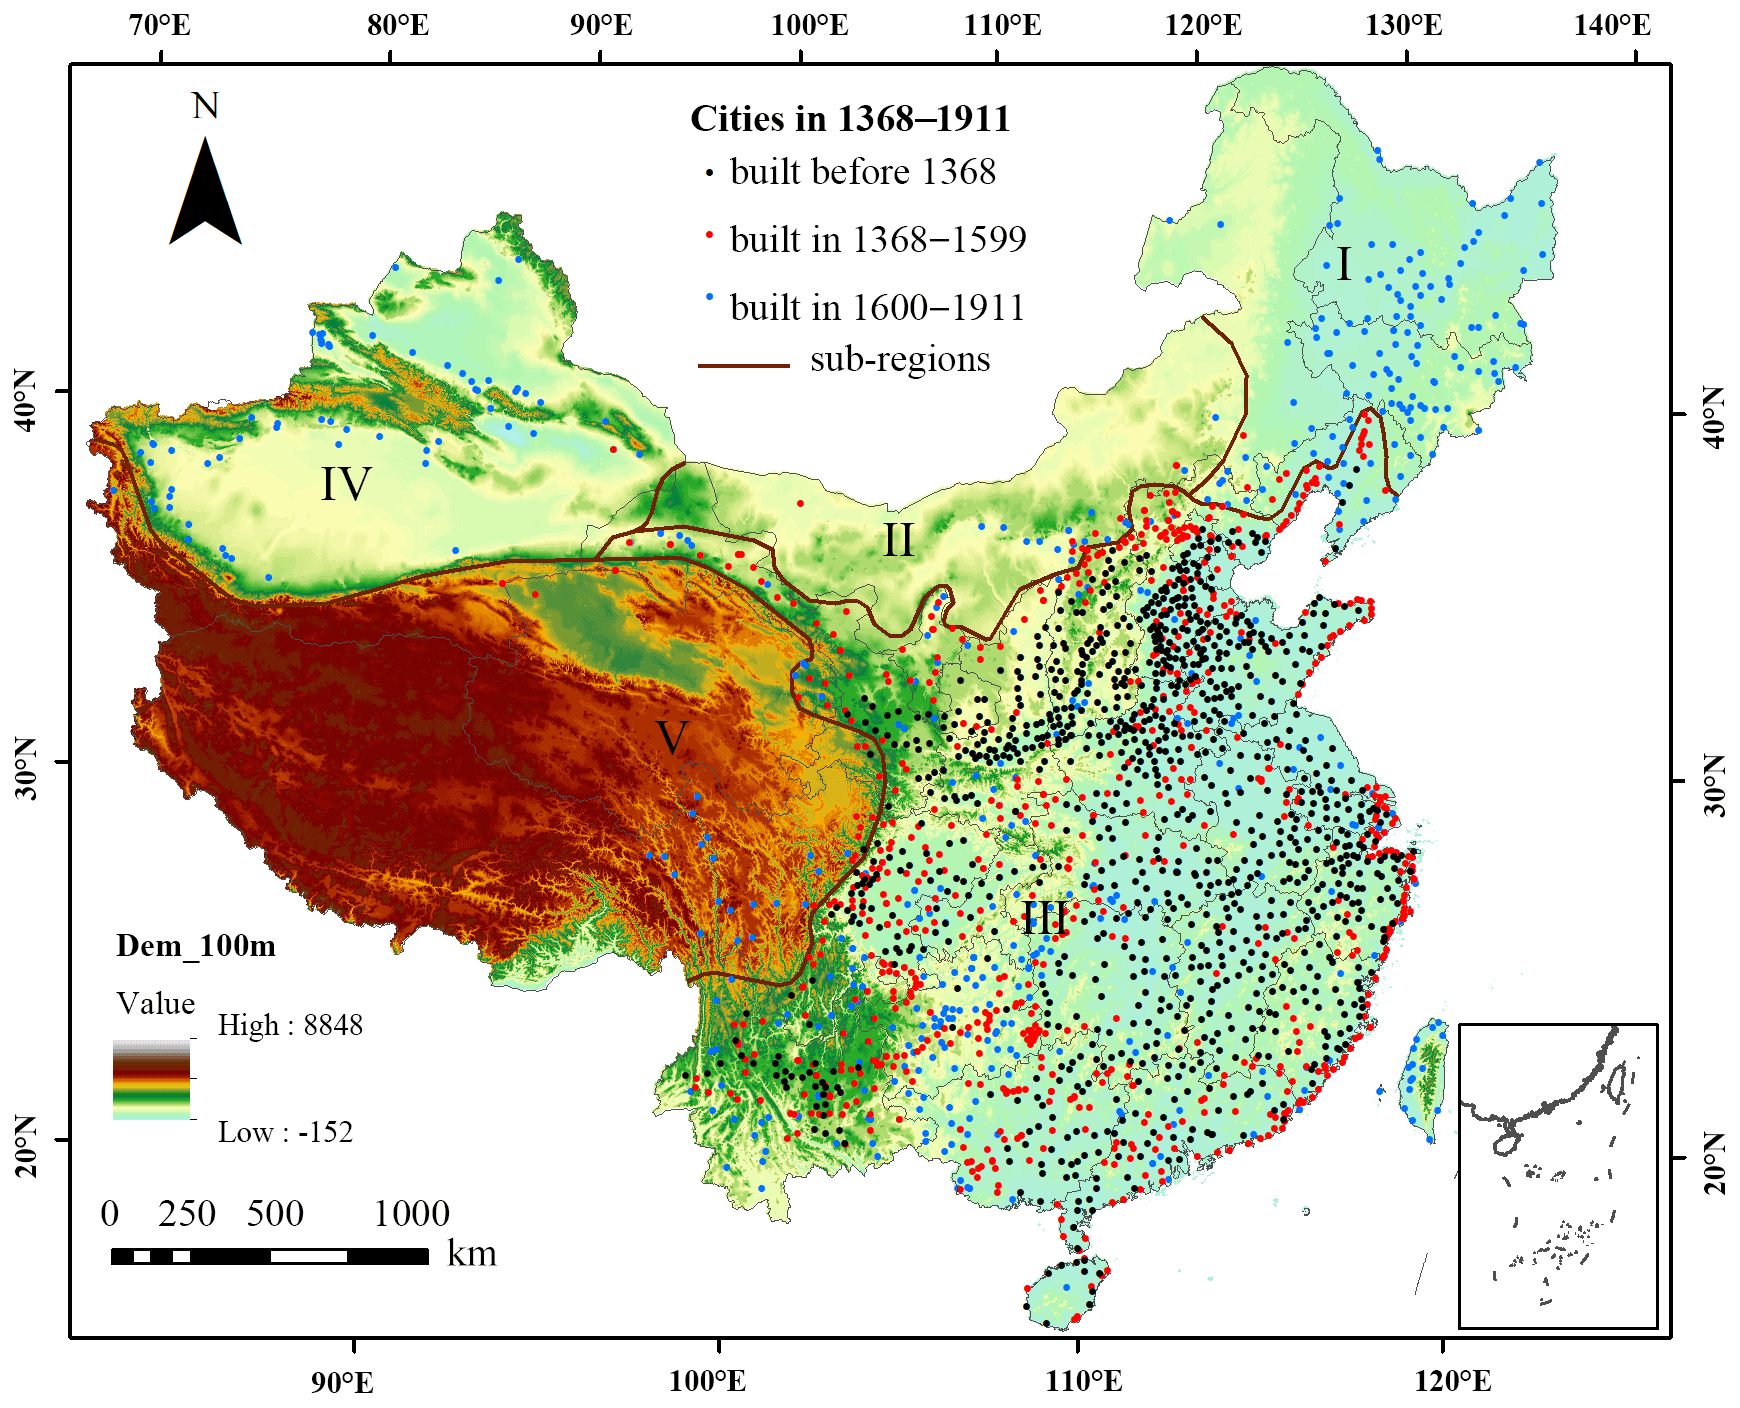
Figure 1Cities in the Ming and Qing dynasties (1368–1911). The study area is divided into five natural sub-regions: Region I, Northeast China; Region II, Inner Mongolia; Region III, traditional agricultural area; Region IV, Xinjiang; Region V, Qinghai–Tibet Plateau.
3.1 City wall records in historical literature
There were detailed and systematic records of city walls in Chinese historical literature, such as the Book Integration of Ancient and Modern Times (edited in 1701–1728), Unified Records of the Qing Dynasty (edited in 1842), and more than 3000 local chronicles edited before 1949 all over China. There was a tradition of compiling local chronicles in the Ming and Qing dynasties. Most of the literature was compiled by local governments, and the city wall, as an important achievement, had been paid much attention. These records detailed the construction and transformation of local city walls, such as their construction time, scale, and form (see Fig. 2), and the Book Integration of Ancient and Modern Times and Unified Records of the Qing Dynasty were collections of local chronicles. The historians in our research team have systematically collated and studied this literature and compiled a series of data compilations (Cheng, 2016a, b, c), and the historical literature of this study was from these data compilations.
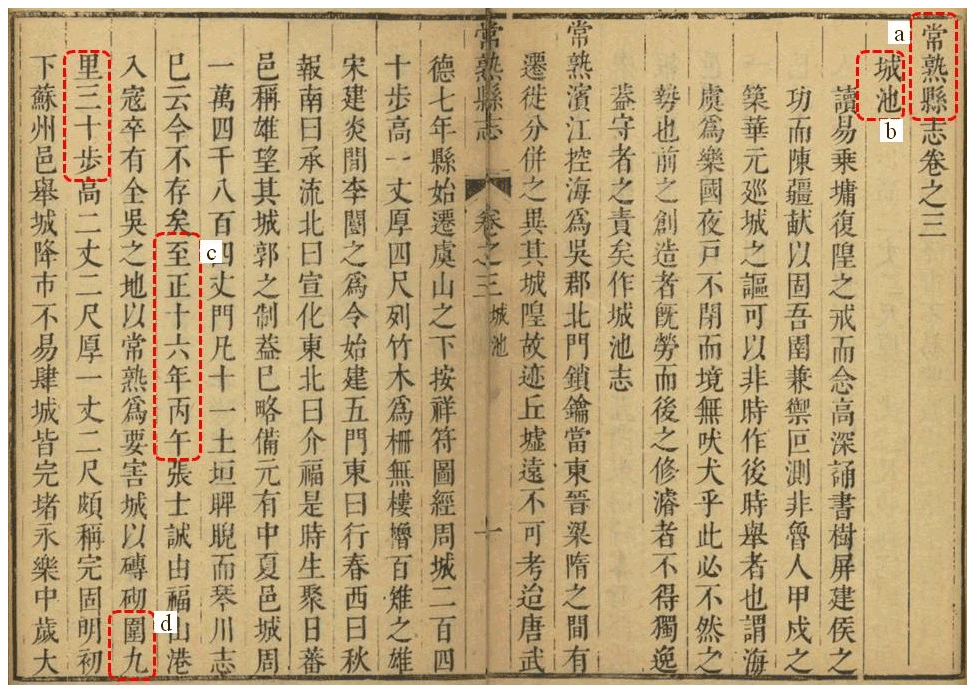
Figure 2The image of the record of the city wall in a local chronicle of the 17th century (Kang-Xi Changshu county's Chronicle). (a) City's name: Changshu (Jiangsu Province). (b) Chapter name: city wall and moat. (c) Year the city wall was built: the 16th year of Zhizheng in the Yuan Dynasty (1356 CE). (d) The perimeter of the wall: around 4.6 km (actual about 5.44 km).
3.2 Old maps and remote sensing images
Spatialization of the text of historical data was the next step to make this database. Most of the city walls of Chinese cities were demolished after 1949, which made it impossible for us to spatialize them directly on today's map. Fortunately, the 1 : 25 000, 1 : 50 000, and 1 : 100 000 military topographic maps produced by the bureau of surveying and mapping of the Republic of China (1912–1949) and the Japanese army in the 1910s to 1930s drew the location of the city walls, making it easier to restore these walls on modern maps (Fig. 3a). These topographic maps were mainly plotted in the periods of 1916–1925 and 1930–1939, and they are mainly collected in Taiwan and Japan at present (Jiang, 2017). More than 60 000 digitalized maps covering 25 provinces in China can be viewed online on various websites, and an integrated query system has been launched (http://map.rchss.sinica.edu.tw/, last access: 4 September 2019).
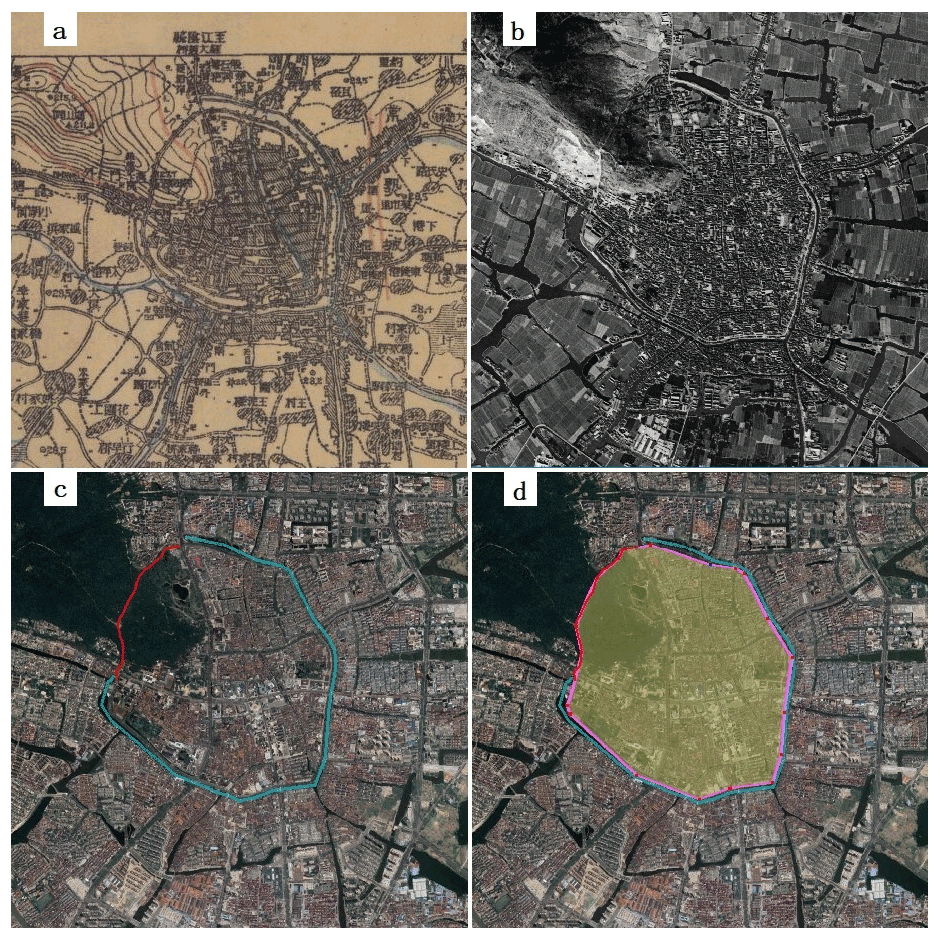
Figure 3Maps and remote sensing images that show the city wall and associated relics of Changshu, Jiangsu Province. (a) The 1 : 50 000 military topographic map made in 1928. The jagged line on the map represents the city wall, and the double line represents the river. (b) The 1970s CORONA photograph from USGS. (c) The remaining city walls (tagged as red line) and moats (tagged as blue line) are still clearly visible. The map is based on © Google Earth image, 2018. (d) According to the remains of the city walls and the moat, the extent of the city wall is drawn (yellow area). The map is based on © Google Earth image, 2018.
In addition, we also need some remote sensing images for auxiliary work, and the CORONA photographs are the most important. CORONA is a satellite deployed by the United States in 1958, and it took remote sensing images covering the world from 1960 to 1972. Now the CORONA photographs have been decrypted and can be downloaded from the USGS website (https://earthexplorer.usgs.gov/, last access: 1 February 2018). Before the 1980s, the cities of the Chinese mainland had not started large-scale expansion, and the ancient relics can be clearly identified from these remote sensing images; the modern remote sensing images are obtained from Google Earth.
3.3 City sites and their lifetime
We need to obtain information on cities in China during the study period, including where they were located, what time they appeared, and when they disappeared. As mentioned above, the research object was the administrative city. If a site was chosen as a local administrative center, it was regarded as the birth of a new city; if all the administrative agencies mentioned above were abandoned or moved, then it was regarded as an abandoned city; and the period between them was called the city's lifetime. Most of the city's lifetime information can be obtained from the China Historical Geographic Information System (CHGIS, Version 6, 2016; available at https://dataverse.harvard.edu/dataverse/chgis_v6/, last access: 2 October 2019). In addition, we supplemented and corrected some missing and mistaken data of CHGIS based on the Historical Atlas of China (Tan, 1982) and General History of Administrative Regions in China (Zhou, 2007–2016; Guo and Jin, 2007; Fu et al., 2013). Through the above work, the city site point layer of the Ming and Qing dynasties could be obtained, as well as the time records of when they were set up or abandoned, including 2560 lifetime records for 2376 city sites in total (Fig. 1), functioning as the basis for the next step to make the CCWAD and the CUED products.
4.1 The historical urban morphology theory
The historical urban morphology theory was proposed by British architect Michael Conzen, emphasizing the importance on studying the urban plan pattern from the perspective of morphology (Conzen, 1969). It was believed that the urban plan pattern was a complex record of the development of urban form, which retained the residual characteristics of each stage of its development process. Therefore, based on the evolutionary perspective, it is a worthwhile analysis method to study and reveal the potential history from the existing planning pattern. The urban morphology theory focuses on large-scale city maps, combined with field research and literature analysis, to analyze the urban plane pattern based on the perspective of evolution, and it is interpreted as three elements: the street and its layout in the street system; the burgage and its agglomeration in the block; and block plan of a building. The city walls are generally considered as an important “fixation line” that has the role of defining the static edge of the city (Conzen, 1969).
Conzen (1969) also put forward a series of basic concepts to describe the urban form and its evolution phenomenon, which is of great significance to the study of urban historical form in China (Li and Wu, 1992; Zhong, 2015; Lai, 2019). Chinese researchers often combine historical text data and old maps to fix the lack of systematic ancient cadastral records. The main elements of the urban flat pattern are appropriately adjusted to aggregate streets, water systems and bridges, city walls, moats, government offices, and temples for analysis. Thus, a relatively clear urban plan pattern was obtained for several time sections in the pre-industrialization period. The production of our database does not involve the restoration of streets and buildings but focuses on the restoration of the location of the city walls, thus reducing the practical difficulty and the requirements for the quality of the original materials. With the historical urban morphology theory, it is not difficult to restore the location of city walls in late imperial China by combining historical literature data, old maps, and remote sensing images with some necessary field investigations, thus helping us to understand the urban extent of this period in China.
Figure 4 provides a schematic overview of dataset construction and is referred to throughout the methods section to clarify the dataset development process.
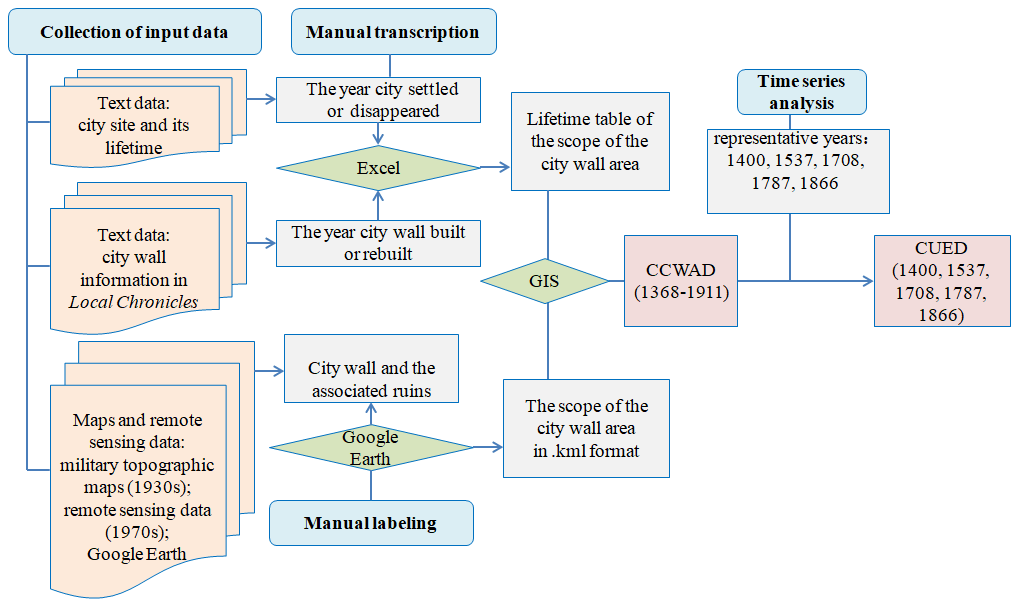
Figure 4A flowchart of the methodology used to generate the China City Wall Areas Dataset (CCWAD) and China Urban Extent Dataset (CUED) for the 15th–19th centuries in late imperial China.
4.2 Restoration of the extent of the city walls
Sorting out the city wall records in historical records and tabulating them by Microsoft Excel involved much work on filtering the city wall information in the historical literature data since it is lengthy, messy, and mixed with many literary descriptions. Moreover, the perimeter of the city walls recorded is often not accurate and can only be used as a reference. Therefore, the focus is on extracting information about construction time and reconstruction time. The literary descriptions of city walls in the historical records were helpful for the interpretation of remote sensing images and were retained for reference.
We georeferenced and digitized the military topographic maps and the 1970s remote sensing images. In the georeferencing process, we used modern topographic web maps and Google Earth to identify common points in the historic maps and the CORONA photographs, such as temples, city gates, city walls, drum towers, and crossroads. Using all of the above processed materials, we are able to identify the location of city wall ruins, or other associated ruins, in Google Earth. Then, according to the literary description in historical records, the correspondence between the text records and the identified ruins are judged, thereby identifying the time of the ruins.
Although most of the city walls of Chinese cities were demolished after 1949, there were still many associated relics, such as the moat parallel to the city wall or a ring road built after the city wall was demolished; the radial spread of multiple roads often implies the location of the city gate. These associated relics could be investigated from remote sensing images of the 1970s and even in modern remote sensing images (e.g., see Fig. 3b, c, d). For example, Figs. 5 and 6 show the extent of the city walls of several famous Chinese cities from 1368 to 1911, and the red lines in these figures are the location of city walls presented in the dataset. The eight cities shown in Fig. 5 did not change the extent of the city walls during the period, while the six cities in Fig. 6 changed to varying degrees. Among these cities, Nanjing in Fig. 5 and Xi'an (1368–1642) in Fig. 6 retain relatively complete city walls today, so it is not difficult to restore their extent in the remote sensing images. Chengdu, Hangzhou, and Suzhou in Fig. 5 retain their city moats, so their city walls were located inside the moats. Shanghai and Kunming in Fig. 5 and Beijing, Shenyang, Tianjin (1369–1860), and Urumqi in Fig. 6 demolished their city walls and built ring roads on their old sites – for example the “Second Ring Road” in Beijing and the “Renmin Road” in Shanghai – so their city wall positions overlap with these ring roads. The extents of city walls in other cities were verified through various ground markers and local chronicles. In cities where the extent of the city walls changed, most of the newly built walls were located outside the old city gates (e.g., Xi'an, Lanzhou) or around the old cities (e.g., Shenyang, Tianjin). This was to protect the newly built-up urban areas. There were also cities that built a new city wall far from the old city (e.g., Urumqi).
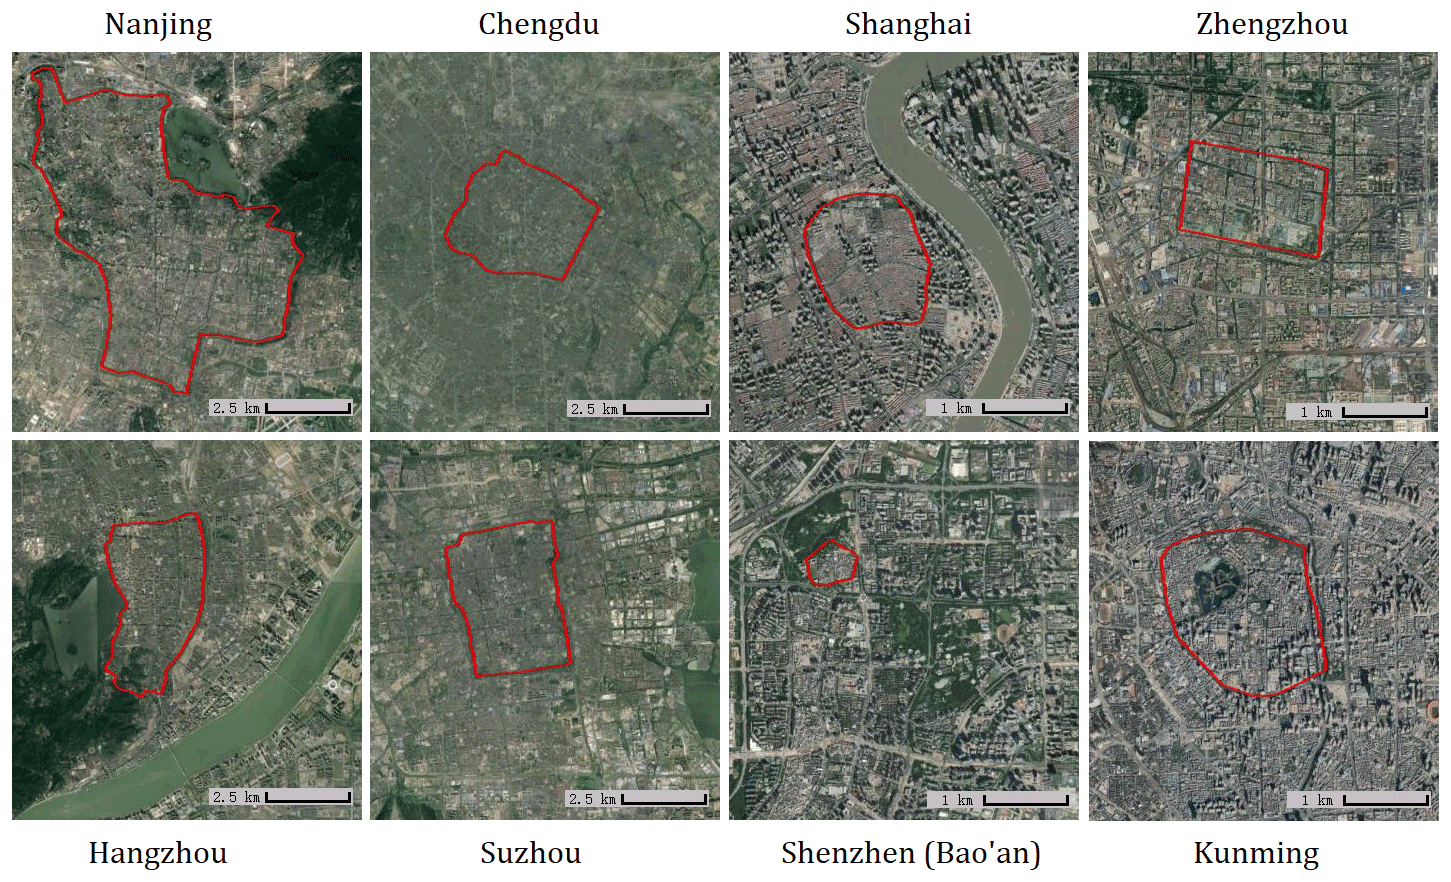
Figure 5Several extents of city walls of Chinese cities from 1368 to 1911. The red aerials are from the China City Wall Areas Dataset (CCWAD) which illustrate the location of city walls. These maps are based on © Google Earth image, 2020.
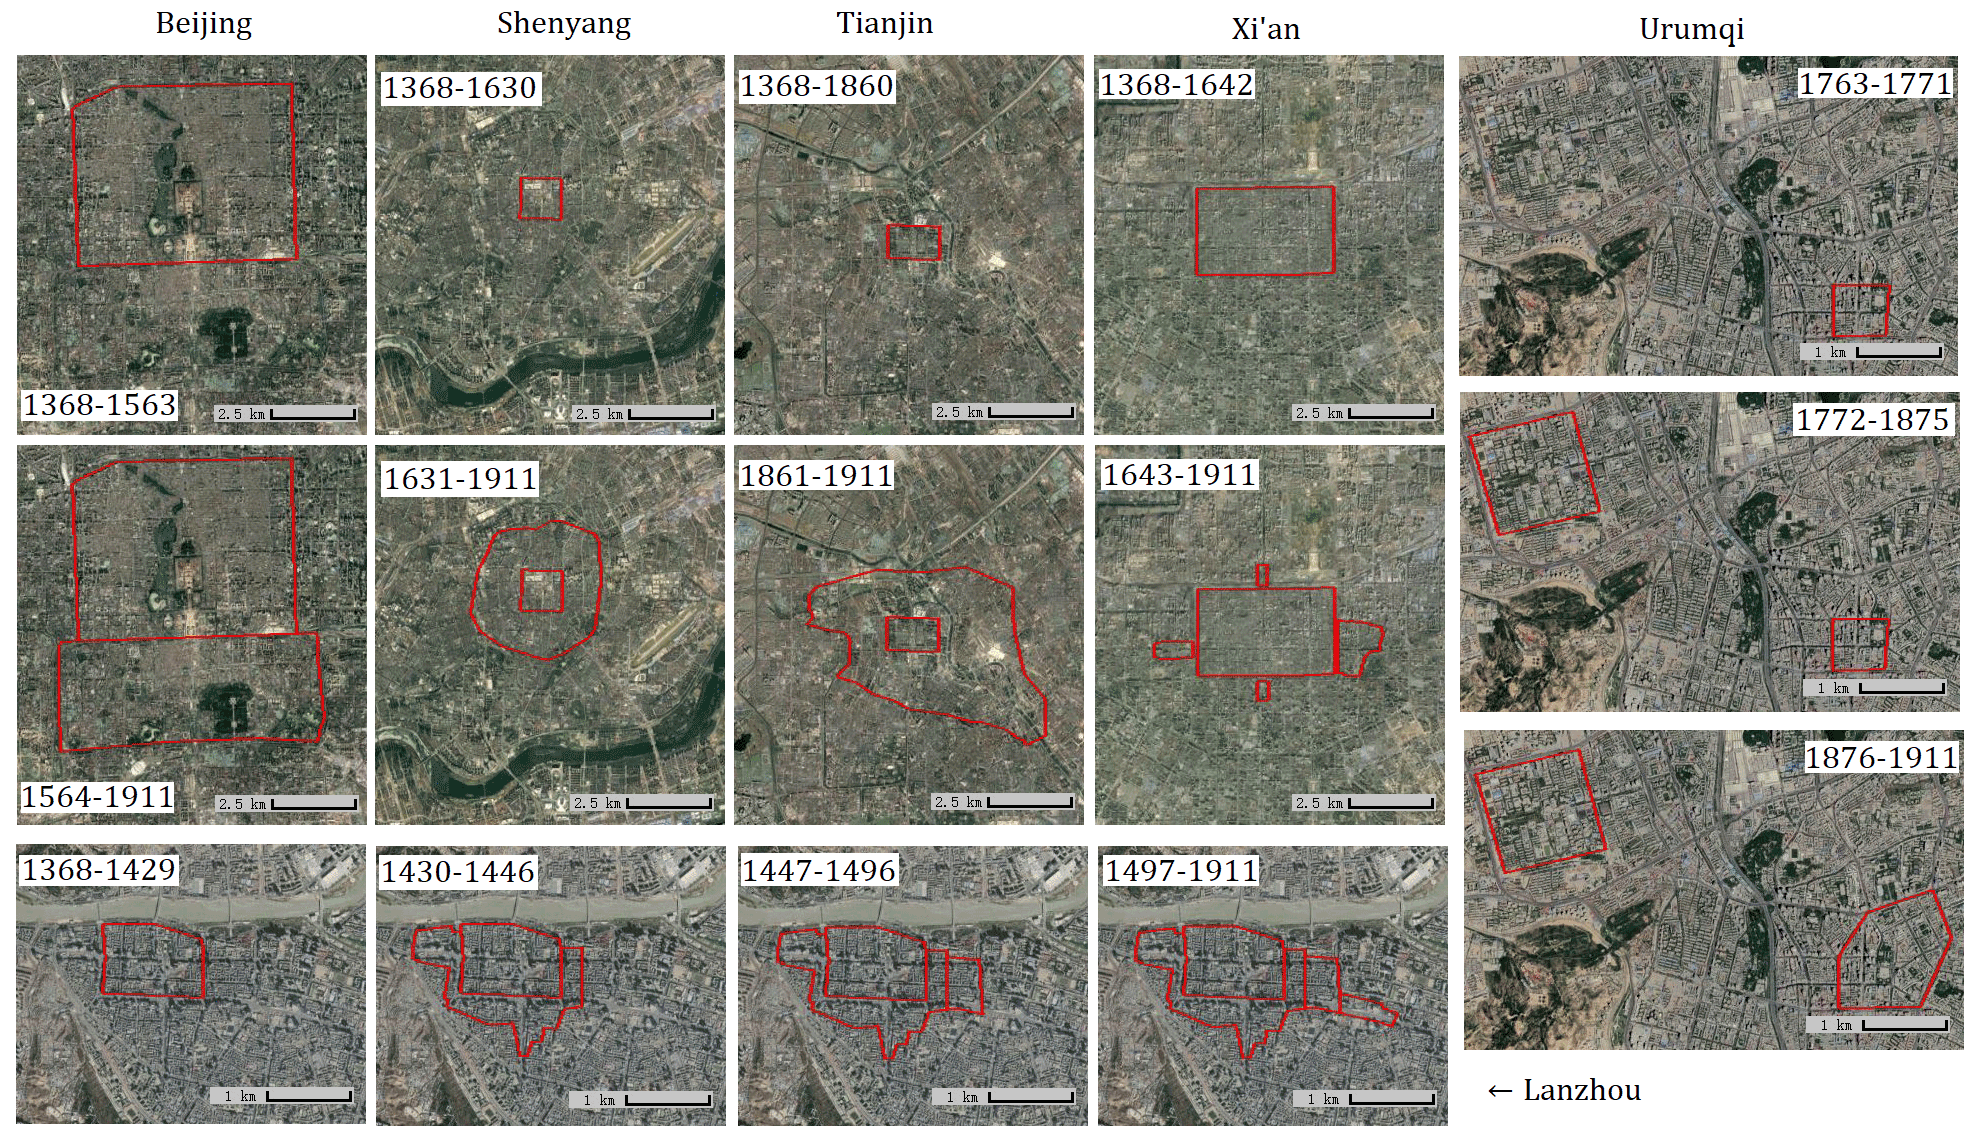
Figure 6Several extents of city walls of Chinese cities from 1368 to 1911. The red aerials are from the China City Wall Areas Dataset (CCWAD) which illustrate the location of city walls. These maps are based on © Google Earth image, 2020.
Target geographic objects, such as city walls, city gates, moats, and ring roads built after the city walls were demolished, were digitized as temporal snapshots from the maps. The georeferencing and digitalization steps were performed by using ArcGIS 10.3 for Desktop (http://www.esri.com/software/arcgis/arcgis-for-desktop/, last access: 20 February 2021). The next step is to generate layers in .kml format in Google Earth, marking their corresponding lifetime, and then use ArcGIS Desktop 10.3 to covert .kml layers into .shp format. The .shp layers are associated with the Excel table that previously saved the local chronicles data, thereby generating the .shp layer of the extent of the city wall area with spatiotemporal attributes.
This section shows the process of making the CCWAD product during the Ming and Qing dynasties. Users can query and obtain the nationwide city wall area data for any year during 1368 to 1911 with GIS software from this dataset.
Now we attempt to extract urban extent data from CCWAD. It must be emphasized that although city walls could be a helpful indicator for representing the extent of cities, there are always gaps and delays in both definitions and spatiotemporal changes between the city walls and urban extents. The city wall was a functional building with high cost, and it would be built only when it was of vital importance to military and economic defense. Therefore, the extent of the city wall must be adapted to the physical boundaries of the built-up urban area at that time. However, the urban extent would not remain unchanged forever; it would change accordingly with the increase or decrease in urban residents. In contrast, after the city walls were built, the extent of the city walls generally did not change with the built-up areas over time. The overflowing population would build contiguous settlements outside the wall, especially during peaceful and prosperous periods. During these periods, the extent of city walls could not be consistent with the urban land use. In addition, the urban boundaries before the construction of the city wall were practically unknown. Finally, some special cities, such as those established in the northeast of China at the end of the Qing Dynasty and some urban concessions (such as the Shanghai concession) established by foreigners in the 19th century, often did not build city walls.
After considering the relationship between the size of the city wall and the urban extent, we think that the city wall could be regarded as the urban boundary at least during the period when the city wall exerts its functional role, and the closer the time to the construction of the city wall is, the more consistent the size of city walls and the urban extent is. Therefore, as long as the appropriate periods were selected, the extent of city walls in these periods could be very approximately regarded as the urban extent. In small-scale studies, users can refer to the above principles to select proper data from CCWAD and regard the size of city walls as the urban extents.
CCWAD may enough to satisfy the demand of local and case studies. However, long-term and large-scale urban extent data are highly desirable for urban studies. Since city wall can be regarded as a helpful indicator of the extent of cities, we hope to provide an acceptable national-scale urban extent dataset based on the CCWAD. This is the China Urban Extent Dataset (CUED). To make CUED, it is necessary to extract some suitable representative years from CCWAD to make the dates of city boundaries be in close proximity to the time that most of the city walls were built. This requires statistics and analysis of the city walls' area, the number of walled cities, and the total number of all cities.
We plotted the time series of the number of city walls built (Fig. 7b), the total number of cities (Fig. 7d), the total number of cities that built the city wall (Fig. 7e), and the percentage of the total number of cities (Fig. 7c). It can be seen in Fig. 7b that there were some connections between the number of wall constructions and the area of the extent of the walls. The periods of more construction were often of faster area growth, and the periods of less construction were always of area decline or unchanged. In 1368, there were 1375 cities in China, of which 851 had city walls, accounting for only 62 % of the total (Fig. 7c, d, e). However, in the year 1393, 70 % of cities had city walls; in 1469 it reached 80 %, in 1540 it was 90 %, and in 1576 it was 95 %. Since then, even though the number of cities fluctuated to a considerable extent, the proportion of cities with walls to the total cities remained stable between 95 % and 97 % for a long time. But after 1868, this percentage began to decline, and after 1900 it dropped sharply.
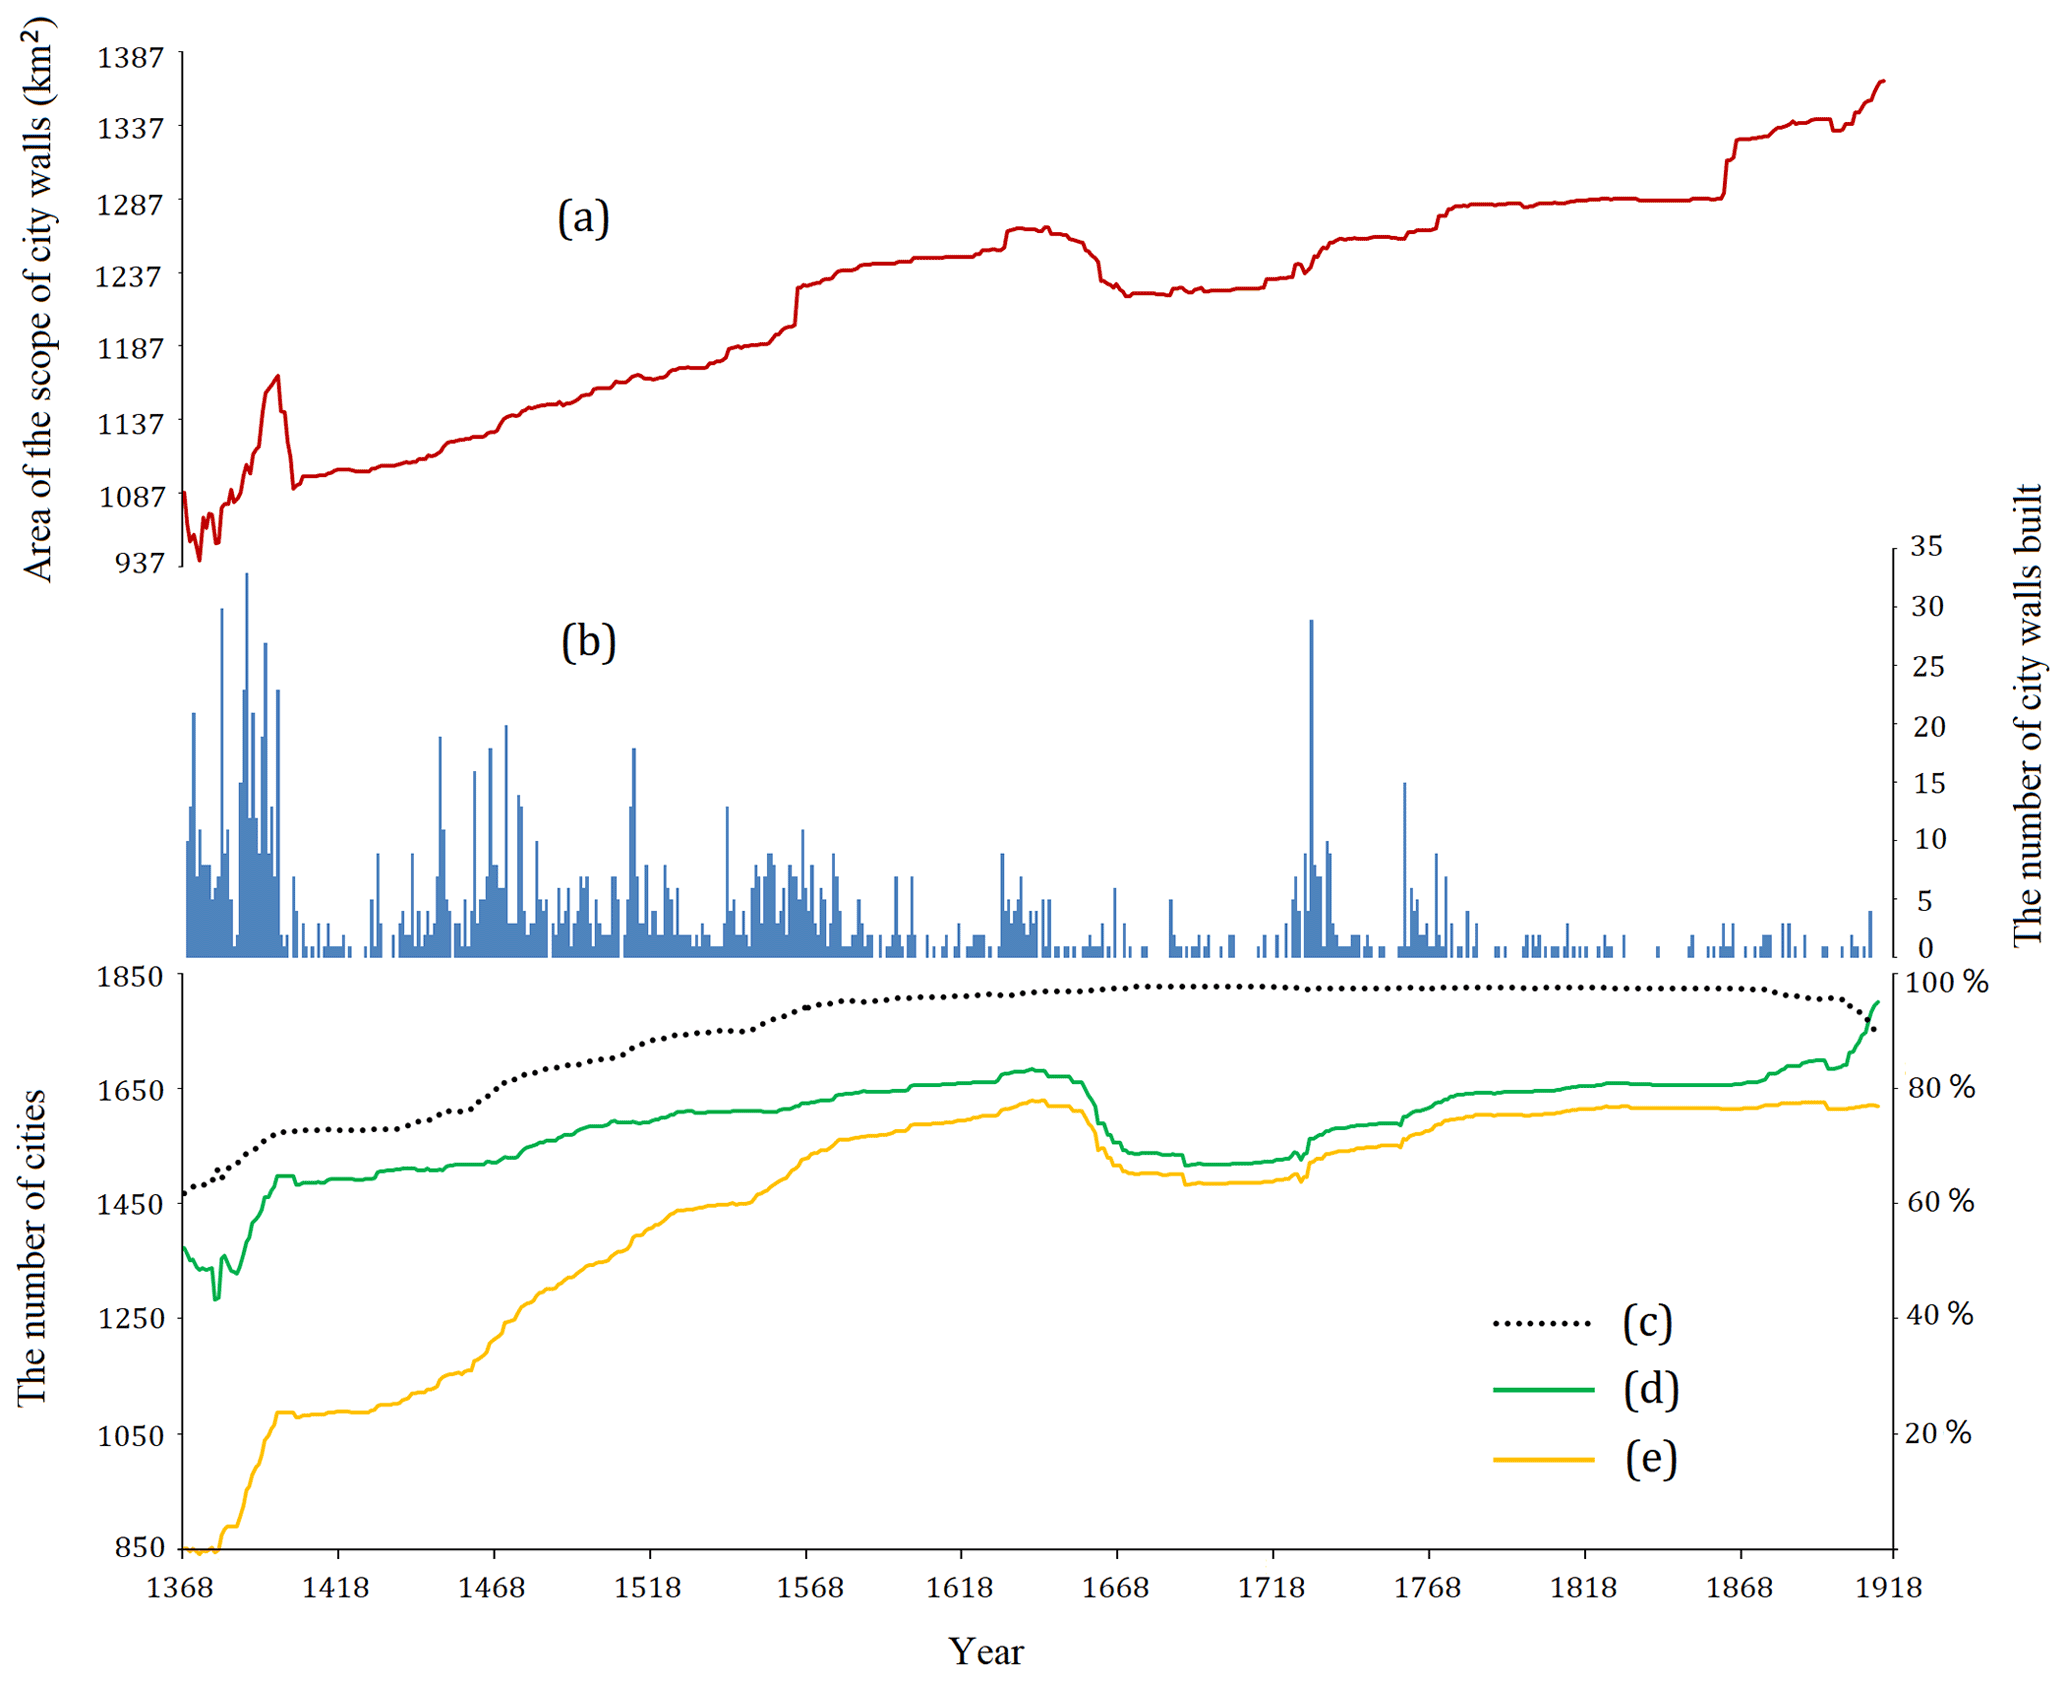
Figure 7Time series of cities and city walls in the Ming and Qing dynasties (1368–1911). (a) The time series of the area of the extent of city walls. (b) The number of city walls built. (c) Walled cities' percentage of the total number of cities. (d) The total number of cities. (e) The total number of walled cities.
According to the above facts, we selected six base years when the area of the city wall extent was closest to the urban boundary from the six time periods (i.e., 1368–1404, 1405–1564, 1565–1662, 1663–1727, 1728–1860, and 1861–1911) to produce the CUED product for the 15th–19th centuries. The selection criteria for the representative years are as follows. Firstly, the proportion of cities with walls to the total cities should be higher. The proportion should generally be more than 90 %, except in the 14th and early 15th centuries. Secondly, after the city walls were built, the extent of the city walls generally did not change with the built-up areas over time, so the representative years should be within only 1 or 2 years after the end of a large-scale construction activities of the city wall period. In addition, the representative year should be selected at a moderate level of changes in the extent of the city wall within the period. Finally, the representative year should avoid major political and military events and severe natural disasters in order to reflect the general level of urban development in that period.
Therefore, we selected 1400, 1537, 1648, 1708, 1787, and 1866 from CCWAD as the representative years to develop the CUED product for the 15th–19th centuries. In these representative years, the extent of city walls and the urban extent were relatively close at the national level. CUED provides the long-term and national-scale urban extent data.
6.1 Accuracy ranking system of the CCWAD and CUED
Due to the differences in data richness and existing relics in various cities, the accuracy of the extent of city walls would also be different. Reliability is a necessary factor to allow researchers and data users to be aware of the accuracy of the data and the subsequent analytical results. So we established an accuracy ranking system for the entire dataset to test consistency. The accuracy ranking is based on the reliability of restored results. It consists of three accuracy levels, A, B, and C, and two special case marks, D and BW. The accuracy ranking A indicates that the authors are quite certain about the restored result, the B indicates that part of the restoration is speculative, and the C means that the restoration is entirely based on supposition. The accuracy ranking mainly depends on the richness of the city's historical documents and the integrity of the ground remains. But the accuracy levels are basically subjective decisions of the authors. In addition, the D indicates that the city has never been walled, so its urban extent is entirely speculative. Those of rank BW indicate that the city did not build a city wall during this lifetime, but it was built later (next lifetime). It expresses the speculation of the urban extent before the city built its original city wall. The hypothetical results of C, D, and BW were based on the city's limited historical documents and physical remains, its administrative level, and the size of the nearby cities. All the rankings were determined after discussion by all authors.
In summary, the accuracy rankings A and B are more credible, accounting for 90 % of the data of CUED and 69 % of CCWAD. The C and D together account for 5 % of CUED and 17 % of CCWAD. Limited by objective conditions, the extent of some cities may be difficult to restore, but it may not be appropriate to exclude these cities directly. Although the accuracy ranking is an uncertainty attribute in our dataset, it is created with the intention of allowing researchers to subset the dataset to the most suitable level of accuracy for each specific analysis. For example, for studies for which the most exact information is required, cities with a certainty ranking of C or D could be rejected. Therefore, we developed the accuracy rankings so that users with different needs could decide how to use these speculative data. Furthermore, improvement and enhancement of the dataset can be better targeted to those cities where geo-locations are suspect – cities with an accuracy value of B or C.
6.2 Comparison with existing historical urban land use results
To validate CCWAD, we use the estimation-based provincial urban land use data (ULUD) for the Qing Dynasty in China (He et al., 2002). Based on the length of city walls data collected from historical documents, ULUD reckoned the areas of urban land use for 18 provinces in 1820. We extract data for 1820 from CCWAD and choose the 1820 administrative division data provided by CHGIS (https://dataverse.harvard.edu/dataverse/chgis_v6_1820, last access: 2 October 2019) to count the area of the extent of city walls in each province. Then we compare the result with the ULUD to validate our dataset (Fig. 8). It is found that areas of the extent of city walls from CCWAD in 1820 showed good consistency with the ULUD (R2=0.89), signifying the reliability of our CCWAD products. But the area of the extent of city walls in each province of CCWAD is only about 60 % of the ULUD. This is probably subject to the overestimations of the urban area in ULUD since ULUD focuses on the length of city walls. The length of city walls recorded in Chinese historical documents is often exaggerated, and ULUD assumes that the shapes of city walls are all square or round, which is far from the actual situation.
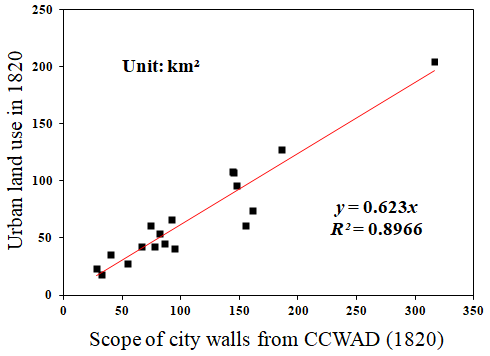
Figure 8Comparison of the area of urban land use in 1820 (ULUD) from He et al. (2002) and the area of the extent of city walls in 1820 from CCWAD.
6.3 The relationship with historical urban population
The increase in urban population is one of the main driving factors for urban land expansion (Paclone, 2001). Thereby we further compared the urban extent data in CUED with the urban population data (UPD) in the Qing Dynasty from Cao (2001b) to validate the accuracy of CUED. UPD provides the urban population for 18 provinces in 1776 and 1893 in the Qing Dynasty, and we count the urban extent areas of these provinces of CUED in 1787 and 1866 for comparison (Fig. 9). UPD includes towns, so its scope is slightly larger than our CUED. The scatter plot between urban population and urban area shows that, on the whole, urban area increased with the urban population, but they are not linearly dependent. In the late 18th century, the urban area and urban population of most provinces are significantly correlated. However, Zhili (today's Hebei, Beijing, Tianjin, and northeastern Henan), Shanxi, Shandong, and Henan have a higher level of urban area than their urban population. Perhaps because these provinces are close to the capital and the Great Wall, the average size of their city walls is larger. Jiangsu and Zhejiang have a lower level of urban area than their urban population, indicating that the urban population density in these provinces is higher and there are more towns (Fig. 9a). In the middle to late 19th century, with the increase in foreign economic activities, the urban population density of the southeastern coast (Guangdong, Zhejiang, Jiangsu) and the midwest (Sichuan, Hubei) increased significantly (Fig. 9b). Long-term changes in the relationship between urban area and urban population are accurately described by CUED, which demonstrated the reliability of CUED.
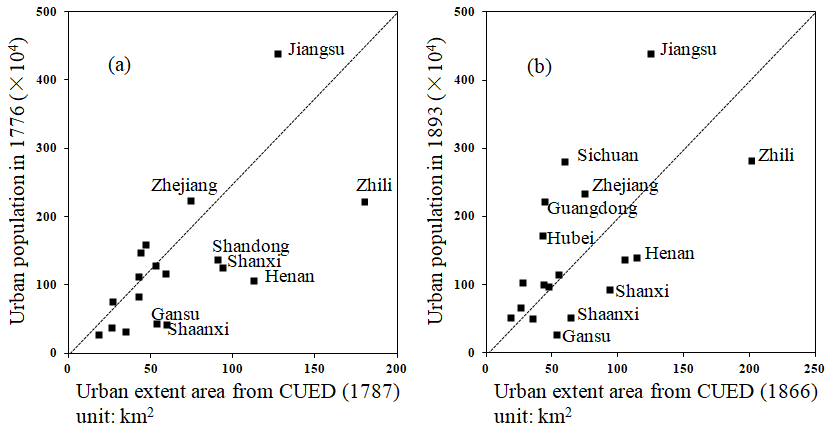
Figure 9Comparison of the urban population in 1776 and 1893 (UPD) and the urban area in 1787 and 1866 from CUED.
Based on the CCWAD product, we plotted the time series of the changes in the area of the city wall's extent. Taking the area of the city walls in 1368 (= 1087.06 km2) as the initial value, Fig. 7a reflects the changes in the area of the city wall area during the Ming and Qing dynasties in China. It can be seen that in the 14th–20th centuries, the extent of the city wall area grew at a slow rate. The smallest area of the city wall was in 1373 (= 1040.98 km2), and the largest area was in 1911 (= 1367.22 km2). According to the change in the slope of Fig. 7a, the area change in the city wall extent can be divided into six periods. Period 1368–1404 was in the early years of the Ming Dynasty: many cities were abandoned due to years of war, which led to a decline in city wall areas. However, these cities were quickly rebuilt, and many military cities were built, making the built-up area soon exceed the level of 1368. At the beginning of the 15th century, the Ming Dynasty abandoned the area north of the Great Wall, and most of the cities in this area were abandoned. After that, in the period 1405–1564, the area of city wall extents grew slowly. From the middle of the 16th century, the situation in the north and southeast was tense, and many cities there built outer city walls, which accelerated the growth of the area of the city walls (period 1565–1662). In the middle of the 17th century, the area of the city walls fell again partly because of the war in the late Ming and early Qing dynasties and also because the Qing government abolished many military cities built by the Ming Dynasty (period 1663–1727). The growth of the area of the city walls in the period 1728–1860 was very slow. Until the middle of the 19th century, the government opened up immigration to the northeast of China, and the area of city walls began to grow rapidly.
Table 1Provincial distribution of urban extents in the 15th–19th centuries.
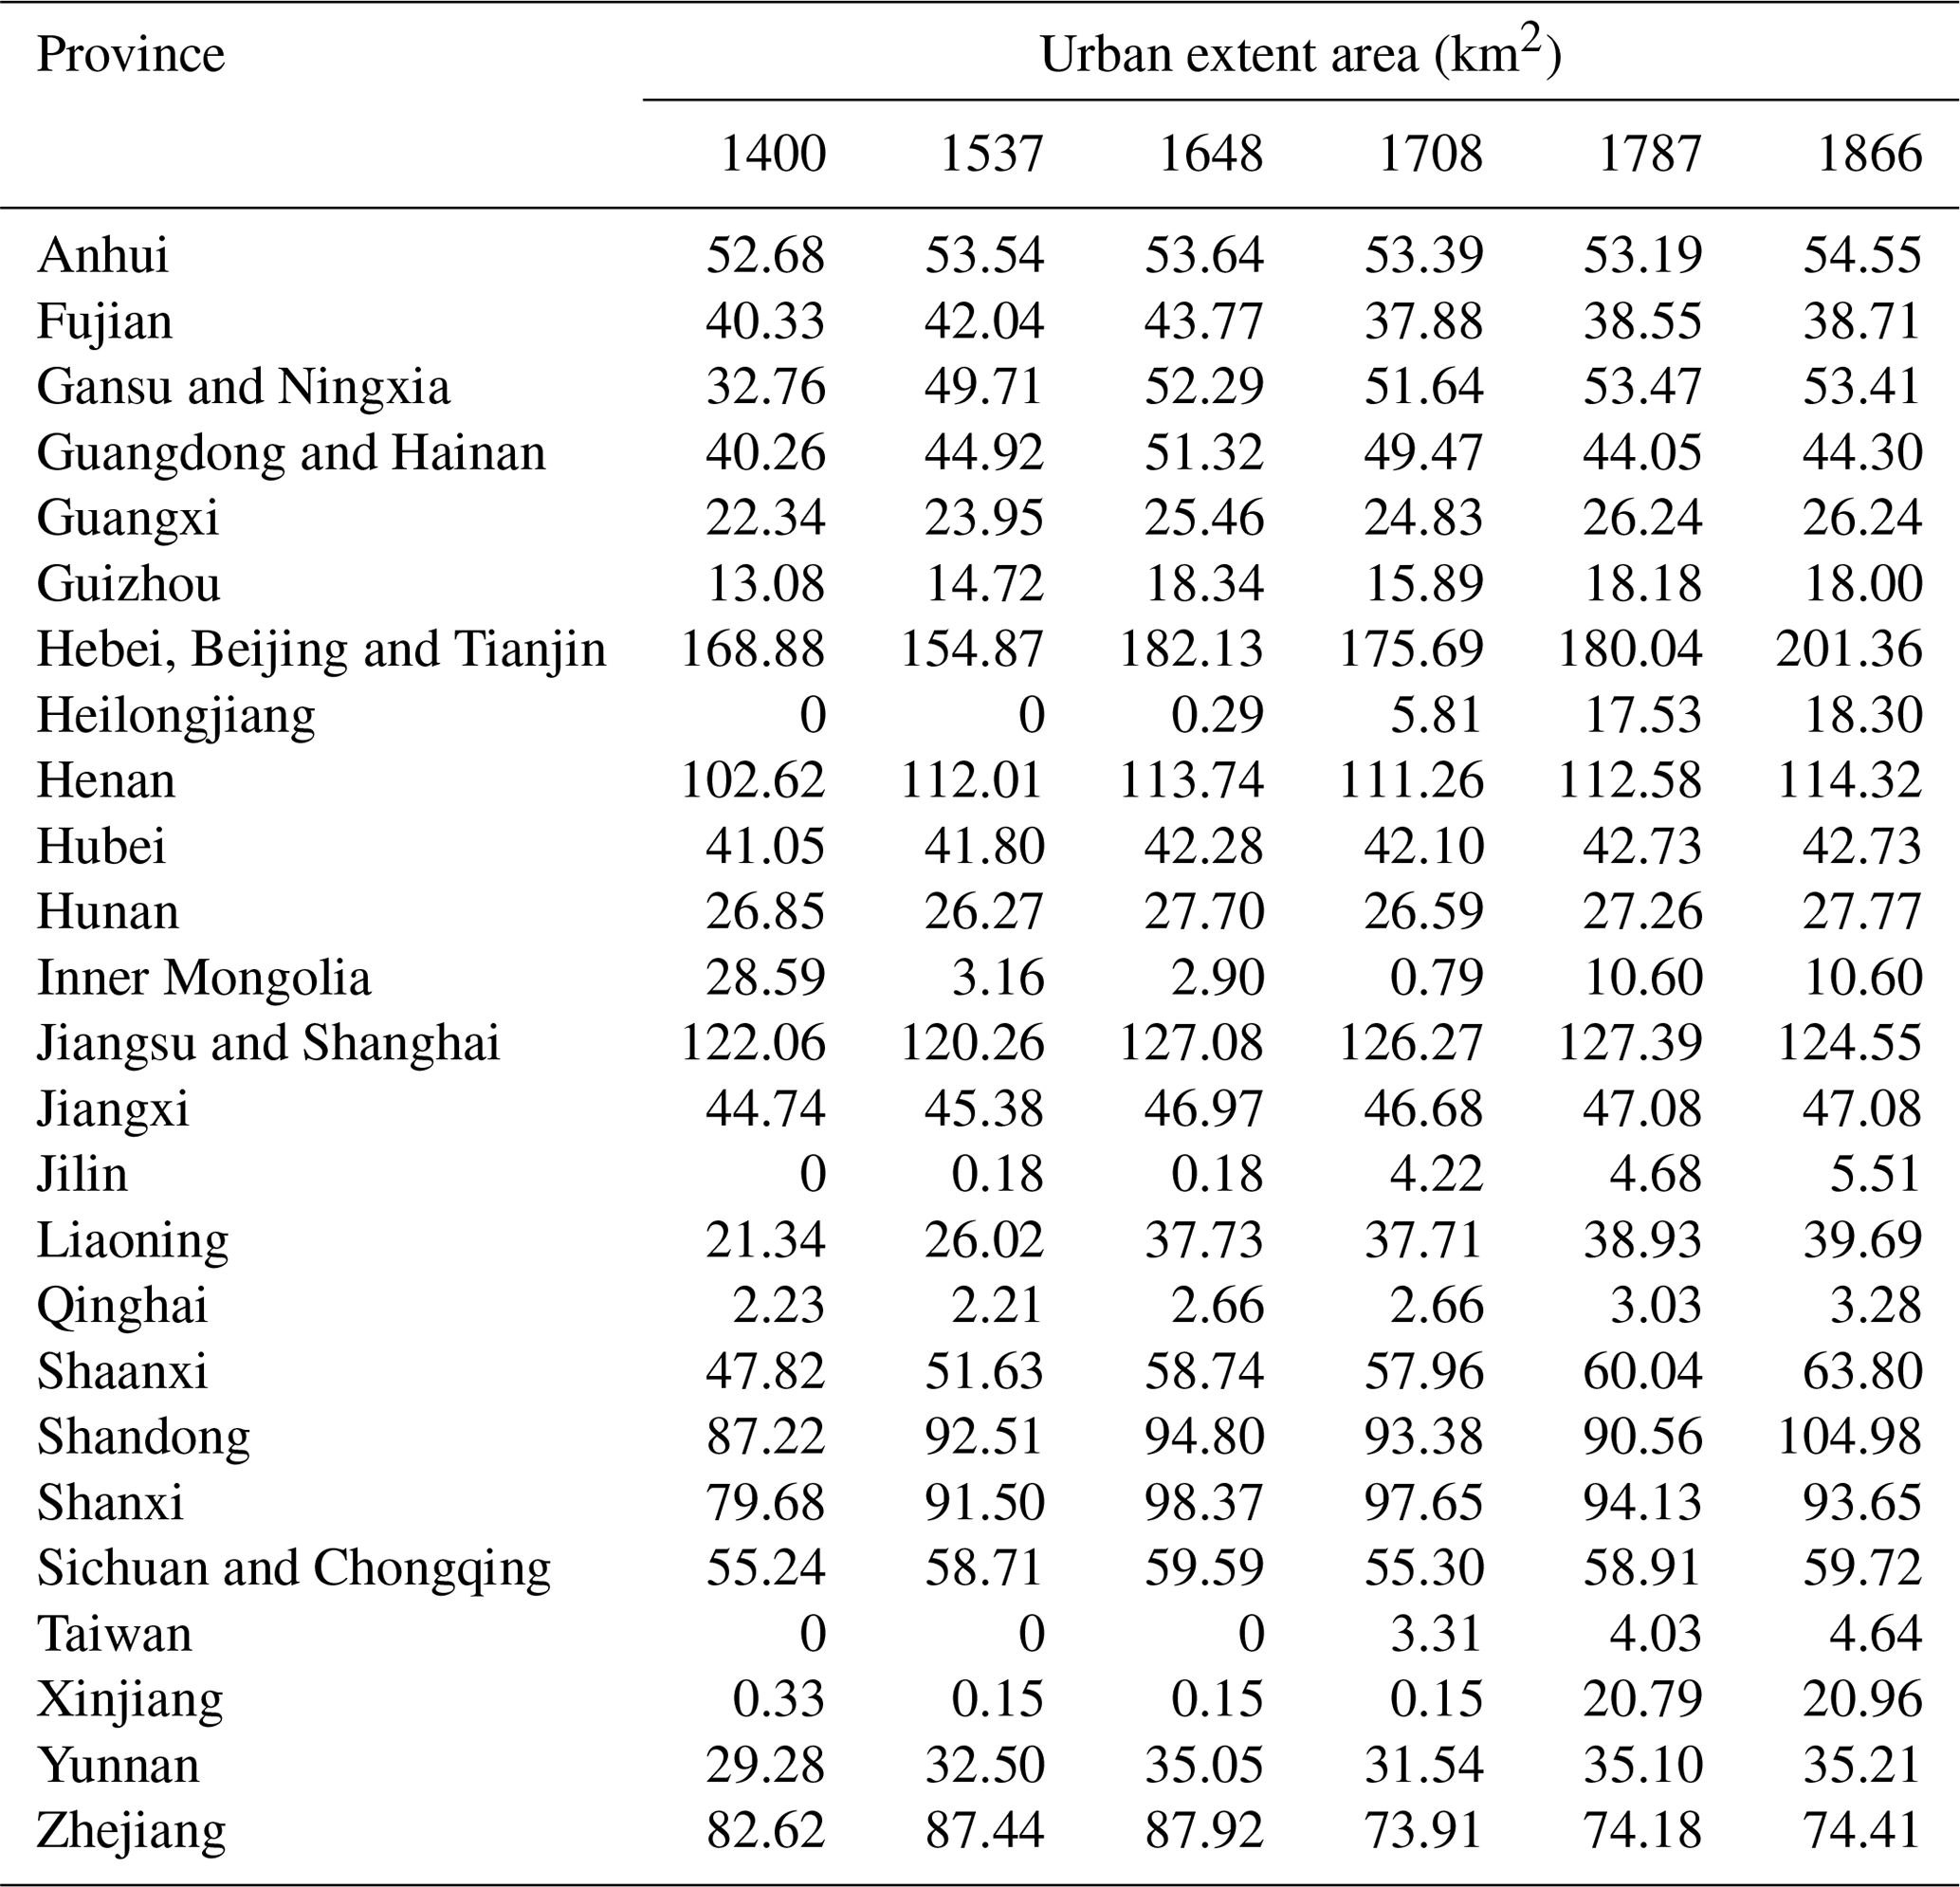
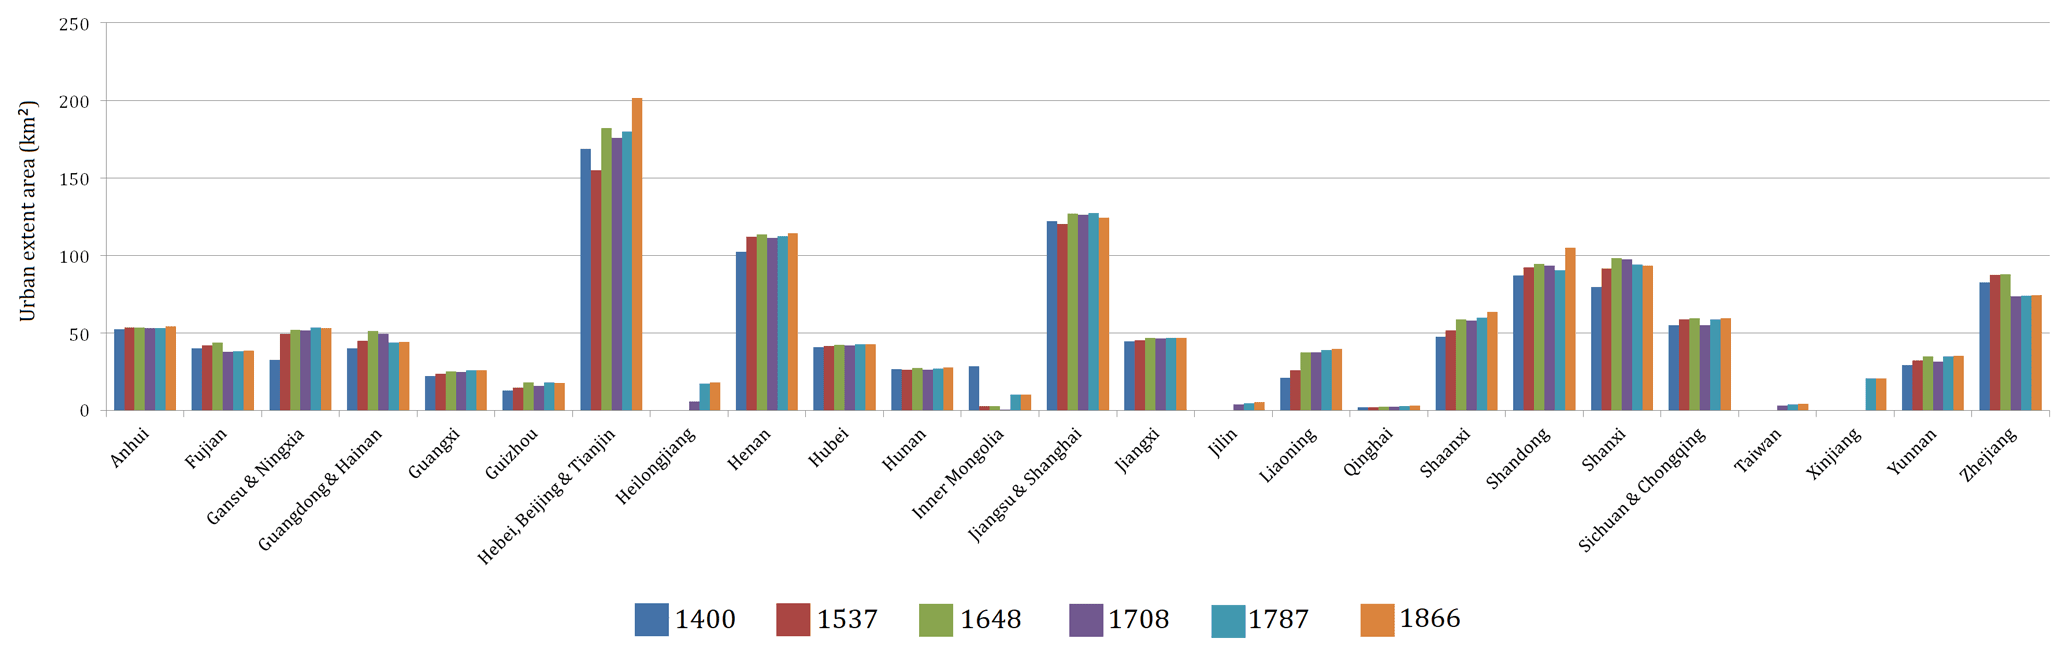
Figure 10Provincial distribution of urban extents in 1400, 1537, 1648, 1708, 1787, and 1866.
Figure 10 based on the CUED product shows the urban extent areas in some provinces in each representative year. Combined with Table 1 and Fig. 1, it can be seen that provinces in the northeast of Region III had the largest urban extent area in the late imperial period in the 15th–19th centuries. Hebei, where the capital Beijing was located, had the largest urban area. Jiangsu and Shanghai, an economically developed area, ranked second, and Henan, a populous province, ranked third. Shandong, Shanxi, and Zhejiang also have large urban areas. During the study period, the urban extent of the above provinces increased steadily or slowly, but Zhejiang province decreased slightly in 1708. That was because the Qing Dynasty issued an order to demolish some coastal cities at that time. The urban extents of other provinces in Region III were roughly the same. Among them, Anhui, Guangxi, Hubei, Hunan, Jiangxi, Sichuan and Chongqing had a long history of land development, and the urban extent remained stable during the 15th–19th centuries. Fujian, Guangdong, and Hainan decreased slightly in 1708 for the same reason as Zhejiang. Yunnan and Guizhou provinces developed intensively and built a number of cities in the early Ming Dynasty. In the middle and late Ming Dynasty, the urban extent of Shaanxi, Liaoning, Gansu, and Ningxia increased rapidly because of the severe military pressure faced by nomads at that time. Taiwan began large-scale development only after the 18th century, and some small cities were built mainly on the west coast.
Jilin and Heilongjiang, located in Region I, had no administrative cities in the Ming Dynasty. After the mid-18th century, with the influx of immigrants, a number of cities were established. Inner Mongolia, located in Region II, had a certain number of cities in the Yuan Dynasty (1271–1368) and the early Ming Dynasty, but by the middle of the Ming Dynasty, these cities were gradually abandoned. It was not until the late 18th century that Inner Mongolia rebuilt some cities with the influx of immigrants. Xinjiang, located in Region IV, was not under the rule of the Ming Dynasty. In the late 18th century, the Qing Dynasty completely conquered Xinjiang and established a number of administrative cities, and the cities of Qinghai in Region V were located in the valleys of the Yellow River and Huangshui River.
The datasets include the CCWAD for 1368–1911 and the CUED for 1400, 1537, 1648, 1708, 1787, and 1866 are publicly available and can be downloaded from https://doi.org/10.6084/m9.figshare.14112968.v3 (Xue et al., 2021).
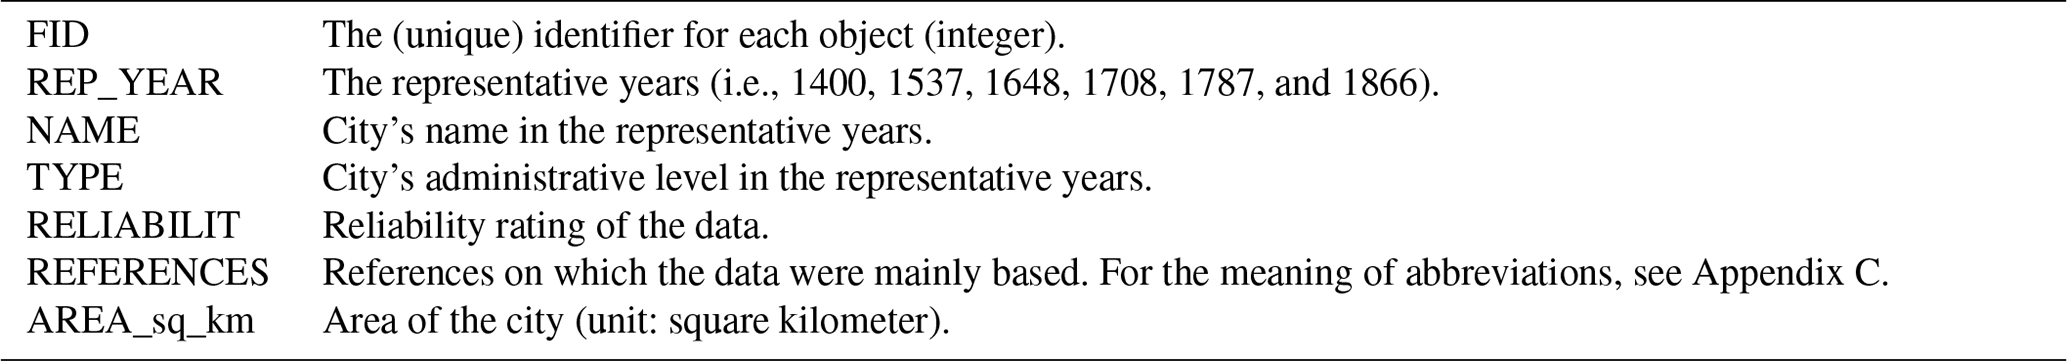
For CCWAD we provide a shapefile file (referring to files with .cpg, .shp, .dbf, .shx, .sbn, .sbx, and .prj extensions). Appendix A provides an introduction to the attributes of CCWAD. For CUED we provide six shapefile files (referring to files with .cpg, .shp, .dbf, .shx, .xml, .sbn, .sbx, and .prj extensions). Appendix B provides an introduction to the attributes of CUED.
Ultimately, we view CCWAD and CUED as a beginning compilation of a richer historical, city-level urban database for late imperial China. Despite the current reliability gaps, these datasets provide a spatially explicit, long-term historical record of walled cities and urban extent of China, especially since no alternative geocoded dataset at such a resolution exists. As a result, this dataset could be used as a foundation to build a full and accurate record of built-up urban areas through history, creating systematic, global built-up area data to measure urban growth on a long timescale.
However, we caution potential CCWAD and CUED users of the following limitations and dataset details:
-
The urban extent dataset (CUED) is derived from the city wall dataset (CCWAD). Strictly speaking, the extent of the city wall cannot be completely equal to the size of the urban extent. The data may better reflect the urban extent in the year when the city wall was built. The lifetime of each urban extent provided by the CCWAD is a period of time, and the urban extent of any year within the time period can be determined. However, if the year to be determined is too far from the year of the construction of the city wall, the actual urban extent may have a large difference from the wall's extent. Before the construction of the city wall, in fact, we could hardly know the actual size of the urban extent, and only the later wall's area was referred to. More often, after the city wall is built, as time goes by, the area farther away from the city gates and the center gradually becomes uninhabited and even becomes cultivated land; the area with convenient transportation outside the city gates forms new built-up areas. Therefore, we recommend that potential CCWAD users should be careful not to be too far away from the year of construction of the city wall when choosing the research years. This was why we generated six representative years in the CUED product in 15th–19th century China.
-
In general, the increase or decrease in the city wall range often means the increase or decrease in the urban extent, but they are not completely synchronized in time. Like most ancient civilizations, city walls in China were primarily defensive military structures. In peacetime, the city walls were useless and often hindered the expansion of cities. During these periods, suburbs grew outside the city gates, and the walls were often neglected or even vandalized. But during the war, the walls became necessary facilities to defend the cities. At this time, if the suburbs outside the city gates had grown large, new suburban walls were built to protect them. Therefore, a paradox is that the development of cities generally requires a peaceful social environment, but the expansion of the city wall area often happened in the period of wars. In this sense, the city wall can be seen as the sign and confirmation of the urban development before wars. Users should understand that it is not the war that has led to the expansion of urban extents, but the expansion of the city wall reflects the development of the city's economy and the increase in population before the outbreak of wars.
-
To sum up, the reliability of this dataset is acceptable, but users need to be aware of whether the reliability rating of the area has fallen when it comes to smaller areas. In the 15th–19th centuries, cities in some regions generally did not build city walls. We use accuracy ranking D to represent the cities without walls in CUED and CCWAD. In CCWAD, there are 436 such cities, accounting for 13 %. In CUED, there are 83 such cities in the representative year 1400, 48 in the year 1537, 43 in the year 1648, 31 in the year 1708, 37 in the year 1787, and 42 in the year 1866; and the proportions are between 2 % and 5 %. Cities without the walls could be roughly divided into two categories. One was the less important cities located in the inland areas. The other was the cities established at the end of the 19th century. At that time, with the advancement of weapons, the defensive significance of the city wall was greatly reduced. When researching these areas, be sure to pay attention to the reliability rating.
-
The objects of our study only include administrative cities. Although almost all cities in late imperial China could be classified as administrative cities, we must point out that the following types of settlements could also be regarded as “cities”, but they are not included in our datasets. (a) In late imperial China, the industrial and commercial settlements without administrative agencies were generally called “markets (shi)” or “towns (zhen)”. The size of the town was generally smaller than the lowest administrative center, the county seat. But there were also some huge towns, such as Hankou, Foshan, Jingde, etc., whose scale exceeded the county seat and even higher-level cities. These huge towns should undoubtedly be regarded as cities, but they are not in the scope of this research. (b) If a city was already there and got chosen later to become an administrative center, in this case, data before the “city” became the administrative center were not included in our datasets. (c) Cities outside the direct administration of the Ming and Qing empires, such as Lhasa, are not included. (d) Cities belonging to colonists, such as Macau, Hong Kong, Qingdao, etc. are not included. The definition of “city” or “urban” in late imperial China is complex and far from conclusive, but we hope that the content of our datasets has a clear border. Therefore, in this study, we defined “city” as the settlement where the administrative center was located. This definition is the same as the general research practice of pre-modern China. As for the cities outside the range of this study, further detailed explorations are needed.
Table A1For the China City Wall Areas Dataset (CCWAD) in 1368–1911 we provide a shapefile file (referring to files with .cpg, .shp, .dbf, .shx, .sbn, .sbx, and .prj extensions). It includes the following attributes.

Table B1For the China Urban Extent Dataset (CUED) for the 15th–19th centuries we provide six shapefile files (referring to files with .cpg, .shp, .dbf, .shx, .xml, .sbn, .sbx, and .prj extensions). It includes six representative years (1400, 1537, 1648, 1708, 1787, and 1866). The data records of CUED in six representative years are the same. They include the following attributes.
The supplement related to this article is available online at: https://doi.org/10.5194/essd-13-5071-2021-supplement.
XJ, QX, and YC originated, conceived, and designed the work. YC collated and studied the historical literature. QX, XJ, XY, and YZ developed and analyzed the dataset. All authors contributed to the writing of the manuscript.
The authors declare that they have no conflict of interest.
Publisher’s note: Copernicus Publications remains neutral with regard to jurisdictional claims in published maps and institutional affiliations.
We would like to thank Lijun Qin, Rui Sun, Shuai Cao, Yuchao Jiang, and Xiaolin Zhang of Nanjing University, Zihao Xu of Yunnan University, and Xinghua Chen of Nanjing Agricultural University for their work of the dataset.
This research has been supported by the National Natural Science Foundation of China (grant no. 41671082).
This paper was edited by David Carlson and reviewed by two anonymous referees.
Bai, X., Dawson, R. J., Urge-Vorsatz, D., Delgado, G. C., Barau, A. S., Dhakal, S., Dodman, D., Leonardsen, L., Masson-Delmotte, V., Roberts, D. C., and Schultz, S.: Six research priorities for cities and climate change, Nature, 555, 23–25, https://www.nature.com/articles/d41586-018-02409-z (last access: 2 February 2019), 2018.
Cao, S.: Chinese population history, Vol. 4 (the Ming Dynasty), Fudan University Press, Shanghai, China, 2000 (in Chinese).
Cao, S.: A study on the population of northern cities in Qing Dynasty, a discussion with William Skinner, Chinese Journal of Population Science, 4, 15–28, 2001a (in Chinese).
Cao, S.: Chinese population history, Vol. 5 (the Qing Dynasty), Fudan University Press, Shanghai, China, 2001b (in Chinese).
Chandler, T.: Four thousand years of urban growth: an historical census, The Edwin Mellen Press, Lewiston, NY, USA, 1987.
Chang, K.: The archaeology of ancient China (4th edition, revised and enlarged), Yale University Press, New Haven, CT, USA and London, UK, 1986.
Chang, S.: Some observations on the morphology of Chinese walled cities, Ann. Assoc. Am. Geogr., 60, 63–91, 1970.
Cheng, Y.: The urban size and administrative scales in the Qing Dynasty, Journal of Yangzhou University (Humanities and Social Sciences Edition), 11, 124–128, 2007 (in Chinese).
Cheng, Y.: City wall data compilation of Book Integration of Ancient and Modern Times, China Social Sciences Press, Beijing, China, 2016a (in Chinese).
Cheng, Y.: City wall data compilation of local Chronicles, China Social Sciences Press, Beijing, 2016b (in Chinese).
Cheng, Y.: City wall data compilation of Unified Records of the Qing Dynasty, China Social Sciences Press, Beijing, 2016c (in Chinese).
Cheng, Y.: Discussion with the Professor Peter K. Bol about his exploring the proposition in the map: taking Yujitu of 1136 as a case, Journal of Tsinghua University (Philosophy and Social Sciences), 34, 99–105, 2019 (in Chinese).
Conzen, M. R. G.: Alnwick, Northumberland: a study in town-plan analysis, Institute of British Geographers, London, UK, 1969.
Doxiadis, C. A.: Ekistics, the science of human settlements: Ekistics starts with the premise that human settlements are susceptible of systematic investigation, Science, 170, 393–404, https://doi.org/10.1126/science.170.3956.393, 1970.
Fu, L., Lin, J., Ren, Y., and Wang, W.: General history of administrative regions in China (the volume of Qing Dynasty), Fudan University Press, Shanghai, China, 2013 (in Chinese).
Goldewijk, K. K., Dekker, S. C., and Zanden, J. L.: Per-capita estimations of long-term historical land use and the consequences for global change research, Journal of Land Use Science, 12, 313–337, 2017.
Gong, P., Li, X., and Zhang, W.: 40-Year (1978–2017) human settlement changes in China reflected by impervious surfaces from satellite remote sensing, Sci. Bull., 64, 756–763, https://doi.org/10.1016/j.scib.2019.04.024, 2019.
Guo, H. and Jin, R.: General history of administrative regions in China (the volume of Ming Dynasty), Fudan University Press, Shanghai, China, 2007 (in Chinese).
He, F., Ge, Q., and Zheng, J.: Reckoning the areas of urban land use and their comparison in the Qing Dynasty in China, Acta Geopraphica Sinica, 57, 709–716, 2002 (in Chinese).
Hedefalk, F., Svensson, P., and Harrie, L.: Spatiotemporal historical datasets at micro-level for geocoded individuals in five Swedish parishes, 1813–1914, Sci. Data, 4, 170046, https://doi.org/10.1038/sdata.2017.46, 2017.
Ho, P.: Studies on the population of China, 1368–1953, Harvard University Press, Cambridge, MA, USA, 1959.
Jiang, W.: Number of commercial towns in Jiangnan: a sharp contrast of the number of commercial towns between Changshu and Wujiang, Journal of Chinese Historical Geography, 32, 56–69, 2017 (in Chinese).
Knapp, R.: China's walled cities, Oxford University Press, Oxford, UK, 2000.
Kostof, S.: The city assembled: the elements of urban from through history, Thames & Hudson Inc., New York, NY, USA, 1992.
Kuang, W., Zhang, S., Li, X., and Lu, D.: A 30 m resolution dataset of China's urban impervious surface area and green space, 2000–2018, Earth Syst. Sci. Data, 13, 63–82, https://doi.org/10.5194/essd-13-63-2021, 2021.
Lai, Y.: The changing spatial pattern of Jiangyin city Song, Historical Review, 179, 17–29, 2019 (in Chinese).
Leyk, S., Uhl, J. H., Connor, D. S., Braswell, A. E., Mietkiewicz, N., Balch, J. K., and Gutmann, M.: Two centuries of settlement and urban development in the United States, Sci. Adv., 6, eaba2937, https://doi.org/10.1126/sciadv.aba2937, 2020.
Li, B.: Agricultural development in Jiangnan, 1620–1850, St. Martin's Press, New York, NY, USA, 1997.
Li, X. and Wu, H.: Application of color infrared aerial photography to study urban historical geography: taking the relationship between cultural landscape evolution and river course change in the three riverside cities of Jiujiang, Wuhu and Anqing as an example, Journal of Peking University, Historical Geography Special Issue, 37–41, 1992 (in Chinese).
Lin, Y., Jin, X., Yang, X., Long, Y., and Zhou, Y.: Dataset establishment and spatial reconstruction of urban and rural construction land of Jiangsu Province in the past 200 years, Acta Geopraphica Sinica, 72, 488–506, 2017 (in Chinese).
Liu, H., Gong, P., Wang, J., Clinton, N., Bai, Y., and Liang, S.: Annual dynamics of global land cover and its long-term changes from 1982 to 2015, Earth Syst. Sci. Data, 12, 1217–1243, https://doi.org/10.5194/essd-12-1217-2020, 2020.
Lu, X.: Inside and outside the city wall: urban form and spatial structure in ancient Han River basin, Zhonghua Press, Beijing, China, 2011 (in Chinese).
Mumford, L.: The city in history: its origins, its transformations, and its prospects, Harvest Books, San Diego, CA, USA, 1968.
Paclone, M.: The internal structure of cities in the third world, Geography, 3, 189–209, 2001.
Perkins, D.: Agricultural development in China 1368–1968, Edinburgh University Press, Edinburgh, UK, 1969.
Qin, L., Jin, X., Jiang, Y., Xue, Q., Cheng, Y., Long, Y., Yang, X., and Zhou, Y.: Analysis of the spatial pattern of urban areas and urban system of Yangtze River Delta in the past 600 years, Geogr. Res., 38, 1045–1062, 2019 (in Chinese).
Reba, M., Reitsma, F., and Seto, K. C.: Spatializing 6,000 years of global urbanization from 3700 BC to AD 2000, Sci. Data, 3, 160034, https://doi.org/10.1038/sdata.2016.34, 2016.
Rodriguez, R. S., Ürge-Vorsatz, D., and Barau, A. S.: Sustainable Development Goals and climate change adaptation in cities, Nat. Clim. Change, 8, 181–183, https://doi.org/10.1038/s41558-018-0098-9, 2018.
Sanchez-Rodriguez, R., Seto, K. C., Simon, D., Solecki, W., Kraas, F., and Laumann, G.: Science Plan: urbanization and global environmental change, International Human Dimensions Programme on Global Environmental Change, Bonn, Germany, 2005.
Seto, K. C. and Ramankutty, N.: Hidden linkages between urbanization and food systems, Science, 352, 943–945, https://doi.org/10.1126/science.aaf7439, 2016.
Seto, K. C., Guneralp, B., and Hutyra, L. R.: Global forecasts of urban expansion to 2030 and direct impacts on biodiversity and carbon pools, P. Natl. Acad. Sci. USA, 109, 16083–16088, https://doi.org/10.1073/pnas.1211658109, 2012.
Skinner, W. (Ed.): The city in late imperial China, Stanford University Press, Stanford, CA, USA, 1977.
Solecki, W., Seto, K. C., and Marcotullio, P.: It's time for an urbanization science, Environment, 55, 12–17, https://doi.org/10.1080/00139157.2013.748387, 2013.
Tan, Q. (Ed.): The historical atlas of China, China Cartographic Publishing House, Beijing, China, 1982 (in Chinese).
Uhl, J. H., Leyk, S., McShane, C. M., Braswell, A. E., Connor, D. S., and Balk, D.: Fine-grained, spatiotemporal datasets measuring 200 years of land development in the United States, Earth Syst. Sci. Data, 13, 119–153, https://doi.org/10.5194/essd-13-119-2021, 2021.
Xue, Q., Cheng, Y., and Jin, X.: A GIS dataset of urban built-up area along the Silk Road in the Ming and Qing dynasties, China Scientific Data, 3, http://csdata.org/p/189/ (last access: 20 October 2019), 2018.
Xue, Q., Jin, X., Cheng, Y., Yang, X., and Zhou, Y.: The dataset of walled cities and urban extent in late imperial China in 15th–19th centuries, Figshare [data set], https://doi.org/10.6084/m9.figshare.14112968.v3, 2021.
Yee, D. K., Harley, J. B., and Woodward, D.: The history of cartography, volume 2, book 2: cartography in the traditional east and southeast Asian societies, The University of Chicago Press, Chicago, IL, USA, 1994.
Zhang, Z.: Ancient cities in Taiwan, Joint Publishing, Beijing, China, 2009 (in Chinese).
Zhong, C.: Lone-term morphological changes of the old Shanghai town: a meso-scale study in town-plan analysis, Journal of Chinese Historical Geography, 3, 56–70, 2015 (in Chinese).
Zhou, Z. (Ed.): General history of administrative regions in China, Fudan University Press, Shanghai, China, 2007–2016 (in Chinese).
- Abstract
- Introduction
- Study area
- Data sources
- The strategy of developing the CCWAD product
- The urban extent data with the CUED product
- The accuracy of the CCWAD and CUED
- Results
- Data availability
- Conclusion and outlook
- Appendix A: Data records of CCWAD
- Appendix B: Data records of CUED
- Appendix C
- Author contributions
- Competing interests
- Disclaimer
- Acknowledgements
- Financial support
- Review statement
- References
- Supplement