the Creative Commons Attribution 4.0 License.
the Creative Commons Attribution 4.0 License.
 | 14 Sep 2021
A spectral library for laser-induced fluorescence analysis as a tool for rare earth element identification
Jan Beyer
Sandra Lorenz
Suchinder Sharma
Axel D. Renno
Johannes Heitmann
Richard Gloaguen
With the recurring interest in rare earth elements (REEs), laser-induced fluorescence (LiF) may provide a powerful tool for their rapid and accurate identification at different stages along their value chain. Applications to natural materials such as minerals and rocks could complement the spectroscopy-based toolkit for innovative, non-invasive exploration technologies. However, the diagnostic assignment of detected emission lines to individual REEs remains challenging because of the complex composition of natural rocks in which they can be found. The resulting mixed spectra and the large amount of data generated demand automated approaches of data evaluation, especially in mapping applications such as drill core scanning. LiF reference data provide the solution for robust REE identification, yet they usually remain in the form of tables of published emission lines. We show that a complete reference spectra library could open manifold options for innovative automated analysis.
We present a library of high-resolution LiF reference spectra using the Smithsonian rare earth phosphate standards for electron microprobe analysis. We employ three standard laser wavelengths (325, 442, 532 nm) to record representative spectra in the UV-visible to near-infrared spectral range (340–1080 nm). Excitation at all three laser wavelengths yielded characteristic spectra with distinct REE-related emission lines for EuPO4, TbPO4, DyPO4 and YbPO4. In the other samples, the high-energy excitation at 325 nm caused unspecific, broad-band defect emissions. Here, lower-energy laser excitation is shown to be successful for suppressing non-REE-related emission. At 442 nm excitation, REE reference spectra depict the diagnostic emission lines of PrPO4, SmPO4 and ErPO4. For NdPO4 and HoPO4 the most efficient excitation was achieved with 532 nm. Our results emphasise the possibility of selective REE excitation by changing the excitation wavelength according to the suitable conditions for individual REEs. Our reference spectra provide a database for the transparent and reproducible evaluation of REE-bearing rocks. The LiF spectral library is available at zenodo.org and the registered DOI https://doi.org/10.5281/zenodo.4054606 (Fuchs et al., 2020). Primarily addressing the raw material exploration sector, it aids particularly the development of advanced data processing routines for LiF analysis but can also support further research on the REE luminescence in natural rocks or artificial compounds. It gives access to traceable data for the comparison of emission line positions, emission line intensity ratios and splitting into emission line sub-levels or can be used as reference or training data for automated approaches of component assignment.
- Article
(4952 KB) - Full-text XML
- BibTeX
- EndNote


The exploding demand for rare earth elements (REEs) for the high-tech industry, e-mobility and the energy transition justifies the need for efficient detection methods all along the value chain, especially in raw material exploration and recycling but also in science and processing or production monitoring (e.g. National Research Council, 2008; Lima and Filho, 2015; Barakos et al., 2016; European Commission, 2014, 2018). Spectroscopy-based methods are of paramount importance in overcoming time- and cost-intensive exploration routines in a world of depleting, increasingly complex and more remote raw material deposits.
Reflectance spectroscopy has shown an immense potential for fast, non-invasive mineral mapping. Several studies particularly demonstrated advances in reflectance hyperspectral imaging (in the following abbreviated as HSI) of REEs in natural materials from close-range scanning of drill cores and outcrops or from drone-borne data of larger-scale areas (e.g. Boesche et al., 2015; Turner, 2015; Neave et al., 2016; Zimmermann et al., 2016; Booysen et al., 2019). However, an absorption feature-based identification relies in most application cases on single REEs (e.g. Nd, Pr, Sm), which then serve as pathfinders for the other REEs based on strong geochemical similarities and consequently assumptions of generic relationships during geological processes. Key to result validation are reference spectra. Established spectral libraries such as from the USGS (Kokaly et al., 2017) give access to the necessary reference data for automated identification routines. This trend is also recognised by Fasnacht et al. (2019), who released a new library explicitly dedicated to serve for advanced automated data processing including machine learning approaches.
Laser-induced fluorescence (LiF) provides a particularly well-suited alternative for REE identification. The distinct, narrow emission lines in LiF spectra correspond to element-specific electron excitation–radiative relaxation processes. The resulting energy release in the form of photons shows characteristic wavelengths dependent on the electronic configuration of the elements (i.e. the trivalent REE with a partially filled 4f-shell) and on the configuration of the element in relation to its neighbour within the crystal lattice (Gaft et al., 2005; Gaft and Panczer, 2013). The diagnostic LiF signatures deliver the spectral fingerprints that can be used in numerous applications in raw material characterisation.
Kauppinen et al. (2014) demonstrated the application of LiF for fast mineral mapping of, for example, drill cores, while others investigated the LiF for horizon control of mining machines (e.g. Nienhaus and Bayer, 2003) or quality control of mineral processing and sorting (e.g. Broicher, 2000, 2005). However, the mapping application cases focused on general measures of emission intensities or their ratios rather than on specific features in LiF spectra. Other studies emphasise the high potential of LiF for REE detection in natural rocks (Reisfeld et al., 1996; Gaft et al., 2005; Lorenz et al., 2019; Seidel et al., 2019). Despite the promising studies, the method is not yet deployed in the raw material sector. To facilitate applications of LiF for REE detection in mineral exploration and related fields of material characterisation, the access to robust, traceable spectral reference data is needed.
LiF reference data are often very specific and limited (e.g. restricted to only a few REEs), and spectra are usually available only as plots (e.g. Czaja et al., 2008; Friis et al., 2010). Comprehensive summaries are given in the form of tables with emission band positions along with information on excitation conditions (e.g. Gaft et al., 2005) and, similarly, in some online databases (e.g. CSIRO, 2019; Barmarin, 2020). Such data limit emerging automated data analysis approaches to a few parameters, while other information stored in LiF spectra remains unspecified (e.g. relative intensities, emission sub-levels). Although not within scope of the presented study, such information opens manifold possibilities also for future research questions not only in the mineral exploration field. Nevertheless, the availability of new, sophisticated, automated data processing routines emphasise already today the need for digital reference data of complete spectra, comparable to those for HSI (e.g. Kokaly et al., 2017) or Raman spectroscopy (e.g. Lafuente et al., 2015). Such reference data are crucial to further develop and automate the LiF-based REE detection and analytical capacities for analyses of REE abundances and their spectral representation in natural rocks.
In this study, we present an open, digital LiF spectral library from REE phosphates as a traceable reference data repository that is available at https://zenodo.org, last access: 20 July 2021, DOI: https://doi.org/10.5281/zenodo.4054606 (Fuchs et al., 2020). The library comprises the spectral information as high-resolution data in the visible to near-infrared range (350–1080 nm) to cover the major REE diagnostic emissions. LiF spectral fingerprints of REEs in phosphates are important because phosphates represent a group of typical REE-bearing minerals, e.g. monazite-(Ce), monazite-(La), monazite-(Nd) and monazite-(Sm) (LREE(PO4)), xenotime-(Y) and xenotime-(Yb) (Y(PO4) and Yb(PO4), respectively), or apatites (Ca5(PO4)3(OH,F,Cl)). Those minerals are relevant in many REE deposits such as in Siilinjärvi and Korsnäs (Finland) (e.g. Goodenough et al., 2016), in Lovozero and Khibina (Kola Peninsula, Russia) (e.g. Kalashnikov et al., 2016) , in Bayan Obo (China) and Mt. Weld (Western Australia) (e.g. Emsbo et al., 2015; Lima and Filho, 2015), or in Ilimaussaq (South Greenland) (e.g. Zirner et al., 2015). We use reference material for electron microprobe analyses from the Smithsonian's Department of Mineral Sciences to base spectral results on well-studied and referenced material (Jarosewich and Boatner, 1991; Donovan et al., 2002).
Our study aims to provide a useful database for mineral characterisation in LiF-based REE exploration, in which particular target groups are developers of advanced data processing routines and of technical implementations but also various scientists working on further aspects of REE luminescence. Therefore, the scope of our study focuses on (1) characterising the observed emissions in LiF spectra of the Smithsonian REE phosphate standards by LiF, (2) investigating the suitability of three standard laser wavelengths (325, 442, 532 nm) with respect to excitation efficiency and selectivity, (3) introducing a LiF spectral library from REE phosphates as a transparent reference for robust evaluation of LiF data acquired from natural rocks, and (4) encouraging others to publish spectral data (a) to complement the REE spectral library and (b) to expand the published knowledge on variations related to the chemical and mineralogical composition of natural (host) materials.
2.1 Rare earth element standards
We used two sets of homogeneous, well-characterised, synthetic REE orthophosphates (crystal size of 0.5–3.0 mm) from the Smithsonian National Museum of Natural History, Department of Mineral Sciences (sample IDs: NMNH 16484–NMNH 168499; Jarosewich and Boatner, 1991; Donovan et al., 2002, 2003; see Table 1; for available data sheets see Smithsonian National Museum of Natural History, 2019), to determine representative REE fluorescence spectra. The relatively simple crystallographic structure of the orthophosphates responsible for a simple defect configuration and the relatively pure chemical composition promote the material to deliver REE reference spectra without perturbances from mixed REEs or complex mineral hosts of natural materials.
Previous analyses of the REE orthophosphates confirmed a high quality of the material regarding REE purity (Jarosewich and Boatner, 1991; Donovan et al., 2002, 2003). However, Donovan et al. (2002) detected REE cross-contamination of mass fractions on the order of 10−4 by instrumental neutron activation analysis (NAA) and found Pb contamination in at least 7 out of the 16 samples (see Table 1). Based on their analytical data, Donovan et al. (2002) determined a roughly 2 %–4 % relative deviation from the expected (theoretical) sample composition but found only the Pb concentration in CePO4, LaPO4 and SmPO4 to possibly affect electron microprobe results. However, our recorded luminescence spectra do not indicate any Pb-related emission features.
Table 1Overview of rare earth element (REE) phosphate samples from the Smithsonian National Museum of Natural History used in this study for the LiF spectral library (based on Jarosewich and Boatner, 1991; Donovan et al., 2002, 2003; LREE: light REE; HREE: heavy REE; ID: identification number of the Smithsonian National Museum of Natural History; data sheets at Smithsonian National Museum of Natural History (2019)) Pb trace analysis values represent the average mass fraction of 10 measurements from instrumental neutron activation analysis. Values are given in wt % × 10−2 to reduce number of zero digits. The given uncertainty values state 1 standard deviation.
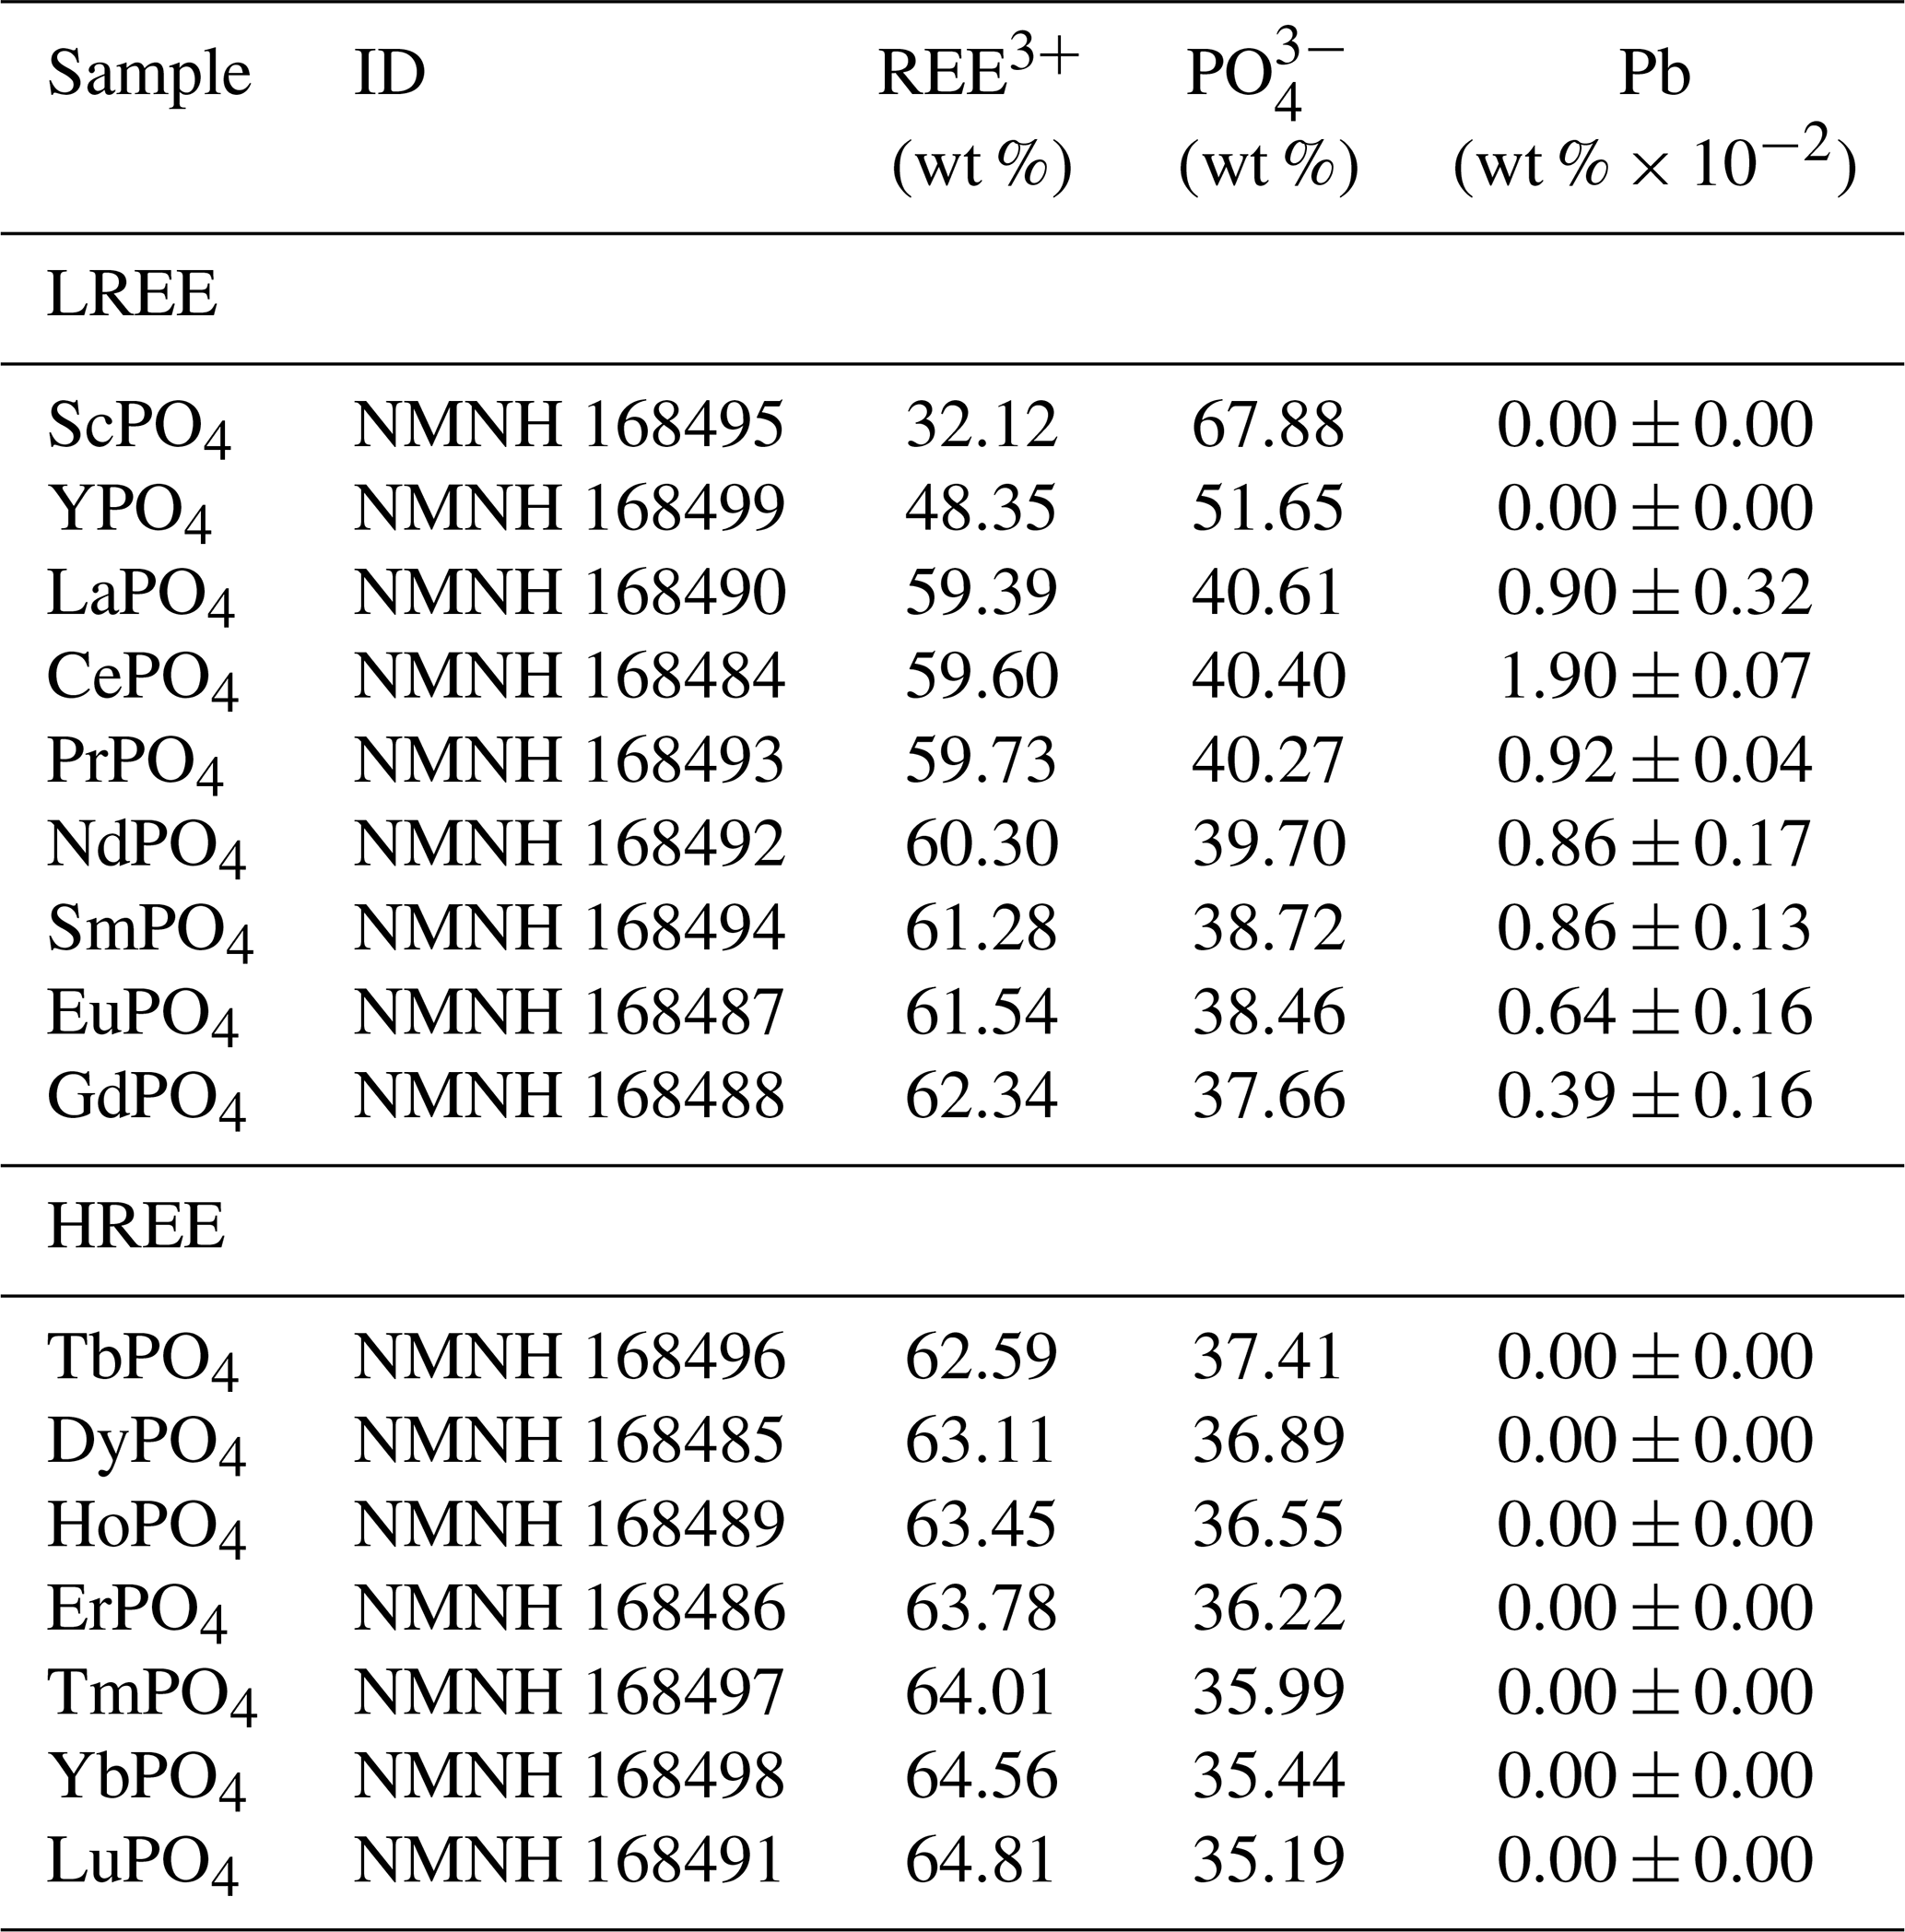
Both sets belong to the same original population of REE reference samples for electron microprobe analysis (Jarosewich and Boatner, 1991) and differ only by one being embedded in a disc of epoxy resin and one being available in the form of single grains (see Fig. 1). Together, the measured REEs in the given orthophosphate samples comprise Sc, Y, Pr, Nd, Sm, Eu, Tb, Dy, Ho, Er, Tm and Yb for embedded standards. From the same material production series, we additionally measured single grain specimens of the already mentioned REEs plus Ce, La and Lu. No diagnostic emission lines are expected for Sc, Y, La and Lu according to their electronic configuration, and hence, those four REE were not included in our library. The diagnostic emission lines of Gd lie outside the detection range.
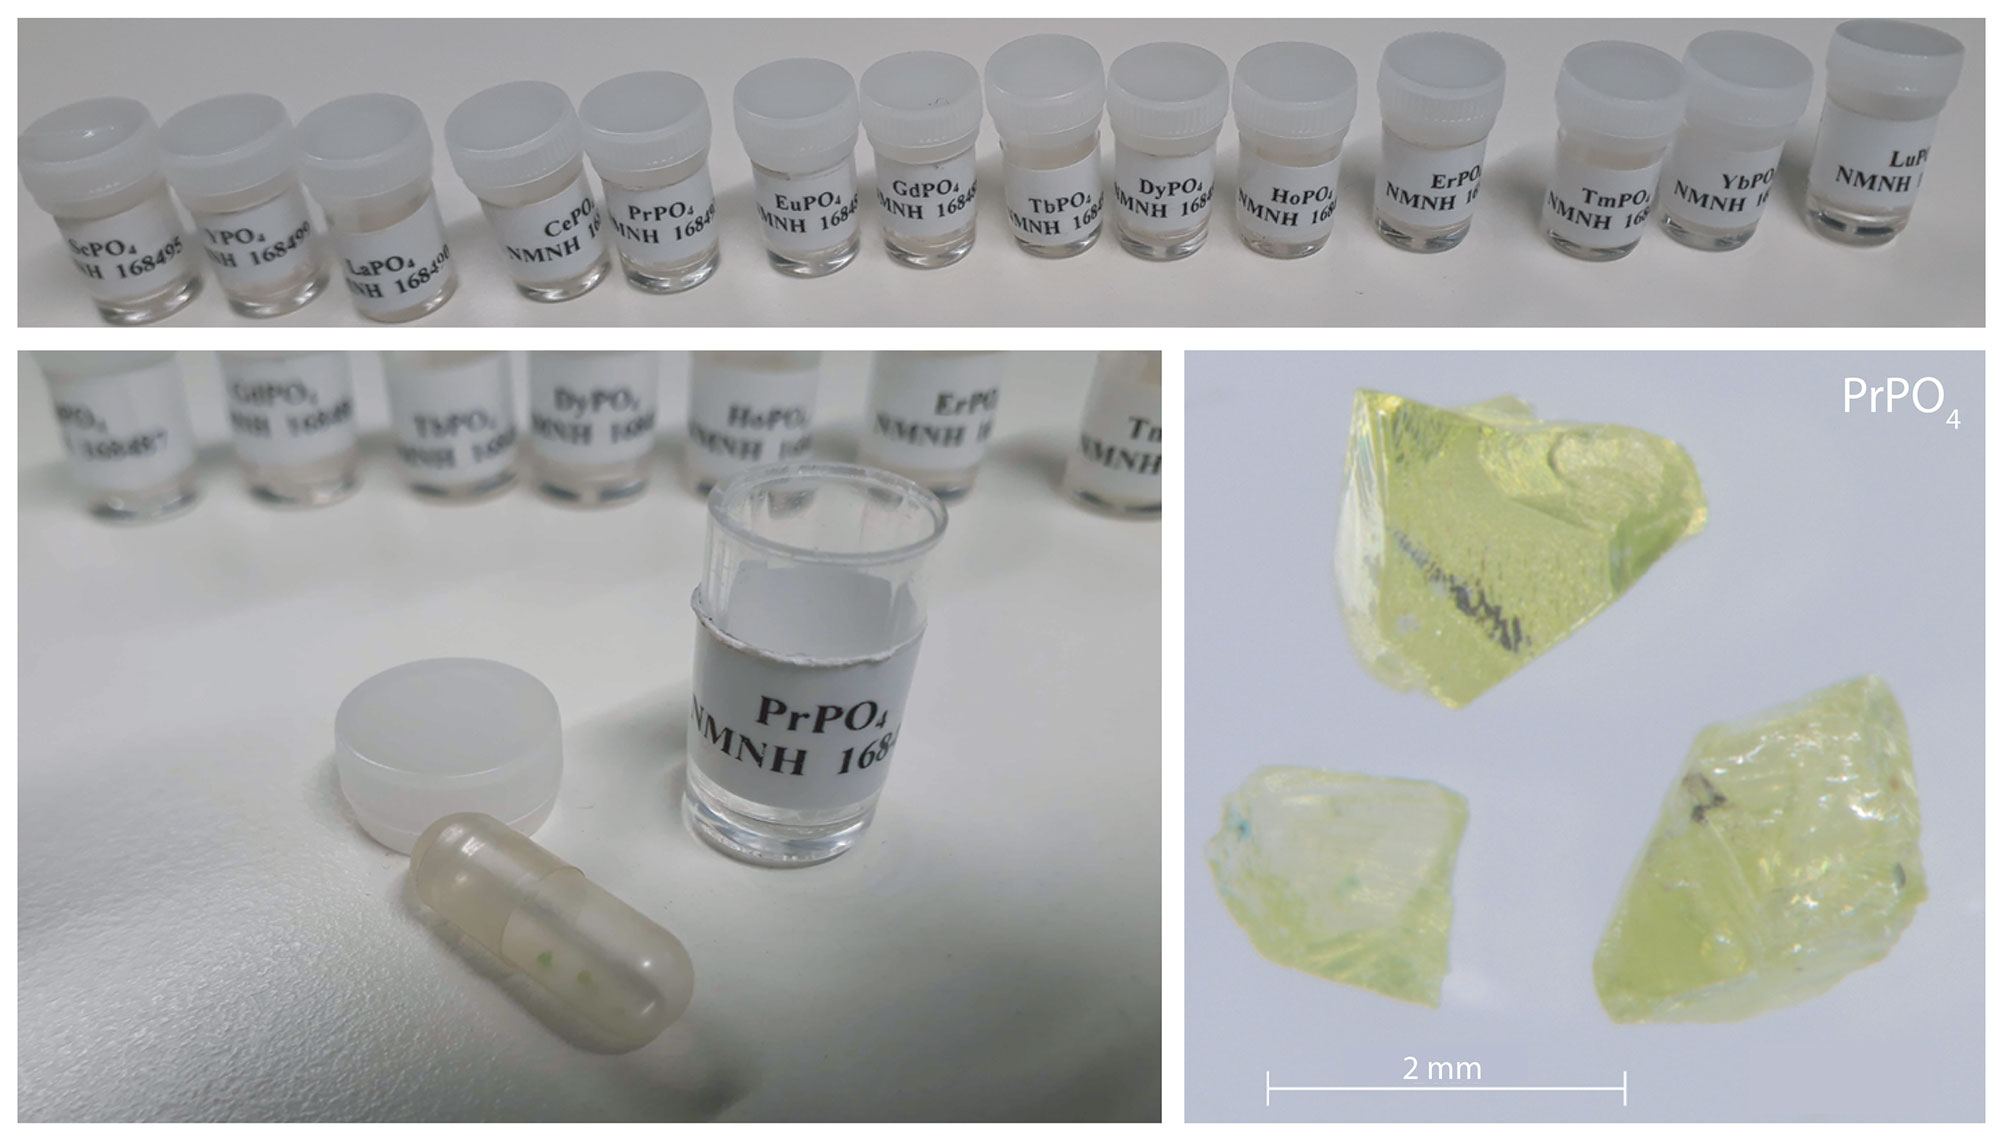
Figure 1The reference REE orthophosphates from the National Museum of Natural History (example PrPO4).
2.2 Measurement setup
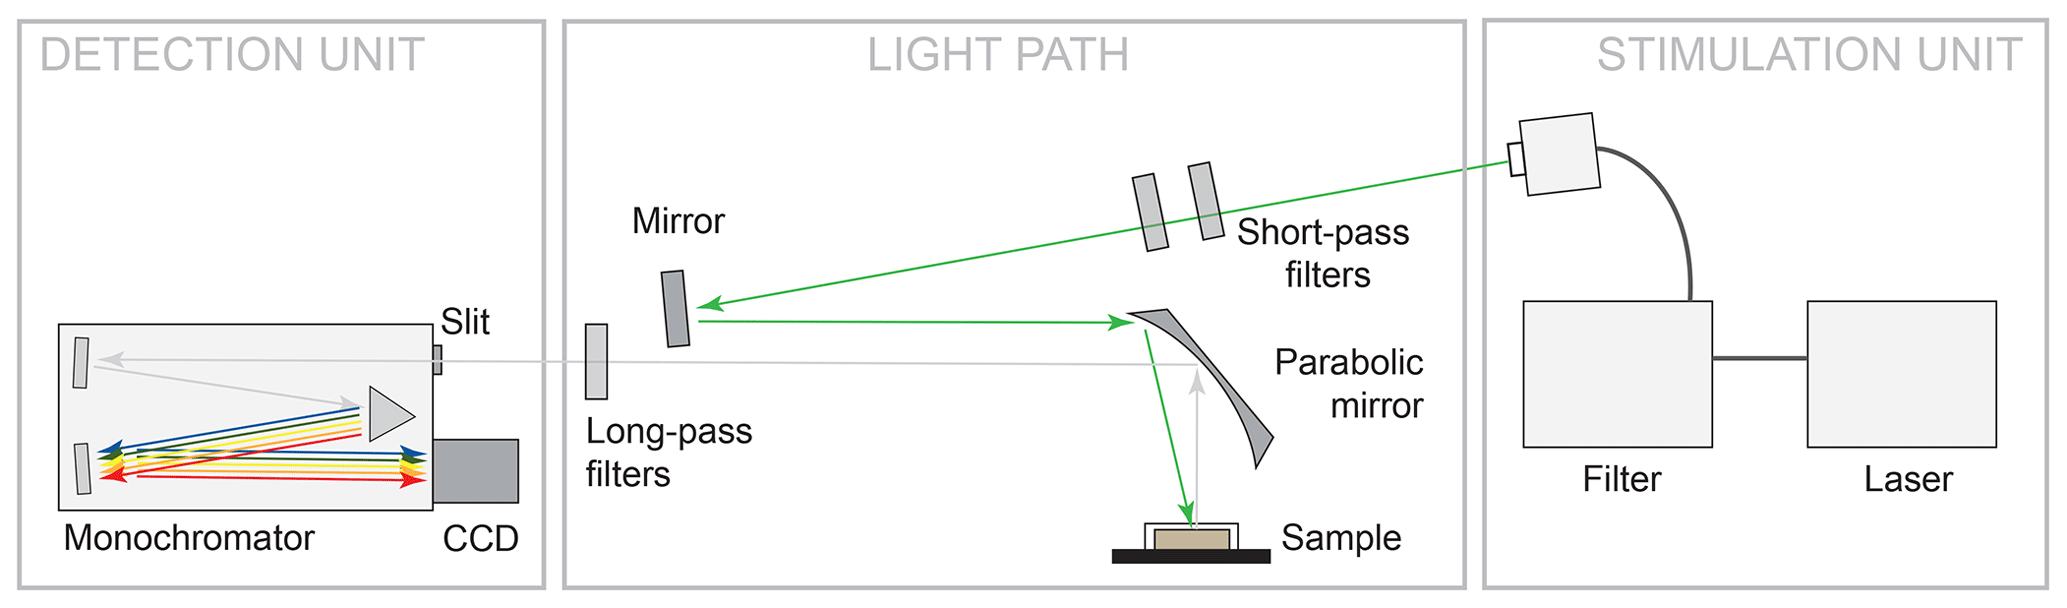
The measurement setup is shown in Fig. 2. The configuration represents a typical luminescence measurement setup in backscattering mode, in which the light paths of excitation to the sample and emitted luminescence from the sample are parallel. We used different laser wavelengths for LiF signal excitation: 325 nm (UV, He-Cd laser, focus spot 185 µm, 14.58 W/cm2), 442 nm (blue, He-Cd laser, focus spot 170 µm, 16.73 W/cm2) and 532 nm (green, diode-pumped frequency-doubled Nd:YAG, focus spot 143 µm, 26.93 W/cm2). The focus spot sizes and power densities (given in the previous sentence in brackets) are given as of a Gaussian fit to the lateral intensity profile. The emitted luminescence was dispersed using a 50 cm monochromator unit Acton SP2560i with a 300 g/mm grating and recorded with a charge-coupled device (CCD) camera (Princeton Instruments SPEC-10:100BR_eXcelon; 1340 channels, liquid nitrogen cooled). The used spectral detection range covers 340 to 1080 nm. Appropriate long-pass filters (edges at 334, 450 and 550 nm) ensured reliable separation of laser stimulation light from emitted luminescence and were furthermore applied to suppress second order diffraction signals in the long-wavelength part of the spectra. We measured all REE standards under continuous-wave excitation at room temperature and chose integration times between 300 ms and 10 s to optimise absolute signal intensities without saturating the CCD camera.
2.3 Data processing
The raw spectra were corrected for the spectral sensitivity of the detection unit with in-house calibration data for the respective technical setup. Consecutive data processing and visualisation were done using the R environment (R Core Team, 2014). Spectra over the full detection range of 340–1080 nm required two separate measurements (long-pass filter of e.g. 334 and 550 nm) to suppress the second order signals at double wavelength. For merging both, a merge segment was defined with the starting point set to 560 nm and the upper end defined according to the minimum intensity difference between both spectra. Within the merge segment, the final spectrum transitions smoothly from the first (measured with 334 nm long-pass filter covering the short wavelength range) to the second partial spectrum (measured with 550 nm long-pass filter covering the long wavelength range). Mathematically this means that the difference of the partial spectra multiplied by a linearly varying weighting factor from zero to one across the merge segment is added to the first spectrum. Finally, the partial spectra were joined using the first spectrum at wavelengths shorter than 560 nm, the calculated new merge segment of the overlapping range and the upper spectrum of the longer wavelengths above the calculated merge segment.
Spectra obtained from the set of embedded phosphate standards showed an intense broad-band emission attributed to the epoxy resin, in particular because of partly small and translucent sample crystals that are not perfectly exposed at the resin surface. We measured the epoxy resin at three locations next to REE crystals. The epoxy resin spectra show reproducible luminescence indicating material homogeneity and, accordingly, allow for subtraction from the REE sample spectra. Minor variations can be attributed to signal noise, which was removed by calculating a mean spectrum from the three epoxy resin spectra. We then subtracted the epoxy-resin-related emission from the REE sample spectra. This operation is comparable to the removal of a non-sample-related background continuum, allowing for an unbiased detection of remaining REE-related emission lines, as well as of absorption features.
Peak detection was made challenging by clustered emission lines and by distinguishing small REE emission peaks from noise artefacts. Therefore, merged spectra were smoothed in a running mean interval of 1.2 nm to reduce the noise while keeping the spectral sampling interval. The smoothing interval was carefully chosen to retain emissions of low intensity and details of clustered narrow emission lines. In the case of emission bands with clusters of many narrow emission lines, an automated peak detection was complicated and resulted typically only in the detection of the most prominent peak. To identify also the individual emission lines within emission bands, we calculated a background continuum based on the spline-smoothed running minimum (degrees of freedom 50, bin size 1.2 nm). After removing this background continuum, we detected all peaks above a threshold of typically 2 standard deviations of the entire spectrum.
2.4 Sample homogeneity
Recorded LiF spectra represent a single measurement spot where the signal to noise ratio was best. We checked for spatial variations and representativity of the selected LiF measurement spot using hyperspectral reflectance imaging. The images from an FX10 camera (Spectral Imaging Ltd.) with a spatial resolution of 0.17 mm depict the sample grains with 5 to 25 pixels (pure sample pixels), each containing the reflectance spectrum in a range of 400–1000 nm. All spectra of the measured REE sample grain were analysed for features deviating from expected REE absorptions. The reflectance data were analysed using the R package “hyperSpec” (Beleites and Sergo, 2018) and compared to the reflectance spectral library of the USGS (Kokaly et al., 2017).
The obtained reflectance spectra of pure sample pixels were consistent with respect to absorption feature position (Fig. 3). Variations in signal intensities have minor influences on relative absorption depth (standard deviation below 5 %). The reference spectral library for standard material from the USGS (Kokaly et al., 2017) comprises only REE oxides and in some cases chlorides, but no phosphates, but a comparison of absorption positions confirmed agreement with observed absorption features in our REE samples. None of the pure sample spectra contained additional absorption features, and thus, reflectance spectra attest to the spatial homogeneity and good sample quality.
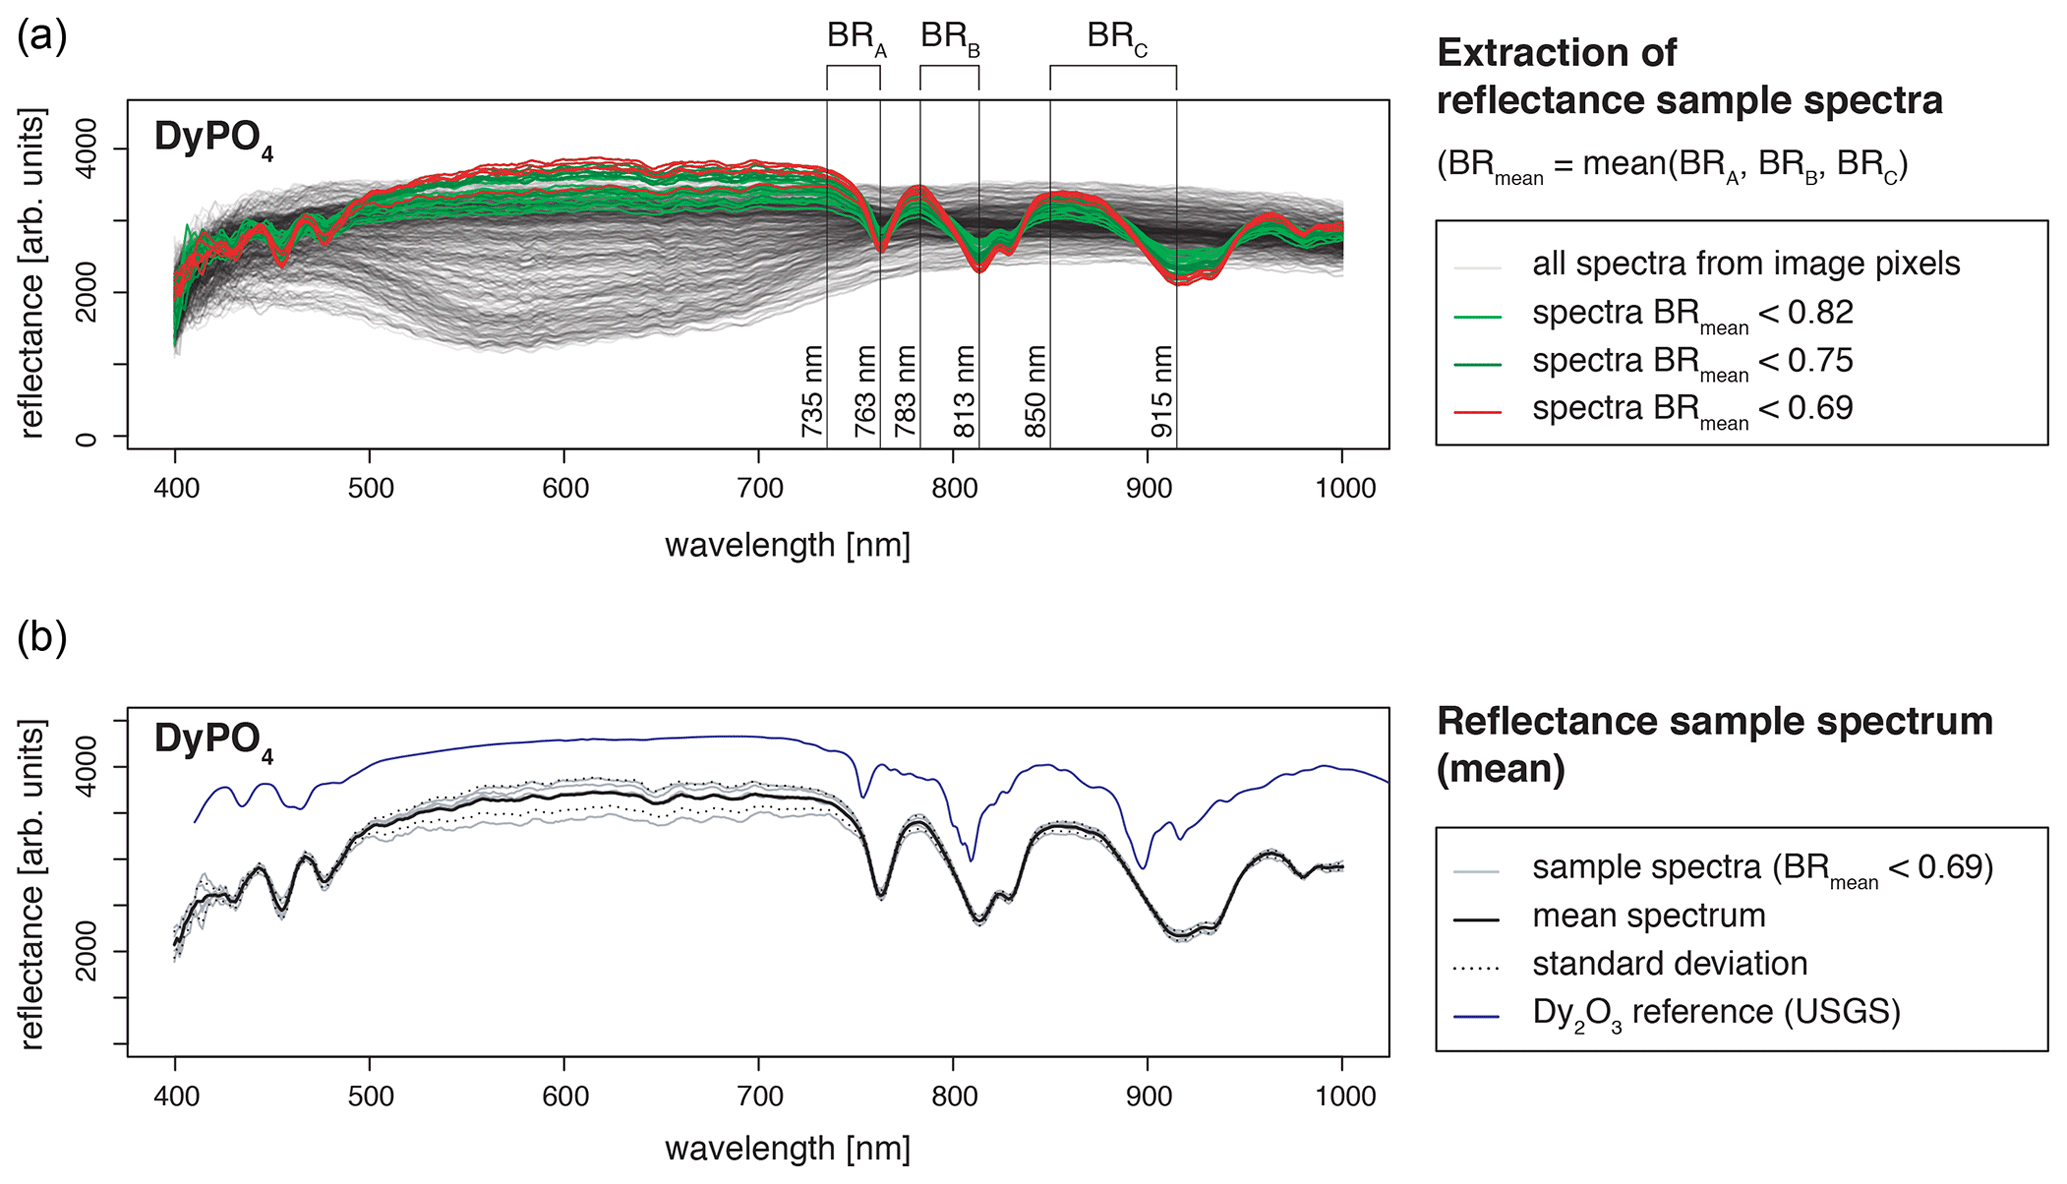
Figure 3Spatial homogeneity evaluation with hyperspectral reflectance images from a SPECIM FX10 camera with a spatial resolution of 0.17 mm (example DyPO4). (a) For REE spectra extraction from all spectra of a measured scene (image), the mean of three band ratios was calculated to reduce influences from noise and ensure accurate identification of sample spectra (pixels containing spectra from the sample grain, in the text referred to as pure sample pixels). Bands were selected according to the position of diagnostic absorption features (BR = band ratio representing the ratio of signal intensities at two given wavelengths). (b) A mean spectrum was calculated from all pure sample pixels. The standard deviation is given as an indication of the variability between spectra of pure sample pixels. The resulting REE absorption spectrum (mean spectrum) was compared to reference data from the USGS spectral library (Kokaly et al., 2017).
3.1 REE reference spectra at 325 nm laser excitation
With a laser excitation at 325 nm the Smithsonian REE phosphate samples yielded representative spectra for Ce3+, Nd3+, Eu3+, Tb3+ and Dy3+ (Fig. 4). Prominent emission lines with high signal to noise ratios allow for an unequivocal assignment of transitions and represent the diagnostic features needed for a LiF-based REE identification. The high spectral resolution (spectral sampling 0.13 nm) of the measurement setup enables us to separate multiple lines within emission clusters associated with the splitting of transitions into sub-levels (Stark level splitting) as observed particularly in the spectra of Nd3+, Tb3+ and Dy3+ (Fig. 4). Table 2, therefore, differentiates between the most intense emission lines (main) and additionally detected less intense emission lines of the same emission band (minor).
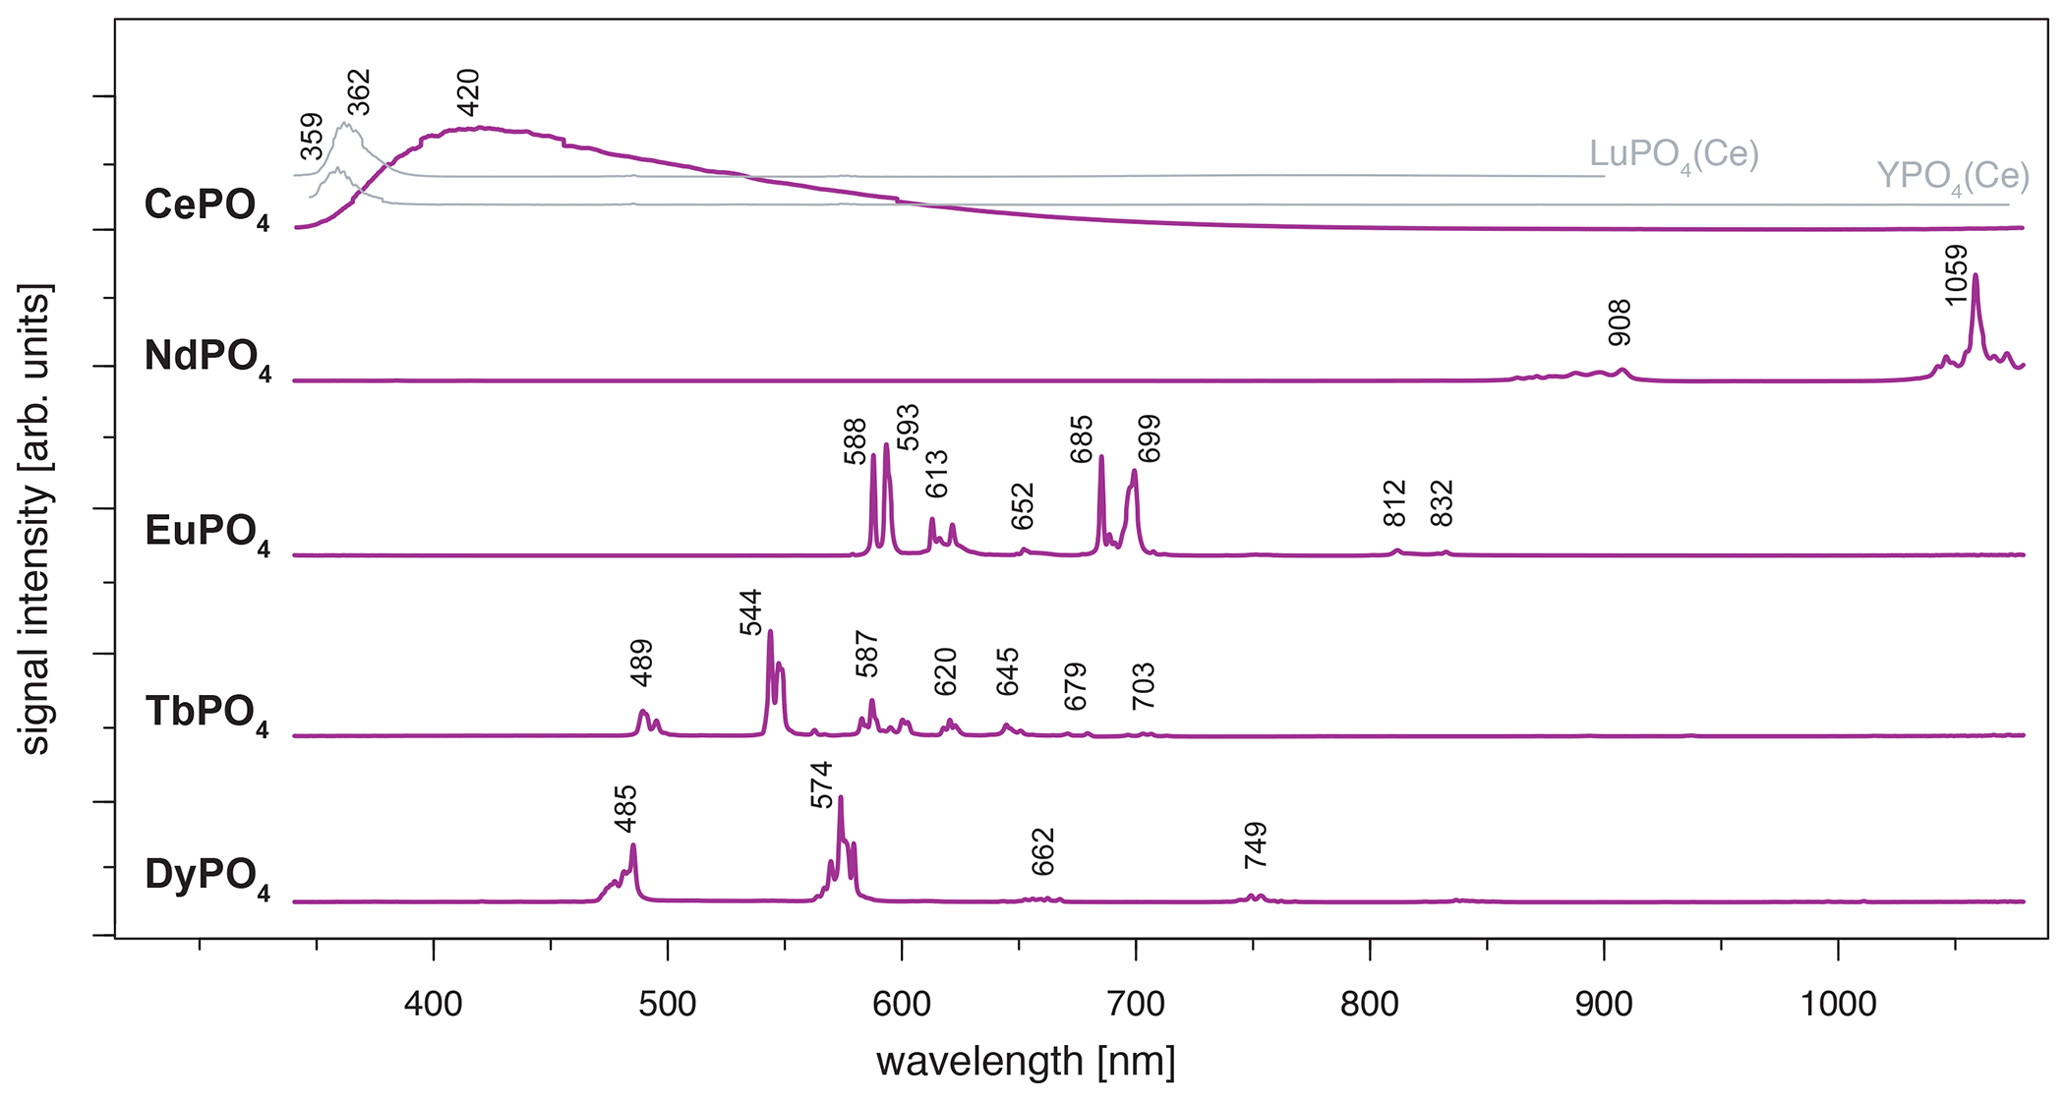
Figure 4LiF reference spectra obtained with 325 nm laser excitation depict the diagnostic emission lines for the REE phosphates NdPO4, EuPO4, TbPO4 and DyPO4 (given values represent wavelength of most intense emission in nanometres for each transition; cf. Table 2). CePO4 is included for completeness, and diagnostic emissions are shown by the grey lines representing spectra from two non-luminescent REE PO4 samples with cerium contaminations (see further explanation in the text along with cerium concentrations in those samples based on neutron activation analysis, NAA, results).
For CePO4, the excitation results in a broad-band emission with a maximum at 420 nm (Fig. 4). The very broad emission is difficult to interpret based on our results and goes beyond the scope of this study. In general, it overlaps with the characteristic Ce3+ emission band around 360 nm that is associated with a 5d–4f transition (e.g. Reisfeld et al., 1996; Gaft et al., 2005; Shalapska et al., 2014). Several studies report broadened Ce-related peaks and discuss reasons behind them; for example, Shalapska et al. (2014) identified a peak doublet with the peak distance dependent on the site symmetry in the crystal lattice, and Chen et al. (2014) observed broadened emission in the range between 310 and 410 nm resulting from mixed phases of a monoclinic and hexagonal lattice. The Ce-related emission band appears less broad and shifts towards lower wavelengths in the two non-luminescent samples of LuPO4 and YPO4 (grey lines in Fig. 4, both samples from same set of Smithsonian REE phosphate standards; see Table 1). LuPO4 contains cerium at a mass fraction of (0.1 ± 0.2) × 10−3 (NAA results according to Donovan et al., 2002) and reveals the maximum emission of Ce3+ at 362 nm (FWHM 356–373 nm). YPO4 contains cerium at a mass fraction of (0.5 ± 0.6) × 10−3 (NAA results according to Donovan et al., 2002), and here the maximum emission of Ce3+ lies at 359 nm (FWHM 352–365 nm).
The NdPO4 spectrum depicts a prominent cluster of distinct emission lines peaking at 1059 nm and a secondary cluster of less intense emissions at 908 nm (Fig. 4). The two emission bands represent – and – transitions, respectively (e.g. Reisfeld et al., 1996; Gaft et al., 2005; Czaja et al., 2012; Shalapska et al., 2014). Emission bands at shorter wavelengths (< 850 nm; Gaft et al., 2005) were not observed during measurements and hence are not recorded in our phosphate reference spectra. Nevertheless, the two observed Nd3+ emission bands are prominent and represent diagnostic features as they do not overlap with emissions of other REEs.
The spectrum of EuPO4 (Fig. 4) shows distinct emission lines at 588, 593, 612, 651 and 699 nm, representing five transitions from 5D0 to 7Fi (i = 0, 1, 2, 3, 4; Gaft et al., 2005; Friis et al., 2010; Shalapska et al., 2014). The spectrum indicates splitting into sub-level emissions. Triplets of emission lines are recorded for the transitions to 7F2 and 7F4 with additional prominent lines at 622 and 685 nm and a line of minor intensity at 616 and 689 nm, respectively. We observe two additional weak emission lines at 812 and 832 nm. These rarely described emissions relate to the 7F6 transition (Binnemans, 2015). The emission pattern corresponds to Eu3+ observed in apatite (Reisfeld et al., 1996), in which the ratio of emission intensities for 5D0 to 7F2 and 5D0 to 7F1 is low. However, the detailed spectroscopic sample characterisation can be found in Sharma et al. (2019).
The emission lines in the TbPO4 spectrum represent five prominent transitions (from 5D4 to 7Fi, i=6, 5, 4, 3, 2) and two weak transitions (from 5D4 to 7F1 and 7F0) (Nazarov et al., 2009; Shalapska et al., 2014; Fang et al., 2017). The transitions are evident as clusters of multiple emission lines with maximum intensities at 489, 544, 587, 587, 620, 645, 679 and 703 nm (Fig. 4). Reisfeld et al. (1996) and Gaft et al. (2005) reported emission lines below 440 nm for the phosphate minerals apatite and monazite. Those transitions from 5D3 to 7Fi are not evident in our sample spectrum.
The DyPO4 spectrum displays narrow emission lines with two prominent bands at 485 and 574 nm and two weak emission bands at 662 and 749 nm. The clustered emission lines correspond to the transitions to 6Hi (; Reisfeld et al., 1996; Gaft et al., 2005; Friis et al., 2010). Our instrumental setup allows for a detection of separate sub-level emission lines corresponding to effects of the phosphate crystal field. Absorption spectroscopy suggests sufficient Dy3+ excitation when using a 325 nm laser, although higher efficiency can potentially be achieved using a slightly longer wavelength laser (e.g. 352 or 366 nm; Friis et al., 2010).
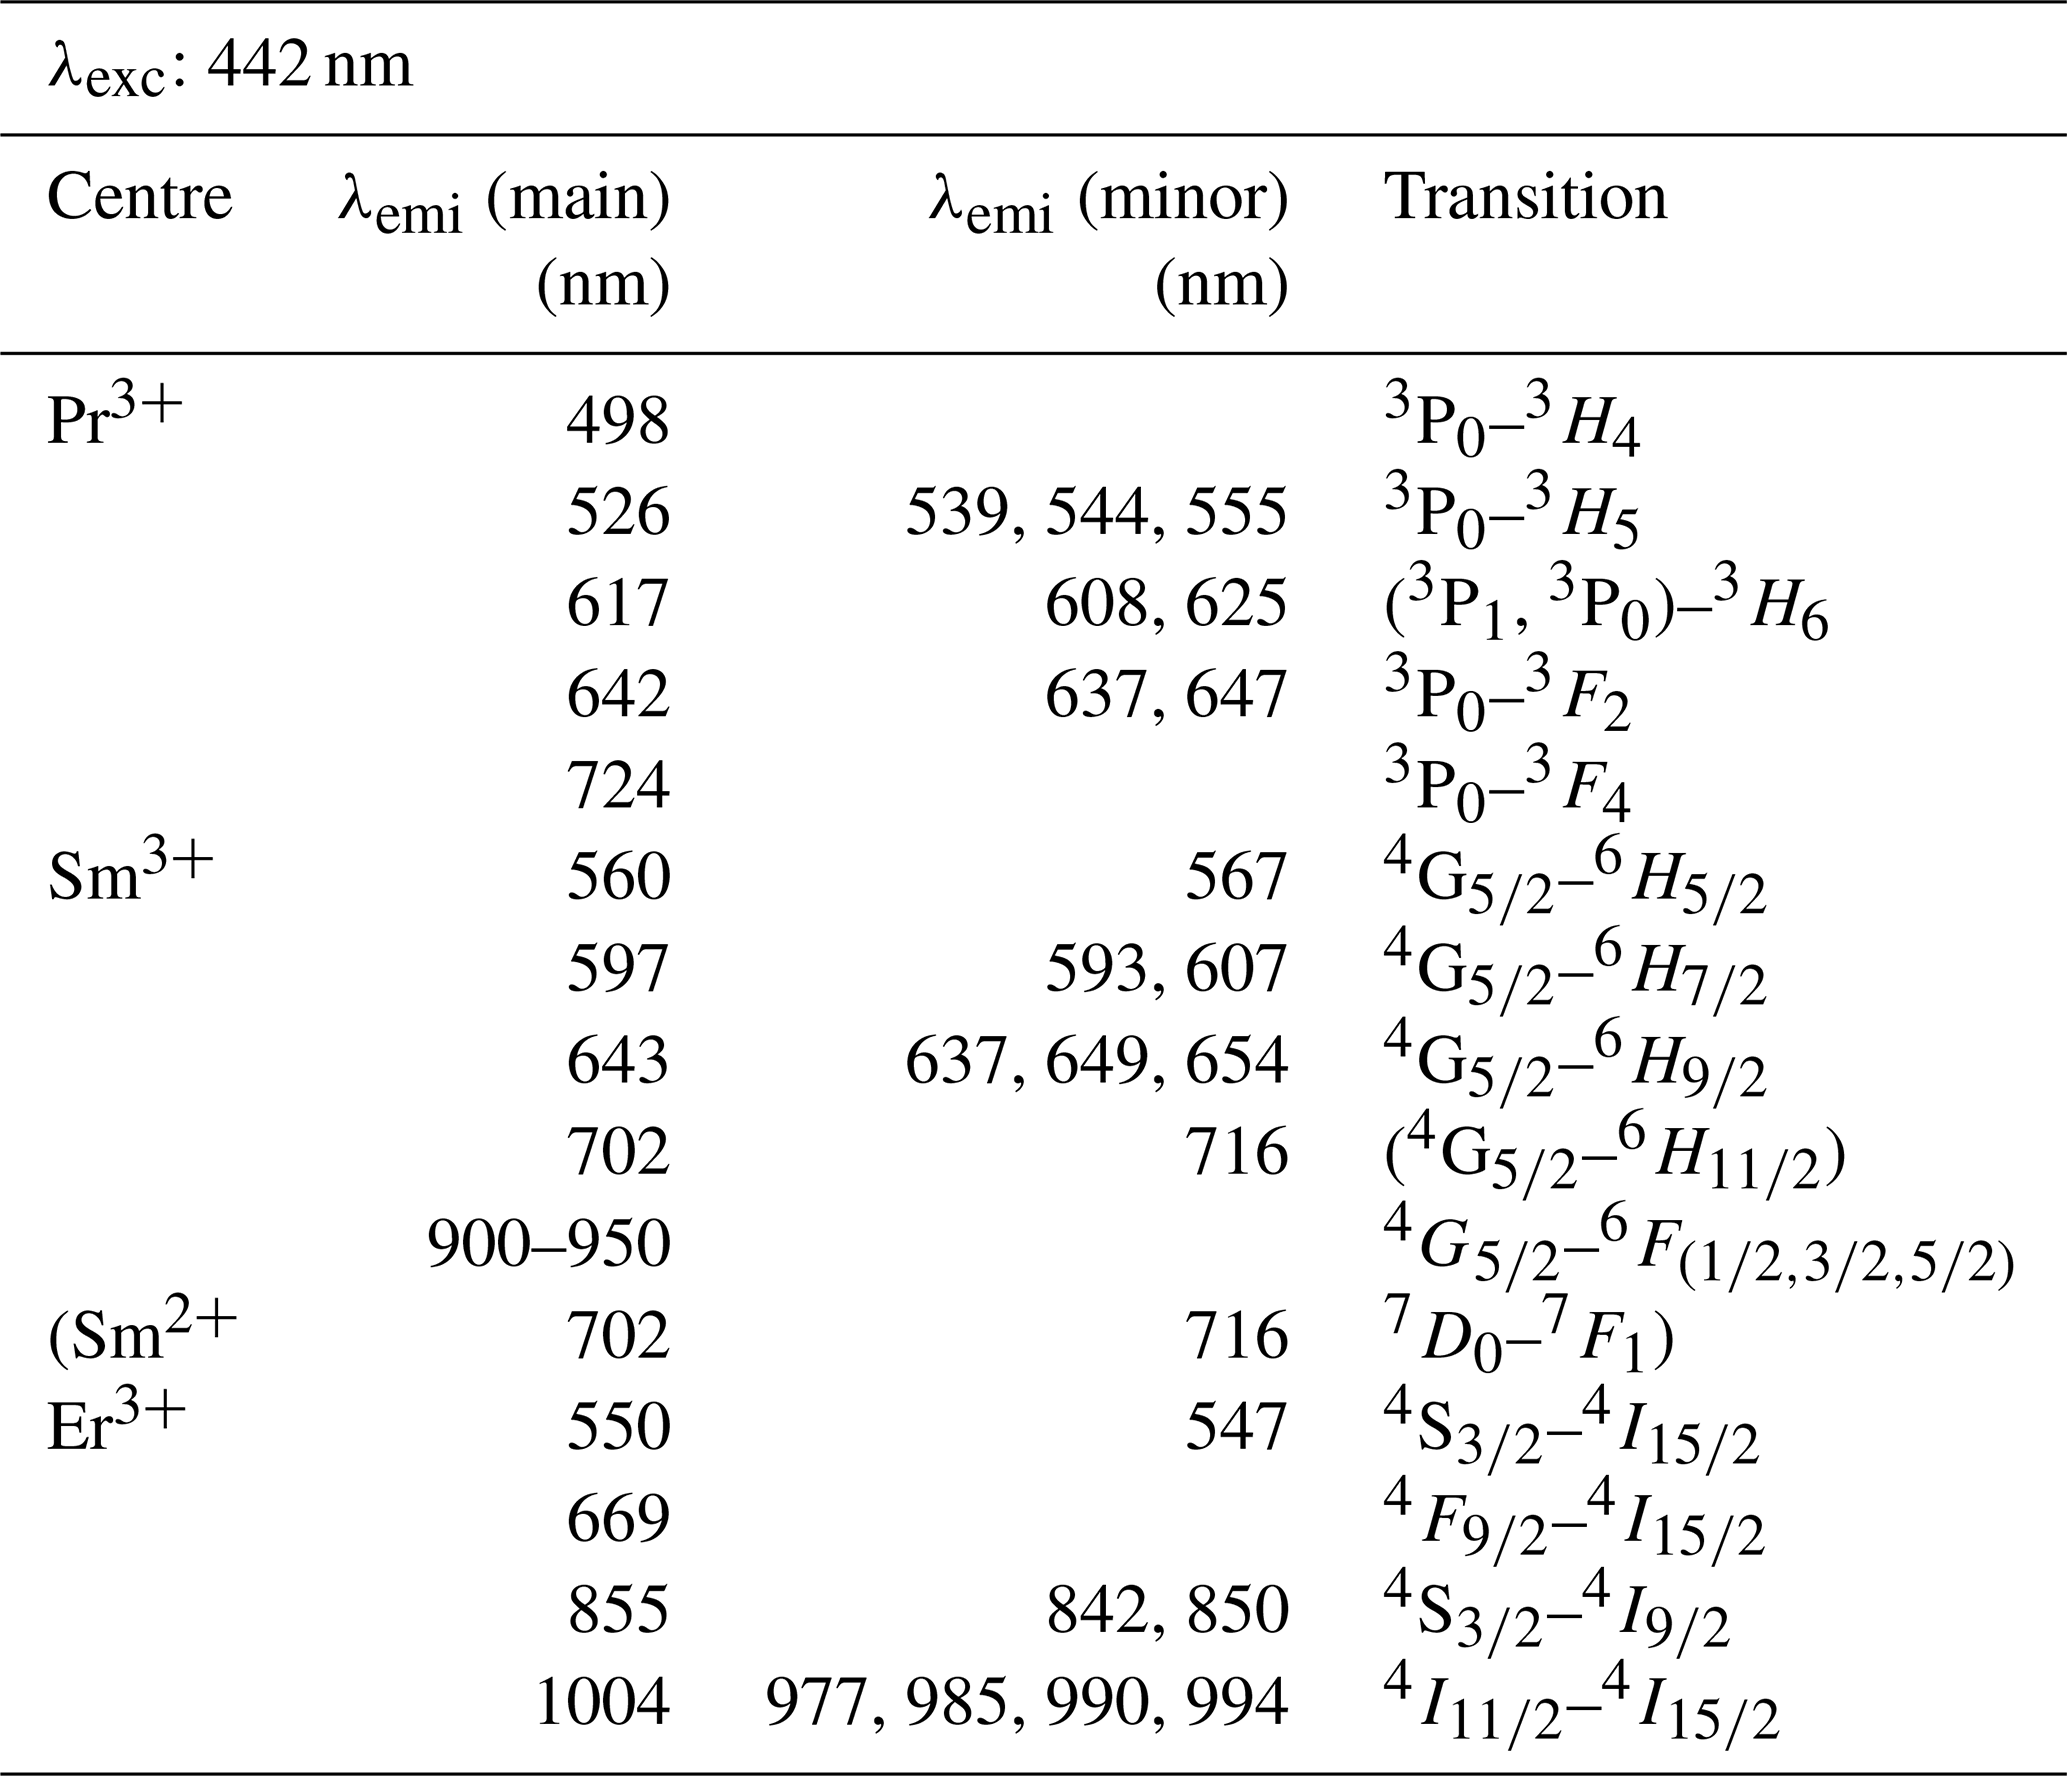
Table 2Overview of detected emission lines and corresponding transitions for the REE phosphates NdPO4, EuPO4, TbPO4, and DyPO4 that were successfully excited at 325 nm and cerium emission measured in YPO4 and LuPO4 (λexc: excitation wavelength; λemi: emission wavelength; main: most intense emission line; minor: additionally detected, less intense emission lines of the same emission band).

a Measured in YPO4 (Ce at mass fraction of (0.1 ± 0.2) × 10−3; Donovan et al., 2002). b Measured in LuPO4 (Ce at mass fraction of (0.5 ± 0.6) × 10−3; Donovan et al., 2002).
3.2 Absorption features in REE spectra at 325 nm laser excitation
Spectra of several REE phosphates, especially PrPO4, SmPO4, HoPO4, ErPO4 and TmPO4, are dominated by a very broad emission band between 350 and 800 nm when using 325 nm laser excitation (Fig. 5), irrespective of the sample being embedded in epoxy resin (see Fig. 5 dark-violet spectra, D = epoxy disc sample) or in the form of stand-alone single grains (see Fig. 5 violet spectra, SG = single grain sample). The broad emission band is intersected by prominent absorption features. A comparison with the USGS spectral library for reflectance data (Kokaly et al., 2017) and absorption positions reported in the literature (e.g. White, 1967; Boesche et al., 2015; Turner et al., 2014) confirms that absorptions match with respective REE-reference spectra.
The broad, unspecific emission band causes strong masking of most REE-diagnostic emission lines < 650 nm. In the case of REEs with diagnostic emission lines > 650 nm, the broad-band emission is less problematic because observed patterns in the long wavelength region may be sufficient for the REE identification (e.g. in the case of ErPO4, spectrum of the single grain (SG) specimen in Fig. 5). Such 325 nm excited spectra depict both absorptions and emissions in the same spectrum. The REE-related absorption features are recorded at wavelength < 800 nm and diagnostic emission lines in the spectral region > 650 nm. To suppress the broad-band emission and unravel the REE emission lines of interest, longer wavelength laser excitation proved successful.

Figure 5REE spectra illustrating diagnostic absorption features within prominent broad-band emissions at wavelengths < 800 nm and REE emission lines for those > 650 nm. Violet and pink LiF spectra were measured using laser excitation at 325 nm for both sample specimens (D: samples embedded in disc; SG: single grain samples). Grey shaded area represents epoxy resin mean spectrum expected for D samples without absorption features. Emissions > 650 nm are better visible in SG samples due to the lower intensity of the broad-band luminescence. Black reflectance spectra depict reference data from the USGS library (Kokaly et al., 2017).
3.3 REE reference spectra at 442 nm laser excitation
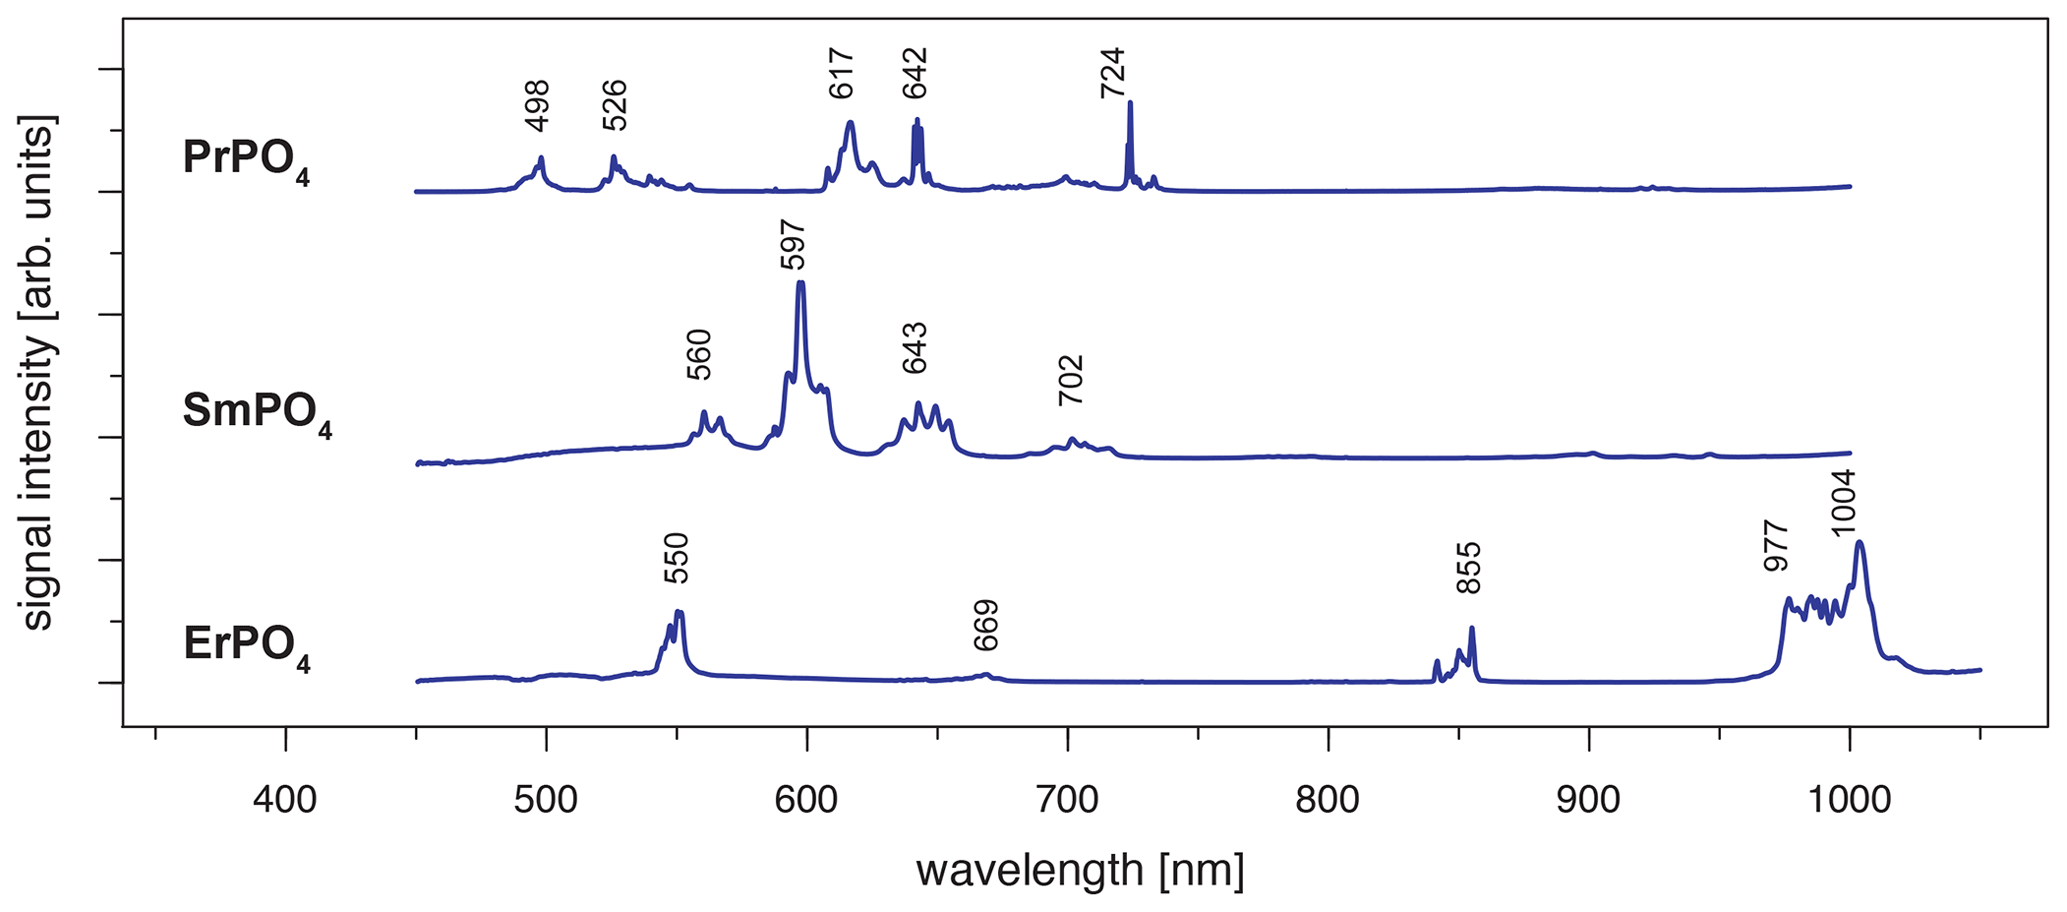
When using 442 nm laser excitation, the same diagnostic emission patterns were recorded for the above-presented REE PO4 samples (NdPO4, EuPO4, TbPO4 and DyPO4). Only the excitation efficiency appeared to be less as signal to noise ratios decreased, in particular for NdPO4 but also for TbPO4 and DyPO4. Additionally, representative LiF spectra could be acquired for PrPO4, SmPO4 and ErPO4.
Excitation with the 442 nm laser allows us to unravel distinct Pr3+-related emission lines in the PrPO4 reference spectrum at 498, 526, 617, 642 and 724 nm (see Fig. 6 and Table 3) corresponding to the dominant transitions described by Gaft et al. (2005) (first, third and fourth emission lines) and Zhou et al. (2012) (first four emission lines). Additionally, Liang et al. (2017), Prasad et al. (2018), and Runowski et al. (2019) recorded also the emissions above 700 nm. The transitions originate in 3P0 or 3P1 (Zhou et al., 2012; Prasad et al., 2018; Runowski et al., 2019), in which the comparison between reported and observed emission wavelengths indicates that both origins are possible and the (relative) dominance of one or the other decided the observed emission position (see Table 3). The transition's final states are 3Hi () and 3Fj () (Zhou et al., 2012; Shalapska et al., 2014; Prasad et al., 2018; Runowski et al., 2019). Prasad et al. (2018) identified the 1D2 state to be the transition origin for the prominent Pr emission at around 600 nm, as well as Gaft et al. (2005), who also attributed the emission around 500 nm to the same origin. However, the observed positions lie at slightly (around 10 nm) higher emission wavelengths that agree better with positions found by, for example, Friis et al. (2010) and Runowski et al. (2019) and potentially result from a superposition of different transitions originating at certain portions from 3P0, 3P1 and 1D2. Nevertheless, the origin of this rather large shift of 10 nm is currently unknown and will require in-depth investigation beyond the scope of this study.
The 442 nm laser-induced SmPO4 spectrum depicts prominent emission line clusters at 560, 597 and 643 nm and a cluster of minor intensity at 702 nm (Fig. 6). The first three emission lines correspond to Sm3+ transitions from to 6Hi (; see Table 3) in line with observations from Gaft et al. (2005), Friis et al. (2010), Czaja et al. (2012), Shalapska et al. (2014), and Guan et al. (2016). The pattern of four emission lines with the second line as most efficient emission resembles well observations by, for example, Ha et al. (2016), Wantana et al. (2017), and Yashodha et al. (2019), who assigned the fourth transition to . However, this transition has been attributed to a luminescence band observed at 720 nm by Friis et al. (2010). Influences from Sm2+ centres are considered to be unlikely because of measurements at room temperature and the absence of the 734 nm emission line (Gaft et al., 2005). Another explanation for the observed 700 nm emission cluster and potential source for peak broadening of the around 600 nm and 700 nm emission clusters could be the minimally detected Eu contamination in the SmPO4 sample (see NAA results in Donovan et al., 2002). The very weak near-infrared emission features around 900–950 nm may indicate additional, less often observed Sm emission features from to 6Fi transitions () (e.g. Ahmed and Iftikhar, 2019), in which, for example, Samanta et al. (2016) ascribe the latter transition around 950 nm to energy transfer from Ce (see small contaminations of Ce in NAA results in Donovan et al., 2002). A Nd contamination with corresponding emission lines in the same wavelength region (around 900 nm) is not evident in NAA results (Donovan et al., 2002).
Laser excitation of ErPO4 at 442 nm unravels an emission at 550 nm, besides the emission at 855 nm and the prominent cluster between 977 and 1004 nm (see Fig. 6), which were already detected at 325 nm excitation (see above). This first line represents an important diagnostic emission in the visible range (e.g. Reisfeld et al., 1996; Gaft et al., 1998; Friis et al., 2010). Gaft et al. (2005) assign respective emission lines to transitions from to 4Ii (i = 15/2, 9/2) (first two lines) and to (third line) (see Table 3). Among others, Czaja et al. (2012) attribute another emission line at about 653 nm to Er3+ that is only weakly present in our reference ErPO4 spectrum (see Fig. 6) and identify the transition from to to be responsible for this emission.
Table 3Overview of detected emission lines and corresponding transitions for those REEs that were successfully excited with the 442 nm laser (potential assignments to transitions are given in brackets).
3.4 REE reference spectra at 532 nm laser excitation
When using 532 nm laser excitation, the diagnostic emission lines already described above for 325 nm excitation (see Sect. 3.1) were recorded for the samples NdPO4, EuPO4, TbPO4 and DyPO4. Especially efficient was the 532 nm laser excitation for NdPO4. Additional reference spectra including the main diagnostic emission lines were recorded for HoPO4 and YbPO4.
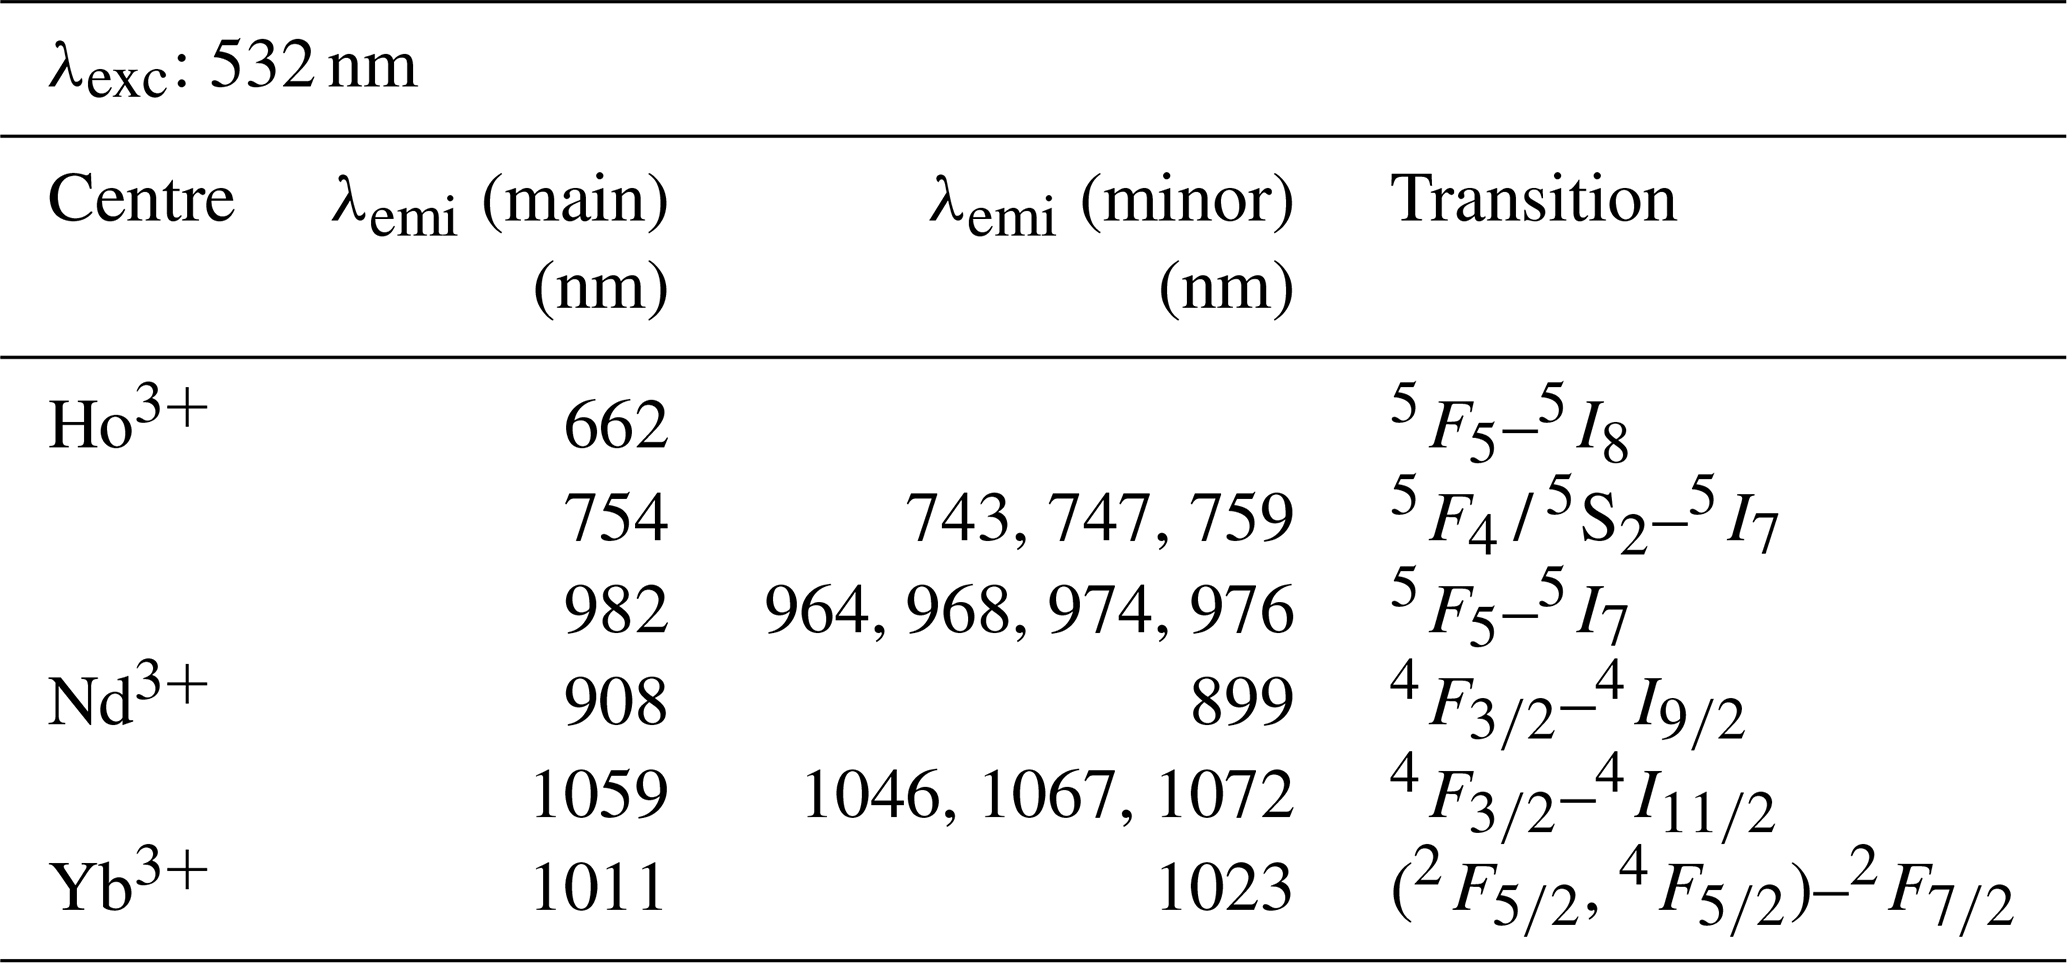
For HoPO4, the diagnostic emission line around 540 nm (e.g. Gaft et al., 2005; Qin et al., 2011; Pandey and Swart, 2016) was masked by broad-band luminescence with Ho3+-related absorptions (e.g. Turner et al., 2014; Kokaly et al., 2017) when using 325 and 442 nm laser excitation (see above). The 532 nm excited spectrum captures only emissions above 550 nm but successfully suppressed the masking broad-band luminescence below 700 nm. Recorded emission lines cluster at 662, 754 and 982 nm (see Fig. 7 and Table 4). The first, relatively weak emission line corresponds to a 5F5 to 5I8 transition (e.g. Friis et al., 2010; Qin et al., 2011; Pandey and Swart, 2016), while the second, more intense emission cluster results from a 5F4 5S2 to 5I7 transition (e.g. Qin et al., 2011; Pandey and Swart, 2016). The third and most prominent emission cluster in the near-infrared wavelength range resembles observations by Yu et al. (2012), who detect a transition from 5F5 to 5I7 with emission lines at 965 nm. A combination with processes assigned to a 5F4 5S2 to 5I6 transition with typical emission features at longer wavelengths conjecturally explain the observed broad, intense emission cluster at 982 nm. An influence from Yb3+ as intensifier of this spectral response (Yu et al., 2012) can be excluded by NAA results below detection limit (Donovan et al., 2002).
Depending on the embedding material of measured NdPO4 grains, the laser excitation with 325 nm may cause a broad-band luminescence below 700 nm, while the use of the 442 nm laser revealed inefficient Nd3+ excitation. Instead, the 532 nm excitation proved efficient and revealed two major emission line clusters: one between 860 and 910 nm (maximum at 908 nm) and the other one from 1040 to 1075 nm (maximum at 1059 nm) (see Fig. 7). The two emission clusters agree with the Nd3+-related lines resulting from a to and a to transition, respectively, and resemble common observations in phosphate minerals at 532 nm laser excitation (Table 4) (e.g. Reisfeld et al., 1996; Gaft et al., 2005; Czaja et al., 2012; Shalapska et al., 2014). Reported emission lines below 800 nm by Gaft et al. (2005) are not present in any of our reference NdPO4 spectra. Shalapska et al. (2014) identified additional emissions to be too weak, of which, however, the one to at 846 nm (cf. Gaft et al., 2005) may also be present in our reference spectrum contributing to the broad cluster around 908 nm.
The 532 nm laser excitation of YbPO4 revealed a relatively weak Yb3+ emission without the strong broad-band emission at wavelengths shorter than 700 nm observed in several of our REE PO4 samples at 325 nm excitation (see Sect. 3.2). The diagnostic Yb3+ emission appears as a relatively broad band with a maximum at 1011 nm and a tentative shoulder at 1023 nm (Fig. 7). Results correspond to the main emission line reported by Gaft et al. (2005) and Czaja et al. (2012) and reflect a (, ) to recombination process (Table 4). Potentially overlapping emissions from splitting into Stark levels (Gaft et al., 1998, 2005; Czaja et al., 2012) may explain the broadened emission band with peak shoulders. The interpretation of overlapping emission lines agrees also with observations by Liang et al. (2016) who detected intense photoluminescence with main peaks at 980 and 1019 nm and several weak peaks at 1020–1100 nm.
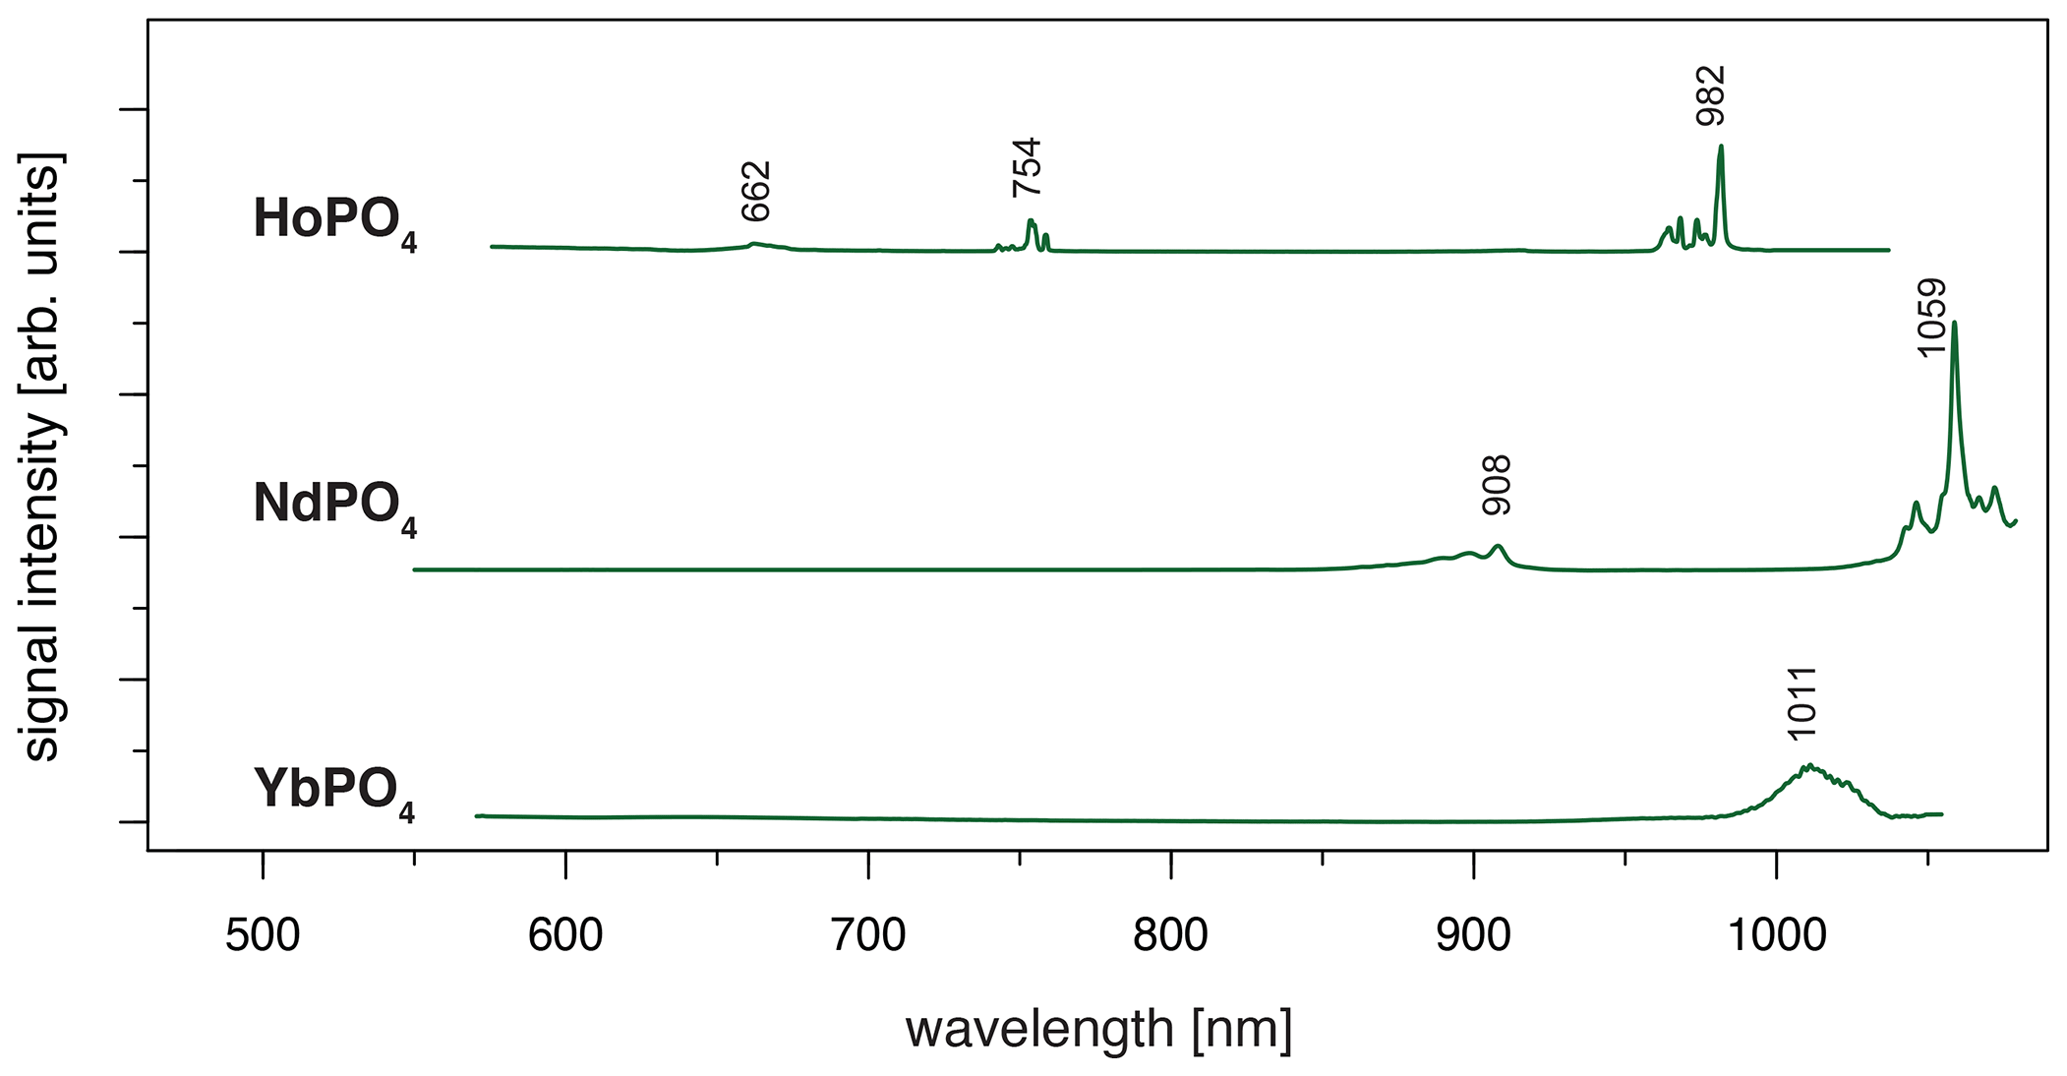
Figure 7LiF reference spectra obtained with 532 nm laser excitation depict the diagnostic emission lines for the REE phosphates HoPO4, NdPO4 and YbPO4 (given values represent wavelength of most intense emission in nanometres for each transition; cf. Table 4).
Table 4Overview of detected emission lines and corresponding transitions for those REEs that were successfully excited with the 532 nm laser.
4.1 Suitable REE excitation wavelength
The REE phosphate reference spectra presented above show that adequate excitation conditions can be achieved when selecting one out of the three laser wavelengths used in this study. Limiting suitable conditions for all REE to three excitation wavelengths delivers great advantages when looking for technical implications for, for example, automated, cost-efficient sensor solutions. The results indicate sufficient conditions for recording the main diagnostic emission lines and hence for identifying the respective REEs (with the exception of GdPO4 and TmPO4), although the used wavelengths do not perfectly match with the most efficient excitation wavelength of individual REEs.
The efficiency of excitation can be evaluated based on absorption spectroscopy, in which prominent absorption features indicate energy uptake by the crystal. Figure 8 depicts the three laser wavelengths (325, 442, 532 nm) compared to our own absorption spectra using the same REE phosphate samples from the Smithsonian library measured with the portable field spectrometer Spectral Evolution PSR 3500 (Fig. 8, orange line). Complementary, Fig. 8 shows reflectance spectra from synthetic REE phosphates presented by Ropp (1969) (black line) and reference data from REE oxides available from Kokaly et al. (2017) (grey line). We included the REE oxides as an additional reference mainly because of the wide use of this spectral library and the overall good match of absorption positions.
The laser wavelength of 325 nm does match with positions of absorption features for Tb3+ and Dy3+ or coincide with shoulders of absorption features for Ce3+, Eu3+ and potentially also for Nd3+. This superposition indicates good excitation conditions. For the other REEs, the 325 nm laser line lies outside or between absorption features, suggesting less suitable conditions. Blue laser excitation at 442 nm is most efficient for Pr3+, matches also for Sm3+ and Er3+, and overlaps with an absorption shoulder in Dy3+ and Ho3+. The 532 nm laser excitation was successful in particular for Nd3+ and also Ho3+. The good excitation conditions with green laser light for Nd3+ agree with other studies on excitation wavelength (e.g. Czaja et al., 2012; Lenz, 2015), while excitation at 325 nm was concluded to be inefficient. Figure 8 suggests that a 325 nm laser is also able to excite Nd according to the coincidence with the edge range of an absorption feature. Nevertheless, the real configuration of the crystal lattice apparently influences intensity ratios of sub-level emissions and shifting emission band positions (Lenz et al., 2013). For Yb3+, it seems surprising that the 532 nm and 325 nm excitations were successful because both excitation wavelengths lie at longer wavelengths than the absorption at < 250 nm shown in Ropp (1969) (see Fig. 8). However, for example, Liang et al. (2016) or Chakraborty et al. (2016) also found efficient absorption of excitation energy between 300 and 400 nm to charge transfer states that emit at wavelengths longer than 900 nm. Another possible explanation may be the sensitisation of Yb3+ by traces of other REEs detected in the studied material by NAA (Donovan et al., 2002). The trace contaminations result from the reference material's production procedure, in which the chemical similarity of REEs limits the complete separation of REEs in the samples. Gaft et al. (2005) report Yb3+ excitation to be strongly dependent on Nd, but NAA results from Donovan et al. (2002) do not indicate any Nd contamination. Other potential candidates for energy transfer processes to Yb3+ are Ho (e.g. Wei et al., 2011; Gavrilović et al., 2015; Kang et al., 2019) (NAA mass fraction: 0.2 ± 0.4 × 10⁻³), Er (e.g. He et al., 2017; Wang et al., 2018; Kang et al., 2019) (NAA mass fraction: 0.2 ± 0.2 × 10⁻³), Tb (e.g. Gandhi et al., 2014) (NAA mass fraction: 0.2 ± 0.3 × 10⁻³) and Ce (e.g. Tang et al., 2018) (NAA mass fraction: 0.1 ± 0.2 × 10⁻³) when taking the detected trace contents of other REEs into account (NAA results given in brackets from Donovan et al., 2002).
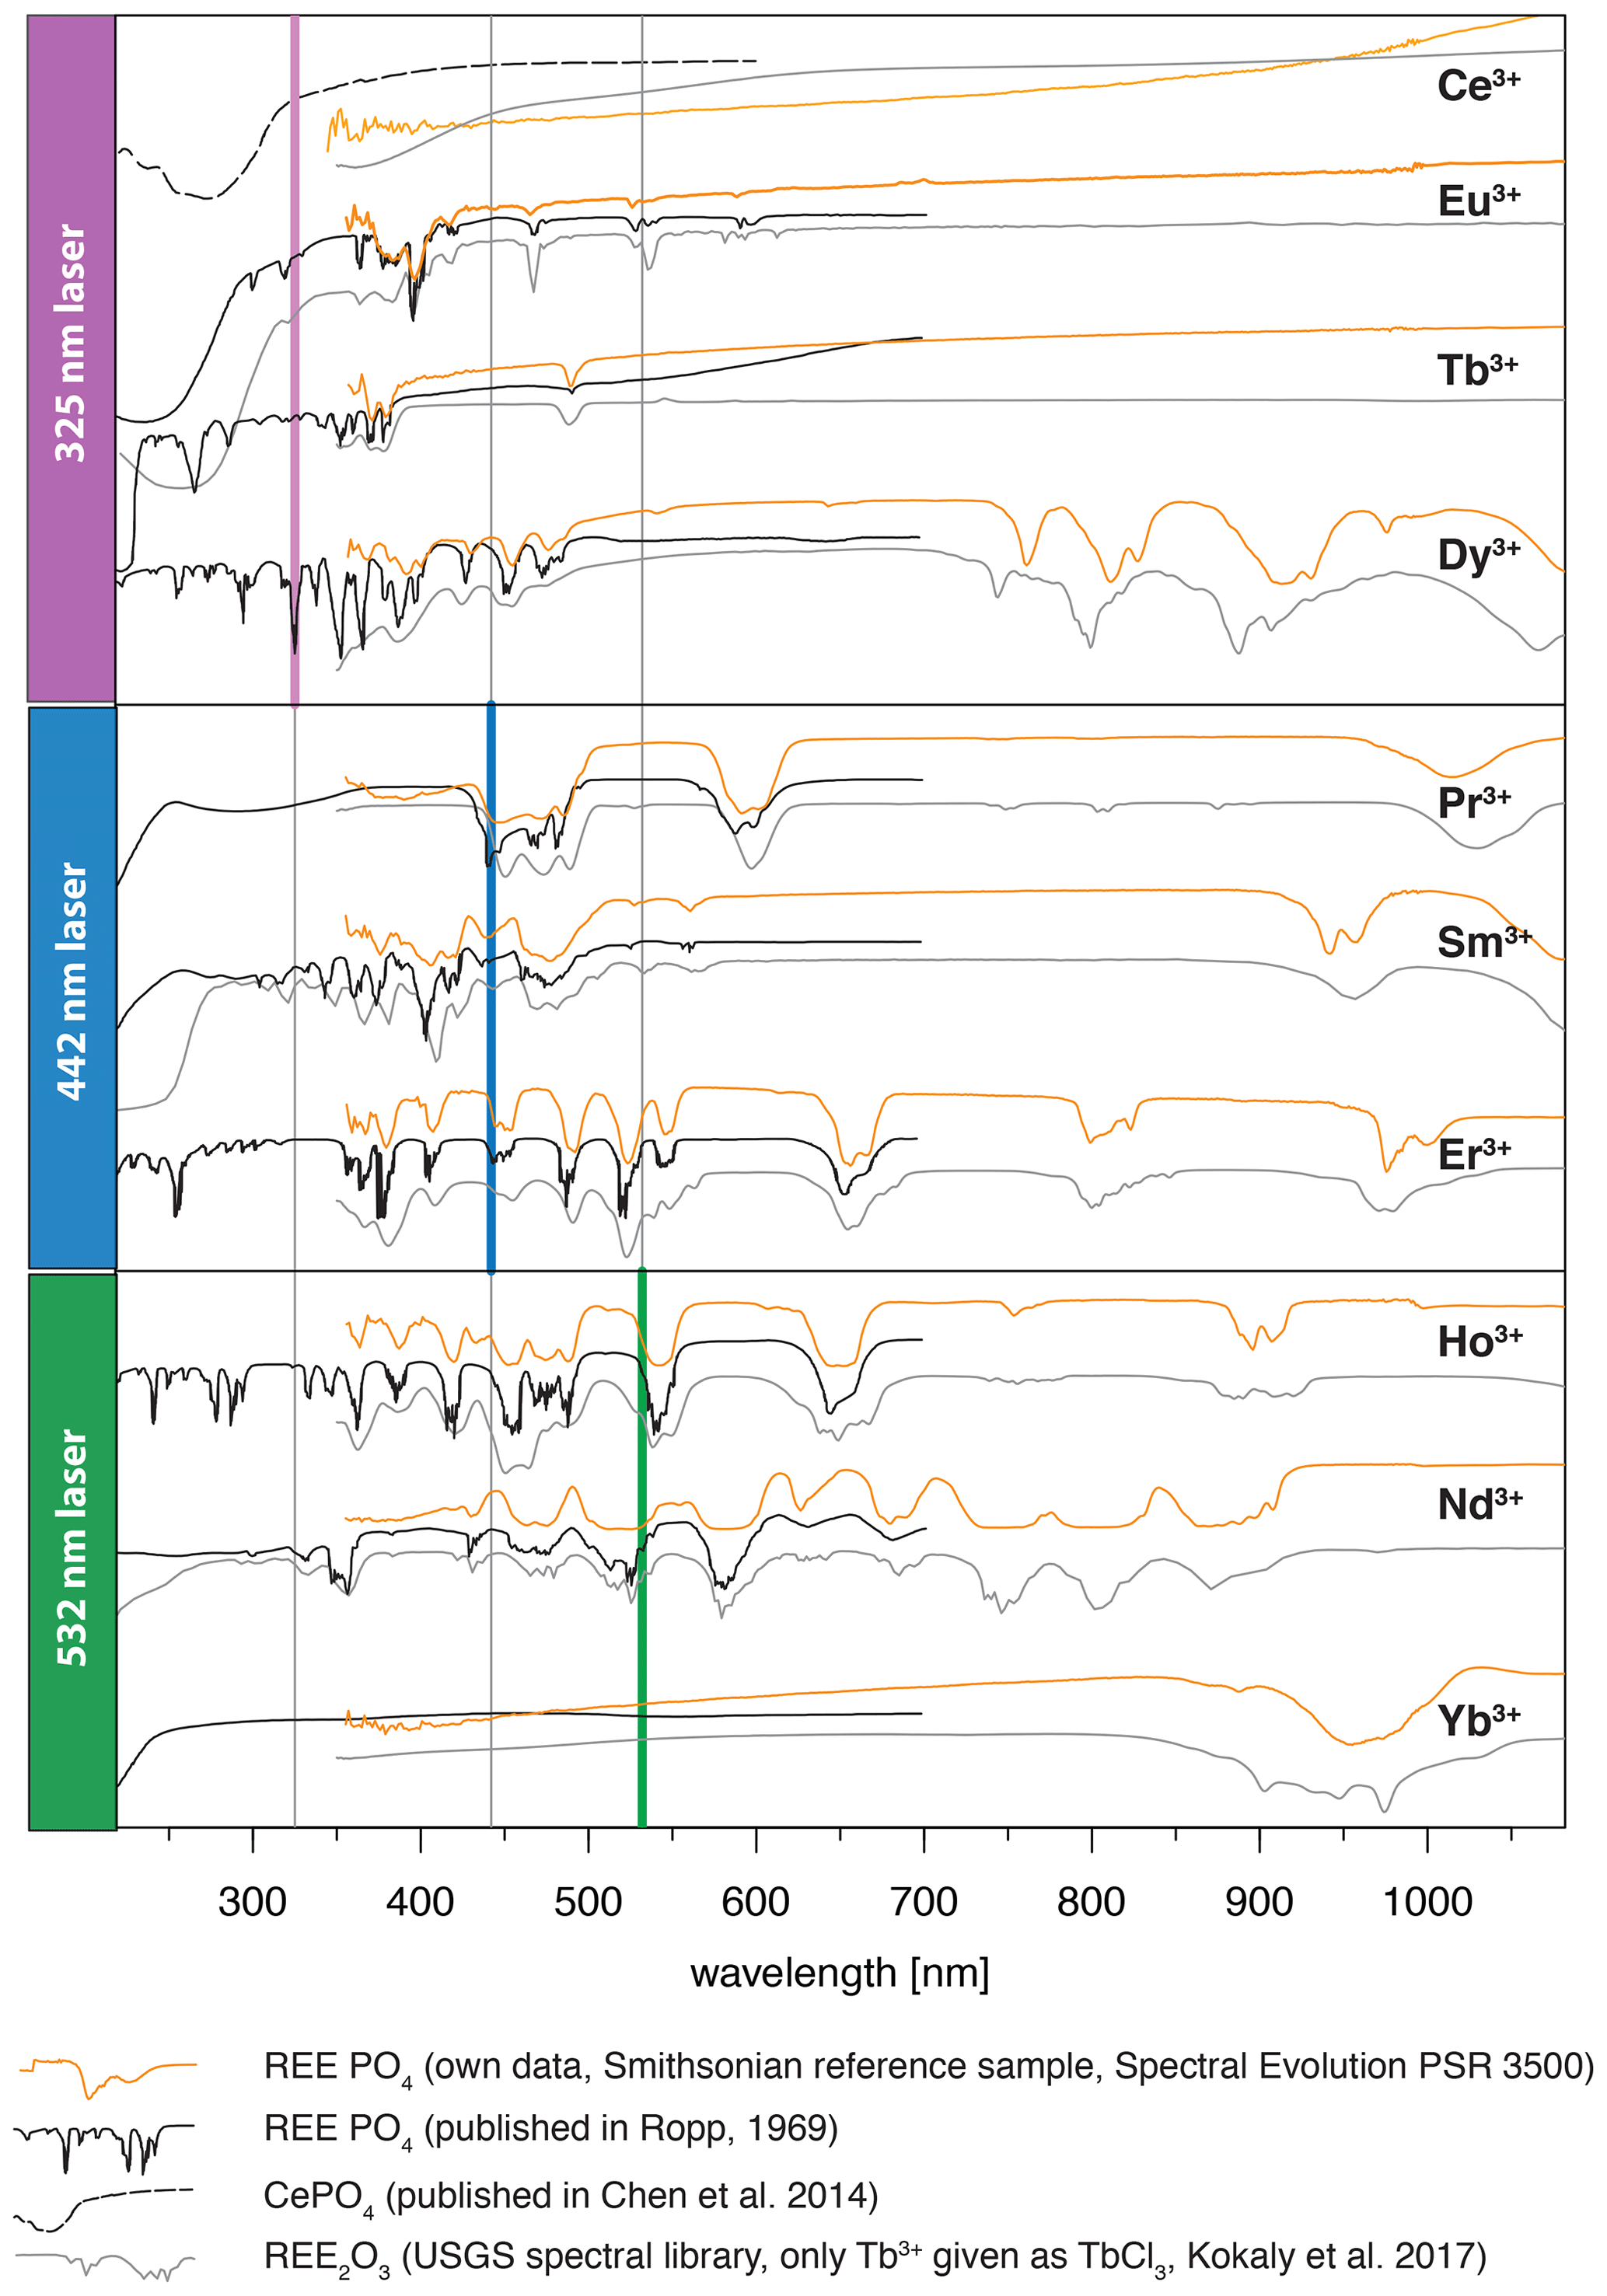
Figure 8Graphical representation of employed excitation laser wavelengths compared to reflectance spectra from our own measurements of the same REE PO4 reference samples using a Spectral Evolution PSR 3500 and two published data sets of reflectance spectra (for reference details see figure legend, y axis given in arbitrary units for illustration purposes).
Although ultra-violet laser wavelengths (such as 325 nm used in our study) seem to be preferred in analyses of REE emission spectra, the advantages of a selected use of excitation wavelengths were already recognised in many other studies, especially for Pr and Sm (blue, e.g. 442 nm) and for Nd and Ho (green, e.g. 532 nm) (e.g. Reisfeld et al., 1996; Gaft et al., 2005; Friis et al., 2010; Lorenz et al., 2019). Our results agree with those investigations and further highlight the specific drawbacks of non-suitable excitation conditions. For example, we observed in several of our REE PO4 samples that non-selective or high-energy excitation (in our case especially the 325 nm laser) seem to cause a broad-band luminescence with predominant absorption features that mask potential diagnostic REE emissions at wavelengths < 800 nm (see Sect. 3.2). This outlines the importance of appropriate laser wavelength selection, which in turn influences the spectral detection range. Fig. 9 shows how 442 and 532 nm lasers can unravel REE emission lines (see HoPO4) but also illustrates how improved REE signal to noise ratios may come at the cost of reduced detection ranges, which may cut off those emission lines (see ErPO4 in Fig. 9) at wavelengths shorter than the laser and long-pass filter wavelength. For example, in the case of Er3+, efficient laser excitation lines are commonly reported to be in the UV or green spectral range (e.g. Gaft et al., 2005). Our results, however, show a broad-band emission when using a UV laser that obscures the emission band around 550 nm. The use of the 442 nm laser excitation enables us to record this emission, which would remain at wavelengths shorter than the detection range when using a 532 nm laser, although the latter shows suitable excitation conditions as well. A comparison of the absorption characteristics depicted in Fig. 8 outlines that the 532 nm laser is close to a very efficient excitation band and hence may be preferred in many application cases, but also the 442 nm laser can provide suitable excitation conditions.
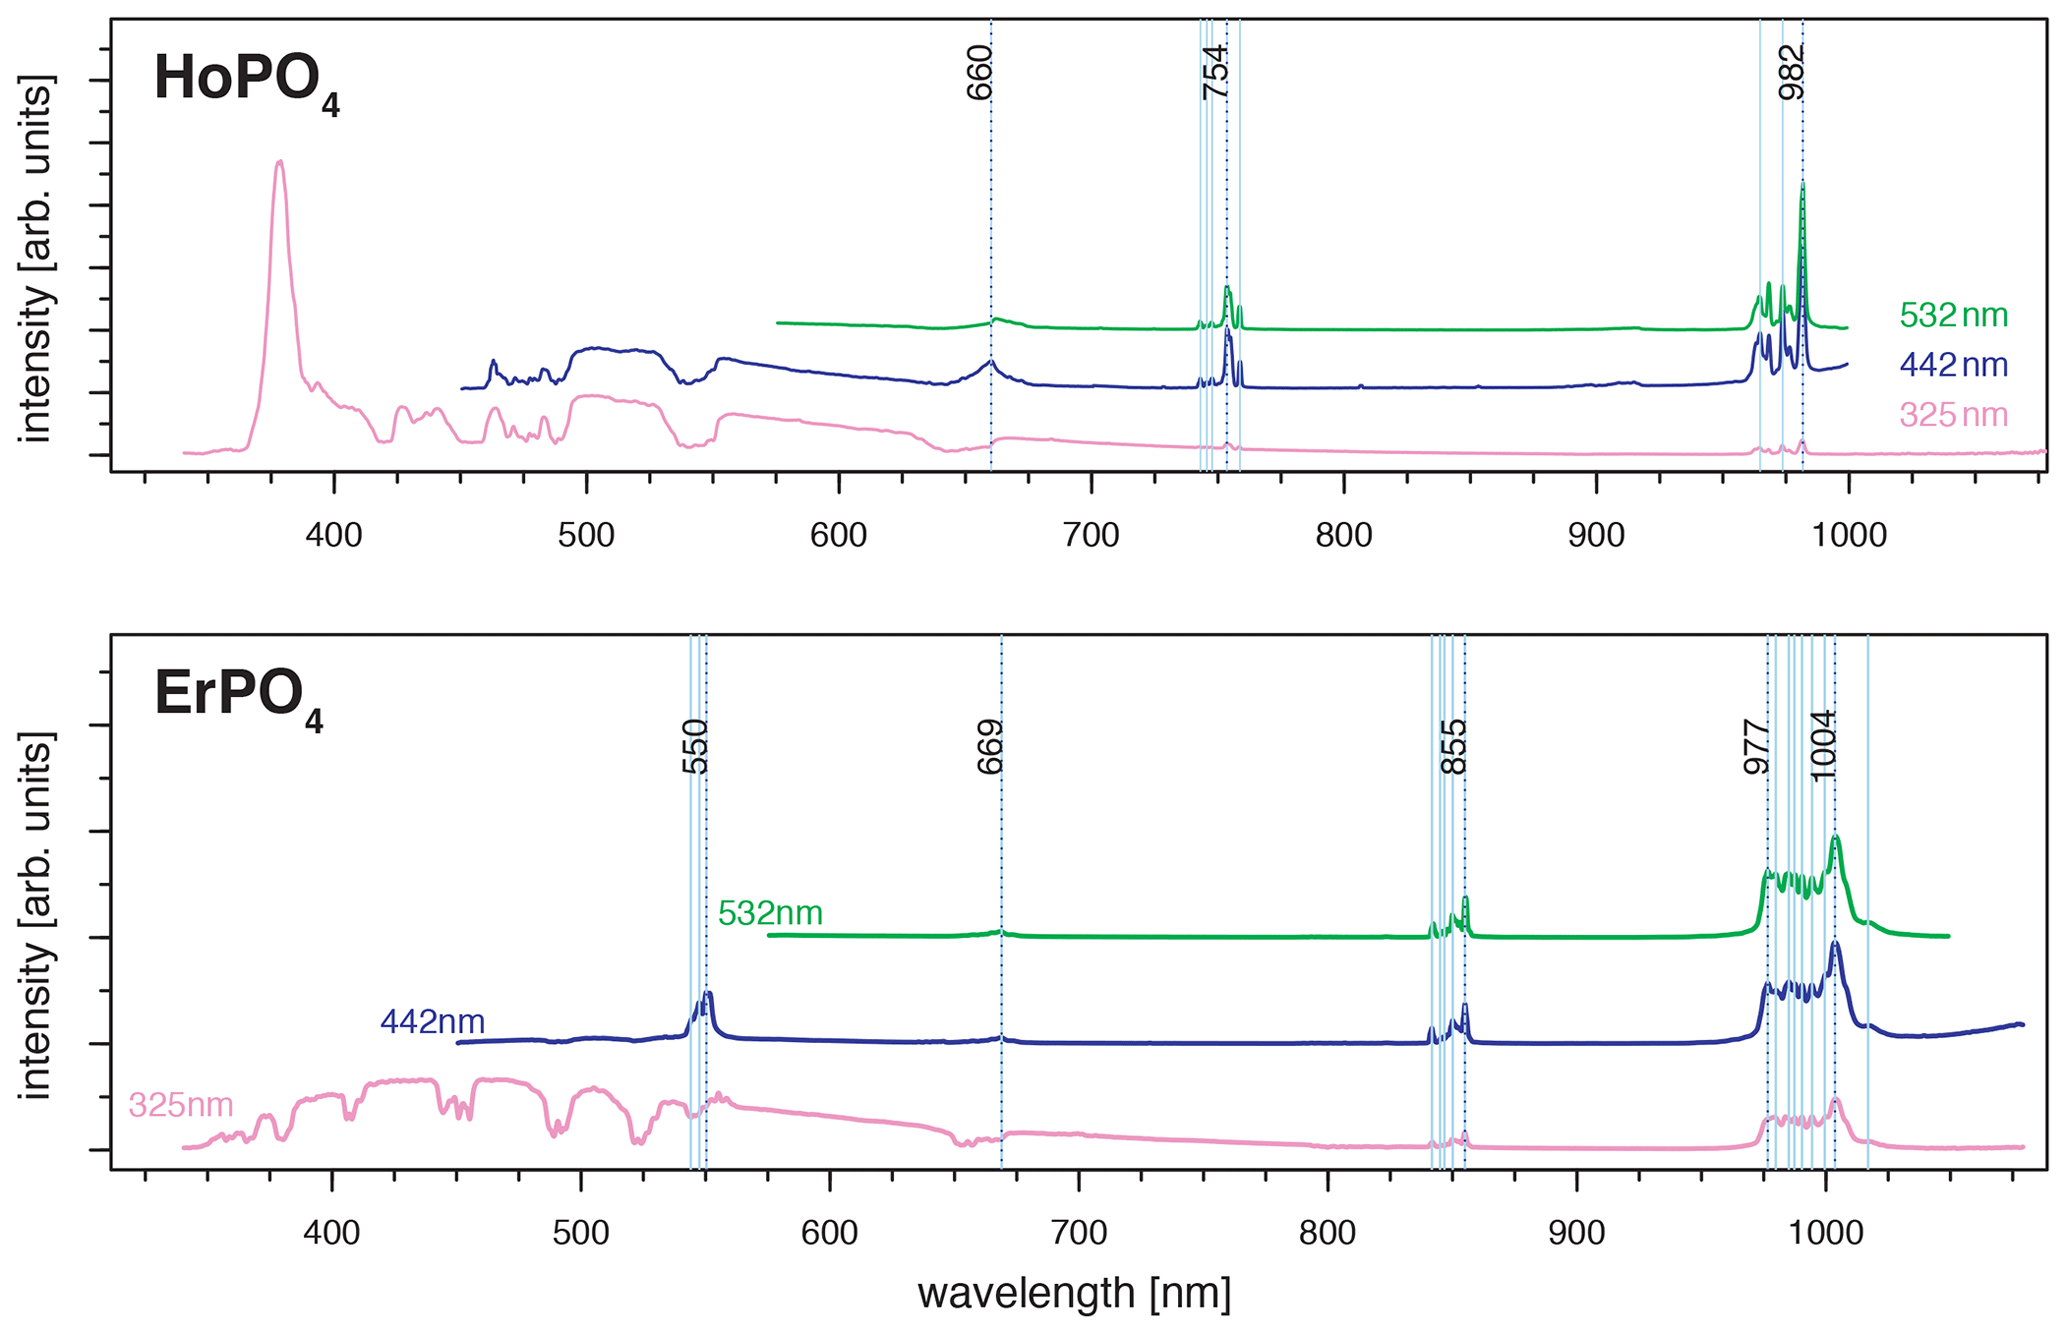
Figure 9Evaluation of suitable laser wavelength for efficient REE excitation without unspecific broad-band luminescence (examples HoPO4 and ErPO4) (dotted black lines: major emissions within emission cluster; light blue lines: emission sub-levels).
To give an overview, we summarise our results with benefits and drawbacks for REE identification dependent on the selected laser wavelength used in this study in Fig. 10. Our results emphasise the potential of selective REE excitation for technical implementation or REE differentiation and the need for careful interpretation of selectively excited LiF spectra. Such a selective approach may deliver the needed tools in analyses of material with unknown, mixed REE contents such as in applications for natural rock.

Figure 10Summary of the evaluation of suitable laser wavelengths for an efficient excitation of individual REEs (+: good conditions; −: bad conditions; A: absorption features recorded).
4.2 Application to natural rock samples
Applications of the LiF spectral library for automated REE identifications have to deal with effects from overlaps, masking or energy transfer when several REEs are present in the studied material. The presence of multiple REEs may influence relative emission intensities, and also the highly variable crystal field in natural samples may influence exact emission line positions. Mixed spectra have to be expected especially from LiF of natural rocks because of the REE's similar geochemical properties and corresponding collective occurrence. Several REEs seem to compete particularly due to a concentration of emission bands in the spectral range between 500 and 700 nm. As a result, the lines of certain REEs are more likely hidden by the stronger luminescence of other REEs. Therefore, an automated REE identification benefits from several emission bands available for peak matching and needs to account for suitable excitation conditions and effects from co-occurrence.
Sm3+, for example, shows prominent peaks at 600 nm (major) and 650 nm to be most relevant for identification, while the peak around 560 nm overlaps with the more prominent Tb3+ emission around 545 nm (Guan et al., 2016). Similarly, the same emission lines (600 and 650 nm) persist when Dy3+ contributes to the measured spectrum and masks the lower 560 nm emission line (Gaft et al., 2005). Pr3+ is difficult to detect because its emissions are hidden by the lines of Sm3+ (600–650 nm), Dy3+ (470–490 nm) and Nd3+ (870–900 nm) (Gaft et al., 2005). Blue lasers being suitable for both Pr and Sm complicate their differentiation, while for Dy3+ and Nd3+ selective excitation with UV (e.g. 325 nm) or green (e.g. 532 nm), respectively, provides an option. Tm3+ was not recorded with our system but is reported to be typically masked by Tb3+ (Gaft et al., 2005). None of the employed laser wavelengths were successful in revealing any diagnostic emission lines of Tm3+, while for both the embedded and the single grain specimen the significant broad-band luminescence in the spectral range < 700 nm dominated the spectra irrespective of 325, 442 or 532 nm excitations. Therefore, our library cannot provide a Tm spectrum for further applications to identify Tm in mixed spectra of natural samples. Nevertheless, we detected in all resulting spectra consistent absorption features at 355–365 nm, a doublet at 465–495 nm (most significant) and another smaller doublet at 660–710 nm (see Fig. 5, bottom) that agree with diagnostic absorption features of reference samples from the USGS library (Kokaly et al., 2017). Other difficulties can arise from energy transfer effects between REEs when several REEs are present, as needs to be expected in natural materials such as rocks or from cross-relaxation phenomena for high rare earth concentrations. Extensive research has been done, of which one simplified example is suppressed Ho3+ emissions in the presence of Dy3+ which can result in sensitisation of the Dy3+ characteristic emissions at 480 and 580 nm (Friis et al., 2010; Lenz, 2015).
An application example is given in Fig. 11 for a xenotime sample from Novo Horizonte, Brazil. The LiF reference spectra (black lines) allow for precise REE assignment to major emission peaks in the detected mixed spectra that were obtained by 325 nm (violet line), 442 nm (blue line) and 532 nm (green line) laser excitation. Especially Dy3+, Sm3+ and Nd3+ can be matched to the most prominent emission bands. The identified REE Dy3+, Sm3+ and Nd3+ (see Fig. 11) were validated by microprobe analysis (EMPA) with 7.73 wt %, 0.70 wt % and 0.08 wt %, respectively (Turner, 2015; Lorenz et al., 2019). The visibility of those prominent emissions exemplifies their dependence on suitable excitation conditions (laser wavelength) and accordingly the possibility to selectively enhance or suppress the luminescence of individual REEs.
However, it is the pattern of emission bands that provides further evidence for assigning the remaining peaks to specific REEs. For example, Er3+ (EMPA: 5.26 wt %) has an unequivocal peak above 850 nm when excited with a 442 nm laser, which may then be used as an indication of its contribution and better identification in remaining emission clusters. The Er3+ luminescence apparently contributes also to the emission cluster around 1000 nm, overlapping with a potential Yb3+ emission band (EMPA: 2.51 wt %), as well as to several dense emission lines around 550 nm which overlap with the Tb3+ emission (EMPA: 1.02 wt %) recorded during 325 nm laser excitation.
The 442 nm excitation pattern further demonstrates the above-mentioned competition between REE emissions (e.g. enhancement or suppression) exemplified by bright Sm3+ emissions compared to weaker Eu3+ emissions (EMPA: 0.12 wt %) at partly overlapping positions. Here, the co-existence of both REEs (Sm3+ and Eu3+) seems to affect the observed emission line pattern and relative intensities shown by, for example, an intense emission peak doublet at around 600 nm (see Fig. 11). The intensified diagnostic Sm3+ versus relatively weak Eu3+ emission lines suggest an energy transfer. The energetic transfer to Sm3+ reduces particularly the Eu3+-diagnostic emission lines at 613–622 nm to very low signal intensities. In the 325 nm excited spectrum, those Eu3+ emission lines at 613–622 nm may be present as weak signals, as well as those around 700 nm, but the prominent Dy3+ lines preclude an unequivocal identification. Another Eu3+ sub-level at 685 nm is, similarly, not apparent in the 442 nm excited spectrum next to the intense Sm3+ emission cluster around 700 nm. The weak to missing Eu3+ emission lines in our application example despite suitable excitation conditions with all three employed laser wavelengths in the reference material (see “Results” section and summary in Fig. 10) exemplify the difficulties of correct REE identification in natural samples with complex interactions between co-existing REEs. The three spectra excited at 325, 442 and 532 nm depict effects from energy transfer between REEs in line with low relative emission intensities compared to dominant emission features particularly of Dy3+, Sm3+, Er3+ and Nd3+ and also of Yb3+, Ho3+, Tb3+. How much the lower concentration of Eu3+ compared to the aforementioned REEs contributes to the low signal intensity is not within the scope of this study.
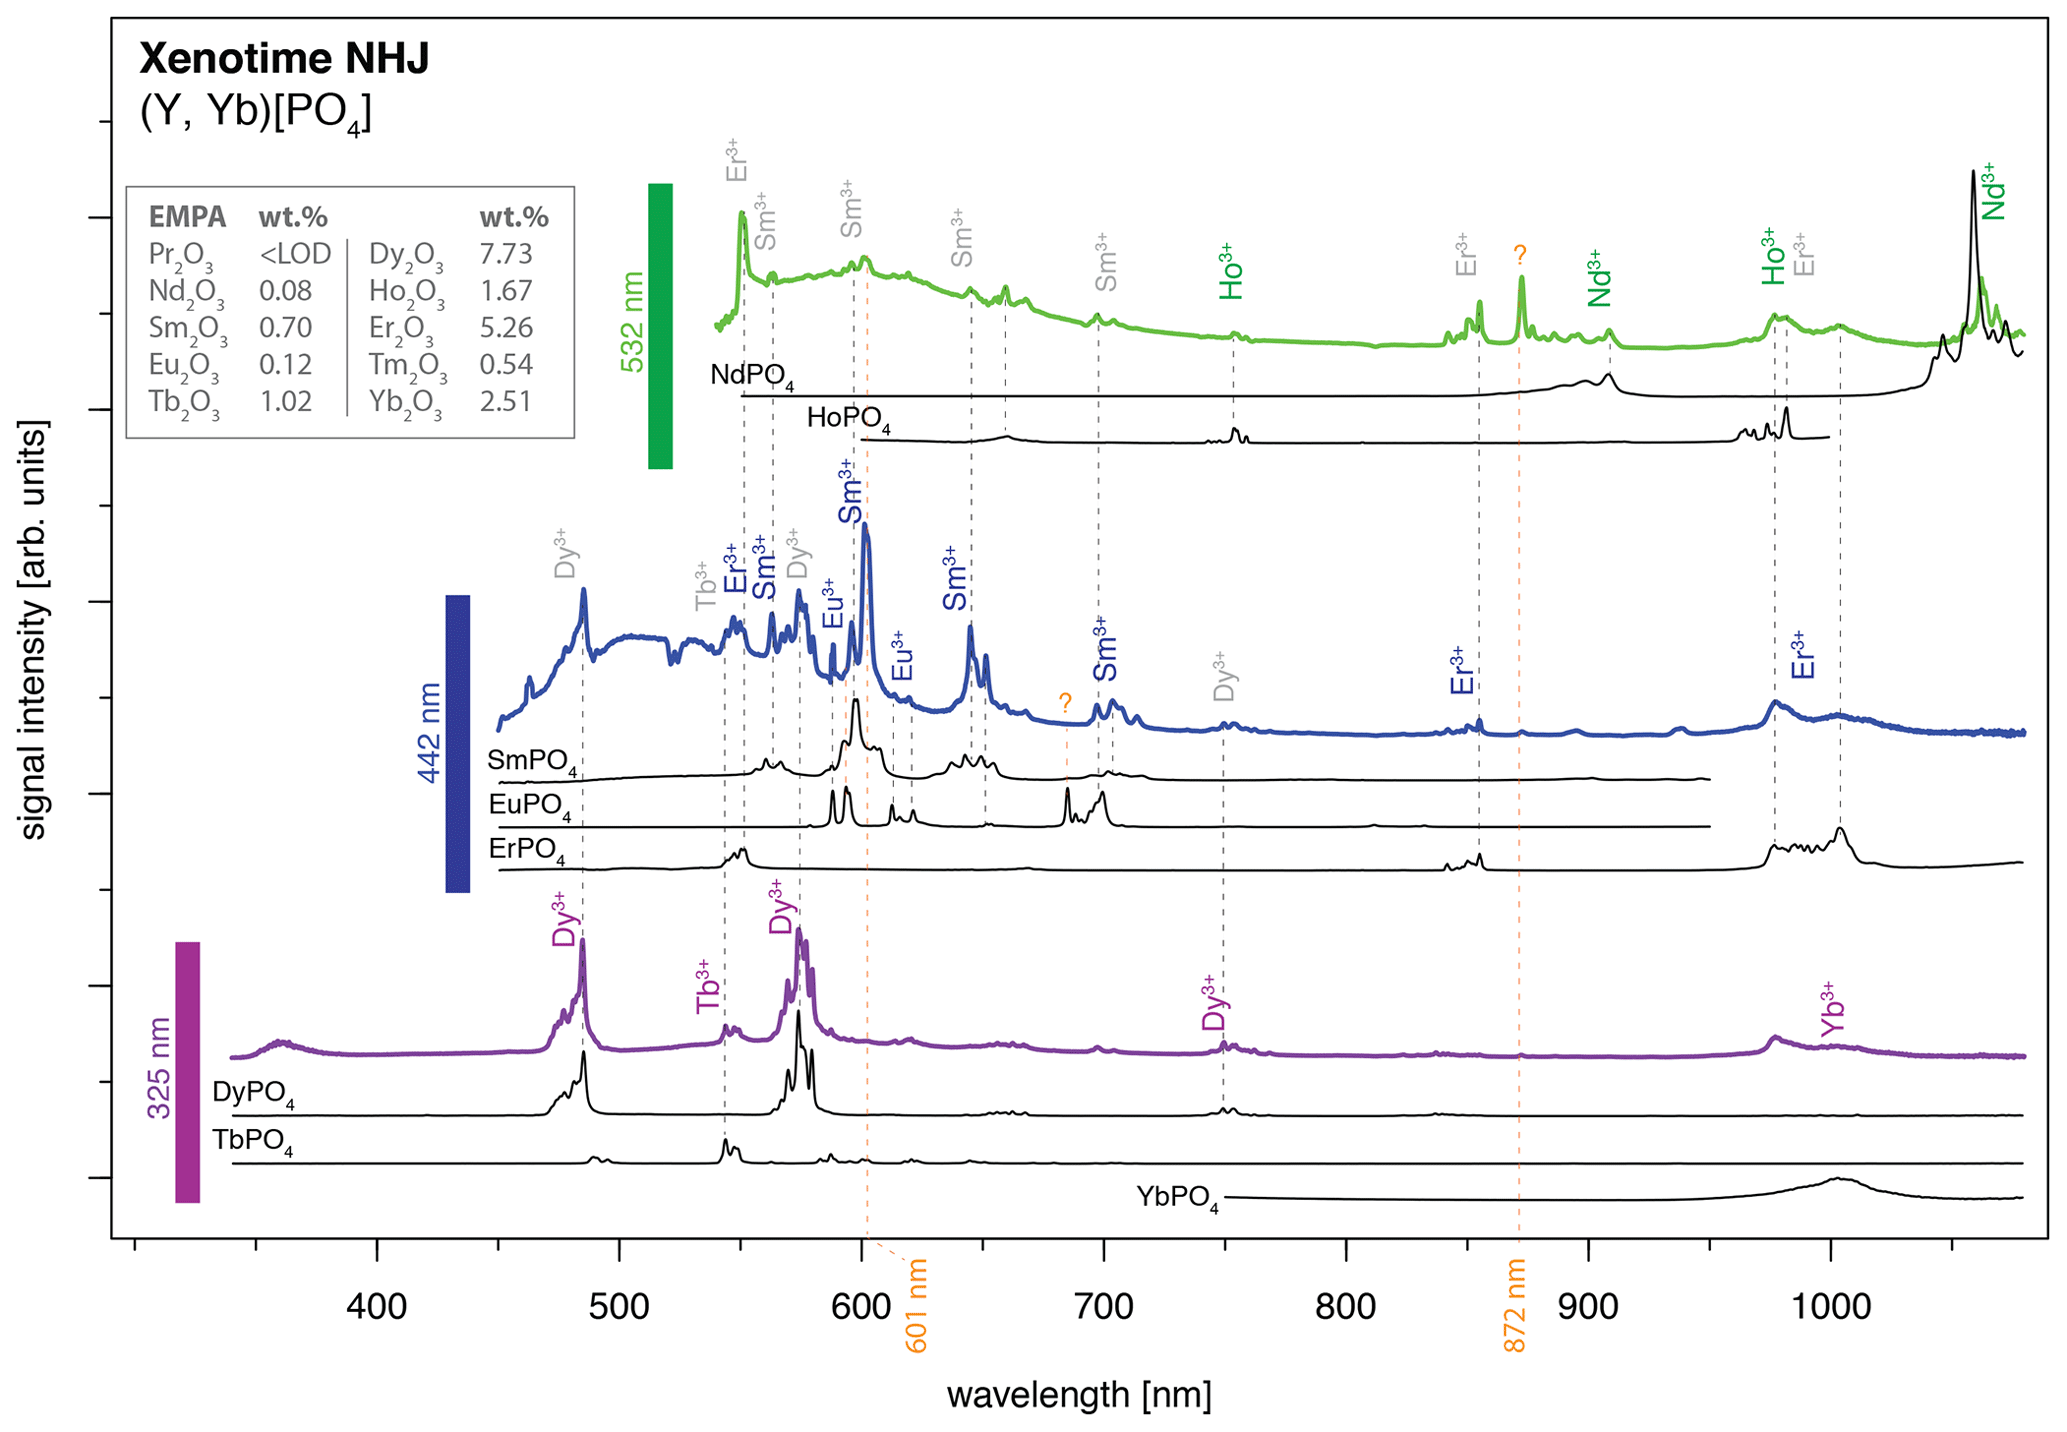
Figure 11Application of the presented LiF spectral library for REE identification in a natural mineral: xenotime from Novo Horizonte, sample NHJ (see Turner, 2015, and Lorenz et al., 2019). The measured spectra from the three different laser excitation wavelengths are offset, and luminescence intensities of individual spectra are scaled for better visualisation of observed emission lines and potential reference emission peaks (arbitrary units: comparison of signal intensities between spectra is not meaningful).
A change in relative emission intensities is further evident in the 532 nm excited xenotime spectrum at 872 nm (see orange question mark in Fig. 10). One potential candidate responsible for this significant peak could be Nd3+ that has a broad emission cluster in the same range but with opposite intensity ratios. Another candidate could be the rarely described near-infrared emission of Sm3+ at 872 nm (cf. Wang et al., 2017) that then may be ascribed to a sensitisation of this emission line as a consequence of complex energy transfers between the co-existing REEs. The excitation at 532 nm suggests also efficient Ho3+ stimulation (EMPA: 1.67 wt %), which is a potential candidate for explaining the 750 nm emission overlapping with a Dy3+ position, as well as for the 1000 nm cluster, where it is possibly mixed with Yb3+ and Er3+. The spectroscopic analysis of the presented phosphate rock sample from Novo Horizonte shows that the new LiF spectral library for REE phosphates enables us to identify all EMPA-detected REEs, despite Tm, down to a concentration of 0.08 wt %.
The observations confirm the valuable nature of reference spectra for natural sample evaluation and REE assignment. But the application example highlights at the same time that care needs to be taken with respect to complex effects between REEs and crystal lattice and between the REEs typically jointly occurring in natural minerals. Resulting mechanisms of energy transfer might influence relative peak intensities, and complex effects from the crystal field may cause shifts in exact peak positions. Differences in relative peak intensities between assigned REEs also underline the limits for quantitative conclusions. Compared to independent EMPA analysis, the Er3+-related emissions remain weak relative to, for example, Sm3+ and Nd3+ during blue and green laser excitations despite its higher concentration of 5.26 wt % versus 0.70 wt % and 0.08 wt %, respectively. Dedicated studies are required to draw conclusions on if and how a relative quantification may be possible under which circumstances, e.g. in the same host rocks from the same parent formation system.
Additionally, we want to emphasise the fact that anion sites in minerals, typically substituted by REEs, also can be occupied by other luminescent anions (e.g. Gaft et al., 2005). For example, Mn2+ substitutes for Ca2+ or Mg2+, Cr3+ for Al3+, and others. Complexes with oxygen such as WO4, MoO4, CrO4 and TiO6 may also contribute to the observed spectra and then may obscure the REE emission lines at overlapping wavelength positions. In those cases, complementary reference spectra for the corresponding anions and complexes would help a correct identification, while more detailed luminescence measurements such as time-resolved detection are needed to unravel REE emissions behind the often broader peaks such as from Mn2+.
The data comprising the LiF spectral library for REE orthophosphates are available via the online repository https://zenodo.org (last access: 20 July 2021), where the data are permanently stored and registered with the DOI https://doi.org/10.5281/zenodo.4054606 (Fuchs et al., 2020). The LiF library gives open access to the spectral data under the Creative Commons Attribution 4.0 International license. You can cite all versions of the data set provided via the LiF spectral library for REE orthophosphates at https://zenodo.org by using the given DOI to refer to Fuchs et al. (2020) and citing this article.
We present LiF spectra for the Smithsonian REE phosphate standards in the visible to near-infrared spectral range (350–1080 nm). Excitation at all three commonly used laser wavelengths (325, 442, 532 nm) yielded spectra with distinct REE-related emission lines for EuPO4, TbPO4, DyPO4 and YbPO4. At 325 nm excitation, most other REE spectra were dominated by broad-band defect emissions with prominent absorption features that match published reflectance data and mask expected REE emission lines. Here, lower-energy laser excitation at 442 nm proved successful especially for suppressing the non-REE-related broad-band luminescence. Resulting REE reference spectra include those from PrPO4, SmPO4 and ErPO4. For NdPO4 and HoPO4 the most efficient excitation was achieved with 532 nm. The diagnostic emission lines of GdPO4 lie outside the detection range, and none of the three laser wavelengths were appropriate for TmPO4 excitation.
Our results demonstrate the suitability of LiF for REE detection and especially the possibility of selective element excitation. Our reference spectra provide the full spectral information at high resolution (0.13 nm) in order to allow for comprehensive analysis of emission line positions, emission line intensity ratios and splitting into emission line sub-levels. The spectral library serves as an objective database for an improved evaluation of REE-bearing natural rocks or other materials and makes a transparent comparison possible with published and future LiF measurement data. The permanent storage and open access of the data via the online repository zenodo.org and registered DOI https://doi.org/10.5281/zenodo.4054606 (Fuchs et al., 2020) provide the needed functionality for sharing and re-using the data set. Thus, the available spectral data support the use of LiF for REE analysis in natural samples and its application in raw material exploration, in which reference libraries are required for efficient solutions of result evaluation. Yet, the presented library is limited to trivalent REEs hosted in orthophosphates. Complementary spectral data of other economically relevant REE configurations (e.g. divalent REEs or other host minerals) are needed to further improve LiF capacities in REE exploration. Applications in natural rock material rely on the suppression of potentially strong matrix emissions. In this respect, selective laser wavelengths instead of high-power UV stimulation and time-resolved measurements promise considerable improvements for reliable REE identification. The three investigated laser wavelength may provide the grounds for robust technical solutions of a LiF sensor in exploration. Nevertheless, scientific research demands more flexible excitation conditions to optimise emission efficiency and selective detection of individual REE luminescence for in-depth analysis. Multiple complex interactions between naturally co-existing REEs and with complex variable host configurations in natural rocks still require careful interpretation of LiF spectra and a good understanding of luminescence principles. Detailed excitation spectra, as well as time-resolved luminescence measurements, represent valuable options for further insights into the causes and mechanisms behind the observed spectra (e.g. Czaja et al., 2013; Gaft et al., 2005). However, usage of the library for visual comparison or implementation into innovative automated data analysis routines facilitates identification of most probable REE candidates responsible for observed luminescence also in cases of similar emission lines but cannot replace the need for expert knowledge. The integration in particular of reflectance hyperspectral imaging provides great potential for cross-validation of REE identification and for insights into mineralisation processes.
MCF and JB designed and performed all experiments for data acquisition in the optical characterisation laboratory of the TU Bergakademie Freiberg. Scientific results and corresponding interpretations were extensively discussed by MCF with all co-authors regarding physical background (JB, SuS and JH) and their mineralogical and geological implications (SL, ADR and RG). MCF prepared the manuscript with contributions from all co-authors.
The authors declare that they have no conflict of interest.
Publisher's note: Copernicus Publications remains neutral with regard to jurisdictional claims in published maps and institutional affiliations.
We thank the Smithsonian Institution Department of Mineral Sciences and Tim Rose for providing and sending the REE phosphate samples NMNH 168484–168499 used in this study (see also https://naturalhistory.si.edu/research/mineral-sciences/collections-overview/reference-materials/smithsonian-microbeam-standards, last access: 20 July 2021). The scientific work was part of the EIT upscaling project inSPECtor. Data acquisition was done in the optical characterisation laboratory of the Institute of Applied Physics at the TU Bergakademie Freiberg.
This research has been supported by the EIT RawMaterials (grant no. 16304).
This paper was edited by Kirsten Elger and reviewed by Uwe Altenberger and one anonymous referee.
Ahmed, Z. and Iftikhar, K.: Red, orange-red and near-infrared light emitting ternary lanthanide tris β-diketonate complexes with distorted C4v geometrical structures, Dalton Trans., 48, 4973–4986, https://doi.org/10.1039/C9DT00198K, 2019. a
Barakos, G., Gutzmer, J., and Mischo, H.: An outlook on the rare earth elements mining industry, AusIMM Bulletin, 2, 62–66, 2016. a
Barmarin, G.: Luminescent Mineral Database, available at: http://www.fluomin.org/uk/accueil.php, last access: 25 April 2020. a
Beleites, C. and Sergo, V.: hyperSpec: a package to handle hyperspectral data sets in R, r package version 0.99-20180627, available at: http://hyperspec.r-forge.r-project.org (last access: 27 November 2020), 2018. a
Binnemans, K.: Interpretation of europium(III) spectra, Coordin. Chem. Rev., 295, 1–45, https://doi.org/10.1016/j.ccr.2015.02.015, 2015. a
Boesche, N. K., Rogass, C., Lubitz, C., Brell, M., Herrmann, S., Mielke, C., Tonn, S., Appelt, O., Altenberger, U., and Kaufmann, H.: Hyperspectral REE (Rare Earth Element) Mapping of Outcrops – Applications for Neodymium Detection, Remote Sensing, 7, 5160, https://doi.org/10.3390/rs70505160, 2015. a, b
Booysen, R., Zimmermann, R., Lorenz, S., Gloaguen, R., Nex, P. A. M., Andreani, L., and Möckel, R.: Towards Multiscale and Multisource Remote Sensing Mineral Exploration Using RPAS: A Case Study in the Lofdal Carbonatite-Hosted REE Deposit, Namibia, Remote Sensing, 11, 2500, https://doi.org/10.3390/rs11212500, 2019. a
Broicher, H.: Bulk sorting by LIF: quality control of ores for bulk sorting and blending – by laser-induced fluorescence analysis, Min. Eng., 52, 24–28, 2000. a
Broicher, H.: Dilution control – online and real-time recognition of ore and waste by LIF, SME Annual Meeting, 28 February–2 March 2005, Salt Lake City, UT 1–5, 2005. a
Chakraborty, A., Debnath, G. H., Saha, N. R., Chattopadhyay, D., Waldeck, D. H., and Mukherjee, P.: Identifying the Correct Host–Guest Combination To Sensitize Trivalent Lanthanide (Guest) Luminescence: Titanium Dioxide Nanoparticles as a Model Host System, J. Phys. Chem. C, 120, 23870–23882, 2016. a
Chen, H., Ni, Y., and Ma, X.: Phase-controllable synthesis, shape evolution and optical performances of CePO4 nanocrystals via a simple oil-bath route, RSC Adv., 4, 36553–36559, https://doi.org/10.1039/C4RA07052F, 2014. a
CSIRO: CSIRO Luminescence database, available at: https://luminescence.csiro.au/luminescence/default.aspx, last access: 1 August 2019. a
Czaja, M., Bodyl-Gajowska, S., Gluchowski, P., Mazurak, Z., and Strek, W.: Luminescence properties of rare earth ions in fluorite, apatite and scheelite mineral, J. Alloy. Compd., 451, 290–292, https://doi.org/10.1016/j.jallcom.2007.04.058, 2008. a
Czaja, M., Bodyl-Gajowska, S., Lisiecki, R., Meijerink, A., and Mazurak, Z.: The luminescence properties of rare-earth ions in natural fluorite, Phys. Chem. Miner., 39, 639–648, https://doi.org/10.1007/s00269-012-0518-8, 2012. a, b, c, d, e, f, g
Czaja, M., Bodyl-Gajowska, S., and Mazurak, Z. G.: Steady-state luminescence measurement for qualitative identification of rare earth ions in minerals, J. Miner. Petrol. Sci., 108, 47–54, https://doi.org/10.2465/jmps.111229, 2013. a
Donovan, J., Hanchar, J., Picolli, P., Schrier, M., Boatner, L., and Jarosewich, E.: Contamination in the rare-earth element orthophosphate reference samples, J. Res. Natl. Inst. Stan., 106, 693–701, https://doi.org/10.6028/jres.107.056, 2002. a, b, c, d, e, f, g, h, i, j, k, l, m, n, o, p, q
Donovan, J., Hanchar, J., Piccoli, P., Schrier, M., Boatner, L., and Jarosewich, E.: A reexamination of the rare-earth element orthophosphate reference samples for electron microprobe analysis, Can. Mineral., 41, 221–232, https://doi.org/10.2113/gscanmin.41.1.221, 2003. a, b, c
Emsbo, P., McLaughlin, P. I., Breit, G. N., du Bray, E. A., and Koenig, A. E.: Rare earth elements in sedimentary phosphate deposits: Solution to the global REE crisis?, Gondwana Res., 27, 776–785, https://doi.org/10.1016/j.gr.2014.10.008, 2015. a
European Commission: Report on critical raw materials for the EU, Report of the Ad-hoc Working Group on defining critical raw materials, European Commission, availablea at: https://ec.europa.eu/docsroom/documents/10010/attachments/1/translations/en/renditions/pdf (last access: 20 July 2021), 2014. a
European Commission: Report on critical raw materials and the Circular Economy, European Commission, Brussels, available at: https://op.europa.eu/de/publication-detail/-/publication/d1be1b43-e18f-11e8-b690-01aa75ed71a1/language-en/format-PDF/source-80004733 (last access: 20 July 2021), 2018. a
Fang, H., Wei, X., Zhou, S., Li, X., Chen, Y., Duan, C.-K., and Yin, M.: Terbium and holmium codoped yttrium phosphate as non-contact optical temperature sensors, RSC Adv., 7, 10200–10205, https://doi.org/10.1039/C6RA27971F, 2017. a
Fasnacht, L., Vogt, M.-L., Renard, P., and Brunner, P.: A 2D hyperspectral library of mineral reflectance, from 900 to 2500 nm, Sci. Data, 6, 268, https://doi.org/10.1038/s41597-019-0261-9, 2019. a
Friis, H., Finch, A., Williams, C., and Hanchar, J.: Photoluminescence of zircon (ZrSiO4) doped with REE3+ (REE = Pr, Sm, Eu, Gd, Dy, Ho, Er), Phys. Chem. Miner., 37, 333–342, https://doi.org/10.1007/s00269-009-0336-9, 2010. a, b, c, d, e, f, g, h, i, j, k
Fuchs, M. C., Beyer, J., Lorenz, S., Sharma, S., Renno, A. D., Heitmann, J., and Gloaguen, R.: Spectral library of laser-induced fluorescence (LiF) properties from Smithsonian rare-earth element (REE) orthophosphate standards, Zenodo [data set], https://doi.org/10.5281/zenodo.4054606, 2020. a, b, c, d, e
Gaft, M. and Panczer, G.: Laser-induced time-resolved luminescence spectroscopy of minerals – a powerful tool for studying the nature of emission centres, Miner. Petrol., 107, 363–373, https://doi.org/10.1007/s00710-013-0293-3, 2013. a
Gaft, M., Reisfeld, R., Panczer, G., Blank, P., and Boulon, G.: Laser-induced time-resolved luminescence of minerals, Spectrochim. Acta A, 54, 2163–2175, https://doi.org/10.1016/S1386-1425(98)00134-6, 1998. a, b
Gaft, M., Reisfeld, R., and Panczer, G.: Modern luminescence spectroscopy of minerals and materials, 1st Edn., Springer-Verlag, Berlin Heidelberg, https://doi.org/10.1007/b137490, 2005. a, b, c, d, e, f, g, h, i, j, k, l, m, n, o, p, q, r, s, t, u, v, w, x, y, z, aa, ab
Gandhi, M., Agrawal, N., and Bhatia, H.: Quantum Cutting down Conversion by Cooperative Energy Transfer from Tb3+ to Yb3+ in CeF3 Nanophosphors, in: Energy Development, vol. 860 of Advanced Materials Research, Trans Tech Publications Ltd, 124–127, https://doi.org/10.4028/www.scientific.net/AMR.860-863.124, 2014. a
Gavrilović, T. V., Jovanović, D. J., Trandafilović, L. V., and Dramićanin, M. D.: Effects of Ho3+ and Yb3+ doping concentrations and Li+ co-doping on the luminescence of GdVO4 powders, Opt. Mater., 45, 76–81, https://doi.org/10.1016/j.optmat.2015.03.013, 2015. a
Goodenough, K., Schilling, J., Jonsson, E., Kalvig, P., Charles, N., Tuduri, J., Deady, E., Sadeghi, M., Schiellerup, H., Müller, A., Bertrand, G., Arvanitidis, N., Eliopoulos, D., Shaw, R., Thrane, K., and Keulen, N.: Europe's rare earth element resource potential: An overview of REE metallogenetic provinces and their geodynamic setting, Ore Geol. Rev., 72, 838–856, https://doi.org/10.1016/j.oregeorev.2015.09.019, 2016. a
Guan, H., Sheng, Y., Song, Y., Zheng, K., Xu, C., Xie, X., Dai, Y., and Zou, H.: White light-emitting, tunable color luminescence, energy transfer and paramagnetic properties of terbium and samarium doped BaGdF5 multifunctional nanomaterials, RSC Adv., 6, 73160–73169, https://doi.org/10.1039/C6RA14296F, 2016. a, b
Ha, H. M., Hoa, T. T. Q., Vu, L. V., and Long, N. N.: Photoluminescence and Energy Transfer Between Sm3+ Ions in LaF3 Nanocrystals Prepared by Hydrothermal Method, International Journal of Materials Science and Applications, 5, 284–289, https://doi.org/10.11648/j.ijmsa.20160506.18, 2016. a
He, S., Xia, H., Zhang, J., Zhu, Y., and Chen, B.: Highly efficient up-conversion luminescence in Er3+/Yb3+ co-doped Na5Lu9F32 single crystals by vertical Bridgman method, Sci. Rep., 7, 8751, https://doi.org/10.1038/s41598-017-09222-0, 2017. a
Jarosewich, E. and Boatner, L.: Rare-earth element reference samples for electron microprobe analysis, Geostandard. Newslett., 15, 397–399, https://doi.org/10.1111/j.1751-908X.1991.tb00115.x, 1991. a, b, c, d, e
Kalashnikov, A., Konopleva, N., Ivanyuk, G., and Pakhomovsky, Y.: Rare Earth Deposits of the Murmansk Region, Russia – A Review, Econ. Geol., 111, 1529–1559, https://doi.org/10.2113/econgeo.111.7.1529, 2016. a
Kang, X., Lü, W., Wang, H., and Ling, D.: Multicolor-tunable up-conversion emissions of Yb3+, Er3+/Ho3+ co-doped Ba3Lu2Zn5O11: crystal structure, luminescence and energy transfer properties, Dalton Trans., 48, 2917–2925, https://doi.org/10.1039/C8DT04577A, 2019. a, b
Kauppinen, T., Khajehzadeh, N., and Haavisto, O.: Laser-induced fluorescence images and Raman spectroscopy studies on rapid scanning of rock drillcore samples, Int. J. Miner. Process., 132, 26–33, https://doi.org/10.1016/j.minpro.2014.09.003, 2014. a
Kokaly, R., Clark, R., Swayze, G., Livo, K., Hoefen, T., Pearson, N., Wise, R., Benzel, W., Lowers, H., Driscoll, R., and Klein, A.: USGS Spectral Library Version 7, Tech. Rep. 1035, U.S. Geological Survey Data Series, https://doi.org/10.3133/ds1035, 2017. a, b, c, d, e, f, g, h, i, j
Lafuente, B., Downs, R. T., Yang, H., and Stone, N.: he power of databases: the RRUFF project, in: Highlights in Mineralogical Crystallography, edited by: Armbruster, T. and Danisi, R. M., W. De Gruyter, Berlin, Germany, 1–30, 2015. a
Lenz, C.: Luminescence of Lanthanoides (Rare-earth elements) – Probes of structural variations in minerals, PhD thesis, University of Vienna, 2015. a, b
Lenz, C., Talla, D., Ruschel, K., Škoda, R., Götze, J., and Nasdala, L.: Factors affecting the Nd3+ (REE3+) luminescence of minerals, Miner. Petrol., 107, 415–428, https://doi.org/10.1007/s00710-013-0286-2, 2013. a
Liang, Y.-J., Liu, F., Chen, Y.-F., Wang, X.-J., Sun, K.-N., and Pan, Z.: New function of the Yb3+ ion as an efficient emitter of persistent luminescence in the short-wave infrared, Light Science Applications, 5, e16124, https://doi.org/10.1038/lsa.2016.124, 2016. a, b
Liang, Y.-J., Liu, F., Chen, Y., Wang, X., Sun, K., and Pan, Z.: Red/near-infrared/short-wave infrared multi-band persistent luminescence in Pr3+-doped persistent phosphors, Dalton Trans., 46, 11149, https://doi.org/10.1039/c7dt02271a, 2017. a
Lima, I. B. D. and Filho, W. L. (Eds.): Rare Earths Industry – Technological, Economic, and Environmental Implications, Elsevier, Boston, https://doi.org/10.1016/C2014-0-01863-1, 2015. a, b
Lorenz, S., Beyer, J., Fuchs, M., Seidel, P., Turner, D., Heitmann, J., and Gloaguen, R.: The Potential of Reflectance and Laser Induced Luminescence Spectroscopy for Near-Field Rare Earth Element Detection in Mineral Exploration, Remote Sensing, 11, 21, https://doi.org/10.3390/rs11010021, 2019. a, b, c, d
National Research Council: Minerals, Critical Minerals, and the U.S. Economy, The National Academies Press, Washington, DC, https://doi.org/10.17226/12034, 2008. a
Nazarov, M., Tsukerblat, B., Byeon, C., Arellano, I., Popovici, E.-J., and Noh, D.: Polarization selection rules and optical transitions in terbium activated yttrium tantalate phosphor under x-ray, vacuum-ultraviolet, and ultraviolet excitations, Appl. Optics, 48, 17–21, https://doi.org/10.1364/AO.48.000017, 2009. a
Neave, D. A., Black, M., Riley, T. R., Gibson, S. A., Ferrier, G., Wall, F., and Broom-Fendley, S.: On the Feasibility of Imaging Carbonatite-Hosted Rare Earth Element Deposits Using Remote Sensing, Econ. Geol., 111, 641–665, https://doi.org/10.2113/econgeo.111.3.641, 2016. a
Nienhaus, K. and Bayer, A.: Innovative Systems for Horizon Control of Mining Machines by Means of Laser Induced Fluorescence (LIF), Mine Planning and Equipment Selection, Kalgoorlie, WA, 1–7, 2003. a
Pandey, A. and Swart, H. C.: Luminescence investigation of visible light emitting Ho3+ doped tellurite glass, J. Lumin., 169, 93–98, https://doi.org/10.1016/j.jlumin.2015.08.060, 2016. a, b, c
Prasad, V. R., Damodaraiah, S., Devara, S., and Ratnakaram, Y.: Photoluminescence studies on holmium (III) and praseodymium (III) doped calcium borophosphate (CBP) phosphors, J. Mol. Struct., 1160, 383–392, https://doi.org/10.1016/j.molstruc.2018.02.034, 2018. a, b, c, d
Qin, F., Zheng, Y., Yu, Y., Cheng, Z., Tayebi, P. S., Cao, W., and Zhang, Z.: Ultraviolet and violet upconversion luminescence in Ho3+-doped Y2O3 ceramic induced by 532-nm CW laser, J. Alloy. Compd., 509, 1115–1118, https://doi.org/10.1016/j.jallcom.2010.09.188, 2011. a, b, c
R Core Team: R: A Language and Environment for Statistical Computing, R Foundation for Statistical Computing, Vienna, Austria, available at: http://www.R-project.org (last access: 20 July 2021), 2014. a
Reisfeld, R., Gaft, M., Boulon, G., Panczer, C., and Jørgensen, C.: Laser-induced luminescence of rare-earth elements in natural fluor-apatites, J. Lumin., 69, 343–353, https://doi.org/10.1016/S0022-2313(96)00114-7, 1996. a, b, c, d, e, f, g, h, i
Ropp, R.: Phosphors Based on Rare Earth Phosphates: II. Reflection Spectra of Rare Earth Phosphates, J. Electrochem. Soc., 116, 623–629, https://doi.org/10.1149/1.2411989, 1969. a, b
Runowski, M., Woźny, P., Martín, I. R., Lavín, V., and Lis, S.: Praseodymium doped YF3:Pr3+ nanoparticles as optical thermometer based on luminescence intensity ratio (LIR) – Studies in visible and NIR range, J. Lumin., 214, 116571, https://doi.org/10.1016/j.jlumin.2019.116571, 2019. a, b, c, d
Samanta, T., Sarkar, S., Adusumalli, V. N. K. B., Praveen, A. E., and Mahalingam, V.: Enhanced visible and near infrared emissions via Ce3+ to Ln3+ energy transfer in Ln3+-doped CeF3 nanocrystals (Ln = Nd and Sm), Dalton Trans., 45, 78–84, https://doi.org/10.1039/c5dt02974k, 2016. a
Seidel, P., Lorenz, S., Heinig, T., Zimmermann, R., Booysen, R., Beyer, J., Heitmann, J., and Gloaguen, R.: Fast 2D Laser-Induced Fluorescence Spectroscopy Mapping of Rare Earth Elements in Rock Samples, Sensors, 19, 2219, https://doi.org/10.3390/s19102219, 2019. a
Shalapska, T., Dorenbos, P., Gektin, A., Stryganyuk, G., and Voloshinovskii, A.: Luminescence spectroscopy and energy level location of lanthanide ions doped in La(PO3)3, J. Lumin., 155, 95–100, https://doi.org/10.1016/j.jlumin.2014.06.029, 2014. a, b, c, d, e, f, g, h, i
Sharma, S. K., Köhler, T., Beyer, J., Fuchs, M., Gloaguen, R., and Heitmann, J.: Extending the temperature sensing range using Eu3+ luminescence up to 865 K in a single crystal of EuPO4, Phys. Chem. Chem. Phys., 21, 16329–16336, https://doi.org/10.1039/C9CP03501J, 2019. a
Smithsonian National Museum of Natural History: Smithsonian microbeam standards data sheet, available at: https://naturalhistory.si.edu/research/mineral-sciences/collections-overview/reference-materials/smithsonian-microbeam-standards, last access: 10 October 2019. a, b
Tang, L., Ye, H., and Xiao, D.: Photo-induced luminescence degradation in Ce, Yb co-doped yttrium aluminum garnet phosphors, Appl. Optics, 57, 7627–7633, https://doi.org/10.1364/AO.57.007627, 2018. a
Turner, D. J.: Reflectance spectroscopy and imaging spectroscopy of rare earth element-bearing mineral and rock samples, PhD thesis, University of British Columbia, 2015. a, b, c
Turner, D. J., Rivard, B., and Groat, L. A.: Visible and short-wave infrared reflectance spectroscopy of REE fluorocarbonates, Am/ Mineral/, 99, 1335–1346, https://doi.org/10.2138/am.2014.4674, 2014. a, b
Wang, S., Xu, J., Wang, J., Wang, K.-Y., Dang, S., Song, S., Liu, D., and Wang, C.: Luminescence of samarium(iii) bis-dithiocarbamate frameworks: codoped lanthanide emitters that cover visible and near-infrared domains, J. Mater. Chem. C, 5, 6620–6628, https://doi.org/10.1039/C7TC01844D, 2017. a
Wang, X., Li, X., Zhong, H., Xu, S., Cheng, L., Sun, J., Zhang, J., Li, L., and Chen, B.: Up-conversion luminescence, temperature sensing properties and laser-induced heating effect of Er3+/Yb3+ co-doped YNbO4 phosphors under 1550 nm excitation, Sci. Rep., 8, 5736, https://doi.org/10.1038/s41598-018-23981-4, 2018. a
Wantana, N., Kaewjaeng, S., Kothan, S., Kim, H. J., and Kaewkhao, J.: Energy transfer from Gd3+ to Sm3+ and luminescence characteristics of CaO–Gd2O3–SiO2–B2O3 scintillating glasses, J. Lumin., 181, 382–386, https://doi.org/10.1016/j.jlumin.2016.09.050, 2017. a
Wei, X., Li, Y., Cheng, X., Chen, Y., and Yin, M.: Strong dependence of upconversion luminescence on doping concentration in holmium and ytterbium co-doped Y2O3 phosphor, J. Rare Earths, 29, 536–539, https://doi.org/10.1016/S1002-0721(10)60493-0, 2011. a
White, W. B.: Diffuse-reflectance spectra of rare-earth oxides, Appl. Spectrosc., 21, 167–171, 1967. a
Yashodha, S. R., Dhananjaya, N., and Manjunath, C.: Synthesis and photoluminescence properties of Sm3+ doped LaOCl phosphor with reddish orange emission and it's Judd-Ofelt analysis, Mater. Res Express, 7, 015003, https://doi.org/10.1088/2053-1591/ab57a6, 2019. a
Yu, D. C., Ye, S., Huang, X. Y., and Zhang, Q. Y.: Enhanced three-photon near-infrared quantum splitting in β-NaYF4:Ho3+ by codoping Yb3+, AIP Adv., 2, 022124, https://doi.org/10.1063/1.4718412, 2012. a, b
Zhou, B., Tao, L., Tsang, Y. H., Jin, W., and Pun, E. Y.-B.: Superbroadband near-IR photoluminescence from Pr3+-doped fluorotellurite glasses, Opt. Express, 20, 3803–3813, https://doi.org/10.1364/OE.20.003803, 2012. a, b, c
Zimmermann, R., Brandmeier, M., Andreani, L., Mhopjeni, K., and Gloaguen, R.: Remote Sensing Exploration of Nb-Ta-LREE-Enriched Carbonatite (Epembe/Namibia), Remote Sensing, 8, 620, https://doi.org/10.3390/rs8080620, 2016. a
Zirner, A. L., Marks, M. A., Wenzel, T., Jacob, D. E., and Markl, G.: Rare earth elements in apatite as a monitor of magmatic and metasomatic processes: The Ilímaussaq complex, South Greenland, Lithos, 228–229, 12–22, https://doi.org/10.1016/j.lithos.2015.04.013, 2015. a