the Creative Commons Attribution 4.0 License.
the Creative Commons Attribution 4.0 License.
 | 03 Sep 2021
Observations of the downwelling far-infrared atmospheric emission at the Zugspitze observatory
Marco Barucci
Claudio Belotti
Giovanni Bianchini
Bertrand Cluzet
Francesco D'Amato
Samuele Del Bianco
Gianluca Di Natale
Marco Gai
Dina Khordakova
Alessio Montori
Hilke Oetjen
Markus Rettinger
Christian Rolf
Dirk Schuettemeyer
Ralf Sussmann
Silvia Viciani
Hannes Vogelmann
Frank Gunther Wienhold
Measurements of the spectrum of the atmospheric emission in the far-infrared (FIR) range, between 100 and 667 cm−1 (100–15 µm) are scarce because of the detection complexity and of the strong absorption of air at ground level preventing the sounding of the FIR from low altitude. Consequently, FIR measurements need to be made from high-altitude sites or on board airborne platforms or satellites. This paper describes the dataset of FIR spectral radiances of the atmosphere and snow surface emission measured in the 100–1000 cm−1 range by the Far-Infrared Radiation Mobile Observation System (FIRMOS) instrument during a 2-month campaign carried out from the ground at about 3000 m of altitude on the top of Mt. Zugspitze in the German Alps in 2018–2019. This campaign is part of the preparatory activity of a new space FIR mission, named Far-infrared Outgoing Radiation Understanding and Monitoring (FORUM), which is under development by the European Space Agency (ESA). The dataset acquired during the campaign also includes all the additional measurements needed to provide a full characterisation of the observed atmospheric state and the local atmospheric and surface conditions. It includes co-located spectral measurements in the infrared range from 400 to 1800 cm−1; lidar backscatter profiles; radio soundings of temperature, humidity and aerosol backscatter profiles; local weather parameters; and snow/ice microphysical properties. These measurements provide a unique dataset that can be used to perform radiative closure experiments to improve modelling parameters in the FIR that are not well-characterised, such as water vapour spectroscopy, scattering properties of cirrus clouds, and the FIR emissivity of the surface covered by snow. The consolidated dataset is freely available via the ESA campaign dataset website at https://doi.org/10.5270/ESA-38034ee (Palchetti et al., 2020a).
- Article
(9096 KB) - Full-text XML
- BibTeX
- EndNote


The far-infrared (FIR), defined here as the longest wavelength region of the infrared spectrum covering the wavenumber range from 667 cm−1 (or equivalently 15 µm wavelength) down to 100 cm−1 (100 µm), contains more than 50 % of the energy emitted by the Earth toward space. This spectral region is modulated by the properties of the most relevant components of the climate system, such as water vapour, carbon dioxide, clouds, and snow surface emissivity (Harries et al., 2008). The characterisation of the FIR radiative properties of these components is therefore essential to improve gaseous modelling of spectroscopy (Mlawer et al., 2019), cirrus cloud radiative properties (Cox et al., 2010), and surface emissivity (Chen et al., 2014), which in turn will allow for a better understanding of the Earth radiation budget and reduce uncertainties in climate models (Huang et al., 2018; Baran et al., 2014; Huang et al., 2007). Nevertheless, due to technical challenges, systematic and global measurements of the FIR from space are still missing and are scarce from ground and airborne platforms.
To fill this observational gap, a space mission, named Far-infrared Outgoing Radiation Understanding and Monitoring (FORUM) (Palchetti et al., 2020b), is under development by the European Space Agency (ESA) as the ninth Earth Explorer mission to be launched in 2026 (https://www.forum-ee9.eu/, last access: 6 May 2021). This mission will measure with high accuracy the spectrum of the outgoing infrared radiation from 100 to 1600 cm−1 (100–6.25 µm) covering, for the first time with high spectral resolution, the FIR portion of the spectrum. In preparation for this mission, an instrument demonstrator, named Far-Infrared Radiation Mobile Observation System (FIRMOS), was developed for field applications from ground-based (and in perspective airborne) platforms to verify with real measurements the sounding capability provided by FIR observations.
At ground level the atmosphere in the FIR spectral region is very opaque because of the high concentration of water vapour. For this reason, sounding of the FIR with ground-based observations is possible only from high altitude sites where the water vapour content is sufficiently low to make the atmosphere transparent at frequencies below 667 cm−1. This requires the deployment of FIR instrumentation on high mountain sites, around 3000 or at higher altitude (Palchetti et al., 2015; Mlynczak et al., 2016; Turner et al., 2012). Observations during the wintertime are preferred in order to have the water vapour content at its seasonal minimum, thus improving the capability to sound the lowest wavenumbers, with potential semi-transparency down to 250 cm−1. The sounding of the remainder of the FIR, below 250 cm−1, is only possible from airborne platforms or high-altitude aircraft (Cox et al., 2007) and balloons (Mlynczak et al., 2006; Palchetti et al., 2006) flying in the upper troposphere or the lower stratosphere. In this paper, we describe the measurements acquired during the first field deployment of FIRMOS between the end of 2018 and the beginning of 2019 at the Alpine observatory of Mt. Zugspitze in the south of Germany at about 3000 m altitude, together with all the ancillary measurements needed to provide a complete characterisation of the observed atmospheric and surface states.
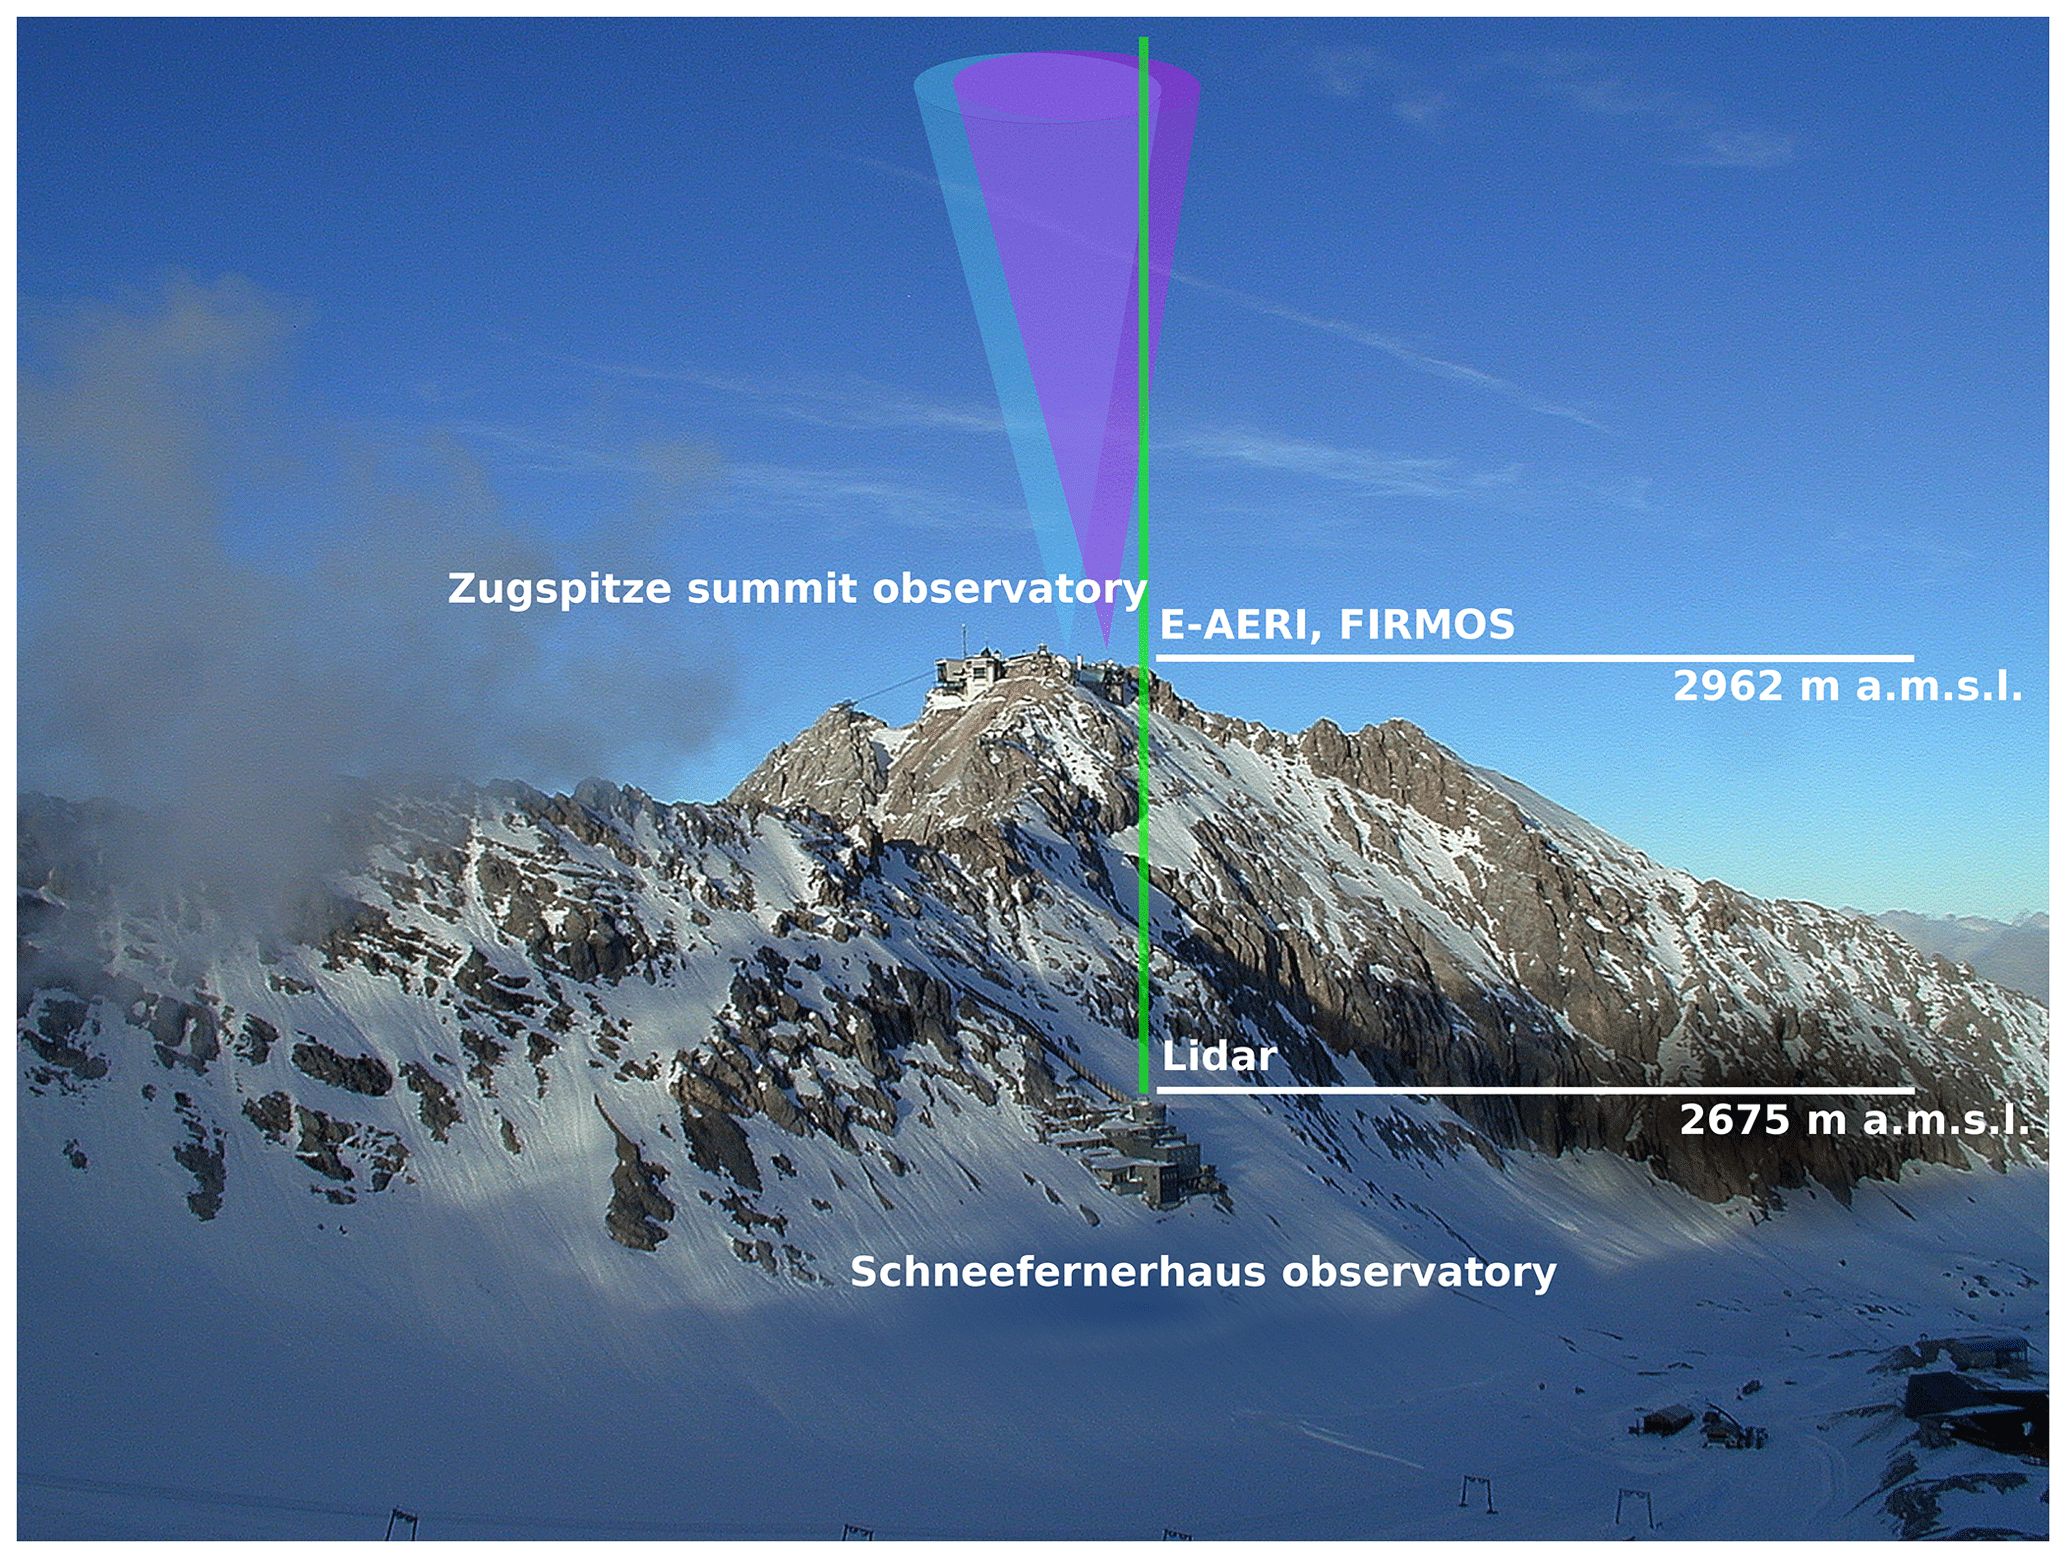
The Zugspitze site was chosen because of the very dry atmospheric conditions frequently encountered at the Summit Observatory, with values of the integrated water vapour (IWV) as low as 0.1 mm and median of 2.3 mm (see more details in Sussmann et al., 2016). The minimum IWV is approximately a factor of 40 lower than at typical lowland mid-latitude sites. In this respect the Zugspitze is comparable to the driest sites in the world, i.e. remote locations like the Atacama Desert or polar stations. In spite of that, the Zugspitze Observatory is reachable via cable car within 10 min from a car park and offered a suitable infrastructure for the deployment of FIRMOS due to the presence of a complementary and comprehensive set of instruments. This provided independent information of the observed atmospheric and cloud states to be used as reference for the comparison with FIRMOS. The Zugspitze Observatory comprises two stations: the Summit station (47.421∘ N, 10.986∘ E; 2962 ) and the Environmental Research Station Schneefernerhaus (47.417∘ N, 10.980∘ E; 2675 ), which is located on the south slope of the mountain, 300 m below and 680 m southwest of the Summit (see Fig. 1).
During the campaign, measurements were carried out using instruments deployed at the Zugspitze Summit, at the Schneefernerhaus station, and at the Karlsruhe Institute of Technology (KIT) in Garmisch-Partenkirchen.
The emission spectrum was measured in the FIR with FIRMOS, which was developed at CNR-INO with the support of ESA and the Italian Space Agency (ASI) and installed in November 2018 on the terrace of the Summit station. The instrument is a Fourier transform spectrometer (FTS) designed on the base of a similar instrument, named Radiation Explorer in the Far InfraRed – Prototype for Applications and Development (REFIR-PAD) (Bianchini et al., 2019), permanently installed in Antarctica in 2012 (Palchetti et al., 2015). The FTS consists of an interferometric layout with double-input and double-output ports in a Mach–Zehnder configuration, which increases the measurement reliability and the calibration precision (Carli et al., 1999). The instrument is able to cover the FIR radiation using wideband germanium-coated biaxially oriented polyethylene terephthalate beam splitters and room-temperature pyroelectric detectors. It was mounted within a plastic box to protect the optics and electronics from environmental conditions, such as wind and snowfall, when installed on the site. The full field of view (FOV) of FIRMOS is 22 mrad.
At the Summit station, KIT operates an Extended-range Atmospheric Emitted Radiance Interferometer (E-AERI) system (Sussmann et al., 2016), manufactured by ABB Bomem Inc. (Quebec, Canada), which covers part of the far, mid- and near-infrared spectral regions. Like FIRMOS, E-AERI is zenith looking, its FOV is 46 mrad.
The spectrum of the downwelling longwave radiation (DLR) was therefore measured in the FIR and mid-infrared spectral ranges from 100 to 1800 cm−1 (100–5.56 µm) using both FIRMOS, covering the 100–1000 cm−1 spectral range, and the first channel of E-AERI, covering the 400–1800 cm−1 range. Spectra are provided without apodisation, with a sampling resolution corresponding to the sinc response function of Δσ=0.3 cm−1 for FIRMOS (maximum optical path difference (MOPD) = 1.66667 cm) and Δσ=0.48215 cm−1 for E-AERI (MOPD = 1.03703 cm). The instrument line shape (ILS) of FIRMOS is a linear combination of sinc and sinc2 (as in the case shown in Bianchini et al., 2019) with a full width at half maximum (FWHM) of about 0.36 cm−1, whereas for E-AERI the ILS is an “ideal” sinc with FWHM = 0.58 cm−1 (Knuteson et al., 2004). More information about ILSs is provided with the dataset.
Figure 2 shows FIRMOS' installation close to the E-AERI instrument, which is permanently installed on the top of the shelter, 4 m above FIRMOS, and routinely performs measurements of spectral DLR when the weather conditions allow operation. A comparison between the average of 310 measurements of the spectral DLR in clear sky conditions performed simultaneously with FIRMOS and E-AERI is also shown in the figure.
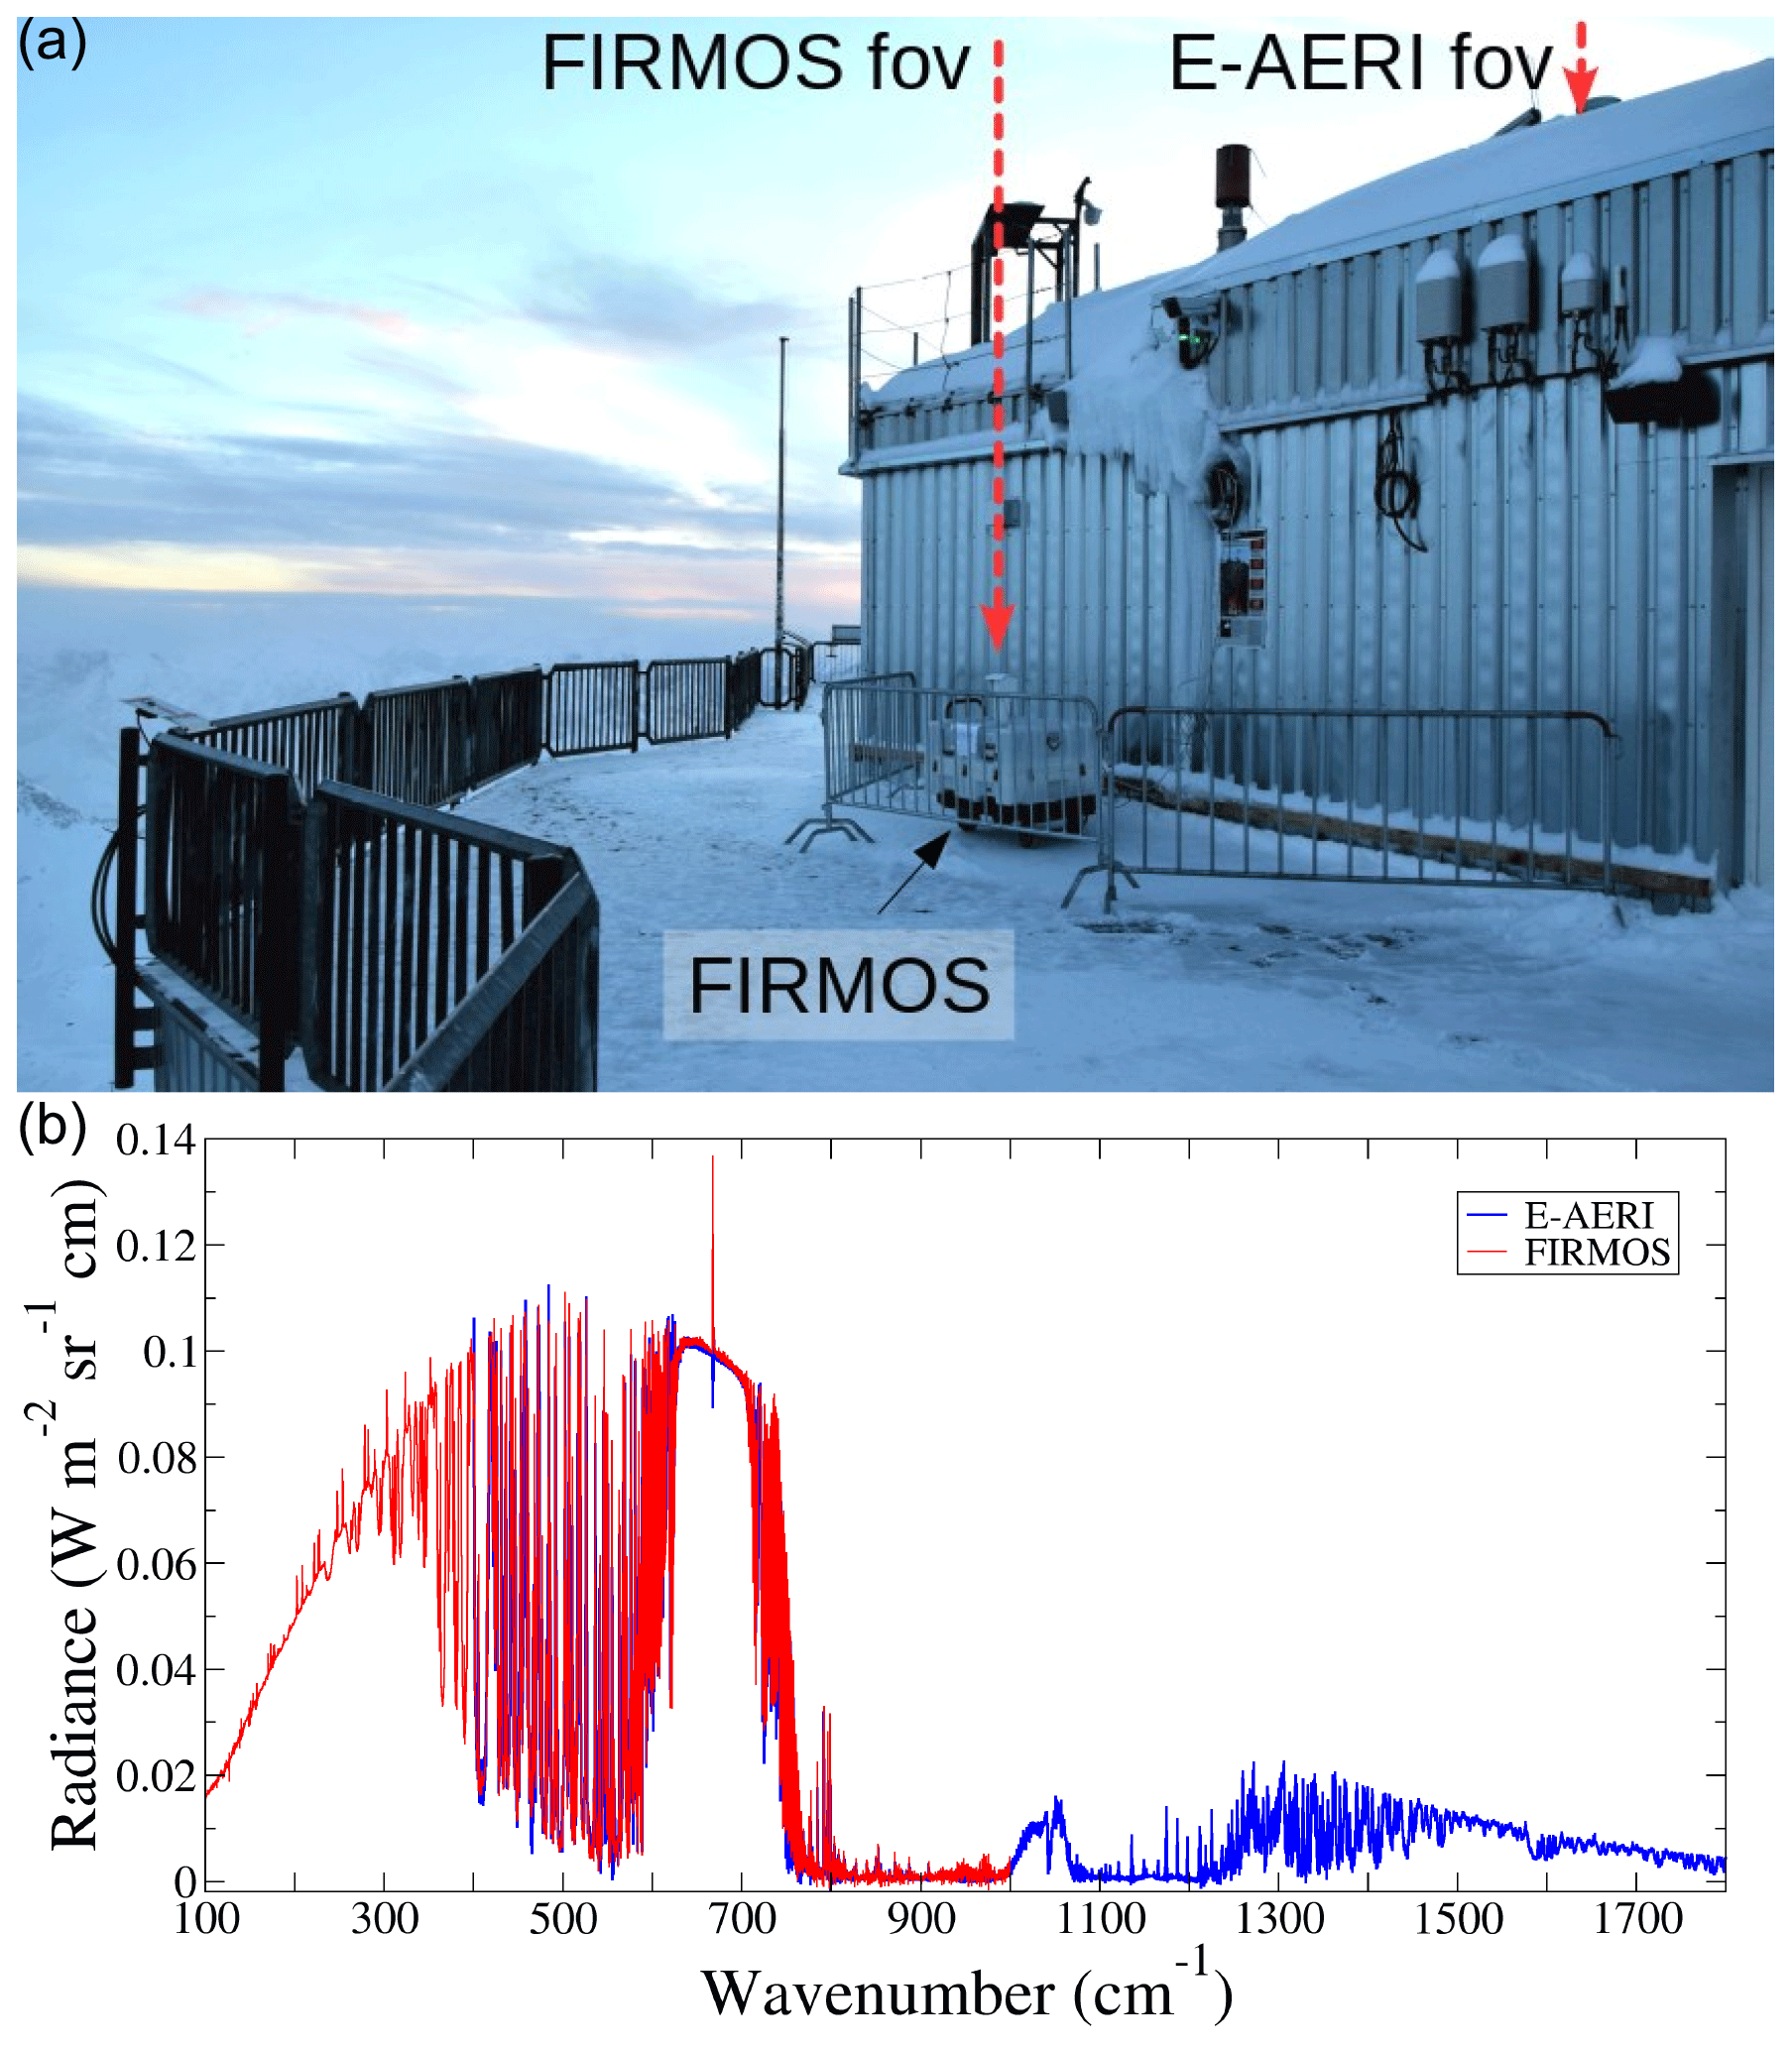
Figure 2FIRMOS and E-AERI installed at the Summit station (a). The comparison between the average spectra of 310 simultaneous observations acquired by the two instruments in clear sky during 2019 campaign is shown in (b).
KIT also operates two lidar systems for aerosols and clouds (Vogelmann and Trickl, 2008), as well as water vapour and temperature (Klanner et al., 2021) profiling, installed at the Schneefernerhaus station. The advantage of mounting the lidar systems at Schneefernerhaus and the spectrometer at the Summit is that the onset of the measured lidar profiles is typically about 300 m above the laser, which coincides with the location of the spectrometers at the Summit. Cirrus cloud properties are detected with the stratospheric aerosol lidar, which is a pure backscatter lidar operating at the wavelength of 532 nm. This system was operated in a semi-automatic mode, with a sequence of one profile every 4 or 10 min and an integration time of 1 min. Water vapour and temperature profiles were measured alternately with a Raman lidar system using a XeCl laser at 308 nm for water vapour and with a Nd:YAG laser at 355 nm for temperature. The latter measurements were carried out manually in order to switch between one laser and the other. Water vapour profiles were recorded with 1 million laser shots, an integration time of 1 h, and a vertical resolution of 30 m near ground (4 ) and 250 m at 15 Temperature profiles were derived from density profiles measured only in absolute clear sky conditions with an integration time of typically 1 h and a vertical resolution of 30 m near ground (4 ) and 2 km at 80 The lidar in operation at night and an example of measurements are shown in Fig. 3.
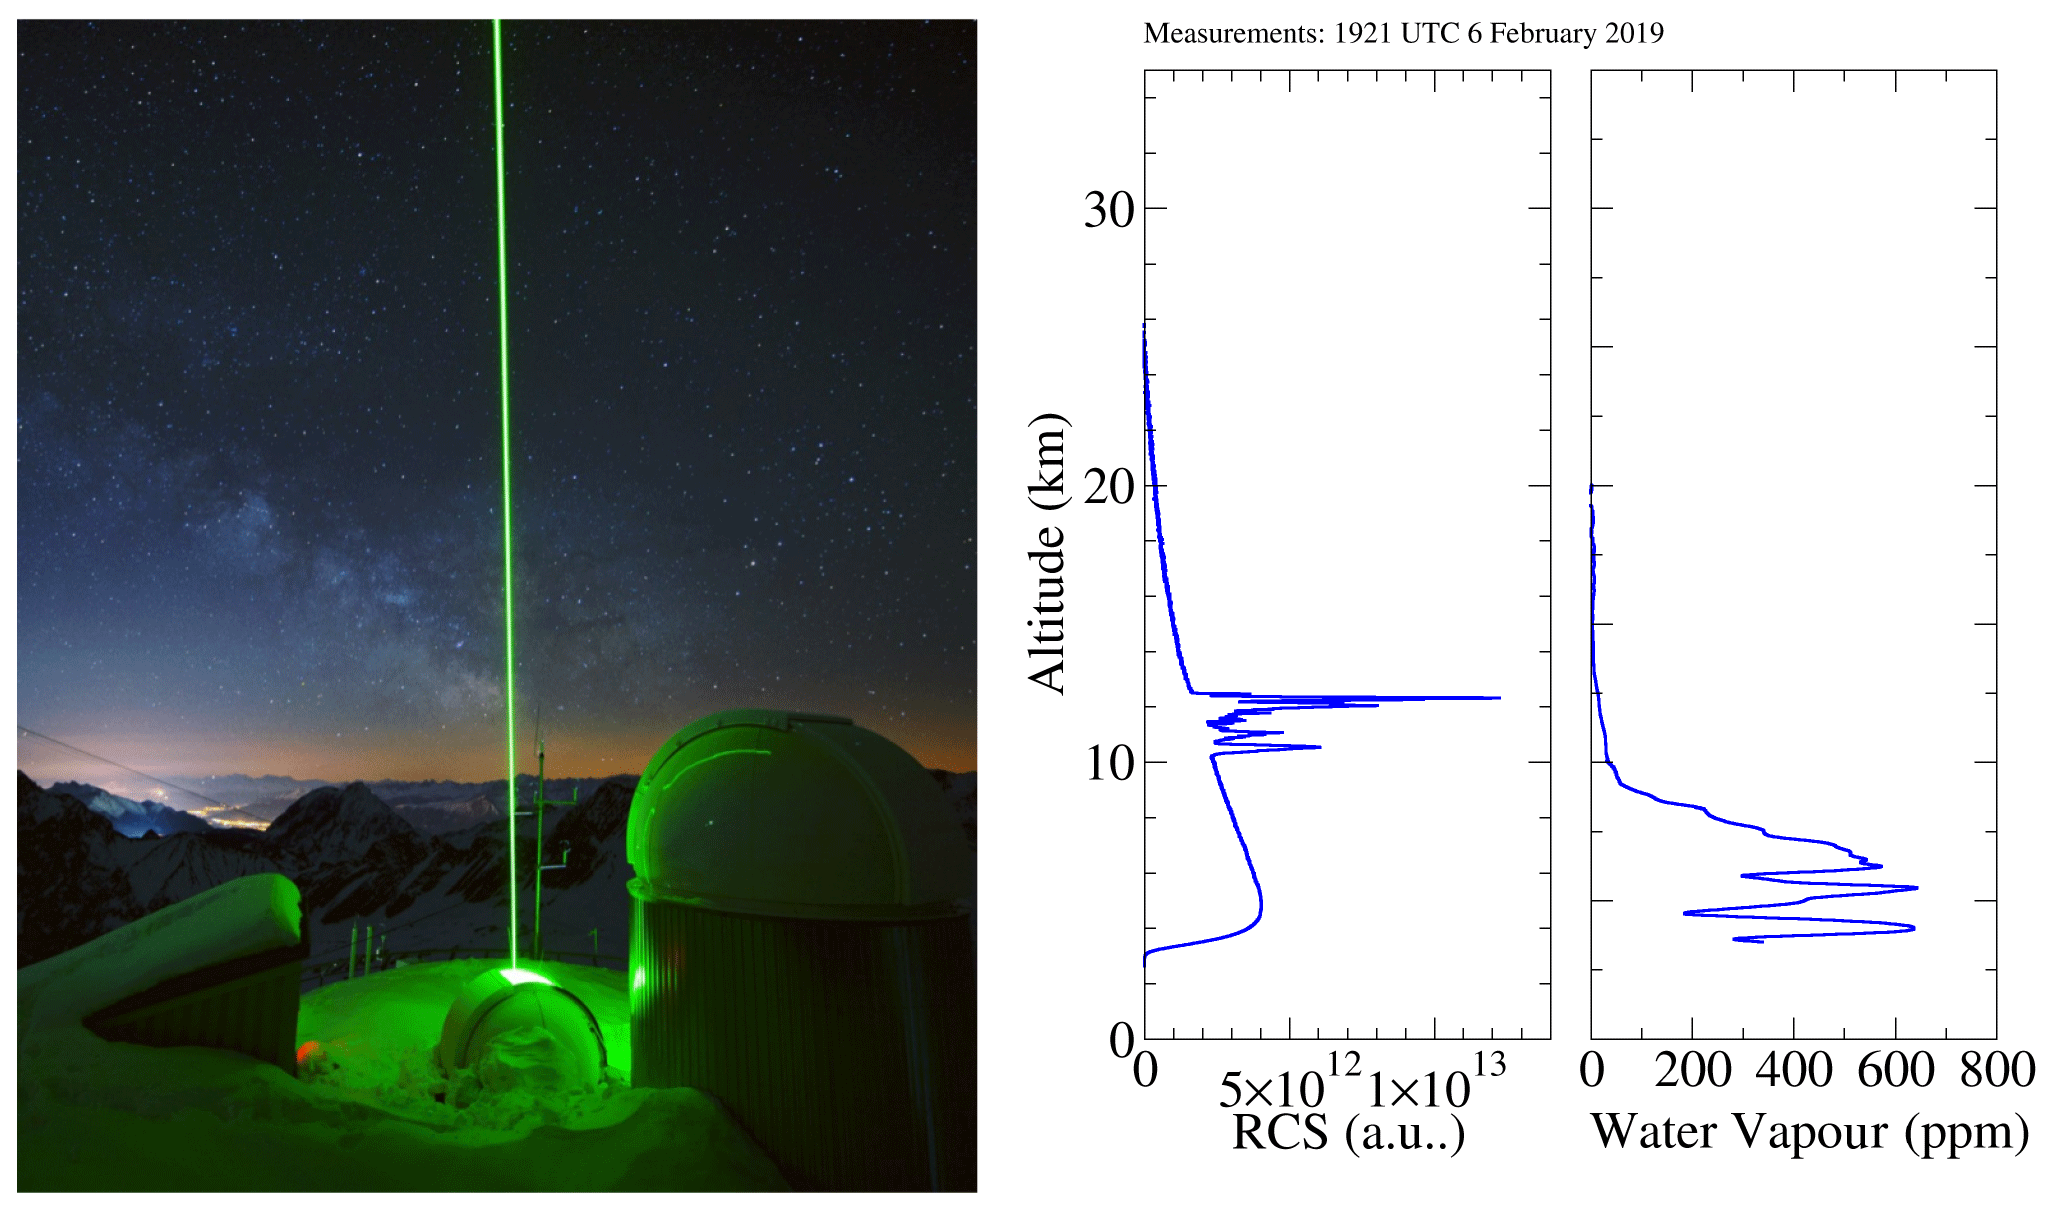
Figure 3Lidar measurements at the Schneefernerhaus station. The plot shows an example of the range-corrected signal (RCS) of the backscatter lidar, detecting a cloud layer, and the water vapour profile of the Raman lidar measured on 6 February 2019, 19:21 UTC.

Figure 4Radio soundings from Garmisch-Partenkirchen of temperature, relative humidity (RH), and colour index profiles for the launch on 6 February 2019, 17:33 UTC. A single cloud layer during the ascending leg (blue curve) and a double layer during descending (red curve) are shown in the colour index plot.
Specific balloon radio soundings (Klanner et al., 2021) for in situ water vapour profiles and cirrus cloud microphysics were performed in 2 d (5–6 February 2019) under clear sky and thin cirrus cloud conditions during nighttime (Fig. 4). The antenna for communication with the balloon was built up on the Summit station, and the preparation of the sonde payload and launch took place at KIT Campus Alpin, in Garmisch-Partenkirchen (47.476∘ N, 11.062∘ E; 730 ) about 8 km northeast of Mt. Zugspitze. The balloon sondes are equipped with a standard radiosonde (RS; Vaisala RS41-SGP), a Cryogenic Frostpoint Hygrometer (CFH) for measuring water vapour profiles with high accuracy, an ozone sonde, and the Compact Optical Backscatter Aerosol Detector (COBALD) (Brabec et al., 2012), developed at the Swiss Federal Institute of Technology in Zurich, that provides backscatter profiles at two wavelengths (940 and 455 nm). The colour index (CI) within the cloud layers, defined as the aerosol backscatter ratio () in the red channel (940 nm) divided by ABSR in the blue channel (455 nm), is also provided. The combined balloon payload is well tested and also regularly used by the Global Climate Observing System (GCOS) Reference Upper-Air Network (GRUAN) (see, for example, Dirksen et al., 2014). The CFH has an uncertainty of about 2 %–3 % in the troposphere and less than 10 % in the lower stratosphere. The CFH is especially suitable for measuring water vapour under the dry conditions at the tropopause and in the stratosphere up to altitudes of 28 km. The accuracy of the backscatter ratio after post-processing the COBALD raw data is better than 5 %, while the precision is smaller than 1 % in the upper troposphere/lower stratosphere (Vernier et al., 2015).
The Summit station is served with standard pressure, temperature, relative humidity (RH), and wind (PTHW) meteorological observations, provided by Deutscher Wetterdienst (DWD) at the website https://opendata.dwd.de/climate_environment/CDC/observations_germany/climate/, last access: 28 February 2019, which for completeness were also included in the available dataset for the period covered by the field campaign. Useful standard atmospheric soundings with operational radiosondes available near Zugspitze can be freely downloaded via the University of Wyoming website (http://weather.uwyo.edu/upperair/sounding.html, last access: 26 October 2020) for the station of Muenchen-Oberschleissheim (Station No. 10868, daily soundings at 00:00 and 12:00 UTC), 100 km north of the Summit, and the Innsbruck-Flughafen station (Station No. 11120, daily soundings at 03:00 UTC), 33 km southeast.
Finally, the properties of snow samples were characterised in terms of snow grain type, density (kg m−3), and specific surface area (SSA, m2 kg−1), using the DUal Frequency Integrating Sphere for Snow SSA measurement (DUFISSS) sensor, which retrieves the SSA by measuring the reflectance at 1310 nm (Gallet et al., 2009).
The aim of the Zugspitze field campaign was to collect FIR measurements of the DLR to be used to provide evidence of the FIR capability to retrieve vertical profiles of water vapour, temperature, and cirrus cloud properties, as well as to perform a side-by-side validation of the FIRMOS measurements in the spectral range in common with the E-AERI instrument permanently installed on the site.
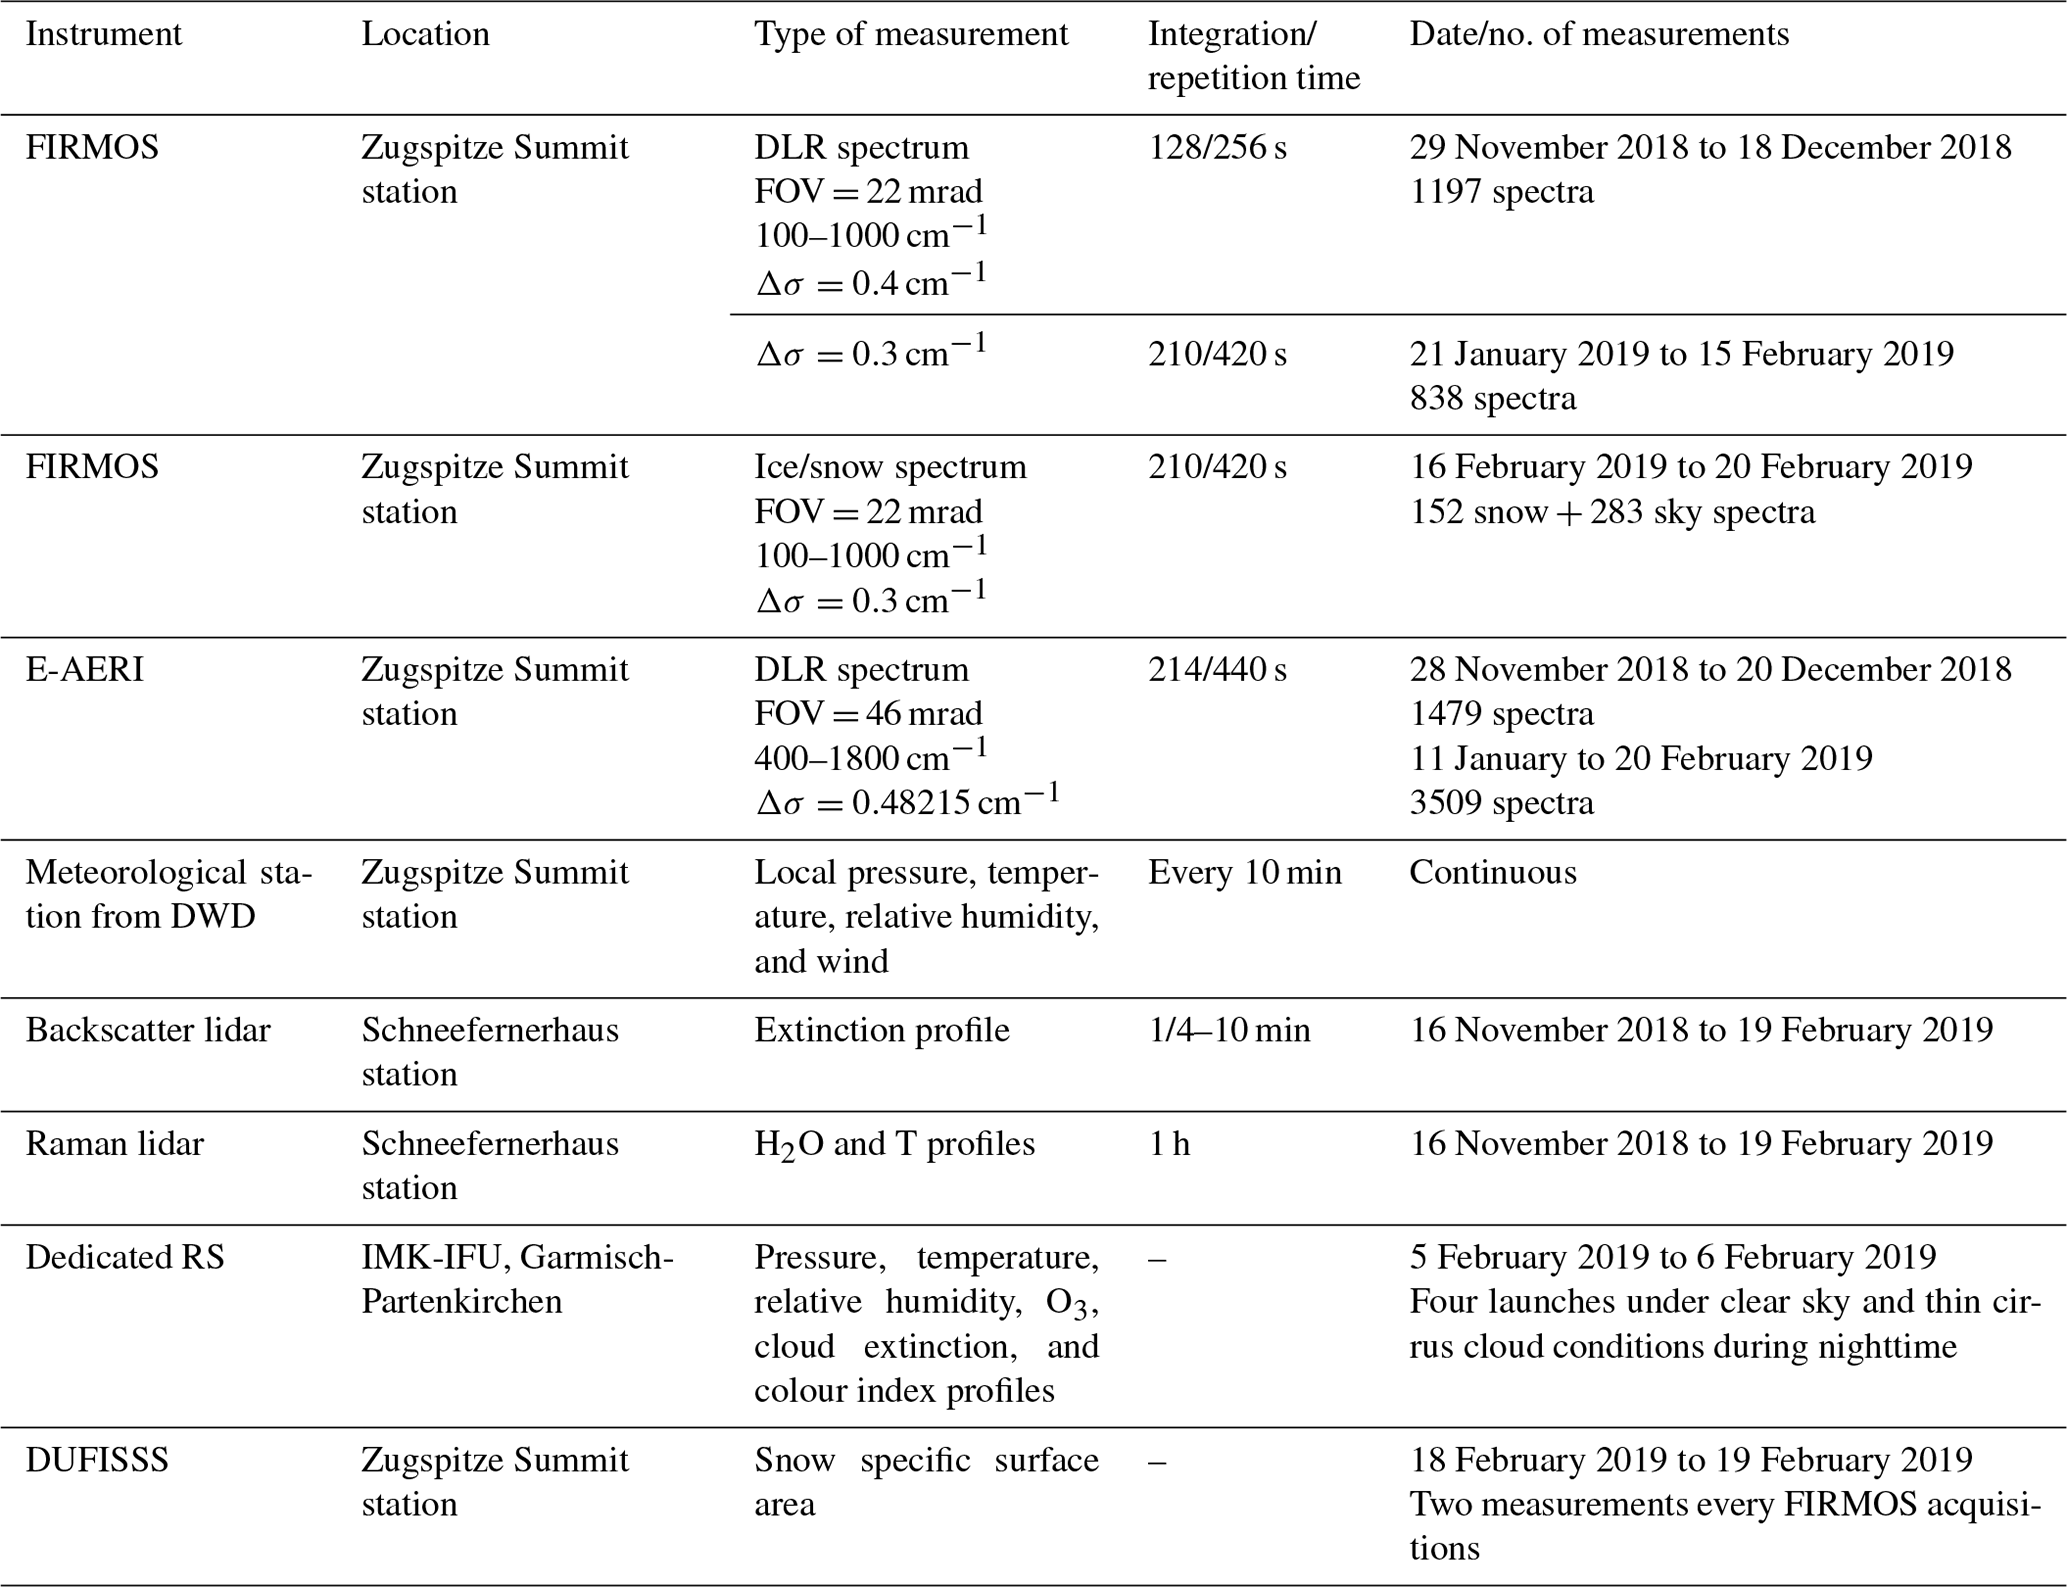
The campaign took place from 29 November to 18 December 2018 and from 21 January to 20 February 2019. Measurements were performed when the weather conditions allowed operations; this occurred for a total of 33 d. The main specifications of the measurements, which are provided in the dataset, are summarised in Table 1.
Table 1Instrumentation deployed at Zugspitze and measurements performed during the FIRMOS campaign and provided in the available dataset.
During the first part of the campaign in November–December 2018, FIRMOS was installed and made operational. The weather conditions during that period were not very good, and only a few days of clear sky to test acquisitions occurred (only 43 useful sky observations). This first part is considered an engineering campaign for the deployment and preparation of the full suite of instruments. For completeness, these measurements were included in the dataset, but their usefulness is quite limited.
The second part of the campaign in January–February 2019 was dedicated to the acquisition of the DLR spectra, both in clear sky and in cirrus cloud conditions, and of all the ancillary information provided by lidars, radio soundings, and meteorological stations. Lidar measurements can be used to retrieve cirrus properties such as cloud geometry (cloud bottom and top heights), extinction profile, and optical depths. These properties, together with vertical soundings of humidity and temperature, provide a full characterisation of the atmospheric state that can be used to check and to refine radiative models of water vapour spectroscopy and cirrus ice-particle properties in the FIR and to explore the effect on the retrieval performance of cirrus microphysics, as shown in Di Natale et al. (2020). An example of spectral measurements in the presence of cirrus cloud and the associated lidar profile is shown in Fig. 5.
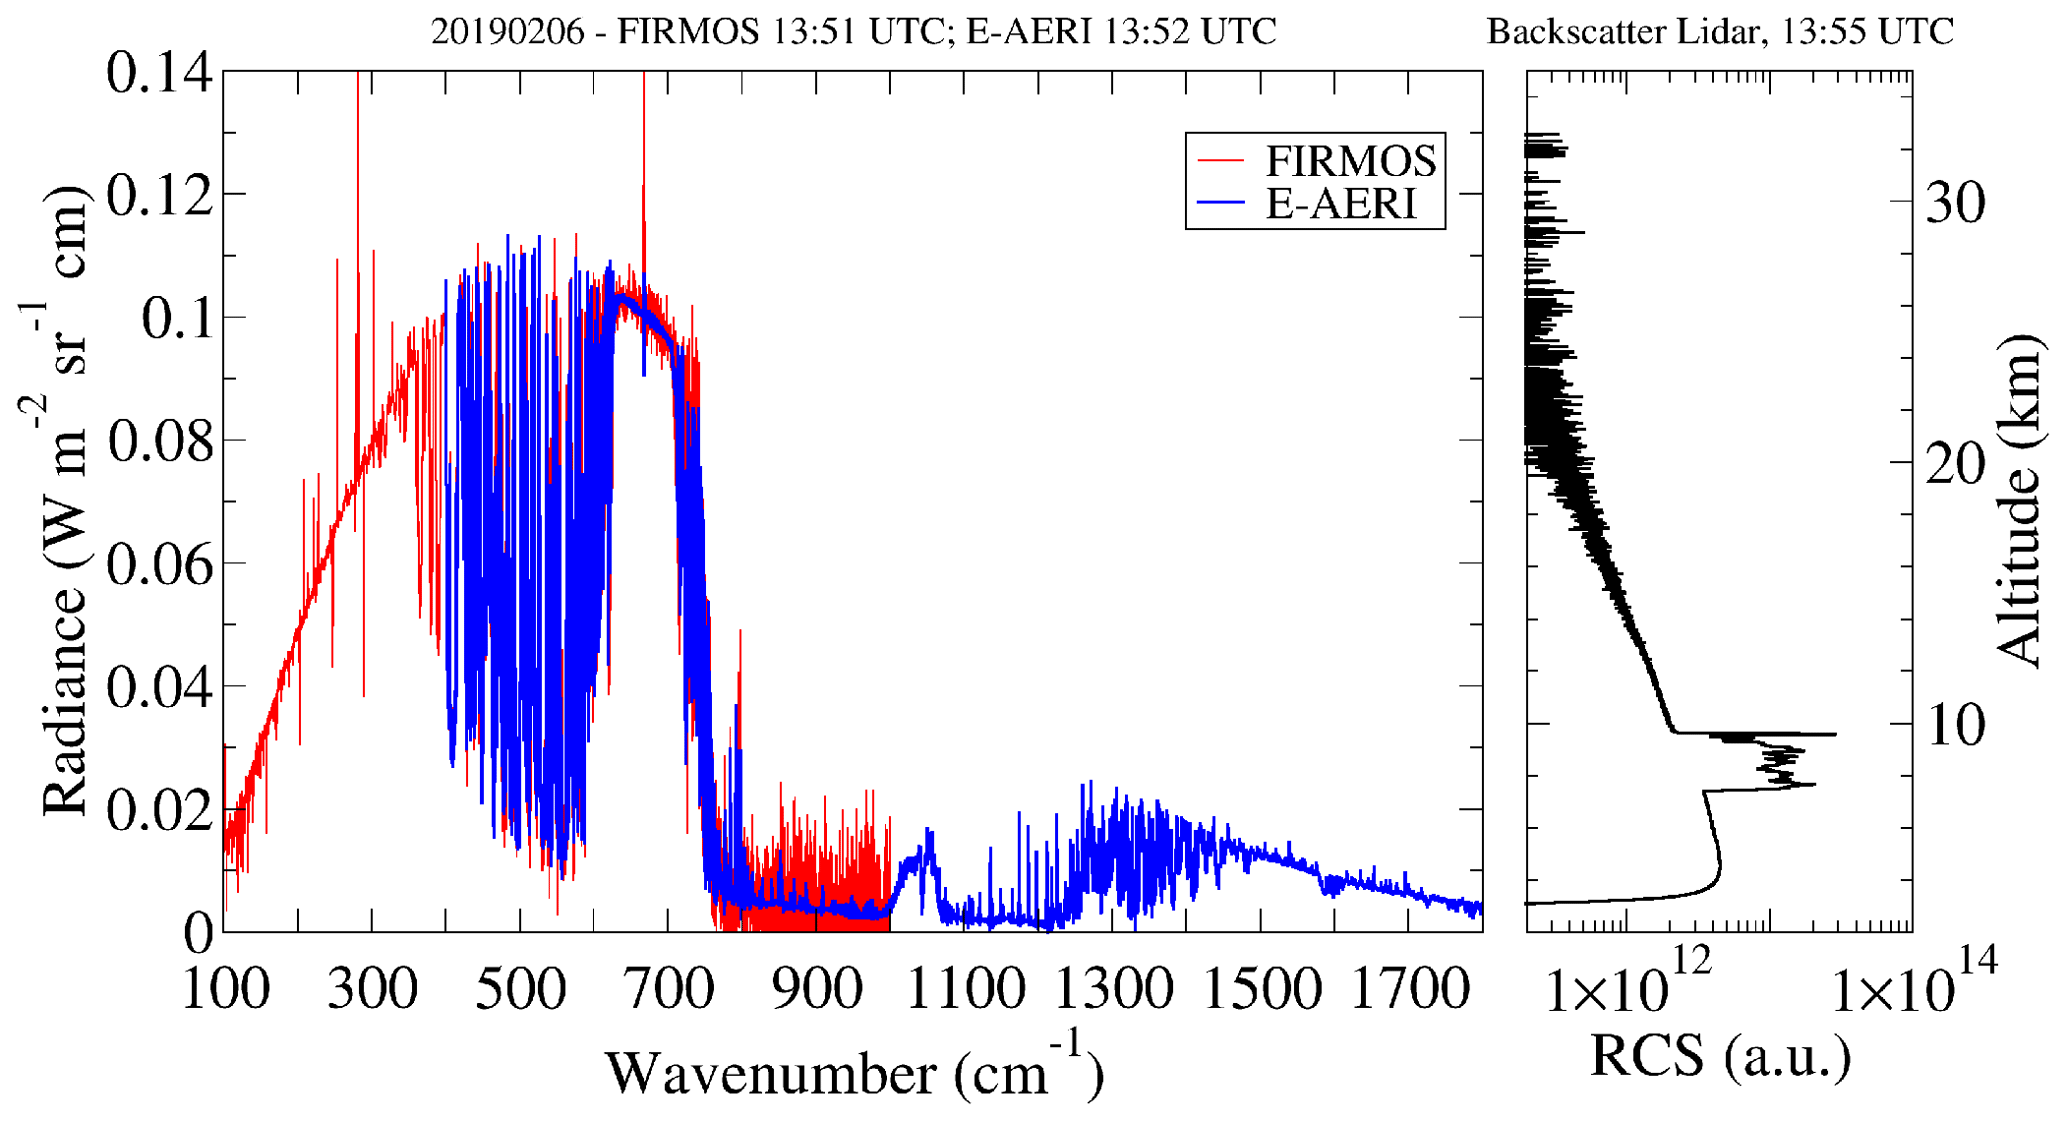
Figure 5FIRMOS and E-AERI spectra simultaneously acquired in presence of a cirrus cloud on 6 February 2019 and the corresponding lidar RCS profile.

Figure 6Snow measurements at Zugspitze Summit. FIRMOS in a slant angle during snow emissivity measurement (top left) and the average spectrum with uncertainties of 11 spectra acquired measuring the 18-2136 sample (top right). DUFISSS snow specific surface area (SSA) measurement (bottom left) and density and SSA properties of the snow samples (bottom right, red labels indicate day and time of FIRMOS acquisition). The upper-left grey box corresponds to an ice sample whose parameters were only roughly estimated.
Four days at the end of the campaign were finally devoted to measure snow and ice samples with the objective to characterise the FIR spectral emissivity, which is not well-characterised in the FIR range (Huang et al., 2016). We performed systematic snow measurements on 18 and 19 February 2019; FIRMOS was adapted to observe in a slant direction close to nadir (Fig. 6, top left). In this way the main contributions to the measured radiance were by the surface emission and by the sky reflection. Each sample was measured by FIRMOS for roughly 90 min and was successively characterised in terms of its surface properties. An example of FIRMOS measurement with error estimates is shown in Fig. 6 (top right). To attain diversity in the snow properties, eight samples of snow and one sample of ice were collected in the vicinity of the Zugspitze Summit and close to Zugspitzplatt stations and were characterised with DUFISSS (Fig. 6, bottom left). One measurement with artificial patterns of surface roughness was also conducted. Figure 6 (bottom right) shows the density and SSA values retrieved on the measured samples. For the ice sample, the figure shows only a rough estimate of the parameters (grey box) since a precise measurement could not be performed with the available equipment.
The FIRMOS dataset includes calibrated spectra and noise estimates, calculated starting from the FTS-acquired interferograms and following the procedure described in Bianchini and Palchetti (2008). Each spectrum is the average of four sky observations, and it is calibrated with four calibration measurements (two looking at a hot back body reference source and two looking at a cold one). The noise is characterised by a spectrally uncorrelated component (independent from one spectral channel to the other), called noise-equivalent spectral radiance (NESR) due to the detector error, and a spectrally correlated component, called calibration error (CalErr) mainly due to the temperature uncertainty of the calibration sources. The NESR is obtained from the error propagation through the calibration procedure of the 1σ detector random error, whereas the CalErr is calculated through the error propagation of the temperature accuracy error measured on each reference blackbody (Bianchini and Palchetti, 2008). These noise estimates show highly resolved structures which are due to the absorption lines of gases inside the interferometric path. They depend on the actual working conditions of the instrument that can vary from measurement to measurement. An example of the FIRMOS products is shown in Fig. 7. In the figure, the NESR (red line) is also compared with the standard deviation (STD) of four sky measurements (brown line) measured with constant sky conditions. Compared to the NESR, the STD estimate does not contain the noise coming from the calibration function measurements, but it contains the effect of possible radiance variations coming from the observed scene. Therefore the STD can be smaller than the NESR estimate when the observed scene is constant.
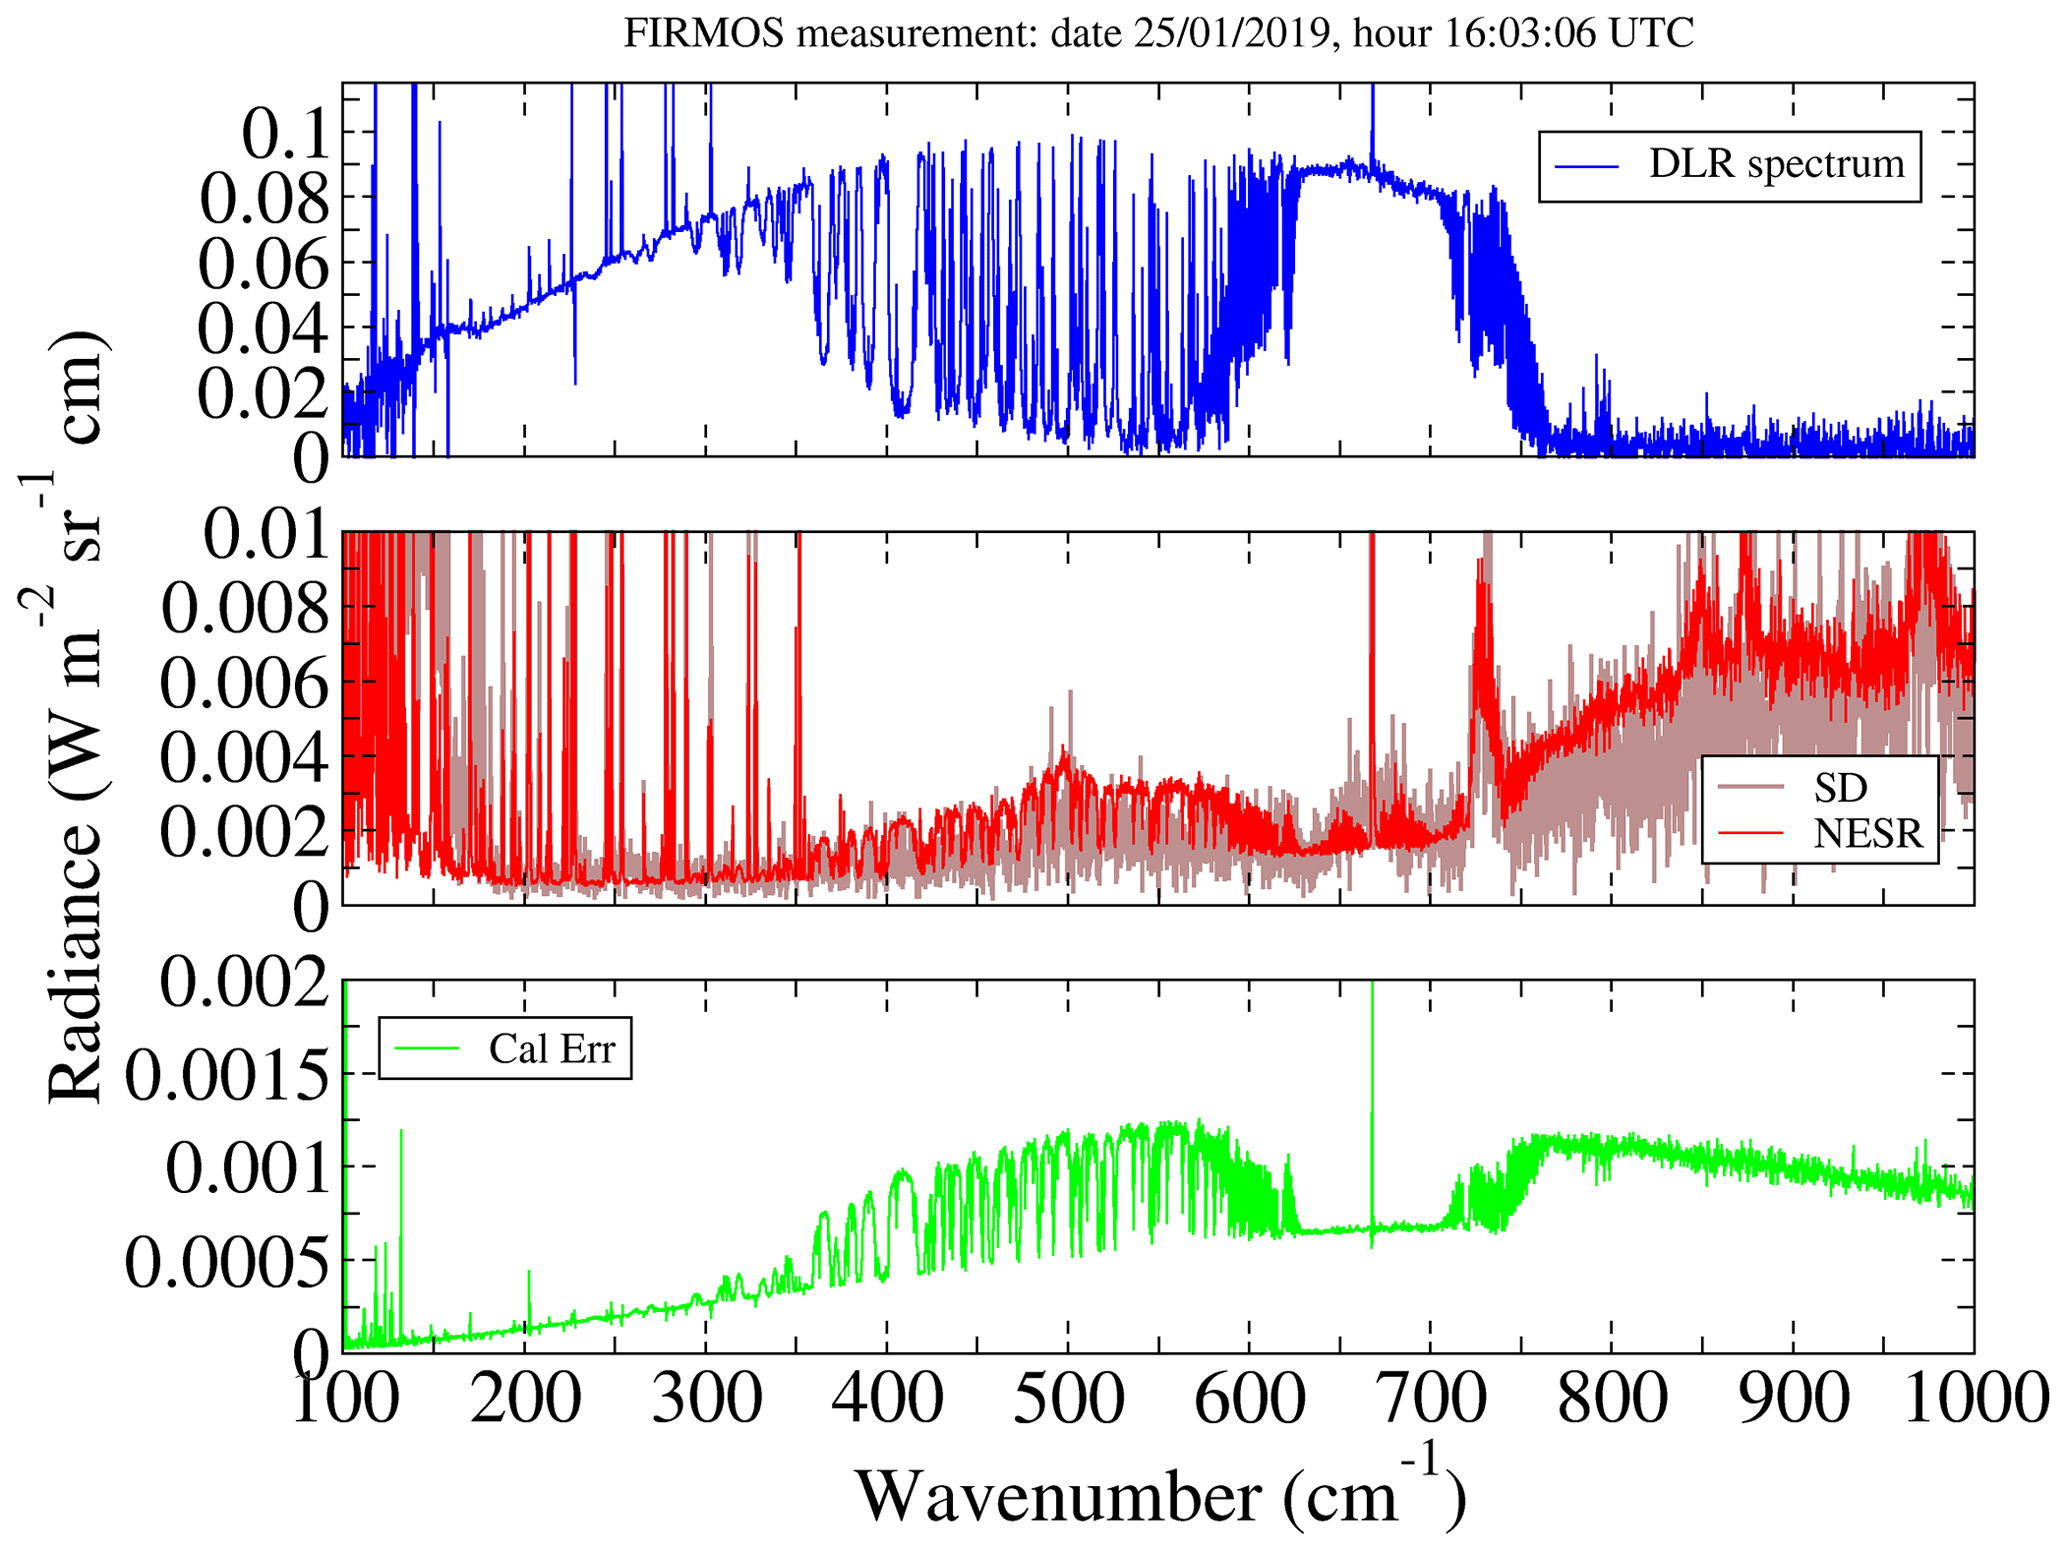
Figure 7Example of FIRMOS DLR spectrum and the associated noise estimates acquired on 25 January 2019, 16:03 UTC.
FIRMOS spectral measurements were validated against E-AERI in the common spectral region in order to qualify FIRMOS with a standard commercial spectrometer. The noise and the calibration accuracy for E-AERI were calculated, using the standard procedure provided by the manufacturer and outlined in Knuteson et al. (2004), from the variance of measurements observing constant sources and taking the average over 25 cm−1 wavenumber bins across the spectrum. To compare these features with the analogous features of FIRMOS, the same 25 cm−1 average was also operated. The comparison is shown in Fig. 8 in brightness temperature error at 280 K. The FIRMOS noise equivalent delta temperature (NEDT) was calculated from the STD using a similar approach as for the E-AERI noise estimate. More information about the spectral and radiance calibration of the two instruments is provided with the dataset.
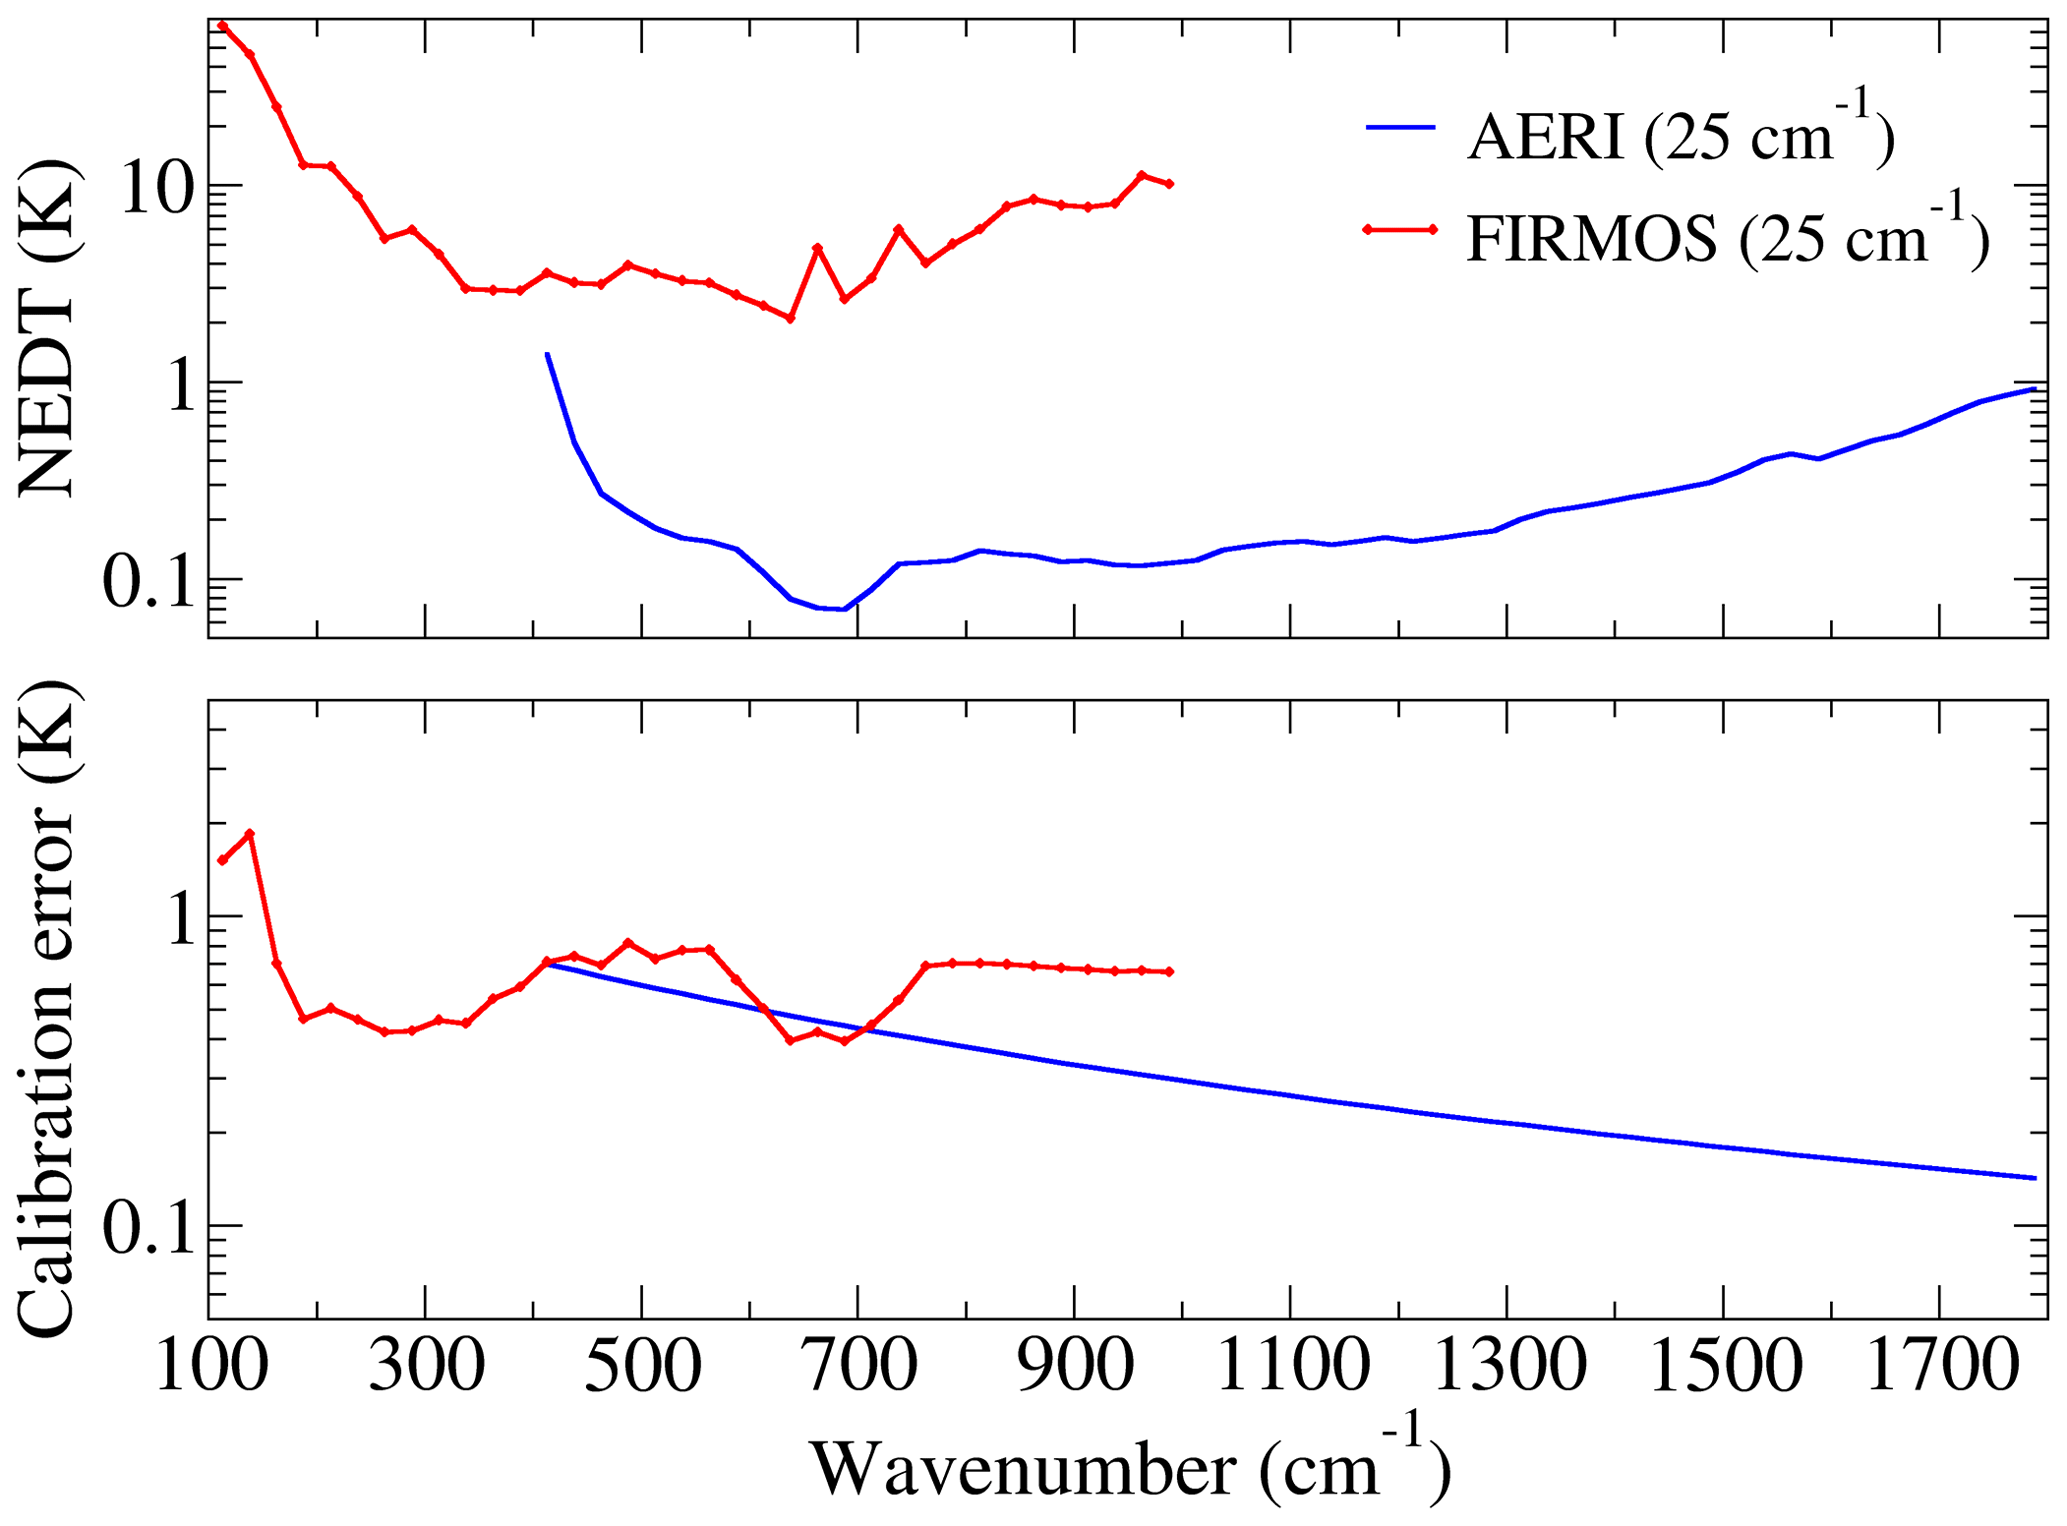
Figure 8FIRMOS (red lines) and E-AERI (blue lines) brightness temperature error estimates at 280 K, averaged over 25 cm−1 wavenumber bins across the spectrum.
A measurable error of the spectral frequency scale due to the uncertainty of the metrology laser was found for both FIRMOS and E-AERI by fitting the measurements with synthetic spectra. FIRMOS shows a frequency scale error of about +50 ppm between simulations and observations (), whereas E-AERI has the same error but with different sign (i.e. ). The frequency scale of spectra was therefore recalibrated with this correction before the comparison.
Furthermore, since the two instruments have different instrument line shapes and measurements are provided on different sampling grids, for this comparison spectra are equalised by applying the same apodisation function (Norton–Beer strong function) (Norton and Beer, 1976, 1977) with 0.968 cm−1 of FWHM resolution and resampled to a common spectral grid of 0.5 cm−1. Figure 9 shows the comparison between the mean spectra of 420 simultaneous measurements selected with the temporal distance between FIRMOS and E-AERI measurements being less than 10 min. A good agreement between the two instruments is found in the common spectral range from 400 to 1000 cm−1 with the difference (shown in the bottom panel) that is within the total uncertainty calculated using both the noise and the calibration accuracy (summed in quadrature) of both instruments. The difference is larger in the strong water vapour and CO2 bands because the slightly different location of the two instruments. However, only in a few lines in the range of 400–450 cm−1 does the difference between spectra exceed the uncertainty estimate; this is probably due to the different FOV of the two instruments, which on average might observe a slightly different scene.
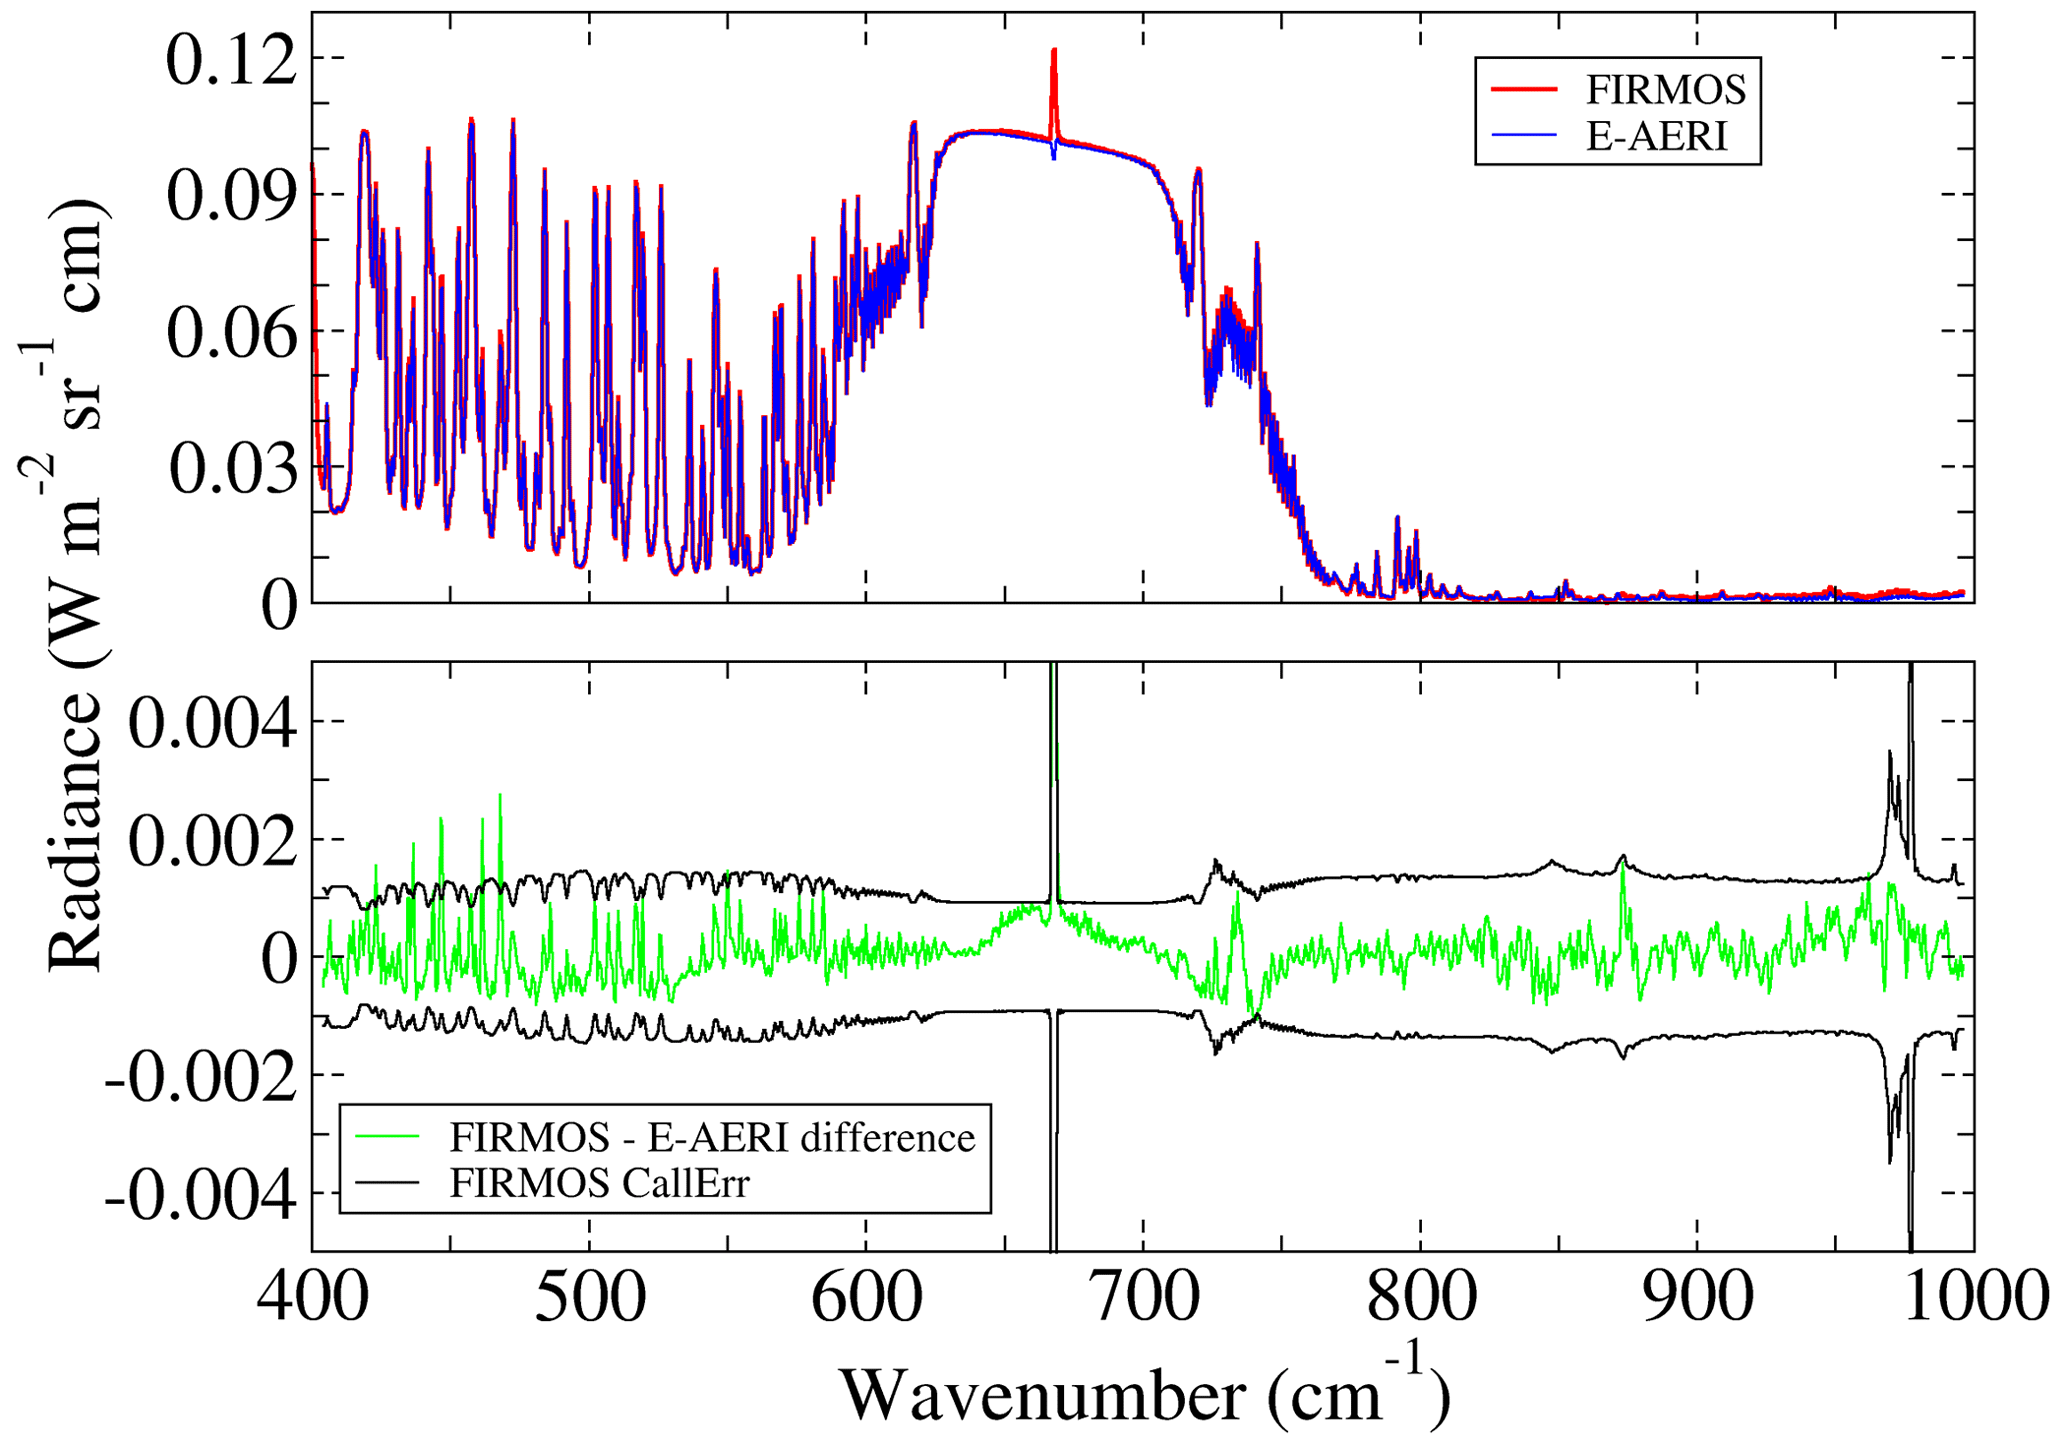
Figure 9Comparison between FIRMOS- and E-AERI-averaged spectra of 420 simultaneous acquisitions for the 2019 campaign. Spectra were apodised with the Norton–Beer strong function with FWHM = 0.968 cm−1 and resampled to a common spectral grid of 0.5 cm−1. The bottom graph shows the difference between the average spectra (in green) compared with the total measurement uncertainty (in black).
To make another assessment of FIRMOS measurements, an indirect approach was also used by comparing values of IWV retrieved from FIRMOS spectral measurements with the same parameter retrieved from E-AERI measurements, using in both cases only the common 400–600 cm−1 spectral region. The IWV was calculated using the KIT algorithm that minimises the FIRMOS (or E-AERI) vs. LBLRTM (Line-By-Line Radiative Transfer Model) spectral residuals. While details will be the subject of an upcoming publication, we briefly state here that we found only a small overall bias (FIRMOS−E-AERI) = 0.0002 mm which is negligible compared to the measured atmospheric IWV states, ranging from 0.2 to 2 mm. This proved that there are no indications of significant calibration errors between the two instruments in the FIR spectral domain of the water vapour rotational band.
The full dataset of the 2-month campaign, including infrared spectra (FIRMOS and E-AERI) and all the additional information (lidars, local PTHW, dedicated RS, snow SSA), is available via the ESA campaign dataset website https://earth.esa.int/eogateway/campaigns/firmos (last access: 20 May 2021) (Palchetti et al., 2020a, https://doi.org/10.5270/ESA-38034ee). ESA requires a free registration to inform users about issues concerning data quality and news on reprocessing. Information about the data formats are reported in README files within each data subdirectory.
In summary, the unique spectral measurements provided by the combination of FIRMOS and E-AERI covering the relevant spectral region of the thermal emission of the atmosphere from 100 to 1800 cm−1, together with the other supporting measurements (lidars, radio soundings, atmospheric state, and surface properties), provide a complete dataset that can be used to constrain radiative properties of water vapour, cirrus ice particles, and snow/ice emissivity over almost all the infrared emission, including the under-explored FIR spectral range.
LP designed the experiment and was chief scientist for the field campaign. RS was responsible for the local deployment. LP, MB, GB, FDA, AM, SV, RS, MR, HV, CR, DK, and BC ran the instruments during the campaign. LP, CB, GDN, RS, MR, HV, CR, BC, SDB, MG, and FGW carried out data analysis and measurement validation. DS and HO were responsible for the campaign organisation. LP prepared the manuscript with contributions from all co-authors.
The authors declare that they have no conflict of interest.
Publisher's note: Copernicus Publications remains neutral with regard to jurisdictional claims in published maps and institutional affiliations.
The authors acknowledge the reviews from Xianglei Huang and the anonymous referees who provided valuable comments to improve the paper.
The study has been supported by the European Space Agency (ESA) and the FIRMOS project (ESA–ESTEC contract no. 4000123691/18/NL/LF) for the development and the deployment of FIRMOS, as well as the Italian Space Agency (ASI) and the research projects SCIEF (Italian acronym of Development of the National Competencies for the FORUM experiment – ASI contract no. 2016-010-U.0) for the preliminary development of a few subsystems. The dedicated balloon activities were also partly supported by funding from the Helmholtz Association in the framework of MOSES (Modular Observation Solutions for Earth Systems).
This paper was edited by Qingxiang Li and reviewed by Xianglei Huang and two anonymous referees.
Baran, A. J., Hill, P., Furtado, K., Field, P., and Manners, J.: A Coupled Cloud Physics–Radiation Parameterization of the Bulk Optical Properties of Cirrus and Its Impact on the Met Office Unified Model Global Atmosphere 5.0 Configuration, J. Climate, 27, 7725–7752, https://doi.org/10.1175/JCLI-D-13-00700.1, 2014. a
Bianchini, G. and Palchetti, L.: Technical Note: REFIR-PAD level 1 data analysis and performance characterization, Atmos. Chem. Phys., 8, 3817–3826, https://doi.org/10.5194/acp-8-3817-2008, 2008. a, b
Bianchini, G., Castagnoli, F., Di Natale, G., and Palchetti, L.: A Fourier transform spectroradiometer for ground-based remote sensing of the atmospheric downwelling long-wave radiance, Atmos. Meas. Tech., 12, 619–635, https://doi.org/10.5194/amt-12-619-2019, 2019. a, b
Brabec, M., Wienhold, F. G., Luo, B. P., Vömel, H., Immler, F., Steiner, P., Hausammann, E., Weers, U., and Peter, T.: Particle backscatter and relative humidity measured across cirrus clouds and comparison with microphysical cirrus modelling, Atmos. Chem. Phys., 12, 9135–9148, https://doi.org/10.5194/acp-12-9135-2012, 2012. a
Carli, B., Barbis, A., Harries, J. E., and Palchetti, L.: Design of an efficient broadband far-infrared fourier-transform spectrometer, Appl. Optics, 38, 3945–3950, https://doi.org/10.1364/AO.38.003945, 1999. a
Chen, X., Huang, X., and Flanner, M. G.: Sensitivity of modeled far-IR radiation budgets in polar continents to treatments of snow surface and ice cloud radiative properties, Geophys. Res. Lett., 41, 6530–6537, https://doi.org/10.1002/2014GL061216, 2014. a
Cox, C., Harries, J., Taylor, J., Green, P., Baran, A., Pickering, J., Last, A., and Murray, J.: Measurement and simulation of mid-and far-infrared spectra in the presence of cirrus, Q. J. Roy. Meteor. Soc., 36, 718–739, https://doi.org/10.1002/qj.596, 2010. a
Cox, C. V., Murray, J. E., Taylor, J. P., Green, P. D., Pickering, J. C., Harries, J. E., and Last, A. E.: Clear-sky far-infrared measurements observed with TAFTS during the EAQUATE campaign, September 2004, Q. J. Roy. Meteor. Soc., 133, 273–283, https://doi.org/10.1002/qj.159, 2007. a
Di Natale, G., Bianchini, G., Del Guasta, M., Ridolfi, M., Maestri, T., Cossich, W., Magurno, D., and Palchetti, L.: Characterization of the Far Infrared Properties and Radiative Forcing of Antarctic Ice and Water Clouds Exploiting the Spectrometer-LiDAR Synergy, Remote Sens.-Basel, 12, 3574, https://doi.org/10.3390/rs12213574, 2020. a
Dirksen, R. J., Sommer, M., Immler, F. J., Hurst, D. F., Kivi, R., and Vömel, H.: Reference quality upper-air measurements: GRUAN data processing for the Vaisala RS92 radiosonde, Atmos. Meas. Tech., 7, 4463–4490, https://doi.org/10.5194/amt-7-4463-2014, 2014. a
Gallet, J.-C., Domine, F., Zender, C. S., and Picard, G.: Measurement of the specific surface area of snow using infrared reflectance in an integrating sphere at 1310 and 1550 nm, The Cryosphere, 3, 167–182, https://doi.org/10.5194/tc-3-167-2009, 2009. a
Harries, J., Carli, B., Rizzi, R., Serio, C., Mlynczak, M., Palchetti, L., Maestri, T., Brindley, H., and Masiello, G.: The Far-infrared Earth, Rev. Geophys., 46, RG4004, https://doi.org/10.1029/2007RG000233, 2008. a
Huang, X., Chen, X., Zhou, D. K., and Liu, X.: An Observationally Based Global Band-by-Band Surface Emissivity Dataset for Climate and Weather Simulations, J. Atmos. Sci., 73, 3541–3555, https://doi.org/10.1175/JAS-D-15-0355.1, 2016. a
Huang, X., Chen, X., Flanner, M., Yang, P., Feldman, D., and Kuo, C.: Improved Representation of Surface Spectral Emissivity in a Global Climate Model and Its Impact on Simulated Climate, J. Climate, 31, 3711–3727, https://doi.org/10.1175/JCLI-D-17-0125.1, 2018. a
Huang, Y., Ramaswamy, V., Huang, X., Fu, Q., and Bardeen, C.: A strict test in climate modeling with spectrally resolved radiances: GCM simulation versus AIRS observations, Geophys. Res. Lett., 34, L24707, https://doi.org/10.1029/2007GL031409, 2007. a
Klanner, L., Höveler, K., Khordakova, D., Perfahl, M., Rolf, C., Trickl, T., and Vogelmann, H.: A powerful lidar system capable of 1 h measurements of water vapour in the troposphere and the lower stratosphere as well as the temperature in the upper stratosphere and mesosphere, Atmos. Meas. Tech., 14, 531–555, https://doi.org/10.5194/amt-14-531-2021, 2021. a, b
Knuteson, R. O., Revercomb, H. E., Best, F. A., Ciganovich, N. C., Dedecker, R. G., Dirkx, T. P., Ellington, S. C., Feltz, W. F., Garcia, R. K., Howell, H. B., Smith, W. L., Short, J. F., and Tobin, D. C.: Atmospheric Emitted Radiance Interferometer. Part II: Instrument Performance, J. Atmos. Ocean. Tech., 21, 1777–1789, https://doi.org/10.1175/JTECH-1663.1, 2004. a, b
Mlawer, E. J., Turner, D. D., Paine, S. N., Palchetti, L., Bianchini, G., Payne, V. H., Cady-Pereira, K. E., Pernak, R. L., Alvarado, M. J., Gombos, D., Delamere, J. S., Mlynczak, M. G., and Mast, J. C.: Analysis of Water Vapor Absorption in the Far-Infrared and Submillimeter Regions Using Surface Radiometric Measurements From Extremely Dry Locations, J. Geophys. Res.-Atmos., 124, 8134–8160, https://doi.org/10.1029/2018JD029508, 2019. a
Mlynczak, M. G., Johnson, D. G., Latvakoski, H., Jucks, K., Watson, M., Kratz, D. P., Bingham, G., Traub, W. A., Wellard, S. J., Hyde, C. R., and Liu, X.: First light from the Far-Infrared Spectroscopy of the Troposphere (FIRST) instrument, Geophys. Res. Lett., 33, L07704, https://doi.org/10.1029/2005GL025114, 2006. a
Mlynczak, M. G., Cageao, R. P., Mast, J. C., Kratz, D. P., Latvakoski, H., and Johnson, D. G.: Observations of downwelling far-infrared emission at Table Mountain California made by the FIRST instrument, J. Quant. Spectrosc. Ra., 170, 90–105, https://doi.org/10.1016/j.jqsrt.2015.10.017, 2016. a
Norton, R. H. and Beer, R.: New apodizing functions for Fourier spectrometry, J. Opt. Soc. Am., 66, 259–264, https://doi.org/10.1364/JOSA.66.000259, 1976. a
Norton, R. H. and Beer, R.: Errata: New Apodizing Functions For Fourier Spectrometry, J. Opt. Soc. Am., 67, 419–419, https://doi.org/10.1364/JOSA.67.000419, 1977. a
Palchetti, L., Belotti, C., Bianchini, G., Castagnoli, F., Carli, B., Cortesi, U., Pellegrini, M., Camy-Peyret, C., Jeseck, P., and Té, Y.: Technical note: First spectral measurement of the Earth's upwelling emission using an uncooled wideband Fourier transform spectrometer, Atmos. Chem. Phys., 6, 5025–5030, https://doi.org/10.5194/acp-6-5025-2006, 2006. a
Palchetti, L., Bianchini, G., Di Natale, G., and Del Guasta, M.: Far-Infrared Radiative Properties of Water Vapor and Clouds in Antarctica, B. Am. Meteorol. Soc., 96, 1505–1518, https://doi.org/10.1175/BAMS-D-13-00286.1, 2015. a, b
Palchetti, L., Barucci, M., Belotti, C., Bianchini, G., Cluzet, B., D'Amato, F., Bianco, S. D., Natale, G. D., Gai, M., Khordakova, D., Montori, A., Oetjen, H., Rettinger, M., Rolf, C., Schuettemeyer, D., Sussmann, R., Viciani, S., Vogelmann, H., and Wienhold, F. G.: FIRMOS 2018–2019 Zugspitze campaign dataset, European Space Agency [data set], https://doi.org/10.5270/ESA-38034ee, 2020a. a, b
Palchetti, L., Brindley, H., Bantges, R., Buehler, S. A., Camy-Peyret, C., Carli, B., Cortesi, U., Del Bianco, S., Di Natale, G., Dinelli, B. M., Feldman, D., Huang, X. L., C.-Labonnote, L., Libois, Q., Maestri, T., Mlynczak, M. G., Murray, J. E., Oetjen, H., Ridolfi, M., Riese, M., Russell, J., Saunders, R., and Serio, C.: FORUM: unique far-infrared satellite observations to better understand how Earth radiates energy to space, B. Am. Meteorol. Soc., 101, E2030–E2046, https://doi.org/10.1175/BAMS-D-19-0322.1, 2020b. a
Sussmann, R., Reichert, A., and Rettinger, M.: The Zugspitze radiative closure experiment for quantifying water vapor absorption over the terrestrial and solar infrared – Part 1: Setup, uncertainty analysis, and assessment of far-infrared water vapor continuum, Atmos. Chem. Phys., 16, 11649–11669, https://doi.org/10.5194/acp-16-11649-2016, 2016. a, b
Turner, D. D., Mlawer, E. J., Bianchini, G., Cadeddu, M. P., Crewell, S., Delamere, J. S., Knuteson, R. O., Maschwitz, G., Mlynczak, M., Paine, S., Palchetti, L., and Tobin, D. C.: Ground-based high spectral resolution observations of the entire terrestrial spectrum under extremely dry conditions, Geophys. Res. Lett., 39, L10801, https://doi.org/10.1029/2012GL051542, 2012. a
Vernier, J.-P., Fairlie, T. D., Natarajan, M., Wienhold, F. G., Bian, J., Martinsson, B. G., Crumeyrolle, S., Thomason, L. W., and Bedka, K. M.: Increase in upper tropospheric and lower stratospheric aerosol levels and its potential connection with Asian pollution, J. Geophys. Res.-Atmos., 120, 1608–1619, https://doi.org/10.1002/2014JD022372, 2015. a
Vogelmann, H. and Trickl, T.: Wide Range Sounding of Free Tropospheric Water Vapor with a Differential Absorption Lidar (DIAL) at a High Altitude Station, Appl. Optics, 47, 2116–2132, https://doi.org/10.1364/AO.47.002116, 2008. a