the Creative Commons Attribution 4.0 License.
the Creative Commons Attribution 4.0 License.
 | 26 Aug 2021
A synthesis dataset of permafrost thermal state for the Qinghai–Tibet (Xizang) Plateau, China
Guojie Hu
Tonghua Wu
Erji Du
Guangyue Liu
Ren Li
Qiangqiang Pang
Yongping Qiao
Xiaodong Wu
Zhe Sun
Zanpin Xing
Yu Sheng
Yonghua Zhao
Jianzong Shi
Changwei Xie
Lingxiao Wang
Chong Wang
Guodong Cheng
Permafrost has great influences on the climatic, hydrological, and ecological systems on the Qinghai–Tibet Plateau (QTP). The changing permafrost and its impact have been attracting great attention worldwide like never before. More observational and modeling approaches are needed to promote an understanding of permafrost thermal state and climatic conditions on the QTP. However, limited data on the permafrost thermal state and climate background have been sporadically reported in different pieces of literature due to the difficulties of accessing and working in this region where the weather is severe, environmental conditions are harsh, and the topographic and morphological features are complex. From the 1990s, we began to establish a permafrost monitoring network on the QTP. Meteorological variables were measured by automatic meteorological systems. The soil temperature and moisture data were collected from an integrated observation system in the active layer. Deep ground temperature (GT) was observed from boreholes. In this study, a comprehensive dataset consisting of long-term meteorological, GT, soil moisture, and soil temperature data was compiled after quality control from an integrated, distributed, and multiscale observation network in the permafrost regions of QTP. The dataset is helpful for scientists with multiple study fields (i.e., climate, cryospheric, ecology and hydrology, meteorology science), which will significantly promote the verification, development, and improvement of hydrological models, land surface process models, and climate models on the QTP. The datasets are available from the National Tibetan Plateau/Third Pole Environment Data Center (https://data.tpdc.ac.cn/en/disallow/789e838e-16ac-4539-bb7e-906217305a1d/, last access: 24 August 2021, https://doi.org/10.11888/Geocry.tpdc.271107, Lin et al., 2021).
Please read the corrigendum first before continuing.
-
Notice on corrigendum
The requested paper has a corresponding corrigendum published. Please read the corrigendum first before downloading the article.
-
Article
(6003 KB)
-
The requested paper has a corresponding corrigendum published. Please read the corrigendum first before downloading the article.
- Article
(6003 KB) - Full-text XML
- Corrigendum
- BibTeX
- EndNote


Permafrost is widely distributed on the QTP, which is called the “Third Pole of the Earth” (Qiu, 2008). It is about 1.06 ×10⁶ km2 in area and accounts for approximately a quarter of the QTP within Chinese territory (Zou et al., 2017). Its unique and complicated hydrothermal process has great regulating effects on ground surface moisture, energy and mass exchange, ecosystem stability, and carbon cycles (Cheng et al., 2019; Schuur et al., 2011). The surface energy and water cycles over the QTP have a great influence on the Asian monsoon, East Asian atmospheric circulation, and global climate change (Ma et al., 2017; Yao et al., 2017). The characteristics of the diabatic heating field of the QTP are also used as an important factor for short-term climate prediction in China (Liu and Hou, 1998; Wu et al., 2009; Ye and Gao, 1979).
The permafrost in the QTP has experienced significant degradation in response to climate warming, which mainly manifested as the permafrost area shrinking and ground temperature (GT) rising, an increased active layer, and decreased permafrost thickness (Hu et al., 2019b; Sharkhuu et al., 2007; Wang et al., 2000; Cheng et al., 2019). Permafrost degradation has caused changes in surface vegetation characteristics. It was reported that the area of alpine meadow on the QTP decreased by 16.2 ×10⁴ km2 (accounting for 32.4 % of the QTP; Zhao and Sheng, 2015) in recent decades, which caused a change in hydrological processes and the ecological environment and further led to desertification (Cheng and Jin, 2013; Cheng et al., 2019; Wu et al., 2003; Zhao et al., 2019). In addition, permafrost degradation could result in the decomposition of organic matter and greenhouse gas release, which will finally affect the surface energy balance and the climate system (Wang et al., 2006a, 2012; Ping et al., 2015; Schuur et al., 2015, 2011; Hu et al., 2019a). Permafrost degradation has also altered geomorphological features and affected the stability of engineering structures in this region (Zhao et al., 2017).
However, the collection of long-term and high-resolution data over the permafrost regions of QTP is challenging due to the complex terrain, severe weather, and inconvenient access (Ma et al., 2008; Li et al., 2012). Previous studies on the permafrost focused on the local and site scale as well as along the Qinghai–Xizang highway (QXP) and railway (Cuo et al., 2015; Su et al., 2013). Some new observation sites in permafrost regions in the vast western territory of the QTP were reported in recent years (Zhao et al., 2017, 2018, 2020). Nevertheless, the climate background used in almost all the permafrost studies was based on the only four national meteorological stations located within the vast territory of permafrost regions. It is urgent to establish a synthesis observational database of permafrost thermal state and its climatic background to satisfy the requirements of calibration and validation for remote sensing interpretation and hydrothermal processes simulation, as well as for key parameter acquisition in permafrost regions (Bao et al., 2016; Li and Koike, 2003; Wang et al., 2017; Zhang et al., 2008; Hu et al., 2020). The complexity of the dynamic process of water and heat in freeze–thaw cycles is also considered one of the crucial reasons for the great errors in permafrost change simulation (Chen et al., 2014; Hu et al., 2016; Yang et al., 2018). Nevertheless, it is of great significance to provide a set of data in dynamic thermal characteristics of the permafrost on the QTP (Wang et al., 2006b; Zhao et al., 2004).
The Cryosphere Research Station, Chinese Academy of Sciences (CRS-CAS), has established a comprehensive and wide permafrost monitoring network on the QTP (Zhao et al., 2019, 2020). This network mainly focuses on monitoring permafrost and its environmental factors in high-elevation and cold-climate regions of the QTP. Since the station was established in 1987, we have conducted long-term continuous monitoring and large-scale field investigations of permafrost. Thus, it synthetically studies the mechanisms of change in hydrothermal conditions on the permafrost as well as their simulations and ecological effects. This paper firstly integrated air temperature, GT, soil moisture, and permafrost temperature dataset over the permafrost regions across the QTP from the CRS-CAS monitoring networks. The monitoring network is summarized in Sect. 2. In Sect. 3, the datasets are described in detail. In Sect. 4, the data availability and access are provided, and in Sect. 5 the conclusions and future work are summarized.
2.1 Permafrost monitoring networks
The vegetation in the permafrost region of the QTP is mainly alpine meadow, swamp meadow, alpine steppe, and alpine desert (Wang et al., 2016). The soils in the western permafrost region are Gelisols, Inceptisols, and Aridisols, and the east mainly consists of Gelisols, Mollisols, and Inceptisols (Li et al., 2015). The permafrost monitoring network includes 6 automatic meteorological stations (AMSs), 12 active layer sites, and 84 boreholes (Fig. 1, Table 1), which were primarily selected based on the landforms and underlying surface conditions (e.g., the vegetation and soil characteristics). The elevation of all the sites is higher than 4000 m a.s.l. (31.82–37.75∘ N, 77.58–99.50∘ E).
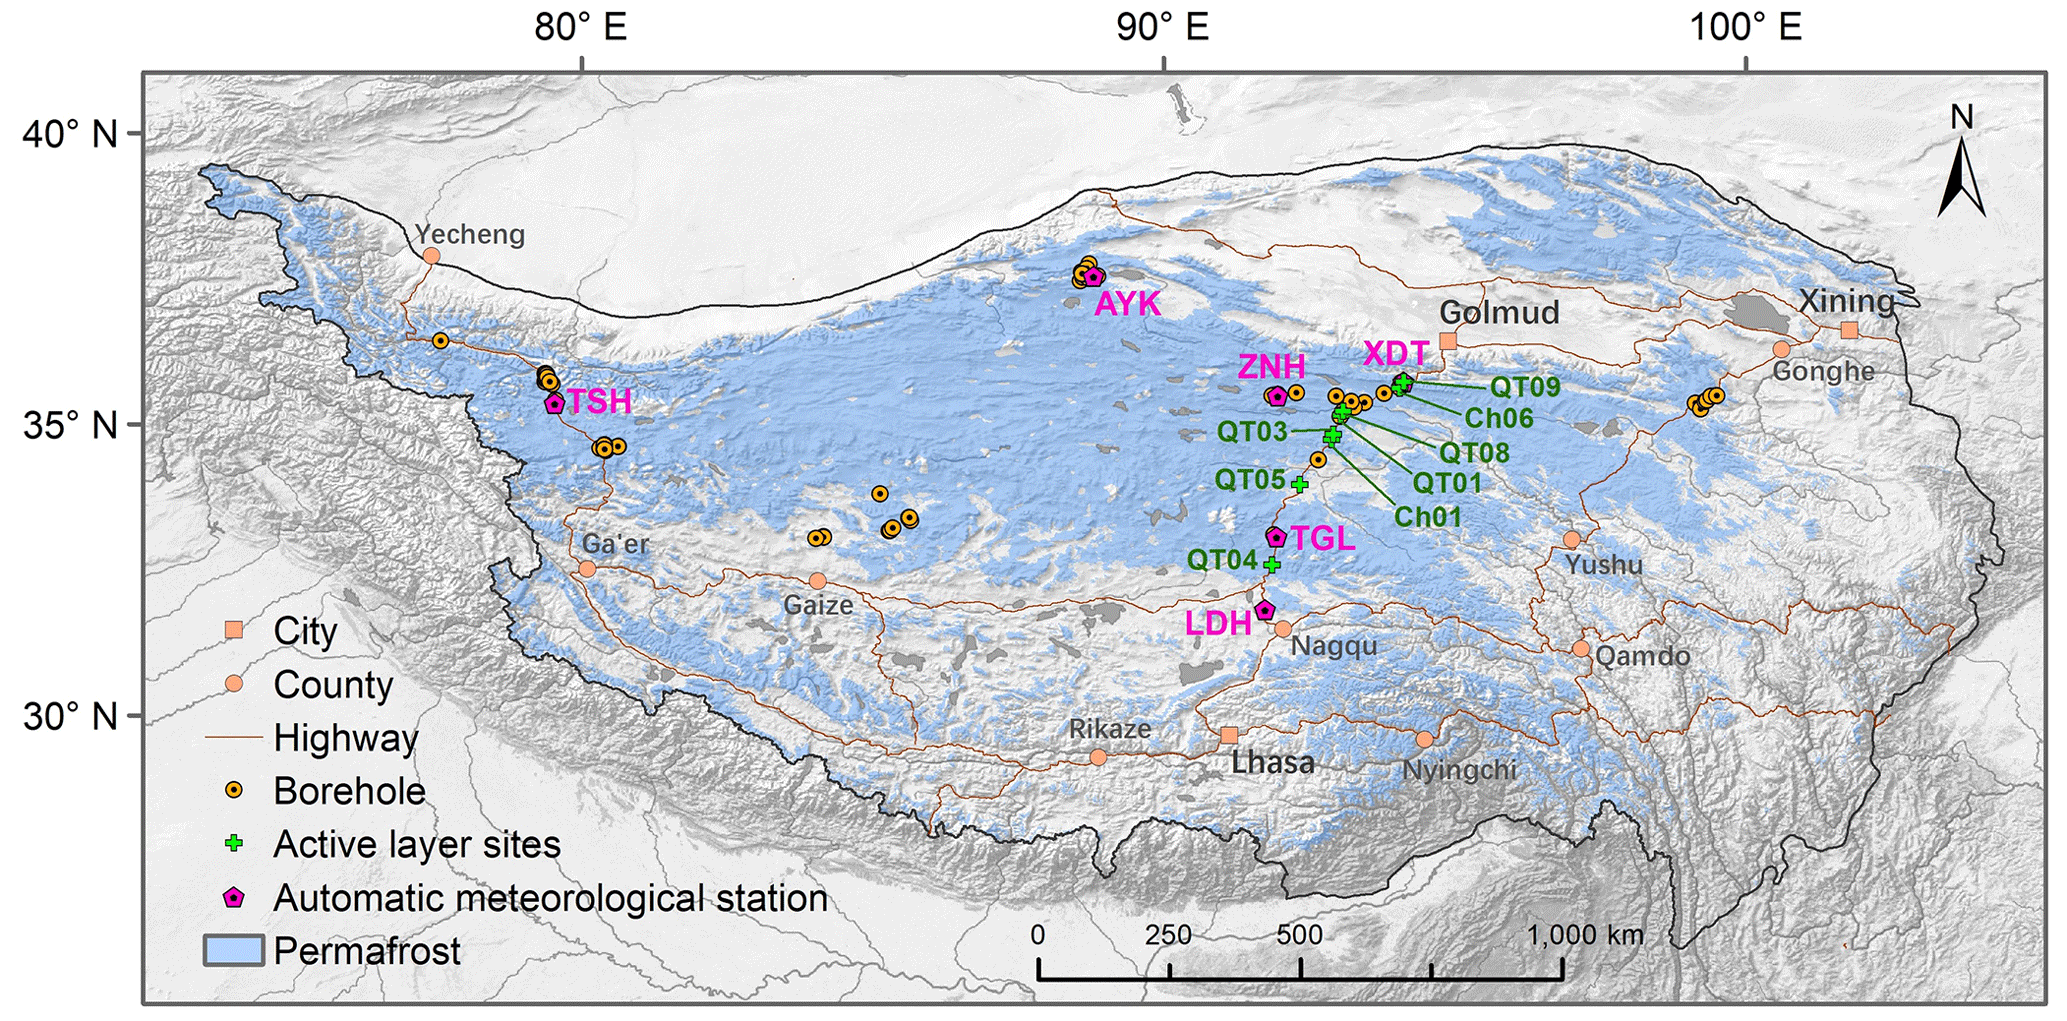
Figure 1The permafrost monitoring networks on the QTP. AL: active layer; AWS: automatic meteorological station.
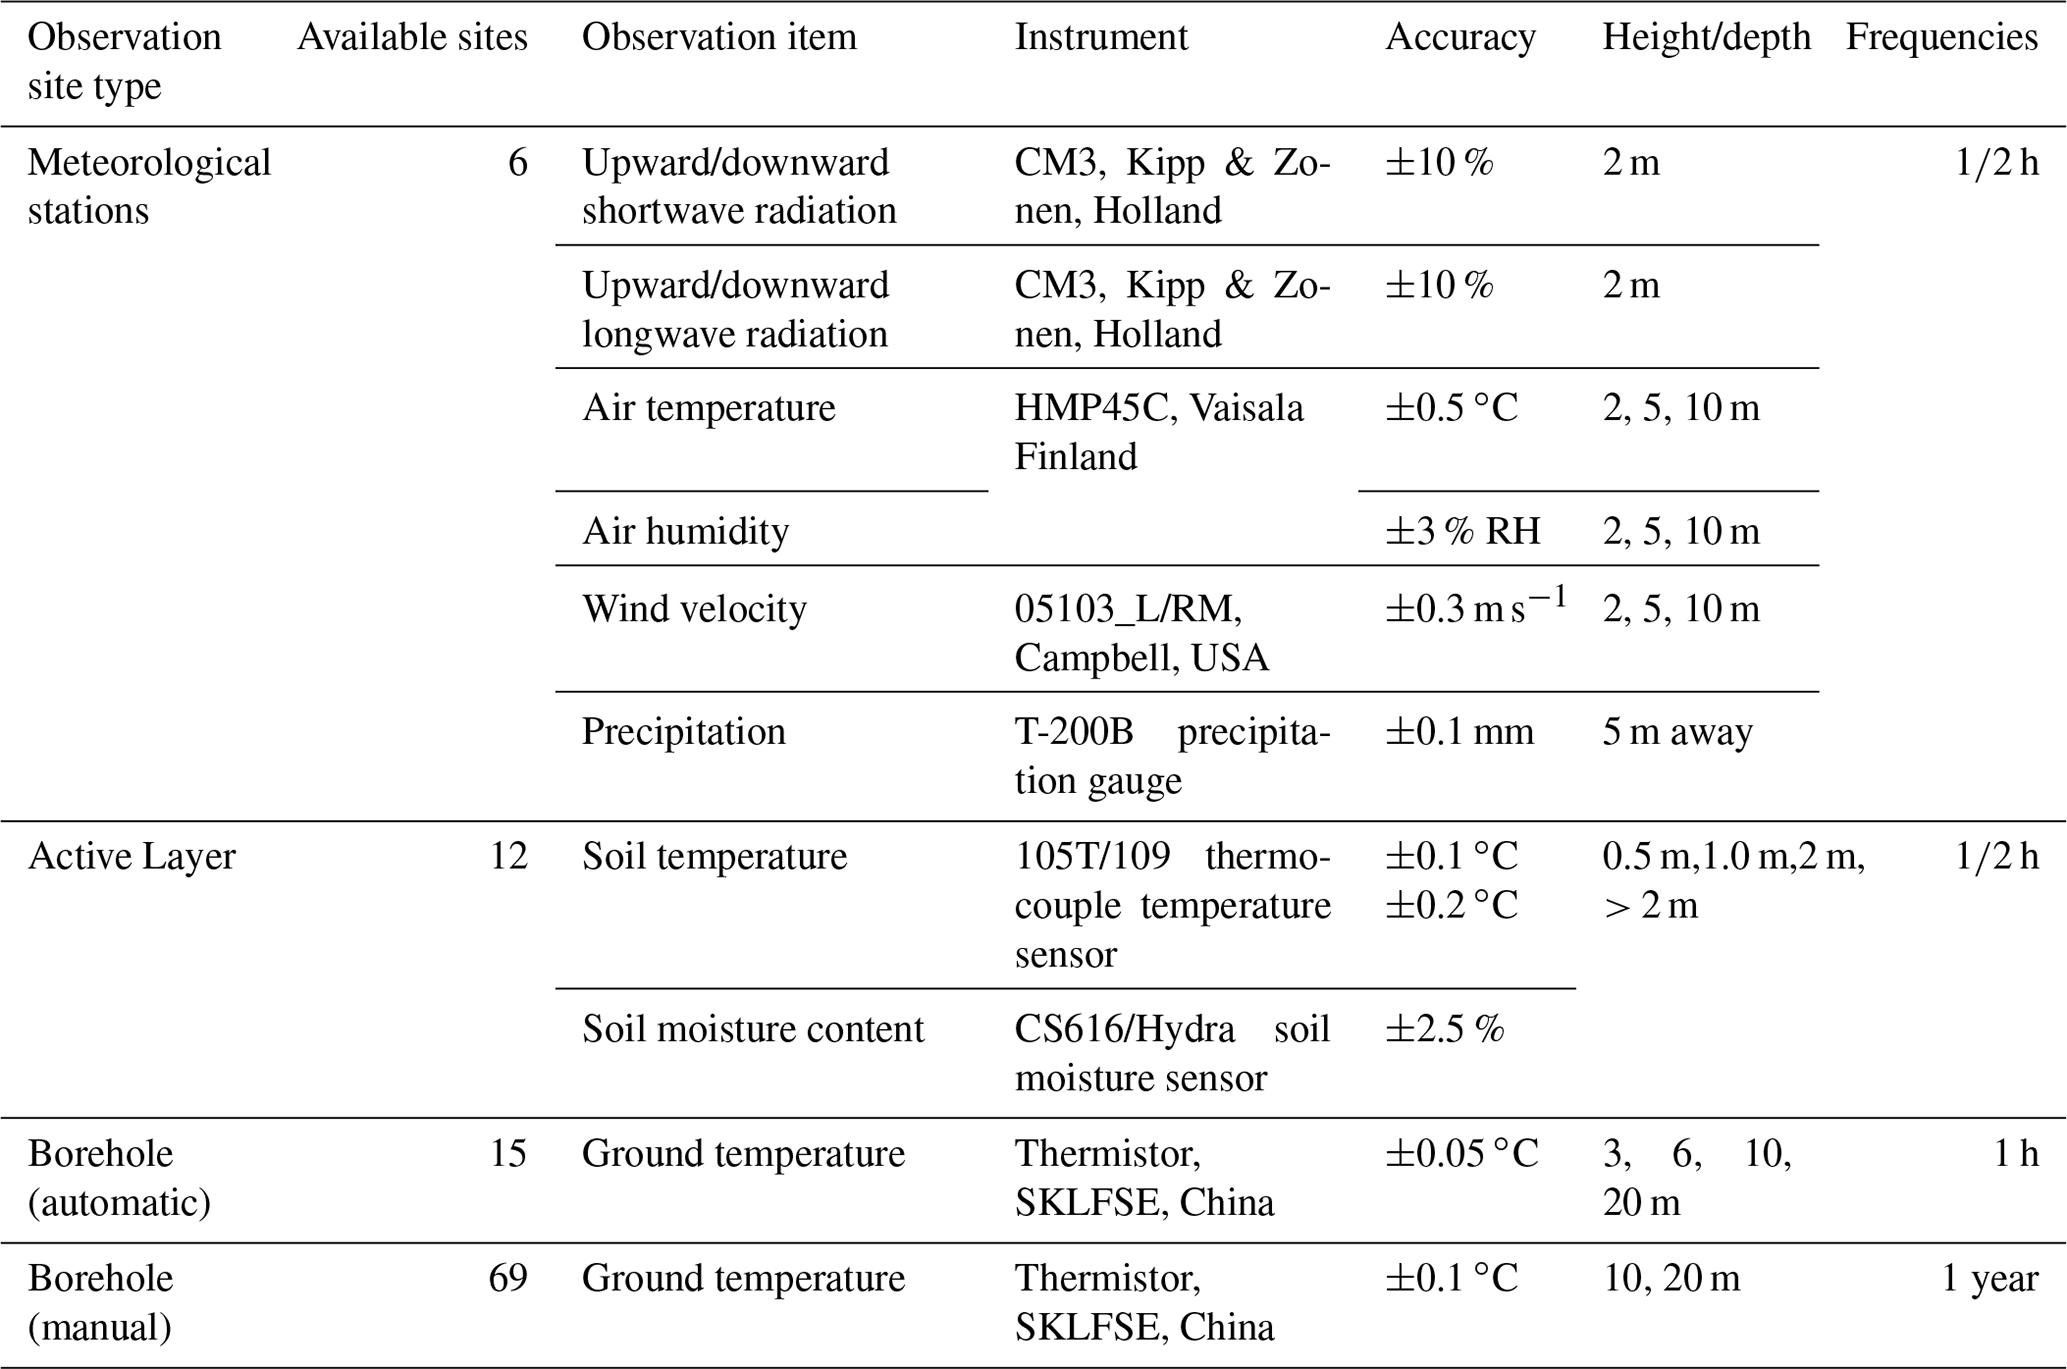
Table 1The observation instruments and items for meteorological data, ground temperature, and soil water content.
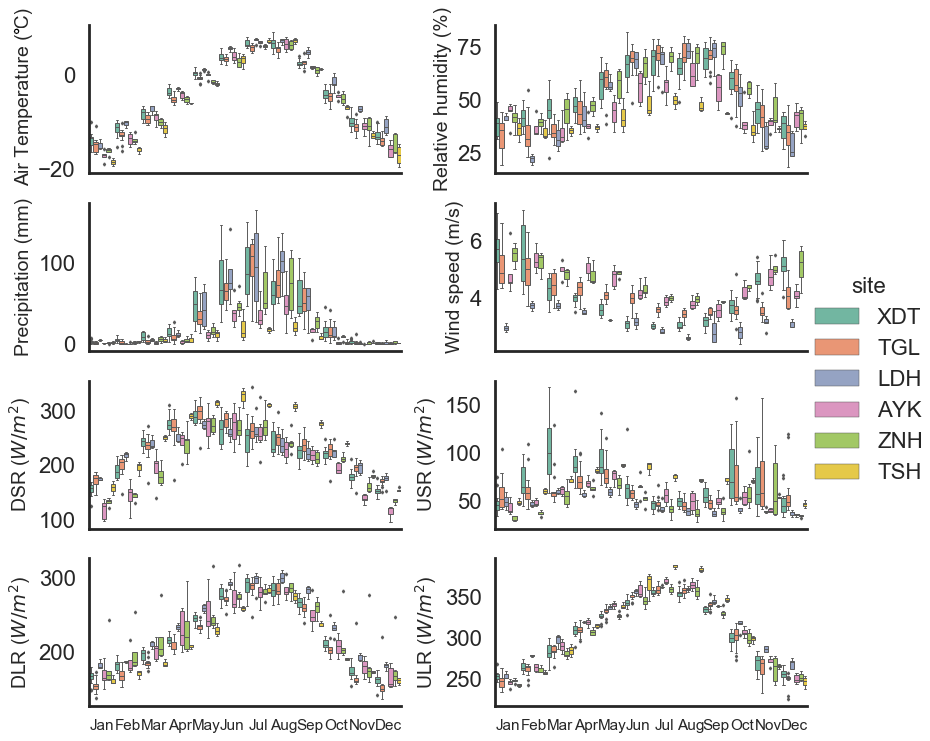
We have set six AMSs (Fig. 2) within the permafrost zone since 2004. The main observation indices include air temperature, humidity, wind speed gradient observation, radiation balance, and precipitation. The active layer observation system and GT borehole were set up simultaneously to record the permafrost, climate, vegetation, and soil indices in different regions of the QTP. The Liangdaohe (LDH) site has the lowest latitude, and it gets the warmest air temperature and the most annual precipitation, while Tianshuihai (TSH) and Ayake (AYK), located in the northwest and north of the QTP, respectively, have the minimum and penultimate temperatures and annual precipitation. TSH has the highest solar radiation among the six stations.
Xidatan (XDT) and Tanggula (TGL) are two sites with the most extended sequence of six gradient meteorological stations. They were established in May 2004, and data sequences are over 16 years. XDT is located near the northern permafrost boundary of the QTP and represents the characteristics of discontinuous permafrost. The TGL site is located on the north side of the Tanggula Mountains in the hinterland of the QTP and represents the characteristics of the continuous permafrost zone. LDH is located near the southern boundary of the permafrost region and represents the characteristics of island permafrost. ZNH is located in the Hoh Xil region, where there was previously no meteorological station and no in situ meteorological monitoring data. It fills the data gap in the central and northern areas of the QTP and is also located in a continuous permafrost zone. AYK is located in the Altun Mountains area in the northern Tibetan Plateau, a vast uninhabited area on the QTP, and is one of the areas with few observations. TSH is located in the western Kunlun Mountains area near the western border of the permafrost region on the QTP. It reflects the regional characteristics of an arid, cold, and high-altitude climate in the vast western part of the QTP. The GT and soil moisture observed in the active layer and permafrost are summarized in Table 1.

2.2 Monitoring data
The main observation indices and instruments for the meteorological observations are shown in Table 1. Observations were made every 10 min, and they were averaged and recorded every 30 min automatically. The data were recorded by CR10X, CR1000, and CR3000 data loggers (Campbell Scientific). Meteorological data (e.g., the precipitation, radiation, air temperature, relative humidity, and wind speed) were recorded hourly with a CR1000/CR3000 data acquisition instrument (Campbell Scientific Inc., USA) (Fig 3a). There were three measurements at heights of 2, 5, and 10 m for air temperature, relative humidity, and wind speed (Table 1).
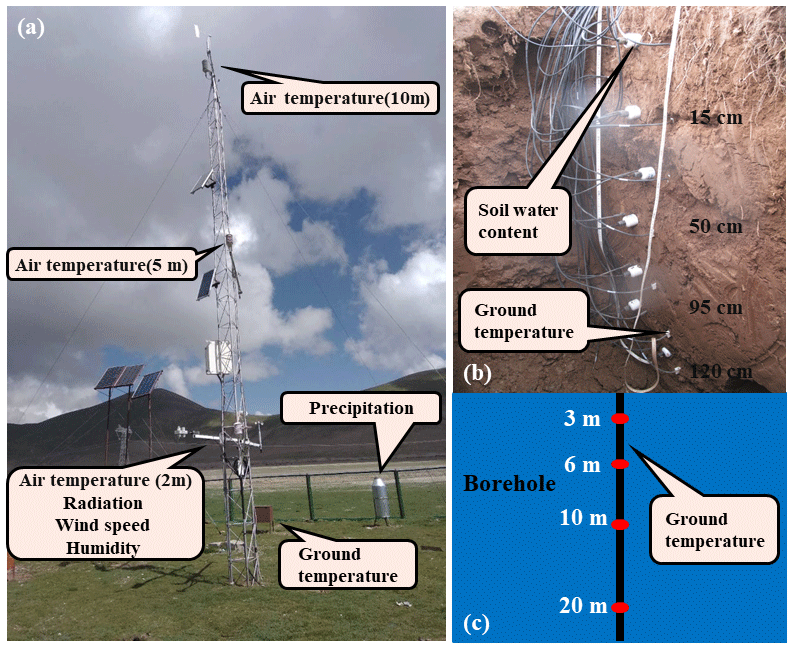
Figure 3The comprehensive observation system: (a) meteorological observation, (b) ground temperature and soil water content in the active layer, and (c) ground temperature observation for permafrost.
The GT for the active layer monitoring system was measured at different depths from the ground surface to the depth of 10 to 50 cm below the permafrost table with a 105T/109 thermocouple probe with an accuracy of ±0.1 ∘C to ±0.2 ∘C in the active layer (Fig. 3b). The soil water content was measured by a Hydra soil moisture sensor (Table 1) by connecting to a CR10X/CR1000/CR3000 data logger (Campbell Scientific, USA), which can record the total volumetric soil water content as the soil is in a thawing state but can only record the unfrozen water content when the soil is frozen.
The GT in the borehole was measured by a thermistor (with an accuracy of ±0.1 ∘C) produced by the State Key Laboratory of Frozen Soil Engineering, Cold and Arid Regions Environmental and Engineering Research Institute of the Chinese Academy of Sciences (SKLFSE, CAREERI, CAS), which was downloaded to depths of 3, 6, 10, and 20 m within a steel pipe in the boreholes. All the borehole GTs along the Qinghai-Xizang highway (QXH) located at the same sites with AMSs were measured at 15 min. The averaged value for each hour was automatically recorded by data loggers (CR1000/CR3000, Campbell Scientific, Logan, UT, USA). Moreover, all the other boreholes far away from the QXH were measured manually by a digital multimeter once every 1 or 2 years depending on local transportation and financial support (Table 1) (Fig. 3c).
2.3 Data processing workflow
The data processing workflow is shown in Fig. 4. The quality control was twofold: (1) the missing data were replaced by −6999; (2) the singular unphysical data were rejected, and the gaps were replaced by −6999. In addition, all the daily data were calculated a 30 min (1 h) intervals per day for the data collected by data loggers. The instruments at meteorological stations are calibrated every few years by comparing observations with standard instruments for about 1 week. The active layer thickness was derived by the maximum depth of 0 ∘C isotherms from linear interpolation of the daily maximum GT. The monthly and annual mean air temperature as well as GTs, radiation, wind speed, relative humidity, and soil water content were also analyzed. The trend of air temperature, active layer thickness, and GT is analyzed and provided for the stations with long-time observations. GTs from manually monitored boreholes were quality-controlled for every measurement.
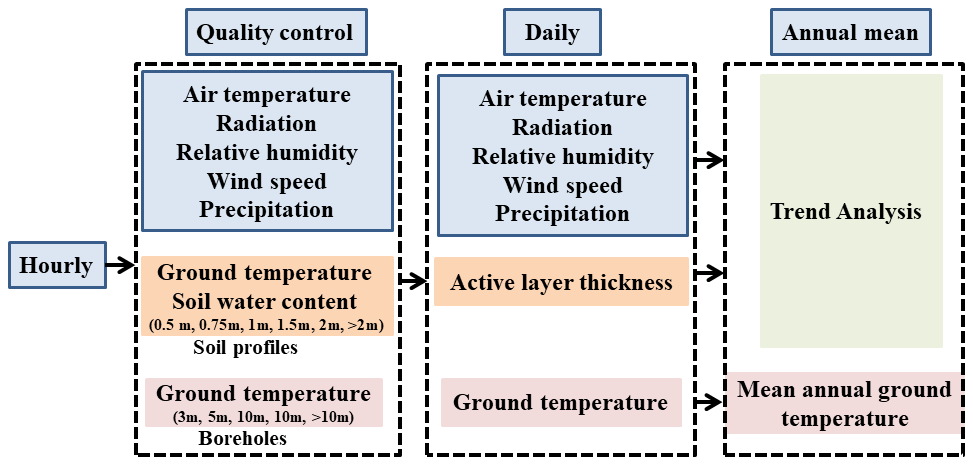
Figure 4Schematic diagram of data processing workflow used to compile the permafrost dataset on the QTP.

3.1 Meteorological data
The seasonal (spring, March–May; summer, June–August; autumn, September–November; and winter, December–February) variation of air temperature at all six sites is significant, with an annual mean from −2.3 to −6 ∘C (Fig. 5). The mean monthly air temperatures in summer are positive but are lower than 0 ∘C in the other three seasons. The differences in the air temperatures between the six stations were minimal in summer, evident in spring and autumn, and much more prominent in winter, mainly caused by the difference in altitude and latitude.
Significant seasonal variation of precipitation is closely related to the monsoon cycles. From May to September, precipitation accounts for more than 85 % of the annual amounts at the five sites other than TSH (78.6 %). Most of the precipitation is concentrated in summer. A small amount is in late spring and early autumn but rare in the winter. Precipitation has significant spatial differences, which are more than 350 mm on average at XDT, TGL, and LDH along QXH. The precipitation at ZNH, located in the hinterland of the QTP and about 200 km from the QXH, is slightly lower, while it is about 150 mm (slightly higher than half at ZNH) in AYK, which is located on the northern edge of the QTP and has the highest latitude among all the six sites. The annual total precipitation at TSH, located near the western boundary of QTP, is the lowest of all the observation sites and is only 100 mm.
The seasonal variation of air humidity is very consistent with the seasonal variations in air temperature and precipitation. The difference between the stations is related to the precipitation, especially in summer. Due to the scarce precipitation, the relative humidity at TSH and AYK is low throughout the year. It is worth noting that the relative humidity in TGL and LDH is quite low in winter as these two sites are located at relatively lower latitude compared with the other four stations. The air temperatures in winter at these two stations are relatively higher. The wind speeds at all stations are generally high except LDH. The average annual wind speeds are higher than 4 m s−1. The wind speed is the highest in winter, followed by spring, and the lowest in summer. The wind speed of LDH was the lowest throughout the year in all AMSs, primarily due to its geomorphological location, as it is a well-developed basin covered with swamp meadow.
Downward shortwave radiation (total solar radiation) usually reaches its maximum in May and decreases in summer due to rainy- and cloudy-day influences at most sites except TSH. The mean downward shortwave radiation in summer is only slightly higher than that in spring. However, at TSH (with little precipitation), it is very high in summer and significantly higher than the other sites in spring and autumn. The upward shortwave radiation is mainly restricted by the surface albedo. Its high value mainly appeared in autumn and indicated that snowfall events mainly occurred in autumn, followed by spring; they were relatively few in winter. The upward shortwave radiation of TSH in all seasons is high, related to the dry and “snow-like” salt-rich ground surface caused by low precipitation but very high evaporation. The upward and downward longwave radiation is closely related to air temperature and surface temperature, respectively, and their seasonal variation trend is basically consistent with the change in air temperature.
XDT and TGL stations have data series with a longer period (from 2004) and can provide basic data for physical process research and land surface process model research. The annual mean temperature of the two stations showed increasing trends, with rates of 0.66 and 0.40 ∘C every 10 years, and p values of 0.27 and 0.23, respectively. The warming trend is the highest in summer and autumn. However, the air temperature in winter shows a slight decrease. The precipitation shows an insignificant weak decrease trend (−15.0 and −14.3 mm every 10 years). It shows a slightly decreasing trend in summer and autumn and an increasing trend in spring (Fig. 6). The changing trend in air temperature and precipitation from these two stations was almost entirely contrary to the results from previous research, which might be due to the limited monitoring time series.
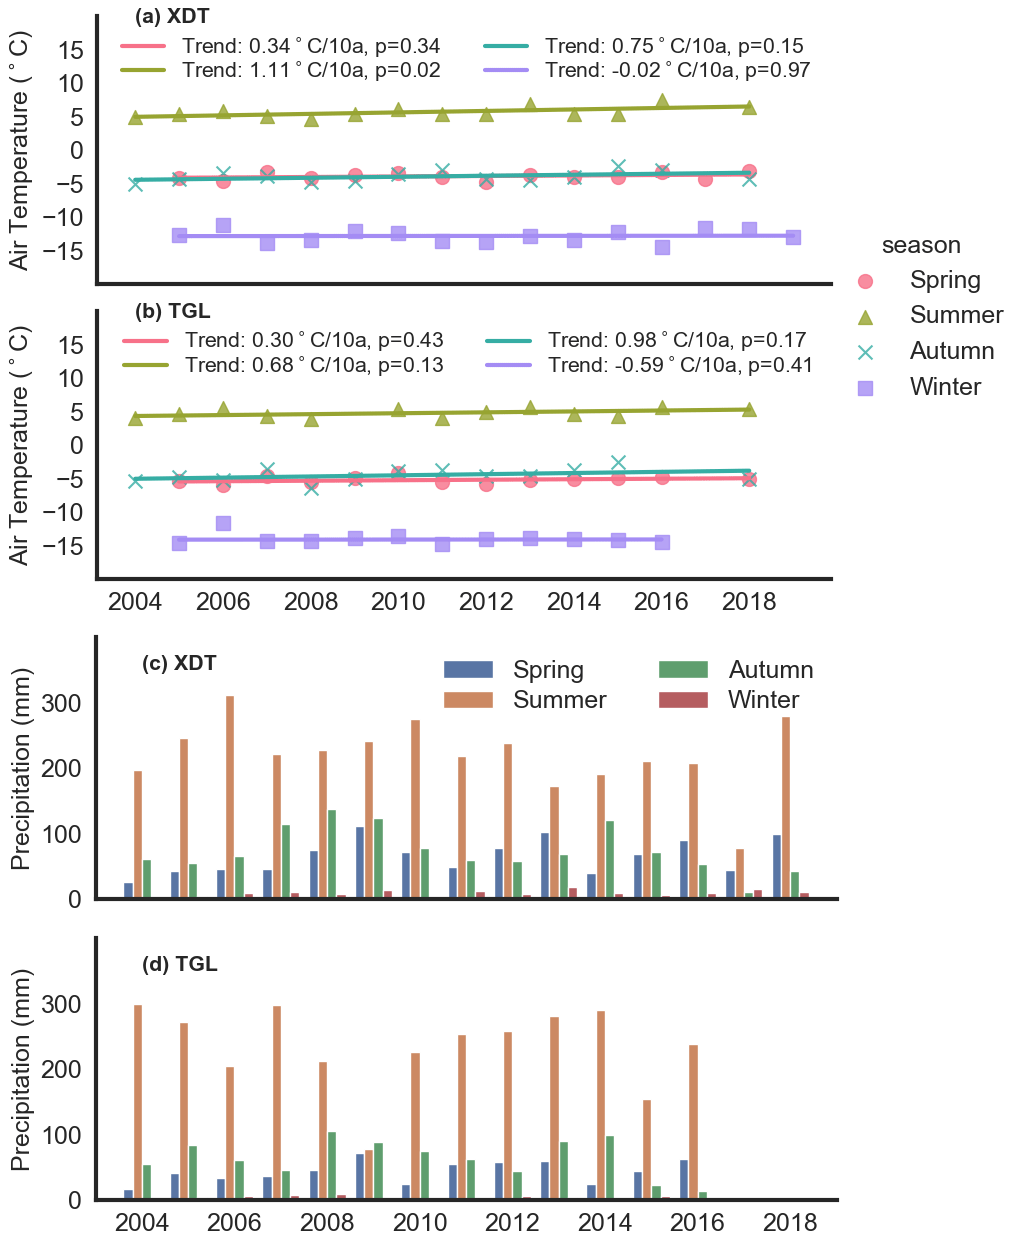
Figure 6Seasonal mean series and changes in temperature and precipitation at XDT and TGL from 2004 to 2018.
3.2 Active layer data
3.2.1 Variation of active layer thickness
The active layer thicknesses varied from about 120 cm to about 300 cm along the Qinghai–Tibet highway under different surface vegetation conditions (Fig. 7). Ch04, which is located in sporadic island permafrost of the QTP southern permafrost distribution boundary regions under swamp meadow condition, appeared to be the shallowest active layer site. Its average thickness was 116 cm during the years 2000–2018. The deepest active layer appeared at QT05, which is located at the margin of permafrost from taliks formed by the thermal influences of the tributaries of Yangtze River headwaters, the Tongtian river and Tuotuo river. Its average thickness was 307 cm from 2004 to 2013, with the surface vegetation being alpine meadow. In the continuous permafrost zone of QTP, including Ch06, QT08, QT01, QT03, and Ch01 sites, the shallowest active layer is located at the Kunlun Mountains pass (Ch06) under nearly bare land surface vegetation condition with an average thickness of 147 cm during 2005–2018. The deepest active layer is located at Wudaoliang (QT08) under bare land with an average thickness of 235 cm during 2010–2018. For representative alpine meadow conditions (e.g., QT01 at Wudaoliang and Ch01 at Fenghuo Mountains), the average thicknesses were 163 and 167 cm. At Beiluhe (QT03), about 10 km north of the Ch01 site, the average thickness was about 231 cm with typical alpine meadow conditions, which is larger than QT01 and Ch01. In addition, the QT09 site, called Xidatan, is located at the northern boundary of the permafrost region, with an average active layer thickness of 141 cm during 2011–2018 under typical alpine meadow conditions. Overall, in our opinion, the ground surface vegetation conditions may have some influence on active layer thickness. However, it is not a controlling factor, especially at a large spatial scale. The spatial distribution of active layer thickness was jointly influenced by climate conditions, GT (including ground surface temperature and permafrost layer temperature), soil water content, and soil texture. Due to the great spatial variation of these influencing factors, the active layer thickness within our monitoring regions presented high spatial variation.
In terms of time variation, all the monitoring sites showed the same pattern. Their active layer thicknesses increased gradually. The increase rate was very different for different sites, with the largest increase rate of 3.9 cm yr−1 at Ch01 and the lowest increase rate of 0.8 cm yr−1 at QT05. It is worth noting that the active layer thickness increase rate can depend on the statistical period. For instance, the average increase rate of QT09 was 3.0 cm yr−1 during 2011–2018, while it was 6.9 cm yr−1 during 2014–2018. Thus, the statistical increase rates of active layer thickness cannot be considered a long-term increasing thickness trend. It only revealed that the active layer thickness has a slow increase trend with interannual fluctuation, and the increasing amplitudes are very different for the different monitoring sites.

Figure 7Variation in active layer thickness among different sites. SI represents the active layer thickness average annual increase rate.
3.2.2 Temperature in the active layer
In this section, we choose GT at a depth of 10 cm and the base of the active layer from 2011 to 2013, during which continuous GT monitoring data series of all eight active layer monitoring sites were available, to analyze the active layer GT spatial distribution and the influence on active layer thickness spatial distribution (Table 3). The GT (ALT_Base_GT) was derived from geothermal interpolation when there was no temperature probe at the actual active layer depth position at the base of the active layer. For all eight active layer monitoring sites, the mean annual GT at a depth of 10 cm (10 cm_GT) varied greatly from site to site. The lowest 10 cm_GT appeared in the Kunlun Mountains region (Ch06), which is −2.86 ∘C. For QT03, QT05, and Ch04, the 10cm_GT was positive and as high as 1.12 and 1.25 ∘C at sites QT05 and Ch04. For ALT_Base_GT, the relatively low temperatures all appeared in mountain regions, such as Ch06 at the Kunlun Mountains and Ch01 at Fenghuo Mountains. This because the ALT_Base_GT was simultaneously influenced by ground surface temperature and underlying permafrost temperature; in mountain regions, the permafrost temperature is often very low in the QTP. At the marginal regions of permafrost distribution or island permafrost, such as QT09, QT05, and Ch04, the ALT_Base_GT was relatively higher than other sites due to their high underlying permafrost temperature.
Table 3The mean active layer thickness, ground temperature at a depth of 10 cm, and permafrost table.

The scatterplot between active layer thickness and 10cm_GT showed that, on the whole, active layer thickness (ALT) increased with the increase in 10cm_GT, but they are not linearly dependent (Fig. 8a). Particularly for Ch04 in the island permafrost region under swamp meadow surface vegetation, the relationship between ALT and 10cm_GT was very different from other monitoring sites, demonstrating that the surface GT spatial distribution did influence the ALT distribution. However, it cannot be used as a primary control factor for ALT prediction under different soil and vegetation conditions. In contrast to the relationship between ALT and 10cm_GT, the relationship between ALT and ALT_Base_GT is much better (Fig. 8b). If ignoring the large deviation of sites QT09 and Ch04, active layer thickness was nearly linearly dependent on the variation of ALT_Base_GT, which indirectly shows that the underlying permafrost temperature has a great influence on ALTs.
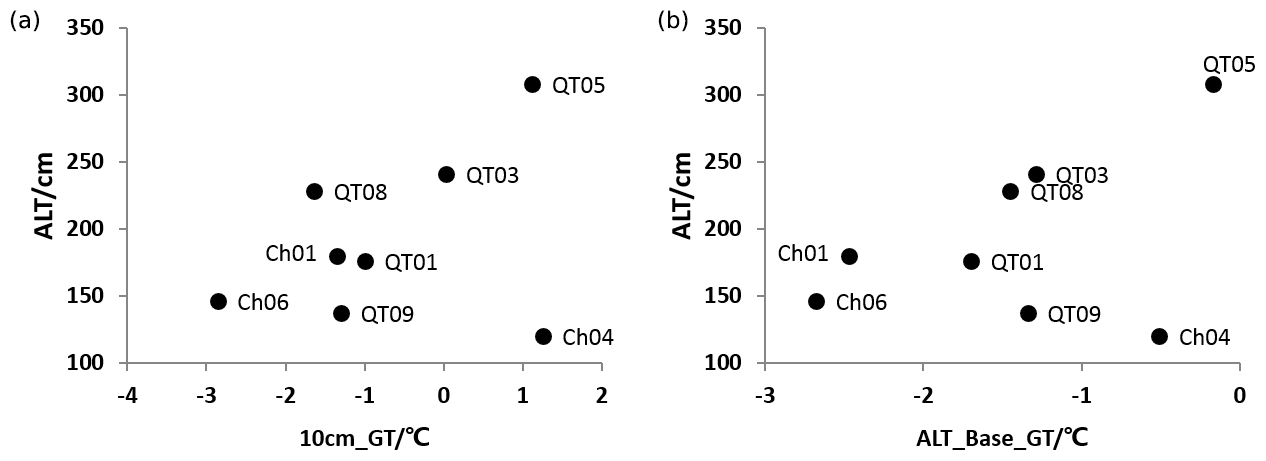
Figure 8The relationship between active layer thickness and the temperature of the permafrost table.
The 10 cm annual mean GT at eight active layer monitoring sites along the Qinghai–Tibetan road ranged from −2.62 to −0.20 ∘C, while GTs near the permafrost table ranged from −2.69 to −0.37 ∘C. The temperature at two depths has a good linear correlation. The mean GTs near the permafrost table at six sites were 0.30 to 1.83 ∘C lower than that at a depth of 10 cm. Only two sites (CN06 and QT08) showed that 10 cm_GT is slightly lower than ALT_Base_GT (approximately 0.2 ∘C). The subsurface GT of 10 cm at all the sites showed increasing trends with increase rates ranging from 0.03 to 0.19 ∘C yr−1. The maximum rate occurred at site QT09, which is located in the northern marginal region of permafrost. The increase rate near the permafrost table is slightly lower than the rate of the surface active layer. Even at CN06, there was a slight cooling trend at the bottom of the active layer.

Figure 9Variation in volumetric water content and soil water equivalent among different sites.
3.2.3 Soil moisture in the active layer
The average volumetric soil water content (VWC) within ALT was calculated with a depth-weighted average method when the ground surface began to freeze and ALT reached its maximum thawing depth at each monitoring site (Fig. 9a). In terms of interannual change, VWC had no obvious changing trend, with random interannual fluctuations. In terms of spatial variation, the VWC varied from 0.141 to 0.403 m3 m−3 among our monitoring sites, with the largest VWC at Ch04 and the lowest at QT08. Active layer soil water content was basically controlled by ground surface vegetation conditions, soil texture, and local drainage conditions. For example, a swamp meadow at Ch04 with about a 60 cm depth of peat soil beneath the ground surface resulted in a very shallow active layer thickness and nearly saturated soil water content conditions. At QT05, the soil pit excavated in 2007 revealed that it was sand within 140 cm. This site has terrible drainage conditions and resulted in relatively high VWC, which averaged 0.292 m3 m−3 during 2004–2018. At QT08, where the soil type is also sand within the active layer and because of its excellent drainage conditions, VWC is very low, which averaged 0.141 during 2012–2018.
Converting the VWC into total soil water depth per unit area stored within the active layer, soil water depth varied from 290 to 890 mm among our monitoring sites (Fig. 9b). QT05 had the highest soil water depth, which averaged 890 mm during 2004–2008. High soil water depth must absorb high heat energy during the active layer thawing process, explaining why the active layer thickness increase rate was very low, while its ground surface temperature was very high.
3.3 Permafrost temperature
A total of 15 borehole sites automatically collected GT at different depths; 14 are located in the permafrost regions and only one is located in a structural talik region (QTB11). Annual mean GTs at depths of 3 and 6 m are given. The GT of these two horizons at most sites has obvious seasonal variation and remarkable interannual variation. Except for QTB11, located in the seasonally frozen ground region, the available mean annual GTs at 10 and 20 m are shown in Fig. 10. For the temperature at 10 m, the highest permafrost temperature appears at site QTB05, which is located on the Qumar River along the Qinghai–Tibetan road; the mean annual GT is very close to 0 ∘C. Meanwhile, the active layer thickness has exceeded approximately 9 m. The lowest temperature appears at site FCKGT, located in a high plain area in the south of the Altun Mountains, where the permafrost temperature reaches −4 ∘C due to extremely cold and dry climatic conditions. The GT at all 15 boreholes showed significant linearly increasing trends, and the permafrost has warmed at different rates (Fig. 10). The warming rates at a depth of 10 m ranged from 0.02 ∘C per decade (FCKGT) to 0.78 ∘C per decade (QTB05) but varied between 0 ∘C per decade and 0.24 ∘C per decade at a depth of 20 m. The annual mean temperature at 20 m for site ZNHGT rarely changed during 2013–2018. At this depth, the most significant warming occurred at sites QTB02, QTB18, and QTB15.
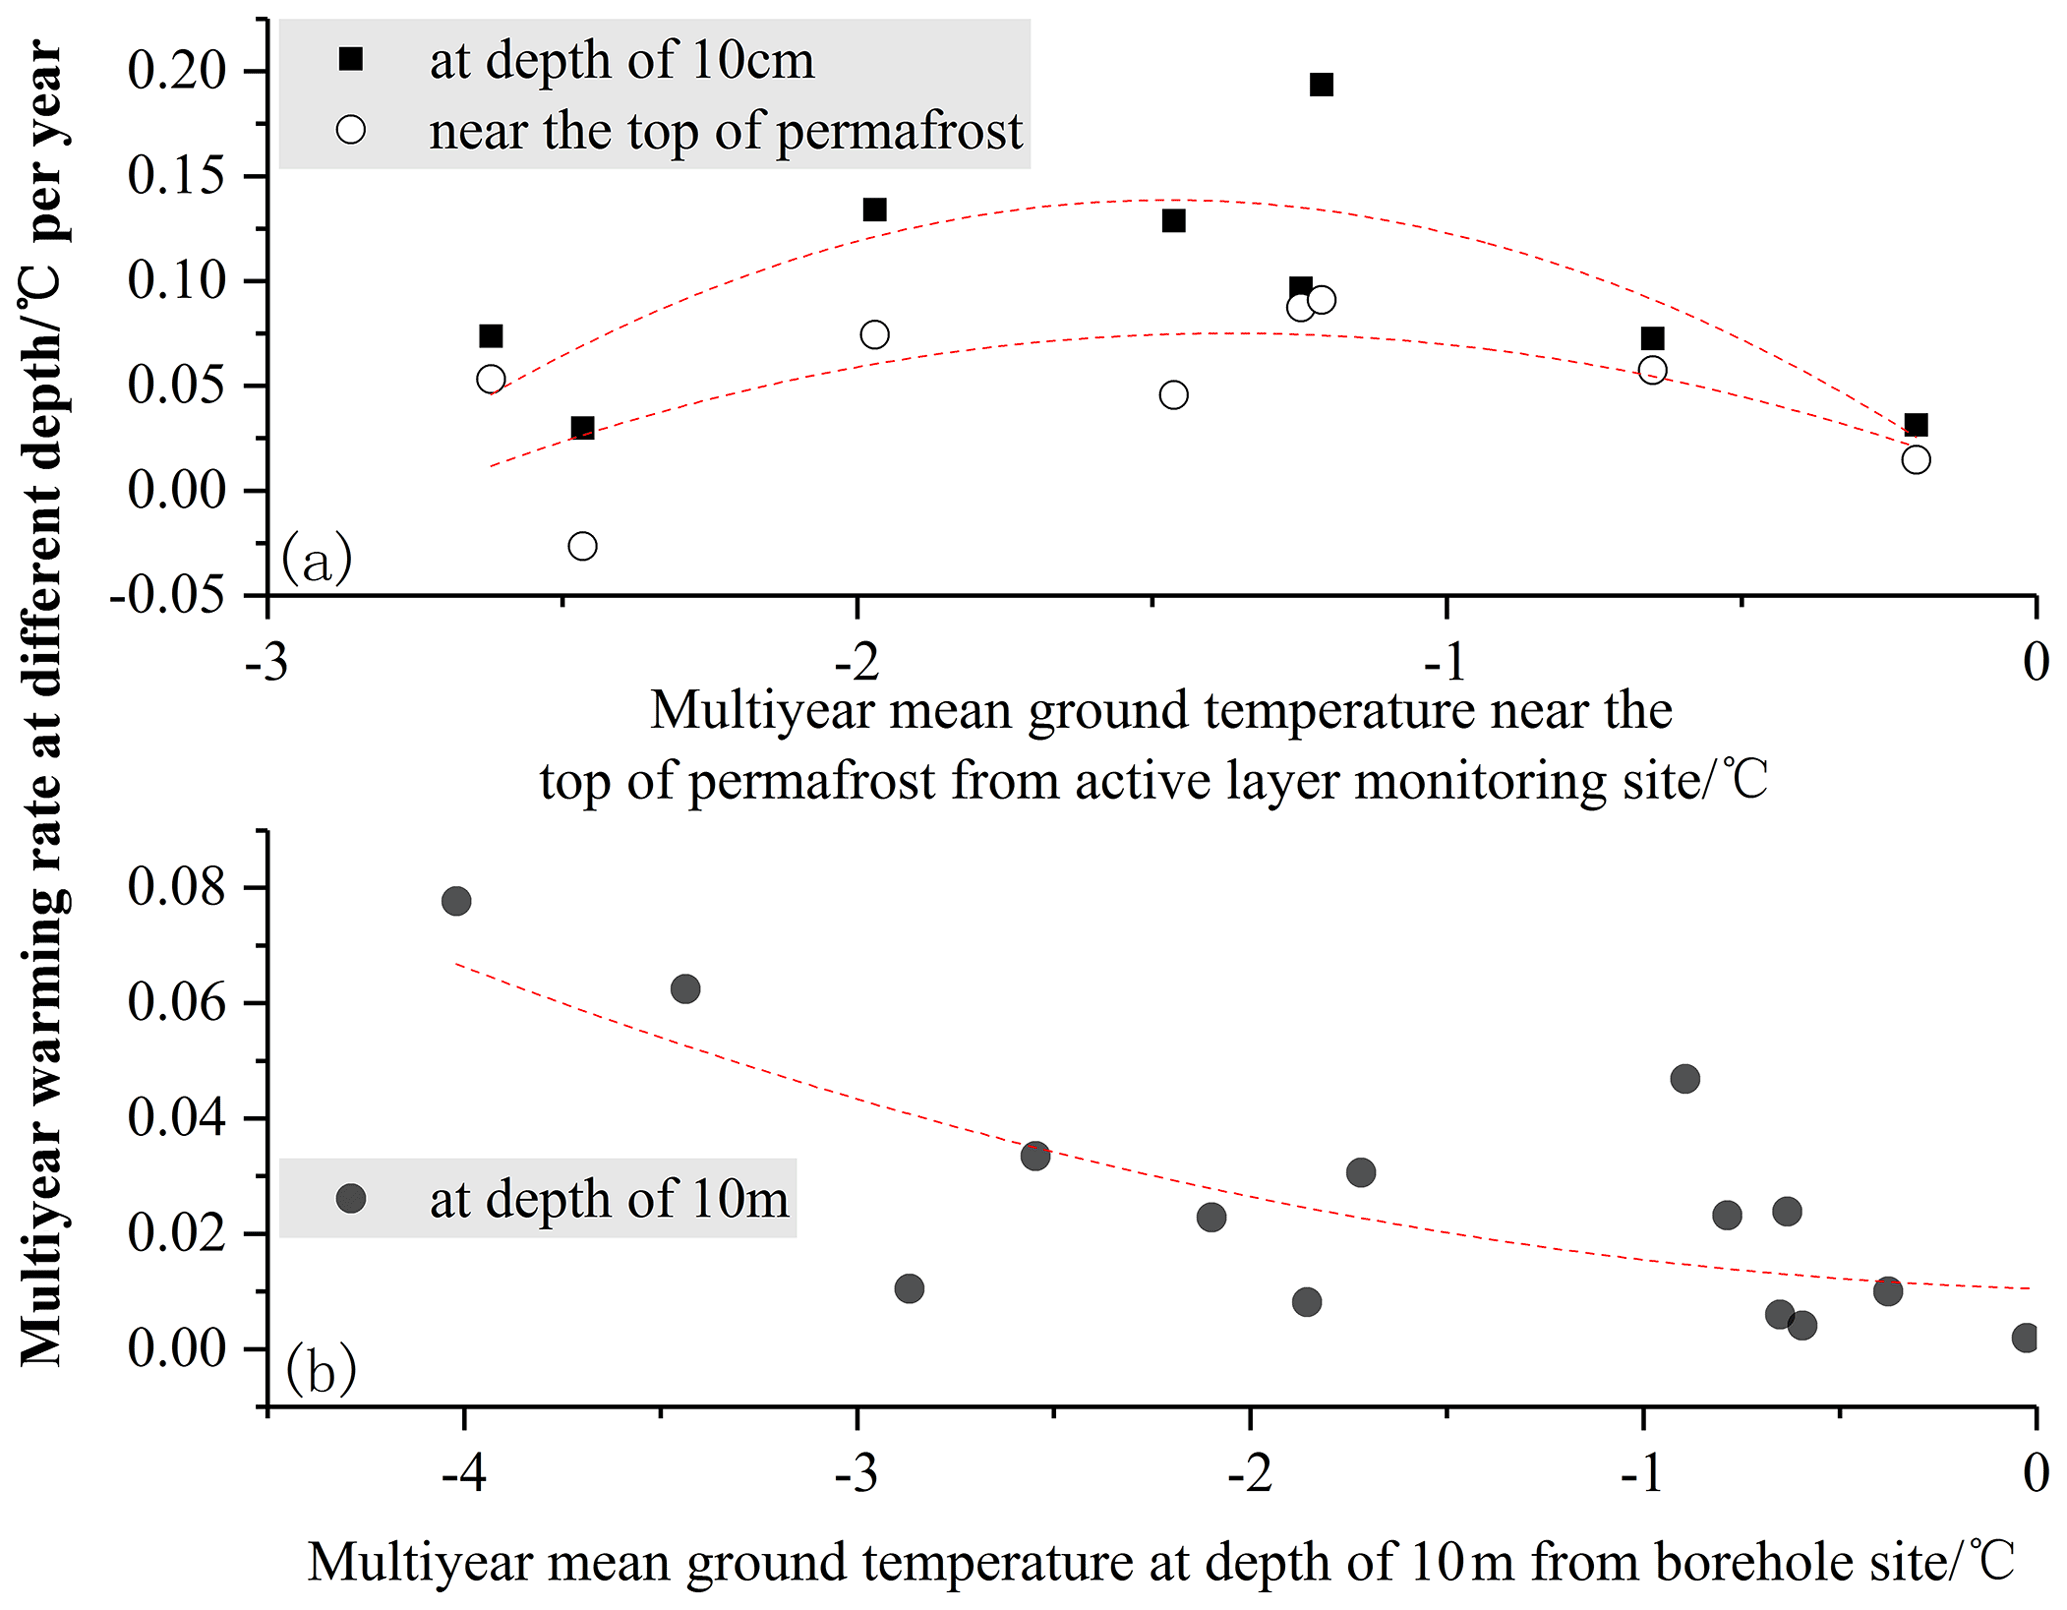
Figure 10Annual mean ground temperature as a function of time at a depth of (a, b) 10 m and (c, d) 20 m from a borehole with continuous data series.
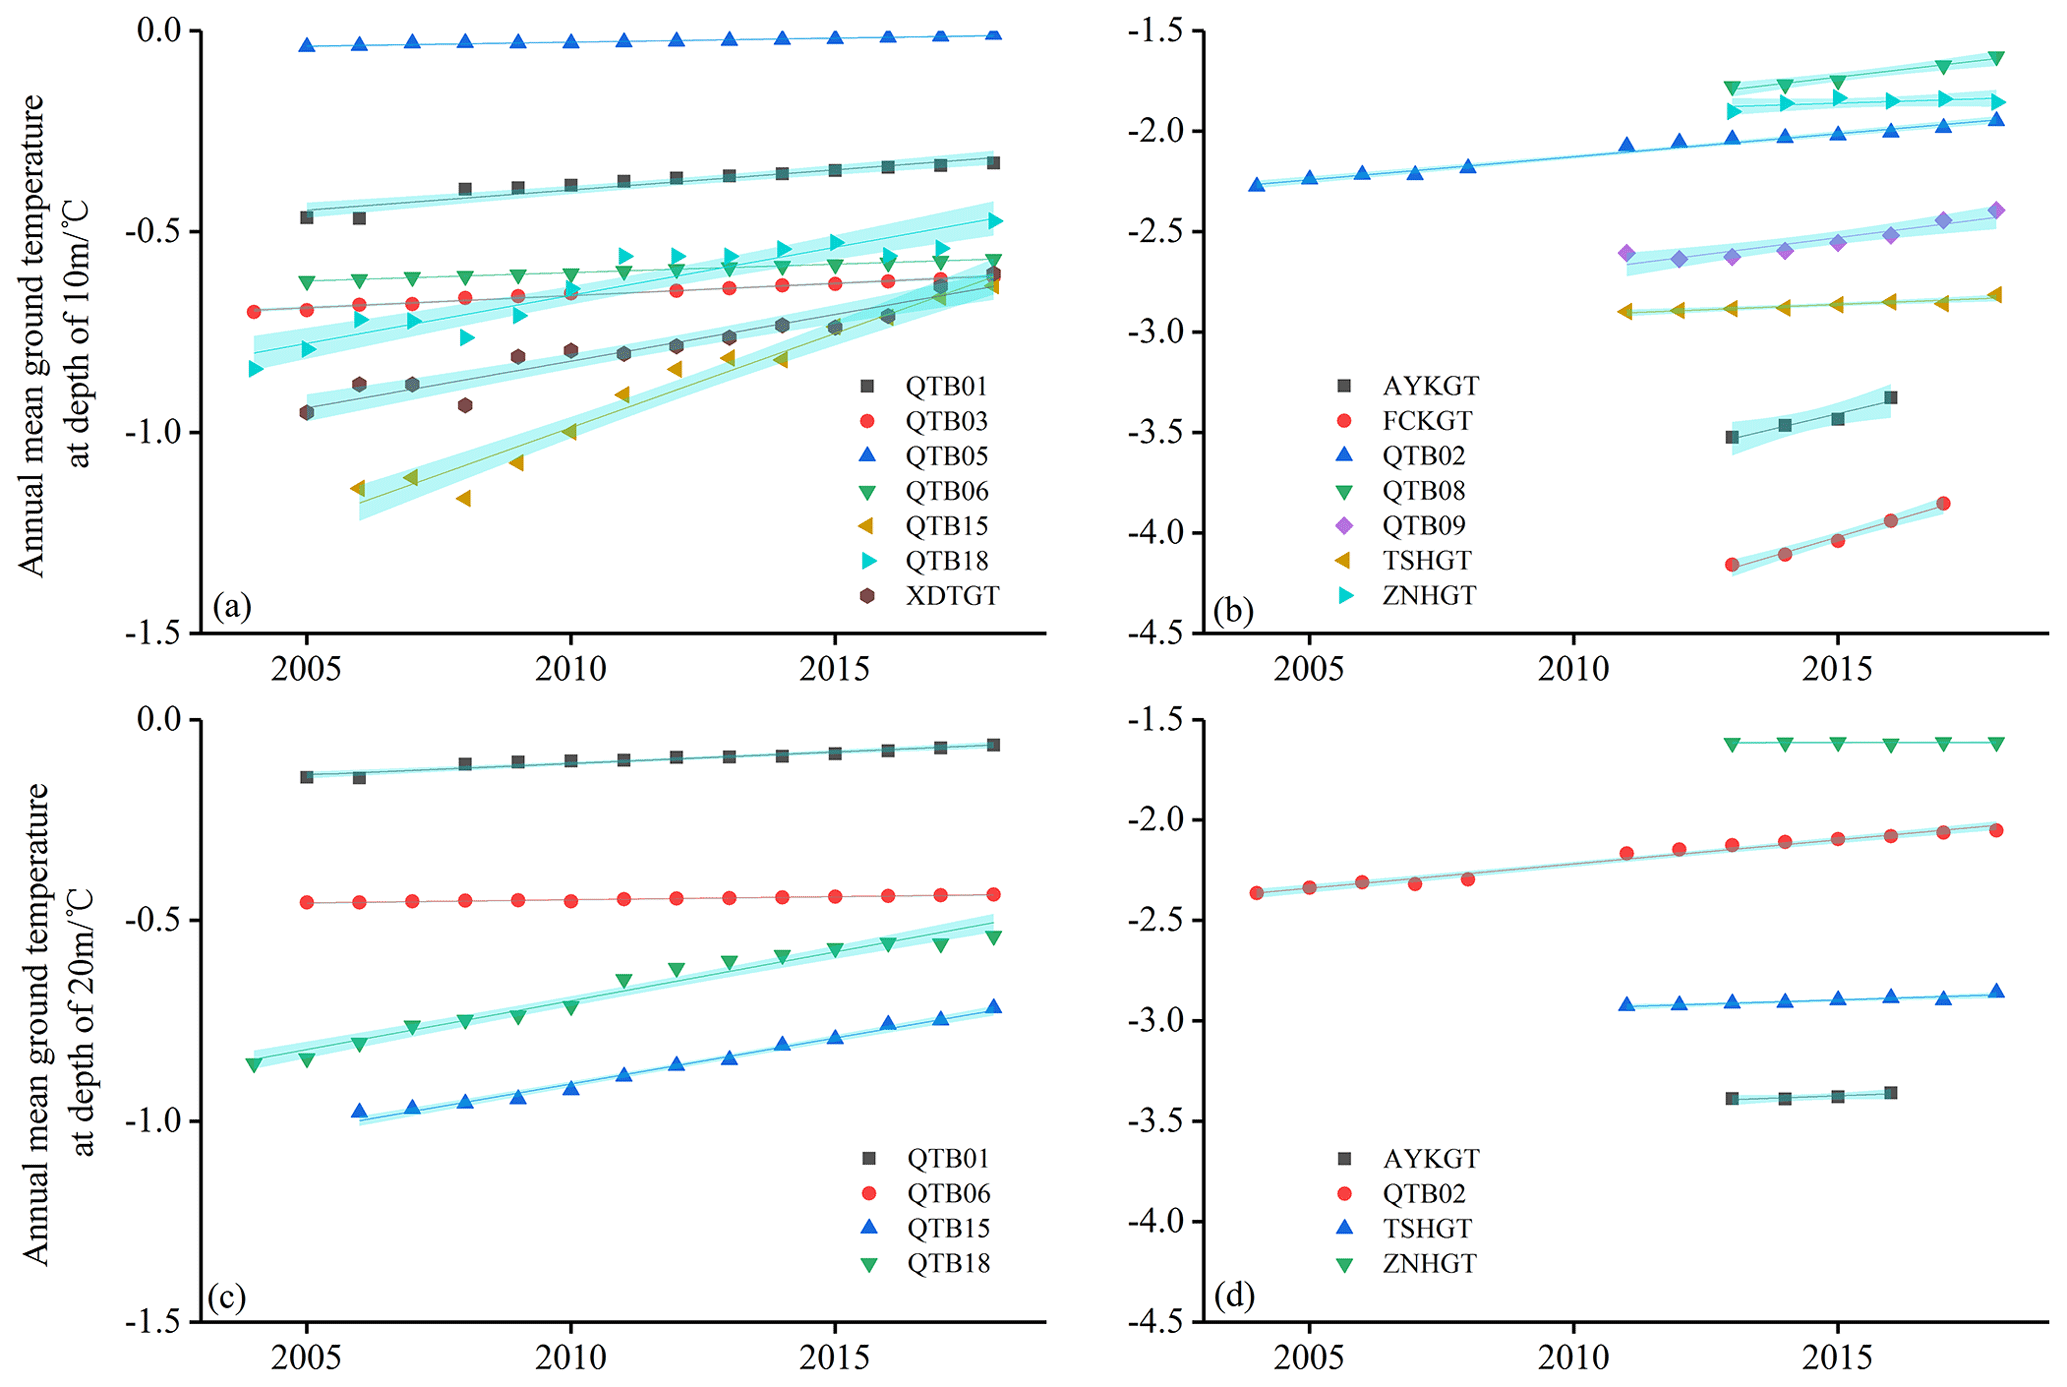
Figure 11The relationship between warming rate and multiyear mean ground temperature during the observation period from the (a) active layer monitoring site and the (b) borehole site.
The warming rate of permafrost seems to have a strong relationship with the temperature of the permafrost itself. Figure 11a shows the change rate of GT at two shallow depths (10 cm and the depth near the permafrost table). They show an increasing trend first and then decreasing as the temperature near the permafrost table rises. Both colder and warmer sites have a relatively lower variation rate of GT. The sites with GTs between −2 and −1 ∘C have the greatest ground warming rate. The warming of the active layer in permafrost regions may be mainly related to regional climate and local topography. Because most sites (QT1, QT3, QT8) with the largest warming rates are located on the high plain in the interior of the QTP, they are geographically relatively close to each other. The two sites (CN1, CN6) with the lowest GT are located in mountain areas (respectively belonging to the Fenghuo Mountains and Kunlun Mountains). At the same time, the other two sites (CN4, QT5) with the highest GT are located in the regions with the warmest climatic conditions, although the underlying surfaces are substantially different. Further study is necessary because the current number of sites is far from enough.
However, the deep GT shows another pattern, and lower-temperature permafrost tends to have a great warming rate (Fig. 11b). This is consistent with the previous research at the QTP, and the correlation between permafrost temperatures and warming rates is more significant than previously found. This indicates that the ice–water phase transition effect in the conversion from permafrost to melting soil has significantly slowed GT increase.
We also analyzed another 69 sites, the GTs of which were recorded manually. The altitude of these sites ranges from 4142 to 5247 m a.s.l. The drilling depth of the borehole reached 10 m at most of the sites, and several reach 20 m. The observation interval is once every 1 year or 2 years. The multiyear averages based on single observations are calculated to compare the thermal regime of different sites. The multiyear mean GT for 10 m observed at different sites ranged from −3.84 to 3.36 ∘C. There are 10 observation fields with a positive mean GT of 10 m and 59 fields with negative values. The site with the highest GT is HT01, and the one with the lowest temperature is STG. For all observation sites, the GT shows a slightly downward trend as the elevation increases.
All datasets in this paper have been released and can be freely download from the National Tibetan Plateau/Third Pole Environment Data Center (https://data.tpdc.ac.cn/en/disallow/789e838e-16ac-4539-bb7e-906217305a1d/, https://doi.org/10.11888/Geocry.tpdc.271107, Lin et al., 2021). More information about the Permafrost Monitoring Network on the Qinghai–Tibet Plateau can be found at the Cryosphere Research Station on the Qinghai–Xizang Plateau (http://new.crs.ac.cn/).
The observation data from permafrost regions on the QTP can provide basic information for studying land–atmosphere interactions and conducting climate change research. They could provide accurate inputs and verifications for land surface models, reanalysis data products, remote sensing products, and climate models. The results revealed that the annual mean air temperatures of all six sites are between −2.3 and −6 ∘C, and their seasonal variation characteristics are significant. Precipitation shows a significant seasonal change trend, which is closely related to the monsoon period. The annual mean air temperature of the XDT and TGL stations showed increasing trends, with rates of 0.66 and 0.40 ∘C every 10 years, respectively, and the GT has a significant warming trend. The precipitation shows an insignificant weak decreasing trend. The active layer thickness has a slow increase trend with interannual fluctuation, and the increasing amplitudes are very different for different monitoring sites. The high-quality comprehensive dataset presented here, with a focus on permafrost thermal state on the QTP, could provide accurate and effective forcing data and evaluation data for different models. This valuable and hard-won permafrost dataset is worth maintaining and promoting in the future. It also provides a prototype of basic data collection and management for other permafrost regions.
LZ generated and designed the observation network, participated in the field installation of most observation sites, and found support for maintaining the observation systems. DZ, GH, TW, XW, RL, ED, GL, YQ, and XY participated in the fieldwork and maintained the observation sites. GH, RL, ED, GL, XY, and DZ performed data processing, organization, and analyses. GH, LZ, ED, GL, XY, and DZ wrote the paper, and all authors participated in the revision of the paper.
The authors declare that they have no conflict of interest.
Publisher's note: Copernicus Publications remains neutral with regard to jurisdictional claims in published maps and institutional affiliations.
This article is part of the special issue “Extreme environment datasets for the three poles”. It is not associated with a conference.
We would like to thank all the scientists, engineers, and students who participated in the fieldwork and helped to maintain this observation network for data acquisition.
This research has been supported by the the Second Tibetan Plateau Scientific Expedition and Research (STEP) program, China (grant no. 2019QZKK0201) and the National Natural Science Foundation of China (grant nos. 41931180, 42071094, 41701073).
This paper was edited by Tao Che and reviewed by three anonymous referees.
Bao, H., Koike, T., Yang, K., Wang, L., Shrestha, M., and Lawford, P.: Development of an enthalpy-based frozen soil model and its validation in a cold region in China, J. Geophys. Res.-Atmos., 121, 5259–5280, https://doi.org/10.1002/2015jd024451, 2016.
Chen, B., Luo, S., Lu, S., Zhang, Y., and Ma, D.: Effects of the soil freeze-thaw process on the regional climate of the Qinghai-Tibet Plateau, Climate Res., 59, 243–257, https://doi.org/10.3354/cr01217, 2014.
Cheng, G. and Jin, H.: Groundwater in the permafrost regions on the Qinghai-Tibet Plateau and it changes, Hydrogeol. Eng. Geol., 40, 1–11, 2013.
Cheng, G., Zhao, L., Li, R., Wu, X., Sheng, Y., Hu, G., Zou, D., Jin, H., Li, X., and Wu, Q.: Characteristic, changes and impacts of permafrost on Qinghai-Tibet Plateau, Chinese Sci. Bull., 64, 2783–2795, 2019.
Cuo, L., Zhang, Y., Bohn, T. J., Zhao, L., Li, J., Liu, Q., and Zhou, B.: Frozen soil degradation and its effects on surface hydrology in the northern Tibetan Plateau, J. Geophys. Res.-Atmos., 120, 8276–8298, https://doi.org/10.1002/2015JD023193, 2015.
Hu, G., Zhao, L., Wu, X., Li, R., Wu, T., Xie, C., Qiao, Y., Shi, J., Li, W., and Cheng, G.: New Fourier-series-based analytical solution to the conduction-convection equation to calculate soil temperature, determine soil thermal properties, or estimate water flux, Int. J. Heat Mass Tran., 95, 815–823, https://doi.org/10.1016/j.ijheatmasstransfer.2015.11.078, 2016.
Hu, G., Zhao, L., Li A, R., Wu, X., Wu, T., Zhu, X., Pang, Q., Liu, G. Y., Du, E., Zou, D., Hao, J., and Li, W.: Simulation of land surface heat fluxes in permafrost regions on the Qinghai-Tibetan Plateau using CMIP5 models, Atmos. Res., 220, 155–168, https://doi.org/10.1016/j.atmosres.2019.01.006, 2019a.
Hu, G., Zhao, L., Wu, X., Wu, T., Li, R., Xie, C., Xiao, Y., Pang, Q., Liu, G., Hao, J., Shi, J., and Qiao, Y.: Variations in soil temperature from 1980 to 2015 in permafrost regions on the Qinghai-Tibetan Plateau based on observed and reanalysis products, Geoderma, 337, 893–905, https://doi.org/10.1016/j.geoderma.2017.07.017, 2019b.
Hu, G., Zhao, L., Zhu, X., Wu, X., Wu, T., Li, R., Xie, C., and Hao, J.: Review of algorithms and parameterizations to determine unfrozen water content in frozen soil, Geoderma, 368, 114277, https://doi.org/10.1016/j.geoderma.2020.114277, 2020.
Li, R., Zhao, L., Ding, Y., Wu, T., Xiao, Y., Du, E., Liu, G., and Qiao, Y.: Temporal and spatial variations of the active layer along the Qinghai-Tibet Highway in a permafrost region, Chinese Sci. Bull., 57, 4609–4616, https://doi.org/10.1007/s11434-012-5323-8, 2012.
Li, X. and Koike, T.: Frozen soil parameterization in SiB2 and its validation with GAME-Tibet observations, Cold Reg. Sci. Technol., 36, 165–182, https://doi.org/10.1016/s0165-232x(03)00009-0, 2003.
Lin, Z., Guojie, H., Defu, Z., Defu, Z., Tonghua, W., Erji, D., Guangyue, L., Yao, X., Yao, X., Yao, X., Ren, L., Qiangqiang, P., Qiangqiang, P., Yongping, Q., Xiaodong, W., Zhe, S., Zangping, X., Yu, S., Yonghua, Z., Yonghua, Z., Jianzong, S., Changwei, X., Lingxiao, W., Chong, W., and Guodong, C.: A synthesis dataset of permafrost for the Qinghai-Xizang (Tibet) Plateau, China (2002–2018), National Tibetan Plateau Data Center, https://doi.org/10.11888/Geocry.tpdc.271107, 2021.
Liu, X. and Hou, P.: Relationship between the climatic warming over the Qinghai -Xizang Plateau and its surrounding areas in recent 30 years and the elevation, Plateau Meteorol., 17, 245–245, 1998.
Ma, L., Zhang, T., Li, Q., Frauenfeld, O. W., and Qin, D.: Evaluation of ERA-40, NCEP-1, and NCEP-2 reanalysis air temperatures with ground-based measurements in China, J. Geophys. Res.-Atmos., 113, D15115, https://doi.org/10.1029/2007jd009549, 2008.
Ma, Y., Ma, W., Zhong, L., Hu, Z., Li, M., Zhu, Z., Han, C., Wang, B., and Liu, X.: Monitoring and Modeling the Tibetan Plateau's climate system and its impact on East Asia, Sci. Rep., 7, 44574, https://doi.org/10.1038/srep44574, 2017.
Ping, C. L., Jastrow, J. D., Jorgenson, M. T., Michaelson, G. J., and Shur, Y. L.: Permafrost soils and carbon cycling, SOIL, 1, 147–171, https://doi.org/10.5194/soil-1-147-2015, 2015.
Qiu, J.: The third pole, Nature, 454, 393–396, https://doi.org/10.1038/454393a, 2008.
Schuur, E., McGuire, A., Schädel, C., Grosse, G., Harden, J., Hayes, D., Hugelius, G., Koven, C., Kuhry, P., and Lawrence, D.: Climate change and the permafrost carbon feedback, Nature, 520, 171–179, https://doi.org/10.1038/nature14338, 2015.
Schuur, E. A. G., Abbott, B., and Permafrost Carbon, N.: High risk of permafrost thaw, Nature, 480, 32–33, https://doi.org/10.1038/480032a, 2011.
Sharkhuu, A., Sharkhuu, N., Etzelmüller, B., Heggem, E. S. F., Nelson, F. E., Shiklomanov, N. I., Goulden, C. E., and Brown, J.: Permafrost monitoring in the Hovsgol mountain region, Mongolia, J. Geophys. Res.-Atmos., 112, 195–225, https://doi.org/10.1029/2006JF000543, 2007.
Su, F., Duan, X., Chen, D., Hao, Z., and Cuo, L.: Evaluation of the Global Climate Models in the CMIP5 over the Tibetan Plateau, J. Climate, 26, 3187–3208, https://doi.org/10.1175/JCLI-D-12-00321.1, 2013.
Wang, G., Li, Y., Wu, Q., and Wang, Y.: Impacts of permafrost changes on alpine ecosystem in Qinghai-Tibet Plateau, Sci. China Ser. D, 49, 1156–1169, 2006a.
Wang, G., Li, Y., Wu, Q., and Wang, Y.: Impacts of permafrost changes on alpine ecosystem in Qinghai-Tibet Plateau, Sci. China Ser. D, 49, 1156–1169, https://doi.org/10.1007/s11430-006-1156-0, 2006b.
Wang, L., Zhou, J., Qi, J., Sun, L., Yang, K., Tian, L., Lin, Y., Liu, W., Shrestha, M., Xue, Y., Koike, T., Ma, Y., Li, X., Chen, Y., Chen, D., Piao, S., and Lu, H.: Development of a land surface model with coupled snow and frozen soil physics, Water Resour. Res., 53, 5085–5103, https://doi.org/10.1002/2017wr020451, 2017.
Wang, S. L., Jin, H. J., Li, S. X., and Zhao, L.: Permafrost degradation on the Qinghai-Tibet Plateau and its environmental impacts, Permafrost Periglac., 11, 43–53, 2000.
Wu, B., Yang, K., and Zhang, R.: Eurasian snow cover variability and its association with summer rainfall in China, Adv. Atmos. Sci., 26, 31–44, 2009.
Wu, Q., Shen, Y., and Shi, B.: The relationship between frozen soil tegether with its water-heat process and ecological environment in the Tibetan Plateau, J. Glaciol. Geocryol., 25, 250–255, 2003.
Wu, X., Zhao, L., Chen, M., Fang, H., Yue, G., Chen, J., Pang, Q., Wang, Z., and Ding, Y.: Soil Organic Carbon and Its Relationship to Vegetation Communities and Soil Properties in Permafrost Areas of the Central Western Qinghai-Tibet Plateau, China, Permafrost Periglac., 23, 162–169, https://doi.org/10.1002/ppp.1740, 2012.
Yang, K., Wang, C., and Li, S.: Improved Simulation of Frozen-Thawing Process in Land Surface Model (CLM4.5), J. Geophys. Res.-Atmos., 123, 13238–13258, https://doi.org/10.1029/2017jd028260, 2018.
Yao, T., Piao, S., Shen, M., Gao, J., Yang, W., Zhang, G., Lei, Y., Gao, Y., Zhu, L., Xu, B., Yu, W., and Li, S.: Chained Impacts on Modern Environment of Interaction between Westerlies and Indian Monsoon on Tibetan Plateau, Bull. Chin. Acad. Sci., 32, 976–984, 2017.
Ye, D. and Gao, Y.: The Meteorology of the Qinghai-Xizang (Tibet) Plateau, Science Press, Beijing, 278 pp., 1979.
Zhang, Y., Carey, S. K., and Quinton, W. L.: Evaluation of the algorithms and parameterizations for ground thawing and freezing simulation in permafrost regions, J. Geophys. Res.-Atmos., 113, D17116, https://doi.org/10.1029/2007jd009343, 2008.
Zhao, L., Ping, C.-L., Yang, D., Cheng, G., Ding, Y., and Liu, S.: Changes of climate and seasonally frozen ground over the past 30 years in Qinghai–Xizang (Tibetan) Plateau, China, Global Planet. Change, 43, 19–31, https://doi.org/10.1016/j.gloplacha.2004.02.003, 2004.
Zhao, L. and Sheng, Y.: Permafrost survey manual, Science Press, Beijing, 13–14, 2015.
Zhao, L., Wu, T., Xie, C., Li, R., Wu, X., Yao, J., Yue, G., and Xiao, Y.: Support Geoscience Research, Environmental Management, and Engineering Construction with Investigation and Monitoring on Permafrost in the Qinghai-Tibet Plateau, China, Bull. Chin. Acad. Sci., 32, 1159–1168, 2017.
Zhao, L., Wu, X., Wang, Z., Sheng, Y., Fang, H., Zhao, Y., Hu, G., Li, W., Pang, Q., Shi, J., Mo, B., Wang, Q., Ruan, X., Li, X., and Ding, Y.: Soil organic carbon and total nitrogen pools in permafrost zones of the Qinghai-Tibetan Plateau, Sci. Rep., 8, 3656, https://doi.org/10.1038/s41598-018-22024-2, 2018.
Zhao, L., Hu, G., Zou, D., Wu, X., Ma, L., Sun, Z., Yuan, L., Zhou, H., and Liu, S.: Permafrost Changes and Its Effects on Hydrological Processes on Qinghai-Tibet Plateau, Bull. Chin. Acad. Sci., 34, 1233–1246, 2019.
Zhao, L., Zou, D. F., Hu, G., Du, E., Pang, Q., Xiao, Y., Li, R., Sheng, Y., Wu, X., Sun, Z., Wang, L., Wang, C., Ma, L., Zhou, H., and Liu, S.: Changing climate and the permafrost environment on the Qinghai–Tibet (Xizang) Plateau, Permafrost Periglac., 31, 396–405, https://doi.org/10.1002/ppp.2056, 2020.
Zou, D., Zhao, L., Sheng, Y., Chen, J., Hu, G., Wu, T., Wu, J., Xie, C., Wu, X., Pang, Q., Wang, W., Du, E., Li, W., Liu, G., Li, J., Qin, Y., Qiao, Y., Wang, Z., Shi, J., and Cheng, G.: A new map of permafrost distribution on the Tibetan Plateau, The Cryosphere, 11, 2527–2542, https://doi.org/10.5194/tc-11-2527-2017, 2017.
The requested paper has a corresponding corrigendum published. Please read the corrigendum first before downloading the article.
- Article
(6003 KB) - Full-text XML