the Creative Commons Attribution 4.0 License.
the Creative Commons Attribution 4.0 License.
 | 25 Aug 2021
EUREC4A
Bjorn Stevens
David Farrell
Felix Ament
Alan Blyth
Christopher Fairall
Johannes Karstensen
Patricia K. Quinn
Sabrina Speich
Claudia Acquistapace
Franziska Aemisegger
Anna Lea Albright
Hugo Bellenger
Eberhard Bodenschatz
Kathy-Ann Caesar
Rebecca Chewitt-Lucas
Gijs de Boer
Julien Delanoë
Leif Denby
Florian Ewald
Benjamin Fildier
Marvin Forde
Geet George
Silke Gross
Martin Hagen
Andrea Hausold
Karen J. Heywood
Lutz Hirsch
Marek Jacob
Friedhelm Jansen
Stefan Kinne
Daniel Klocke
Tobias Kölling
Heike Konow
Marie Lothon
Wiebke Mohr
Ann Kristin Naumann
Louise Nuijens
Léa Olivier
Robert Pincus
Mira Pöhlker
Gilles Reverdin
Gregory Roberts
Sabrina Schnitt
Hauke Schulz
A. Pier Siebesma
Claudia Christine Stephan
Peter Sullivan
Ludovic Touzé-Peiffer
Jessica Vial
Raphaela Vogel
Paquita Zuidema
Nicola Alexander
Lyndon Alves
Sophian Arixi
Hamish Asmath
Gholamhossein Bagheri
Katharina Baier
Adriana Bailey
Dariusz Baranowski
Alexandre Baron
Sébastien Barrau
Paul A. Barrett
Frédéric Batier
Andreas Behrendt
Arne Bendinger
Florent Beucher
Sebastien Bigorre
Edmund Blades
Peter Blossey
Olivier Bock
Steven Böing
Pierre Bosser
Denis Bourras
Pascale Bouruet-Aubertot
Keith Bower
Pierre Branellec
Hubert Branger
Michal Brennek
Alan Brewer
Pierre-Etienne Brilouet
Björn Brügmann
Stefan A. Buehler
Elmo Burke
Ralph Burton
Radiance Calmer
Jean-Christophe Canonici
Xavier Carton
Gregory Cato Jr.
Jude Andre Charles
Patrick Chazette
Yanxu Chen
Michal T. Chilinski
Thomas Choularton
Patrick Chuang
Shamal Clarke
Céline Cornet
Pierre Coutris
Fleur Couvreux
Susanne Crewell
Timothy Cronin
Zhiqiang Cui
Yannis Cuypers
Alton Daley
Gillian M. Damerell
Thibaut Dauhut
Hartwig Deneke
Jean-Philippe Desbios
Steffen Dörner
Sebastian Donner
Vincent Douet
Kyla Drushka
Marina Dütsch
André Ehrlich
Kerry Emanuel
Alexandros Emmanouilidis
Jean-Claude Etienne
Sheryl Etienne-Leblanc
Ghislain Faure
Graham Feingold
Luca Ferrero
Andreas Fix
Cyrille Flamant
Piotr Jacek Flatau
Gregory R. Foltz
Linda Forster
Iulian Furtuna
Alan Gadian
Joseph Galewsky
Martin Gallagher
Peter Gallimore
Cassandra Gaston
Chelle Gentemann
Nicolas Geyskens
Andreas Giez
John Gollop
Isabelle Gouirand
Christophe Gourbeyre
Dörte de Graaf
Geiske E. de Groot
Robert Grosz
Johannes Güttler
Manuel Gutleben
Kashawn Hall
George Harris
Kevin C. Helfer
Dean Henze
Calvert Herbert
Bruna Holanda
Antonio Ibanez-Landeta
Janet Intrieri
Suneil Iyer
Fabrice Julien
Heike Kalesse
Jan Kazil
Alexander Kellman
Abiel T. Kidane
Ulrike Kirchner
Marcus Klingebiel
Mareike Körner
Leslie Ann Kremper
Jan Kretzschmar
Ovid Krüger
Wojciech Kumala
Armin Kurz
Pierre L'Hégaret
Matthieu Labaste
Tom Lachlan-Cope
Arlene Laing
Peter Landschützer
Theresa Lang
Diego Lange
Ingo Lange
Clément Laplace
Gauke Lavik
Rémi Laxenaire
Caroline Le Bihan
Mason Leandro
Nathalie Lefevre
Marius Lena
Donald Lenschow
Gary Lloyd
Sebastian Los
Niccolò Losi
Oscar Lovell
Christopher Luneau
Przemyslaw Makuch
Szymon Malinowski
Gaston Manta
Eleni Marinou
Nicholas Marsden
Sebastien Masson
Nicolas Maury
Bernhard Mayer
Margarette Mayers-Als
Christophe Mazel
Wayne McGeary
James C. McWilliams
Mario Mech
Melina Mehlmann
Agostino Niyonkuru Meroni
Theresa Mieslinger
Andreas Minikin
Peter Minnett
Gregor Möller
Yanmichel Morfa Avalos
Caroline Muller
Ionela Musat
Anna Napoli
Almuth Neuberger
Christophe Noisel
David Noone
Freja Nordsiek
Jakub L. Nowak
Lothar Oswald
Douglas J. Parker
Carolyn Peck
Renaud Person
Miriam Philippi
Albert Plueddemann
Christopher Pöhlker
Veronika Pörtge
Ulrich Pöschl
Lawrence Pologne
Michał Posyniak
Marc Prange
Estefanía Quiñones Meléndez
Jule Radtke
Karim Ramage
Jens Reimann
Lionel Renault
Klaus Reus
Ashford Reyes
Joachim Ribbe
Maximilian Ringel
Markus Ritschel
Cesar B. Rocha
Nicolas Rochetin
Johannes Röttenbacher
Callum Rollo
Haley Royer
Pauline Sadoulet
Leo Saffin
Sanola Sandiford
Irina Sandu
Michael Schäfer
Vera Schemann
Imke Schirmacher
Oliver Schlenczek
Jerome Schmidt
Marcel Schröder
Alfons Schwarzenboeck
Andrea Sealy
Christoph J. Senff
Ilya Serikov
Samkeyat Shohan
Elizabeth Siddle
Alexander Smirnov
Florian Späth
Branden Spooner
M. Katharina Stolla
Wojciech Szkółka
Simon P. de Szoeke
Stéphane Tarot
Eleni Tetoni
Elizabeth Thompson
Jim Thomson
Lorenzo Tomassini
Julien Totems
Alma Anna Ubele
Leonie Villiger
Jan von Arx
Thomas Wagner
Andi Walther
Ben Webber
Manfred Wendisch
Shanice Whitehall
Anton Wiltshire
Allison A. Wing
Martin Wirth
Jonathan Wiskandt
Kevin Wolf
Ludwig Worbes
Ethan Wright
Volker Wulfmeyer
Shanea Young
Chidong Zhang
Dongxiao Zhang
Florian Ziemen
Tobias Zinner
Martin Zöger
The science guiding the EUREC4A campaign and its measurements is presented. EUREC4A comprised roughly 5 weeks of measurements in the downstream winter trades of the North Atlantic – eastward and southeastward of Barbados. Through its ability to characterize processes operating across a wide range of scales, EUREC4A marked a turning point in our ability to observationally study factors influencing clouds in the trades, how they will respond to warming, and their link to other components of the earth system, such as upper-ocean processes or the life cycle of particulate matter. This characterization was made possible by thousands (2500) of sondes distributed to measure circulations on meso- (200 km) and larger (500 km) scales, roughly 400 h of flight time by four heavily instrumented research aircraft; four global-class research vessels; an advanced ground-based cloud observatory; scores of autonomous observing platforms operating in the upper ocean (nearly 10 000 profiles), lower atmosphere (continuous profiling), and along the air–sea interface; a network of water stable isotopologue measurements; targeted tasking of satellite remote sensing; and modeling with a new generation of weather and climate models. In addition to providing an outline of the novel measurements and their composition into a unified and coordinated campaign, the six distinct scientific facets that EUREC4A explored – from North Brazil Current rings to turbulence-induced clustering of cloud droplets and its influence on warm-rain formation – are presented along with an overview of EUREC4A's outreach activities, environmental impact, and guidelines for scientific practice. Track data for all platforms are standardized and accessible at https://doi.org/10.25326/165 (Stevens, 2021), and a film documenting the campaign is provided as a video supplement.
- Article
(32419 KB) - Full-text XML
- BibTeX
- EndNote


The clouds of the trades are curious creatures. On the one hand they are fleeting and sensitive to subtle shifts in the wind, to the presence and nature of particulate matter, and to small changes in radiant energy transfer, surface temperatures, or myriad other factors as they scud along the sky (Siebesma et al., 2020). On the other hand, they are immutable and substantial – like Magritte's suspended stone (Stevens and Schwartz, 2012). In terms of climate change, should even a small part of their sensible side express itself with warming, large effects could result. This realization has motivated a great deal of research in recent years (Bony et al., 2015), culminating in a recent field study named1 EUREC4A. The measurements made as part of EUREC4A, which this paper describes, express the most ambitious effort ever to quantify how cloud properties covary with their atmospheric and oceanic environment across an enormous (mm to Mm) range of scales.
Initially EUREC4A was proposed as a way to test hypothesized cloud-feedback mechanisms thought to explain large differences in model estimates of climate sensitivity, as well as to provide benchmark measurements for a new generation of models and satellite observations (Bony et al., 2017). To meet these objectives required quantifying different measures of clouds in the trade winds as a function of their large-scale environment. In the past, efforts to use measurements for this purpose – from Bannon (1949) to BOMEX2 (Holland and Rasmusson, 1973) and from ASTEX (Albrecht et al., 1995) to RICO (Rauber et al., 2007) – have been hampered by an inability to constrain the mean vertical motion over larger scales and by difficulties in quantifying something as multifaceted as a field of clouds (Bretherton et al., 1999; Stevens et al., 2001; Siebesma et al., 2003; vanZanten et al., 2011). EUREC4A was made possible by new methods to measure these quantities, many developed through experimentation over the past decade in and around the Barbados Cloud Observatory (Stevens et al., 2016, 2019a). To execute these measurements required a high-flying aircraft (HALO, High Altitude and Long Range Research Aircraft) to characterize the clouds and cloud environment from above, both with remote sensing and through the distribution of a large number of dropsondes around the perimeter of a mesoscale (ca. 200 km diameter) circle. A second low-flying aircraft (the ATR), with in situ cloud sensors and sidewards-staring active remote sensing, was necessary to ground truth the remote sensing from above, as well as to determine the distribution of cloudiness and aspects of the environment as seen from below. By making these measurements upwind of the Barbados Cloud Observatory (BCO), and by adding a research vessel (the R/V Meteor) for additional surface-based remote sensing and surface flux measurements, the environment and its clouds would be better constrained.
Quantifying day-to-day variations in both cloudiness and its environment opened the door to additional questions, greatly expanding EUREC4A's scope. In addition to testing hypothesized cloud-feedback mechanisms, EUREC4A's experimental plan was augmented to (i) quantify the relative role of micro- and macrophysical factors in rain formation; (ii) quantify different factors influencing the mass, energy, and momentum balances in the sub-cloud layer; (iii) identify processes influencing the evolution of ocean meso-scale eddies; (iv) measure the influence of ocean heterogeneity, i.e., fronts and eddies, on air–sea interaction and cloud formation; and (v) provide benchmark measurements for a new generation of both fine-scale coupled models and satellite retrievals. Complementing these scientific pursuits, EUREC4A developed outreach and capacity-building activities that allowed scientists coming from outside the Caribbean to benefit from local expertise and vice versa.
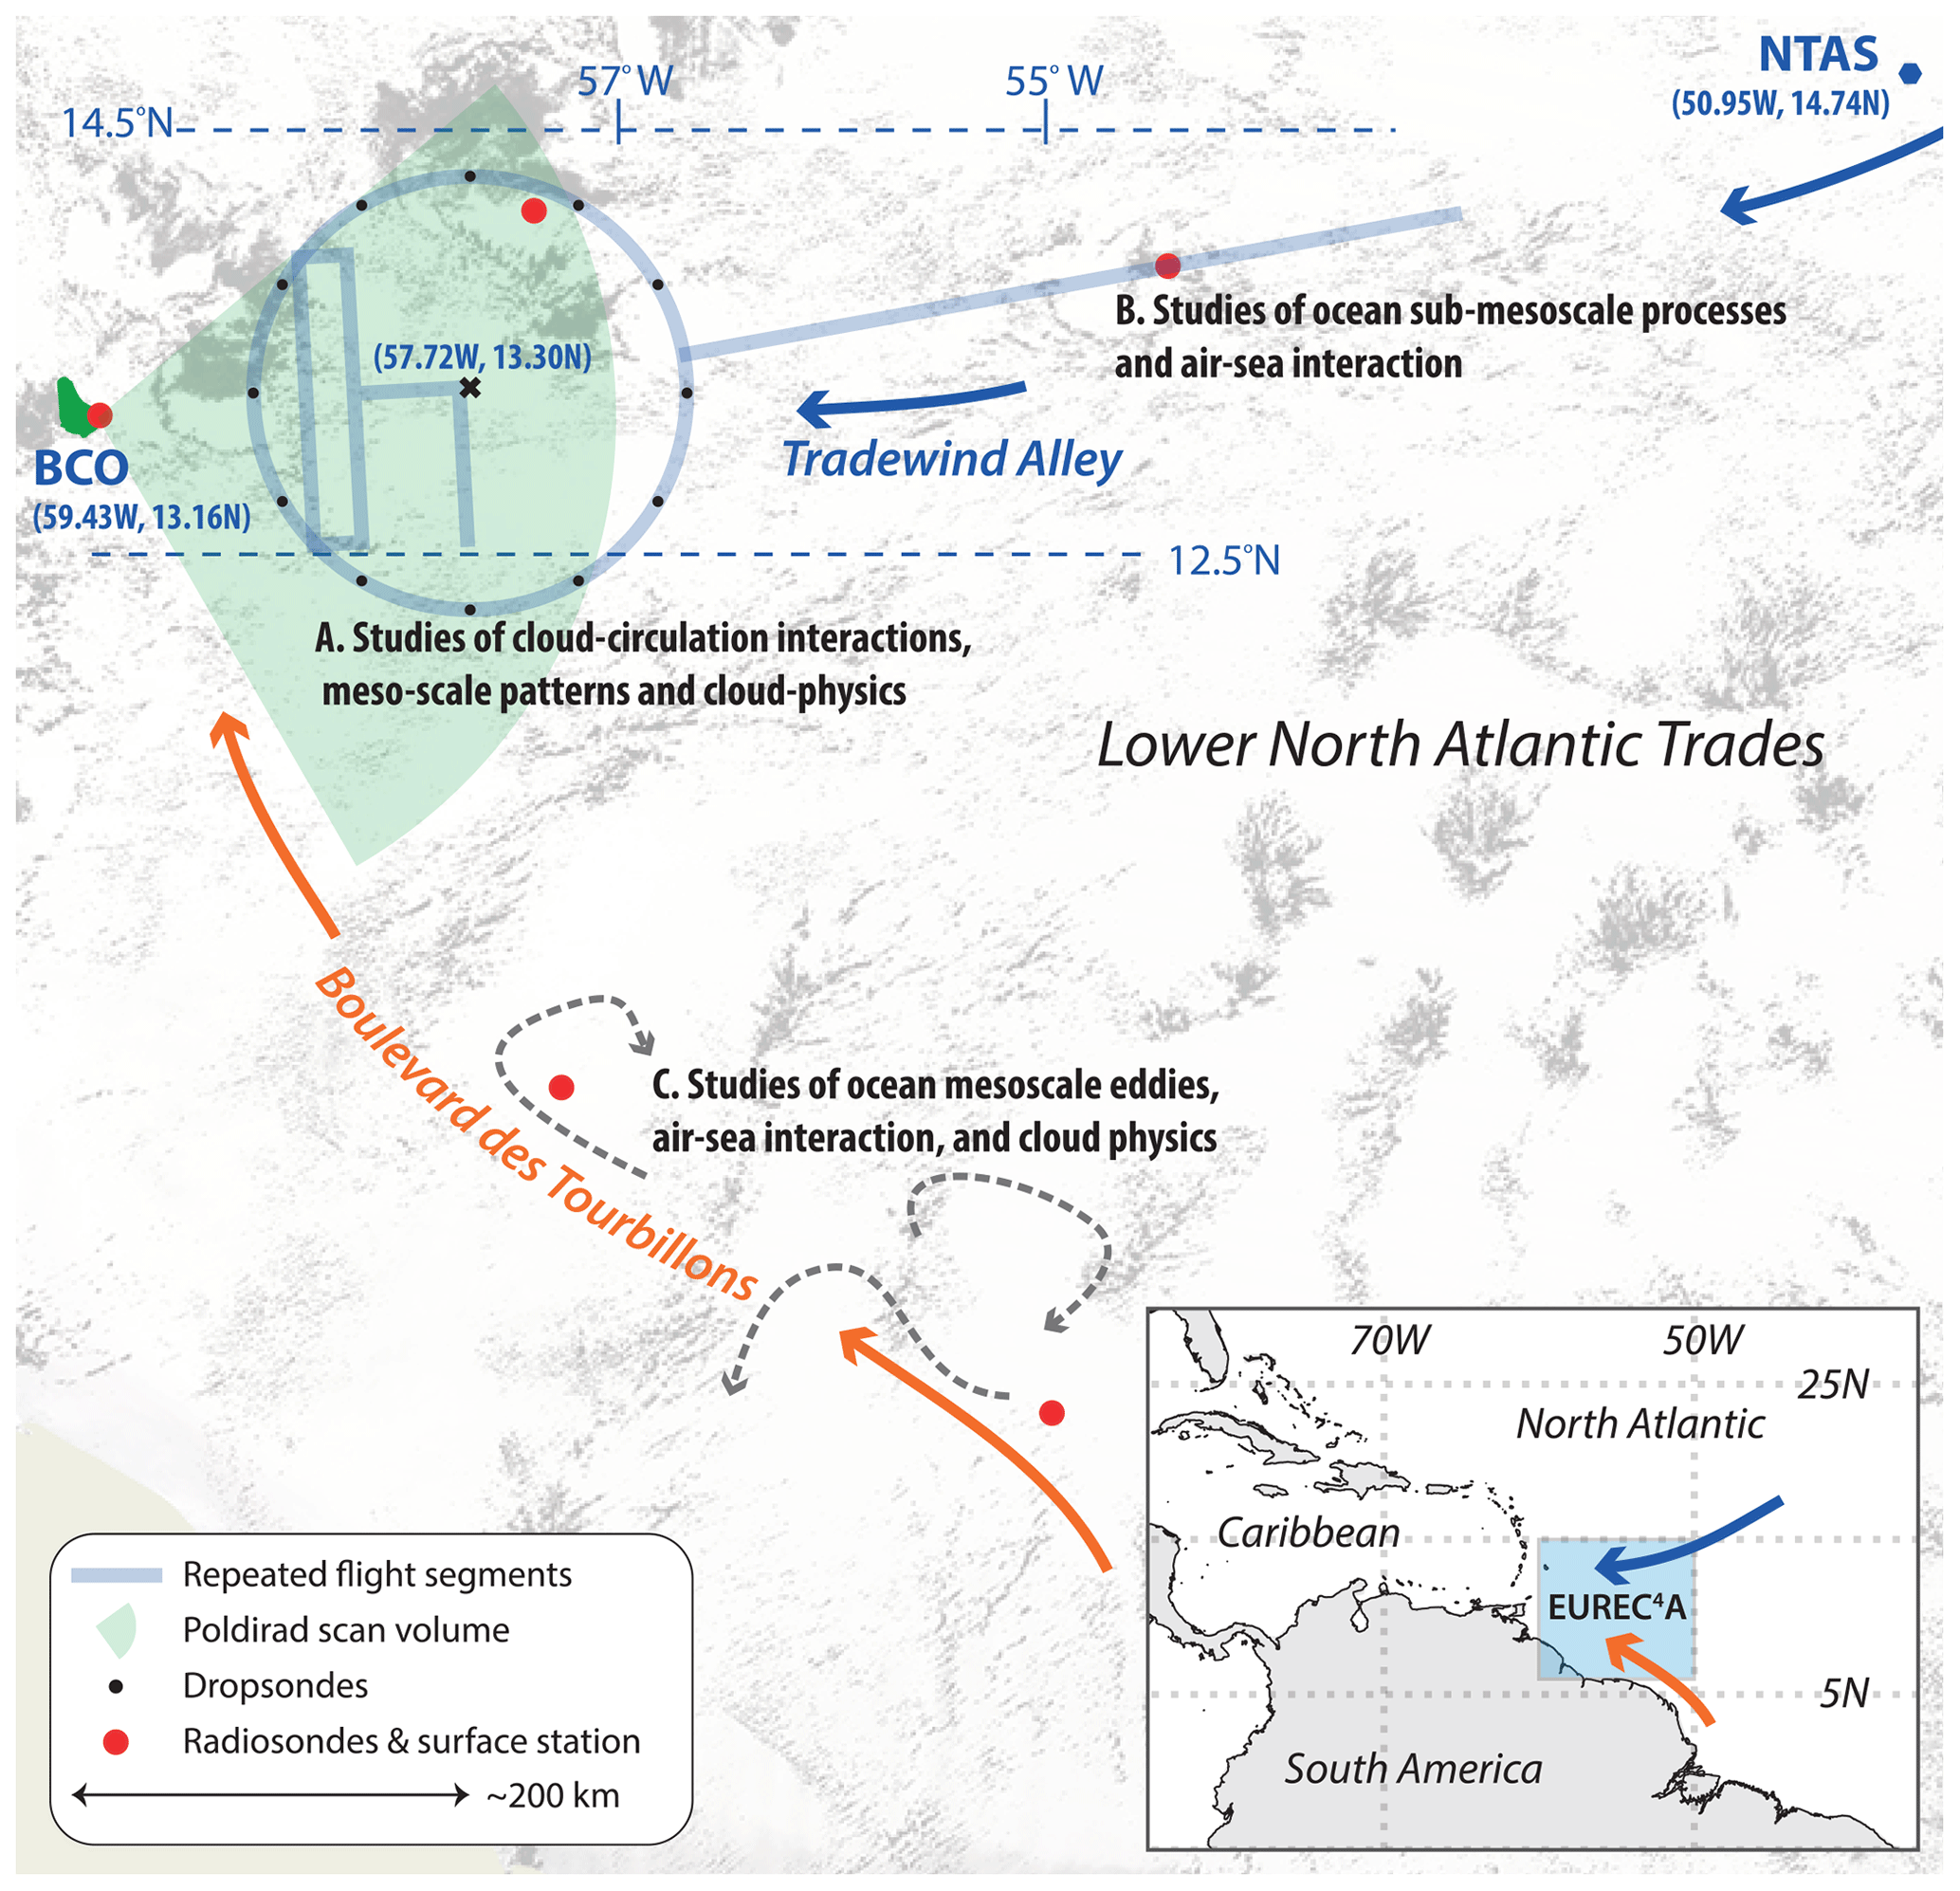
Figure 1The EUREC4A study area in the lower trades of the North Atlantic. The zonally oriented band following the direction of the trades between the Northwest Tropical Atlantic Station (NTAS) and the Barbados Cloud Observatory (BCO) is called Tradewind Alley. It encompasses study areas A and B. The “EUREC4A-Circle” is defined by the circular airborne sounding array centered at 13.3∘ N, 57.7∘ W. A third study area (C) followed the southeast-to-northwest meanders of what we called the Boulevard des Tourbillons. The background shows a negative of the cloud field taken from the 5 February 2020 MODIS-Terra (ca. 14:30 UTC) overpass.
Addressing these additional questions required a substantial expansion of the activities initially planned by the Barbadian–French–German partnership that initiated EUREC4A. This was accomplished through a union of projects led by additional investigators. For instance, EUREC4A-UK (a UK project) brought a Twin Otter (TO for short) and ground-based facilities for aerosol measurements to advance cloud physics studies; EUREC4A-OA secured the service of two additional research vessels (the R/V L'Atalante and the R/V Maria Sibylla Merian) and various ocean-observing platforms to study ocean processes; and the Atlantic Tradewind Ocean–Atmosphere Mesoscale Interaction Campaign (ATOMIC) brought an additional research vessel (the R/V Ronald H. Brown), assorted autonomous systems, and the WP-3D Orion, “Miss Piggy”, to help augment studies of air–sea and aerosol–cloud interactions. Additionally, nationally funded projects supported a large-scale sounding array, the installation of a scanning precipitation radar, the deployment of shipborne kite-stabilized helium balloons (CloudKites), a network of water stable isotopologue measurements, and a rich assortment of uncrewed aerial and seagoing systems, among them fixed-wing aircraft, quadcopters, drifters, buoys, underwater gliders, and Saildrones. Support within the region helped link activities to operational initiatives, such as a training program for forecasters, and fund scientific participation from around the Caribbean. The additional measurement platforms considerably increased EUREC4A's scientific scope and geographic footprint, as summarized in Fig. 1.
This article describes EUREC4A in terms of seven different facets as outlined above. To give structure to such a vast undertaking, we focus on EUREC4A's novel aspects but strive to describe these in a way that also informs and guides the use of EUREC4A data by those who did not have the good fortune to share in their collection. The presentation (Sect. 3) of these seven facets is framed by an overview of the general setting of the campaign in Sect. 2, as well as a discussion of more peripheral, but still important, aspects such as data access, good scientific practice, and the environmental impact of our activities in Sect. 4.
EUREC4A deployed a wide diversity of measurement platforms over two theaters of action: the “Tradewind Alley” and the “Boulevard des Tourbillons”, as illustrated schematically in Fig. 1. Tradewind Alley comprised an extended corridor with its downwind terminus defined by the BCO and extending upwind to the Northwest Tropical Atlantic Station (NTAS, 15∘ N, 51∘ W), an advanced open-ocean mooring (Weller, 2018; Bigorre and Plueddemann, 2020) that has been operated continuously since 2001. Measurements aimed at addressing the initial objectives of EUREC4A were situated near the western end of the corridor, within the range of low-level scans of a C-band radar installed on Barbados. The area of overlap between the radar and the (∼200 km diameter) EUREC4A-Circle (marked A in Fig. 1) defined a region of intensive measurements in support of studies of cloud–circulation interactions, cloud physics, and factors influencing the mesoscale patterning of clouds. Additional measurements between the NTAS and 55∘ W (Region B in Fig. 1) supported studies of air–sea interaction and provided complementary measurements of the upwind environment, including a characterization of its clouds and aerosols.
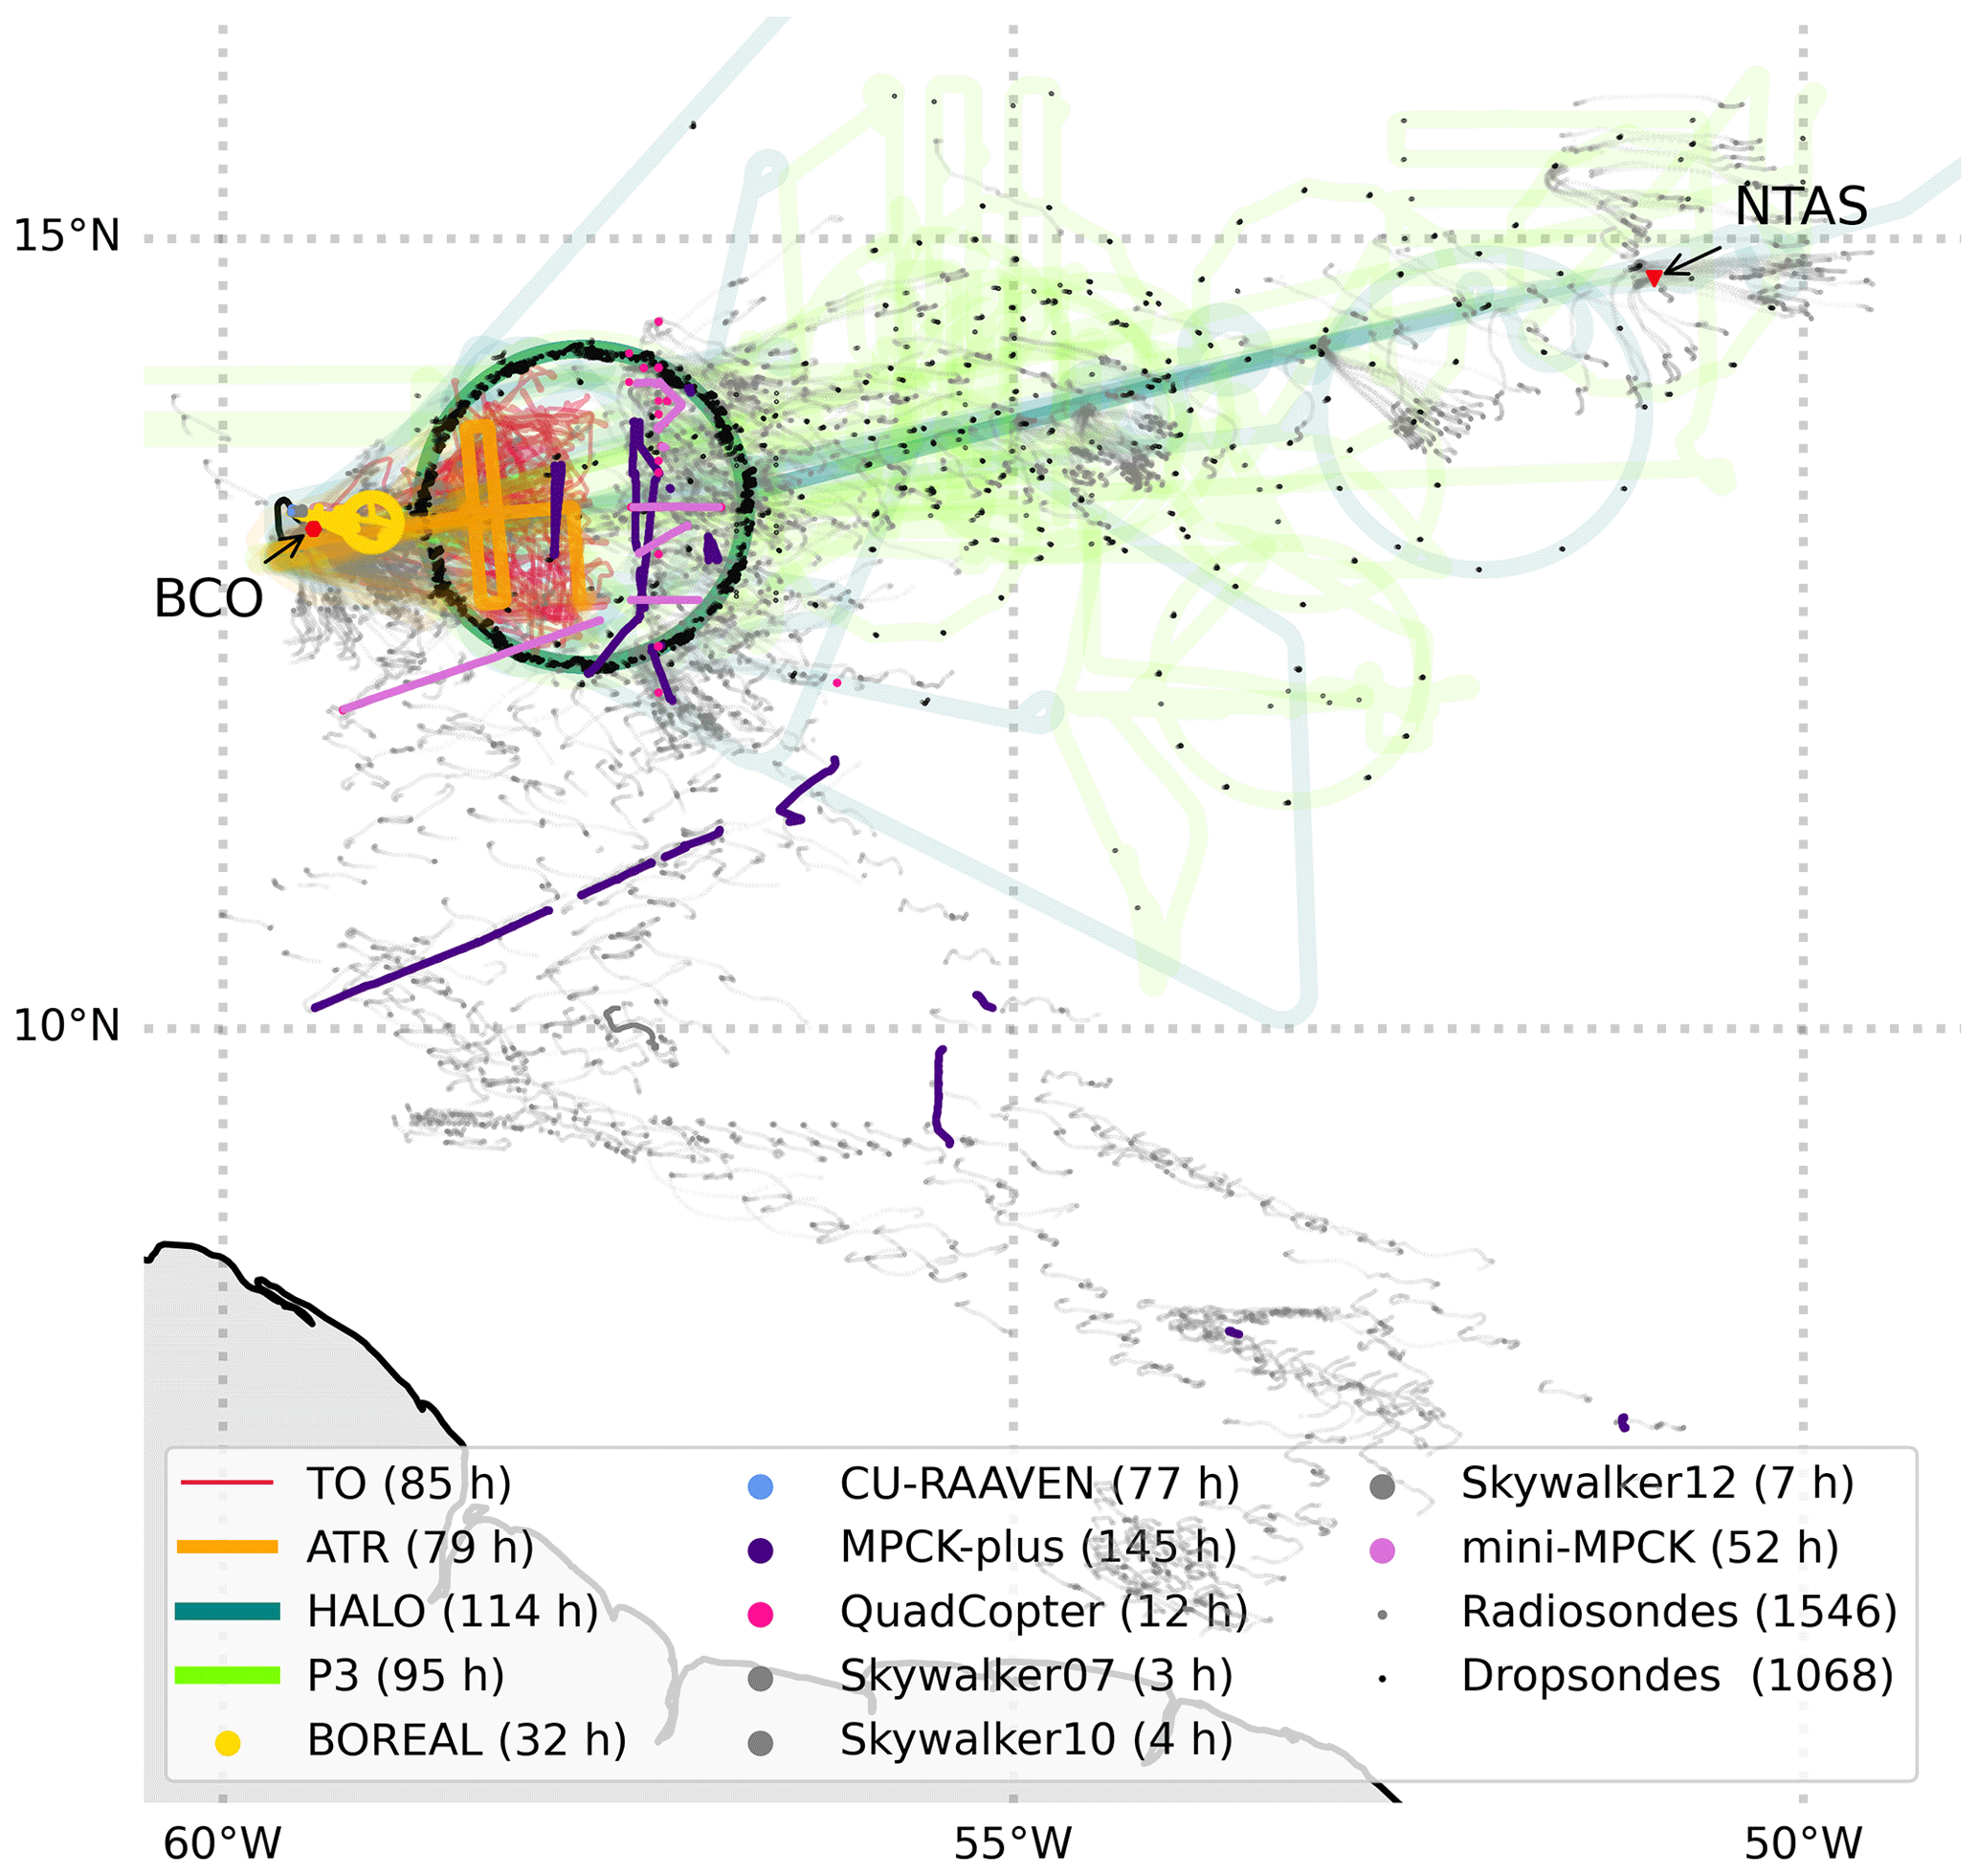
Figure 2Heat map showing distribution of airborne-platform tracks, colored (with transparency) by platform. Sonde trajectories are shown by trail of dots, with the slower ascent of the radiosondes leading to greater horizontal displacements leading to tracks resembling gray whiskers. The legend includes the flight time (defined as the period spent east of 59∘ W and west of 45∘ W to exclude ferries) and number of soundings. Radiosondes ascents and descents with valid data are treated as independent.
The Boulevard des Tourbillons describes the geographic region that hosted intensive measurements to study how air–sea interaction is influenced by mesoscale eddies, sub-mesoscale fronts, and filaments in the ocean (Region C in Fig. 1). Large (ca. 300 km) warm eddies – which migrate northwestward and often envelope Barbados, advecting large freshwater filaments stripped from the shore of South America – created a laboratory well suited to this purpose. These eddies, known as North Brazil Current (NBC) rings, form when the retroflecting NBC pinches off around 7∘ N. Characterizing these eddies further offered the possibility to expand the upper-air network of radiosondes and to make contrasting cloud measurements in a potentially different large-scale environment. This situation led EUREC4A to develop its measurements following the path of the NBC rings toward Barbados from their place of formation near the point of the NBC retroflection, with a center of action near Region C in Fig. 1. Measurements in the Boulevard des Tourbillons extended the upper-air measurement network and provided cloud measurements to contrast with similar measurements being made in Tradewind Alley.
2.1 Platforms for measuring the lower atmosphere
Aerial measurements were made by research aircraft, uncrewed (i.e., remotely piloted) aerial systems (UASs), and from balloon- or parachute-borne soundings. These were mostly distributed along Tradewind Alley. Figure 2 shows the realization of the EUREC4A strategy: the EUREC4A-Circle (teal) and box L (orange) stand out, indicative of the number of times HALO and the ATR flew these patterns. The very large number of dropsondes deployed by HALO (black dots) gives further emphasis to the EUREC4A-Circle. Excursions by HALO and flights by the P-3 extended the area of measurements upwind toward the NTAS. The TO intensively sampled clouds in the area of ATR operations in the western half of the EUREC4A-Circle. UASs provided extensive measurements of the lower atmosphere, mostly in the area between the EUREC4A-Circle and Barbados. Due to their limited range many (Skywalkers, CU-RAAVEN, and quadcopter) only appear as dots on Fig. 2.
Different clusters of radiosonde soundings (evident as short traces, or whiskers, of gray dots) can also be discerned in Fig. 2. Those soundings originating from the BCO (342) and from the R/V Meteor (362) were launched from relatively fixed positions, with the R/V Meteor operating between 12.5 and 14.5∘ N along the 57.25∘ W meridian. East of the EUREC4A-Circle, sondes were launched by the R/V Ronald H. Brown (Ron Brown), which mostly measured air masses in coordination with the P-3 measurements between the NTAS and the EUREC4A-Circle. The R/V Maria Sibylla Merian (MS-Merian) and R/V L'Atalante (Atalante) combined to launch 424 sondes in total, as they worked water masses up and down the Boulevard. For most sondes, measurements were recorded for both the ascent and descent, with descending sondes falling by parachute for all platforms except the R/V Ron Brown. The synoptic environment encountered during EUREC4A, the radiosonde measurement strategy, and an analysis of the sonde data are described in more detail by Stephan et al. (2021).
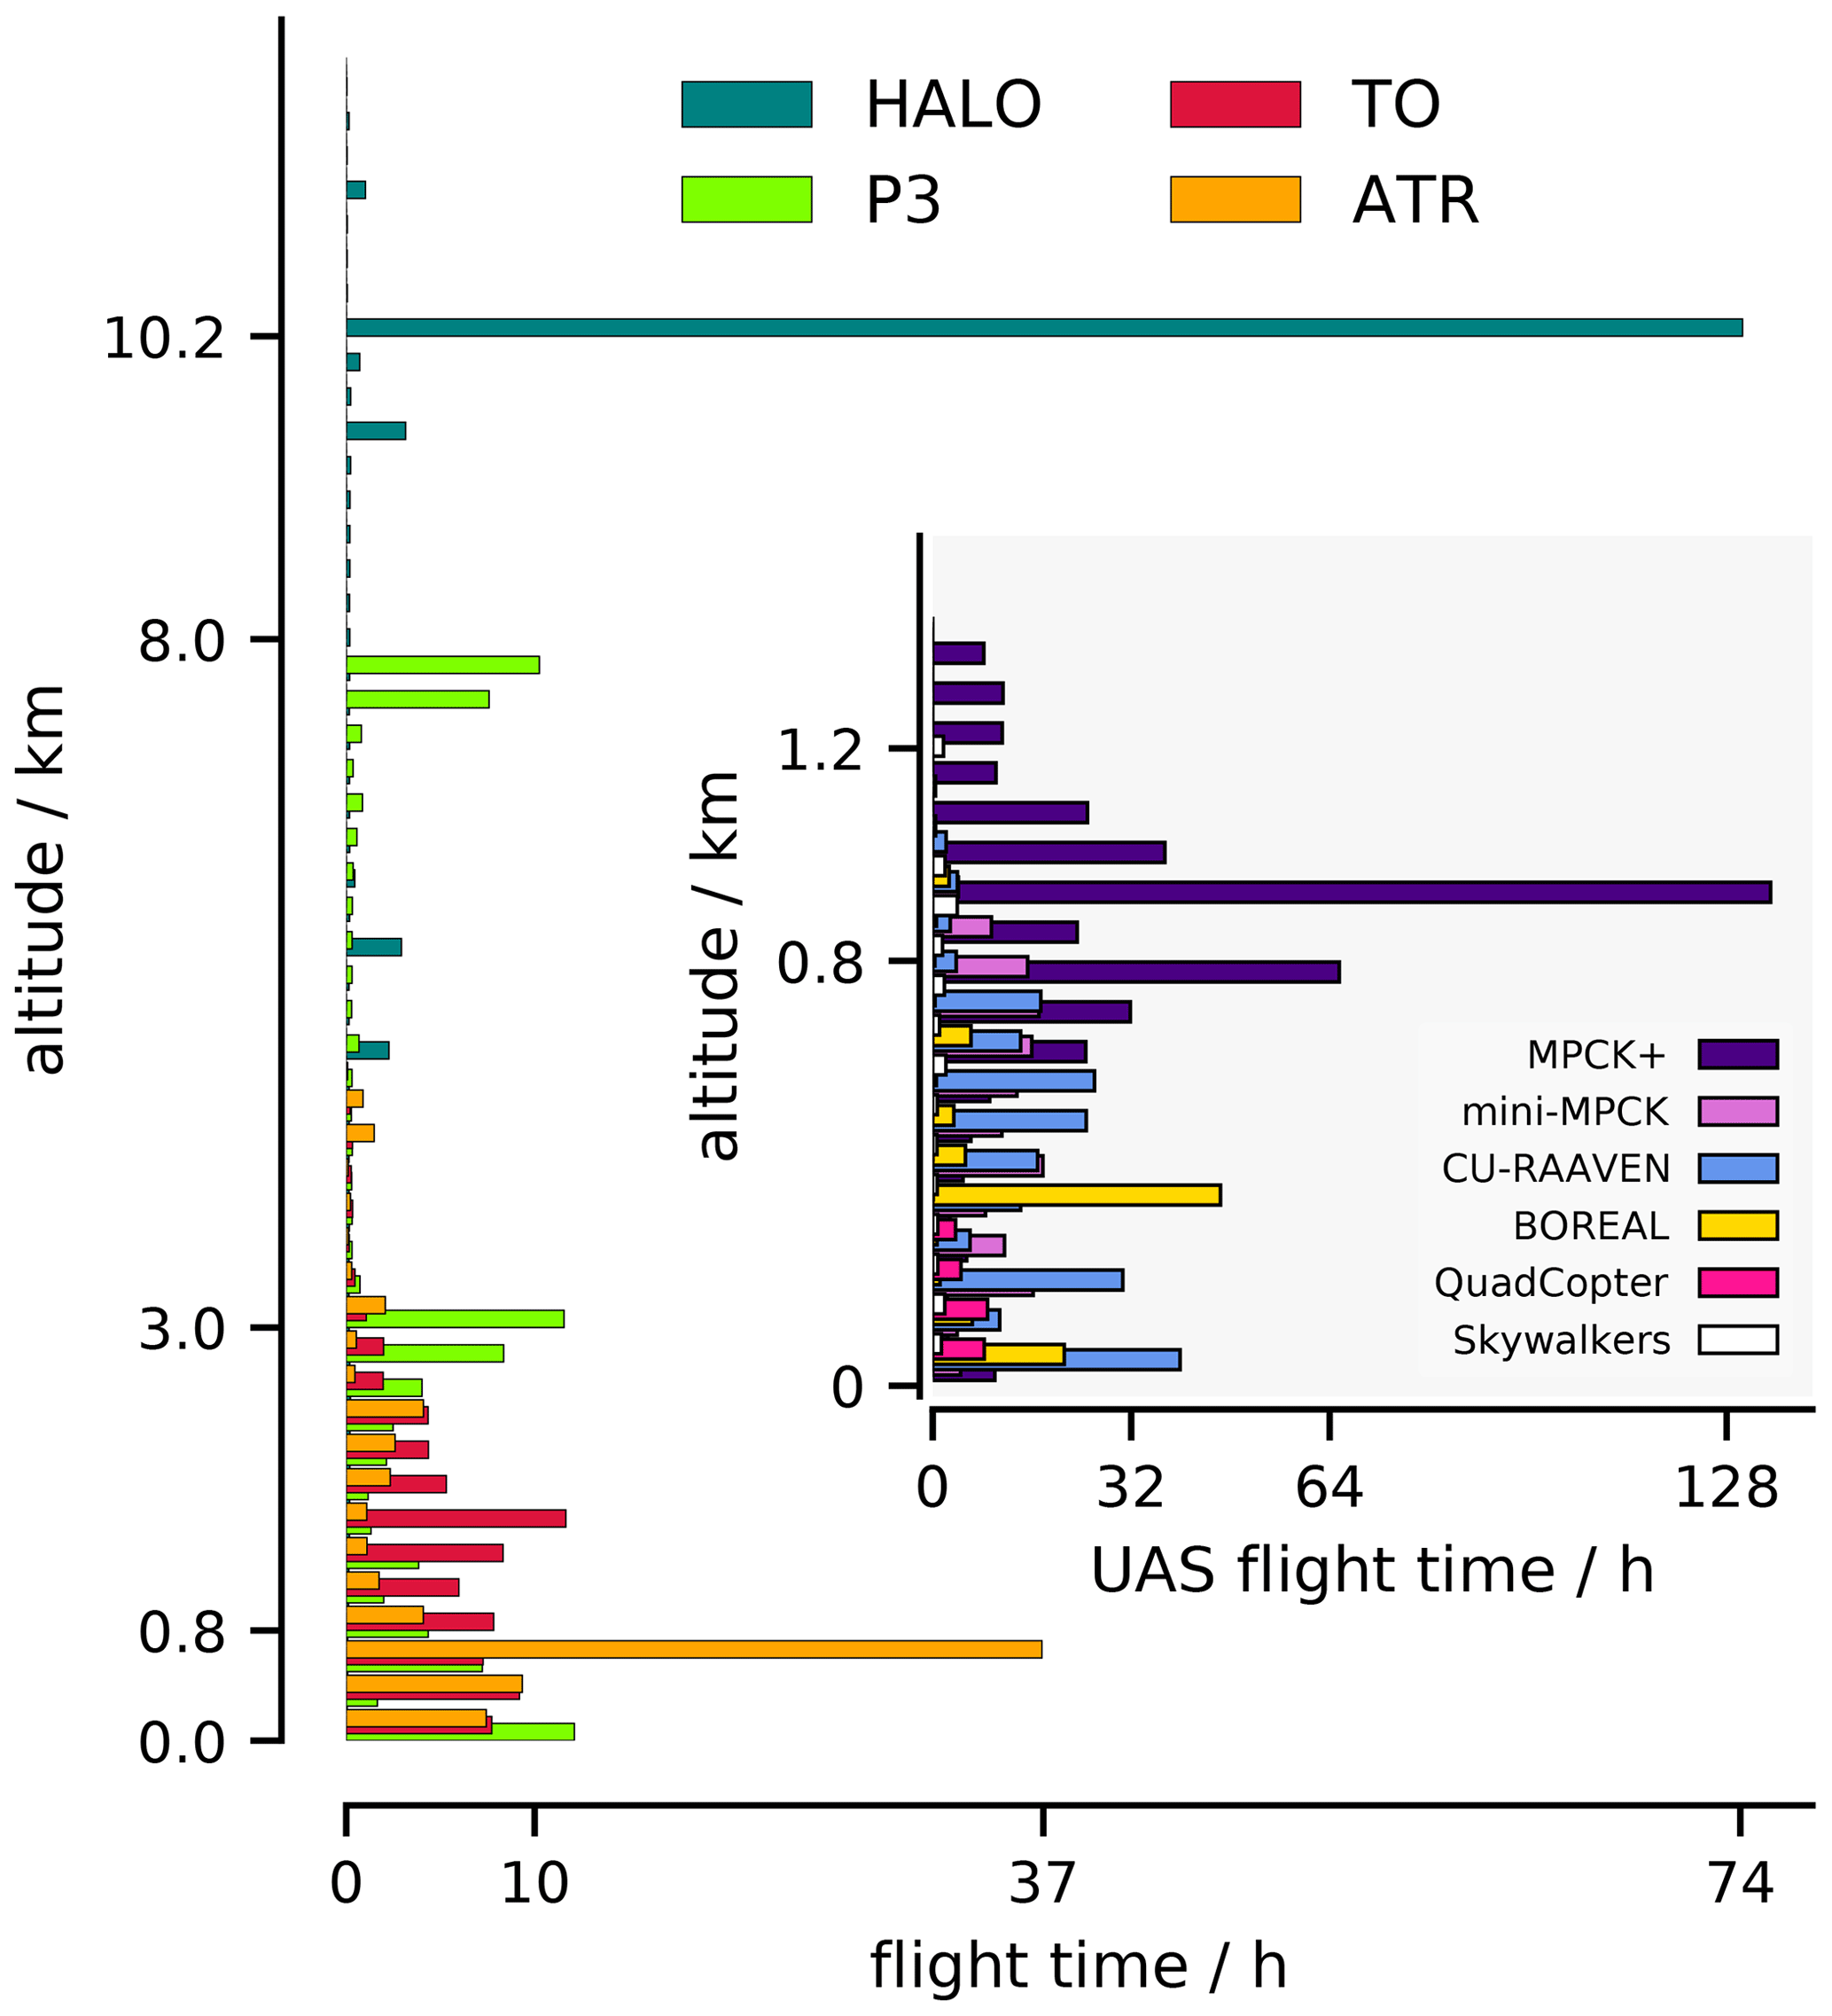
Figure 3Flight time spent at different altitudes by different airborne platforms. Uncrewed aerial systems (UASs) shown in inset.
HALO, the ATR, and most of the UASs emphasized statistical sampling. Hence flight plans did not target specific conditions, except to adjust the ATR flight levels relative to the height of the sub-cloud layer – but this varied relatively little. During planned excursions from its circling flight pattern, HALO also positioned its track for satellite overpasses – one by MISR (5 February 2021) and another by the core GPM satellite (11 February 2020). Measurements from the MPCK+ (a large CloudKite tethered to the R/V MS-Merian) emphasized the lower cloud layer, selecting conditions when clouds seemed favorable. The mini-MPCK was used more for profiling the boundary layer and the cloud-base region and was deployed when conditions allowed. The Twin Otter targeted cloud fields, often flying repeated samples through cloud clusters identified visibly, but also sampled the sub-cloud layer. The P-3 strategy was more mixed; some flights targeted specific conditions, and others were more statistically oriented (for example, to fill gaps in the HALO and ATR sampling strategy). The different sampling strategies are reflected in Fig. 3, where the measurements of HALO are concentrated near 10.2 km and those of the ATR at about 800 m, with relative uniform sampling of the trade wind moist layer by the Twin Otter. Figure 3 also shows the strong emphasis on sampling the lower atmosphere, with relatively uniform coverage of the lower 3 km. Except for the Twin Otter, which was limited to daytime operations, takeoff and landing times of the aircraft were staggered, with three night flights by the P-3, to better sample the diurnal cycle. Data papers for the individual platforms are being prepared and will describe their activities in greater detail.
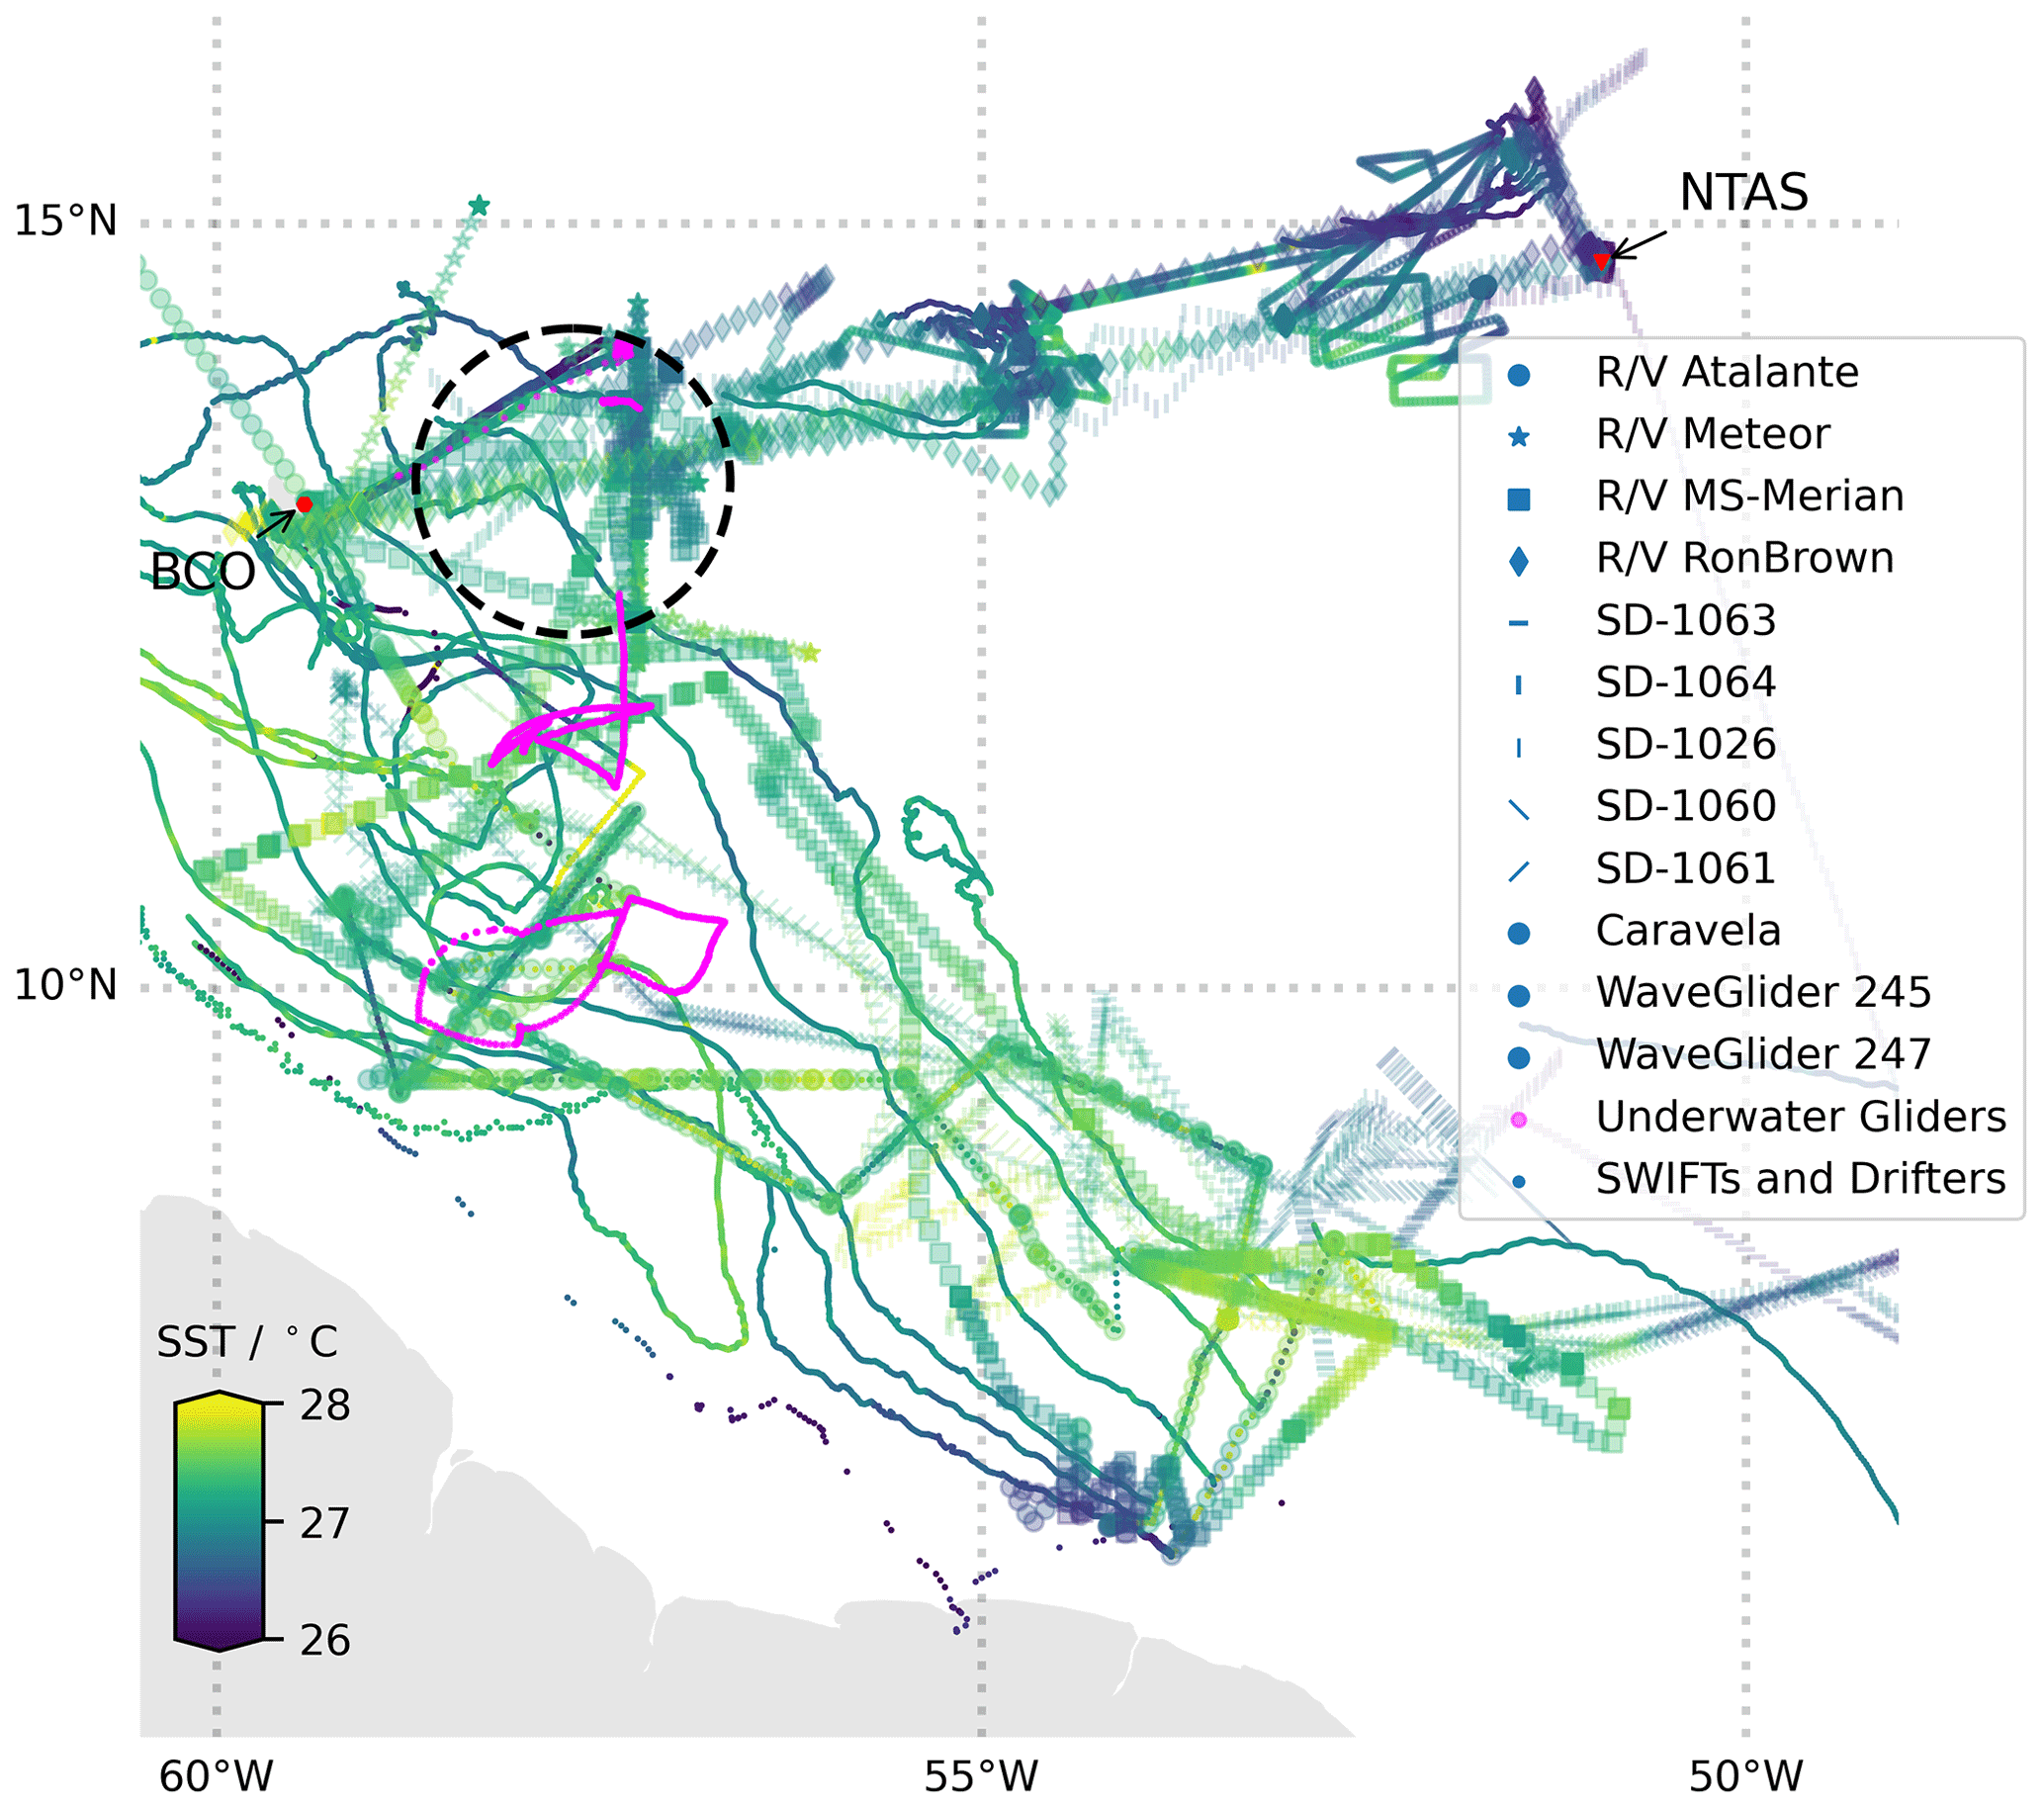
Figure 4Map showing surface- and subsurface-platform trajectories, colored by (uncalibrated) near-surface water temperature for platforms with near-surface measurements.
2.2 Airborne platforms for measuring the upper ocean and air–sea interface
Four global-class research vessels – all equipped with surface meteorological measurements and underway temperature/salinity sampling devices – and scores of autonomous ocean-observing platforms (AOOPs) were deployed along Tradewind Alley and the Boulevard des Tourbillons. The tracks of the surface vessels are shown in Fig. 4. These tracks, colored by measurements of the near-surface water temperature, show slightly more variability in water temperatures along the Boulevard des Tourbillons, in contrast with more steady westward warming of surface temperatures following the trades along Tradewind Alley. The more dynamic situation along the Boulevard des Tourbillons, as compared to the situation on the Tradewind Alley, required a different measurement strategy. For the former, research vessels actively tracked and surveyed mesoscale features, and for the latter the sampling was more statistical so as to better support the airborne measurements and cloud characterization.
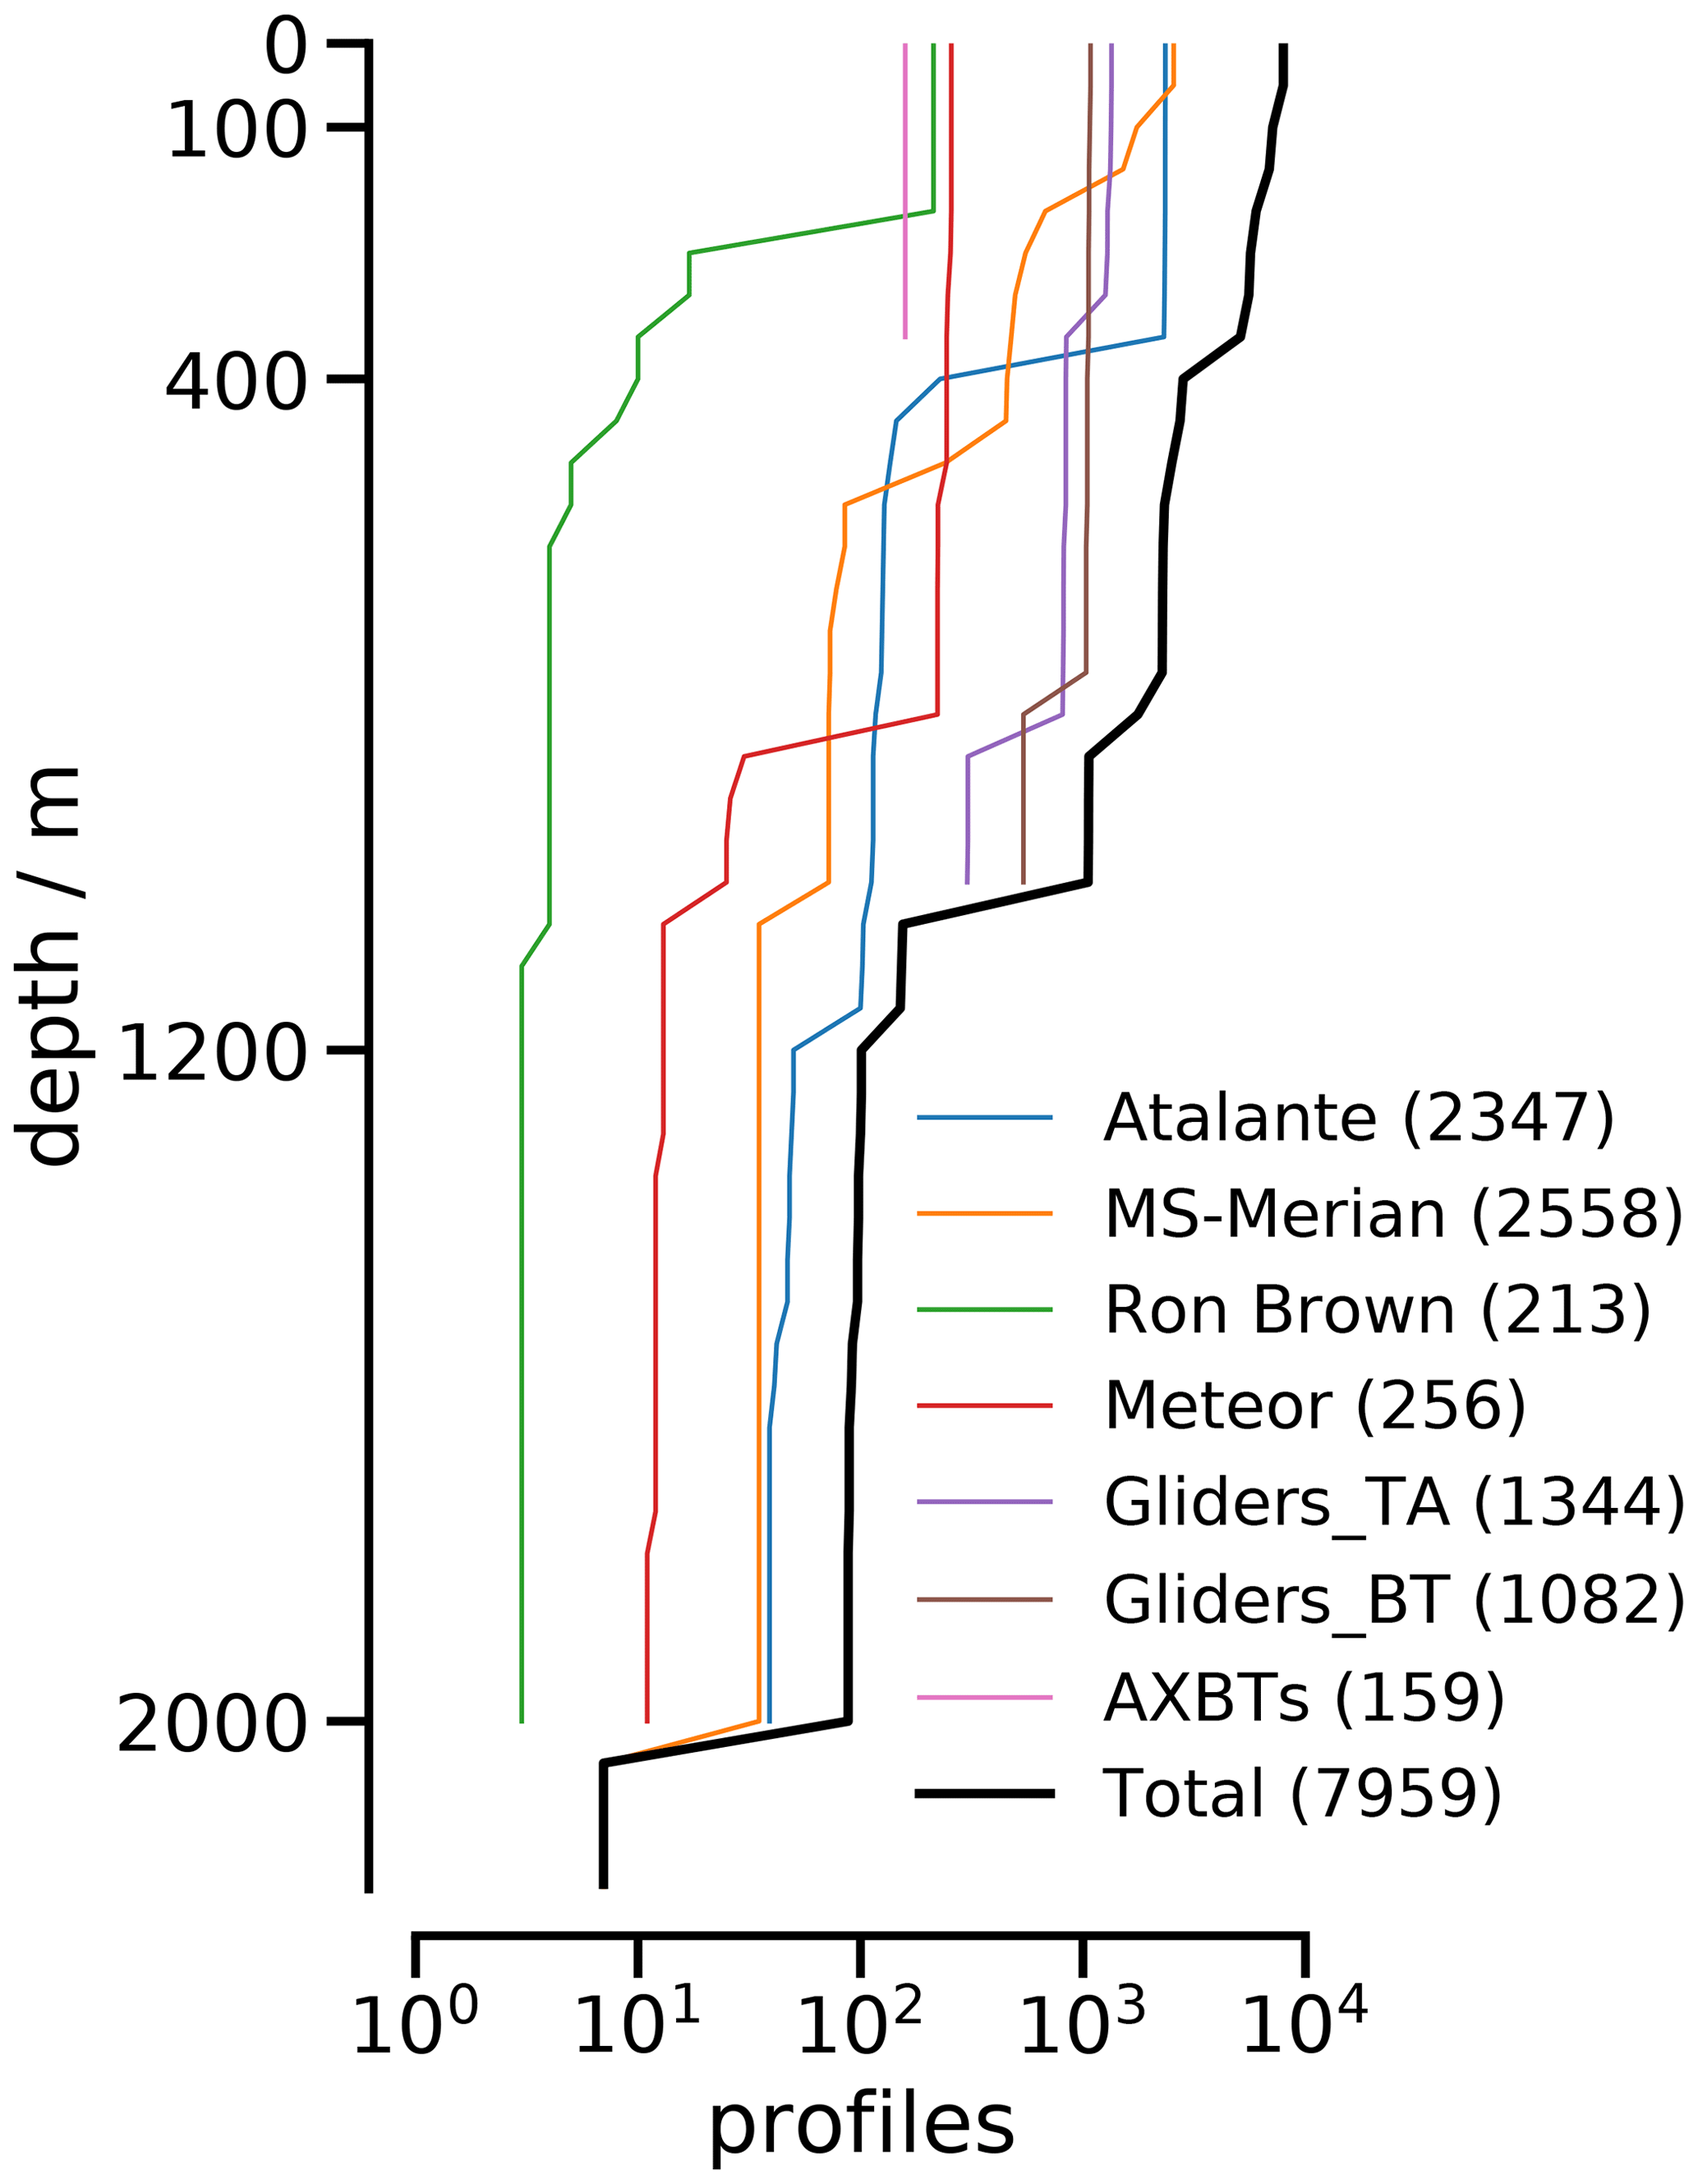
Figure 5Number of profiles sampling seawater properties at the indicated depth. Ship-based profiling is from CTD casts, underway CTDs, XBTs, and moving vessel profilers. AXBTs were dropped by the P-3.
Along Tradewind Alley, the R/V Meteor mostly worked along the line of longitude at 57.25∘ W between 12.4 and 14.2∘ N. The R/V Ron Brown, coordinating its measurements with the P-3, was stationed between the NTAS and the MOVE3 moorings in January and in the region upwind of the EUREC4A-Circle, near 55∘ W in February. For both positions, SWIFT buoys were deployed and recovered in coordination with P-3 airborne expendable bathythermograph (AXBT) soundings. A Saildrone, two Wave Gliders, an AutoNaut (Caravela), four underwater gliders, and extensive conductivity–temperature–depth (CTD) casts from the two ships profiled the upper ocean Fig. 5.
Along the Boulevard des Tourbillons the R/V MS-Merian and the R/V Atalante studied the meso- and submesoscale dynamics. Both research vessels extensively profiled the ocean's upper kilometer using a wide assortment of instruments, including underway CTDs, moving vessel profilers, vertical microstructure profilers (VMP and MSS), expendable bathythermographs (XBTs), and expendable CTDs (XCTDs). Three ocean gliders (one SeaExplorer and two Slocum electric gliders) provided dense sampling (more than 1300 profiles, most to at least 700 m, Fig. 5) of subsurface structures associated with mesoscale eddies. Of the roughly 8000 upper-ocean profiles performed during EUREC4A, nearly three-fourths were performed in coordination with the eddy sampling along the Boulevard des Tourbillons. Four Saildrones, 22 drifters and four deployments of two air–sea fluxes observing prototypes, OCARINA and PICCOLO, substantially expanded the observations at the ocean–atmosphere interface. Five Argo floats equipped with a dissolved-oxygen sensor were deployed to allow a Lagrangian monitoring of the ocean surface and subsurface dynamics during and after the campaign.
To effectively survey features in the active waters of the Boulevard des Tourbillons, the sampling strategy and cruise plan were assessed daily, using information from the previous day's measurements, updates from satellite products, weather forecasts, and ocean predictions. Tailored satellite products and model predictions were provided by a variety of groups4 to help track and follow surface features in near real time.
2.3 Instrument clusters
EUREC4A set itself apart from past field studies both through new types of measurements, as performed by individual platforms, but also through the quantity or clustering of certain instruments. Instrument clustering means using similar instruments across a number of platforms so as to improve the statistical characterization of air masses and their evolution. The ability to make such measurements enables estimates of systematic and random measurement errors, giving rise to a different quality of measurement as compared to those made previously, especially in marine environments. Examples are described below and include the use of remote sensing, instruments for measuring stable water isotopologues, and drones. A platform-by-platform listing of the EUREC4A instrumentation is provided in Appendix B.
2.3.1 Remote sensing
EUREC4A included eight cloud-sensitive Doppler (W- and Ka-band) radars. Four zenith-staring instruments were installed at surface sites (BCO, R/V MS-Merian, R/V Meteor, and R/V Ron Brown) and three on aircraft (nadir, zenith on the ATR, HALO, and the P-3). The ATR flew a second, horizontally staring, Doppler system. Two scanning radars (a C-band system installed on Barbados and a P-3 X-band tail radar) and three profiling rain radars (one at the BCO, another at the Caribbean Institute for Meteorology and Hydrology (CIMH), and a third on the R/V MS-Merian) measured precipitation. The R/V MS-Merian additionally had an X-Band radar installed for wave characteristics and surface currents over a roughly 2 km footprint around the ship. Fourteen lidars were operated, four of which were advanced (high-spectral-resolution, multi-wavelength) Raman or DIAL (differential absorption lidar) systems for profiling water vapor and aerosol/cloud properties. The Raman systems (at the BCO, on the R/V MS-Merian, and on the R/V Meteor) were upward-staring surface-mounted systems, and the DIAL aboard HALO operated in a nadir-staring mode (Wirth et al., 2009). On the ATR a backscatter UV lidar operated alongside the horizontally staring radar, looking horizontally to provide an innovative planform view of cloudiness near cloud base. In total, six wind lidars and three ceilometers were operated from the BCO and all research vessels except for the R/V Atalante. As an example of the sensor synergy arising from the multitude of sensors, Fig. 6 shows water vapor flux profiles (Behrendt et al., 2020) estimated from co-located vertically staring Doppler wind lidar and Raman (water vapor) lidar measurements from the ARTHUS system (Lange et al., 2019) aboard the R/V MS-Merian. This type of measurement strategy, employing a dense network of remote sensors to both improve sampling and realize synergies, is increasingly emphasized for land–atmosphere interaction studies (e.g., Wulfmeyer et al., 2018), but it is more difficult to realize, and thus uncommon, over the ocean.

Figure 6Vertical latent-heat (vaporization enthalpy) flux as a function of time and height above the platform as measured from the combination of water vapor Raman lidar (ARTHUS) and Doppler wind lidar aboard the R/V MS-Merian. The mean value over the 3 d period is 100 W m−2 at 200 m, and the fluxes are positive throughout the sub-cloud layer.
More standard, but still unprecedented by virtue of its space–time–frequency coverage, was the contribution of airborne, surface, and space-based passive remote sensing to EUREC4A. Three 14-channel microwave radiometers operated from surface platforms, and a 25 channel nadir-staring system operated from HALO (Mech et al., 2014; Schnitt et al., 2017). Handheld sun-photometer measurements were made on all four research vessels, and an automated system operated from Ragged Point, near the BCO, provided additional constraints on estimates of aerosol loading (from lidars) and column water vapor (from radiometers). Infrared radiometers for measuring the surface skin temperature were operated on the ATR, HALO, the R/V Ron Brown, the BOREAL, and CU-RAAVEN UASs, as well as on the five Saildrones. For estimating fluxes of radiant energy, broadband longwave and shortwave radiometers were installed on three of the airborne (zenith and nadir) and surface (zenith) platforms. In addition, HALO and the R/V Meteor hosted high-spectral-resolution systems measuring shortwave and near-infrared down- and upwelling radiances (Wendisch et al., 2001). Near-real-time geostationary GOES-East satellite imagery and cloud product retrievals between 19∘ N–5∘ S and 49–66∘ W were collected, with finer temporal resolution every minute (between 14 January and 14 February, with a few data gaps from diversions to support hazardous weather forecasting in other domains) archived over most of this domain. ASTER's high-resolution (15 m visible and near-infrared, and 90 m thermal) imager on board TERRA was activated between 7–17∘ N and 41–61∘ W. It recorded 412 images of 60 km × 60 km in 25 overpasses between 11 January and 15 February. These images are complemented by Sentinel-2 data with images at 10 m resolution in some visible–near-infrared bands and 20 m resolution in shortwave-infrared bands relevant for cloud microphysical retrievals.
The intensity of remote sensing instrumentation in the vicinity of the EUREC4A-Circle will support efforts to, for the first time, observationally close the column energy budget over the ocean, as well as efforts to test hypotheses that link precipitation to processes across very different time and space scales.
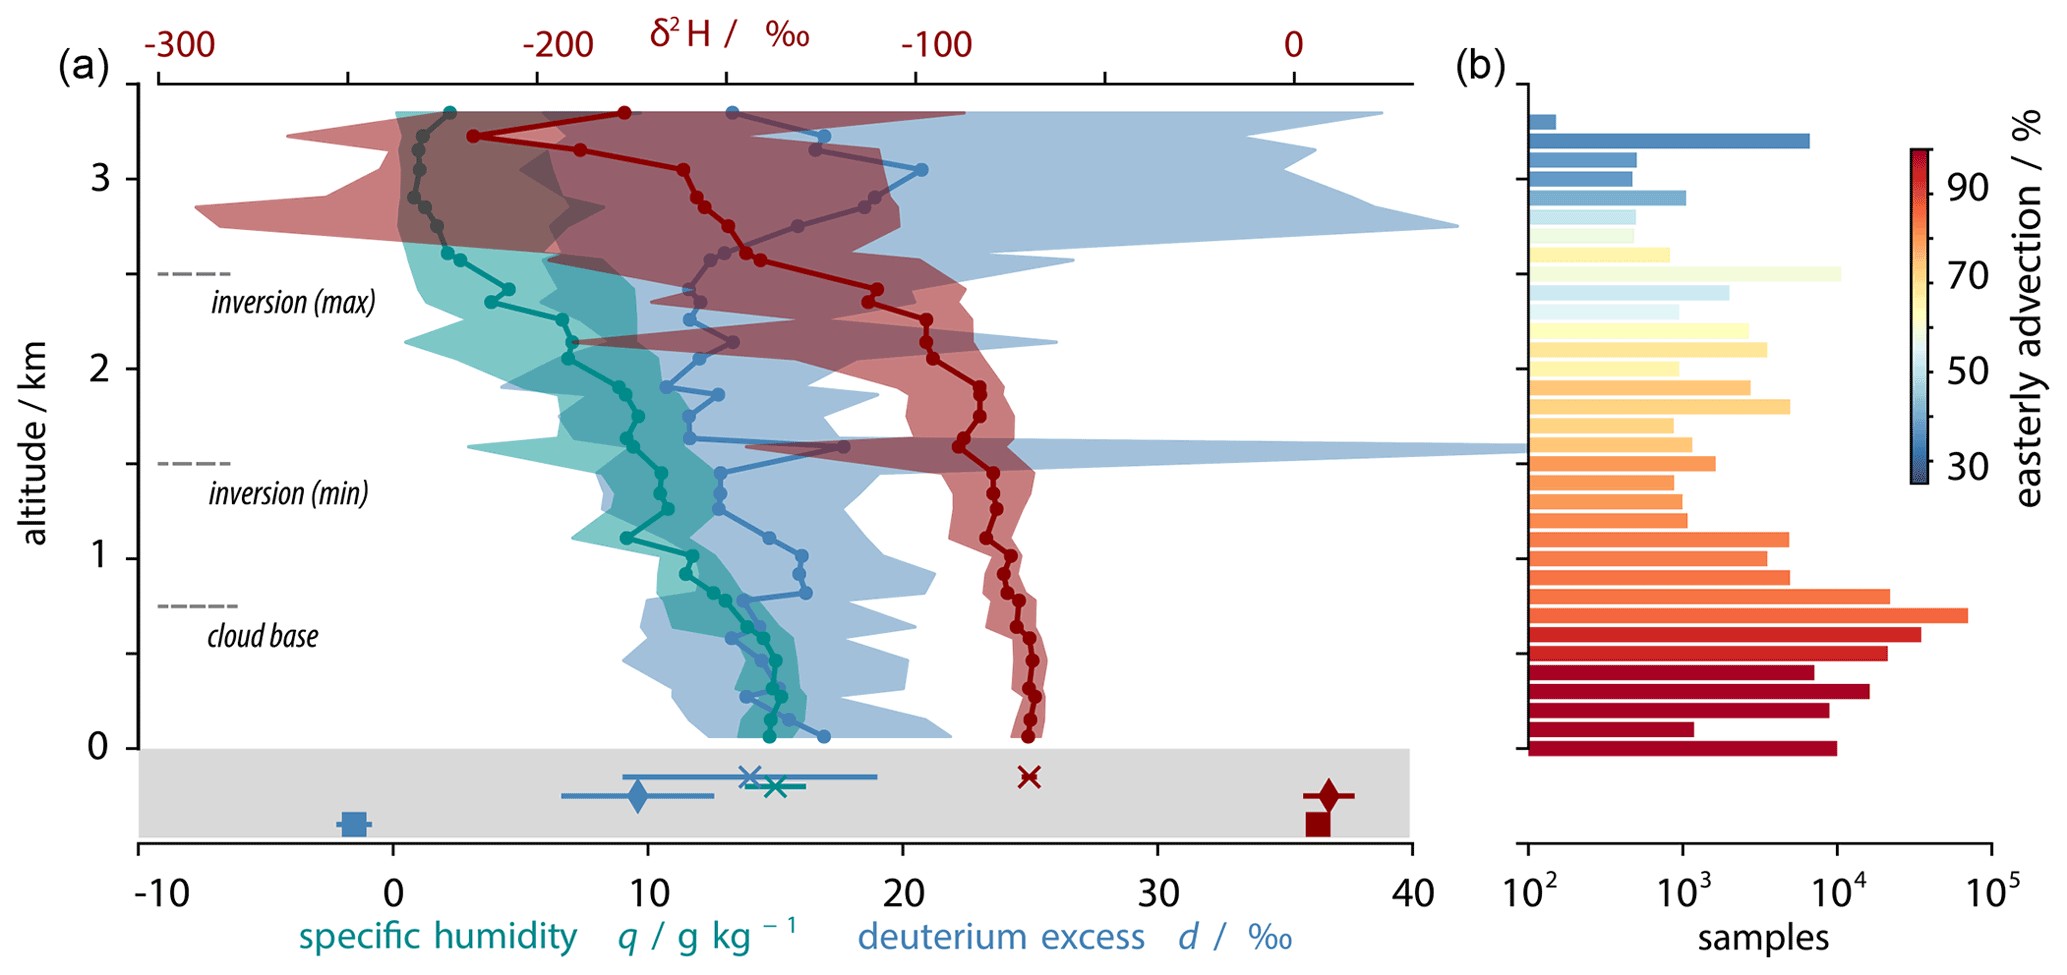
Figure 7Water stable isotopologues mass fractions (a) binned by altitude over all EUREC4A measurements, including samples from near-surface waters. Percent of measurements at each altitude (b) associated with winds from the east (45 to 135∘ from north).
2.3.2 Stable water isotopologues
EUREC4A benefited from an unusually complete and spatially extensive network of stable water isotopologue measurements (HO, HO, and HDO) distributed across multiple platforms. Seven laser spectrometers and five precipitation sampling systems especially designed to avoid post-sampling re-evaporation were deployed. At the BCO, two laser spectrometers provided robust high-frequency measurements of isotopologues in water vapor and 46 event-based precipitation samples were collected. Three ships – the R/V Atalante, the R/V Meteor, and the R/V Ron Brown – were similarly equipped and in addition collected ocean water samples (340 in total) from the underway water line and the CTDs. These samples have been analyzed in the laboratory together with 50 shipboard rainfall samples. Two of the high-frequency laser spectrometers were mounted on the ATR and P-3 to measure the vertical distribution of water isotopologues. The airborne measurements also added continuity, sampling air masses between the BCO and R/V Meteor stations and between the R/V Meteor and the upwind R/V Ron Brown. The measurements provided very good coverage through the lower (3 km) atmosphere. Air-parcel backward trajectories based on three-dimensional wind fields from the operational ECMWF analyses indicate that boundary layer air came almost exclusively from the east, with a more heterogeneous origin of air masses sampled above 2500 m (Fig. 7; see also Aemisegger et al., 2021). Large-scale context for the in situ measurements will be provided by retrievals of atmospheric HDO and HO from spaceborne instruments.
The size of the network of isotopologue measurements and the degree of coordination among the different measurement sites will enable investigations of the variability of the stable water isotopologues – in space and time, in ocean water, atmospheric vapor, and precipitation following the trades – that were previously not possible.
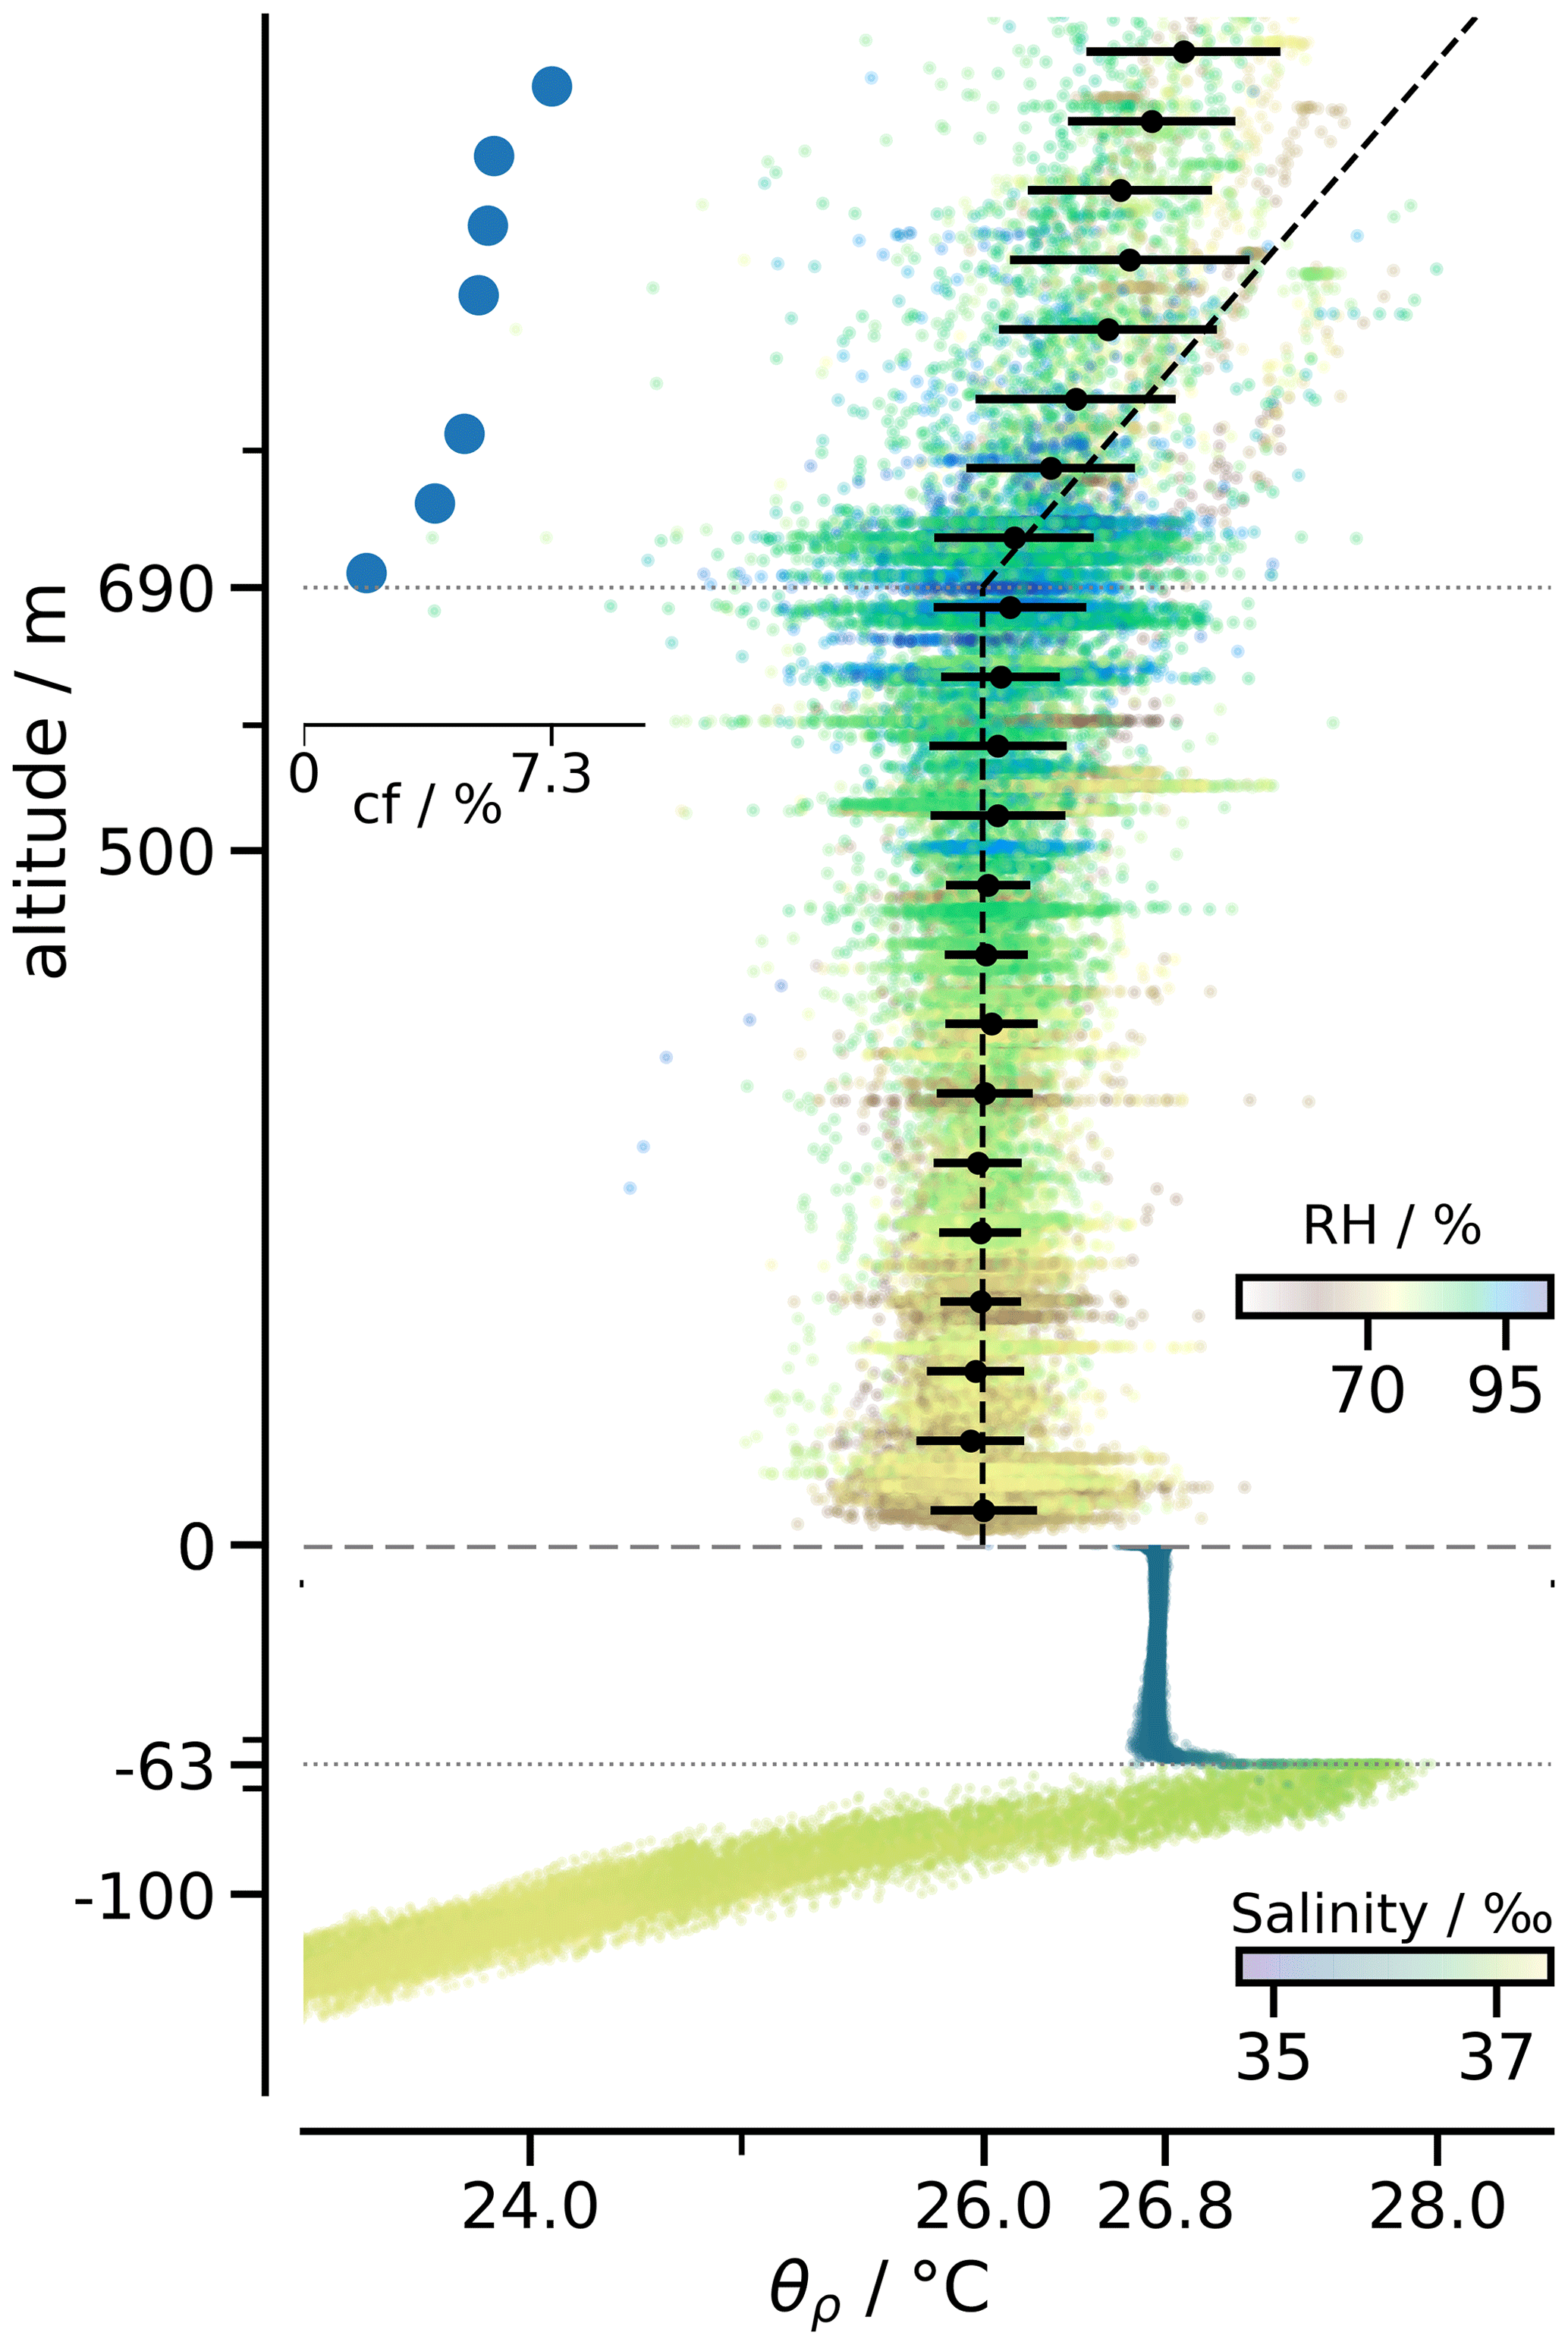
Figure 8Ocean and atmospheric boundary layer upwind of the BCO. Dots show CU-RAAVEN measurements of the density potential temperature vs. altitude, as well as underwater glider measurements of the temperature below the surface. Values are normalized to compensate for differences associated with either synoptic variations or from variations in the depth of the sampled planetary boundary layers. Blue dots show profile of cloud fraction from all MPCK profiles. The dashed (black) line marks the potential temperature of near-surface air isentropically lifted from the surface; the slope discontinuity at the lifting condensation level (690 m) marks the shift from an unsaturated to a saturated isentrope. The temperature difference between the sea surface and the lower atmosphere is taken from Saildrone data.
2.3.3 Drones and tethered platforms
A diversity of tethered and remotely piloted platforms provided measurements in the lower atmosphere and upper ocean. Many of these had been used in past field studies, but what set EUREC4A apart was its coordinated use of so many platforms. Five fixed-wing systems and a quadcopter provided approximately 200 h of open-ocean atmospheric profiling, while seven underwater gliders profiled the underlying ocean well over a thousand times, mostly between the surface and 700 m. Figure 8 presents measurements from one of the underwater gliders and the CU-RAAVEN – which along with the other fixed-wing systems (BOREAL and Skywalkers) was flown from Morgan Lewis Beach, a windward beach about 20 km north of the BCO. The measurements highlight the boundary layers on either side of the air–sea interface – one (in the atmosphere) extending to about 700 m and capped by a layer that is stably stratified with respect to unsaturated, but unstable with respect to saturated, convection. The typical ocean mixed layer was as impressively well mixed, but over a layer about 10 times shallower. Here the measurements document the peculiar situation of salinity maintaining the stratification that caps the downward growth of the ocean mixed layer. Ship-based measurements of the air–sea interface were greatly extended by 5 Saildrones, 3 wave gliders, 6 SWIFT drifters, 2 autonomous prototype drifters (OCARINA and PICCOLO), and 22 drifters. In Fig. 8 the air–sea temperature difference of about 0.8 K is based on Saildrone data, which also quantifies the role of moisture in driving density differences. During EUREC4A more than half of the density difference between the near-surface air and air saturated at the skin temperature of the underlying ocean can be attributed to variations in the specific humidity.
Kite-stabilized helium balloons, known as Max Planck CloudKites (MPCKs), made their campaign debut during EUREC4A. Three instrument systems were flown. One large MPCK+ instrument was flown on the R/V MS-Merian, suspended from the larger aerostat (115 kg lift, 1.5 km ceiling) to sample clouds. Two smaller mini-MPCK instruments were flown both on the same aerostat and the smaller aerostat on the R/V Meteor (30 kg lift, 1 km ceiling), which focused on boundary layer and cloud-base profiling. Measurements from the CloudKites are used to quantify the cloud coverage in Fig. 8.
In this section we elaborate on topics that motivated EUREC4A and how this influenced the measurement strategy. The presentation aims to emphasize novel contributions without loosing sight of the need to also provide a clear sketch of the campaign as a whole. Additional details describing the activities of specific platforms, or groups of platforms, are being described in complementary data papers, and a full listing of the deployed instrumentation is presented in Appendix B.
3.1 Testing hypothesized cloud-feedback mechanisms
As described by Bony et al. (2017), EUREC4A was conceived as a way to test the hypothesis that enhanced mixing of the lower troposphere desiccates clouds at their base, in ways that warming would enhance (Rieck et al., 2012; Sherwood et al., 2014; Brient et al., 2016; Vial et al., 2016) but the signal of which has not been possible to identify in past measurements (Nuijens et al., 2014). In addition, recent research suggests that clouds in the trades tend to organize in mesoscale patterns (Stevens et al., 2019b) selected by environmental conditions (Bony et al., 2020). These findings raise the additional question as to whether changes in the mesoscale cloud organization with evolving environmental conditions might play a role in low-cloud feedbacks. To address these questions, EUREC4A developed techniques to measure the strength of convective-scale and large-scale vertical motions in the lower troposphere, together with the co-incident cloud-base cloud fractions, in addition to other possible drivers of changes in mesoscale cloud patterns, such as coherent structures within the sub-cloud layer, radiative cooling, and air mass trajectories.
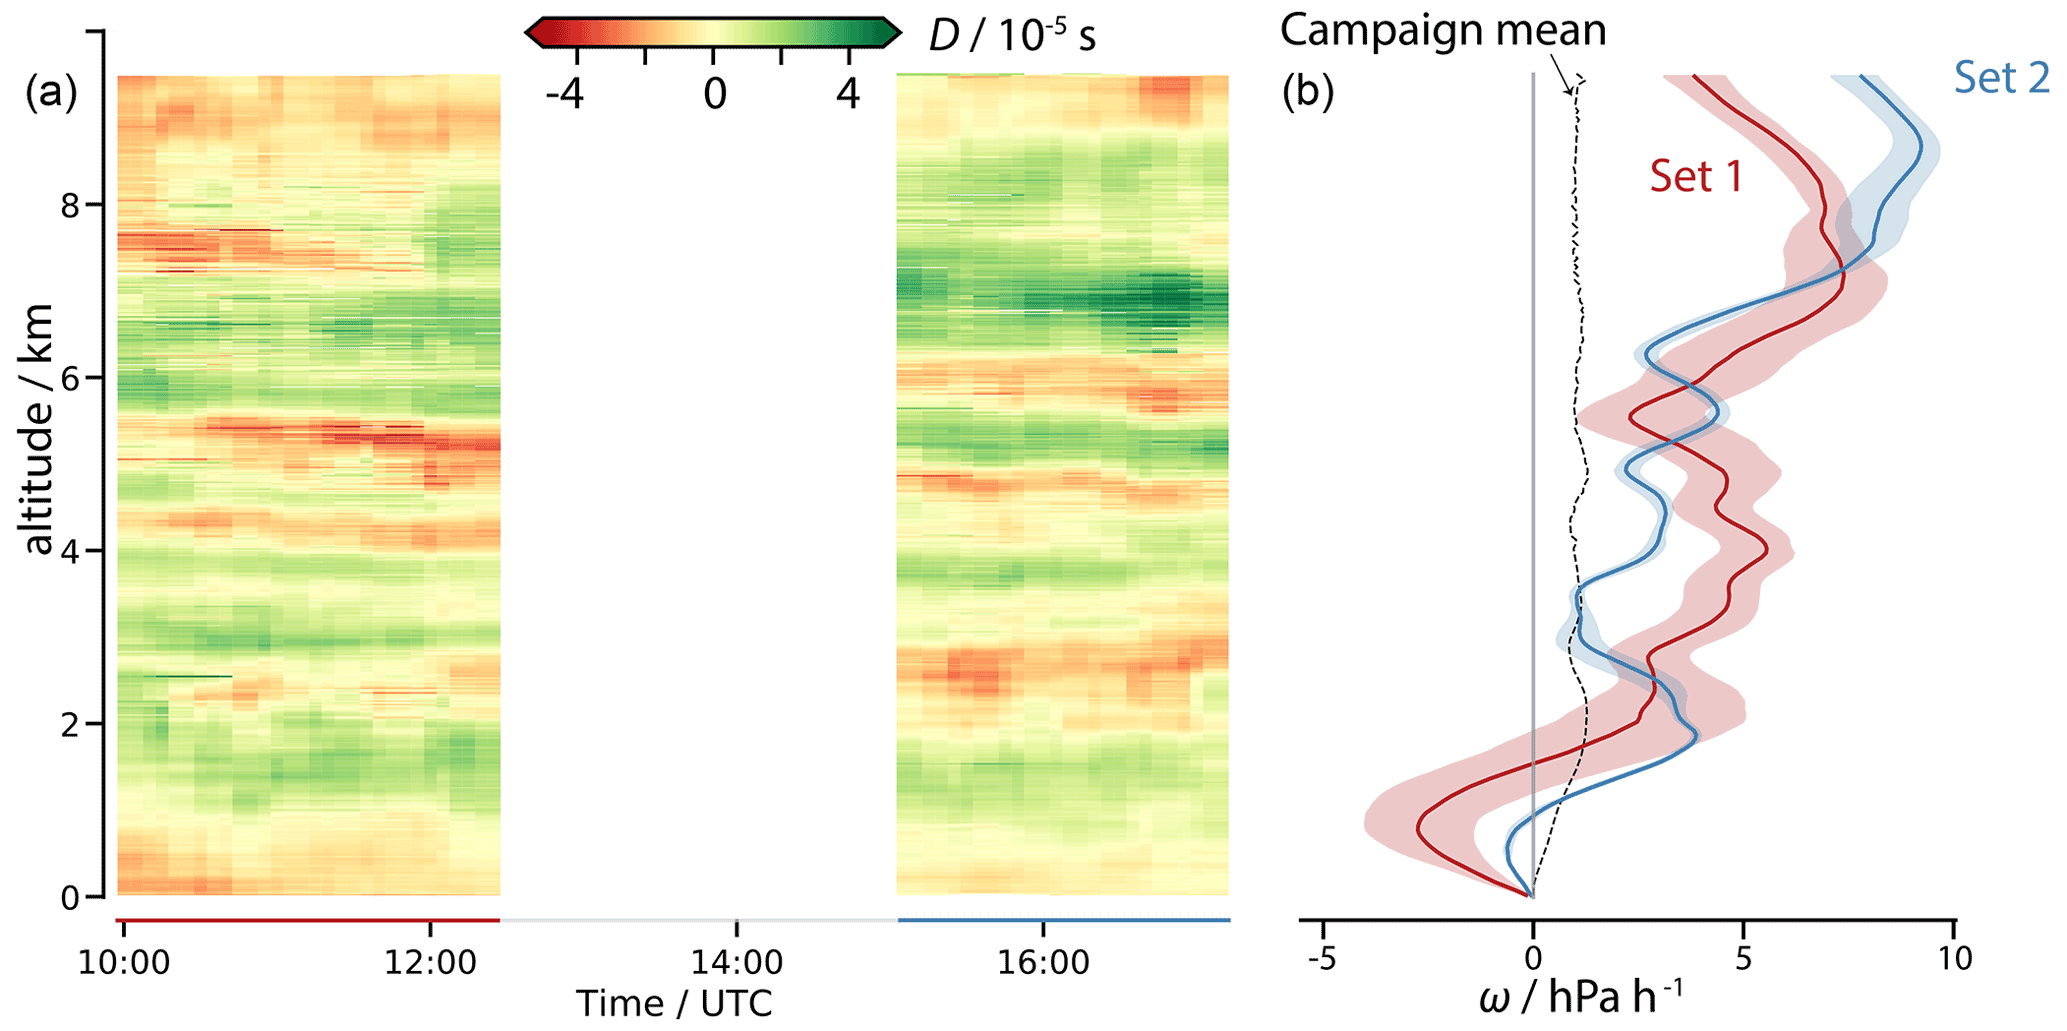
Figure 9Divergence of the horizontal wind versus height (a), and vertical pressure velocity versus height (b). Divergence estimated from dropsonde measurements and vertical pressure velocity derived from these for the two sets of circles flown on 5 February. The black dashed line on the rightmost panel denotes vertical pressure velocity averaged over all EUREC4A-Circle dropsonde measurements.
To make the desired measurements required HALO and the ATR to fly closely coordinated flight patterns, ideally sampling different phases of the diurnal cycle (Vial et al., 2019). This was realized by HALO circling (at an altitude of 10.2 km) 3.5 times over 210 min. Within this period three full sounding circles were defined by a set of 12 dropsonde launches, one for each 30∘ change in heading. The start time of successive sounding circles was offset by 15 min so as to distribute the sondes through the period of circling. During this time HALO also provided continuous active and passive remote sensing of the cloud field below. Flying 50 min “box” patterns just above the estimated cloud base (usually near a height of about 800 m, Fig. 3), the ATR provided additional remote sensing, as well as in situ turbulence and cloud microphysical measurements. After two to three box patterns, the ATR flew two to four L-shaped wind-aligned and wind-perpendicular patterns (the “L” in Fig. 1) – at the top, middle, and bottom of the sub-cloud layer – before returning to Barbados to refuel for a second mission. While the ATR was refueling, HALO made an excursion, usually in the direction of the R/V Ron Brown and the NTAS buoy. On all but two occasions the ATR returned to the measurement zone after refueling (about 90 min later) to execute a second round of sampling, accompanied by HALO returning for another 210 min tour of the EUREC4A-Circle. All told this resulted in 18 coordinated (4 h) flight segments, one of which involved the P-3 substituting for HALO on one of its nighttime flights.
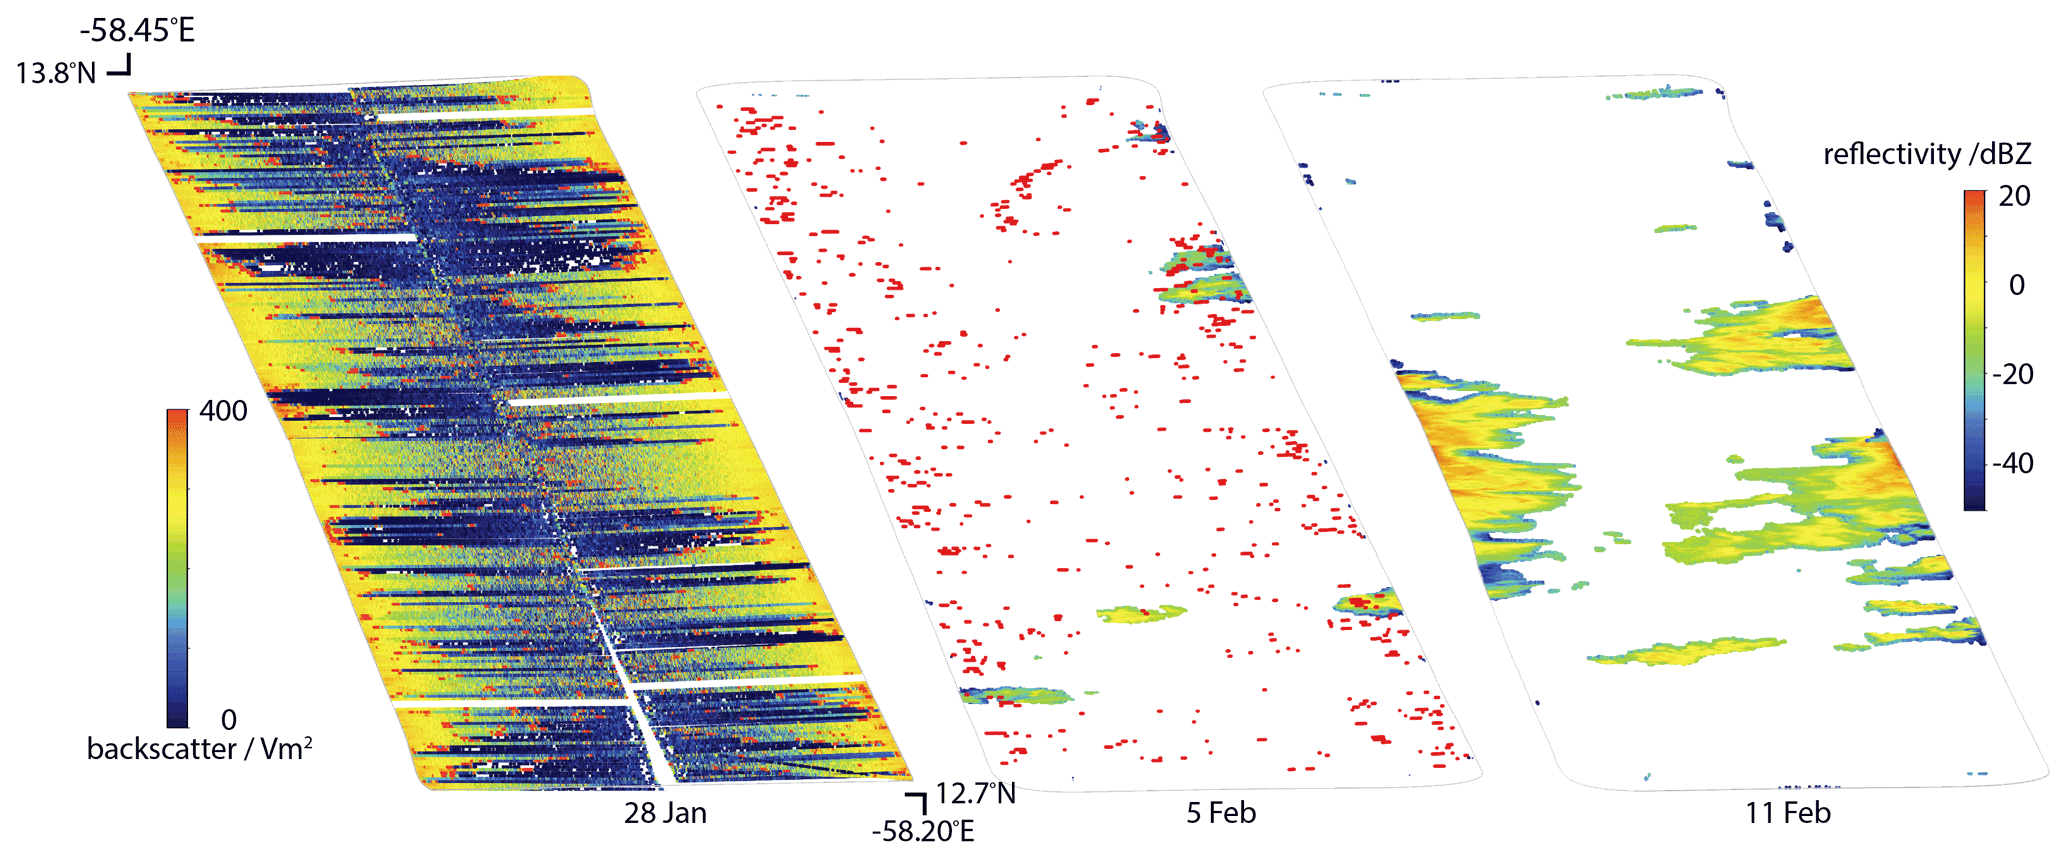
Figure 10Illustration for January 28 lidar, February 5 lidar and radar, and February 11 radar cloud field observed at cloud base by the ATR with horizontal lidar (detected cloud boundaries denoted by red dots) and radar measurements.
A first target of the flight strategy was the measurement, for each sounding circle, of the vertical profile of mass divergence using dropsondes (following Bony and Stevens, 2019). In Fig. 9 the vertical pressure velocity, ω, estimated from this divergence is averaged over a set of three circles for the two 5 February circling periods. Also shown is the average over all circles over all days. The continuity of the divergence within a circle and across two circling periods – although on some flights vertical motion can change more markedly across sets of circles – gives confidence that the measurements are capturing a physical signal. It also shows, for the first time from measurements on this scale, how the mean ω reduces to the expected climatological profile, with a magnitude (of about 1 h Pa h−1) similar to what is expected if subsidence warming is to balance radiative cooling.
The second target of the flight strategy was the measurement of the cloud fraction at cloud base through horizontal lidar–radar measurements by the ATR. In fields of optically thin shallow cumuli (such as those associated with the cloud patterns observed on 28 January), cloud droplets were too small to be detected by the radar, but the lidar could detect the presence of many successive clouds along a roughly 10 km line of sight, i.e., half of its box-pattern width (Fig. 10; Chazette et al., 2021). In the presence of larger cloud droplets, normally associated with larger or more-water-laden clouds, such as on 11 February, the radar detected larger droplets and rain drops over a range of 10 km (Fig. 10). The lidar–radar synergy will provide, for each ATR box, the cloud fraction and the distribution of cloud geometric and optical properties at cloud base. The second, vertically pointing ATR cloud radar allows a characterization of the aspect ratio of clouds, which may help infer the mesoscale circulations within the cloud field. These measurements, associated with new methods developed to estimate the cloud-base mass flux (Vogel et al., 2020), and to characterize the mesoscale cloud patterns from GOES-16, MODIS, or ASTER satellite observations (Stevens et al., 2019b; Mieslinger et al., 2019; Bony et al., 2020; Denby, 2020; Rasp et al., 2021), will make it possible to test cloud-feedback mechanisms and advance understanding of the processes underlying the formation of the mesoscale cloud patterns, as well as whether they influence the hypothesized feedback mechanisms.
3.2 Quantifying processes influencing warm-rain formation
As highlighted by Bodenschatz et al. (2010), the range of scales, from micro- to megameters, that clouds encompass has long been one of their fascinating aspects. Measurements made during EUREC4A quantified, for the first time, the main processes that influence trade wind clouds across this full range of scales. By doing so, long-standing questions in cloud physics were addressed, including (i) whether microphysical processes substantially influence the net amount of rain that forms in warm clouds and (ii) how important is the interplay between warm-rain development and the mesoscale organization of cloud fields. These questions identify precipitation development as the link among processes acting on different scales and hence guided EUREC4A's measurement strategy.
On the particle scale, measurements were performed to characterize aerosols and to quantify how small-scale turbulence mixing processes influence droplet kinematic interactions and activation. Aerosol properties and turbulence both imprint themselves on the cloud microstructure and thereby affect the formation of precipitation (Broadwell and Breidenthal, 1982; Cooper et al., 2013; Li et al., 2018; Pöhlker et al., 2018; Wyszogrodzki et al., 2013). In most cases, not only the magnitude, but also the sign of the hypothesized effects can be ambiguous, if not controversial. For example, by acting as an additional source of cloud condensation nuclei (CCN), Saharan dust may retard the formation of precipitation (Levin et al., 1996; Gibson et al., 2007; Bailey et al., 2013), but if present as giant CCN, it may have the opposite effect (Jensen and Nugent, 2017).
On the cloud scale, the intensity of rain and the evaporation of raindrops can lead to downdrafts, cold pools, and mesoscale circulations which can lift air parcels, producing secondary and more sustained convection (e.g., Snodgrass et al., 2009). These cloud-scale circulations, which the EUREC4A-Circle measurements quantified, may also change the vigor and mixing characteristics of cloud. This could in turn influence precipitation formation, a process that Seifert and Heus (2013) suggest may be self-reinforcing, consistent with an apparent link between precipitation and mesoscale cloud patterns such as “fish” or “flowers” (Stevens et al., 2019b).
On larger (20 to 200 km) scales, horizontal transport, which determines whether or not Saharan dust reaches the clouds, as well as factors such as the tropospheric stability, or patterns of mesoscale convergence and divergence, which influence cloud vertical development, may affect the efficiency of warm-rain production. In addition to the characterization of the environment from the dropsondes, the positioning of surface measurements (R/V Meteor, R/V Ron Brown, and BCO) helped characterize the Lagrangian evolution of the flow, also in terms of aerosol and cloud properties.
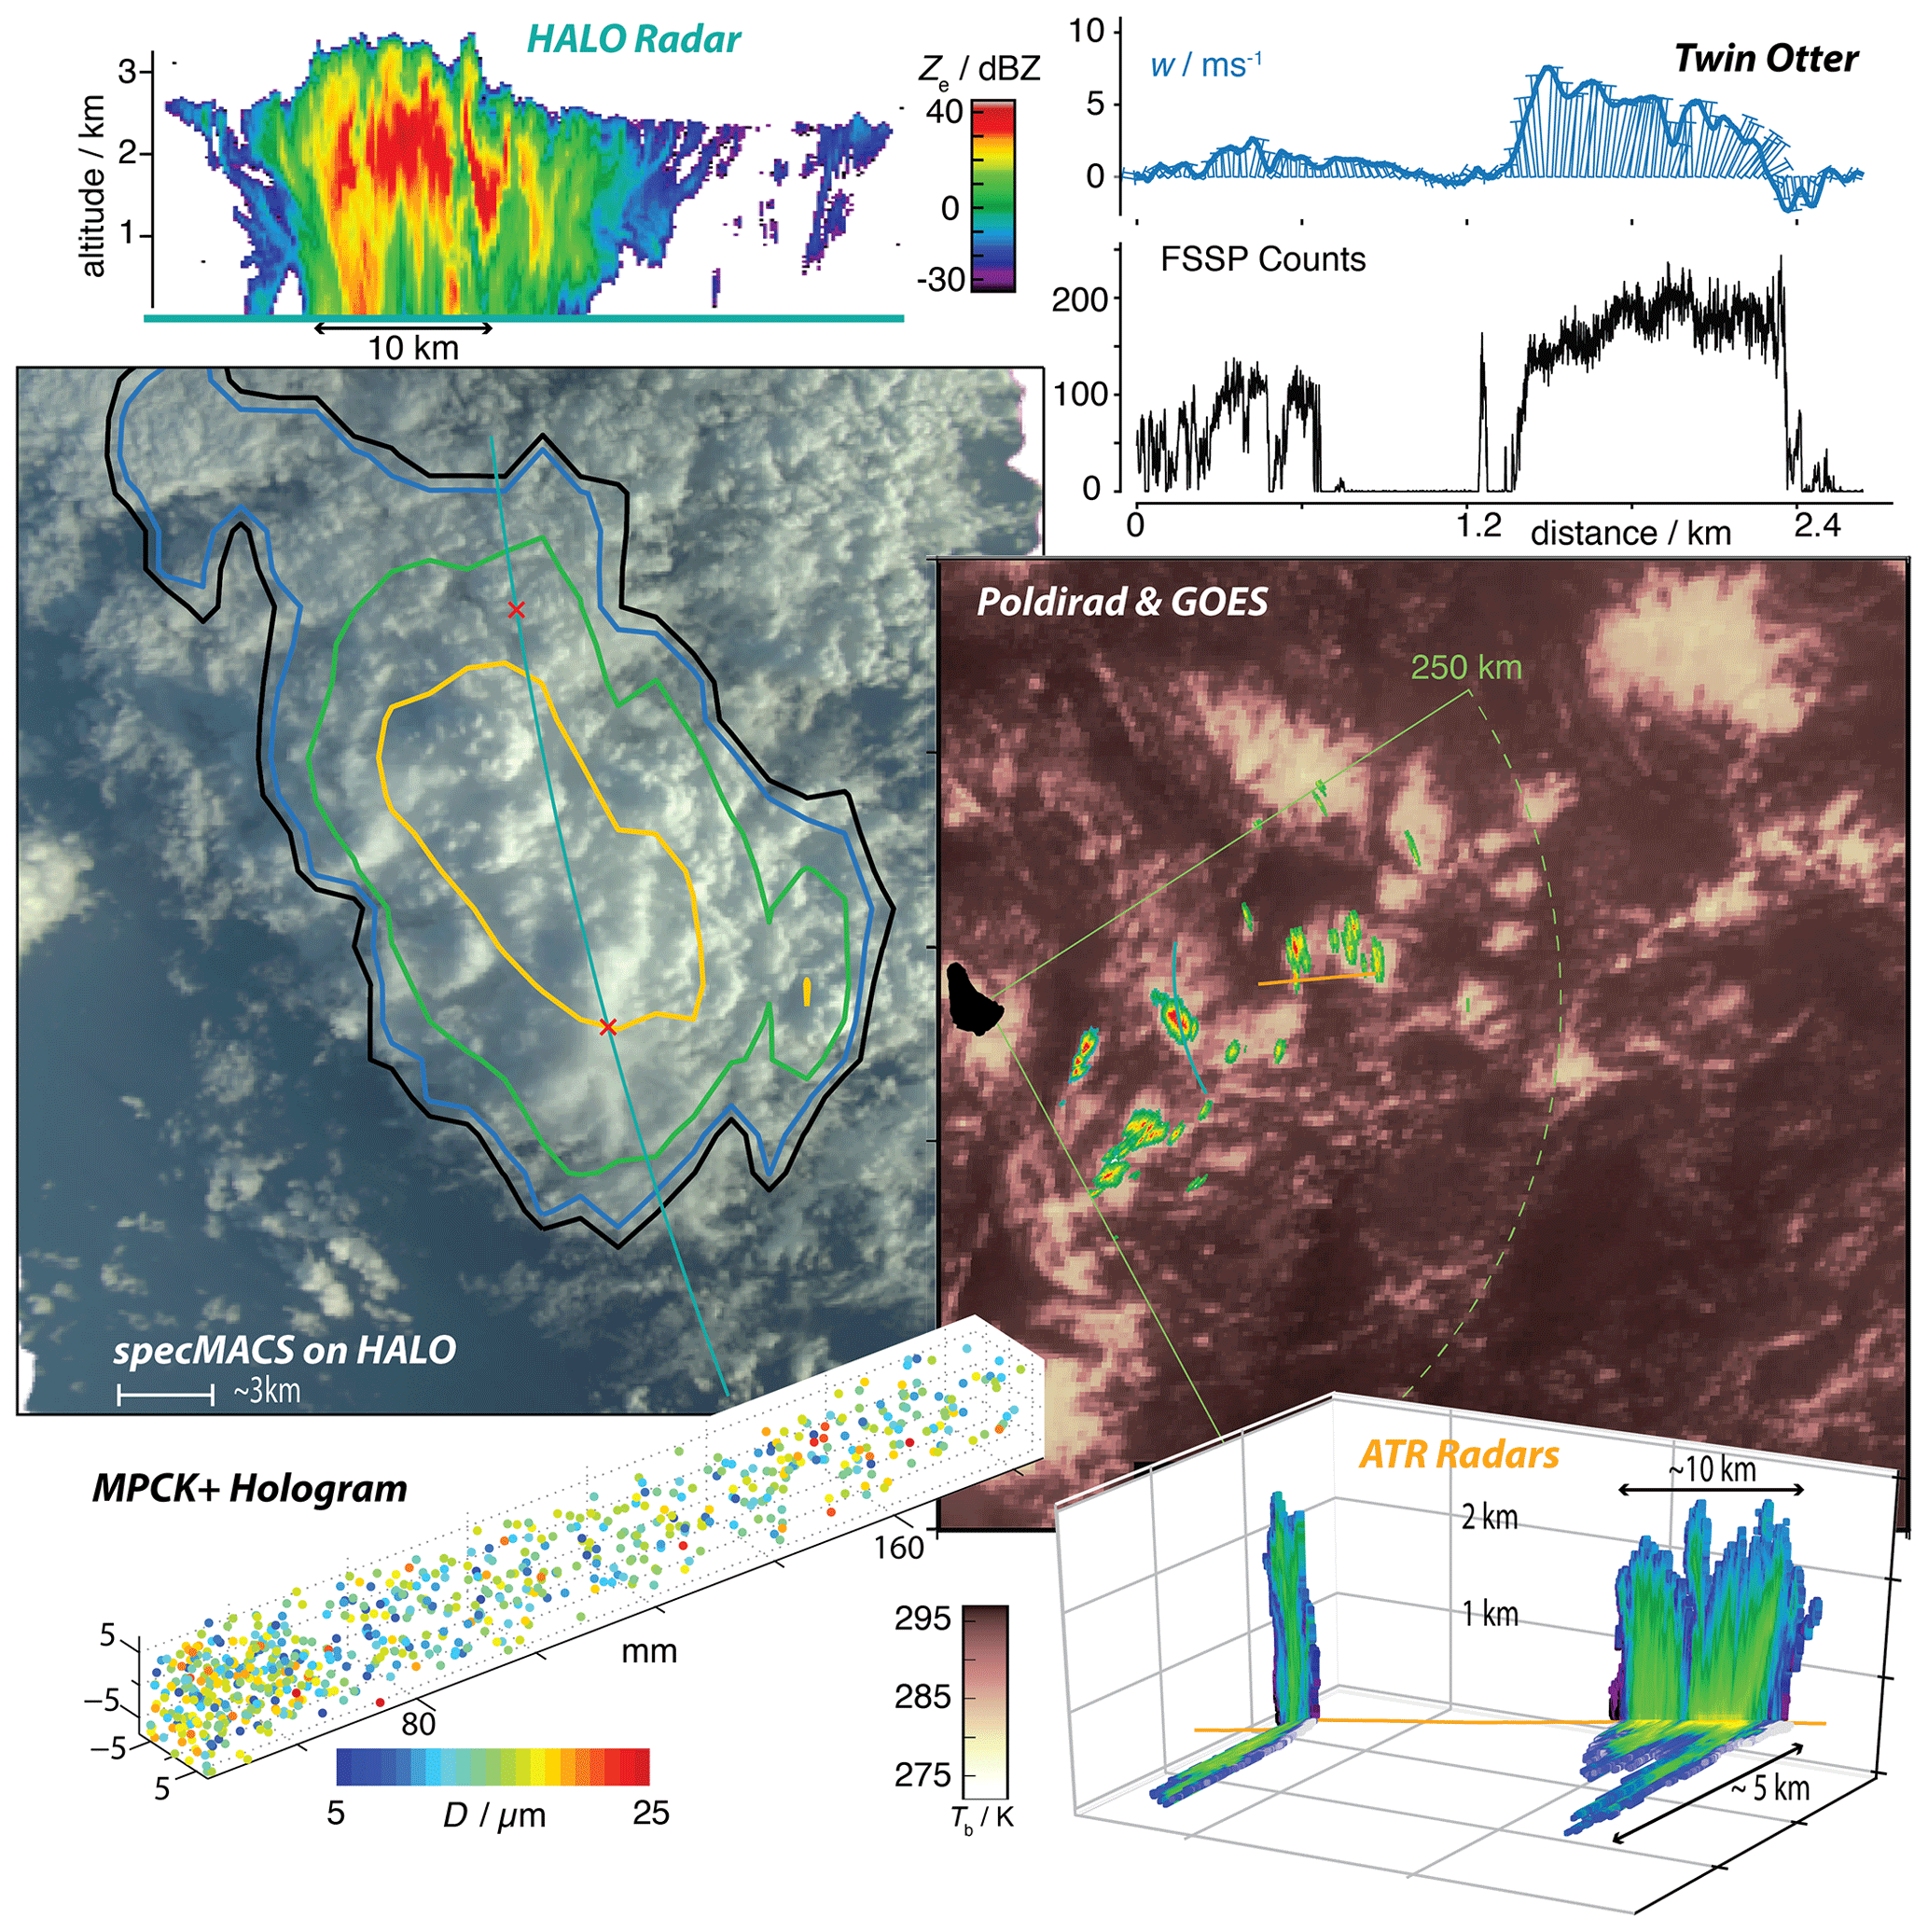
Figure 11Measurements within the Tradewind Alley test section (5 February) define a multi-scale cloud chamber. The figure highlights clustering on different scales. Scanning C-band radar (POLDIRAD) 0.6∘ scan (11:25:25 UTC) is overlain on the 11:33:41 UTC brightness temperature (at 10.6 µm) measured by GOES-16, with coincident segments of the HALO and ATR flight tracks. Radar images from the ATR (horizontal and zenith) and HALO (nadir) are shown (all radar imagery shares the same color scale), as well as cloud water and updraft velocity from a penetration of cloud by the Twin Otter (later in the day, at 18:32 UTC, near 13.55∘ N, 58.26∘ W at 1910 m). Visual image from the specMACS instrument, with POLDIRAD reflectivity contours superimposed, shows the cloud visualization along a segment of the HALO flight track. MPCK+ hologram measurements (made in the southern portion of the circle – 12.25∘ N, 57.70∘ W at 1084 m – on 17 February) demonstrate the capability to measure the three-dimensional distribution of individual cloud droplets colored by size.
Figure 11 shows an example of the cascade of measurements, spanning scales covering 10 orders of magnitude. On the smallest O(10−5 m) scale, a sample holographic image from an instrument mounted on the MPCK+ shows the spatial and size distribution of individual cloud drops. In situ measurements and airborne remote sensing document the cloud microphysical structure and its relationship to the properties of the turbulent wind field. On scales of hundreds of meters to a few kilometers, vertically and horizontally pointing cloud radars and lidars characterize the geometry and the macrophysical properties of clouds. On yet larger O(105 m) scales, the spatial organization and clustering of clouds and precipitation features are captured by satellite, by high-resolution radiometry from high-altitude aircraft, and by the C-band scanning radar, POLDIRAD (Schroth et al., 1988).
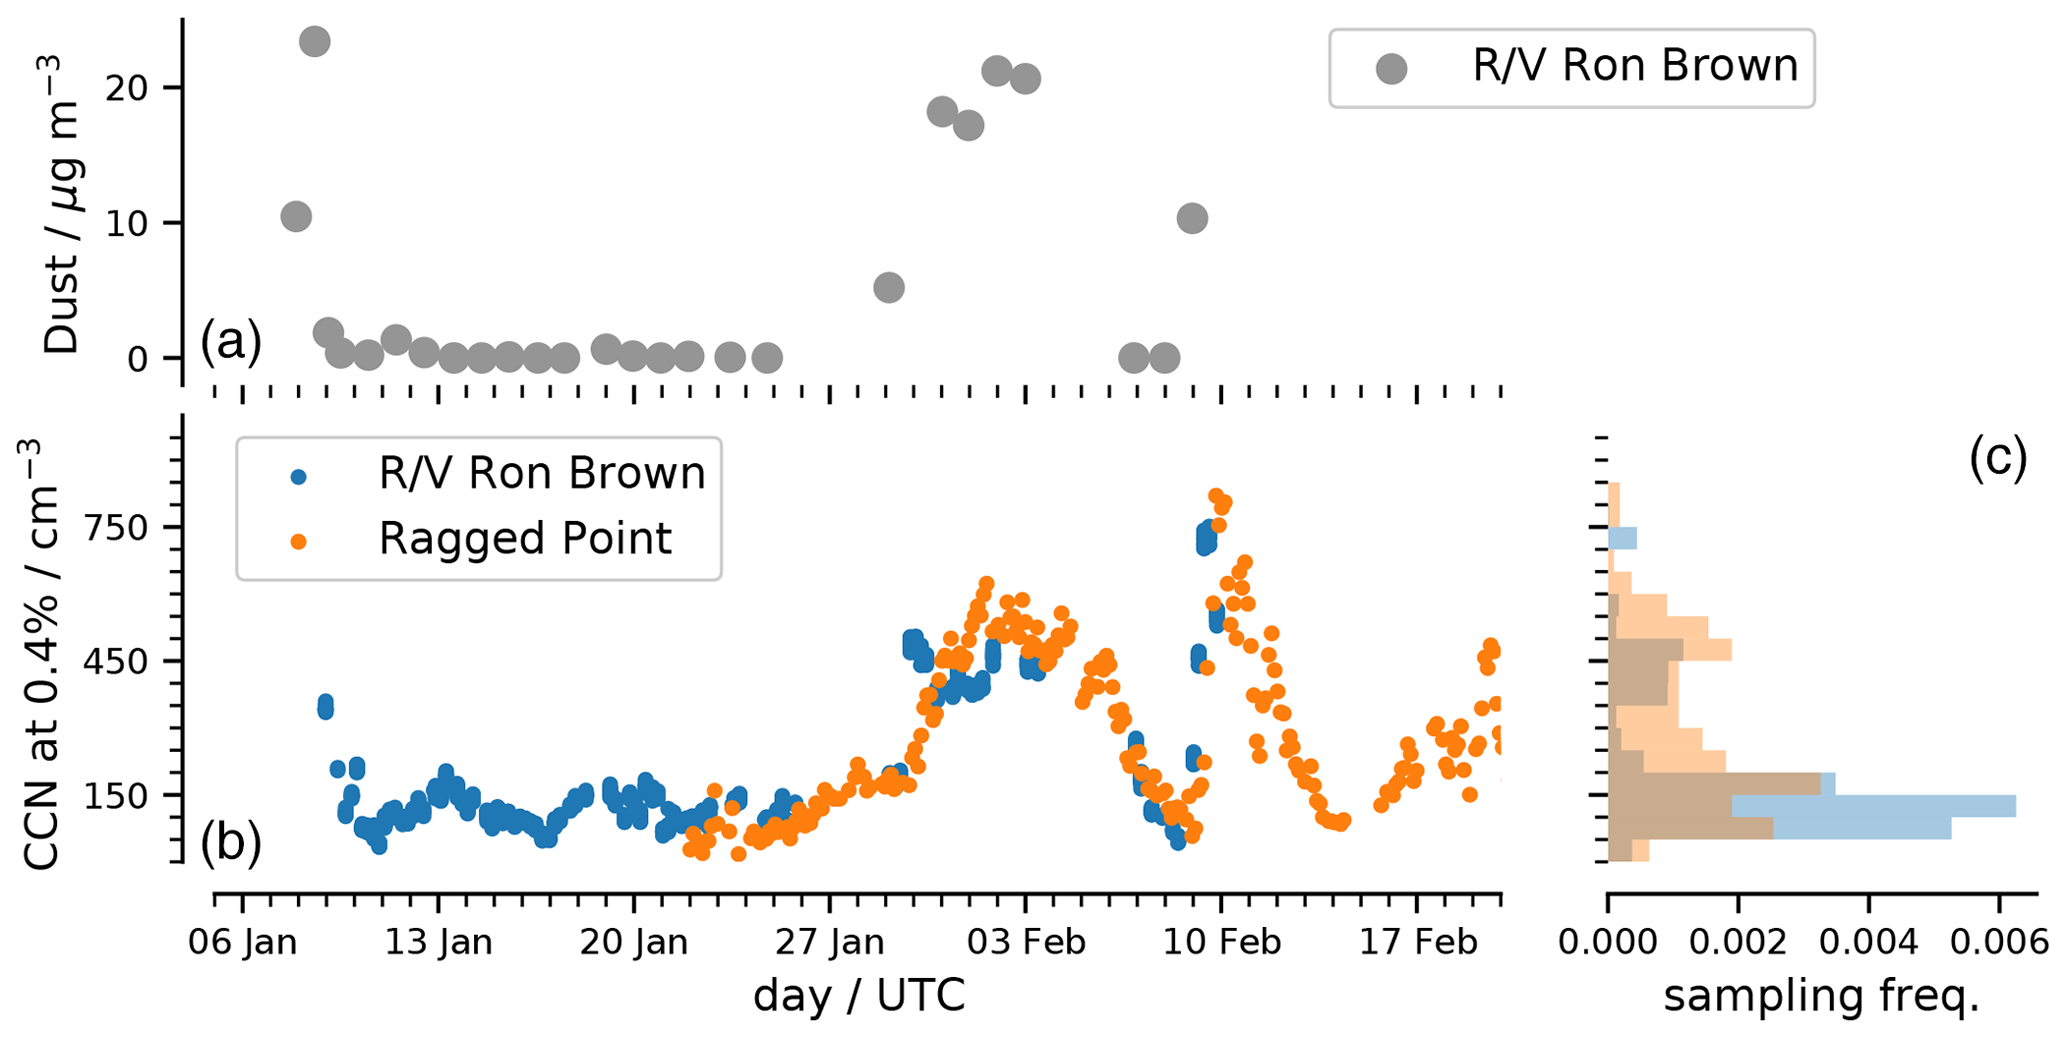
Figure 12Aerosol characteristics measured in the Tradewind Alley highlight two periods (31 January to 6 February and 9–12 February) of CCN-laden air. Dust mass density from the R/V Ron Brown (a), which was mostly east of 55∘ W. Normalized histogram showing the relative frequency of occurrence of different CCN concentration levels (c). Note that the periods of observation at the two locations are only partly overlapping.
An example of how the measurements upwind and downwind of the EUREC4A-Circle helped constrain its aerosol environment is shown in Fig. 12. Two periods with larger CCN number concentration (near 450 cm−3), both associated with periods of elevated mineral dust, can be identified in measurements made aboard the R/V Ron Brown (east of 55∘ W) and from the ground station at Ragged Point (Pöhlker et al., 2018). The slight lag of the Ragged Point measurements relative to those on the R/V Ron Brown is consistent with the positioning of the two stations and the westward dust transport by the mean flow. The episodes of elevated dust are believed to be from Saharan dust outbreaks, which are unusual in the (boreal or northern) winter months (Prospero et al., 2020) and can greatly increase CCN number concentrations (Wex et al., 2016). In between these events, CCN number concentration are 3-fold smaller (150 cm−3), which we take as representative of the clean maritime environment.
The degree of aerosol variability should aid efforts to untangle the relative role of different factors influencing warm-rain formation. Helping in this regard is that variations in CCN concentrations are not too rapid to call into question the idea of associating a 3 h period of measurements on the EUREC4A-Circle with a particular concentration of CCN: 50 % of the Ragged Point measurements change by less than 10 % over a 3 h period, and only 20 % of the time are changes larger than 30 % measured.
3.3 Sub-cloud mass, matter, energy, and momentum budgets
Early field studies extensively and compellingly documented the basic structure of the lower atmosphere in the trades (Riehl et al., 1951; Malkus, 1958; Augstein et al., 1974; Brummer et al., 1974; Garstang and Betts, 1974). What remains poorly understood is the relative role of specific processes, particularly those acting at the mesoscale, in influencing this structure. A specific question that EUREC4A aims to answer is the importance of downdrafts, and associated cold pools (Rauber et al., 2007; Zuidema et al., 2012), in influencing boundary layer thermodynamic structure and momentum transport to the surface. A related question is whether the links between the cloud and sub-cloud layer depend on the patterns of convective organization, for instance as a result of differences in the circulation systems that may accompany such patterns.
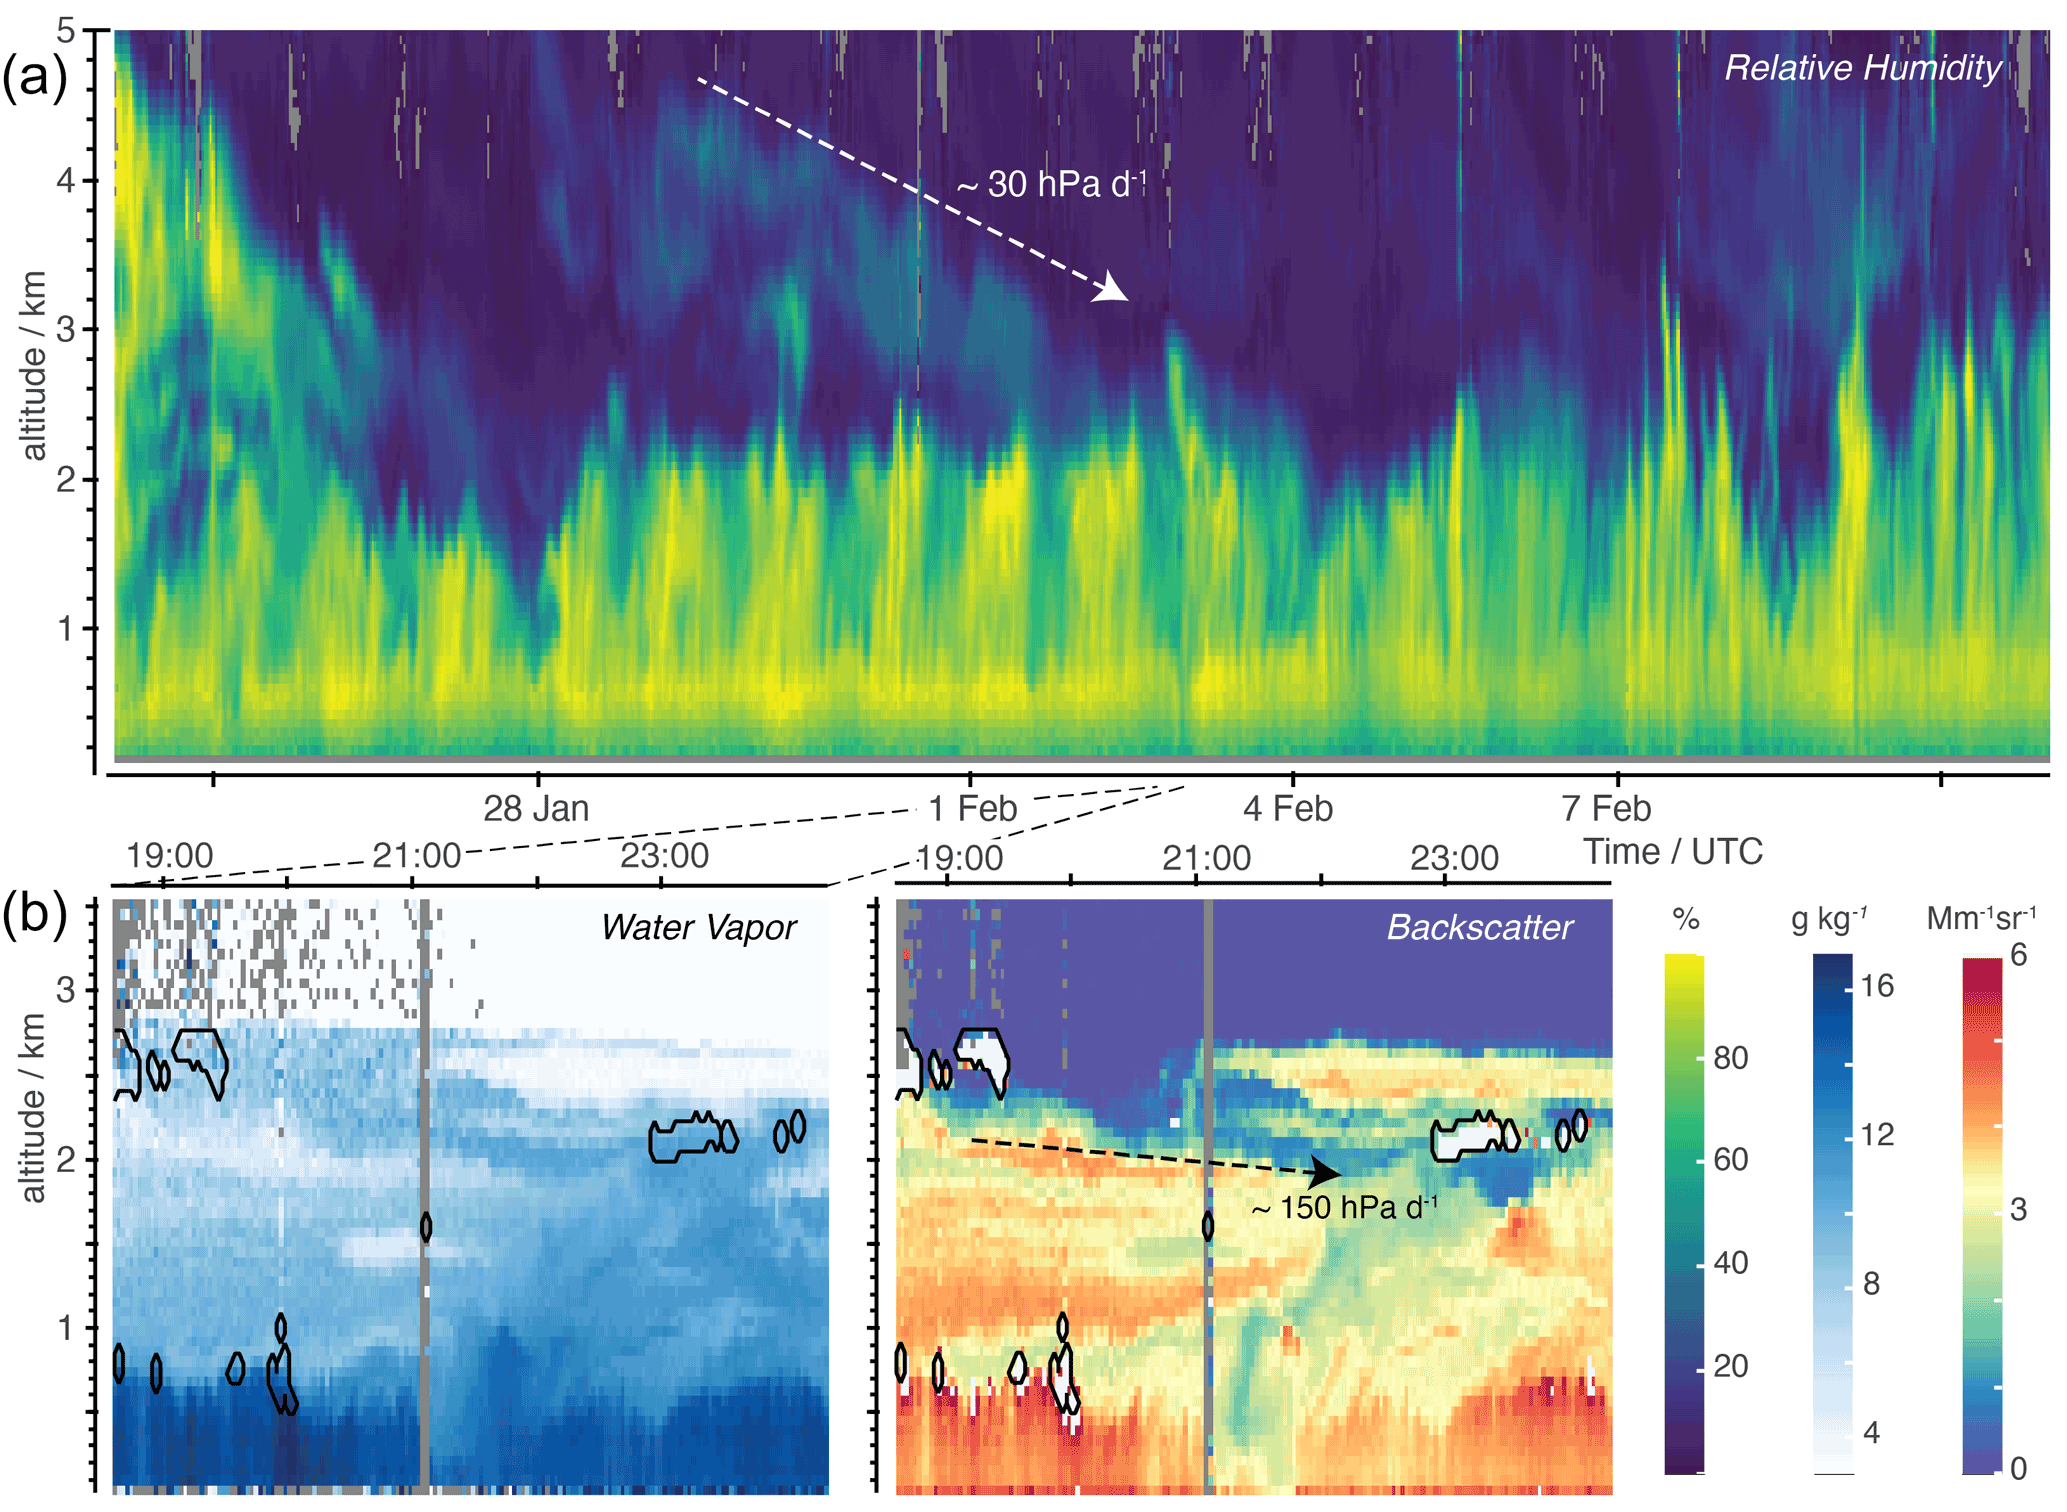
Figure 13Lidar profiling of the lower atmosphere using the CORAL lidar at the Barbados Cloud Observatory. The upper panel (a) shows the relative humidity in the lower 5 km over the entirety of the campaign. The lower panel (b) shows (from left to right) show the specific humidity over a 4 h period marked by a large intrusion of cloud layer air on 2 February and the associated aerosol/cloud backscatter. Also shown is the Lagrangian evolution of humidity, or backscatter features, with dashed arrows following the descent with time of features (white arrow in the upper panel: following RH feature; black arrow in the lower panel: following backscatter feature) being indicative of the magnitude of vertical velocity variations on different temporal scales. Gray bars on lower plots (at 21 h) are missing data.
For quantifying the sub-cloud layer budgets, as for many other questions, a limiting factor has been an inability to measure mesoscale variability in the vertical motion field. EUREC4A's measurements not only address this past short coming, but the ship-based sounding network additionally quantifies the mean vertical motion at different scales. The arrangement of measurements, particularly flight segments, was designed to quantify the Lagrangian evolution of air masses, with legs repeated on every mission at levels attuned to the known structure of the lower troposphere, i.e., near the surface, in the middle, near the top, and just above the sub-cloud layer, as well as in and just above the cloud layer. Past studies using a single aircraft, albeit in a more homogeneous environment, demonstrate that such a strategy can close boundary layer moisture and energy budgets (Stevens et al., 2003). Doing so also aids quantification of the vertical profile of turbulent transport and contributions associated with horizontal heterogeneity and sets the stage for estimating mass and energy budgets through the entire atmospheric column.
To address the measurement challenge posed by an environment rich in mesoscale variability, EUREC4A made use of additional aircraft and a larger array of surface measurements (also from uncrewed platforms) as well as extensive ship and airborne active remote sensing, and a network of water stable isotopologues (as presented in Sect. 2.3.2). At the BCO, aboard the R/V Meteor and on the R/V MS-Merian, advanced Raman lidars provided continuous profiling of water vapor, clouds, temperature, and aerosols. The nadir-staring WALES lidar on HALO likewise profiled water vapor, clouds, and aerosols. As an example of this capability, Fig. 13 presents relative humidity data (deduced from temperature and absolute humidity retrievals) from the BCO lidar. These measurements document the time–height evolution of water vapor in the boundary layer, something impossible to assess from in situ measurements, which measure at only a few levels, or soundings, which are sparse in time.
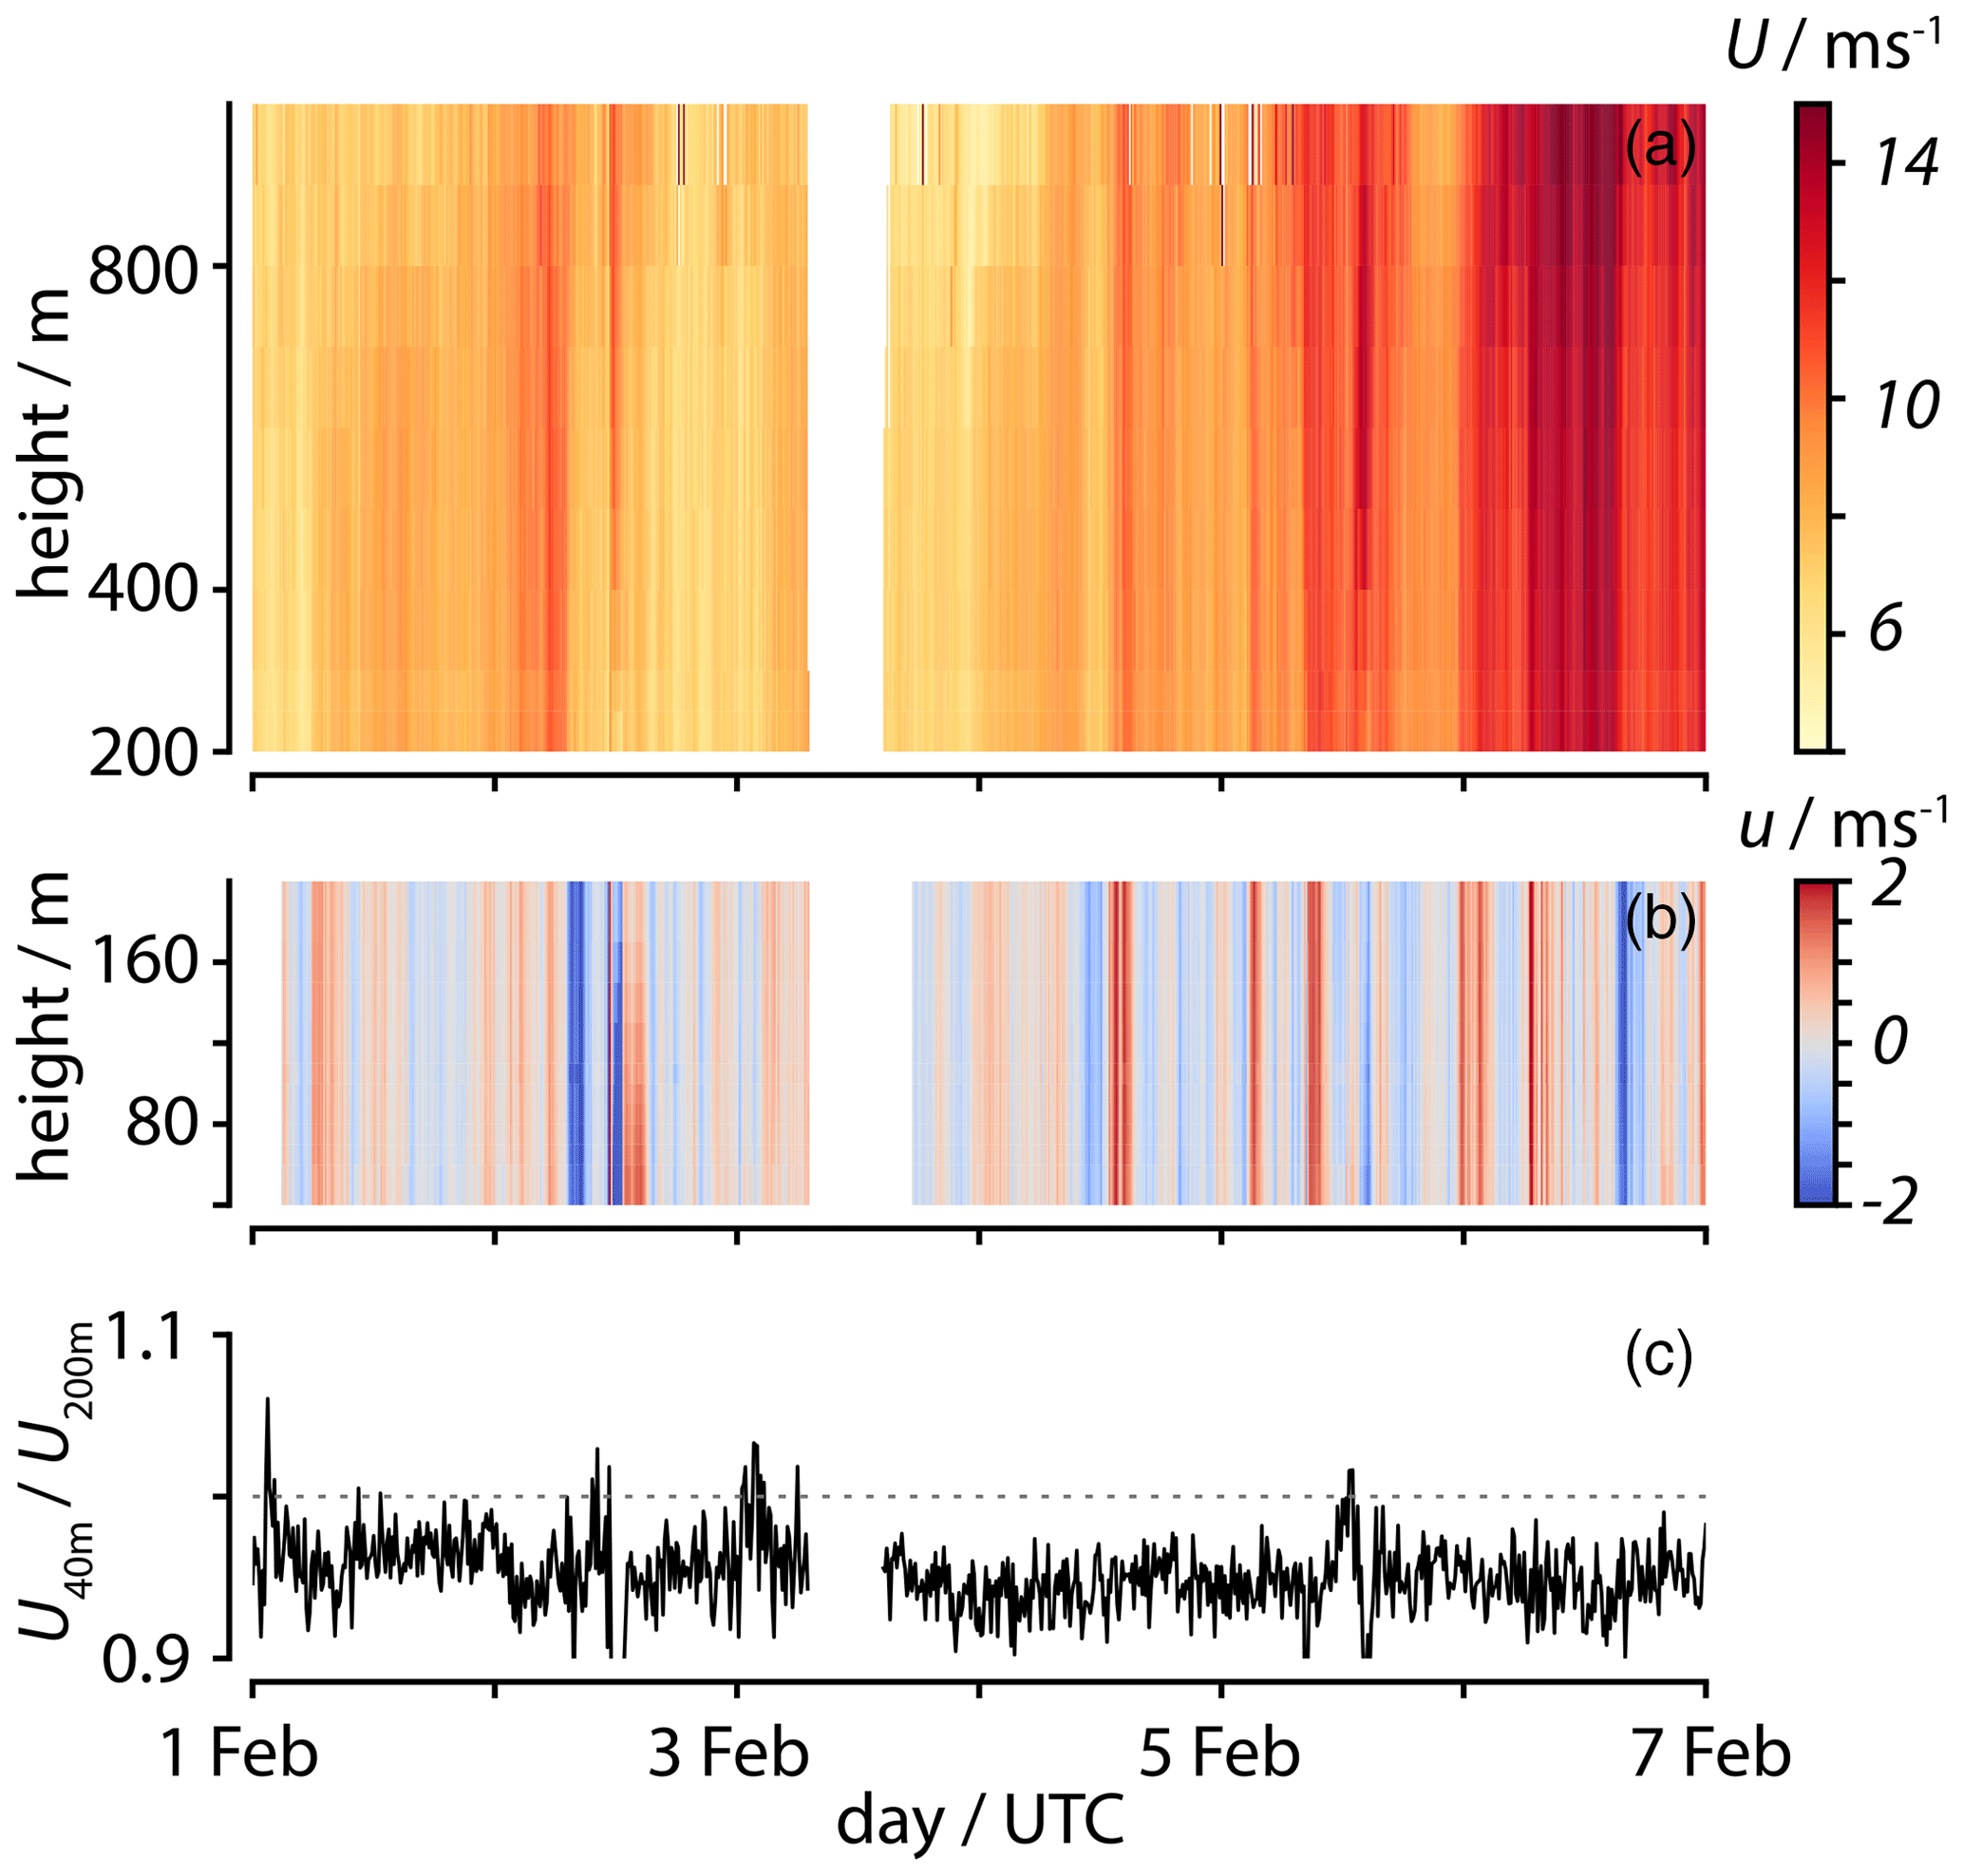
Figure 14Sub-cloud layer lidar wind versus height above the R/V Meteor. Panel (a) shows the value of the wind speed in the sub-cloud layer, above 200 m. Fluctuations of the near-surface wind speed from a 3-hourly running mean value (b) are shown with an expanded vertical scale. The lower time series (c) shows the ratio of the wind speed at 40 m (the lowest remotely sensed level) to its value at 200 m.
The BCO lidar measurements quantify the structure of moist or dry layers in the free atmosphere, as well as variations in the cloud and sub-cloud layers, illustrating days of more nocturnal activity (centered on 1 February), and also features presumed to be the signature of mesoscale circulations. Analyses of Meteor data show a signature of the diel cycle (0.54 K), but it is more pronounced (1.27 K) over the BCO – both at the surface and as sensed by the BCO lidar at 400 m. Both a slight slackening of the winds and an upwind adjustment in response to diurnal heating of the island could be responsible for the amplification of the diel cycle over the BCO.
Possible mesoscale circulations are the focus of the magnification in the lower panels (of Fig. 13). Shown are measurements in the lower 3 km for a 5 h period late on 2 February 2020. During this period aerosol-poor air appears to descend adiabatically into the cloud layer (near 2 km), coincident with a large-scale fold of cloud layer air into the sub-cloud layer. This results in a sharp contact discontinuity (aerosol front) near 21:00 UTC, which extends to the surface and is also evident in the water vapor field. Typically the marine boundary (sub-cloud) layer is viewed as a turbulent layer that primarily interacts with the much-larger-scale evolution of the free atmosphere through small-scale entrainment at its top. Events such as the one shown in Fig. 13 suggest that in addition to downdrafts and the cold pools they feed, circulations on scales commensurate with and larger than the depth of the sub-cloud layer may be important for boundary layer budgets.
Similar considerations also apply to the momentum budget of the trades. In Dixit et al. (2020) idealized large-eddy simulations are shown to underestimate the flux of momentum in the sub-cloud layer, something they hypothesize to arise from an absence of mesoscale circulations in the simulations. As an example of efforts to quantify such processes Fig. 14 shows the total wind speed measured in the sub-cloud layer by the long-range wind lidar aboard the R/V Meteor. The lower panel documents kilometer-scale wind speed variations on the order of 2 ms−1 that extend into the surface layer (derived from the short-range wind lidar, defined with respect to 3-hourly running means). One question asked is whether, for a given surface friction, convectively driven flows can sustain a relatively large near-surface wind, and weaker surface layer wind shear, than expected from shear-driven turbulence alone. The third panel shows that the ratio of wind speeds at 40 m to wind speeds at 200 m, as a measure of surface layer wind shear, is close (ca. 0.95) to unity. Combined with surface heat and momentum fluxes measured by other platforms, the lidars provide a unique opportunity to identify the influence of (moist) convection on wind stress at the surface.
3.4 Ocean mesoscale eddies and sub-mesoscale fronts and filaments
Mesoscale eddies, fronts, and filaments – not unlike the mesoscale circulations that are the subject of increasing attention in the atmosphere – are coherent structures that may be important for linking surface mixed layer to the interior ocean dynamics (Carton, 2010; Mahadevan, 2016; McWilliams, 2016). By virtue of a sharp contrast with their surroundings, these structures can efficiently transport enthalpy, salt, and carbon through the ocean. Though satellite observations have enhanced knowledge of their occurrence and surface imprint (Chelton et al., 2001), the sparsity of direct observations limits our ability to test understanding of such structures, in particular subsurface eddies. Understanding of the role of these types of structures is further limited by their short lifespans (hours to days) and small spatial scales (0.1 to 10 km), which make them difficult to observe. These facts motivated ocean observations during EUREC4A, as did recent work suggesting that such coherent structures, in particular localized upwelling, downwelling, straining, stratification variability, wave breaking, and vertical mixing, may couple with and influence atmospheric processes, including cloud formation (Lambaerts et al., 2013; Renault et al., 2016; Foussard et al., 2019).
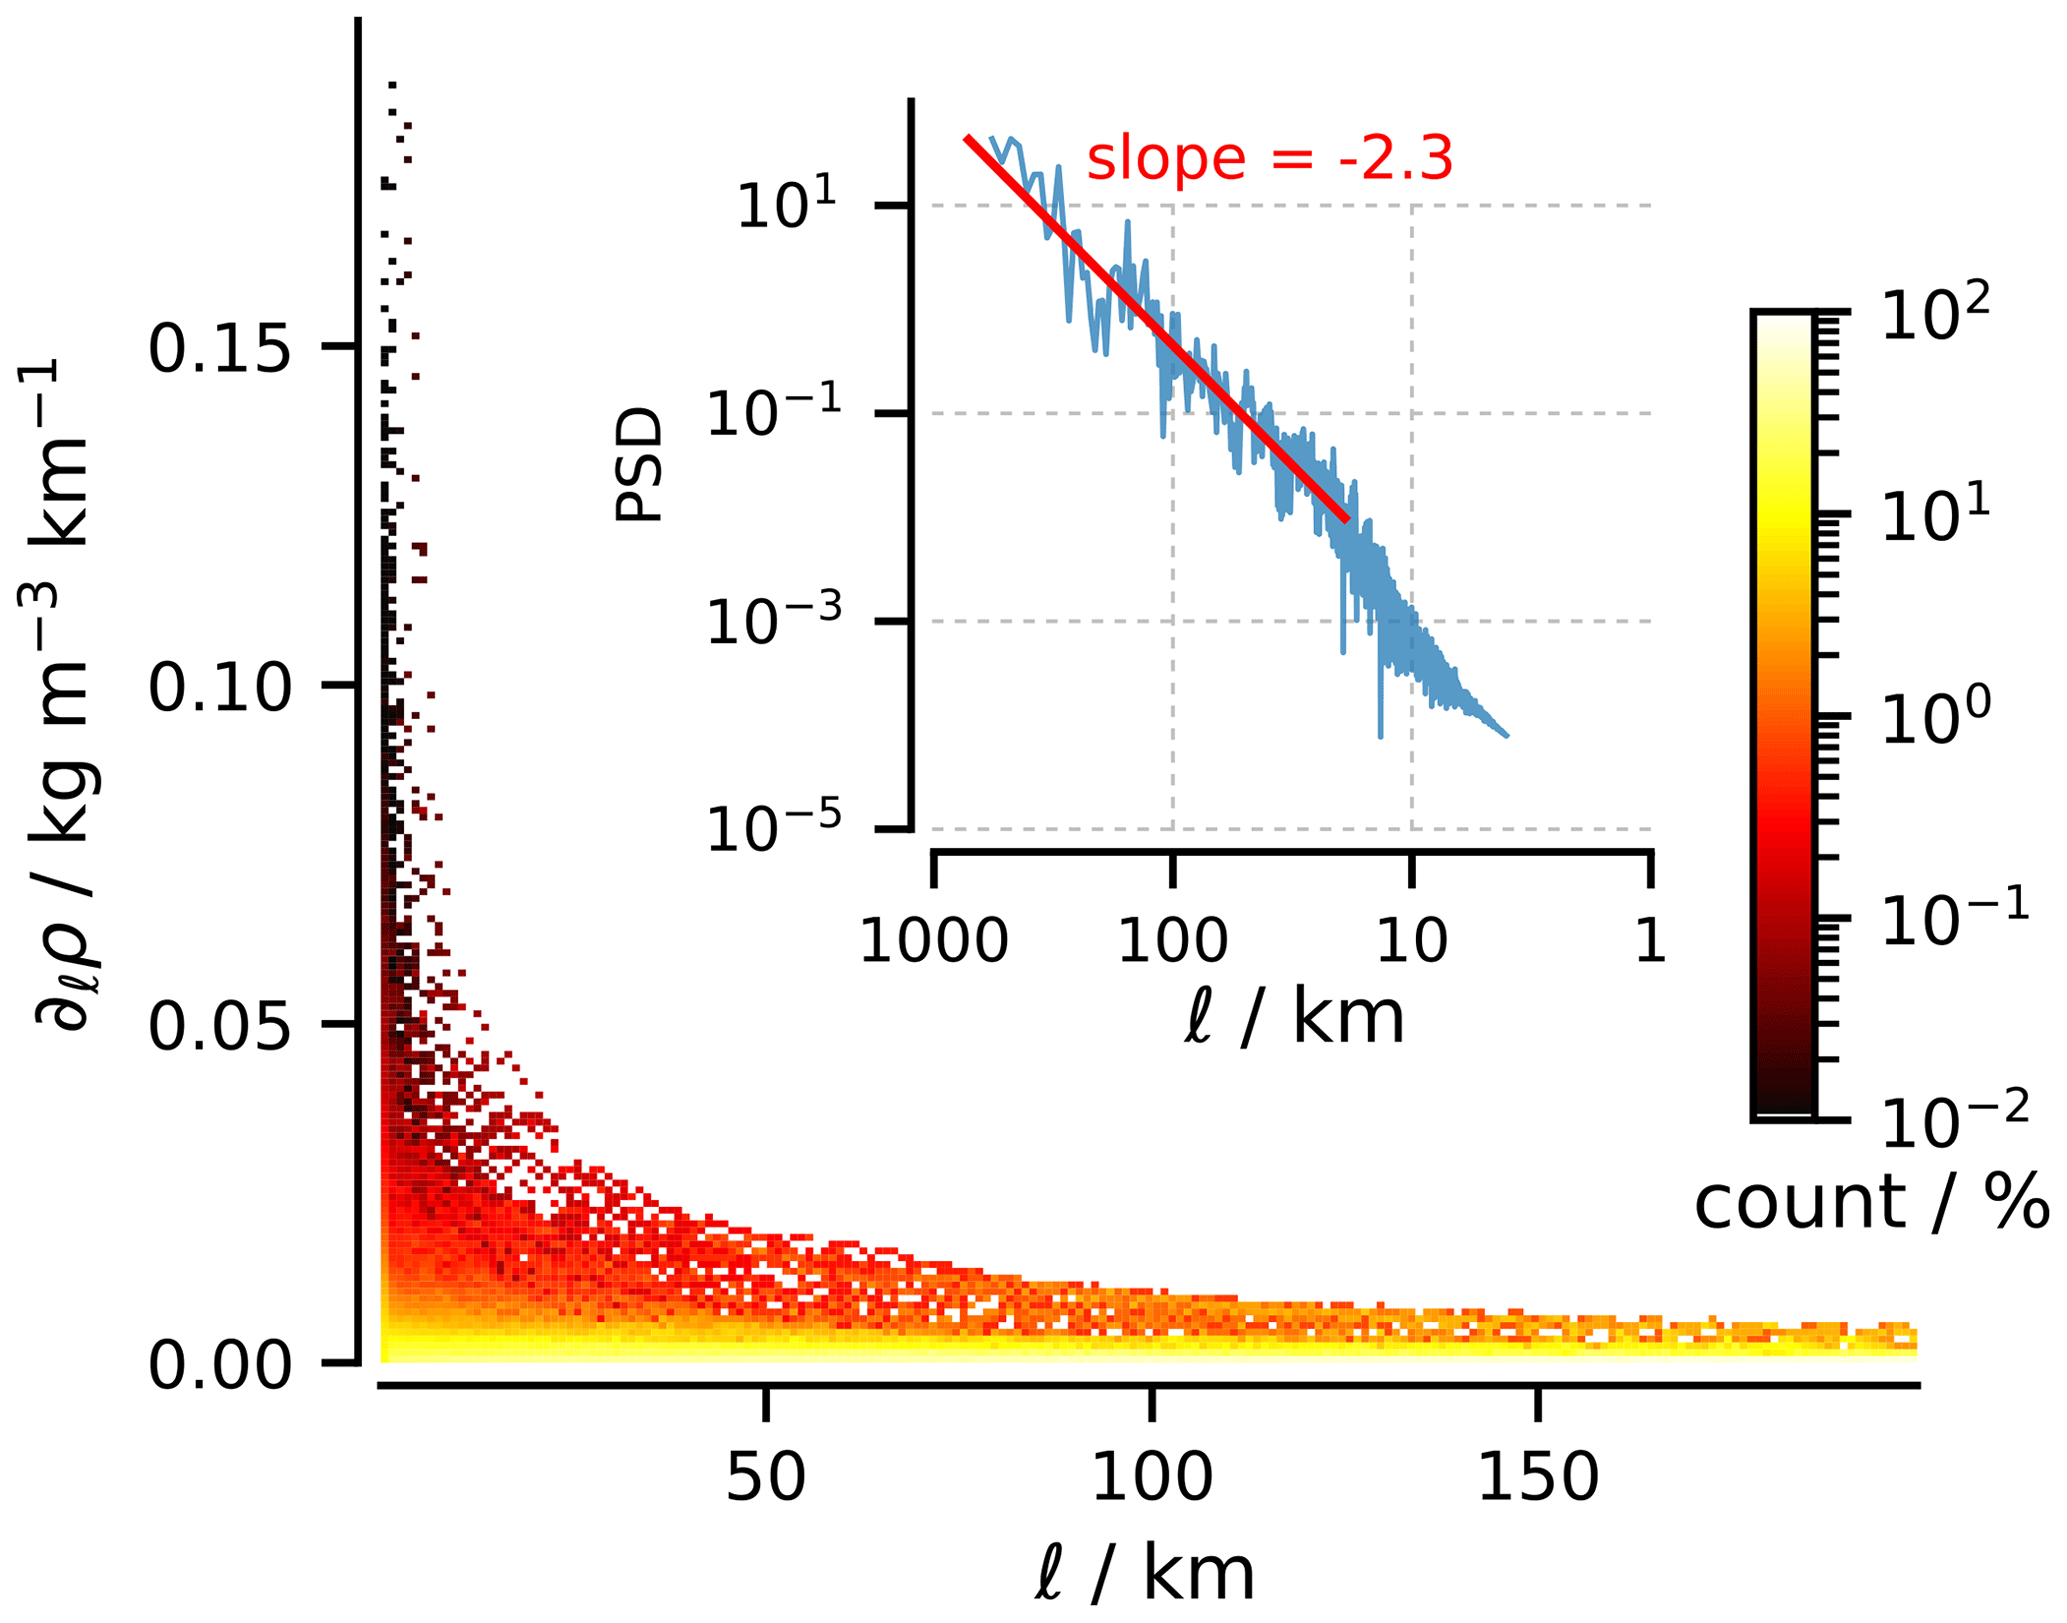
Figure 15Surface density gradients at different horizontal length scales. Bivariant histogram shows counts versus (1 to 200 km) and strength of gradient as measured by Saildrones (note the log-scale color bar). Inset is power spectral density of the surface density gradients, calculated by averaging periodograms constructed for each vehicle after de-trending the data and smoothing the data with a 2 km Gaussian filter. The red line shows the linear regression best fit slope of −2.3.
To address these questions, measurements during EUREC4A attempted to quantify how near-surface currents, density, and waves varied across and within different dynamical regimes, e.g., for mesoscale eddies, fronts, and filaments. Such measurements aimed to answer specific questions not unlike those posed for the atmospheric boundary layer, namely to quantify the contribution of such structures to the spatial and temporal variability of the upper ocean. EUREC4A distinguished itself from past campaigns that have attempted similar measurements – LatMix (Shcherbina et al., 2013), OSMOSIS (Buckingham et al., 2016), and CARTHE (D'Asaro et al., 2018) – by virtue of the number and diversity of observing platforms deployed (Saildrones, underwater gliders, instrumentally enhanced surface and subsurface drifters, Wave Gliders, an AutoNaut, and biogeochemical Argo floats). These mapped the ocean down to 1000 m or more, simultaneously across both the Tradewind Alley and the Boulevard des Tourbillons (Fig. 2). These measurements have resulted in an unprecedented view of a large spectrum of ocean temporal and spatial scales across different oceanic environments.
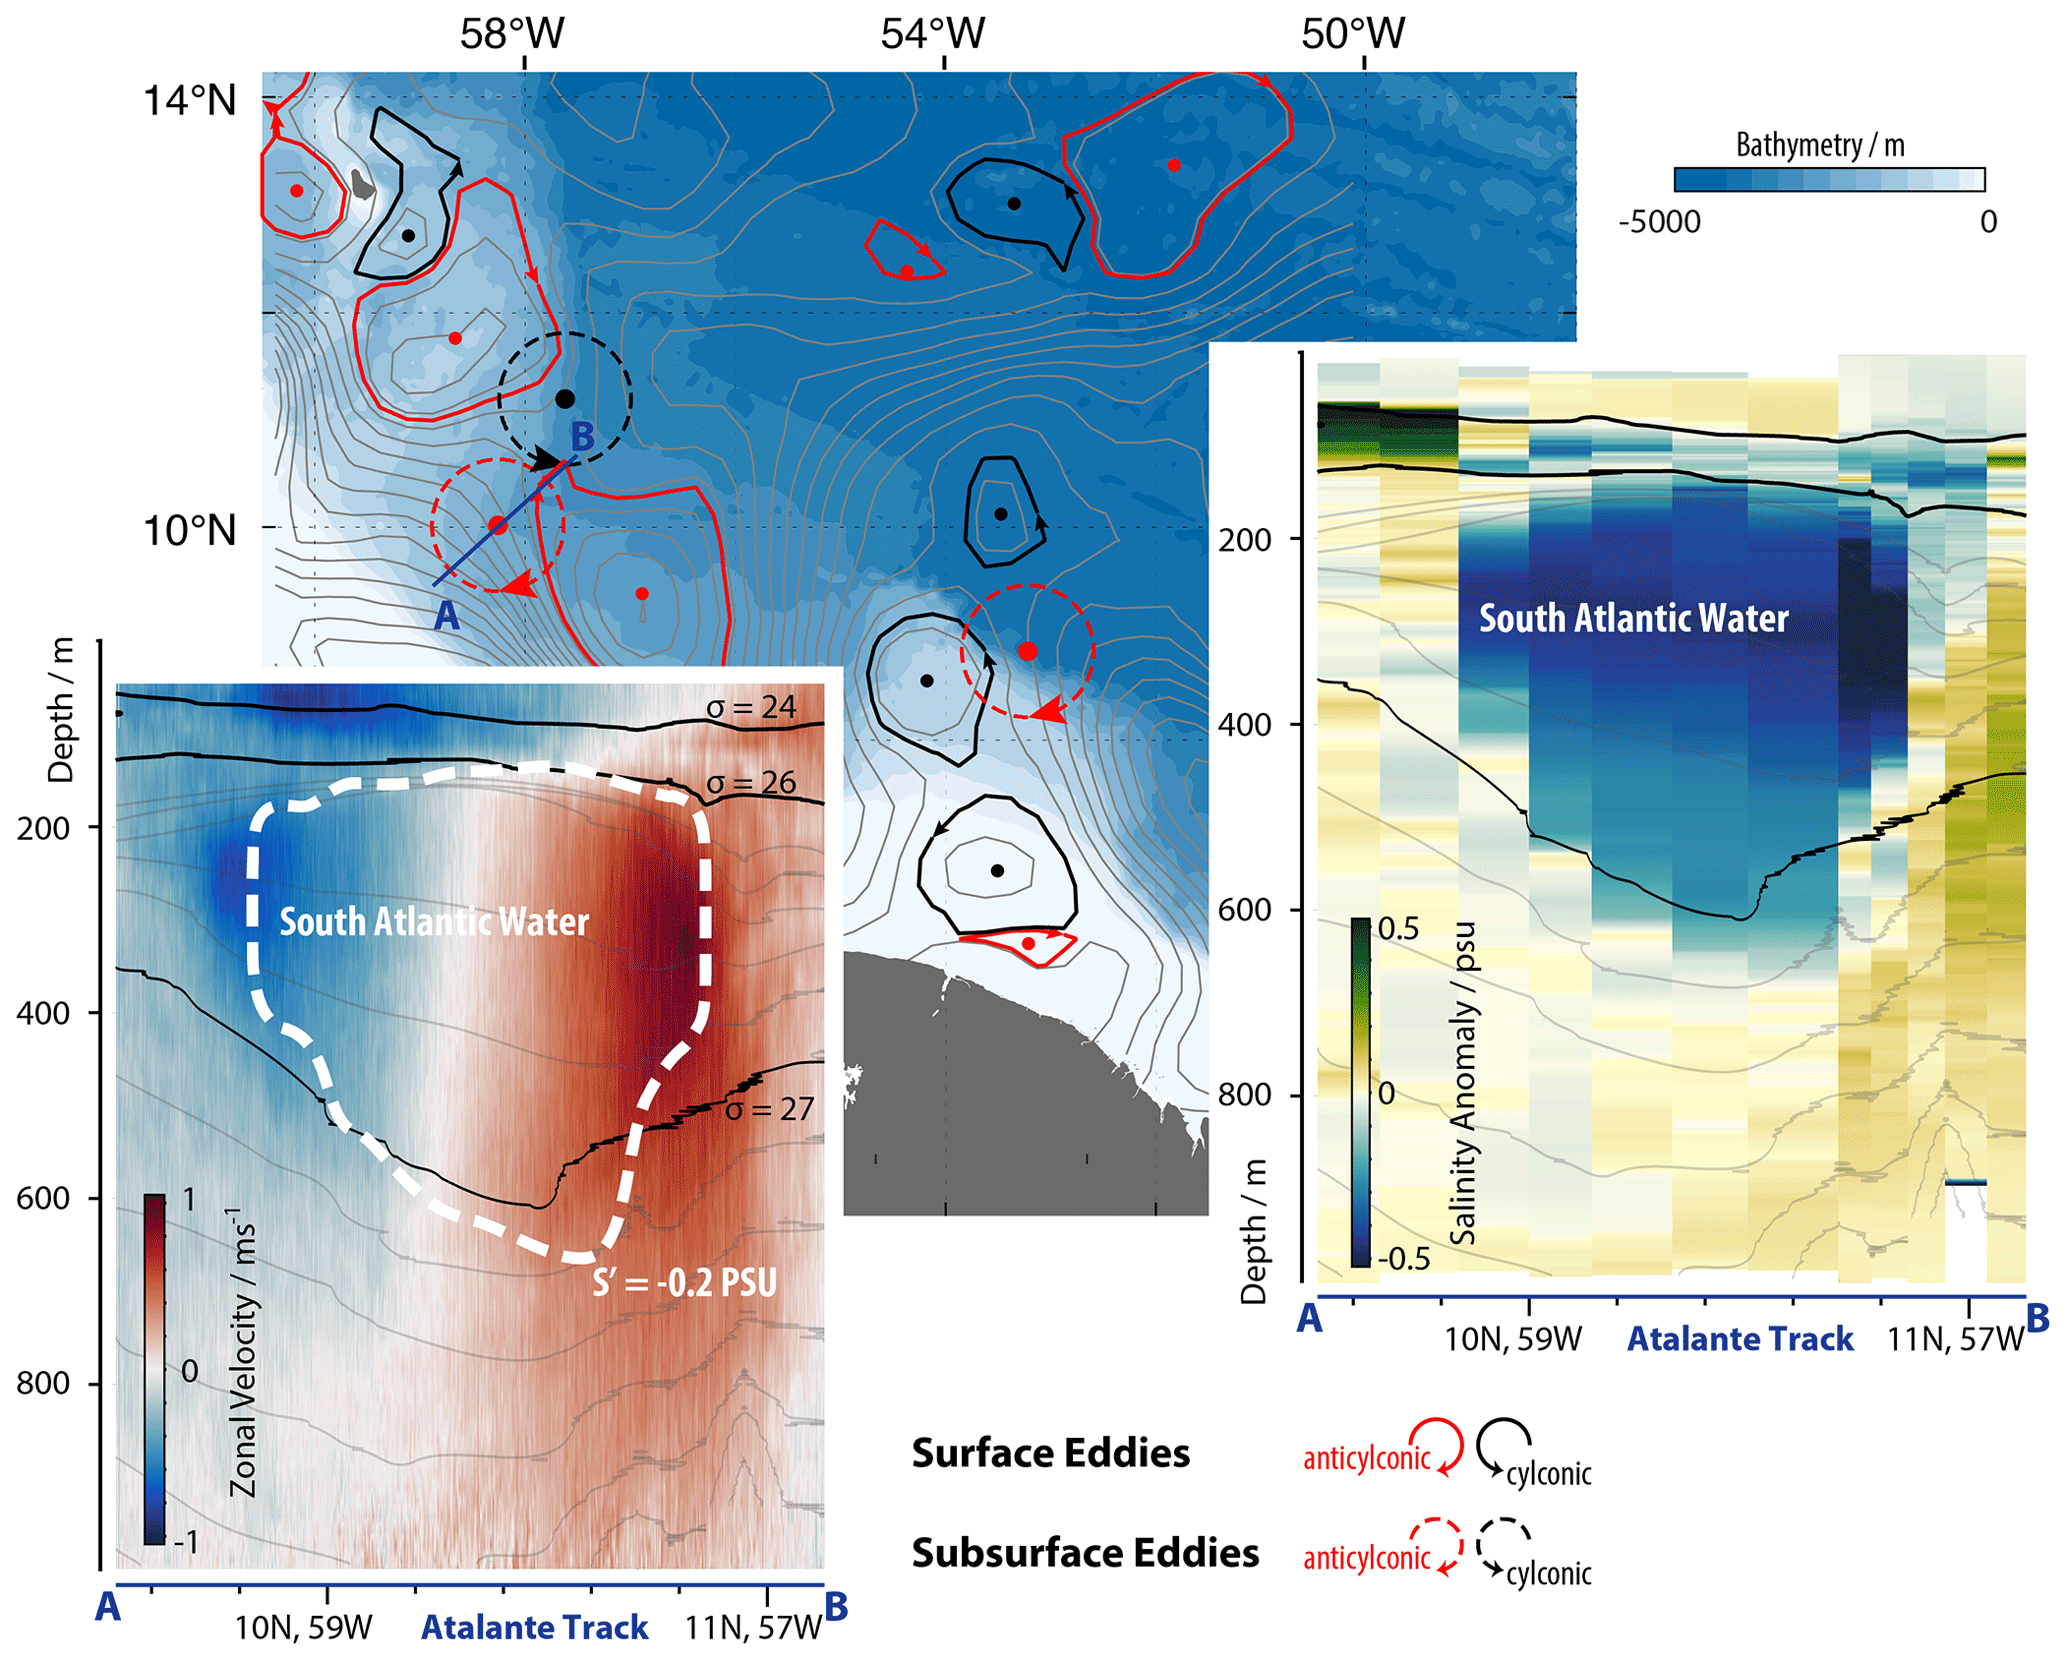
Figure 16Eddies in the Boulevard des Tourbillons (map) with vertical cross section (A–B transect near 10∘ N, 58∘ W on the map) showing ship acoustic Doppler current profiler (SADCP) currents from the R/V Atalante (bottom left) and salinity from CTD casts (right). Surface-eddy field derived from satellite altimetry (Pujol et al., 2016). Eddy contours are detected automatically by the TOEddies algorithm (Laxenaire et al., 2018). The position of subsurface eddies (200 to 600 m deep) as identified from the eddy detection method (Nencioli et al., 2010) applied to vector currents measured by SADCPs are shown by red circles. A subsurface eddy freshwater anomaly is indicative of South Atlantic origins.
The richness of structure observed in the upper ocean during EUREC4A can be quantified by the distribution of surface temperature fronts. All seagoing platforms contributed to observing the upper-ocean temperature structure, surveying a wide region and a large spectrum of ocean scales, and thus can contribute to this measure of upper-ocean variability. An example from one such platform, a Saildrone, is shown in Fig. 15. The sensitivity of frontal density gradients to spatial resolution was explored by subsampling data from 0.08 to 100 km (Fig. 15). For each length scale, the percentage frequency of each density gradient was calculated. This analysis demonstrates that smaller length scales yield larger density gradients. The largest gradients were found at spatial scales of only 1 km and were associated with strong, local freshening. These are believed to be associated with small-scale, but intense, rain showers, a potentially far-reaching idea given the importance of rain for linking processes at different scales in the atmosphere (e.g., Sect. 3.2). The analysis further documents self-similar (power law) scaling between 19 and 1900 km with a slope of −2.3. There is evidence of a scale break at around 25 km. Surface quasi-geostrophic turbulence generally predicts a slope of or steeper (Callies and Ferrari, 2013; Rocha et al., 2016; Lapeyre, 2017).
A wide array of instruments deployed from all four ships (CTDs, underway CTDs, mounted vessel profilers, microstructure profilers, XBTs, XCTDs, Doppler current meter profilers, five BGC Argo floats) and the seven underwater gliders (e.g., Fig. 5) profiled water properties and ocean currents. This array of measurements, guided by near-real-time satellite data and real-time ship profiling, revealed a surprisingly dense and diverse distribution of mesoscale eddies. All of the measured eddies captured by satellite data (Fig. 16) were shallow, extending to a depth of about 150 m (Fig. 16) and transporting warm and salty North Atlantic tropical water swiftly northward. Below but not aligned with the surface structures and separated by strong stratification, large subsurface anticyclonic eddies (and on some occasions cyclonic eddies) extended from 150 to 800 m and carried large quantities of water from the South Atlantic northward. An example sampled by the R/V Atalante along a southwest- to northeast-aligned transect near 50∘ N and 58∘ W is illustrated in Fig. 16. Here a ca. 200 km eddy characterized by a 0.2 PSU freshwater anomaly was measured carrying water, which was likely subducted in the south Atlantic, northward. The anomaly was associated with a circulation of ∼1 ms−1 with maximum velocities near 300 m extending downward to a depth of about 800 m. EUREC4A observations such as these will be essential for understanding the complex dynamics of the upper ocean and the extent to which they can be captured by a new generation of kilometer-scale coupled climate models.
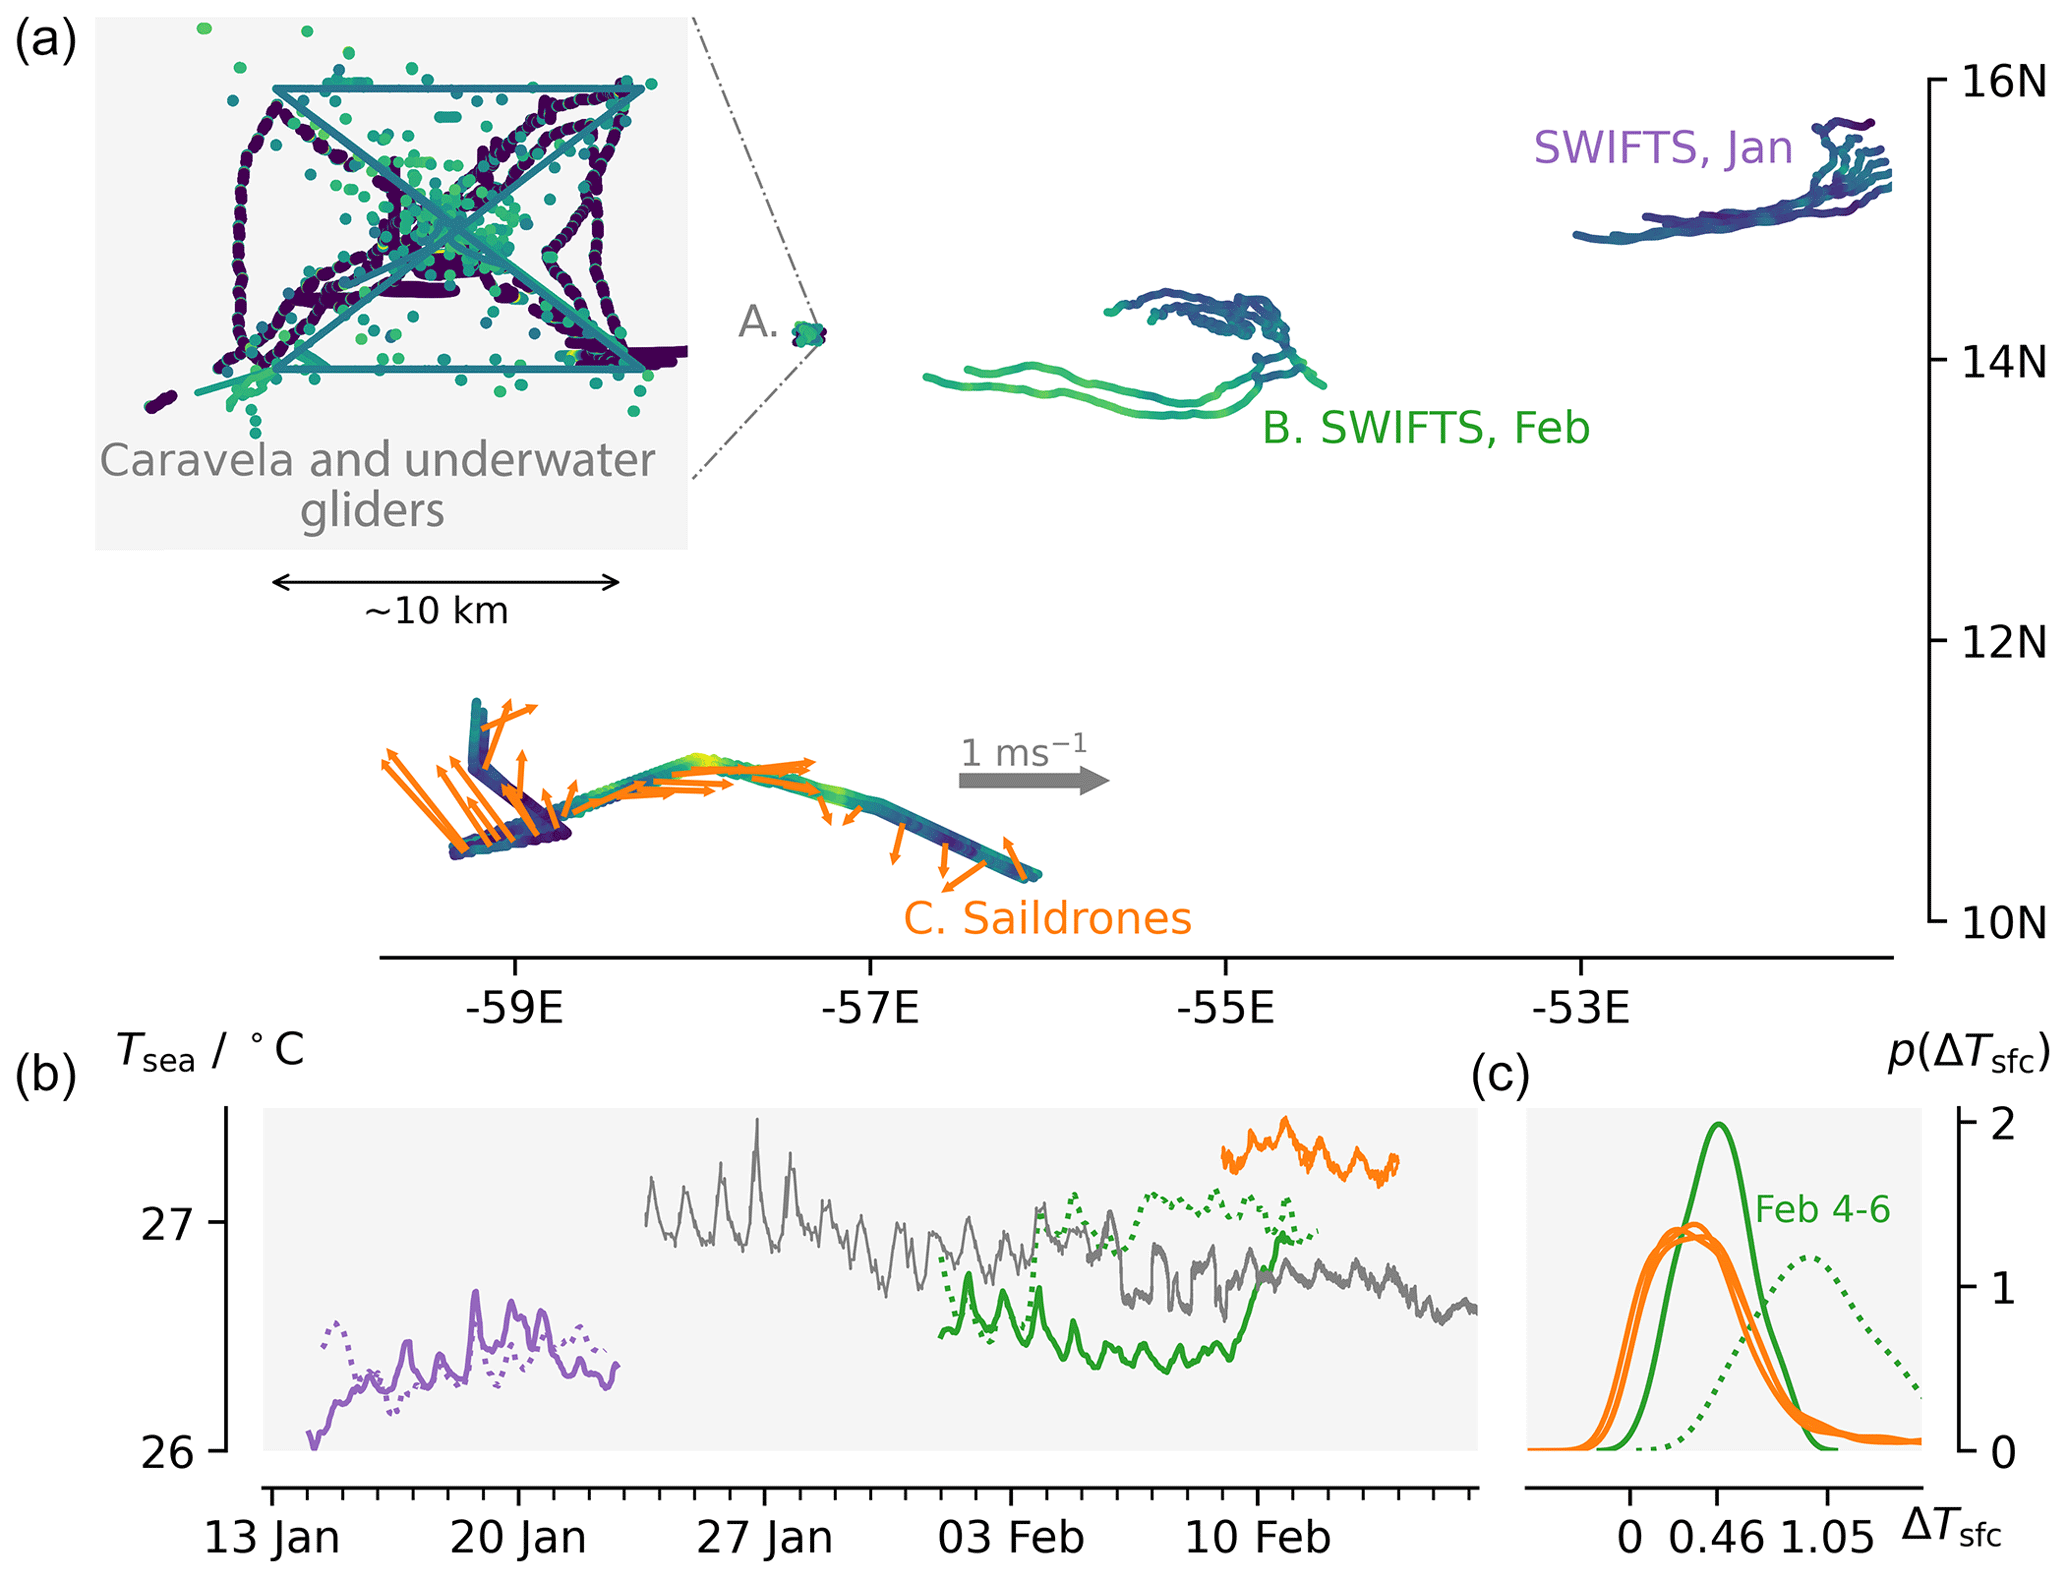
Figure 17Near-surface temperature (Tsea) from drifters and gliders in the three EUREC4A study regions. Panel (a) shows the tracks of the instruments colored by Tsea. The magnification (upper left) expands the domain of the Caravela (and underwater glider) measurements in Region A (near 57∘ W). January and February SWIFT buoy (Tsea at −0.3 m) deployments in Region B. Saildrone (Tsea at −0.5 m) measurements across an eddy near 11∘ N, with anti-cyclonic currents (at −5 m) shown by vectors, in Region C. Panel (b) shows time series of Tsea measurements by the different instruments. Probability density, p, of air–sea temperature differences measured by two SWIFT buoys between 04:00 UTC 4 February and 14:00 UTC 6 February (c).
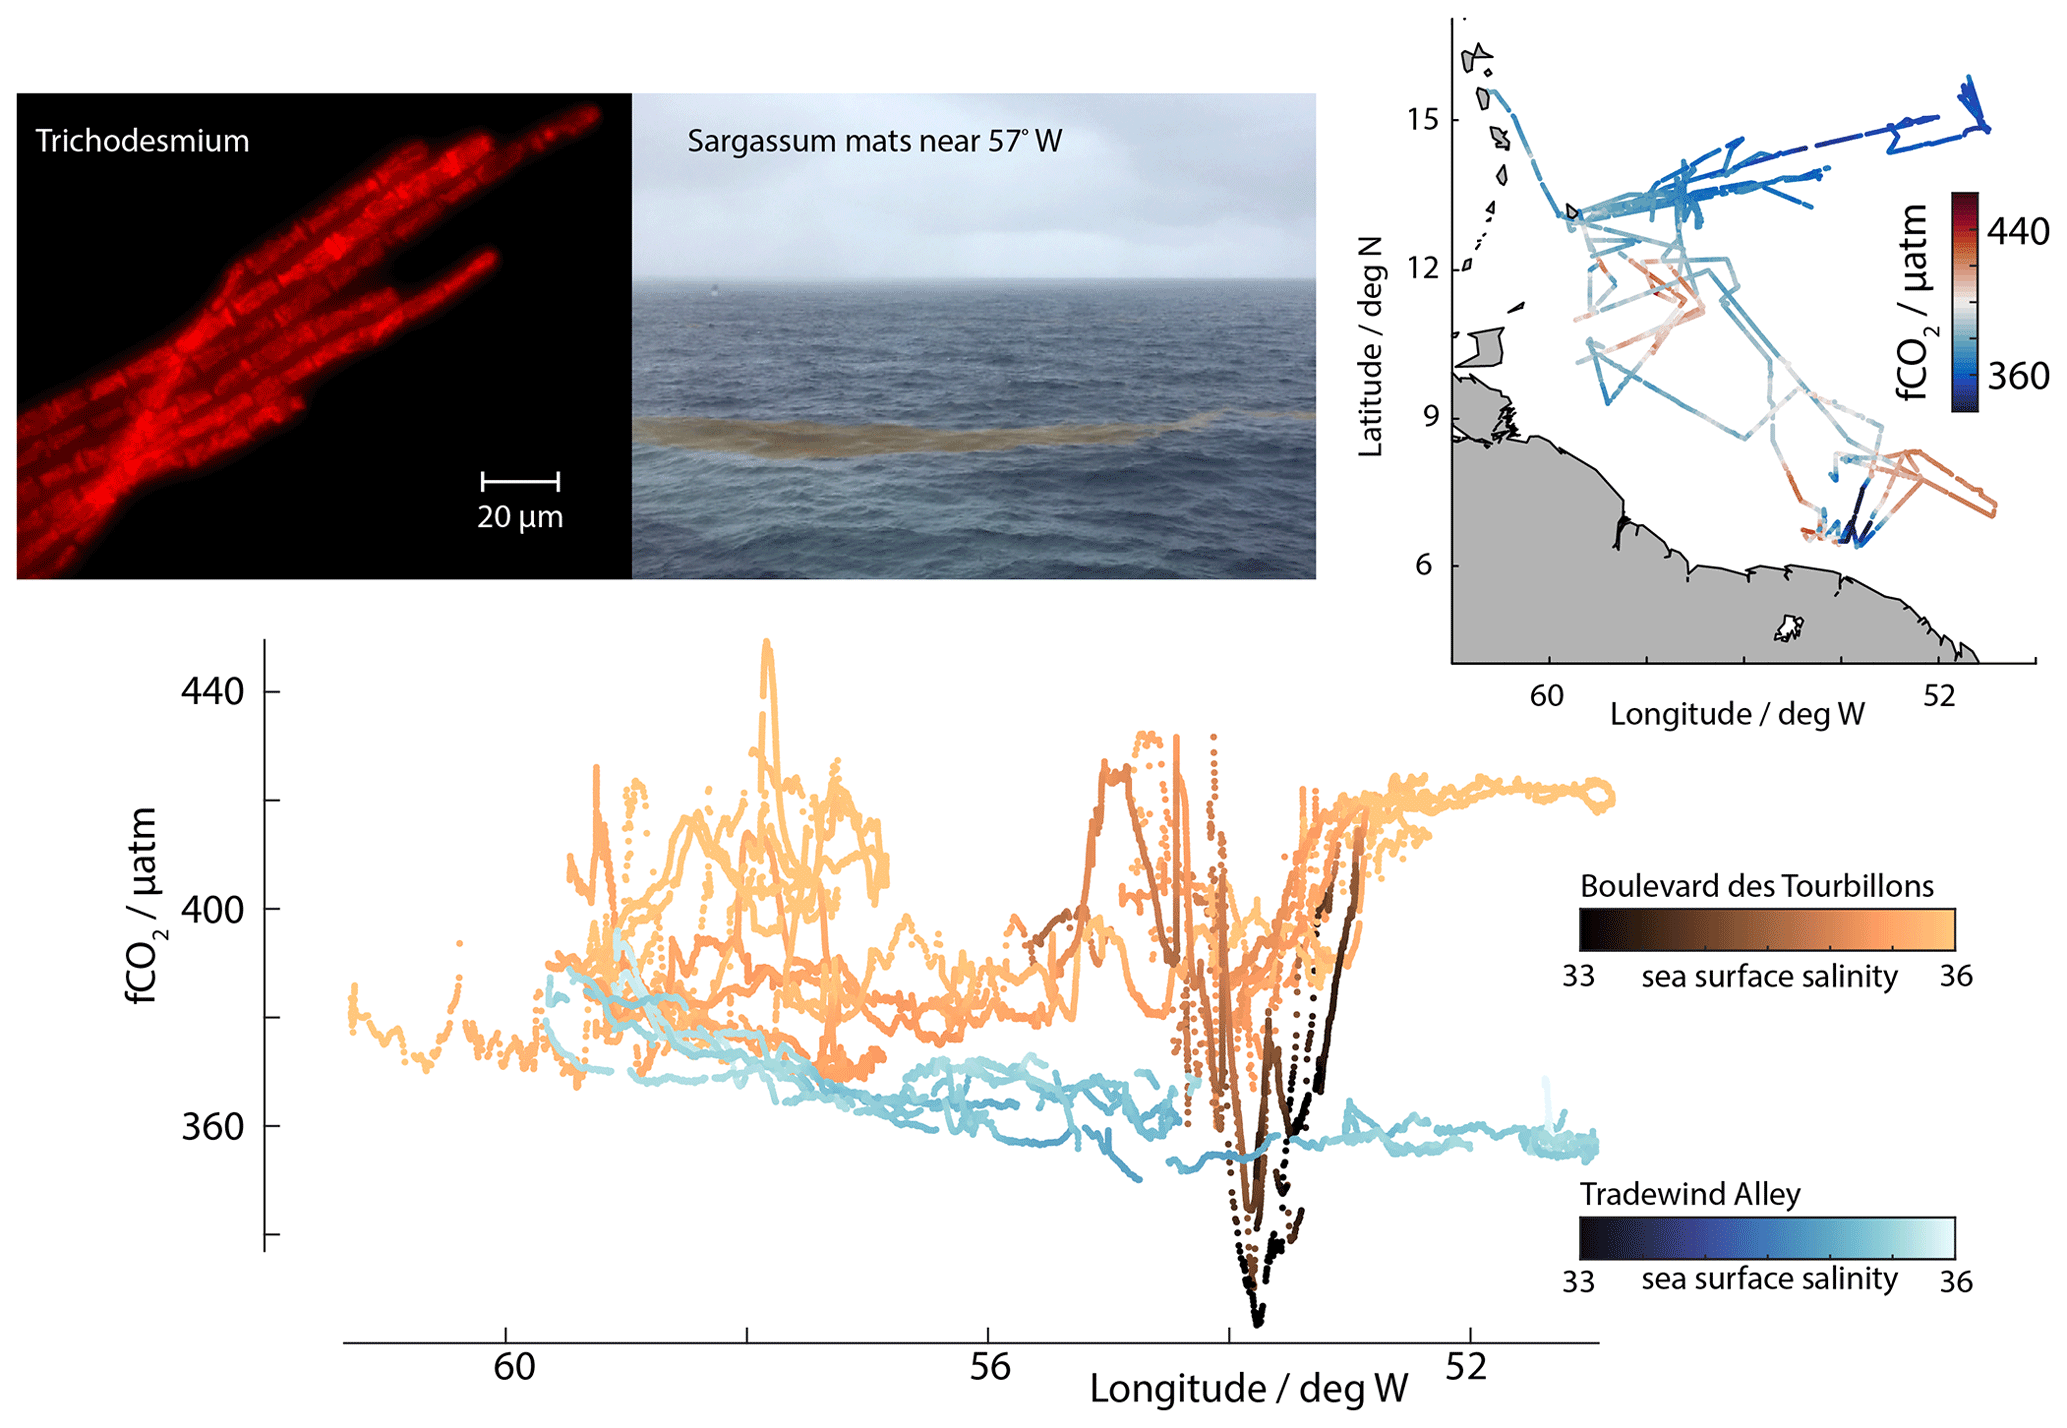
Figure 18CO2 fugacity (fCO2) measurements from different surface vessels (upper right) and versus longitude (lower). The presentation contrasts strong variability in fCO2 in association with eddies and salinity variations along Boulevard des Tourbillons (orange in lower panel, track in upper right) versus in the Tradewind Alley (blues). Microscopic/epifluorescence image of several filaments of Trichodesmium, an N2-fixing cyanobacterium that is found in the region (upper left), and mats of seaweed (Sargassum, photo by Wiebke Mohr, upper center) which were frequently observed and difficult to navigate from some of the uncrewed surface vehicles.
3.5 Air–sea interaction
What distinguished EUREC4A from the many previous campaigns focused on air–sea interaction was its interest in assessing how circulation systems, in both the ocean and the atmosphere, influence surface exchange processes. These interests extended to interactions with ocean biology and their impact on both CO2 exchange and profligate amounts of seaweed (Sargassum) that have, in past years, developed into a regional hazard. To study these processes EUREC4A made use of a flotilla of uncrewed devices and a wealth of nadir-staring airborne remote sensing, specifically designed to characterize the air–sea interface on a range of scales.
Ocean eddies, fronts, and filaments influence the atmosphere by perturbing air–sea surface fluxes (Chelton and Xie, 2010; O'Neill et al., 2012) – a process that may also feed back on the ocean by causing a damping of the (sub)mesoscale activity (Renault et al., 2018). As an example, Sullivan et al. (2020) use large-eddy simulation to show how small-scale ocean fronts perturb the boundary layer through its depth, giving rise to circulations on scales much larger than that of the boundary layer, or of the front itself (their Fig. 12). These lead to large perturbations in vertical mixing and, one can speculate, on patterns of cloudiness. Similarly, clouds influence the downward longwave and shortwave irradiance, which influences both the sea surface temperature and atmospheric temperatures directly, something that Naumann et al. (2019) have shown to commensurately power (2 to 200 km) circulations.
In the area near and within the EUREC4A-Circle (Region A), measurements sought to quantify how surface exchange processes vary with circulation (cloud pattern) regime. Measurements by Caravela (an AutoNaut) and three underwater gliders characterized the air–sea interface in a small, and spatially fixed, (ca. 10 km) region in this domain (Fig. 17). These measurements help untangle spatial from temporal variability, with both a secular (seasonal) cooling of surface waters over the course of the campaign and a variable, but at times pronounced, diel cycle (Fig. 17). In addition, CTD casts, lower atmospheric profiling (with a mini-MPCK and a quadcopter), and eddy-covariance measurements from an outrigger mast were performed by the R/V Meteor as it steamed up and down the 57.25∘ W meridian bisecting the EUREC4A-Circle just upwind of Caravela's box. Rounding out the measurements in this region were low-level Twin Otter, ATR (as part of its “L” pattern) legs, and BOREAL UAS measurements, as well as airborne remote sensing of sea surface temperatures along the EUREC4A-Circle by HALO. Based on preliminary analyses, these measurements are proving useful in quantifying the diel cycle in both the upper ocean and in the lower atmosphere.
Effects of ocean sub-mesoscale processes on air–sea interactions were the focus of measurements in Region B (Fig. 1). On two occasions the R/V Ron Brown deployed six SWIFT drifters (spar buoys) in regions of surface heterogeneity: once in January near the NTAS buoy and again in early February near 55∘ W. The deployments were performed and coordinated with further measurements by the R/V Ron Brown, as well as by the P-3, two Wave Gliders, and a Saildrone. The P-3 (see also Figs. 4 and 2) dropped AXBTs around the SWIFTS, quantified air–sea exchange with near-surface flight legs, and surveyed the near-surface wind and wave fields using remote sensing. Figure 17 documents how, during the February deployment, the SWIFTS sampled large 0.5 K mesoscale (ca. 30 km) variability in sea surface temperature (SST) features. This variability gives rise to air–sea temperature differences twice as large as the baseline, as inferred from the average of measurements over longer periods (i.e., as shown by the Saildrone data, orange lines) and is characteristic of the SWIFT data away from the local feature in surface temperatures (e.g., green solid line in Fig. 17).
In the Boulevard des Tourbillons (Region C), coordinated sampling between Saildrones and two research vessels aimed to quantify mesoscale and submesoscale air–sea interaction. Submesoscale variability and strong near-surface currents, with a circulation indicative of an NBC ring, were measured by the Saildrones (Fig. 17). These measurements were coordinated with the activities of the R/V Atalante and R/V MS-Merian, as well as three underwater gliders (e.g., Fig. 4). Extensive vertical profiling, also by high-speed underway CTDs, aimed to quantify the impacts of submesoscale fronts and filaments and mesoscale eddies on surface exchange processes, and vice versa. Being able to resolve the thermal structure of the upper ocean should also help quantify the importance of the O(0.3 K) cool-skin effect and diurnal warming just below the skin layer (Fairall et al., 1996) on ocean mixing and air–sea exchange.
Factors, including the role of meso- and sub-mesoscale variability, influencing air–sea gas exchange were also studied. pCO2 measurements were made on the R/V Atalante, R/V MS-Merian, and the R/V Ron Brown (Fig. 18). In addition, both the R/V MS-Merian and R/V Meteor regularly sampled water at four different depths (selected based on chlorophyll concentrations) for N2 fixation and primary production rates as well as potential aerobic methane production. DNA- and RNA-based sequencing will additionally be performed on these water samples to identify diazotrophic community members, potentially including so far unrecognized members. Furthermore, large floating mats of seaweed (genus Sargassum) were observed from all crewed platforms. On the R/V MS-Merian, to investigate if, and to what degree, this biomass and primary production can be supported by local N2 fixation, incubation experiments including stable isotopes were conducted on seaweed samples that were collected underway. In addition to extending studies of air–sea interaction to incorporate chemical and biological processes, EUREC4A may also shed light on the role of meso- and submesoscale ocean circulations on these chemical and biological processes.
Figure 19Global 2.5 km mesh simulations performed by ICON as part of DYAMOND-Winter for the EUREC4A period. The snapshot, with a magnification over the study region to show the degree of detail in the simulations, was taken from 2 February of a simulation initialized on 20 January and allowed to freely evolve thereafter.
3.6 Benchmarks for modeling and satellite retrievals
The range of scales and types of processes that can presently be captured by both satellites and models, and the extent to which they were integrated into EUREC4A's experimental design (see Bony et al., 2017), allows EUREC4A to address questions that could not be addressed with data from earlier field studies. For instance, what resolution is required for atmospheric models with an explicit (fluid-dynamical) representation of clouds and convection to represent the vertical structure of the lower troposphere, and its interaction with mesoscale vertical motion and upper-ocean variability, within the observational uncertainty? The fine scale of the EUREC4A measurements also makes it possible to quantify satellite retrieval uncertainty, for instance for measurements of small-scale precipitation features, cloud microphysical properties, or column energy budgets (Illingworth et al., 2015).
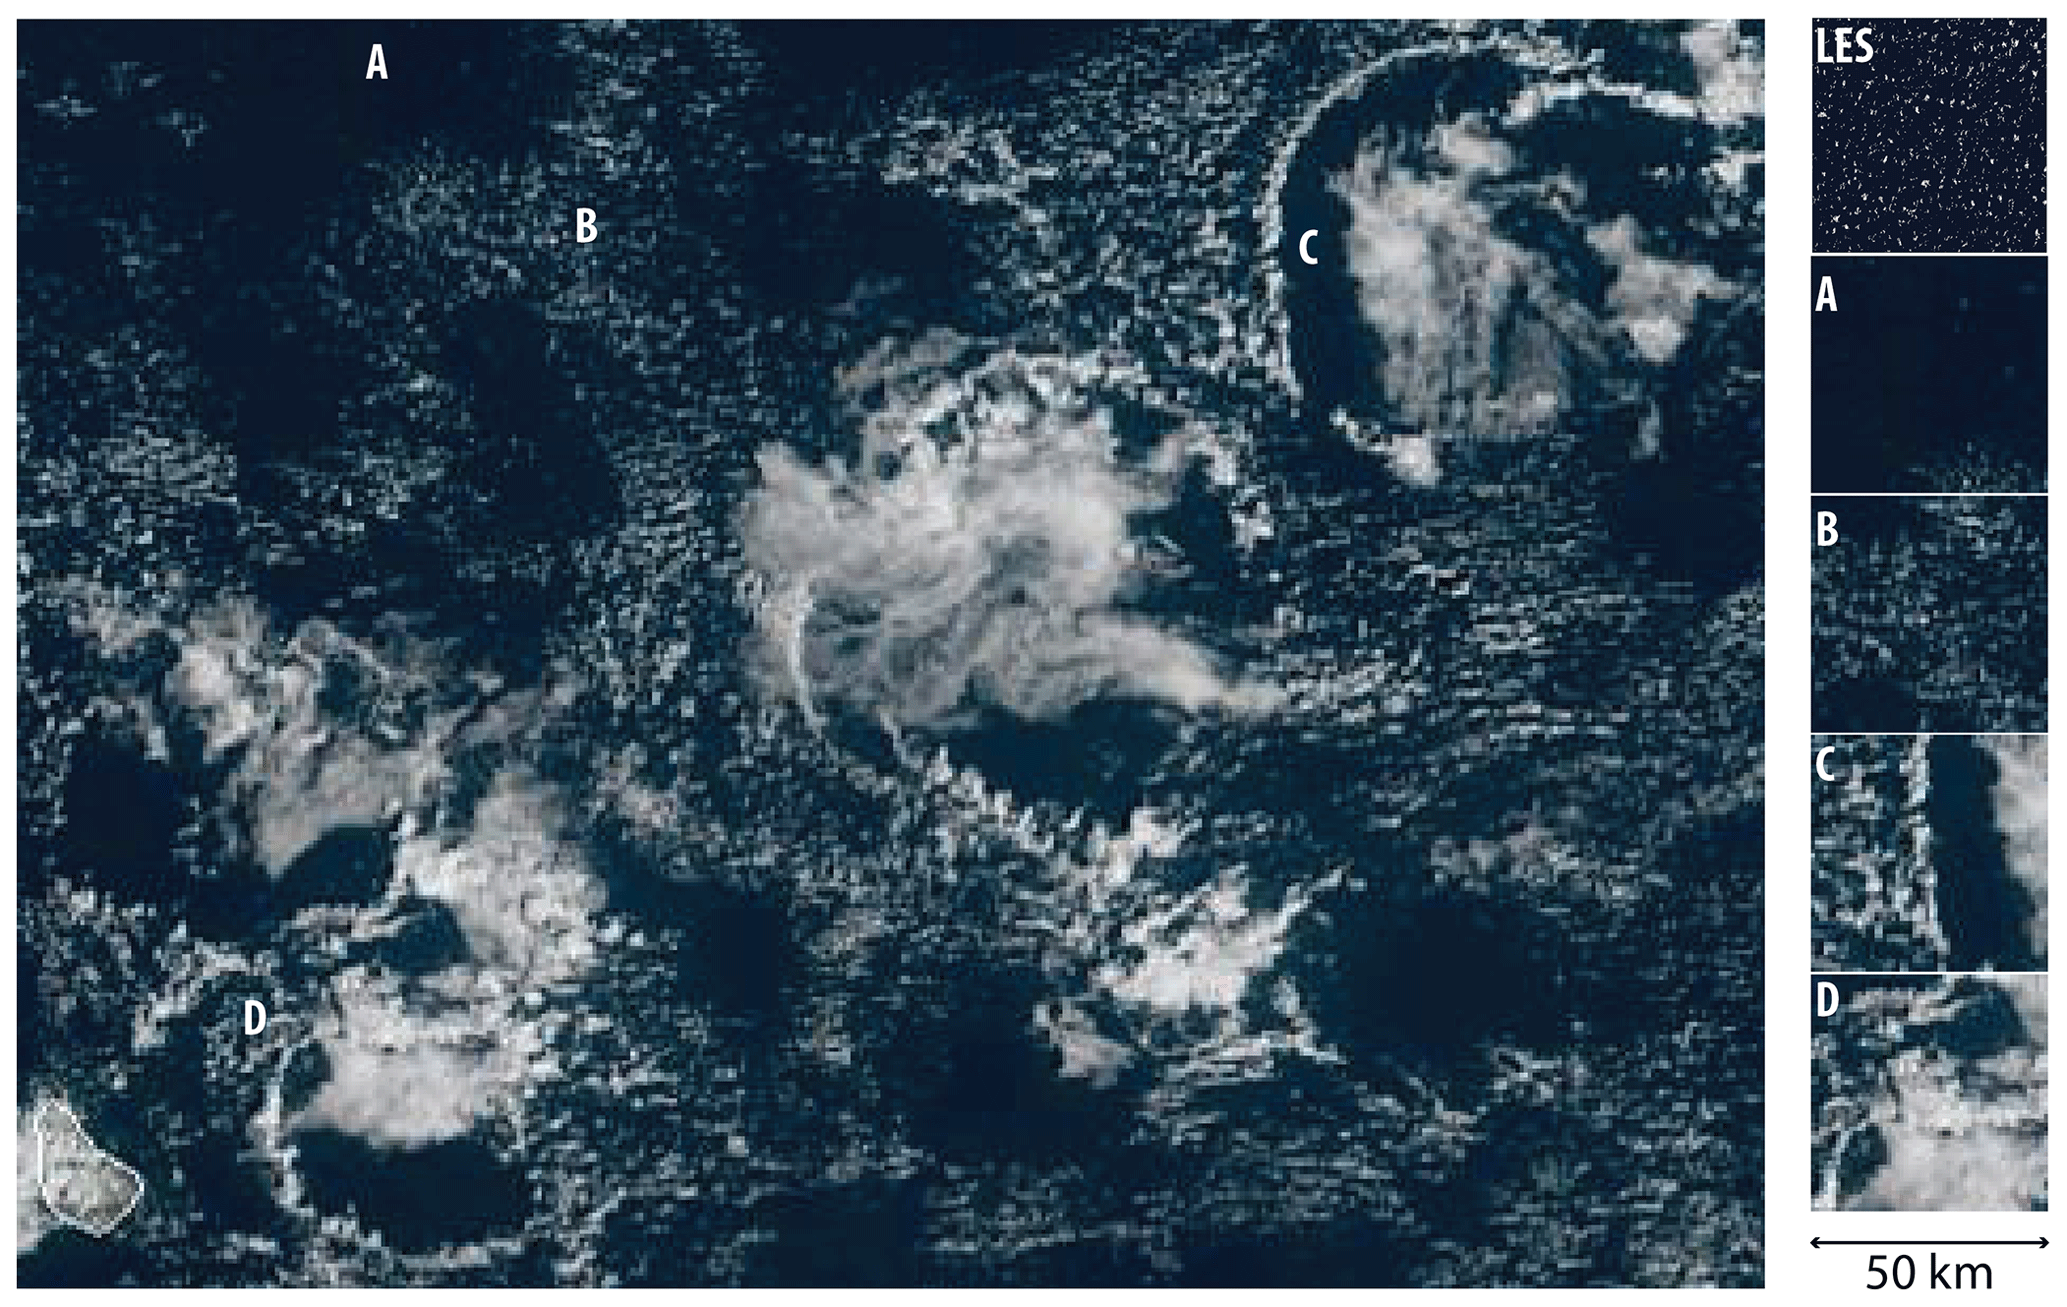
Figure 20Geostationary satellite image showing the cloud field in the measurement area on 5 February 2020. Snapshots of cloud fields over 50 km × 50 km subdomains labeled “A” to “D” are compared to large-eddy simulation. The large-eddy simulation employed a 100 m mesh, doubly periodic horizontal boundary conditions, and horizontally homogeneous mean forcing is estimated from measurements in the vicinity of subdomain “D”.
For these purposes EUREC4A was closely coordinated with efforts to develop and test a new generation of Earth-system models. Recently, following the pioneering efforts of Japanese colleagues (Tomita et al., 2005), a number of groups in other countries have demonstrated – within the DYAMOND5 project (Stevens et al., 2019c) – the capability of performing kilometer-scale simulations on global (atmospheric) grids (Satoh et al., 2019). A follow-up, called DYAMOND-Winter, is extending this capability to also include coupled global models and has been coordinated to simulate the EUREC4A period. DYAMOND-Winter simulations are being initialized from observational analyses on 20 January and run for at least 40 d. With grid scales of a few kilometers in the atmosphere (and ocean for coupled runs) the simulations explicitly represent scales of motion similar to those observed, all as part of a consistently represented global circulation. This enables investigations of processes influencing the mesoscale organization of fields of shallow convection, including the possible role of surface ocean features, as well as a critical evaluation of the simulations.
An example of an uncoupled DYAMOND-Winter simulation using ICON is given in Fig. 19. The simulated cloud fields exhibit rich mesoscale variability whose structure, while plausible, begs a more quantitative evaluation. The combination of the field measurements and simulations with realistic variability on the mesoscale will aid efforts to test retrievals of physical quantities from satellite radiances. This should make it possible to establish a self-consistent and quantitative understanding of controls on cloudiness.
In addition to the global coupled modeling activities, coordinating modeling activities using much-higher-resolution (meters to tens of meters) simulations of the ocean, atmosphere, and the coupled system over a limited area are ongoing. These include idealized simulations with doubly periodic boundary conditions, atmospheric simulations designed to track the Lagrangian evolution of the flow, and simulations with open boundaries matched either to meteorological/oceanographic analyses or the free-running global simulations. Few if any field studies have benefited from such a rich complement of modeling activities.
Some of the challenges to evaluating these simulations are illustrated with the help of preliminary, but idealized, large-eddy simulations with the forcing specified based on preliminary data in a manner similar to what has been adopted in past studies (e.g., Stevens et al., 2005; vanZanten et al., 2011), albeit (in the present case) over considerably larger domains. Figure 20 shows, with the help of a satellite image, the degree of mesoscale cloud variability. This apparent whimsicality suggests that, given the imprecision in the forcing and the cloud retrievals, assessing the magnitude of systematic biases in the simulations will be a challenge. In this case, the simulations performed for the mean conditions in the vicinity of “D” seem implausible. The challenge will be to assess to what extent this reflects imprecision in the forcing, of the sort that differentiates the different marked regions in the figure.
Given a demonstration that fine-scale models can quantitatively represent the macro-structure of the observed clouds, EUREC4A measurements are expected to provide benchmarks for the simulation of cloud microphysical process. This would allow the first ever evaluation of the ability of microphysical models, which depend on a variety of parameterized processes, to quantitatively represent precipitation formation processes in realistically simulated cloud fields. Previous attempts (Ackerman et al., 2009; vanZanten et al., 2011) at making such an evaluation have highlighted large differences in models, but it remains unclear to what extent these differences are due to the representation of cloud macrophysics versus microphysics. Greater confidence in the fidelity of these simulation approaches will also greatly benefit their application to questions in remote sensing.
3.7 Scientific outreach and capacity building
A core, and hopefully sustainable, feature of the EUREC4A field campaign was the rich human and scientific interactions with the Barbadian public, the regional research community, and the larger community of scientists from outside of the region. Activities that permitted these exchanges included operational support for flight planning, inclusion in flight teams and on-ship data collection teams, weekly seminars, a larger symposium, and scientific outreach to schools and to the general public. A total of more than 25 researchers from the region as well as representatives of regional governments contributed to the data collection. This participation was essential not just for meeting EUREC4A's original objectives, but it also expanded the scope of activities to include the development of regional climate resilience and capacity building in the use of advanced weather and climate early warning systems.
3.7.1 Operational support
Daily operational meetings were hosted at a facility shared by the Barbados Meteorological Service and the Department of Civil Aviation. Scientists from national meteorological services across the region supported the effort by providing daily weather forecasts, which helped to coordinate the measurements for the following days. The European Centre for Medium-Range Weather Forecasts and national weather services in France, Germany, the Netherlands, the UK, and the USA supported these activities by providing access to output from global models at 10 km resolution and regional forecasts made specially for the region on kilometer-scale grids. The daily weather discussions provided an opportunity for scientists from different teams to discuss and analyze the early results of the campaign and the perspectives ahead. For example, during one of these meetings it was learned that the mesoscale cloud patterns identified as “fish” in the recent literature have long been termed “rope” clouds by the regional forecast community.
3.7.2 Symposium and scientific seminars
Knowledge transfers of immense value were facilitated by the organization of regular scientific presentations that provided an opportunity for exchange among EUREC4A participants and researchers at the Caribbean Institute for Meteorology and Hydrology (CIMH). It is expected that such exchanges will sustain collaborations well beyond the campaign. Keynote presentations at the Barbados Museum and Historical Society brought to a general audience the goals of the EUREC4A campaign, the very early history of meteorology on Barbados, and issues or relevance to climate change and related adaptation.
Campaign participants also celebrated the 50th anniversary of the Barbados Oceanographic and Meteorological EXperiment (BOMEX) field campaign with a 2 d public symposium entitled “From BOMEX to EUREC4A”. The symposium brought together a varied audience, including regional and international scientists, EUREC4A participants, and students from the University of the West Indies Cave Hill Campus (Fig. 21). The symposium provided an opportunity to reflect upon the evolution of climate research during the past 50 years. From fascinating speeches by BOMEX veterans, to presentations describing the state of present-day understanding as expressed in EUREC4A's objectives, the symposium helped contextualize the efforts being made as part of EUREC4A.
In December 2019, prior to the start of the EUREC4A campaign, the Caribbean Meteorological Organization (CMO) Headquarters Unit and the University of Leeds, with the assistance of CIMH, organized a Caribbean Weather Forecasting Initiative workshop at CIMH to promote knowledge exchange between researchers and forecasters from CMO members and other Caribbean states. This activity supported the EUREC4A forecast testbed, in which many of the regional forecasters who participated in the workshop provided some of the daily forecasts previously discussed.
Figure 21“From BOMEX to EUREC4A” symposium participants (photo by Frédéric Batier). Pat S. R. Callender (front, third from right) and Clyde Outram (front center, with cane) participated in BOMEX.
3.7.3 Scientific outreach in schools and facility visits
Scientific outreach activities, such as school visits and scientific open houses, sought to sensitize the public, in particular school children, to the EUREC4A program and its important role in addressing issues of severe weather and climate change. Together with the CIMH, and the Barbados Ministry of Education, 10 visits to primary and secondary schools in Barbados were arranged. Simple experiments were designed and performed with the children to help build intuition as to the underlying atmospheric and ocean processes relevant to EUREC4A's scientific objectives, not to mention the weather phenomena that surrounds them on a daily basis. These outreach efforts aimed to raise awareness in ways that would increase the resilience of the region to weather and climate extremes, to support citizen science, and to expose young people to scientific career paths.
The open houses consisted of guided tours of many of the measurement platforms. This included tours of the research ships; visits to the BCO at Deebles Point, St. Philip (where visitors could help launch radiosondes); the aerosol measurement facility on nearby Ragged Point; BOREAL, Skywalker, and CU-RAAVEN drone launches at Morgan Lewis Beach, St. Andrew; and tours of the POLDIRAD radar at Colleton, St. John. As an informal complement to the symposium, the outreach activities provided a window into the daily life of the campaign and gathered a diverse audience, from local Barbadians to the scientists involved in EUREC4A. The success of EUREC4A's outreach efforts is perhaps best exemplified by the ad hoc team of young engineers (Fig. 22) that helped flight proof the drones before their launch from Morgan Lewis Beach.
Further activities included members of the scientific team planting trees as part of Barbados' “We Planting” initiative. In parallel to the scientific campaign, two French filmmakers also visited Barbados for the duration of the EUREC4A field campaign to shoot a documentary combining scientific, cultural, and historical elements of the island of Barbados. From their material an additional short scientific documentary of the campaign was created and is provided as a Supplement (video asset) with this paper.

Figure 22Local children helping to evaluate air worthiness of CU-RAAVEN UAS prior to launch from Morgan Lewis Beach (photo by Sandrine Bony).
EUREC4A advanced a culture of open and collaborative use of data. It did so by initiating a series of discussions, starting well before the field campaign and culminating in a document outlining principles of good scientific practice. In arriving at these principles emphasis was placed on understanding the differing cultural contexts in which data are collected. For instance, the degree to which measurements are made by individual investigators, or made for investigators by institutions, were often colored by different national practice. Differences in how measurements are made lead to differences in expectations as to how the resultant data should be made available and used and thus reflect this national coloring. EUREC4A defined “good scientific practice” in terms of four principles, summarized below:
-
To actively support the initial dispersal of data by making (even preliminary) data available to everyone as quickly as possible through the AERIS archive.
-
To publish finalized data in ways that ensure open and long-term availability and bestow appropriate credit on those who collected it.
-
To actively attempt to meaningfully involve those who collected data in their analysis at the early stages of their use.
-
To provide clear, timely, and unprompted feedback on the use of the data, both by the analysis community for the instrument groups and vice versa.
Most of the data collected during EUREC4A are already available on the AERIS archive, much of them are described by data papers published, or being published, as part of this ESSD special issue.
Examples of “bad practice” were also outlined – for example (i) in the first years after the campaign using data for specific analysis without asking the data provider whether/how this analysis overlaps with his/her current analysis efforts, (ii) using someone's data to write a paper and then sending the paper to the data providers only as it is about to be submitted and offering authorship, or (iii) by assigning co-authorship on the basis of someone's status rather than through substantive contributions. “Good practice” would have been to intellectually involve the data provider at an early stage of the study. “Good practice” also recognized the importance of providing intellectual space for young scientists to independently develop their ideas – giving them a bit more time to recognize and reach what a more experienced colleague might more immediately recognize as low-hanging fruit.
Authorship of the present paper recognizes all technical/scientific contributions to the data collection. The ways in which each author contributed to EUREC4A are summarized in the Supplement on author contributions.
4.1 Data
The data collected during EUREC4A will, in different stages of development, be uploaded and archived on the AERIS data center. The AERIS data center is part of the French Data Terra research infrastructure, which has the objective to facilitate and enhance the use of atmospheric data, whether from satellite, aircraft, balloon, or ground observations, or from laboratory experiments. It generates advanced products and provides services to facilitate data use, to prepare campaigns, and to interface with modeling activities.
In addition, emphasis is being placed on the publishing of datasets through a special collection of articles in Earth System Science Data. Many of these data papers will involve the construction of cross-platform datasets, for instance for the upper-air network, or dropsondes, isotope measurements, or classes of remote sensors. At the end of the data collection phase, all data on AERIS will be mirrored by the Caribbean Institute for Meteorology and Hydrology in Barbados.
4.2 Environmental impact
EUREC4A was motivated by an interest to better anticipate how Earth's climate will change with warming. This makes it all the more relevant to ask how EUREC4A exacerbates the problems it attempts to understand, or more pertinently, whether it made appropriate use of scarce resources. The first step in answering this question is to estimate the magnitude of its environmental impact. We do so here mostly in terms of EUREC4A's carbon footprint, which we estimate (see Appendix A for details) to be 5000 t of CO2. The marginal increase – EUREC4A took place at the expense of other campaigns – is of course much less. The main contribution to the carbon footprint was from fossil fuels (kerosene and diesel) used to power the research platforms. The travel of the participating scientists contributed non-negligibly (5 %) to EUREC4A's carbon footprint and provides context for the total emissions.
When learning about EUREC4A many people become concerned about the environmental impact of the dropsondes – a concern shared by some of the present authors. The sondes have been designed to sink to the ocean floor after descending to the sea surface. As elaborated upon in Appendix A, this along with the choice of materials (including batteries), and their small size (which with planned modifications may be reduced by a further factor of 2), results in the environmental impact of the use of even a very large number of sondes themselves being minimal. One hesitates to call any environmental impact negligible, but compared to many of the other activities – let alone the initial emotional response to the idea of throwing objects out of an aircraft – this is probably an apt description.
The potential of using yet smaller sondes, or smaller platforms in general, to further reduce environmental impacts was vividly illustrated by EUREC4A's extensive use of robotic sensors (uncrewed aerial systems, UASs; autonomous ocean-observing platforms, AOOPs). In many cases these provided more agile and less energy intensive ways of sampling the environment. For instance, the Saildrones, Wave Gliders, and AutoNaut (Caravela) make use of renewable energy sources for their propulsion (e.g., wind for Saildrones, waves for the Wave Gliders and AutoNaut), and for their scientific sensors (solar panels).
Validation for EUREC4A's use of the resources was experienced not just through the data collected, but also through the social interactions that the campaign enabled. These, as discussed in Sect. 3.7, were expressed in bonds of friendship that were established and through the many opportunities that were presented through the outreach and capacity building activities (Fig. 22). Further validation of EUREC4A's use of resources depends on how the gained data advances scientific understanding to help humanity. This ultimately depends on what is done with the data – something over which we, the authors, have considerable influence and responsibility. We very much hope this realization will motivate a determination to learn as much as possible from the EUREC4A measurements and that the importance of supporting such efforts is recognized by funding agencies. We also acknowledge the imperative this creates to make the hard-won data easy to access and use, e.g., through data papers, and to also communicate what we learned from our efforts, as widely and freely as possible.
A standardized (CF-1.8 compliant) track data set provides the trajectory data for the 59 mobile platforms deployed during EUREC4A. Trajectories are described by the latitude and longitude (and altitude or depth as applicable) of each platform as a function of time. Airborne platforms are segmented by flight. The data are freely available on the AERIS archive (https://doi.org/10.25326/165, Stevens, 2021). The EUREC4A film is freely available on the AERIS archive (https://doi.org/10.25326/224, Lena et al., 2021).
Field studies are commonplace, and each – by virtue of taking a snapshot of nature at a given point in time and space – is unique and unprecedented. This is in itself not particularly remarkable. Field studies involving such a large number of investigators and such a large degree of coordination, as was the case in EUREC4A, are uncommon, but also this represents little more than an organizational achievement. Moreover, many of the questions EUREC4A attempted to address have been the focus of past field studies. For instance, air–sea interaction was at the heart of the original Barbados field study, BOMEX (Holland and Rasmusson, 1973). Likewise a great number of studies, most recently the Convective Precipitation Experiment (Leon et al., 2016) and Rain in Cumulus over the Ocean (RICO Rauber et al., 2007), had warm-rain formation processes as a central focus. The influence of boundary layer processes on cloud formation was already extensively studied by Malkus (1958) and again more recently by Albrecht et al. (2019). Field studies to measure aerosol–cloud interactions are myriad and include very large international efforts such as the Indian Ocean Experiment (Ramanathan et al., 2001). And with new insights from modeling, an increasing number of studies have begun to focus on ocean meso- and submesoscale dynamics (Shcherbina et al., 2013; Buckingham et al., 2016; D'Asaro et al., 2018). What made EUREC4A an improvement was neither its size nor many of its specific questions – rather it was EUREC4A's ability to quantify a specific process: the link between circulation and cloudiness. Doing so opened the door to characterizing the totality of processes believed to influence the structure of the lower atmosphere and upper ocean in the region of the trades. This is what made EUREC4A special.
The execution of EUREC4A was successful. All of the measurements we set out to make have been made. For some key quantities, such as the mean mesoscale vertical motion field, preliminary analyses (e.g., Fig. 9) suggest that the measurements sampled substantial variability, which bodes well for testing the hypothesized link between cloudiness and cloud-based mass fluxes. The analysis of other measurements, such as those that aim to quantify clouds, is more delicate and ongoing. We anticipate that each step of the subsequent analysis of the EUREC4A data will teach us a great deal more about the ways of clouds, how they couple to circulation systems on different scales, how they influence and are influenced by the upper ocean, the extent to which they are susceptible to perturbations in the aerosol environment, and how precipitation links processes across scales. At the very least a better quantification of these sensitivities should help us understand to what extent a warmer world will express the majesty of the clouds in the trades less markedly.
With a specific density of 0.82 kg L−1 we can compute the total CO2 emissions from aircraft operations as 629 497 L ×3 kg CO2 kg-fuel ×0.82 kg-fuel L 548 562 kg of CO2 emissions, or roughly 1500 t.
Table A1Fuel consumption from EUREC4A crewed aircraft. Some fuel burn rates were reported in pounds (lb) and were converted to liters using a conversion of 1.76 lb L−1.

Estimates of the fuel consumption for the research vessels are larger as they operate around the clock and support the life of a community of scientists and their laboratories at sea. They are also more roughly estimated. We begin with numbers from the R/V Meteor, which burns sulfate-reduced diesel. Its burn rate is estimated as 5000 L d−1 when stationary and as much as twice that much when under way. Given that the ships were generally steaming but with station work mixed in, we adopt a burn rate of 8000 L d−1. Diesel is denser than kerosene and produces more CO2 per kilogram. We adopt a conversion of 3.15 kg of CO2 for every kilogram of diesel and a density of 0.85 kg L−1. Based on this we estimated that the R/V Meteor burned 21 420 kg d−1. The reported fuel use for the R/V Ron Brown was 79 922 gallons or 363 333 L, which included the ferry to and from a home port. This fuel burn corresponds to 972 823 kg of CO2. Assuming 35 d of operations, this corresponds to a burn rate of 10 380 L d−1. For our estimates we adopt the 8000 L d−1 burn rate for all the ships and estimate 5 d of ship ferry time, so for four ships each with 30 d−1 of ship time we end up with a total emission of 3000 t of CO2, which is about twice the direct emissions from the research aircraft. The ship numbers are not offset by the reduced personal emissions of those on the ship, i.e., who do not need hotels, or rental cars, or the operation of their home labs, and often have reduced travel, but this is likely minor.
We estimated that 200 people traveled to EUREC4A. If each is further assumed to have flown 15 000 km (about the round-trip distance from Frankfurt to Grantley Adams International Airport in Barbados) in economy class, then we can adopt an emission estimate of 75 gCO2km−1 per passenger (from Atmosfair for a non-stop flight with an Airbus 340–500). This 200×15 000 km ×75 gCO2km 000 kg of CO2 emissions. More modern aircraft have substantially reduced emissions (60 g km−1), then again carbon-offsetting schemes often estimate a 3-fold larger equivalent emission due to the inclusion of other factors.
The environmental impact of the sondes is informed by life cycle analyses that Vaisala has commissioned for their radiosondes, as well as our own analysis. The life cycle analysis identified “the production of the printed circuit board and the electricity used during the assembly [as having] the most significant effect on the environmental impacts”. But this analysis did not consider the impact of the waste, beyond issues of things like battery toxicity. In this regard the lithium batteries used by the sondes had the least environmental impact of all available choices, i.e., alkaline or water-activated batteries. We estimated that 1.2 kg of lithium was deposited with the sondes in the ocean – which is roughly equivalent to what would be found naturally in the seawater displaced by one of the EUREC4A research vessels. Plastic sensor casings, parachutes, and/or remainders of the latex balloon add an additional impact. This is minimized by designing the sondes to sink to the ocean floor. Efforts are ongoing to identify different materials to further reduce the environmental impact of the sondes. One also questions whether the potential energy loss by the sonde could be used to power the instrumentation and whether a different and smaller sonde could forgo the use of a parachute.
B1 BCO
The Barbados Cloud Observatory (BCO) is located at the far east of Barbados ( N, W) and started operation in April 2010 with a growing set of different instruments for cloud observing and recording. During the whole EUREC4A campaign the BCO was staffed for radiosonde launching and maintenance. Measurements at Ragged Point listed below were made by the University of Miami, the University of Manchester, and the Max Planck Institute for Chemistry. DLR and CIMH staff operated POLDIRAD at St. John ( N, W; altitude 240 m).

B2 NTAS
The Woods Hole Northwest Tropical Atlantic Station (NTAS) is a surface mooring maintained at approximately 15∘ N, 51∘ W since 2001 by means of annual mooring “turnaround”, i.e., deployment of a refurbished mooring and recovery of the old mooring. The refurbished mooring has freshly calibrated sensors and is deployed first. A 1 to 2 d period of overlap before recovering the old mooring provides intercomparison data and allows consecutive data records to be merged. Meteorological variables suitable for estimation of air–sea fluxes from bulk formulas, as well as upper-ocean variables and deep ocean temperature and salinity, are measured. Data are available from the Upper Ocean Processes Group at the Woods Hole Oceanographic Institution.
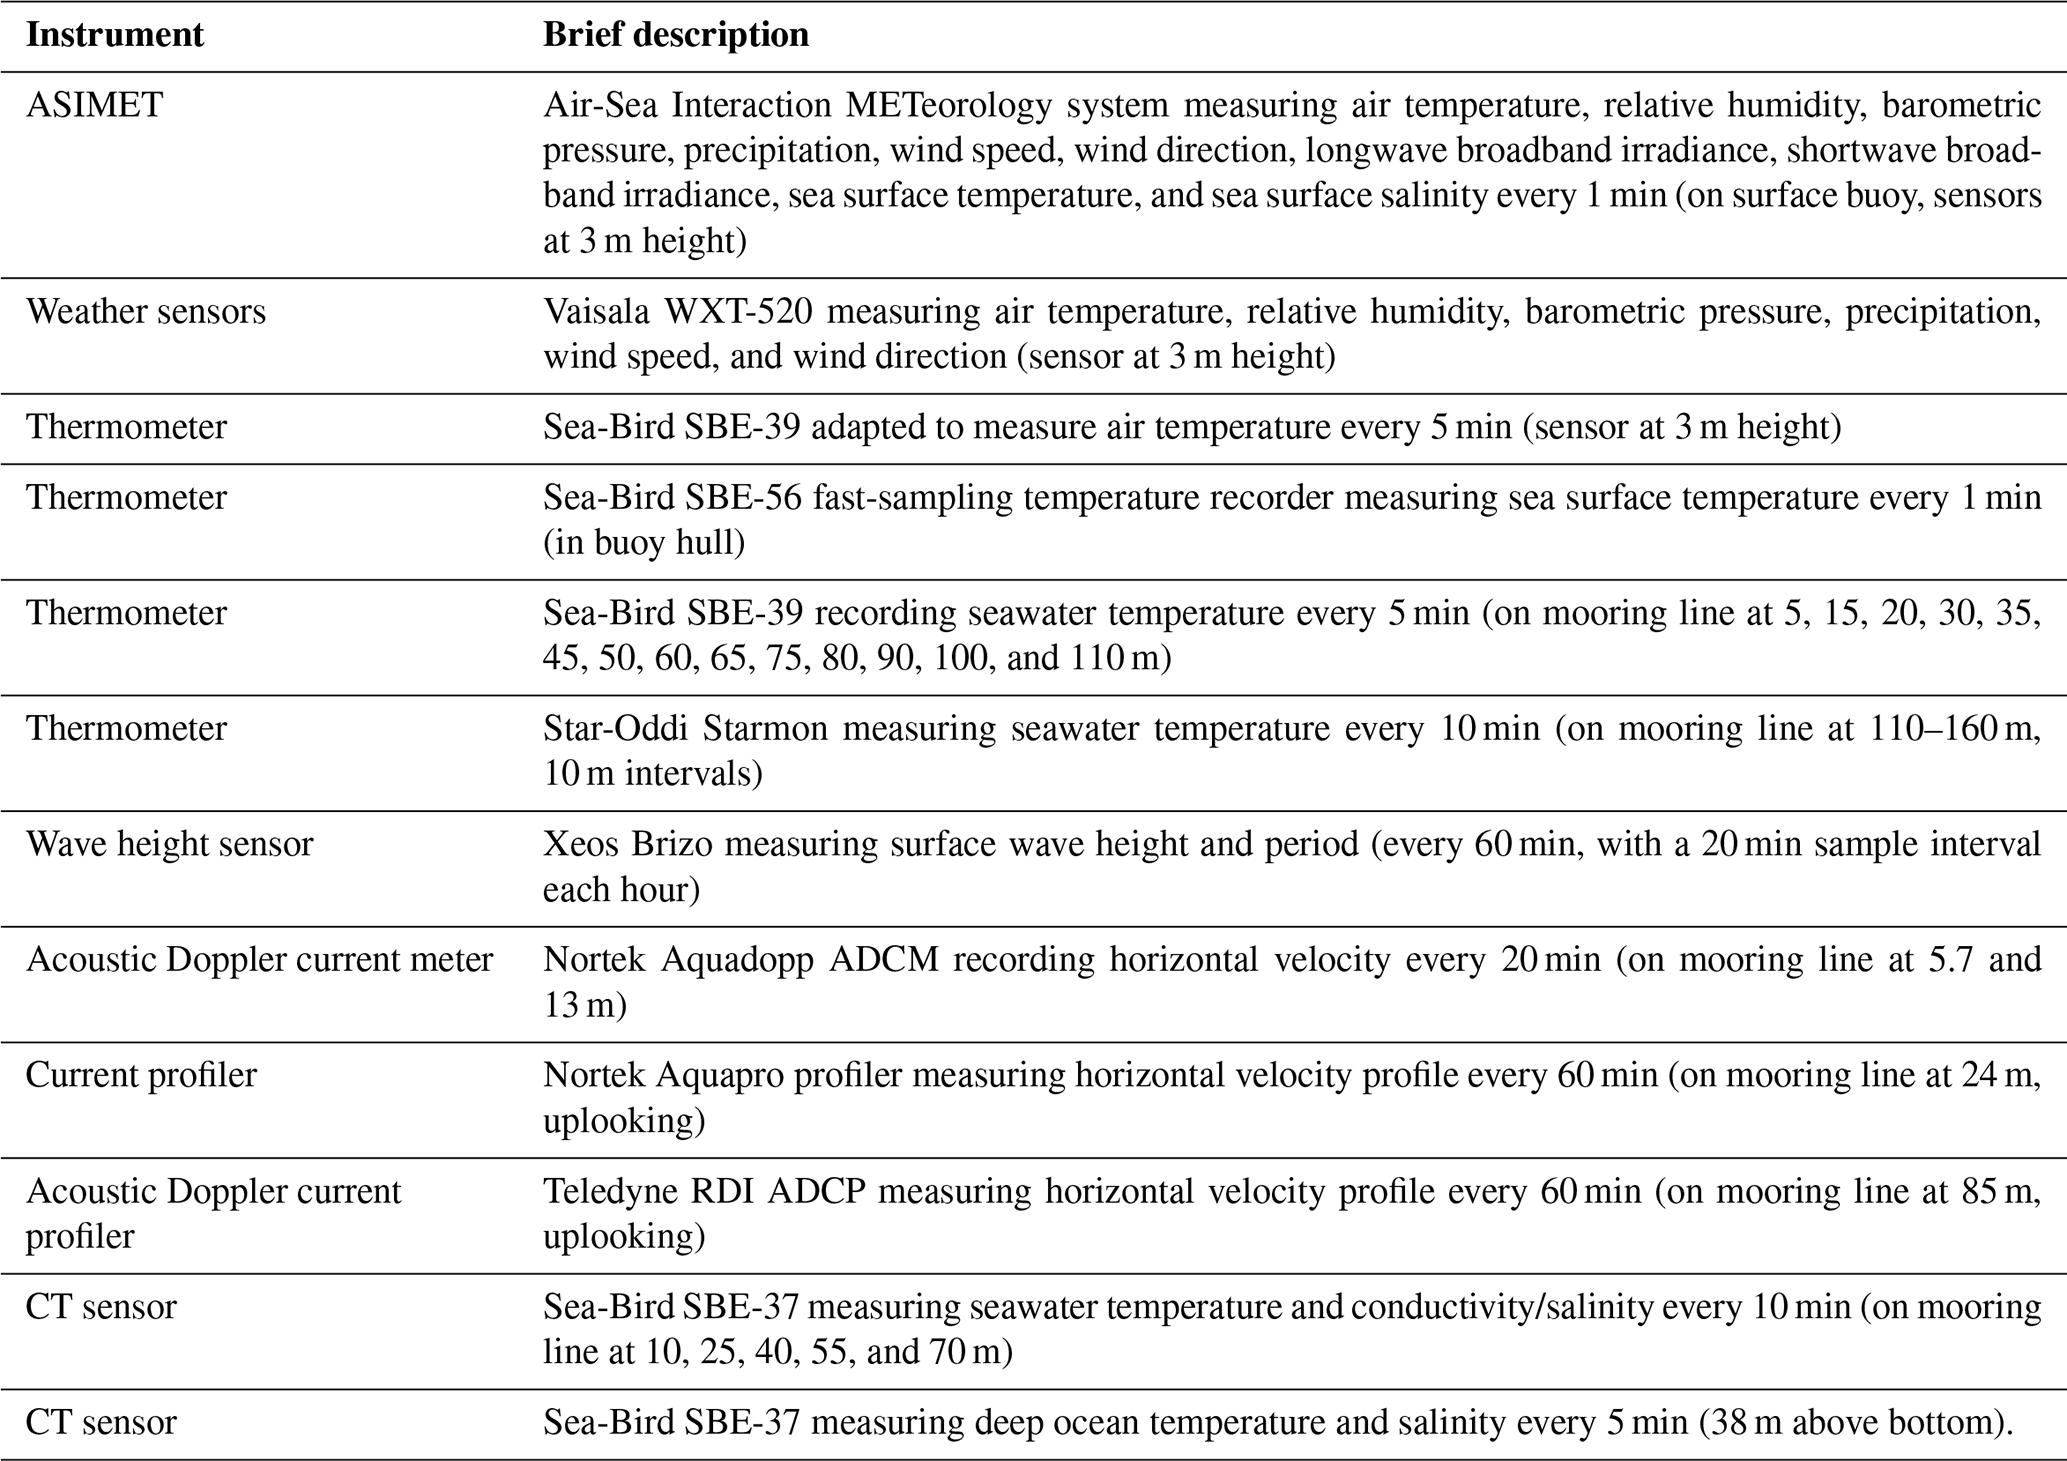
B3 ATR
The French ATR-42 aircraft, operated by SAFIRE (Service des Avions Français Instrumentés pour la Recherche en Environnement, a national research infrastructure of Météo-France/CNRS/CNES), is a turboprop aircraft that has the capability of flying in the lower troposphere (ceiling at about 8 km). During EUREC4A it flew 19 missions on 11 d, from 25 January to 13 February 2020, totaling 91 flight hours. It generally flew two missions per day. Each mission was about 5 h long, including a transit time from the airport to the EUREC4A-Circle of 20 min in each direction. Most missions were composed of a transit leg to the circle flown at an altitude of about 2.5 km, two or three box patterns (rectangles of 15 km by 120 km) near cloud base, two L patterns within the sub-cloud layer (near the top and the middle of the layer, cross-wind and along-wind), and a surface leg (altitude of 60 m) before a transit back to the airport at an altitude of about 4.5 km.
(Chazette et al., 2021)(Delanoë et al., 2016)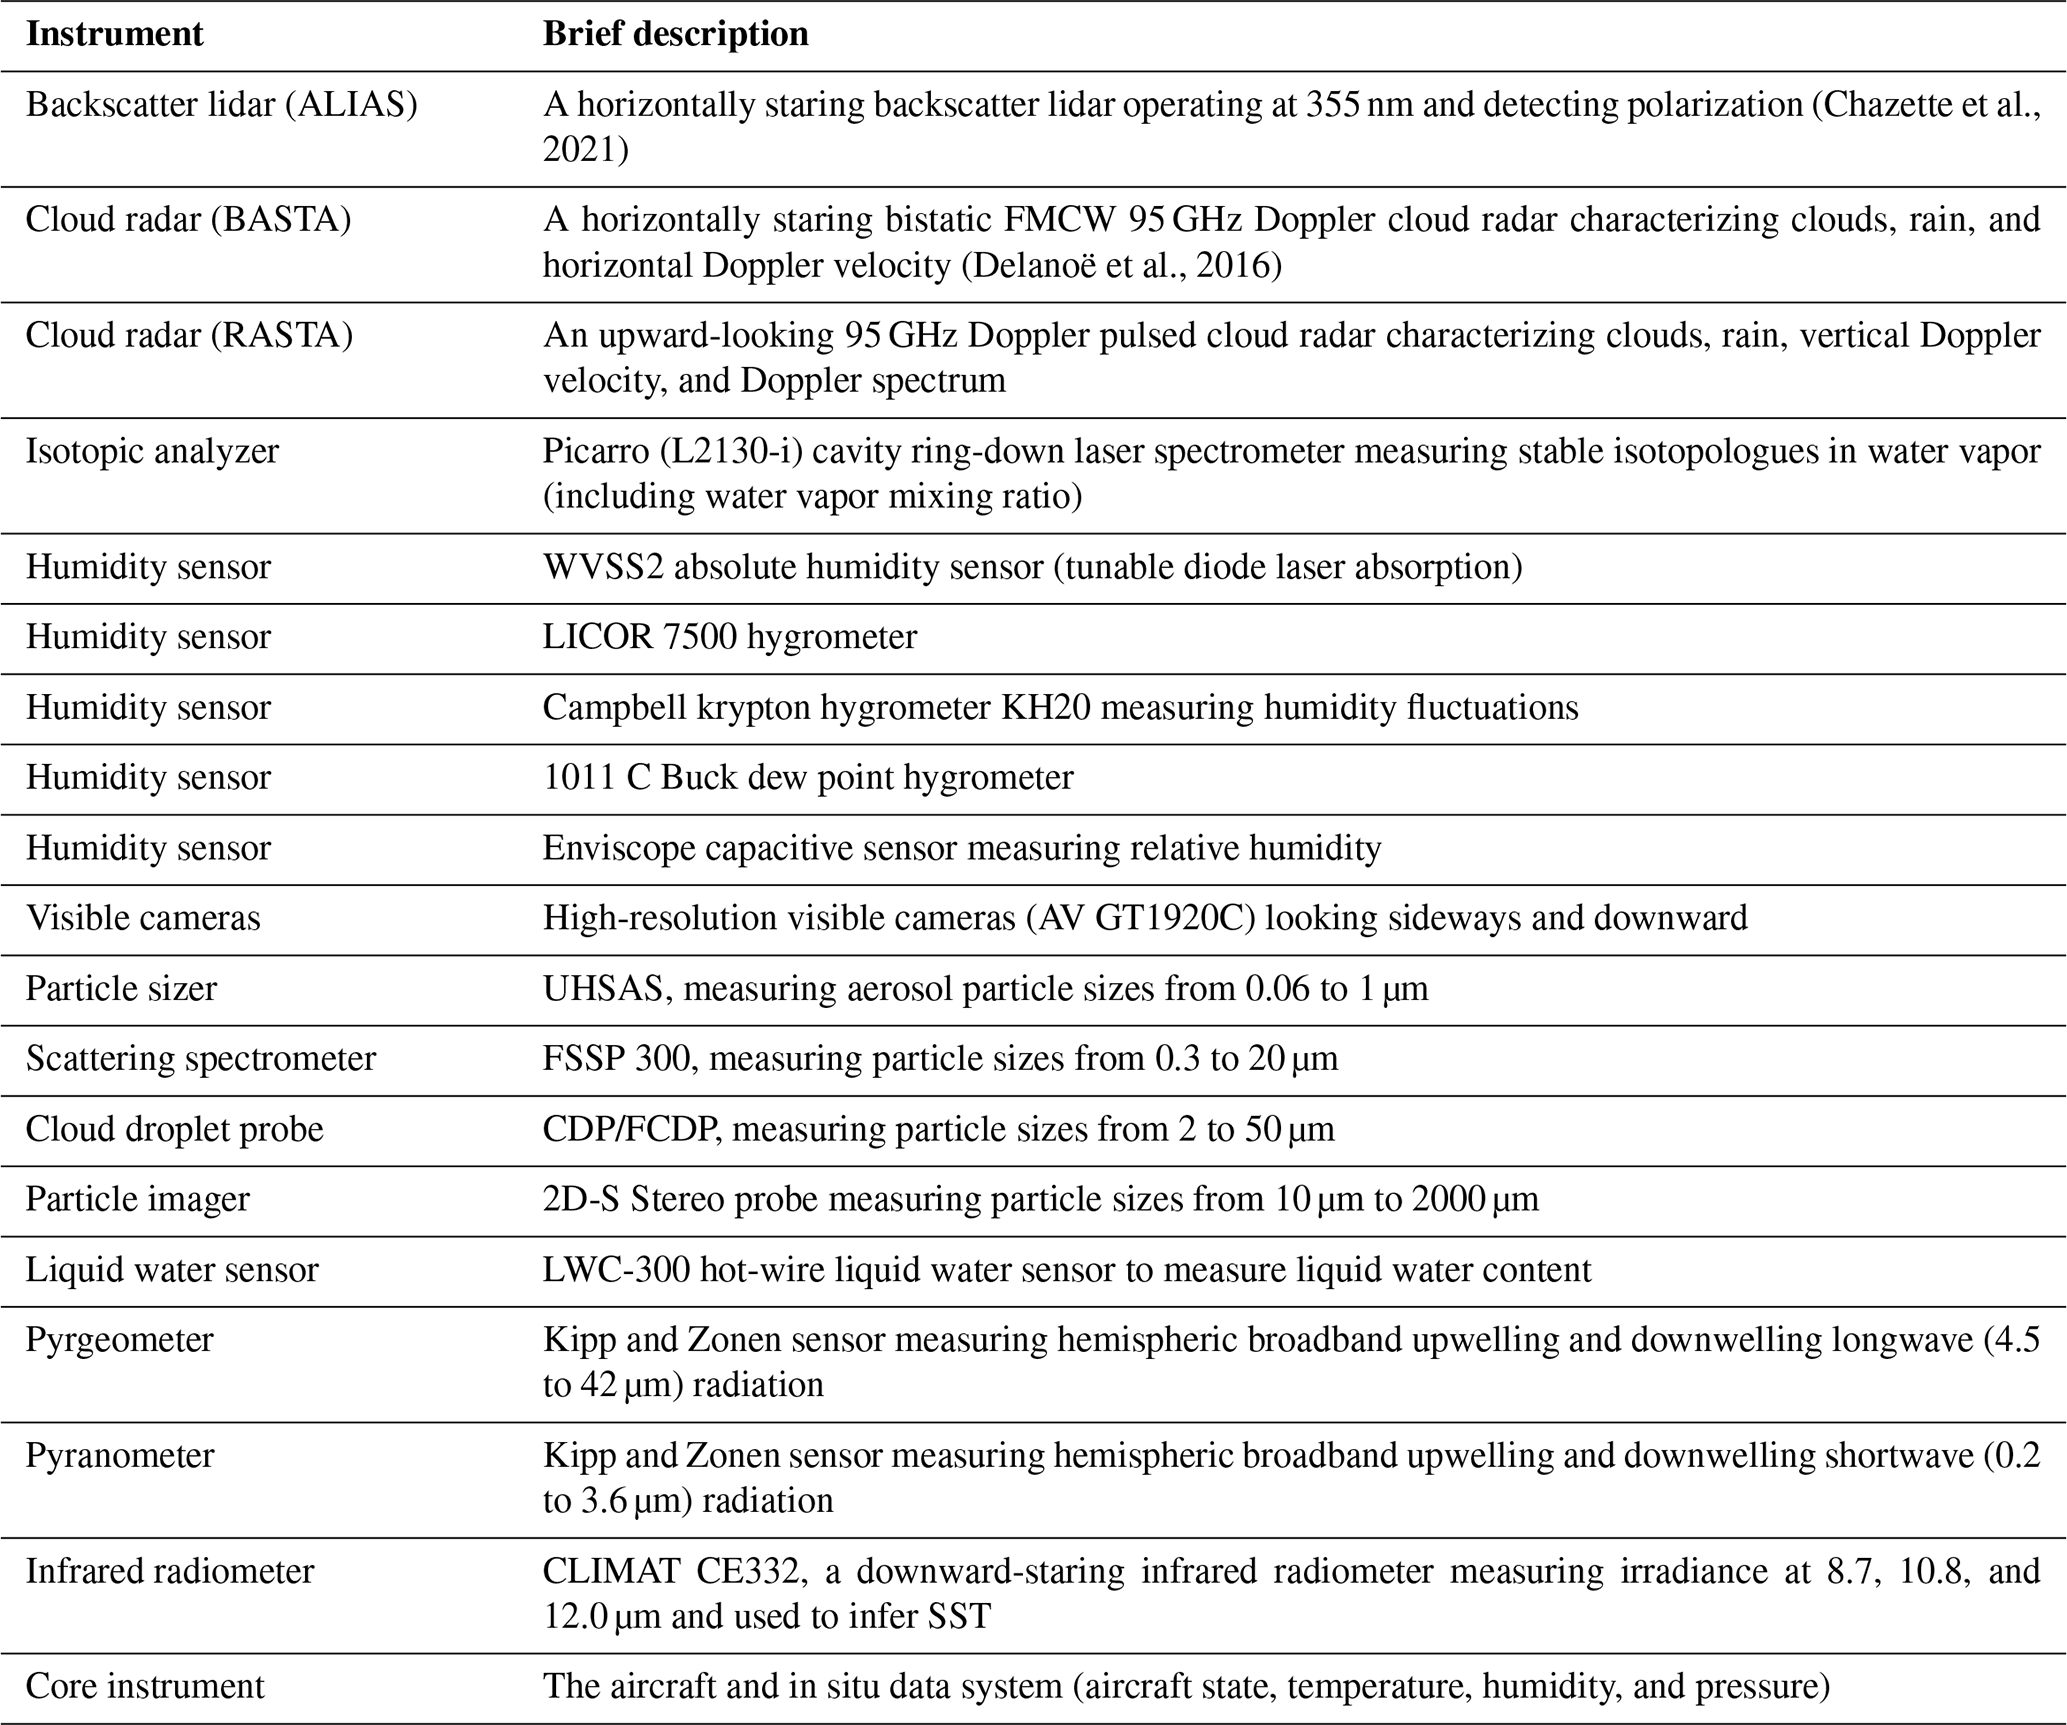
B4 HALO
The German research aircraft HALO (High Altitude and Long Range Research Aircraft) is operated by DLR in the configuration described by Stevens et al. (2019a), with instruments developed, certified, and operated by groups from around Germany. During EUREC4A it was stationed at the Grantley Adams International Airport (GAIA, TBPB) on Barbados. It flew 13 missions out of GAIA plus two transfer flights from and to Germany, totaling in 130 flight hours. Its first local flight was on 22 January and its last on 15 February 2020. HALO is a modified twin-engine business jet (Gulfstream 550) with an endurance of over 8000 km and a ceiling of 15.5 km. Most flights were spent around 10 km altitude with a flight speed of about 190 ms−1, with a typical flight pattern of two sets of 3.5 circles (each lasting about an hour) on the EUREC4A-Circle separated by a 1 h excursion toward the NTAS buoy.
(Ewald et al., 2016)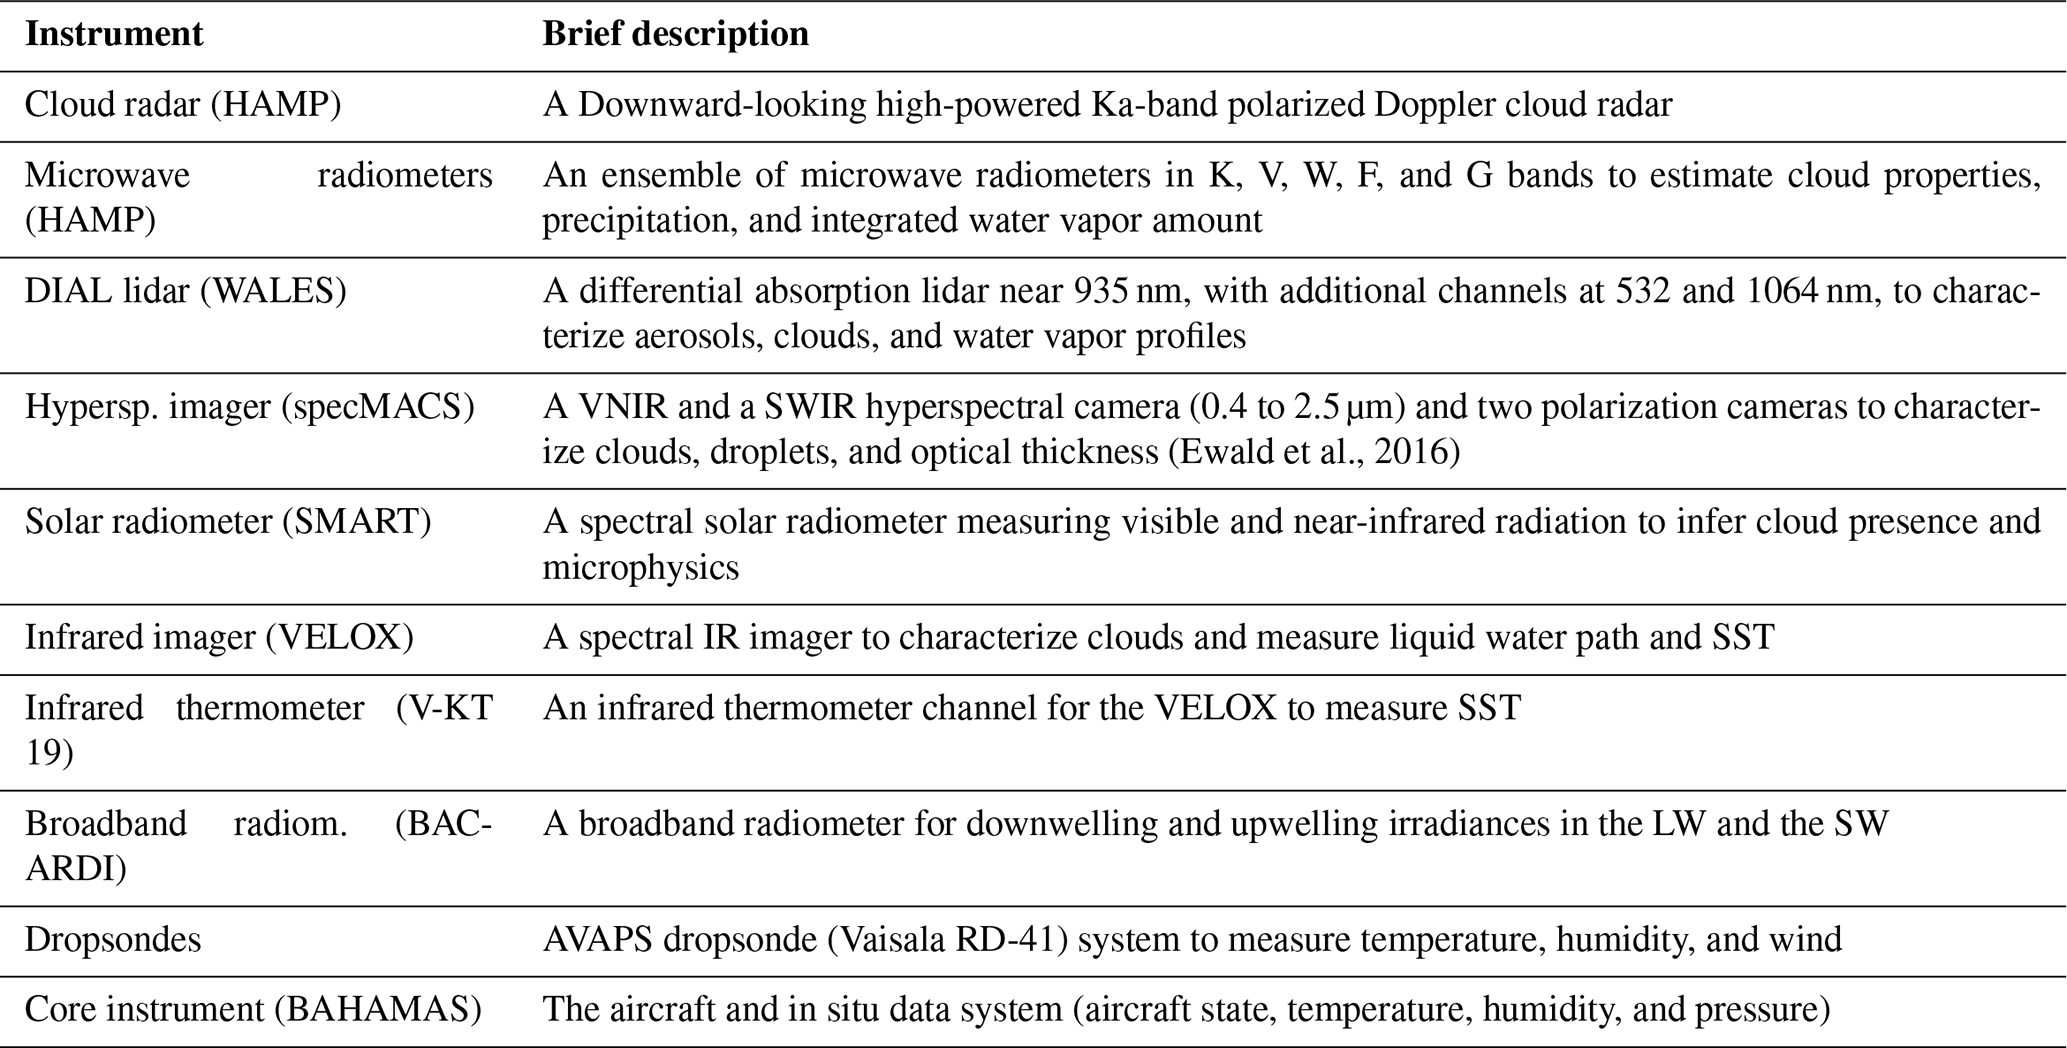
B5 P-3
The NOAA WP-3D Orion (P-3) “Miss Piggy” was operated by NOAA's Aircraft Operations Center. During EUREC4A it flew 11 missions on 11 d totaling 95 flight hours. Its first flight was on 17 January and its last on 11 February 2020. There were three night flights on 9, 10, and 11 February, taking off between 22:00 and 23:30 local time on 8, 9, and 10 February respectively. The P-3, one of two “Hurricane Hunters”, is a four-engine turboprop and operates with a maximum endurance of 10 flight hours and a maximum ceiling of 8.75 km. Flight strategies varied over the course of the experiment but included circles at or above 7 km to deploy dropsondes, slow profiles from 7 km to 500 ft/150 m for water vapor sampling, stacked straight and level legs to vertically sample horizontal variability at different heights within the cloud and sub-cloud layers, and “lawnmower” patterns at 2.75 to 3.00 km for deployment of airborne expendable bathythermographs and remote sensing of ocean surface state. Flight-level data include aircraft navigation and orientation and standard meteorological variables.
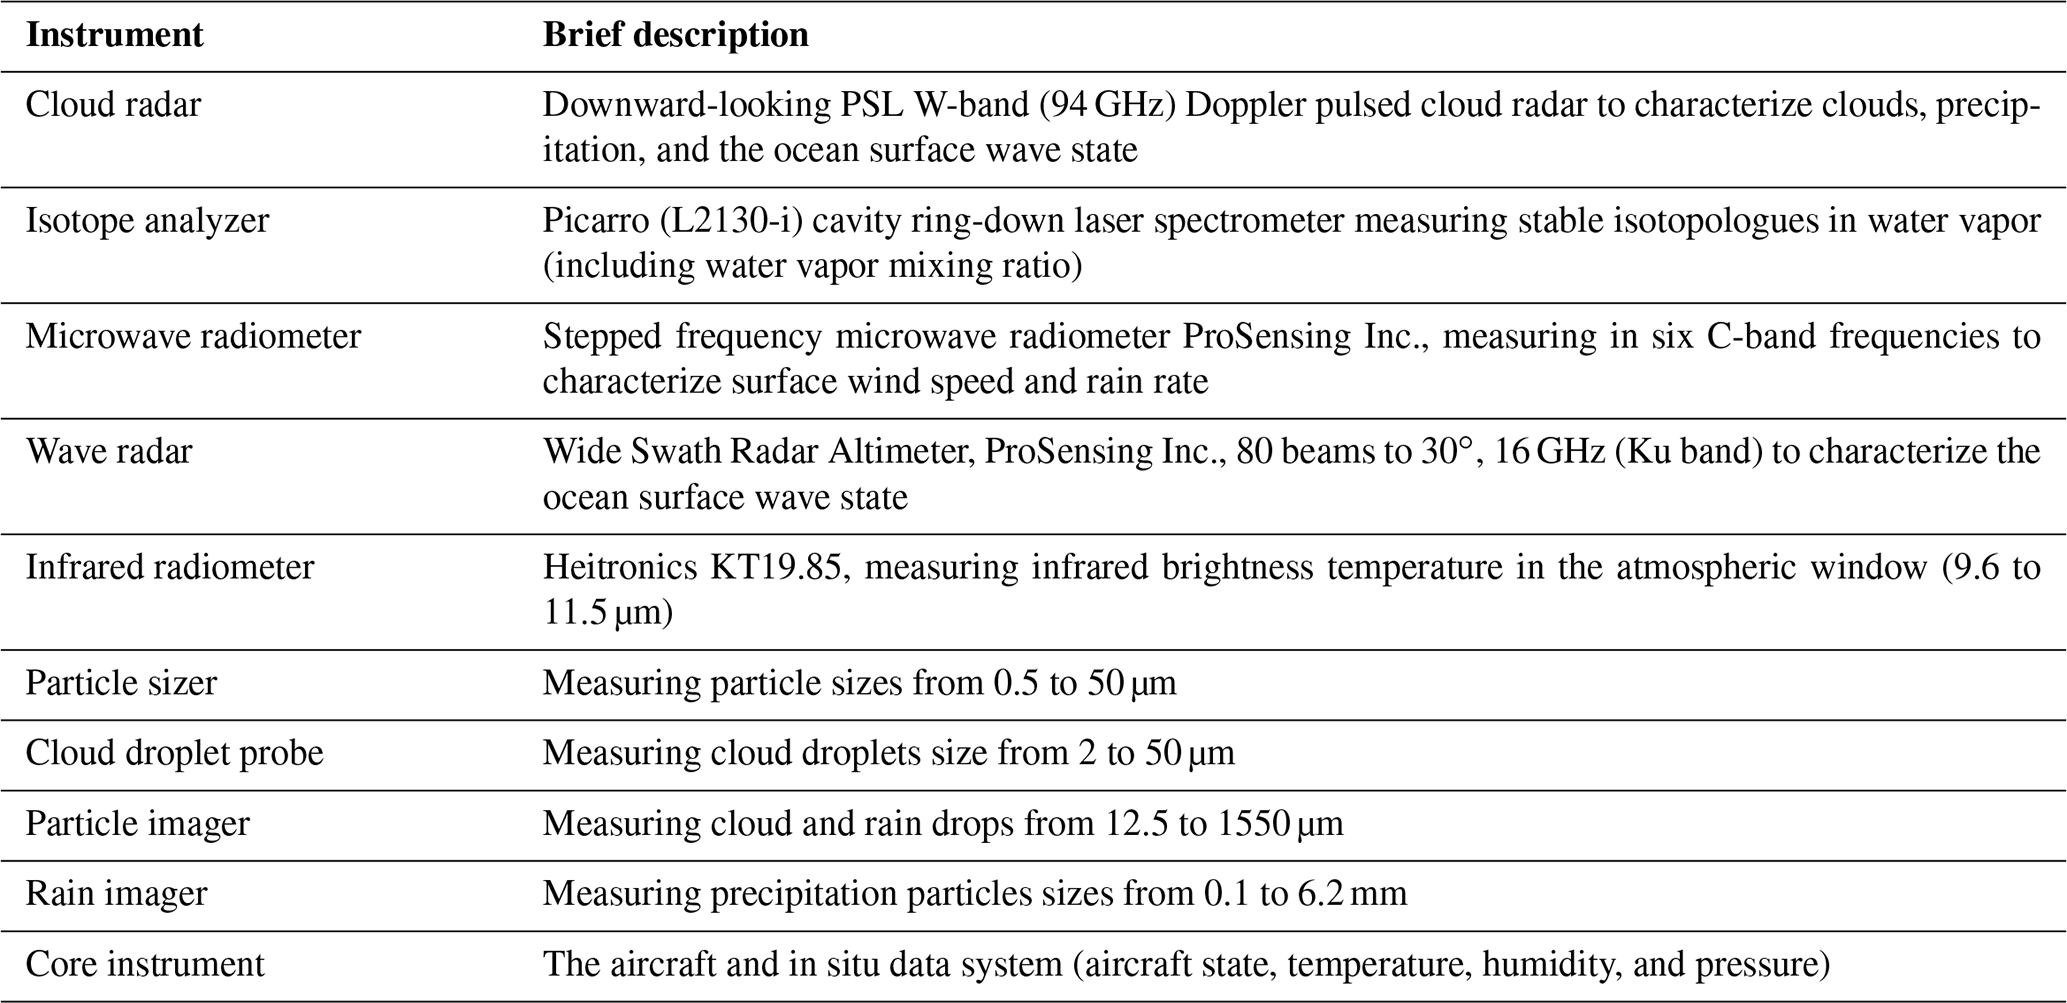
B6 TO
The Twin Otter (TO) was operated by the British Antarctic Survey (BAS). It flew 25 missions on 15 d totaling 90 flight hours. The first flight was on 24 January and the last on 15 February 2020. All flights were during daylight hours. The main objective of the TO flights was to observe the sub-cloud and cloud layers at a number of altitudes from close to the sea surface to the level of the detrainment region and above. As many clouds as possible were sampled by zigzagging to catch the clouds.
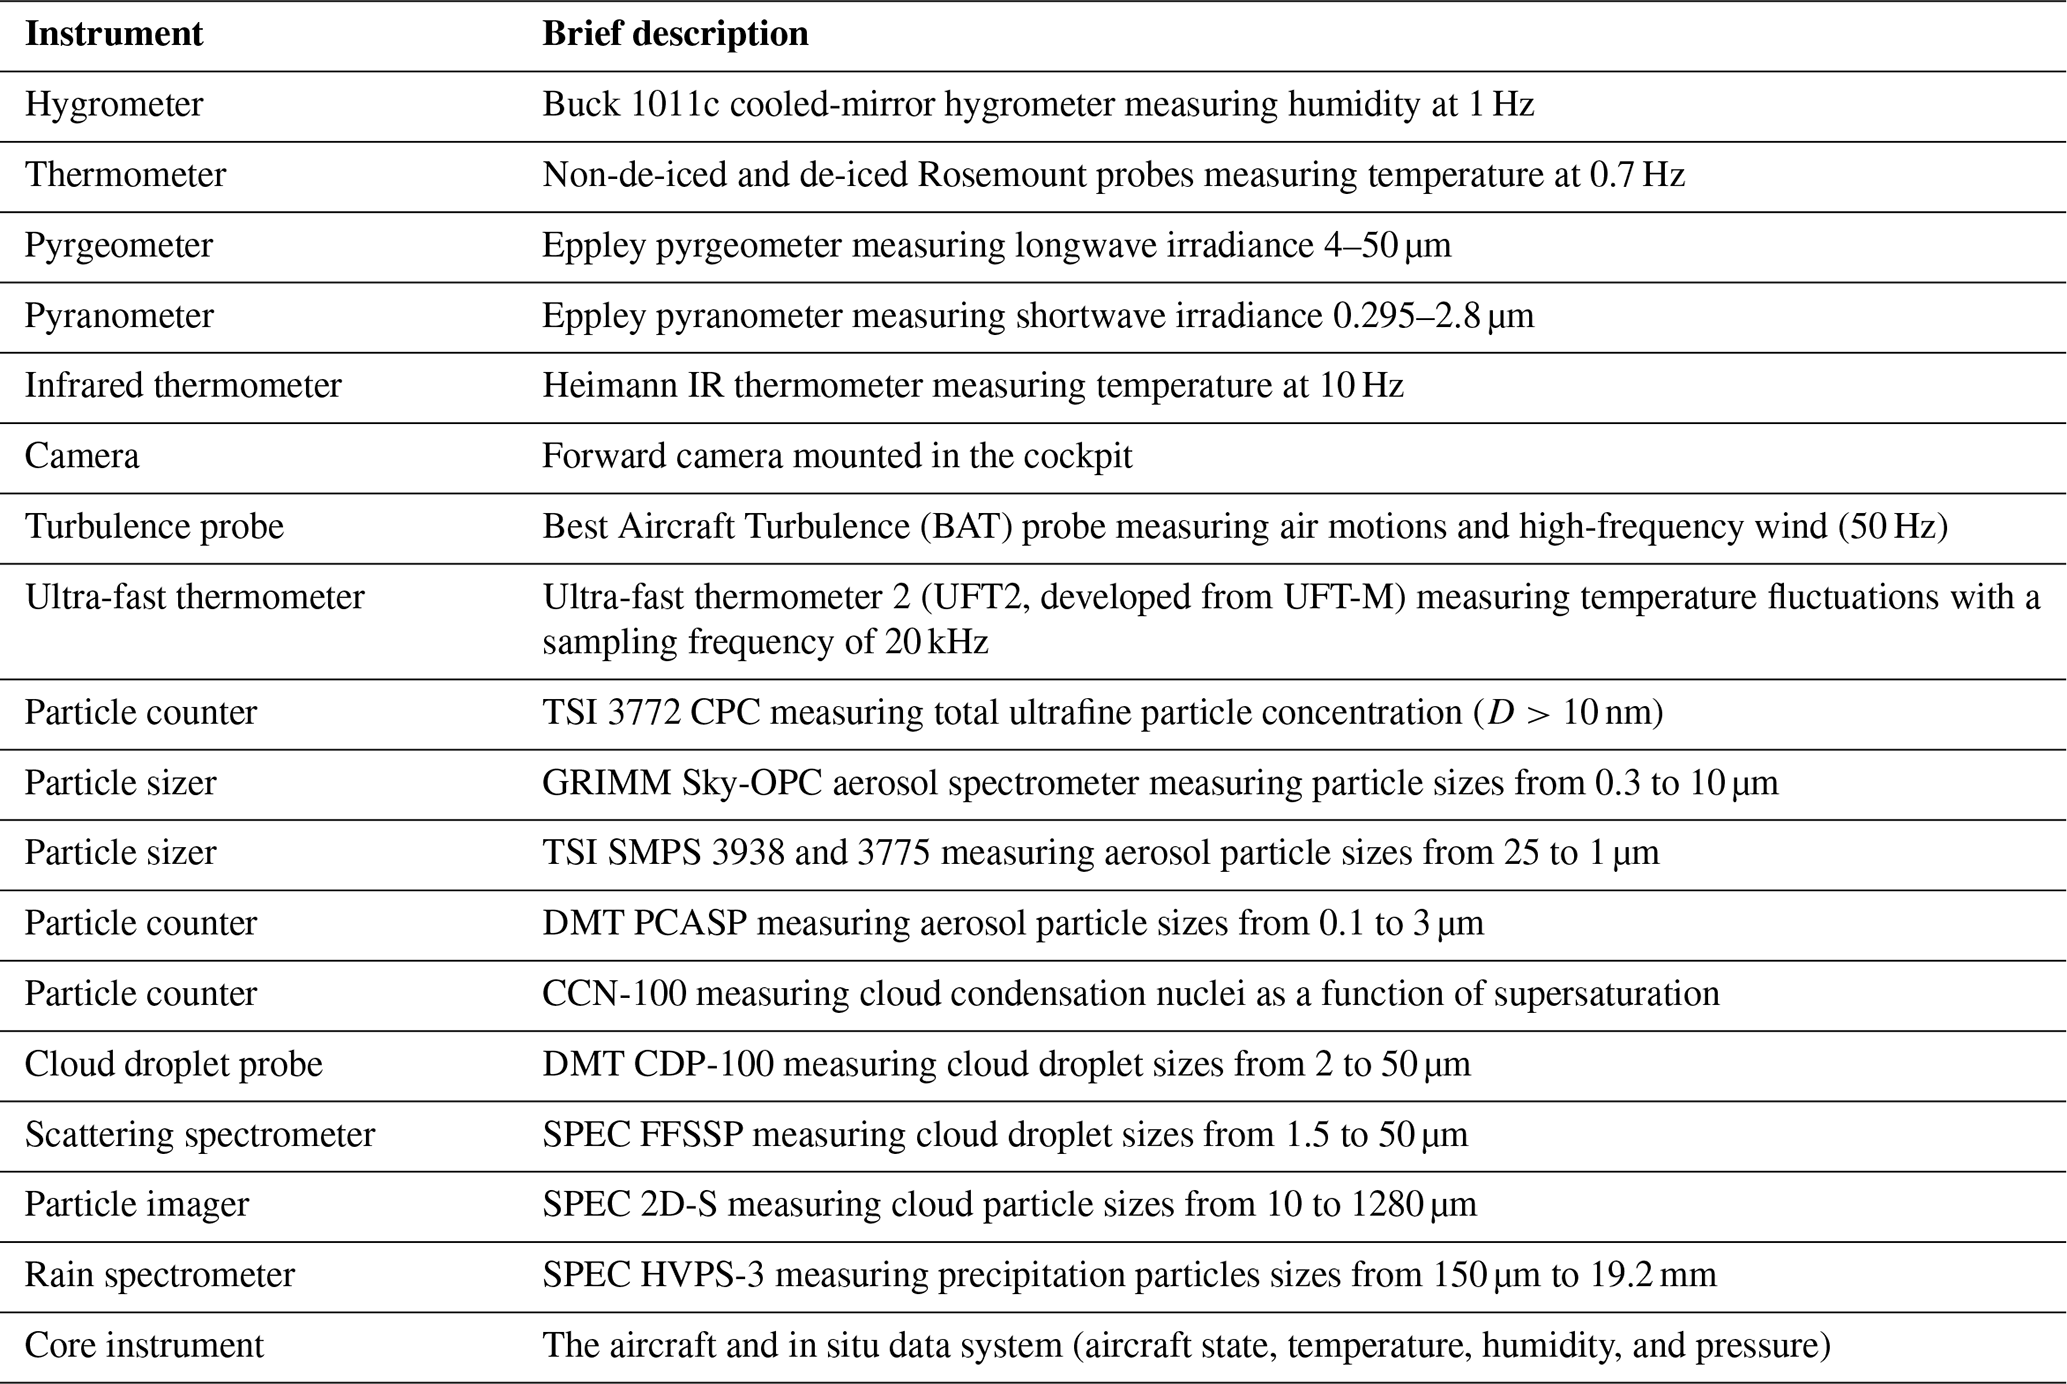
B7 Atalante
The R/V L'Atalante (Atalante) belongs to the French oceanographic research fleet national infrastructure and is operated by IFREMER. This 85 m long vessel is the first modern vessel of the French open-ocean fleet. The R/V Atalante ship time has been provided by the French operator to the EUREC4A_OA project within the EUREC4A umbrella. It sailed from Pointe-à-Pitre, Guadeloupe, on 20 January and started its operations in Barbados water on 21 January 2020. It navigated for more than 3000 nmi collecting ocean and atmosphere data from 6 to 15∘ N and 60 to 52∘ W and surveying the Tradewind Alley and the North Brazil Current eddy corridor (Boulevard des Tourbillons) in international waters and in the EEZ (or Exclusive Economic Zone) of Barbados, Trinidad and Tobago, Guyana, Suriname, and French Guyana. During the cruise, an underwater electric glider (Kraken) and surface drifters (including the OCARINA and PICCOLO platforms) were deployed (see respective sub-subsections).
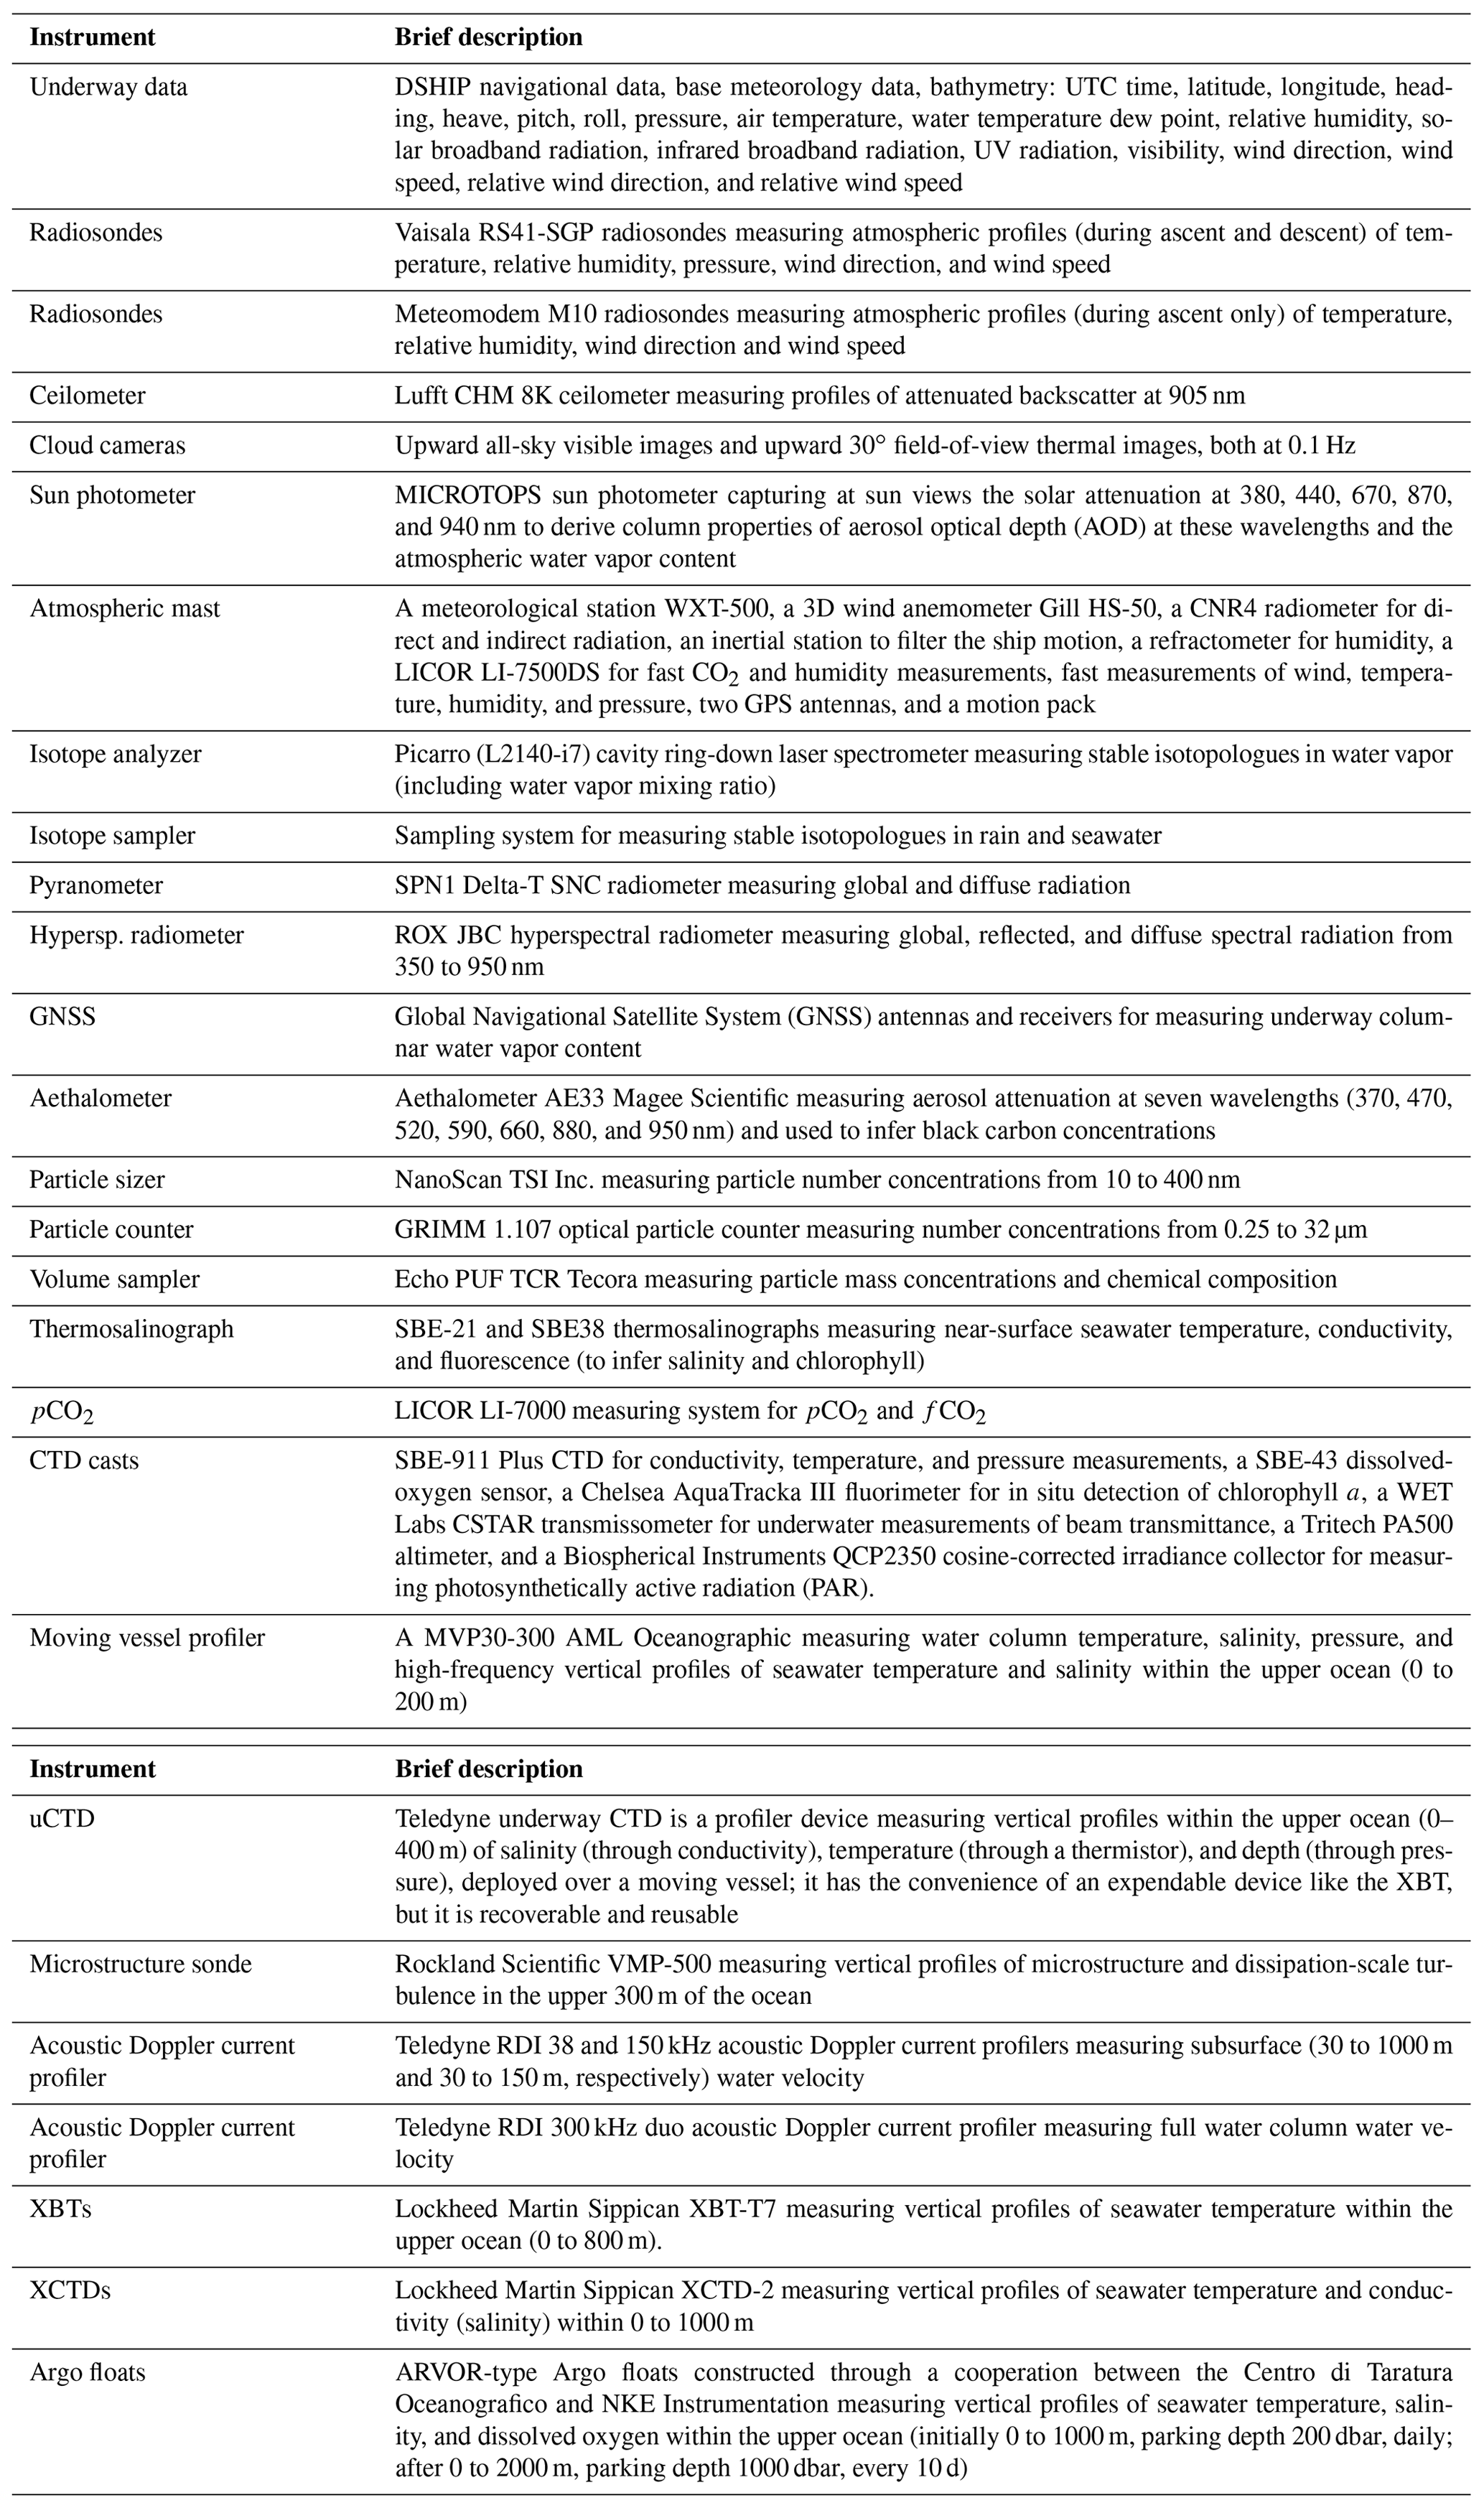
B8 MS-Merian
The R/V Maria Sibylla Merian is a (95 m) long German research vessel, owned and funded jointly by the German Research Foundation (DFG) and the German Ministry for Education and Science (BMBF). The MSM89 cruise started (17 January 2020) and ended (20 February 2020) in Bridgetown, Barbados (Karstensen et al., 2020). During the cruise various ocean and atmosphere profile measurements were carried out from the ship. In addition, underwater electric gliders and the CloudKite were deployed but are described separately (see respective sub-subsections).
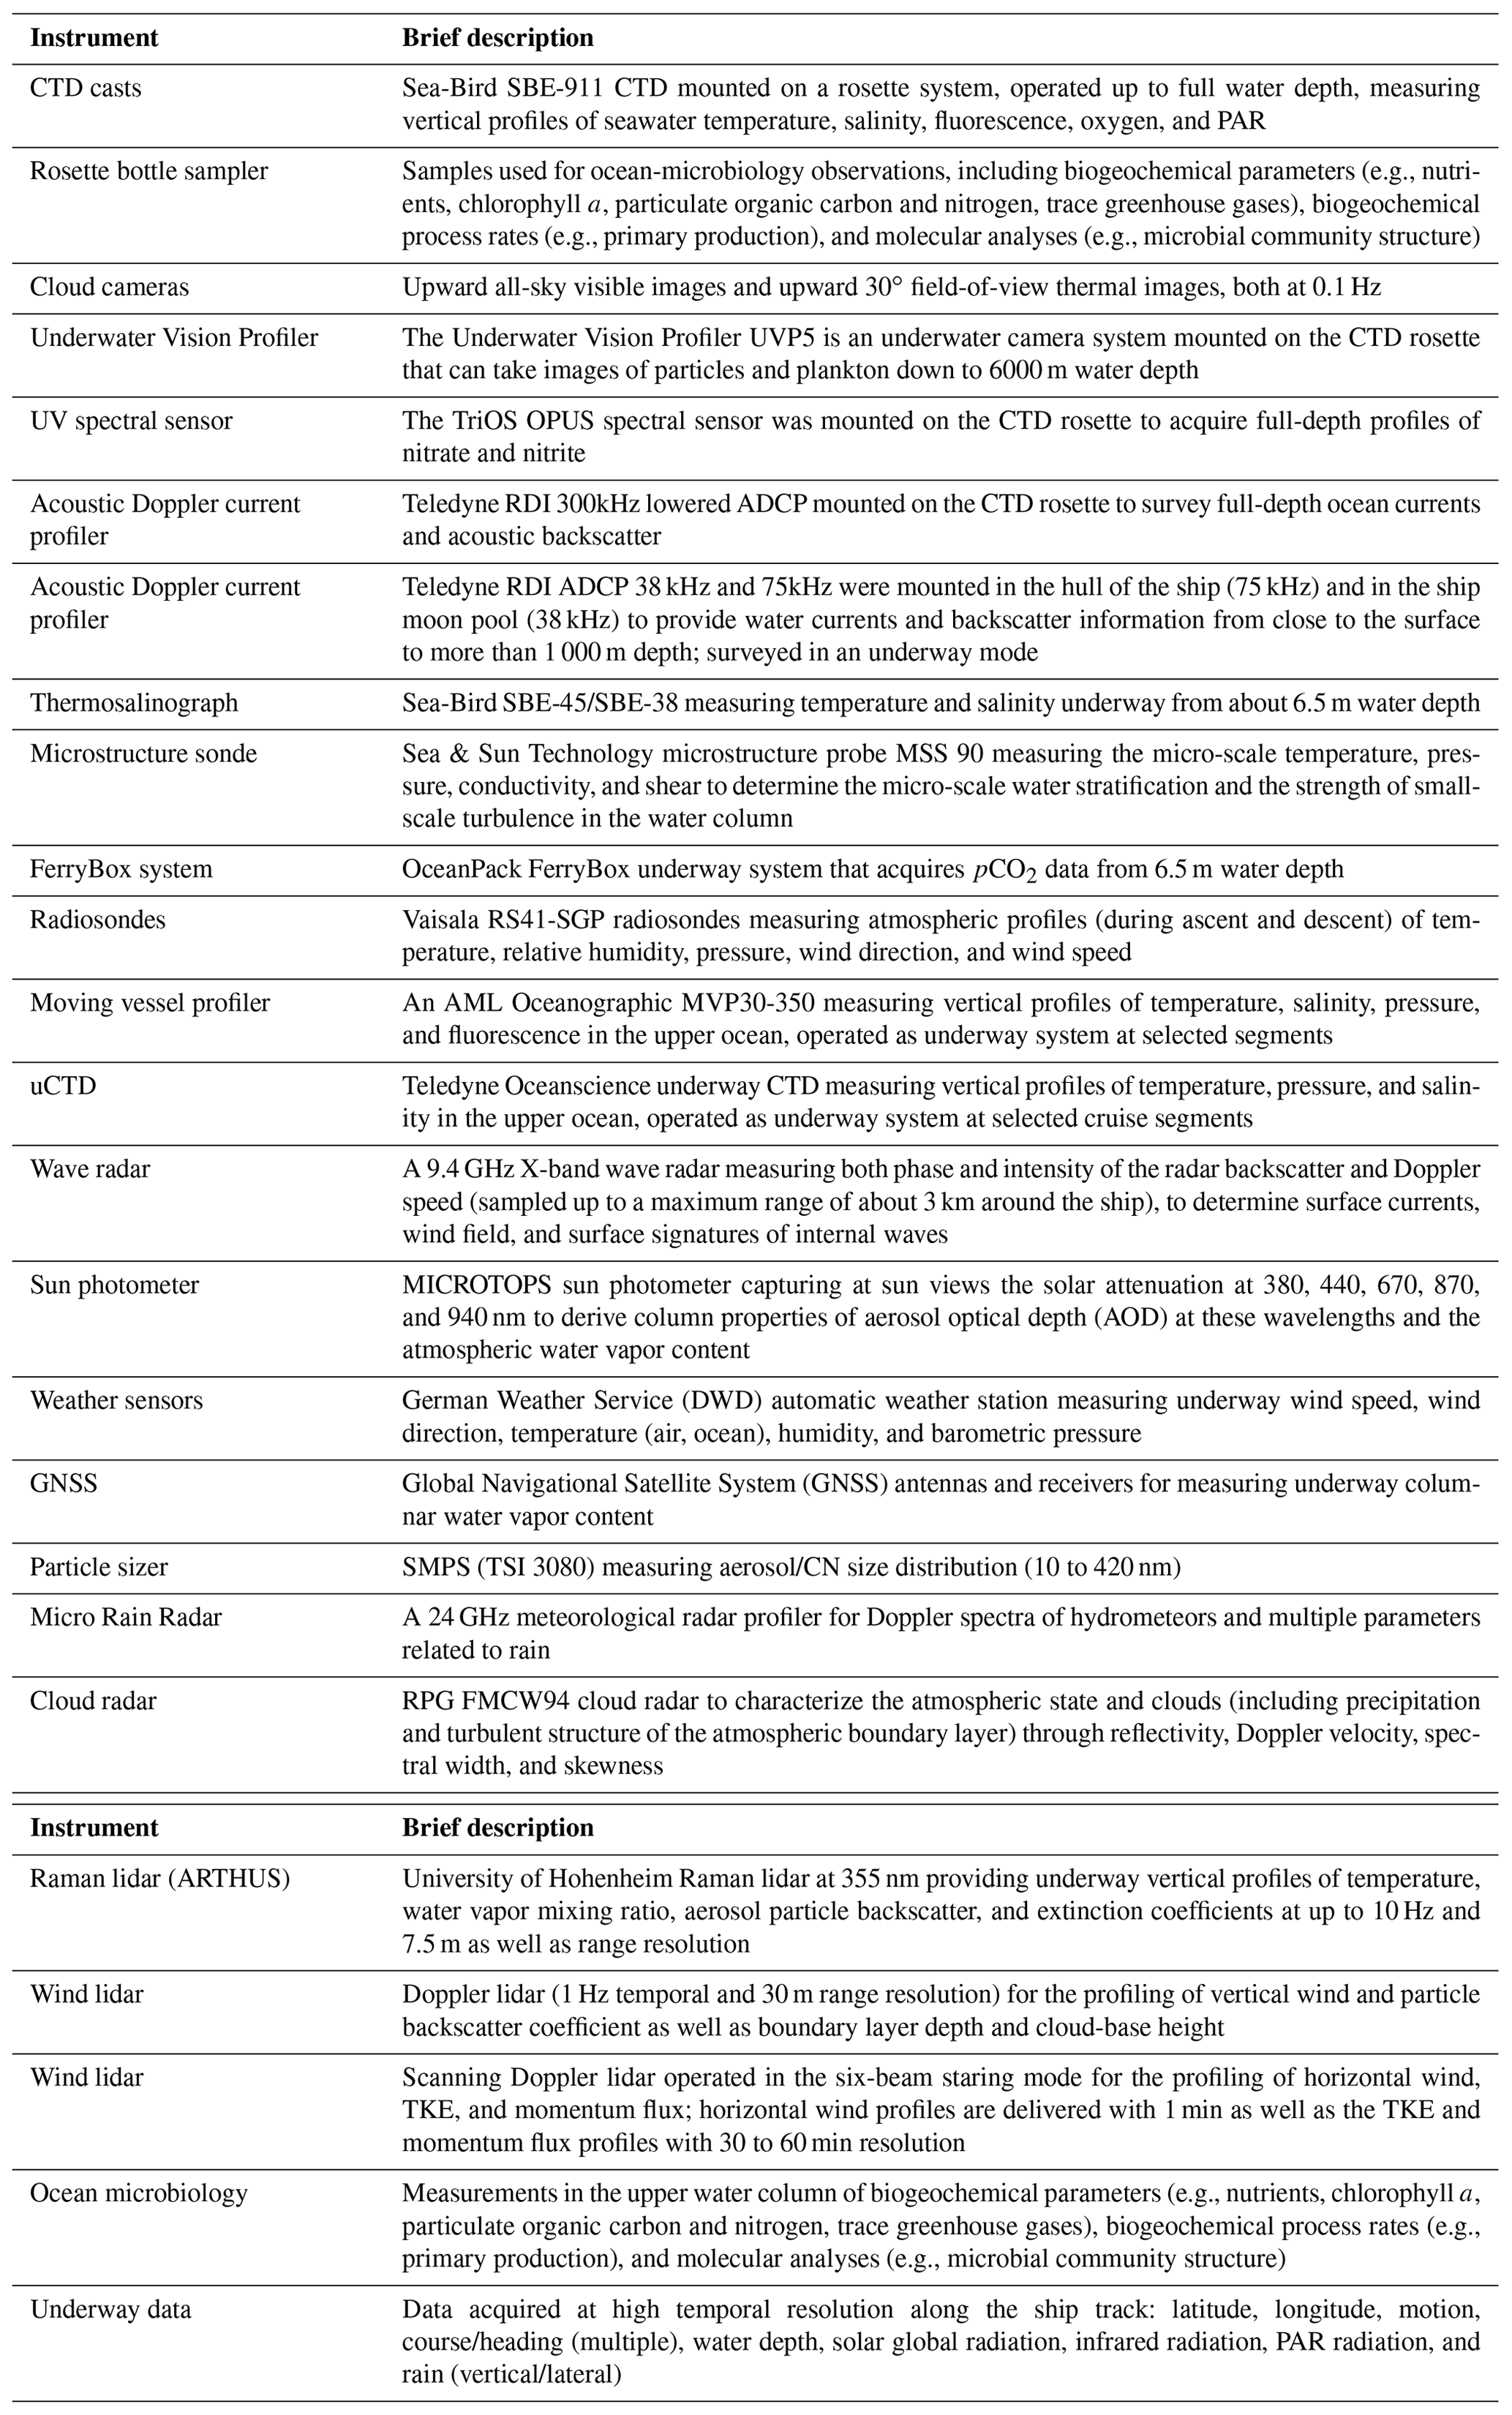
B9 Meteor
The R/V Meteor is a 98 m long German research vessel, which is funded jointly by the German Research Foundation (DFG) and the German Ministry for Education and Research (BMBF). The M161 cruise started in Bridgetown (Barbados) on 17 January 2020, and R/V Meteor spent the following month in the trade wind alley east of Barbados (between 12 to 15∘ N and 54 to 60∘ W). During this time, the atmosphere above and the ocean underneath was repeatedly probed using a wealth of instruments that either were running continuously or sampled discrete stations. At the end of the campaign, R/V Meteor headed for its next working area. Additional measurements were carried during this transit, and the vessel arrived in Ponta Delgada (Azores, Portugal) on 3 March 2020 after a total of 6250 nmi of sailing (Rollo et al., 2020). The autonomous platforms (such as CloudKite or ocean glider) deployed from the R/V Meteor are described in their respective sub-subsections.
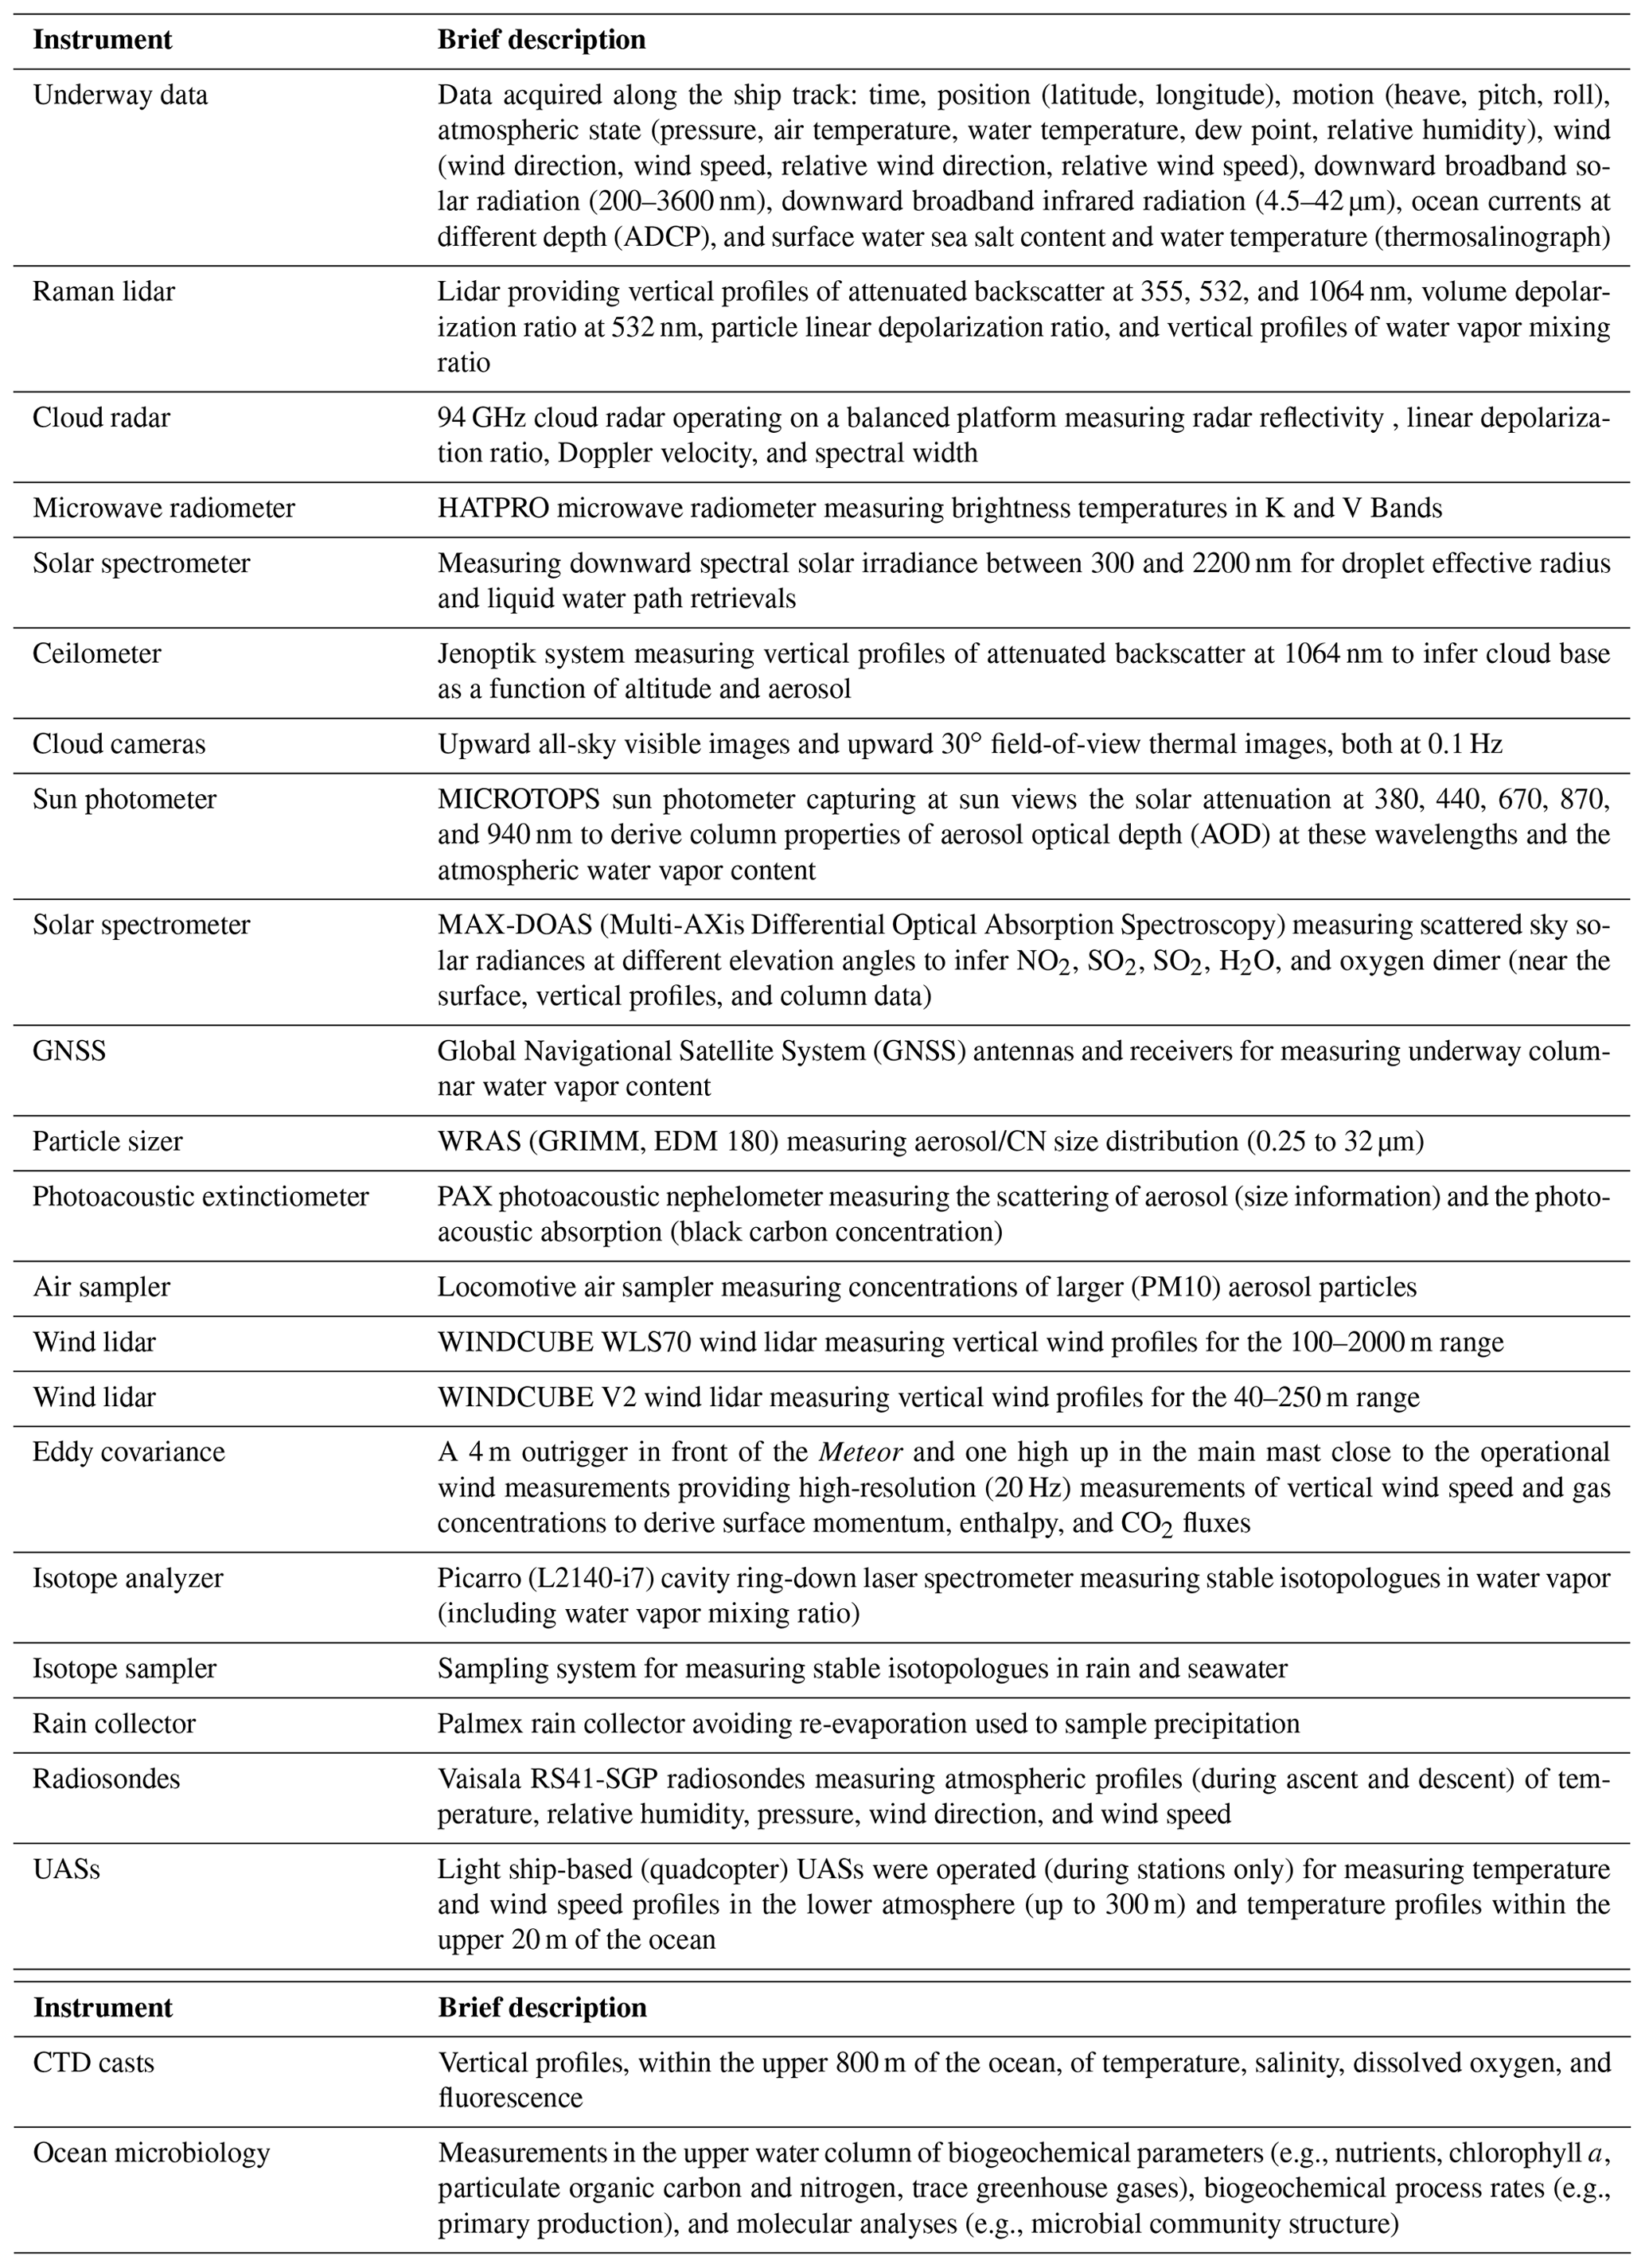
B10 Ron Brown
Sampling on board the NOAA Ship Ronald H. Brown took place from 7 January to 13 February 2020 and focused on the region between 57 and 51∘ W east of Barbados and north of 12.5∘ N in the trade wind alley. The overarching strategic goal of ATOMIC was to provide a view of the atmospheric and oceanic conditions upwind of the EUREC4A study region. Operations of the R/V Ron Brown were coordinated with two Wave Gliders (245 and 247) and SWIFTS deployed from the ship, the P-3 aircraft, Saildrone 1064, and BCO (these platforms are described in their respective sub-subsections). An additional logistical objective included recovering the NTAS-17 mooring and replacing it with the NTAS-18 mooring. A third objective was to triangulate and download data from a Meridional Overturning Variability Experiment (MOVE) subsurface mooring and related Pressure Inverted Echo Sounders (PIESs). MOVE is designed to monitor the integrated deep meridional flow in the tropical North Atlantic. Additional information on shipboard sampling strategies, measurements, and data availability can be found in Quinn et al. (2020).
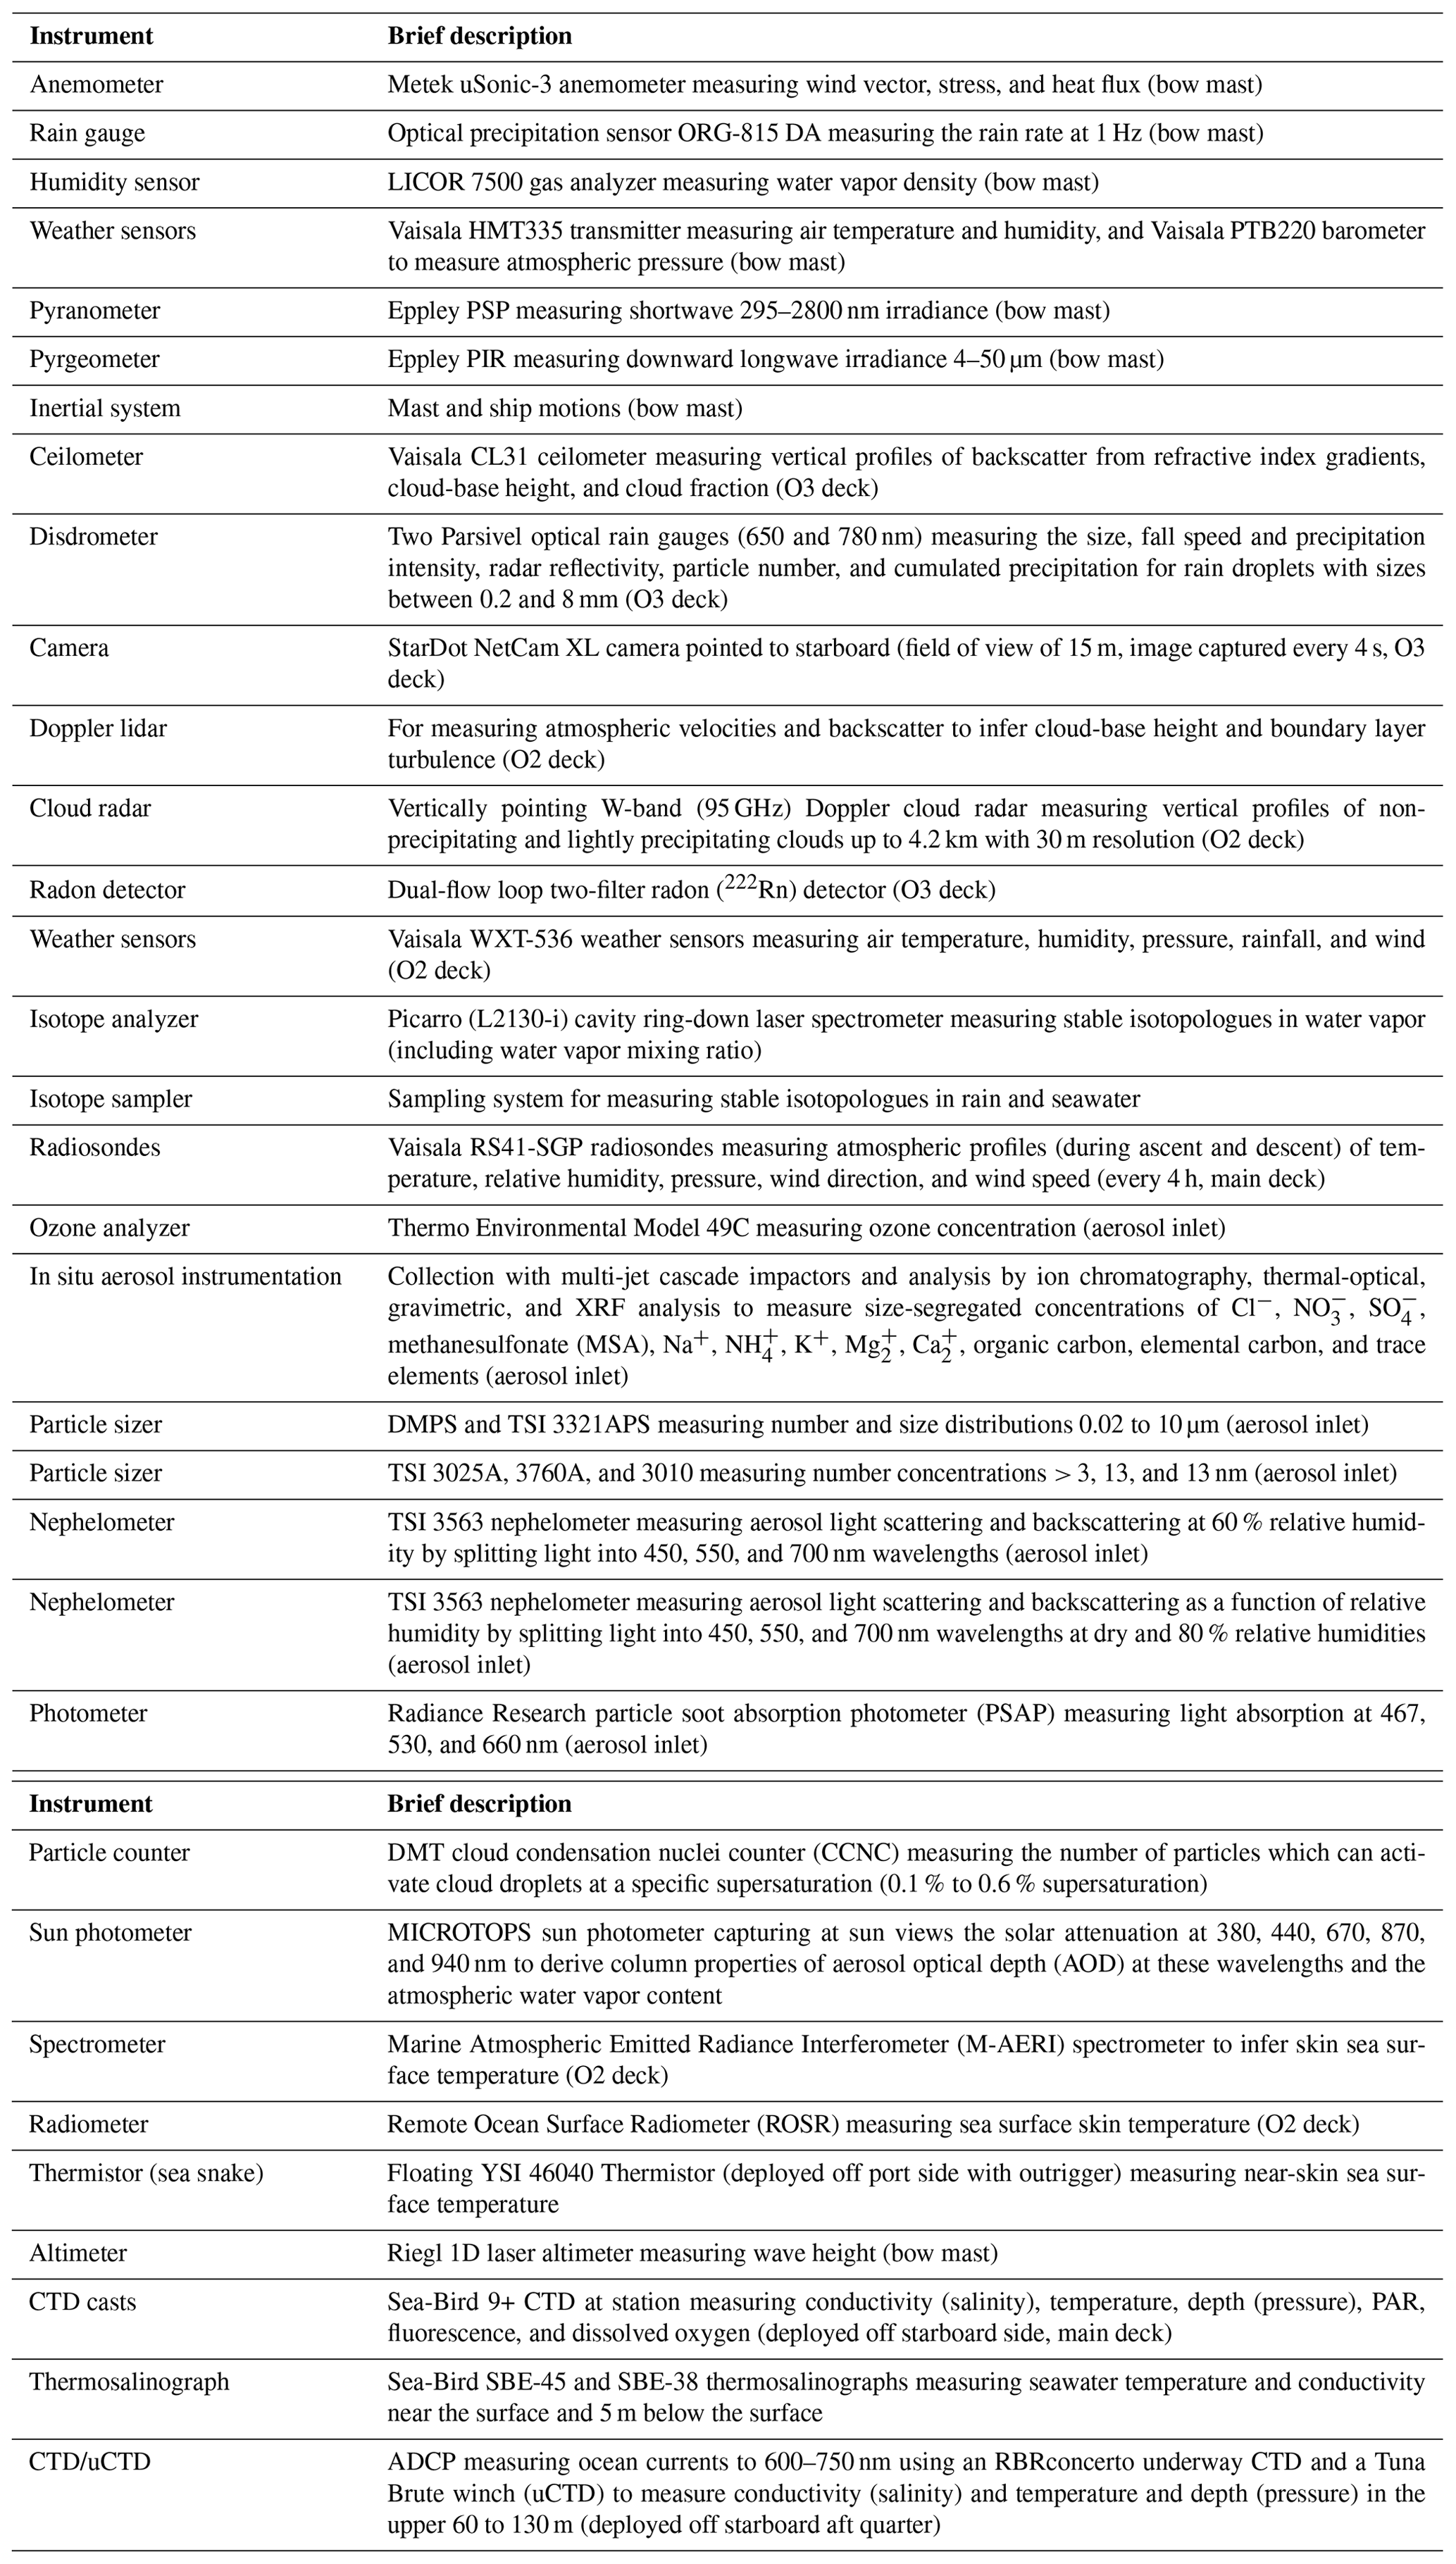
B11 BOREAL
The BOREAL UAS was operated by BOREAL SAS (Toulouse, France) and the National Center for Meteorological Research (CNRM; Toulouse, France). During EUREC4A it flew nine missions totaling 32 research flight hours. Its first flight was on 26 January and its last on 9 February 2020. The BOREAL has a 4.2 m wingspan and a maximum takeoff weight of 25 kg. The BOREAL can fly up to 6 h, covering more than 600 km, with a 5 kg payload. During EUREC4A, the BOREAL flew roughly 20 km radius circles between 80 and 1000 m above sea level centered at a distance of roughly 50 km upwind of the Barbados Cloud Observatory (see Fig. 2).
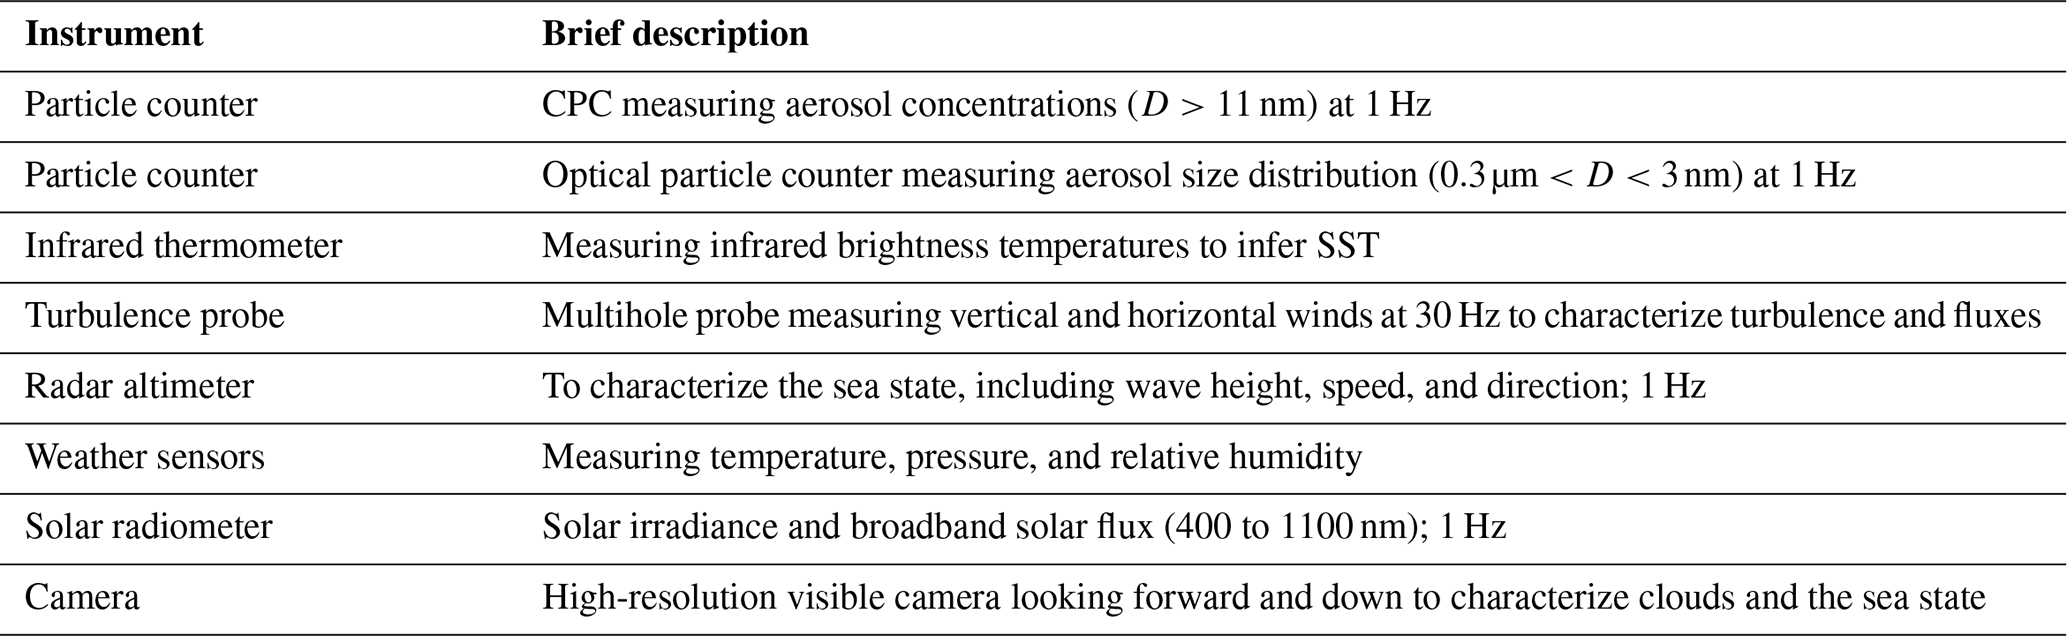
B12 CU-RAAVEN
The RAAVEN was operated from Morgan Lewis Beach, Barbados, by the University of Colorado Boulder, under support from the National Oceanic and Atmospheric Administration (NOAA). During EUREC4A it flew 38 missions spanning 20 d and totaling 77 flight hours. Its first flight was on 24 January and its final flight was on 15 February 2020. It typically flew two flights per day, with one occurring in the mid-morning and one in the mid-afternoon. It is an electric, fixed-wing remotely piloted aircraft system and operates with an endurance of approximately 2.5 h. Flights were primarily focused on the boundary layer, with all measurements collected below 1000 m altitude and the majority of observations occurring in the lowest 750 m of the atmosphere. Additional information on the RAAVEN, its capabilities, and the data collected during EUREC4A can be found in de Boer et al. (2021).

B13 MPCKs
The Max Planck CloudKites were operated on R/V MS-Merian and R/V Meteor. Two different instrument boxes were flown with the CloudKites, namely the MPCK+ (only on R/V MS-Merian) and mini-MPCK (on both R/V MS-Merian and R/V Meteor). The CloudKites (except for the aerostats and winches that are produced by the Allsopp Helikites Ltd) are designed and produced by the Mobile Cloud Observatory at the Max Planck Institute for Dynamics and Self-Organization. The MPCK+ and mini-MPCK aboard R/V MS-Merian together flew 18 missions on 17 d (between 26 January and 18 February 2020) totaling 135 measurement flight hours. Most of the flight time was spent at 1000 m with the maximum altitude being at 1500 m. The mini-MPCK aboard the R/V Meteor flew nine successful missions on 9 d (between 24 January and 6 February 2020) totaling 51 measurement flight hours. Most of the flight time was spent between 200 and 1000 m.
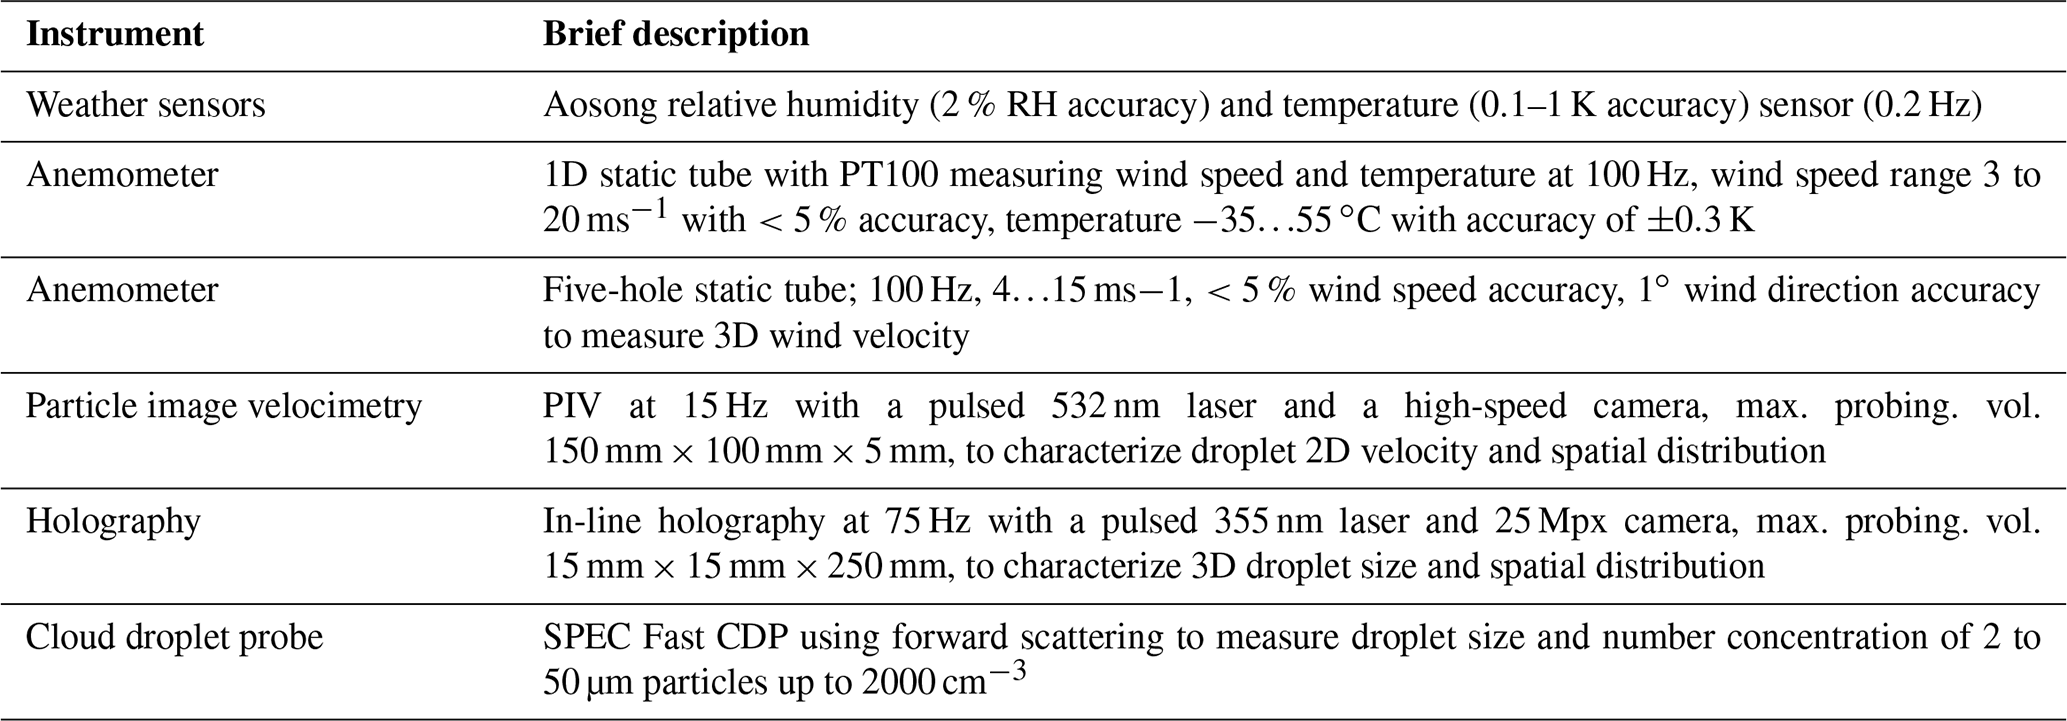

B14 Skywalker
The Skywalker X6 UASs were operated by the National Center for Meteorological Research (CNRM; Toulouse, France), the French Civil Aviation University (ENAC; Toulouse, France), and the Laboratory for Analysis and Architecture of Systems (LAAS; Toulouse, France) as part of the NEPHAELAE project (ANR-17-CE01-0003). During EUREC4A, the team flew more than 50 flights over the ocean up to 15 km off the eastern coast of Barbados. The first flight was on 25 January and the last was on 9 February 2020. The Skywalker has a 1.5 m wingspan and a maximum takeoff weight of 2.5 kg. The Skywalker flew up to 1 h and utilized sensor feedback to map an individual cloud autonomously and adaptively.
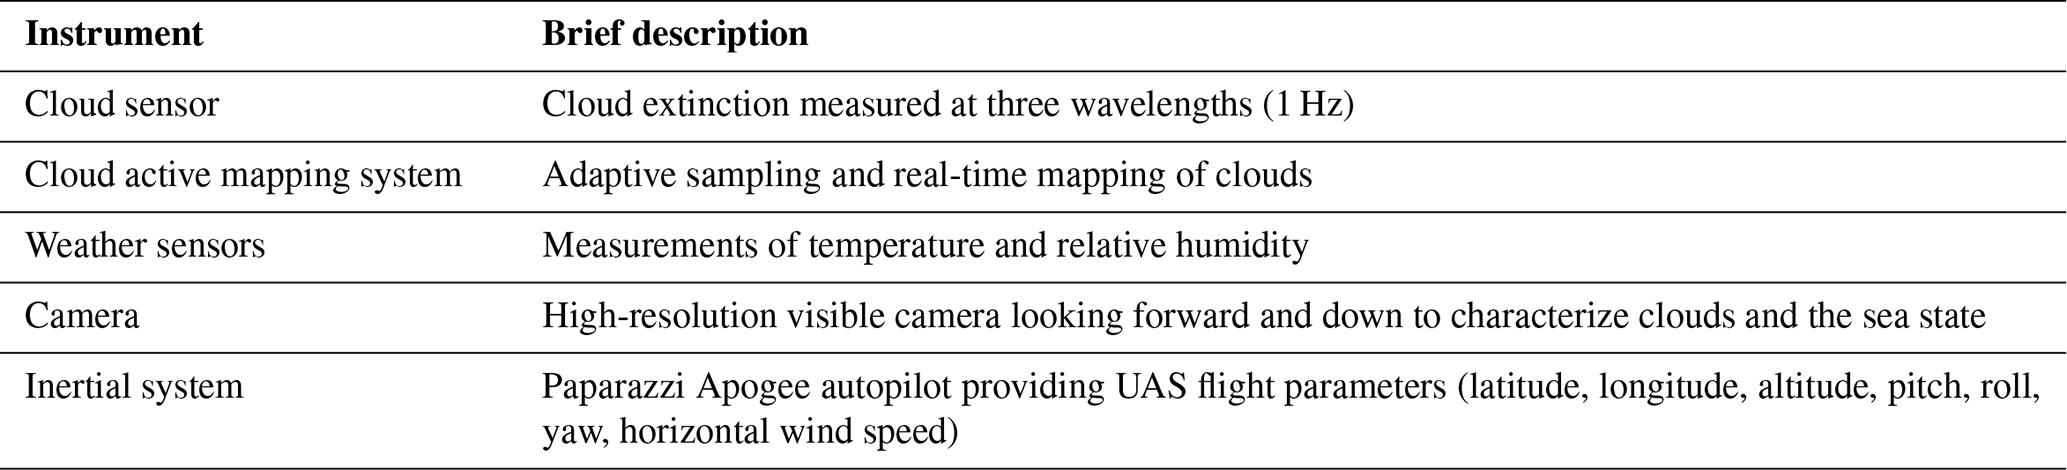
B15 Caravela
The AutoNaut (Caravela) was operated by the University of East Anglia (UEA). Caravela is an unmanned surface vehicle with continuously sampling meteorological and oceanographic sensors and can also be used to tow and deploy an underwater glider. During EUREC4A it was deployed on 22 January from the coastguard station on Barbados towing underwater glider SG579, which was released on 28 January. Caravela continued to its study location centered at 14.2∘ N, 57.3∘ W and spent 11 d repeating a butterfly pattern around a square with 10 km sides, before returning to Barbados for recovery on 24 February.
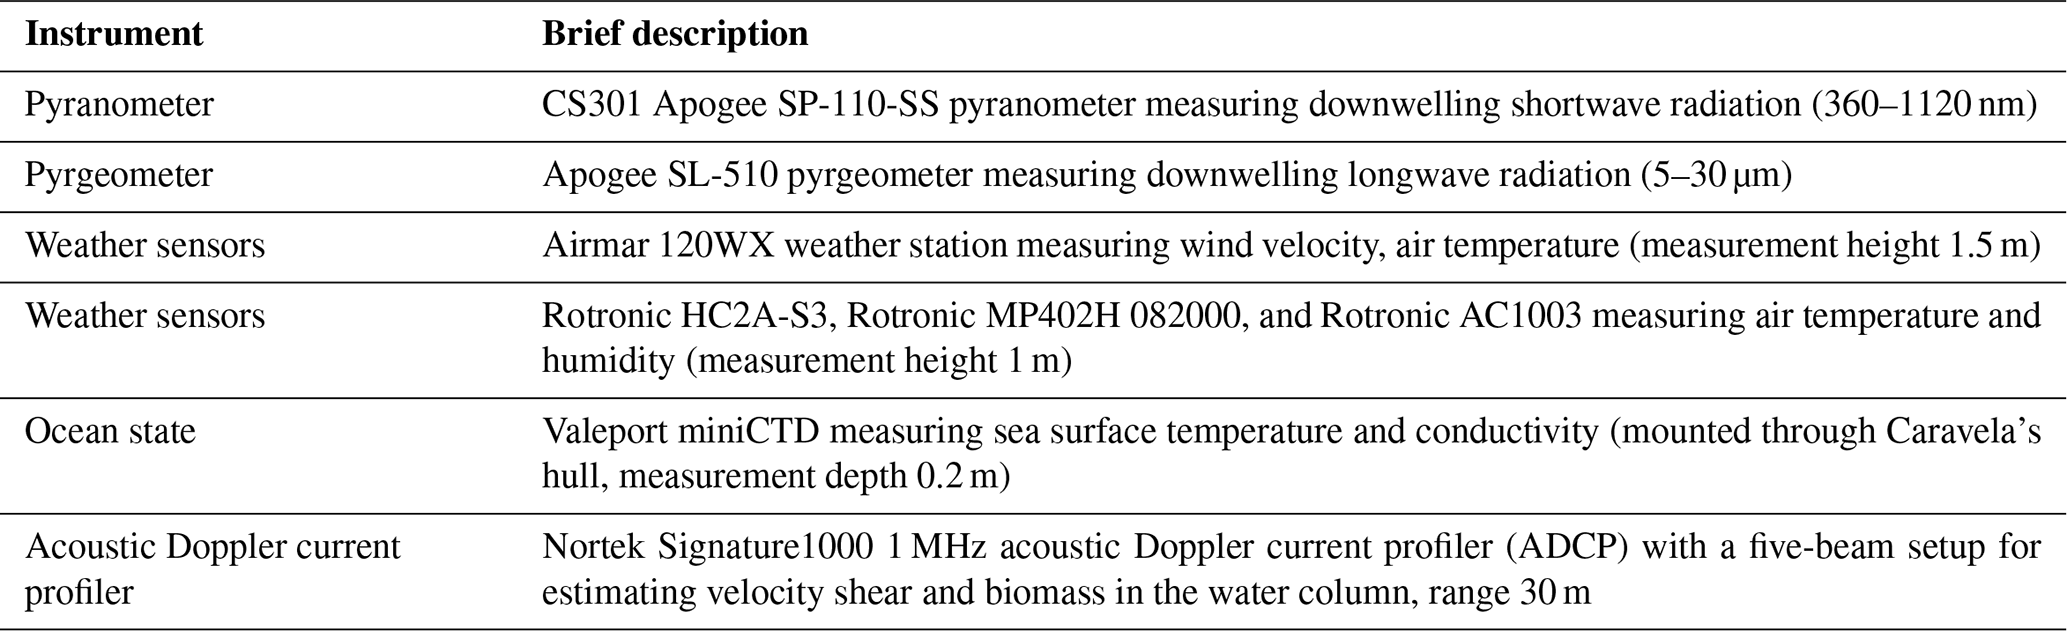
B16 Underwater electric gliders
Three underwater gliders were operated by UEA. SG579 was deployed from Caravela on 28 January and completed 76 dives to 1 000 m along the transect to the gliders' study location, followed by 219 dives to 250 m while traversing the same butterfly pattern as Caravela. It was recovered onto R/V Meteor on 16 February. SG637 was deployed from R/V Meteor on 23 January, completed 155 dives to 750 m around the same “butterfly”, all with ADCP data, and was also recovered onto R/V Meteor on 16 February. SG620 was deployed from the Meteor on 23 January and completed 131 dives to 750 min virtual mooring mode at the center of the butterfly, before being recovered on 5 February onto R/V Meteor.
Three Teledyne Slocum G2 underwater electric gliders were operated by GEOMAR. All three surveyed down to 1000 m depth. IFM03 and IFM12 were deployed from the R/V MS-Merian on 24 January to survey the edge of a mesoscale eddy. IFM03 was recovered by the R/V Meteor on 3 February, and IFM12 was recovered with R/V MS-Merian on 17 February 2020 after a complete survey. IFM09 was operated within the EUREC4A-Circle as a virtual mooring mission from 20 January and recovered by R/V MS-Merian on 9 February 2020.
One SeaExplorer X2 underwater glider (Kraken) was deployed and recovered from the R/V Atalante and operated by DT INSU CNRS in connection with the ship chief scientist. Kraken was deployed on 25 January at N, W and was recovered on 13 February 2020 at N, W. It accomplished 472 profiles down to 700 m across two different mesoscale eddies, both anticyclonic: a North Brazil Current ring limited to the upper 150 m of depth and a thicker subsurface (200–600 m) eddy.
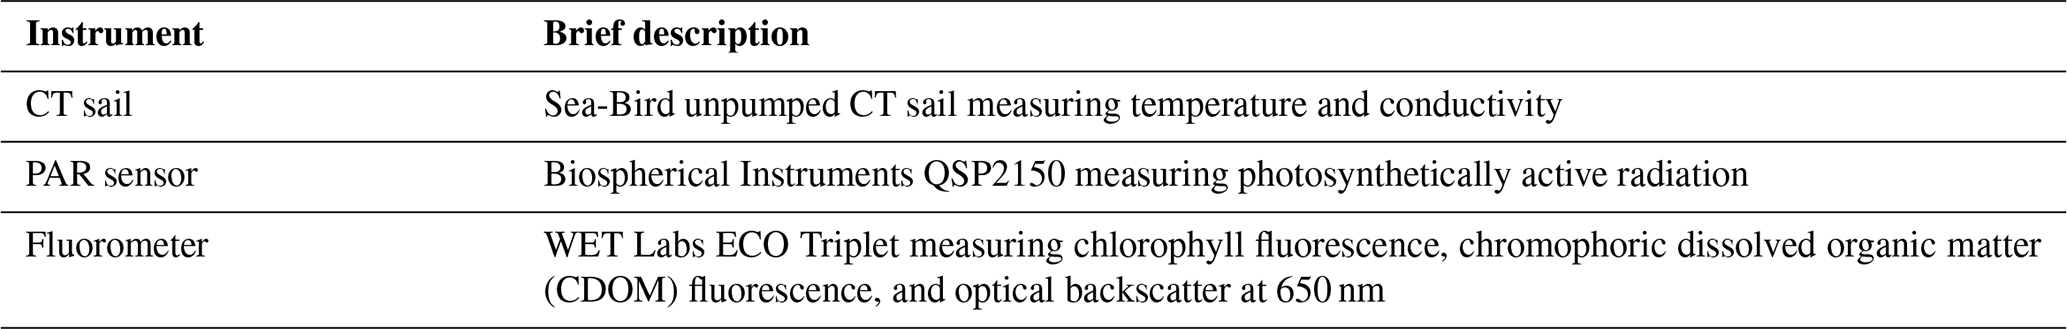
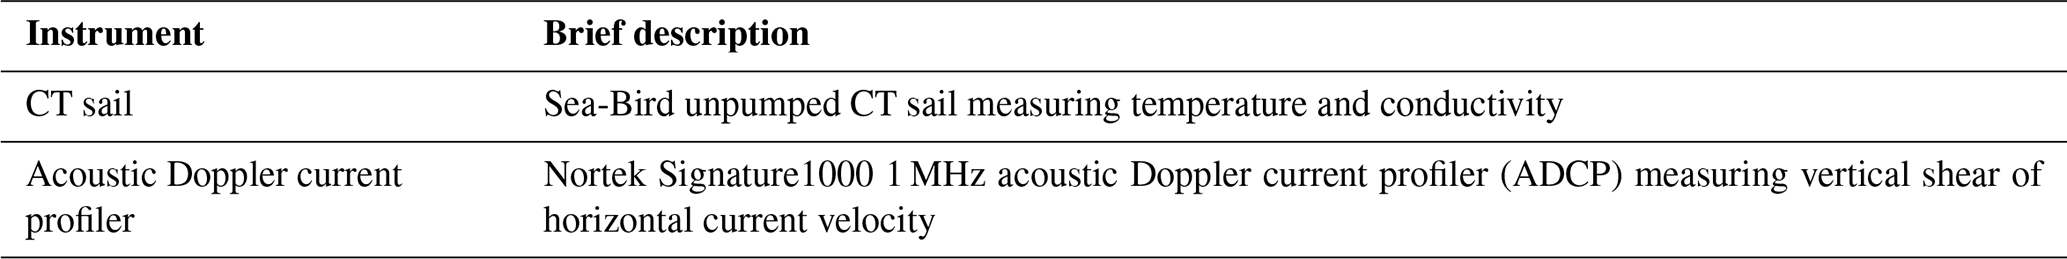
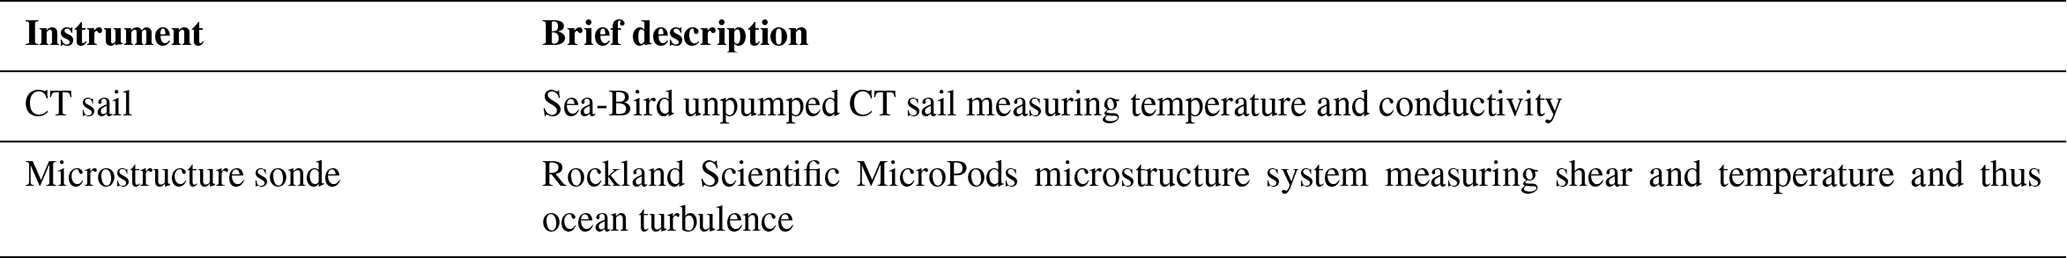
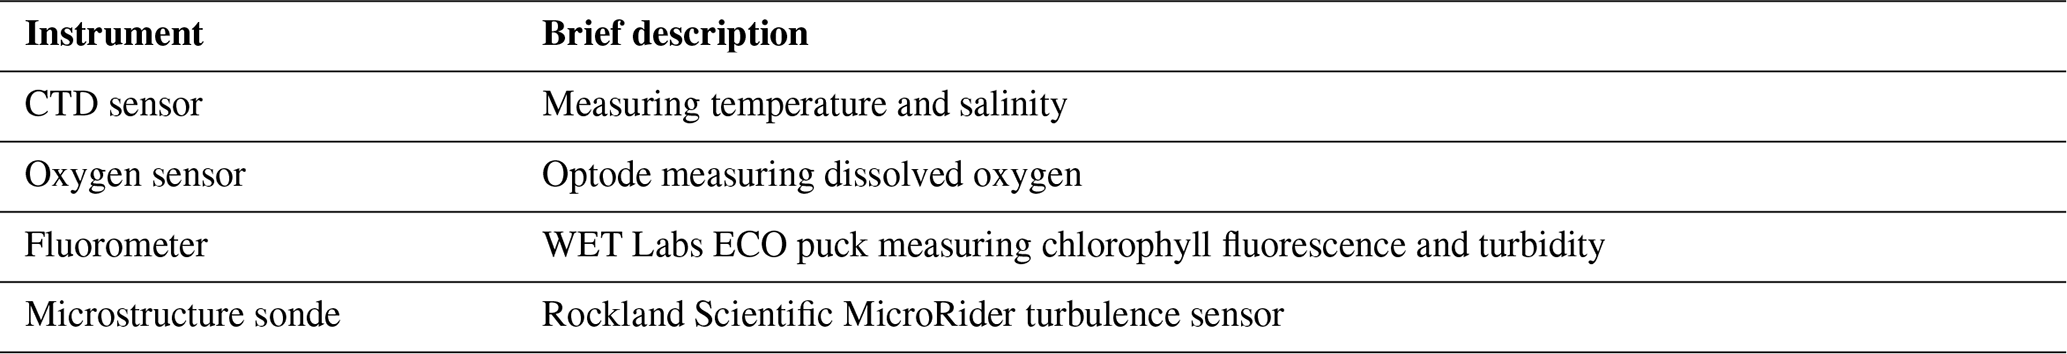
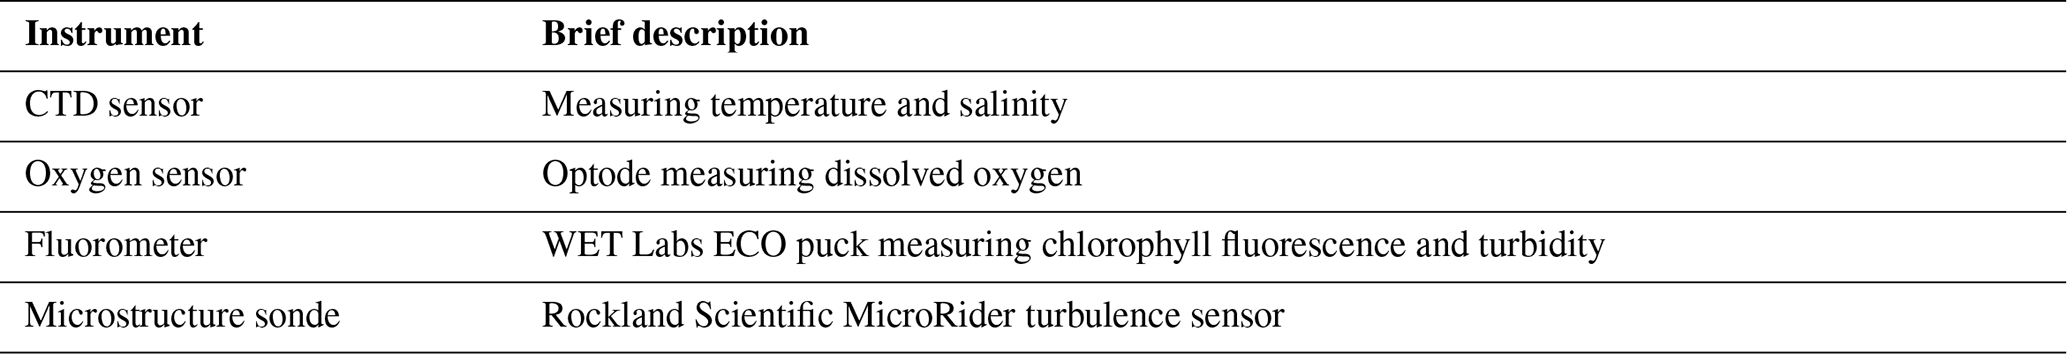

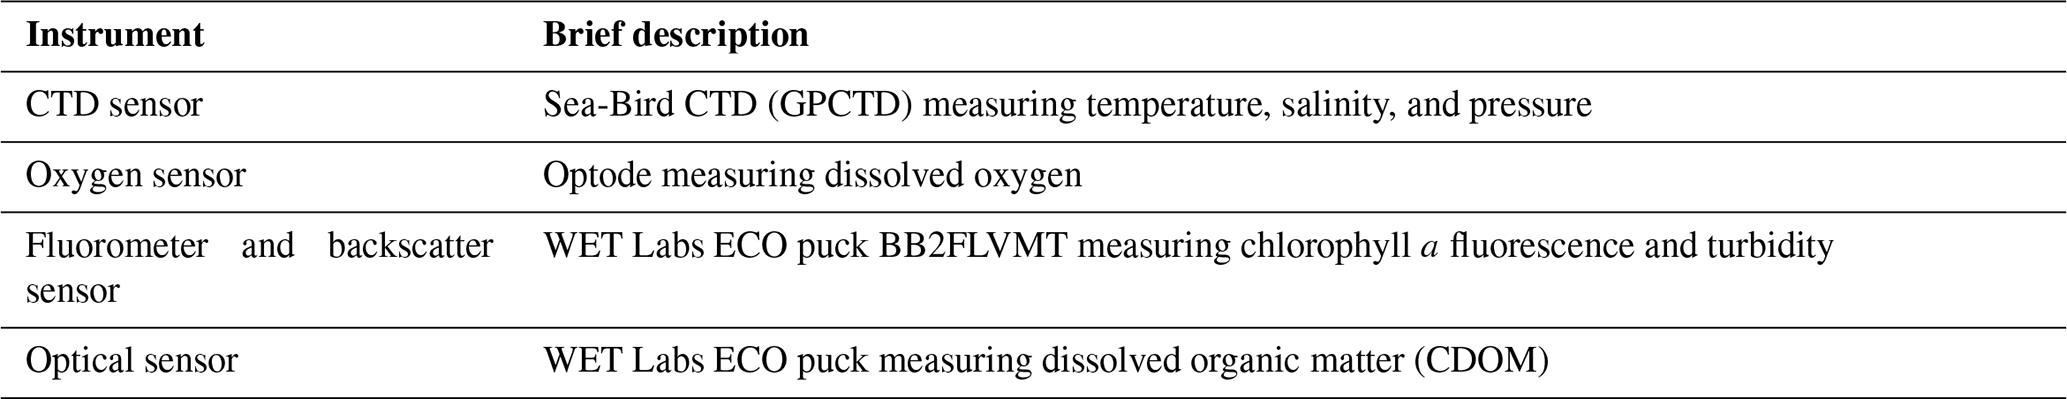
B17 Saildrones
Continuous measurements of air–sea interaction by five uncrewed surface vehicle (USV) Saildrones were led by Farallon Institute, NOAA/PMEL, and CICOES/University of Washington during EUREC4A and ATOMIC from 12 January to 3 March 2020. Three NASA funded Saildrones (SD1026, SD1060, SD1061) and one NOAA-funded Saildrone (SD1063) were dedicated to the ocean eddy corridor southeast of Barbados, where large North Brazil Current rings migrate northwestward. The NOAA-funded Saildrone SD1064 was dedicated to the trade wind alley between NTAS buoy and the HALO flight circle. The two NOAA-funded Saildrones continued their observation after the EUREC4A/ATOMIC intensive observation period until 15 July 2020.
Zhang et al., 2019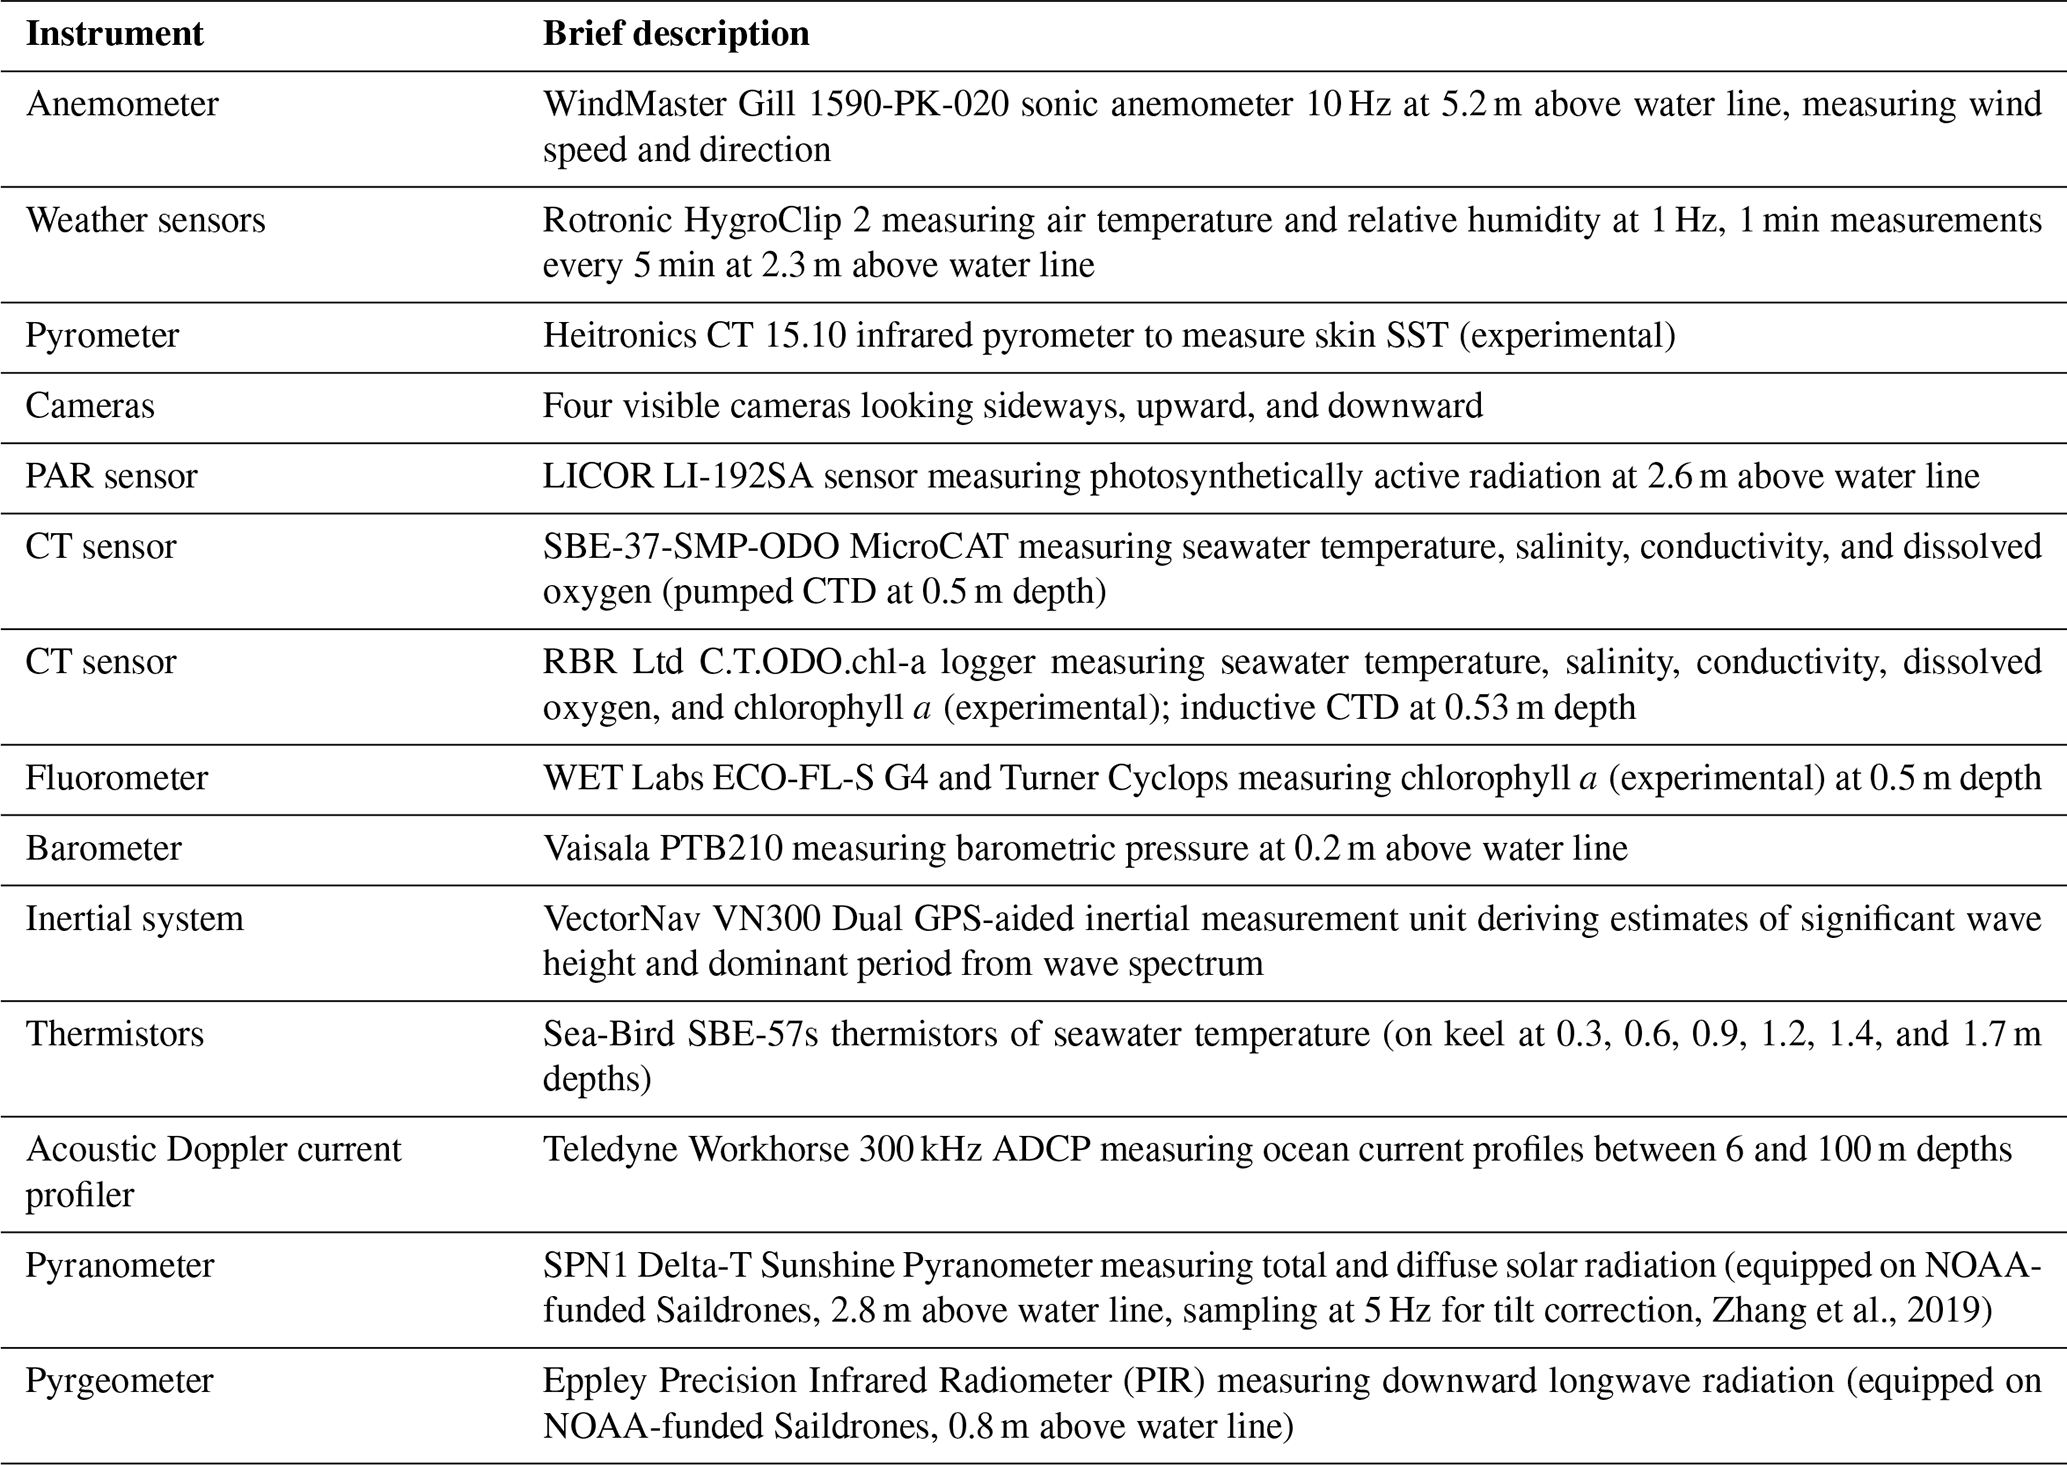
B18 SWIFTs and Wave Gliders
A total of six SWIFT (Surface Wave Instrument Floats with Tracking) drifting platforms were deployed from the R/V Ron Brown during EUREC4A. There was an initial deployment for 2 weeks in January 2020 and a second deployment for another 2 weeks in February 2020. SWIFTs are produced and operated by the Applied Physics Laboratory at the University of Washington. Two of the SWIFTs were version 3 models, as described in Thomson (2012), and four of the SWIFTs were version 4 models, as described in Thomson et al. (2019). SWIFTs collect data in a wave following reference frame, with burst sampling and statistical products available hourly.
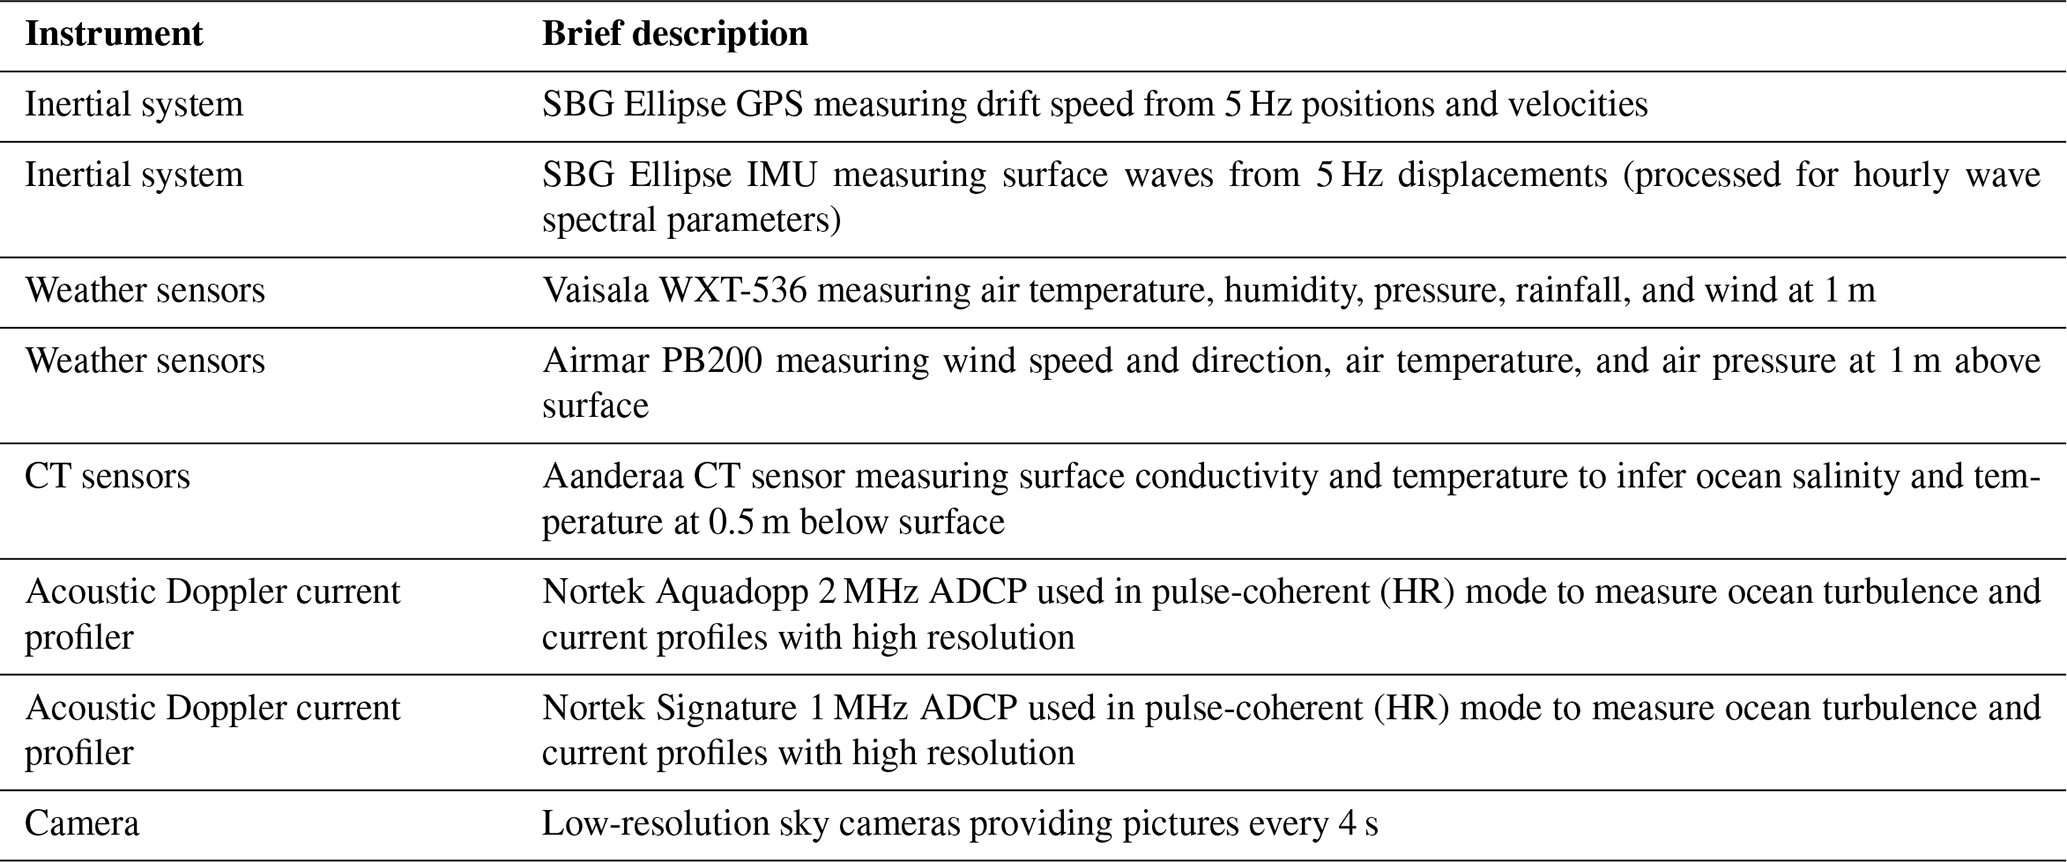
Two Wave Glider ASVs (autonomous surface vehicles), designated WG245 and WG247, operated from the R/V Ron Brown during EUREC4A. The missions each spanned 4 weeks from January to February 2020. The Wave Gliders are built by Liquid Robotics, Inc, with additional sensors integrated by the Applied Physics Laboratory at the University of Washington for air–sea flux calculations (Thomson and Girton, 2017).
Thomson et al., 2018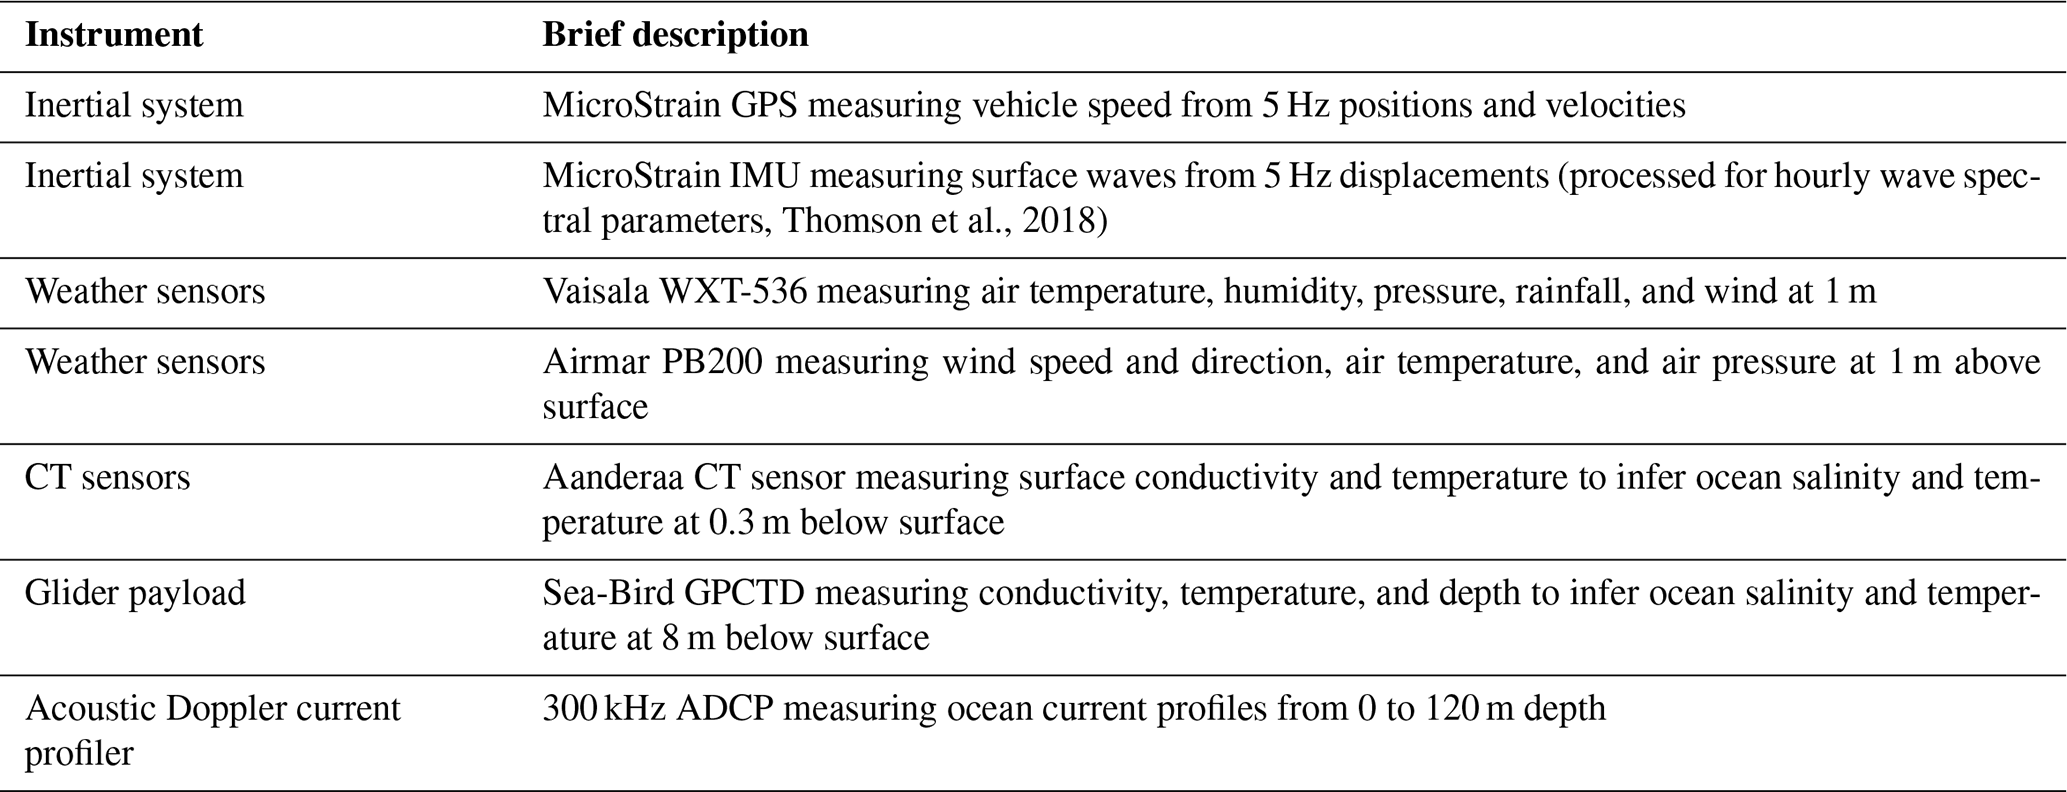
B19 Surface drifters, OCARINA and PICCOLO
Ten SVP-BSW (barometer–salinity–wind) drifters from Pacific Gyre were deployed from R/V Atalante from 23 January to 4 February 2020. Each drifter had temperature and salinity measurements at three levels (0.50, 5, and 10 m) as well as barometric sea level pressure and wind. Five SC40 SVP-BRST drifters (from EUMETSAT grant TRUSTED to Météo-France/CLS) manufactured by NKE were deployed for three short periods of time from the R/V Atalante before being finally released at sea between 10 and 14 February 2020. Each drifter provided high-precision measurements of temperature at 20 cm depth and of barometric sea level pressure. Two SC40 SVP-BSC drifters (from Météo-France/LOCEAN with CNES/SMOS support) manufactured by NKE were deployed for three short periods of time from the R/V Atalante before being released at sea between 10 and 14 February 2020. Each drifter measured temperature and salinity at 20 cm depth and barometric sea level pressure. Two Surpact wave riders manufactured by SMRU (University of St Andrews) and LOCEAN (with CNES/SMOS support) were deployed for short times from the R/V Atalante before being released at sea between 10 and 14 February 2020. These drifters do not have a drogue to follow the currents at 15 m and thus are deployed tethered to another drifter. Each float measured temperature and salinity at 5 cm depth, as well as vertical acceleration and thus wave spectra. Moreover, the noise recorded by a microphone under a cupola was spectrally analyzed to estimate the noise of the wind/waves and rainfall. Five barometer–temperature drifters from Pacific Gyre were deployed from R/V MS-Merian from 21 January to 4 February 2020. Each drifter measured temperature at 20 cm depth and barometric sea level pressure. Each drifter had a 6 m long drogue centered at a depth of 15 m. The drifters used Iridium SBD telemetry and a 50-channel GPS system (including WAAS correction), and data were transmitted every 30 min.
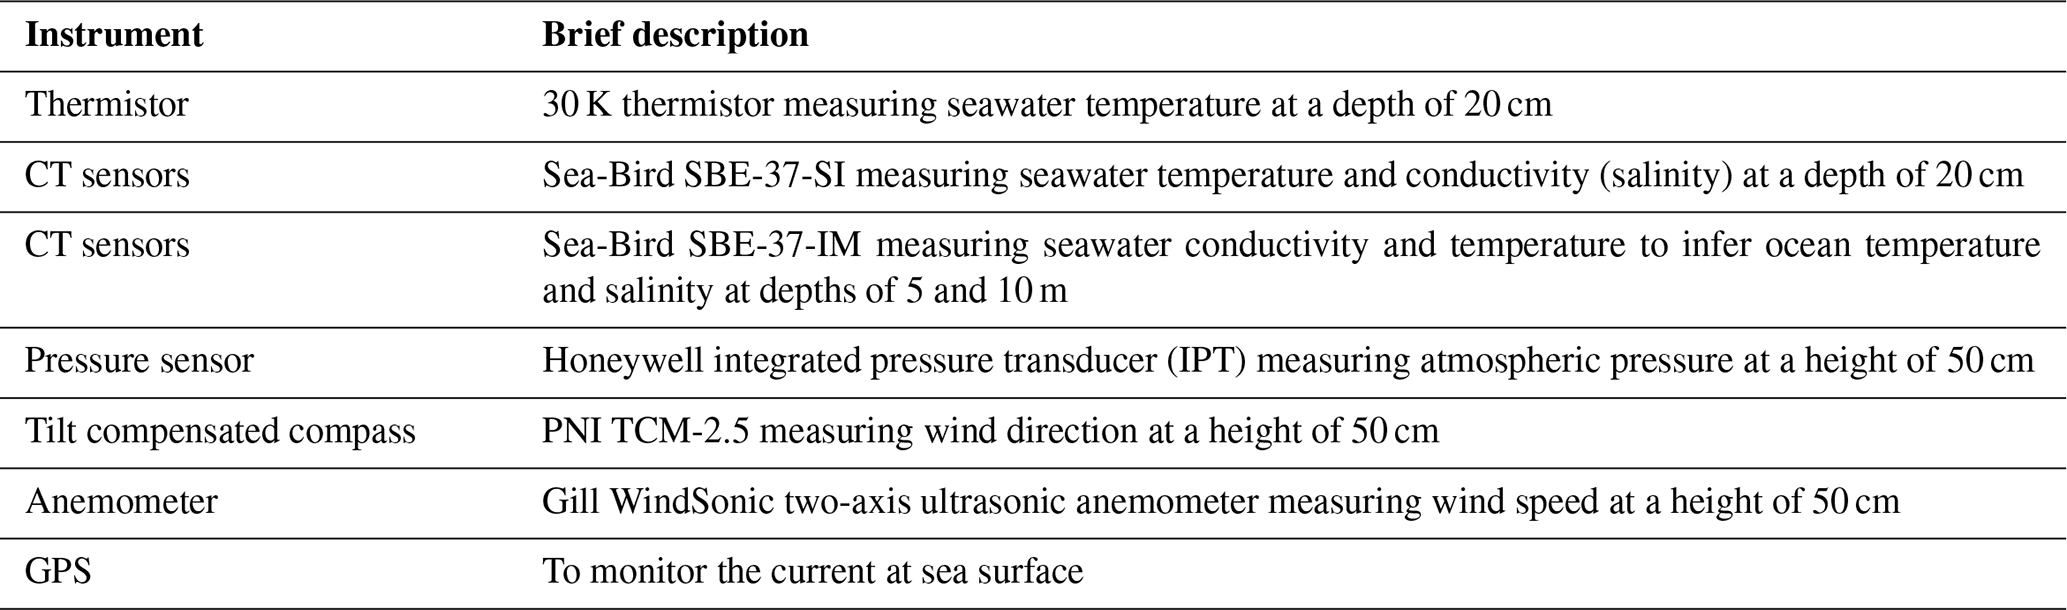
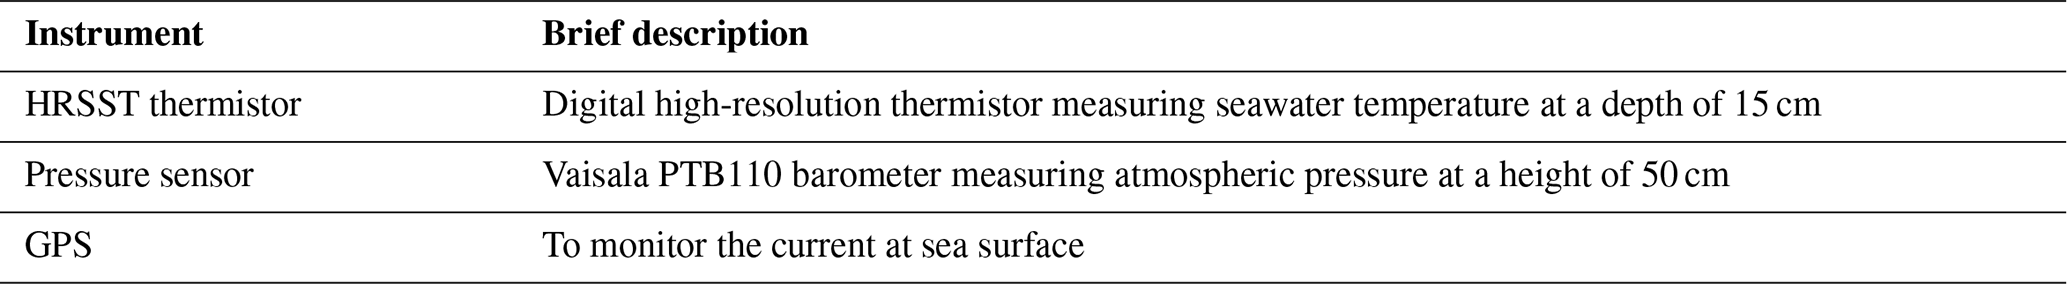
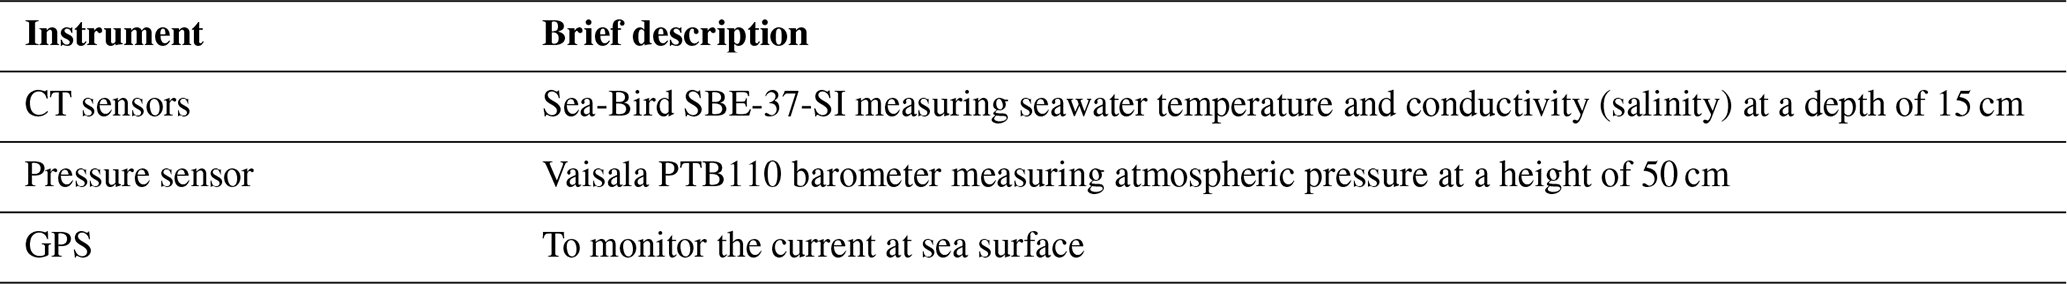
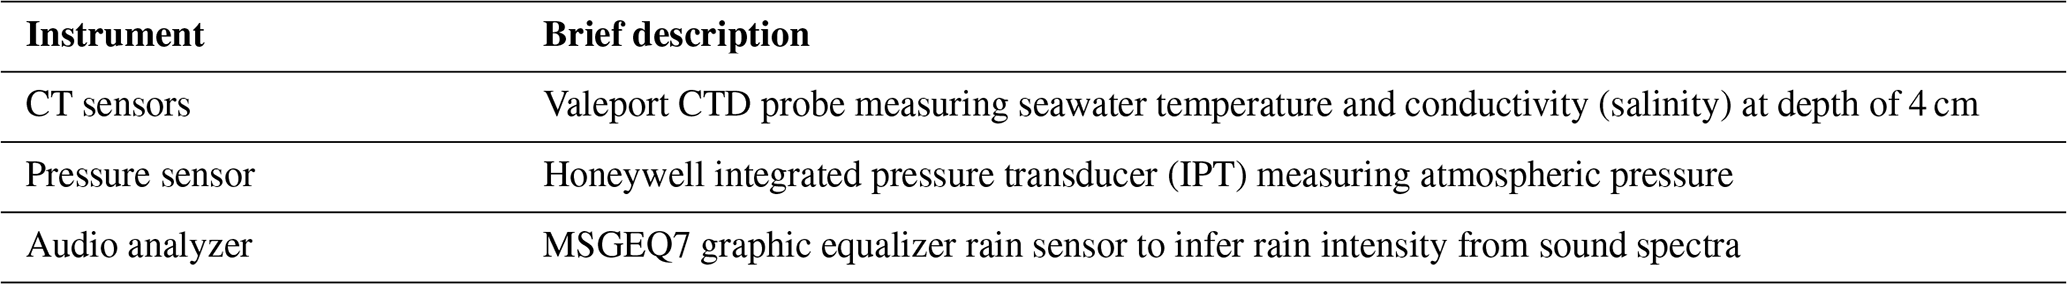
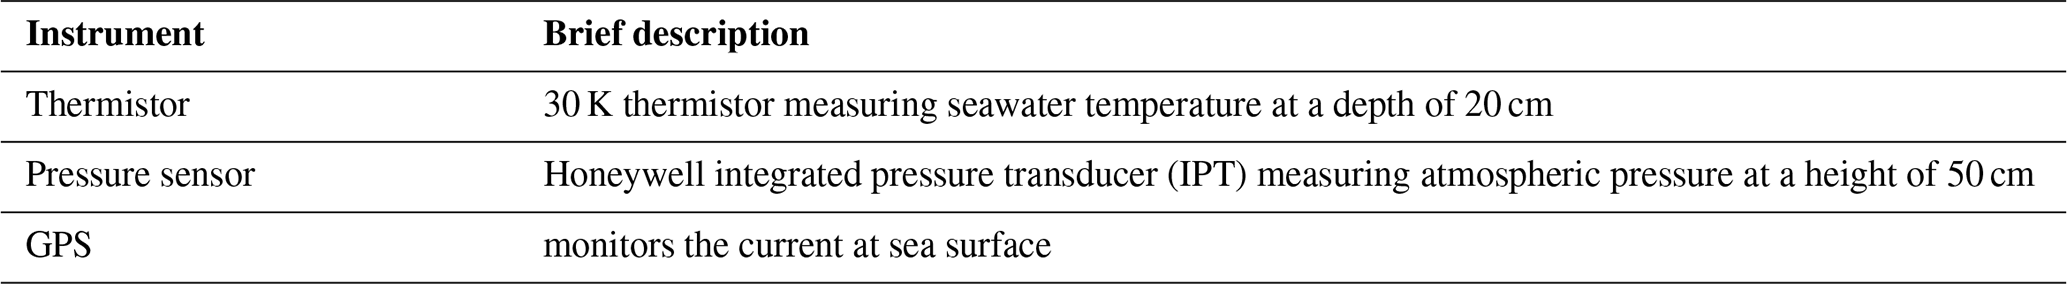
The R/V Atalante also deployed two drifting platform prototypes, OCARINA (Ocean Coupled to Atmosphere, Research at the Interface with a Novel Autonomous platform) and PICCOLO (Profiling Instrument to Check if the wind Curvature is Only Logarithmic on the Ocean), to measure air–sea fluxes (momentum, sensible heat, latent heat, radiative shortwave and longwave up and down) very close to the sea surface. The platforms were deployed on 25 January 2020 from 15:00 to 21:00 UTC (start position 10.11∘ N, 57.50∘ W; end position 10.15∘ N, 57.45∘ W), on 3 February from 10:00 to 21:00 UTC (start position 6.83∘ N, 54.14∘ W; end position 6.83∘ N, 54.34∘ W), on 10 February from 10:00 to 19:00 UTC (start position 10.38∘ N, 59.13∘ W; end position 10.53∘ N, 59.23∘ W), and on 17 February from 09:00 to 18:00 UTC (start position 13.13∘ N, 59.75∘ W; end position 13.10∘ N, 59.82∘ W).
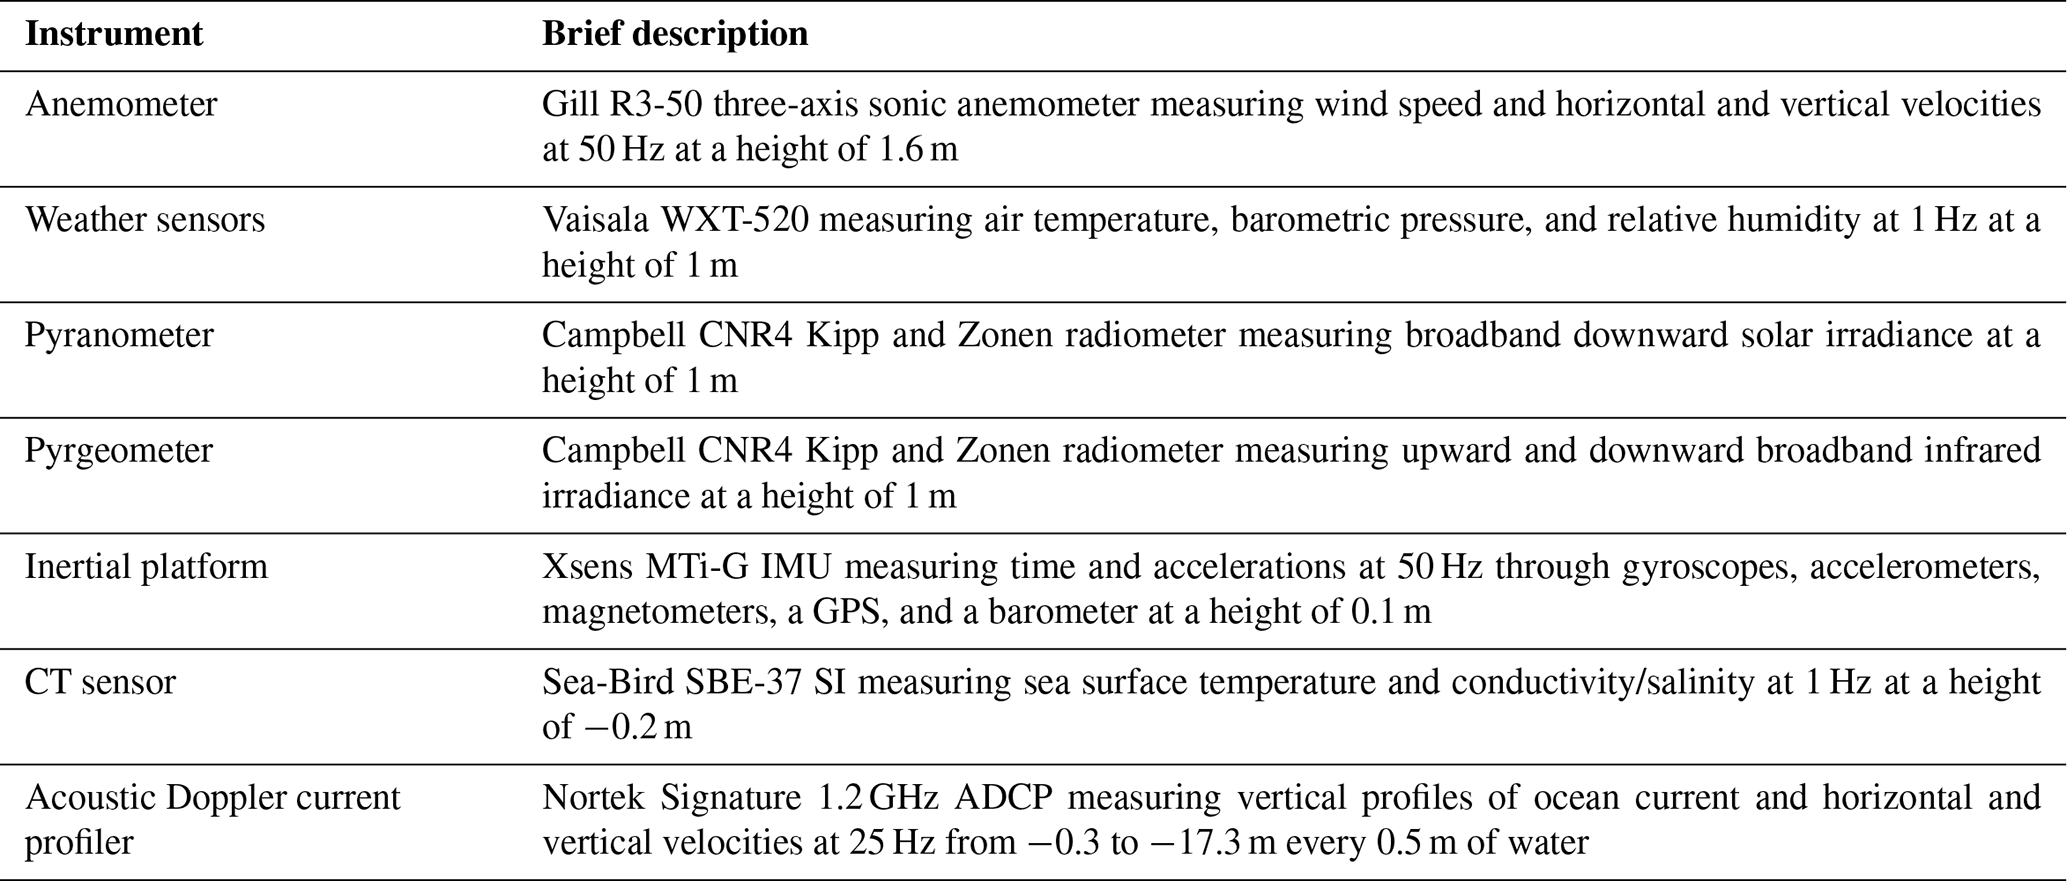
A film documenting EUREC4A activities, by Iulian Furtuna and Marius Lena, is made available as a video supplement (https://doi.org/10.25326/224, Lena et al., 2021).
Author contributions are grouped (alphabetically) in different categories of contribution. BS and SB conceived of and led EUREC4A and the preparation and writing of this paper. DF co-led the coordination as the local lead principal investigator (PI). FA, AB, CF, JK, PKQ, and SaS conceived of and led a major component of EUREC4A. AB, DF, and SaS additionally contributed substantially to the preparation of the paper. The next grouping of authors, beginning with CA, made major contributions to the broader coordination and execution of scientific and/or dissemination activities. The final group of authors, beginning with NA, served as instrument PIs and/or made substantial contributions to the scientific preparation, execution, and/or dissemination activities. The groupings are subjective and imperfect but were motivated in part by the desire to better highlight the initiative of early career scientists in taking on responsibility and contributing to both the intellectual and organizational foundations of EUREC4A. Specific contributions, as self statements, are recorded as part of the scientific documentation.
The authors declare that they have no conflict of interest.
Publisher's note: Copernicus Publications remains neutral with regard to jurisdictional claims in published maps and institutional affiliations.
This article is part of the special issue “Elucidating the role of clouds–circulation coupling in climate: datasets from the 2020 (EUREC4A) field campaign”. It is not associated with a conference.
The authors thank the people and government of Barbados for their support of EUREC4A. Without the hospitality and scientific interest of both Barbadian citizens and their institutions (governmental, private, and non-profit), our efforts would not have borne fruit. We thank the captains and crews of the R/V Atalante, the R/V Meteor (cruise M161), the R/V MS-Merian (cruise MSM89), and the R/V Ron Brown for their excellent support. We likewise thank the pilots, technicians, and engineers of the ATR-42, HALO, the Twin Otter, and the WP-3D. Richard Hoad is thanked for his support and access to his property for UAS operations. Alissandra Cummins and the Barbados Museum are thanked for their enduring support and their cooperation in the establishment and maintenance of the BCO. William Burton is thanked for a guided hiking tour for the on-island scientists. We also gratefully acknowledge Aurélien Bourdon (director of SAFIRE) as well as all the SAFIRE and airplane delivery staff for overcoming extraordinary last-minute challenges to make the participation of the ATR in EUREC4A possible. The editors and staff of the ESSD are thanked for their professional handling of the paper, and two anonymous reviewers are thanked for their positive comments. Gaelle Bruant is thanked for her administrative support. Angela Gruber is thanked for her organizational support and her admirable ability to manage people and bureaucracies.
This research has been supported by the people and government of Barbados; the Max Planck Society and its supporting members; the German Research Foundation (DFG) and the German Federal Ministry of Education and Research (grant nos. GPF18-1_69 and GPF18-2_50); the European Research Council (ERC) advanced grant EUREC4A (grant agreement no. 694768) under the European Union’s Horizon 2020 research and innovation program (H2020), with additional support from CNES (the French National Centre for Space Studies) through the EECLAT proposal, Météo-France, the CONSTRAIN H2020 project (grant agreement no. 820829), and the French AERIS Research Infrastructure; the Natural Environment Research Council (NE/S015868/1, NE/S015752/1, and NE/S015779/1); ERC under the European Union’s H2020 program (COMPASS, advanced grant agreement no. 74110); the French national program LEFE INSU, by IFREMER, the French research fleet, CNES, the French research infrastructures AERIS and ODATIS, IPSL, the Chaire Chanel program of the Geosciences Department at ENS, and the European Union's Horizon 2020 research and innovation program under grant agreement no. 817578 TRIATLAS; NOAA’s Climate Variability and Prediction Program within the Climate Program Office (grant nos. GC19-305 and GC19-301); NOAA cooperative agreement NA15OAR4320063; NOAA's Climate Program Office and base funds to NOAA/AOML's Physical Oceanography Division; Swiss National Science Foundation grant no. 188731; the UAS Program Office, Climate Program Office, and Physical Sciences Laboratory and by the US National Science Foundation (NSF) through grant AGS-1938108; Deutsche Forschungsgemeinschaft (DFG, German Research Foundation) under Germany's Excellence Strategy – EXC 2037 “CLICCS – Climate, Climatic Change, and Society” – project no. 390683824; and Poland’s National Science Centre grant no. UMO-2018/30/M/ST10/00674 and Foundation for Polish Science grant no. POIR.04.04.00-00-3FD6/17-02.
This paper was edited by Lisan Yu and reviewed by two anonymous referees.
Ackerman, A. S., vanZanten, M. C., Stevens, B., Savic-Jovcic, V., Bretherton, C. S., Chlond, A., Golaz, J.-C., Jiang, H., Khairoutdinov, M., Krueger, S. K., Lewellen, D. C., Lock, A., Moeng, C.-H., Nakamura, K., Petters, M. D., Snider, J. R., Weinbrecht, S., and Zulauf, M.: Large-Eddy Simulations of a Drizzling, Stratocumulus-Topped Marine Boundary Layer, Mon. Weather Rev., 137, 1083–1110, 2009. a
Aemisegger, F., Vogel, R., Graf, P., Dahinden, F., Villiger, L., Jansen, F., Bony, S., Stevens, B., and Wernli, H.: How Rossby wave breaking modulates the water cycle in the North Atlantic trade wind region, Weather Clim. Dynam., 2, 281–309, https://doi.org/10.5194/wcd-2-281-2021, 2021. a
Albrecht, B., Bretherton, C. S., Johnson, D., Schubert, W. S., and Frisch, A. S.: The Atlantic stratocumulus transition experiment – ASTEX, B. Am. Meteorol. Soc., 76, 889–904, 1995. a
Albrecht, B., Ghate, V., Mohrmann, J., Wood, R., Zuidema, P., Bretherton, C., Schwartz, C., Eloranta, E., Glienke, S., Donaher, S., Sarkar, M., McGibbon, J., Nugent, A. D., Shaw, R. A., Fugal, J., Minnis, P., Paliknoda, R., Lussier, L., Jensen, J., Vivekanandan, J., Ellis, S., Tsai, P., Rilling, R., Haggerty, J., Campos, T., Stell, M., Reeves, M., Beaton, S., Allison, J., Stossmeister, G., Hall, S., and Schmidt, S.: Cloud System Evolution in the Trades (CSET): Following the Evolution of Boundary Layer Cloud Systems with the NSF–NCAR GV, B. Am. Meteorol. Soc., 100, 93–121, 2019. a
Augstein, E., Schmidt, H., and Ostapoff, F.: The vertical structure of the atmospheric planetary boundary layer in undisturbed trade winds over the Atlantic Ocean, Bound.-Lay. Meteor., 6, 129–150, 1974. a
Bailey, A., Toohey, D., and Noone, D.: Characterizing moisture exchange between the Hawaiian convective boundary layer and free troposphere using stable isotopes in water, J. Geophys. Res.-Atmos., 118, 8208–8221, 2013. a
Bannon, J. K.: Large-scale vertical motion in the atmosphere, Nature, 163, 495–496, 1949. a
Behrendt, A., Wulfmeyer, V., Senff, C., Muppa, S. K., Späth, F., Lange, D., Kalthoff, N., and Wieser, A.: Observation of sensible and latent heat flux profiles with lidar, Atmos. Meas. Tech., 13, 3221–3233, https://doi.org/10.5194/amt-13-3221-2020, 2020. a
Bigorre, S. and Plueddemann, A. J.: The Annual Cycle of Air-Sea fluxes in the Northwest Tropical Atlantic, Front. Mar. Sci., 7, 612842, https://doi.org/10.3389/fmars.2020.612842, 2020. a
Bodenschatz, E., Malinowski, S. P., Shaw, R. A., and Stratmann, F.: Can we understand clouds without turbulence?, Science, 327, 970–971, 2010. a
Bony, S. and Stevens, B.: Measuring Area-Averaged Vertical Motions with Dropsondes, J. Atmos. Sci, 76, 767–783, 2019. a
Bony, S., Stevens, B., Frierson, D. M. W., Jakob, C., Kageyama, M., Pincus, R., Shepherd, T. G., Sherwood, S. C., Siebesma, A. P., Sobel, A. H., Watanabe, M., and Webb, M. J.: Clouds, circulation and climate sensitivity, Nat. Geosci., 8, 261–268, 2015. a
Bony, S., Stevens, B., Ament, F., Bigorre, S., Chazette, P., Crewell, S., Delanoë, J., Emanuel, K., Farrell, D., Flamant, C., Gross, S., Hirsch, L., Karstensen, J., Mayer, B., Nuijens, L., Ruppert, J. H., Sandu, I., Siebesma, P., Speich, S., Szczap, F., Totems, J., Vogel, R., Wendisch, M., and Wirth, M.: EUREC4A: A field campaign to Elucidate the Couplings between Clouds, Convection and Circulation, Surv. Geophys., 36, 1529–1568, 2017. a, b, c
Bony, S., Schulz, H., Vial, J., and Stevens, B.: Sugar, Gravel, Fish and Flowers: Dependence of Mesoscale Patterns of Trade-wind Clouds on Environmental Conditions, Geophys. Res. Lett., 47, e2019GL085988, https://doi.org/10.1029/2019GL085988, 2020. a, b
Bretherton, C. S., Krueger, S. K., Wyant, M. C., Bechtold, P., van Meijgaard, E., Stevens, B., and Teixeira, J.: A GCSS Boundary-Layer Cloud Model Intercomparison Study Of The First Astex Lagrangian Experiment, Bound.-Lay. Meteorol., 93, 341–380, 1999. a
Brient, F., Schneider, T., Tan, Z., Bony, S., Qu, X., and Hall, A.: Shallowness of tropical low clouds as a predictor of climate models' response to warming, Clim. Dynam., 47, 433–449, 2016. a
Broadwell, J. E. and Breidenthal, R. E.: A simple model of mixing and chemical reaction in a turbulent shear layer, J. Fluid Mech., 125, 397–410, 1982. a
Brummer, B., Augstein, E., and Riehl, H.: On the low-level wind structure in the Atlantic trade, Q. J. Roy. Meteor. Soc., 100, 109–121, 1974. a
Buckingham, C. E., Garabato, A. C. N., Thompson, A. F., Brannigan, L., Lazar, A., Marshall, D. P., Nurser, A. J. G., Damerell, G., Heywood, K. J., and Belcher, S. E.: Seasonality of submesoscale flows in the ocean surface boundary layer, Geophys. Res. Lett., 43, 2118–2126, 2016. a, b
Callies, J. and Ferrari, R.: Interpreting Energy and Tracer Spectra of Upper-Ocean Turbulence in the Submesoscale Range (1–200 km), J. Phys. Oceanogr., 43, 2456–2474, 2013. a
Carton, X.: Oceanic Vortices, in: Fronts, Waves and Vortices in Geophysical Flows, pp. 61–108, Springer Berlin Heidelberg, Berlin, Heidelberg, 2010. a
Chazette, P., Totems, J., Baron, A., Flamant, C., and Bony, S.: Trade-wind clouds and aerosols characterized by airborne horizontal lidar measurements during the EUREC4A field campaign, Earth Syst. Sci. Data, 12, 2919–2936, https://doi.org/10.5194/essd-12-2919-2020, 2020. a, b
Chelton, D. B. and Xie, S.-P.: Coupled Ocean-Atmosphere Interaction at Oceanic Mesoscales, Oceanography, 23, 52–69, 2010. a
Chelton, D. B., Esbensen, S. K., Schlax, M. G., Thum, N., Freilich, M. H., Wentz, F. J., Gentemann, C. L., McPhaden, M. J., and Schopf, P. S.: Observations of Coupling between Surface Wind Stress and Sea Surface Temperature in the Eastern Tropical Pacific, J. Climate, 14, 1479–1498, https://doi.org/10.1175/1520-0442(2001)014<1479:OOCBSW>2.0.CO;2, 2001. a
Cooper, W. A., Lasher-Trapp, S. G., and Blyth, A. M.: The influence of entrainment and mixing on the initial formation of rain in a warm cumulus cloud, J. Atmos. Sci., 70, 1727–1743, 2013. a
D'Asaro, E. A., Shcherbina, A. Y., Klymak, J. M., Molemaker, J., Novelli, G., Guigand, C. M., Haza, A. C., Haus, B. K., Ryan, E. H., Jacobs, G. A., Huntley, H. S., Laxague, N. J. M., Chen, S., Judt, F., McWilliams, J. C., Barkan, R., Kirwan, A. D., Poje, A. C., and Özgökmen, T. M.: Ocean convergence and the dispersion of flotsam, P. Natl. Acad. Sci. USA, 115, 1162–1167, 2018. a, b
de Boer, G., Borenstein, S., Calmer, R., Cox, C., Rhodes, M., Choate, C., Hamilton, J., Osborn, J., Lawrence, D., Argrow, B., and Intrieri, J.: Measurements from the University of Colorado RAAVEN Uncrewed Aircraft System during ATOMIC, Earth Syst. Sci. Data Discuss. [preprint], https://doi.org/10.5194/essd-2021-175, in review, 2021. a
Delanoë, J., Protat, A., Vinson, J.-P., Brett, W., Caudoux, C., Bertrand, F., Parent du Chatelet, J., Hallali, R., Barthes, L., Haeffelin, M., and Dupont, J.-C.: BASTA: A 95-GHz FMCW Doppler Radar for Cloud and Fog Studies, J. Atmos. Ocean. Tech., 33, 1023–1038, 2016. a
Denby, L.: Discovering the Importance of Mesoscale Cloud Organization Through Unsupervised Classification, Geophys. Res. Lett., 47, 1097–10, 2020. a
Dixit, V. V., Nuijens, L., and Helfer, K. C.: Counter-gradient momentum transport through subtropical shallow convection in ICON-LEM simulations, Earth and Space Science Open Archive, p. 23, 2020. a
Ewald, F., Kölling, T., Baumgartner, A., Zinner, T., and Mayer, B.: Design and characterization of specMACS, a multipurpose hyperspectral cloud and sky imager, Atmos. Meas. Tech., 9, 2015–2042, https://doi.org/10.5194/amt-9-2015-2016, 2016. a
Fairall, C. W., Bradley, E. F., Godfrey, J. S., Wick, G. A., Edson, J. B., and Young, G. S.: Cool-skin and warm-layer effects on sea surface temperature, J. Geophys. Res.-Oceans, 101, 1295–1308, 1996. a
Foussard, A., Lapeyre, G., and Plougonven, R.: Response of Surface Wind Divergence to Mesoscale SST Anomalies under Different Wind Conditions, J. Atmos. Sci., 76, 2065–2082, 2019. a
Garstang, M. and Betts, A. K.: A Review of the Tropical Boundary Layer and Cumulus Convection: Structure, Parameterization, and Modeling, B. Am. Meteorol. Soc., 55, 1195–1205, 1974. a
Gibson, E. R., Gierlus, K. M., Hudson, P. K., and Grassian, V. H.: Generation of Internally Mixed Insoluble and Soluble Aerosol Particles to Investigate the Impact of Atmospheric Aging and Heterogeneous Processing on the CCN Activity of Mineral Dust Aerosol, Aerosol Sci. Tech., 41, 914–924, 2007. a
Holland, J. Z. and Rasmusson, E. M.: Measurements of the atmospheric mass, energy, and momentum budgets over a 500-kilometer square of tropical ocean, Mon. Weather Rev., 101, 44–55, 1973. a, b
Illingworth, A. J., Barker, H. W., Beljaars, A., Ceccaldi, M., Chepfer, H., Clerbaux, N., Cole, J., Delanoë, J., Domenech, C., Donovan, D. P., Fukuda, S., Hirakata, M., Hogan, R. J., Huenerbein, A., Kollias, P., Kubota, T., Nakajima, T., Nakajima, T. Y., Nishizawa, T., Ohno, Y., Okamoto, H., Oki, R., Sato, K., Satoh, M., Shephard, M. W., Velázquez-Blázquez, A., Wandinger, U., Wehr, T., and van Zadelhoff, G. J.: The EarthCARE Satellite: The next step forward in global measurements of clouds, aerosols, precipitation, and radiation, B. Am. Meteorol. Soc., 96, 1311–1332, 2015. a
Jensen, J. B. and Nugent, A. D.: Condensational growth of drops formed on giant sea-salt aerosol particles, J. Atmos. Sci., 74, 679–697, 2017. a
Karstensen, J., Lavik, G., Kopp, A., Mehlmann, M., Boeck, T., Ribbe, J., Guettler, J., Nordsiek, F., Philippi, M., Bodenschatz, E., Tschitschko, B., Lange, D., Reus, K., Ritschel, M., Acquistapace, C., Wiskandt, J., Bendinger, A., Bagheri, G., Hall, K., Begler, C., Piosek, S., and Koerner, M.: EUREC4A Campaign, Cruise No. MSM89, 17 January–20 February 2020, Bridgetown Barbados – Bridgetown Barbados, The ocean mesoscale component in the EUREC4A++ field study, MARIA S. MERIAN-Berichte, https://doi.org/10.2312/cr_msm89, 2020. a
Lambaerts, J., Lapeyre, G., Plougonven, R., and Klein, P.: Atmospheric response to sea surface temperature mesoscale structures, J. Geophys. Res.-Atmos., 118, 9611–9621, 2013. a
Lange, D., Behrendt, A., and Wulfmeyer, V.: Compact Operational Tropospheric Water Vapor and Temperature Raman Lidar with Turbulence Resolution, Geophys. Res. Lett., 46, 14844–14853, 2019. a
Lapeyre, G.: Surface Quasi-Geostrophy, Fluids, 2, 7–28, 2017. a
Laxenaire, R., Speich, S., Blanke, B., Chaigneau, A., Pegliasco, C., and Stegner, A.: Anticyclonic Eddies Connecting the Western Boundaries of Indian and Atlantic Oceans, J. Geophys. Res.-Oceans, 123, 7651–7677, 2018. a
Lena, M., Furtuna, I., and Fortuna, C.: EUREC4A film, Aeris, https://doi.org/10.25326/224, 2021. a, b
Leon, D. C., French, J. R., Lasher-Trapp, S., Blyth, A. M., Abel, S. J., Ballard, S., Barrett, A., Bennett, L. J., Bower, K., Brooks, B., Brown, P., Charlton-Perez, C., Choularton, T., Clark, P., Collier, C., Crosier, J., Cui, Z., Dey, S., Dufton, D., Eagle, C., Flynn, M. J., Gallagher, M., Halliwell, C., Hanley, K., Hawkness-Smith, L., Huang, Y., Kelly, G., Kitchen, M., Korolev, A., Lean, H., Liu, Z., Marsham, J., Moser, D., Nicol, J., Norton, E. G., Plummer, D., Price, J., Ricketts, H., Roberts, N., Rosenberg, P. D., Simonin, D., Taylor, J. W., Warren, R., Williams, P. I., and Young, G.: The Convective Precipitation Experiment (COPE): Investigating the Origins of Heavy Precipitation in the Southwestern United Kingdom, B. Am. Meteorol. Soc., 97, 1003–1020, 2016. a
Levin, Z., Ganor, E., and Gladstein, V.: The effects of desert particles coated with sulfate on rain formation in the eastern Mediterranean, J. Appl. Meteorol., 35, 1511–1523, 1996. a
Li, X.-Y., Brandenburg, A., Svensson, G., Haugen, N. E. L., Mehlig, B., and Rogachevskii, I.: Effect of turbulence on collisional growth of cloud droplets, J. Atmos. Sci., 75, 3469–3487, 2018. a
Mahadevan, A.: The Impact of Submesoscale Physics on Primary Productivity of Plankton, Annu. Rev. Marine. Sci., 8, 161–184, 2016. a
Malkus, J. S.: On the structure of the trade wind moist layer, Massachusetts Institute of Technology and Woods Hole Oceanographic Institution, Cambridge, MA, 1958. a, b
McWilliams, J. C.: Submesoscale currents in the ocean, Proc. R. Soc. A, 472, 27279778, https://doi.org/10.1098/rspa.2016.0117, 2016. a
Mech, M., Orlandi, E., Crewell, S., Ament, F., Hirsch, L., Hagen, M., Peters, G., and Stevens, B.: HAMP – the microwave package on the High Altitude and LOng range research aircraft (HALO), Atmos. Meas. Tech., 7, 4539–4553, https://doi.org/10.5194/amt-7-4539-2014, 2014. a
Mieslinger, T., Horváth, Á., Buehler, S. A., and Sakradzija, M.: The Dependence of Shallow Cumulus Macrophysical Properties on Large-Scale Meteorology as Observed in ASTER Imagery, J. Geophys. Res.-Atmos., 124, 11477–11505, 2019. a
Naumann, A. K., Stevens, B., and Hohenegger, C.: A Moist Conceptual Model for the Boundary Layer Structure and Radiatively Driven Shallow Circulations in the Trades, J. Atmos. Sci, 76, 1289–1306, 2019. a
Nencioli, F., Dong, C., Dickey, T., Washburn, L., and McWilliams, J. C.: A Vector Geometry–Based Eddy Detection Algorithm and Its Application to a High-Resolution Numerical Model Product and High-Frequency Radar Surface Velocities in the Southern California Bight, J. Atmos. Ocean. Tech., 27, 564–579, 2010. a
Nuijens, L., Serikov, I., Hirsch, L., Lonitz, K., and Stevens, B.: The distribution and variability of low-level cloud in the North Atlantic trades, Q. J. Roy. Meteor. Soc., 140, 2364–2374, 2014. a
O'Neill, L. W., Chelton, D. B., and Esbensen, S. K.: Covariability of Surface Wind and Stress Responses to Sea Surface Temperature Fronts, J. Climate, 25, 5916–5942, 2012. a
Pöhlker, M. L., Ditas, F., Saturno, J., Klimach, T., Hrabě de Angelis, I., Araùjo, A. C., Brito, J., Carbone, S., Cheng, Y., Chi, X., Ditz, R., Gunthe, S. S., Holanda, B. A., Kandler, K., Kesselmeier, J., Könemann, T., Krüger, O. O., Lavrič, J. V., Martin, S. T., Mikhailov, E., Moran-Zuloaga, D., Rizzo, L. V., Rose, D., Su, H., Thalman, R., Walter, D., Wang, J., Wolff, S., Barbosa, H. M. J., Artaxo, P., Andreae, M. O., Pöschl, U., and Pöhlker, C.: Long-term observations of cloud condensation nuclei over the Amazon rain forest – Part 2: Variability and characteristics of biomass burning, long-range transport, and pristine rain forest aerosols, Atmos. Chem. Phys., 18, 10289–10331, https://doi.org/10.5194/acp-18-10289-2018, 2018. a, b
Prospero, J. M., Delany, A. C., Delany, A. C., and Carlson, T. N.: The Discovery of African Dust Transport to the Western Hemisphere and the Saharan Air Layer: A History, B. Am. Meteorol. Soc., 102, E1239–E1260, 2020. a
Pujol, M.-I., Faugère, Y., Taburet, G., Dupuy, S., Pelloquin, C., Ablain, M., and Picot, N.: DUACS DT2014: the new multi-mission altimeter data set reprocessed over 20 years, Ocean Sci., 12, 1067–1090, https://doi.org/10.5194/os-12-1067-2016, 2016. a
Ramanathan, V., Crutzen, P. J., Lelieveld, J., Mitra, A. P., Althausen, D., Anderson, J., Andreae, M. O., Cantrell, W., Cass, G. R., Chung, C. E., Clarke, A. D., Coakley, J. A., Collins, W. D., Conant, W. C., Dulac, F., Heintzenberg, J., Heymsfield, A. J., Holben, B., Howell, S., Hudson, J., Jayaraman, A., Kiehl, J. T., Krishnamurti, T. N., Lubin, D., McFarquhar, G., Novakov, T., Ogren, J. A., Podgorny, I. A., Prather, K., Priestley, K., Prospero, J. M., Quinn, P. K., Rajeev, K., Rasch, P., Rupert, S., Sadourny, R., Satheesh, S. K., Shaw, G. E., Sheridan, P., and Valero, F. P. J.: Indian Ocean Experiment: An integrated analysis of the climate forcing and effects of the great Indo-Asian haze, J. Geophys. Res.-Atmos., 106, 28371–28398, 2001. a
Rasp, S., Schulz, H., Bony, S., and Stevens, B.: Combining crowd-sourcing and deep learning to understand meso-scale organization of shallow convection, B. Am. Meteorol. Soc., 101, E1980–E1995, 2021. a
Rauber, R. M., Stevens, B., Ochs III, H. T., and Knight, C.: Rain in shallow cumulus over the ocean–The RICO campaign, B. Am. Meteorol. Soc., 88, 1912–1928, 2007. a, b, c
Renault, L., Molemaker, M. J., McWilliams, J. C., Shchepetkin, A. F., Lemarie, F., Chelton, D., Illig, S., and Hall, A.: Modulation of Wind Work by Oceanic Current Interaction with the Atmosphere, J. Phys. Oceanogr., 46, 1685–1704, 2016. a
Renault, L., McWilliams, J. C., and Gula, J.: Dampening of Submesoscale Currents by Air-Sea Stress Coupling in the Californian Upwelling System, Sci. Rep., 8, 1–8, 2018. a
Rieck, M., Nuijens, L., and Stevens, B.: Marine boundary layer cloud feedbacks in a constant relative humidity atmosphere, J. Atmos. Sci., 69, 2538–2550, 2012. a
Riehl, H., Yeh, T. C., Malkus, J. S., and Laseur, N. E.: The North-East Trade of the Pacific Ocean, Q. J. Roy. Meteor. Soc., 77, 598–626, 1951. a
Rocha, C. B., Chereskin, T. K., Gille, S. T., and Menemenlis, D.: Mesoscale to Submesoscale Wavenumber Spectra in Drake Passage, J. Phys. Oceanogr., 46, 601–620, 2016. a
Rollo, C., Kinne, S., Kidane, A., Schlenczek, O., Schröder, M., Grosz, R., Sandiford, S., Raeke, A., Makuch, P., Gollop, J., Neuberger, A., de Groot, G., Meyer, M., Los, S., Chilinski, M., Ubele, A. A., Baranowski, D., Morfa-Avalos, Y., von Arx, J., Worbes, L., Nowak, J., Helfer, K., Kalesse, H., Ibáñez-Landeta, A., Siddle, E., Baier, K., Szkolka, W., Mohr, W., Schirmacher, I., and Röttenbacher, J.: EUREC4A Campaign, Cruise No. M161, 17 Jan 2020–3 Mar 2020, Bridgetown Barbados – Ponta Delgada Portugal, https://doi.org/10.2312/cr_m161, 2020. a
Satoh, M., Stevens, B., Judt, F., Khairoutdinov, M., Lin, S.-J., Putman, W. M., and Düben, P.: Global Cloud-Resolving Models, Curr. Clim. Change Rep., 5, 172–184, 2019. a
Schnitt, S., Orlandi, E., Mech, M., Ehrlich, A., and Crewell, S.: Characterization of Water Vapor and Clouds During the Next-Generation Aircraft Remote Sensing for Validation (NARVAL) South Studies, IEEE J. Sel. Top. Appl., 10, 3114–3124, https://doi.org/10.1109/JSTARS.2017.2687943, 2017. a
Schroth, A. C., Chandra, M. S., and Meischner, P. F.: A C-Band Coherent Polarimetric Radar for Propagation and Cloud Physics Research, J. Atmos. Ocean. Tech., 5, 803–822, 1988. a
Seifert, A. and Heus, T.: Large-eddy simulation of organized precipitating trade wind cumulus clouds, Atmos. Chem. Phys., 13, 5631–5645, https://doi.org/10.5194/acp-13-5631-2013, 2013. a
Shcherbina, A. Y., D'Asaro, E. A., Lee, C. M., Klymak, J. M., Molemaker, M. J., and McWilliams, J. C.: Statistics of vertical vorticity, divergence, and strain in a developed submesoscale turbulence field, Geophys. Res. Lett., 40, 4706–4711, 2013. a, b
Sherwood, S. C., Bony, S., and Dufresne, J.-L.: Spread in model climate sensitivity traced to atmospheric convective mixing, Nature, 505, 37–42, 2014. a
Siebesma, A. P., Bretherton, C. S., Brown, A., Chlond, A., Cuxart, J., Duynkerke, P. G., Jiang, H., Khairoutdinov, M., Lewellen, D., Moeng, C.-H., Sánchez, E., Stevens, B., and Stevens, D. E.: A Large Eddy Simulation Intercomparison Study of Shallow Cumulus Convection., J. Atmos. Sci, 60, 1201–1219, 2003. a
Siebesma, A. P., Bony, S., Jakob, C., and Stevens, B.: Clouds and Climate: Climate Science's Greatest Challenge, Cambridge University Press, Cambridge, UK, 2020. a
Snodgrass, E. R., Di Girolamo, L., and Rauber, R. M.: Precipitation Characteristics of Trade Wind Clouds during RICO Derived from Radar, Satellite, and Aircraft Measurements, J. Appl. Meteorol., 48, 464–483, 2009. a
Stephan, C. C., Schnitt, S., Schulz, H., Bellenger, H., de Szoeke, S. P., Acquistapace, C., Baier, K., Dauhut, T., Laxenaire, R., Morfa-Avalos, Y., Person, R., Quiñones Meléndez, E., Bagheri, G., Böck, T., Daley, A., Güttler, J., Helfer, K. C., Los, S. A., Neuberger, A., Röttenbacher, J., Raeke, A., Ringel, M., Ritschel, M., Sadoulet, P., Schirmacher, I., Stolla, M. K., Wright, E., Charpentier, B., Doerenbecher, A., Wilson, R., Jansen, F., Kinne, S., Reverdin, G., Speich, S., Bony, S., and Stevens, B.: Ship- and island-based atmospheric soundings from the 2020 EUREC4A field campaign, Earth Syst. Sci. Data, 13, 491–514, https://doi.org/10.5194/essd-13-491-2021, 2021. a
Stevens, B.: EUREC4A Tracks, AERIS, https://doi.org/10.25326/165 [data set], 2021. a, b
Stevens, B. and Schwartz, S. E.: Observing and Modeling Earth's Energy Flows, Surv. Geophys., 33, 779–816, 2012. a
Stevens, B., Ackerman, A. S., and Albrecht, B. A.: Simulations of Trade Wind Cumuli under a Strong Inversion , J. Atmos. Sci., 58, 1870–1891, 2001. a
Stevens, B., Lenschow, D. H., and Faloona, I.: On entrainment rates in nocturnal marine stratocumulus, Q. J. Roy. Meteorol. Soc., 129, 3469–3493, 2003. a
Stevens, B., Moeng, C.-H., Ackerman, A. S., Bretherton, C. S., Chlond, A., de Roode, S., Edwards, J., Golaz, J.-C., Jiang, H., Khairoutdinov, M., Kirkpatrick, M. P., Lewellen, D. C., Lock, A., Müller, F., Stevens, D. E., Whelan, E., and Zhu, P.: Evaluation of Large-Eddy Simulations via Observations of Nocturnal Marine Stratocumulus, Mon. Weather Rev., 133, 1443–1462, 2005. a
Stevens, B., Farrell, D., Hirsch, L., Jansen, F., Nuijens, L., Serikov, I., Brügmann, B., Forde, M., Linné, H., Lonitz, K., and Prospero, J. M.: The Barbados Cloud Observatory: anchoring investigations of clouds and circulation on the edge of the ITCZ, B. Am. Meteorol. Soc., 97, 787–801, 2016. a
Stevens, B., Ament, F., Bony, S., Crewell, S., Ewald, F., Gross, S., Hansen, A., Hirsch, L., Jacob, M., Kölling, T., Konow, H., Mayer, B., Wendisch, M., Wirth, M., Wolf, K., Bakan, S., Bauer-Pfundstein, M., Brueck, M., Delanoë, J., Ehrlich, A., Farrell, D., Forde, M., Gödde, F., Grob, H., Hagen, M., Jäkel, E., Jansen, F., Klepp, C., Klingebiel, M., Mech, M., Peters, G., Rapp, M., Wing, A. A., and Zinner, T.: A High-Altitude Long-Range Aircraft Configured as a Cloud Observatory: The NARVAL Expeditions, B. Am. Meteorol. Soc., 100, 1061–1077, 2019a. a, b
Stevens, B., Bony, S., Brogniez, H., Hentgen, L., Hohenegger, C., Kiemle, C., L'Ecuyer, T. S., Naumann, A. K., Schulz, H., Siebesma, P. A., Vial, J., Winker, D. M., and Zuidema, P.: Sugar, gravel, fish and flowers: Mesoscale cloud patterns in the trade winds, Q. J. Roy. Meteor. Soc., 146, 141–152, 2019b. a, b, c
Stevens, B., Satoh, M., Auger, L., Biercamp, J., Bretherton, C. S., Chen, X., Düben, P., Judt, F., Khairoutdinov, M., Klocke, D., Kodama, C., Kornblueh, L., Lin, S.-J., Neumann, P., Putman, W. M., Röber, N., Shibuya, R., Vanniere, B., Vidale, P. L., Wedi, N., and Zhou, L.: DYAMOND: the DYnamics of the Atmospheric general circulation Modeled On Non-hydrostatic Domains, Prog. Earth Planet. Sci., 6, 1–17, 2019c. a
Sullivan, P. P., McWilliams, J. C., Weil, J. C., Patton, E. G., and Fernando, H. J. S.: Marine boundary layers above heterogeneous SST: Across-front winds, J. Atmos. Sci., 77, 4251–4275, 2020. a
Thomson, J.: Wave Breaking Dissipation Observed with SWIFT Drifters, J. Atmos. Ocean. Tech., 29, 1866–1882, https://doi.org/10.1175/JTECH-D-12-00018.1, 2012. a
Thomson, J. and Girton, J.: Sustained Measurements of Southern Ocean Air-Sea Coupling from a Wave Glider Autonomous Surface Vehicle, Oceanography Magazine, 30, 104–109, https://doi.org/10.5670/oceanog.2017.228, 2017. a
Thomson, J., Girton, J. B., Jha, R., and Trapani, A.: Measurements of Directional Wave Spectra and Wind Stress from a Wave Glider Autonomous Surface Vehicle, J. Atmos. Ocean. Tech., 35, 347–363, https://doi.org/10.1175/JTECH-D-17-0091.1, 2018. a
Thomson, J., Moulton, M., de Klerk, A., Talbert, J., Guerra, M., Kastner, S., Smith, M., Schwendeman, M., Zippel, S., and Nylund, S.: A new version of the SWIFT platform for waves, currents, and turbulence in the ocean surface layer, in: IEEE/OES Workshop on Currents, Waves, and Turbulence Measurements, 2019. a
Tomita, H., Miura, H., Iga, S., Nasuno, T., and Satoh, M.: A global cloud-resolving simulation: Preliminary results from an aqua planet experiment, Geophys. Res. Lett., 32, L08805, https://doi.org/10.1029/2005GL022459, 2005. a
vanZanten, M. C., Stevens, B., Nuijens, L., Siebesma, A. P., Ackerman, A. S., Burnet, F., Cheng, A., Couvreux, F., Jiang, H., Khairoutdinov, M., Kogan, Y., Lewellen, D. C., Mechem, D., Nakamura, K., Noda, A., Shipway, B. J., Slawinska, J., Wang, S., and Wyszogrodzki, A.: Controls on precipitation and cloudiness in simulations of trade-wind cumulus as observed during RICO, J. Adv. Model. Earth Sy., 3, 1–20, 2011. a, b, c
Vial, J., Bony, S., Dufresne, J.-L., and Roehrig, R.: Coupling between lower-tropospheric convective mixing and low-level clouds: Physical mechanisms and dependence on convection scheme, J. Adv. Model. Earth Sy., 8, 1892–1911, 2016. a
Vial, J., Vogel, R., Bony, S., Stevens, B., Winker, D. M., Cai, X., Hohenegger, C., Naumann, A. K., and Brogniez, H.: A New Look at the Daily Cycle of Trade Wind Cumuli, J. Adv. Model. Earth Sy., 11, 3148–3166, 2019. a
Vogel, R., Bony, S., and Stevens, B.: Estimating the Shallow Convective Mass Flux from the Subcloud-Layer Mass Budget, J. Atmos. Sci, 77, 1559–1574, 2020. a
Weller, R. A.: Observing Surface Meteorology and Air-Sea Fluxes, Springer International Publishing, Cham, 17–35, https://doi.org/10.1007/978-3-319-66493-4_2, 2018. a
Wendisch, M., Müller, D., Schell, D., and Heintzenberg, J.: An airborne spectral albedometer with active horizontal stabilization, J. Atmos. Ocean. Technol., 18, 1856–1866, 2001. a
Wex, H., Dieckmann, K., Roberts, G. C., Conrath, T., Izaguirre, M. A., Hartmann, S., Herenz, P., Schäfer, M., Ditas, F., Schmeissner, T., Henning, S., Wehner, B., Siebert, H., and Stratmann, F.: Aerosol arriving on the Caribbean island of Barbados: physical properties and origin, Atmos. Chem. Phys., 16, 14107–14130, https://doi.org/10.5194/acp-16-14107-2016, 2016. a
Wirth, M., Fix, A., Mahnke, P., Schwarzer, H., Schrandt, F., and Ehret, G.: The airborne multi-wavelength water vapor differential absorption lidar WALES: system design and performance, Appl. Phys. B, 96, 201–213, 2009. a
Wulfmeyer, V., Turner, D. D., Baker, B., Banta, R., Behrendt, A., Bonin, T., Brewer, W. A., Buban, M., Choukulkar, A., Dumas, E., Hardesty, R. M., Heus, T., Ingwersen, J., Lange, D., Lee, T. R., Metzendorf, S., Muppa, S. K., Meyers, T., Newsom, R., Osman, M., Raasch, S., Santanello, J., Senff, C., Späth, F., Wagner, T., and Weckwerth, T.: A New Research Approach for Observing and Characterizing Land–Atmosphere Feedback, B. Am. Meteorol. Soc., 99, 1639–1667, 2018. a
Wyszogrodzki, A. A., Grabowski, W. W., Wang, L.-P., and Ayala, O.: Turbulent collision-coalescence in maritime shallow convection, Atmos. Chem. Phys., 13, 8471–8487, https://doi.org/10.5194/acp-13-8471-2013, 2013. a
Zhang, D., Cronin, M. F., Meinig, C., Farrar, J. T., Jenkins, R., Peacock, D., Keene, J., Sutton, A., and Yang, Q.: Comparing Air-Sea Flux Measurements from a New Unmanned Surface Vehicle and Proven Platforms During the SPURS-2 Field Campaign, Oceanography, 32, 122–133, 2019. a
Zuidema, P., Li, Z., Hill, R. J., Bariteau, L., Rilling, B., Fairall, C., Brewer, W. A., Albrecht, B., and Hare, J.: On Trade Wind Cumulus Cold Pools, J. Atmos. Sci., 69, 258–280, 2012. a
EUREC4A is more of a name than an abbreviation; in terms of the latter it expands to ElUcidating the RolE of Cloud–Circulation Coupling in ClimAte and is pronounced heúrēka, as Archimedes is reputed to have exclaimed upon discovering buoyancy while bathing.
Abbreviations for field experiments, many instruments, instrument platforms, and institutions often take the form of a proper name, which if not expanded in the text is provided in the cited literature or in Appendix B describing the instrumentation.
Meridional Overturning Variability Experiment mooring located 50 nmi (nautical miles) northwest of the NTAS and not shown in Fig. 1.
Collecte Localisation Satellites, the Centre Aval de Traitement des Données, Mercator Ocean, and the Center for Ocean-Atmospheric Prediction Studies.
the DYnamics of the Atmospheric general circulation Modeled On Non-hydrostatic Domains
- Abstract
- Introduction
- General setting and novel measurements
- EUREC4A's seven science facets
- Scientific practice
- Data availability
- Conclusions
- Appendix A: Estimates of environmental impact
- Appendix B: Platforms
- Video supplement
- Author contributions
- Competing interests
- Disclaimer
- Special issue statement
- Acknowledgements
- Financial support
- Review statement
- References