the Creative Commons Attribution 4.0 License.
the Creative Commons Attribution 4.0 License.
 | 29 Jun 2021
The AntSMB dataset: a comprehensive compilation of surface mass balance field observations over the Antarctic Ice Sheet
Minghu Ding
Carleen H. Reijmer
Paul C. J. P. Smeets
Shugui Hou
Cunde Xiao
A comprehensive compilation of observed records is needed for accurate quantification of surface mass balance (SMB) over Antarctica, which is a key challenge for calculation of Antarctic contribution to global sea level change. Here, we present the AntSMB dataset: a new quality-controlled dataset of a variety of published field measurements of the Antarctic Ice Sheet SMB by means of stakes, snow pits, ice cores, ultrasonic sounders, and ground-penetrating radar (GPR). The dataset collects 3579 individual multi-year-averaged observations, 687 annually resolved time series from 675 sites extending back over the past 1000 years, and daily resolved records covering 245 years from 32 sites across the whole ice sheet. These records are derived from ice cores, snow pits, stakes/stake farms, and ultrasonic sounders. Furthermore, GPR multi-year-averaged measurements are included in the dataset, covering an area of 22 025 km2. This is the first ice-sheet-scale compilation of SMB records at different temporal (daily, annual, and multi-year) resolutions from multiple types of measurement and is available at https://doi.org/10.11888/Glacio.tpdc.271148 (Wang et al., 2021). The database has potentially wide applications such as the investigation of temporal and spatial variability in SMB, model validation, assessment of remote sensing retrievals, and data assimilation. As a case of model estimation, records of the AntSMB dataset are used to assess the performance of ERA5 for temporal and spatial variability in SMB over Antarctica.
- Article
(5425 KB) - Full-text XML
-
Supplement
(181 KB) - BibTeX
- EndNote


Against the background of rapid global warming, wide international concerns have arisen about changes in the Antarctic Ice Sheet (AIS) mass balance, which positively contributed 14.0 ± 2.0 mm to global sea level rise over 1979–2017 (Rignot et al., 2019). Antarctic mass balance is dependent on the partitioning between ice discharge into the ocean and net snow accumulation at the surface, i.e., surface mass balance (SMB). Recent negative mass balance of the ice sheet reflects larger ice dynamical loss than mass gain from SMB (e.g., Shepherd et al., 2012, 2018). Despite the responsibility of ice discharge for Antarctic mass balance on decadal or longer timescales, considerable inter-annual variability is largely determined by fluctuations in SMB (Rignot et al., 2019). Because annual net mass input into the entire ice sheet through snowfall is equivalent to about a 6 mm global sea level decline (IPCC, 2019), even any small fluctuations in the Antarctic SMB can result in large variability and trends in global sea level.
SMB is defined as the sum of precipitation, surface and drifting snow sublimation, erosion/deposition caused by drifting snow, and surface meltwater runoff. Since the International Geophysical Year 1957–1958 (IGY), a number of scientific Antarctic traverses/expeditions have been performed with the goal of obtaining SMB measurements by means of stakes, ice cores/snow pits, ultrasonic sounders, or ground-penetrating radar (GPR) (e.g., Isaksson and Melvold, 2002; Mayewski et al., 2005). Due to logistical constraints in the harsh environment, gaps in the spatial coverage of SMB measurements are still large, and long-term samplings are also scarce (Favier et al., 2013). As a result, substantial caveats have been encountered when quantifying SMB at the ice sheet scale by using simple interpolation of these observations (Magand et al., 2007; Genthon et al., 2009). Climate models and various atmospheric reanalysis products provide an important choice of how to assess SMB for large areas. The outputs of regional climate models have been used to calculate ice sheet SMB in recent decades by a wealth of Antarctic mass change estimate studies (e.g., Rignot et al., 2011; Shepherd et al., 2012; Rignot et al., 2019). However, these simulations depend on ground-based observations to improve their accuracy and resolution. Before application, the model's performance needs to be carefully assessed based on in situ observations, as performed by some previous studies (Medley et al., 2013; Wang et al., 2015; Van Wessem et al., 2018; Agosta et al., 2019; Wang et al., 2020). To improve the ice sheet SMB estimates, field measurements have been used by cross comparison with remotely sensed data (Arthern et al., 2006) or outputs of the climate models (e.g., Monaghan et al., 2006a; Van de Berg et al., 2006; Medley and Thomas, 2019; Wang et al., 2019). Thus, it is still pivotal to compile all available observations from the past to present to better estimate spatial and temporal variability in SMB and to constrain climate models and remote sensing algorithms.
Vaughan and Russell (1997) performed pioneering work to compile all multi-year-averaged SMB field measurement data over the AIS, and this compilation was introduced in detail by Vaughan et al. (1999). However, according to Magand et al. (2007), this dataset includes a lot of unreliable data and should be used with caution. To improve this, Favier et al. (2013) updated the database using the new field measurements carried out during 1999–2012, through quality control proposed by Magand et al. (2007). Recently, several compilations of SMB measurements at an annual resolution have been published (e.g., Mayewski and Dixon, 2013; Altnau et al., 2015; Thomas et al., 2017; Montgomery et al., 2018). In spite of numerous field measurements in these datasets, most cover only a limited area of the AIS. In particular, these datasets missed a large number of annually resolved stake/stake farm observations, such as data from the Japanese Antarctic Research Expedition (JARE), the South Pole, and Vostok. In addition, available SMB measurements derived from GPR are not collected or at least not fully collected in these datasets. Furthermore, all available ultrasonic sounder data from automatic weather stations (AWSs) at daily or higher resolutions have not been compiled until now.
In this study, our objective is to generate a comprehensive SMB database for Antarctica, using all available measurements by means of stakes/stake networks, snow pits/ice cores, GPR, and ultrasonic sounders, with control of data quality. This dataset includes SMB measurements at daily, annual, and multi-year resolutions, which can be applied to validation and calibration of climate models and remote sensing, developments of remotely sensed algorithms, examination of spatial and temporal patterns in Antarctic SMB, and estimates of the drivers of SMB changes across multiple scales. As a case of model validation, we make a comparison of the dataset with ERA5 reanalysis.
2.1 Data collections and sources
We compile the dataset of SMB measurements over the AIS by searching the literature and public data portal platforms (e.g., the National Snow and Ice Data Center, NSIDC; PANGAEA; World Data Service for Paleoclimatology, NOAA), by collecting the supplements of publications, and by asking individual data generators to contribute their field measurements by email. If two or more request emails were not replied to, we consider the data unavailable to the public, and thus they are not included in this dataset.
The new data resources of the records in the database include GPR measurements over West Antarctic coastal zones during 2010–2017 (Dattler et al., 2019), over Thwaites Glacier in 2009 (Medley et al., 2013), and between Dome C and Vostok in 2012 (Le Meur et al., 2018) (Fig. 1). They cover an area of 22 025 km2. A large number of new stake measurements were acquired by revisiting the traverses from Zhongshan Station to Dome Argus (Dome A) (Ding et al., 2015), from Syowa Station to Dome Fuji (Dome F) (Motoyama et al., 2015), and between Progress Station and Vostok Station (Khodzher et al., 2014). In addition to new long-term ice core SMB records at the South Pole (Winski et al., 2019), this dataset includes previously published (in figures or tables) but unreleased (in terms of the original data) time series of SMB records from ice cores drilled over the Lambert Glacier basin (Xiao et al., 2001; Li et al., 2009; Ding et al., 2017). Furthermore, an important update of annually resolved SMB data results from the continuous stake network measurements performed at the South Pole, Vostok, and six sites of the transverse between Syowa Station and Dome F. In addition, this is the first public release of the published high-resolution ultrasonic sounder observations on Berkner Island (Reijmer et al., 1999; Reijmer and Van den Broeke, 2003), Dronning Maud Land (DML; Van den Broeke et al., 2004), the East Antarctic Plateau (Reijmer and Van den Broeke, 2003), and the Chinese transverse from Zhongshan Station to Dome A (Liu et al., 2019), which are very useful for the investigation of intra-annual and seasonal cycles of SMB. The other records of the database are obtained from existing SMB data compilations, including the multi-year-averaged SMB measurements by Favier et al. (2013) and Wang et al. (2016); time series of ice core records at an annual resolution by Mayewski and Dixon (2013), Altnau et al. (2015), and Thomas et al. (2017); and SMB component measurements over the Antarctic Ice Sheet and Greenland Ice Sheet (SUMup dataset) by Montgomery et al. (2018).
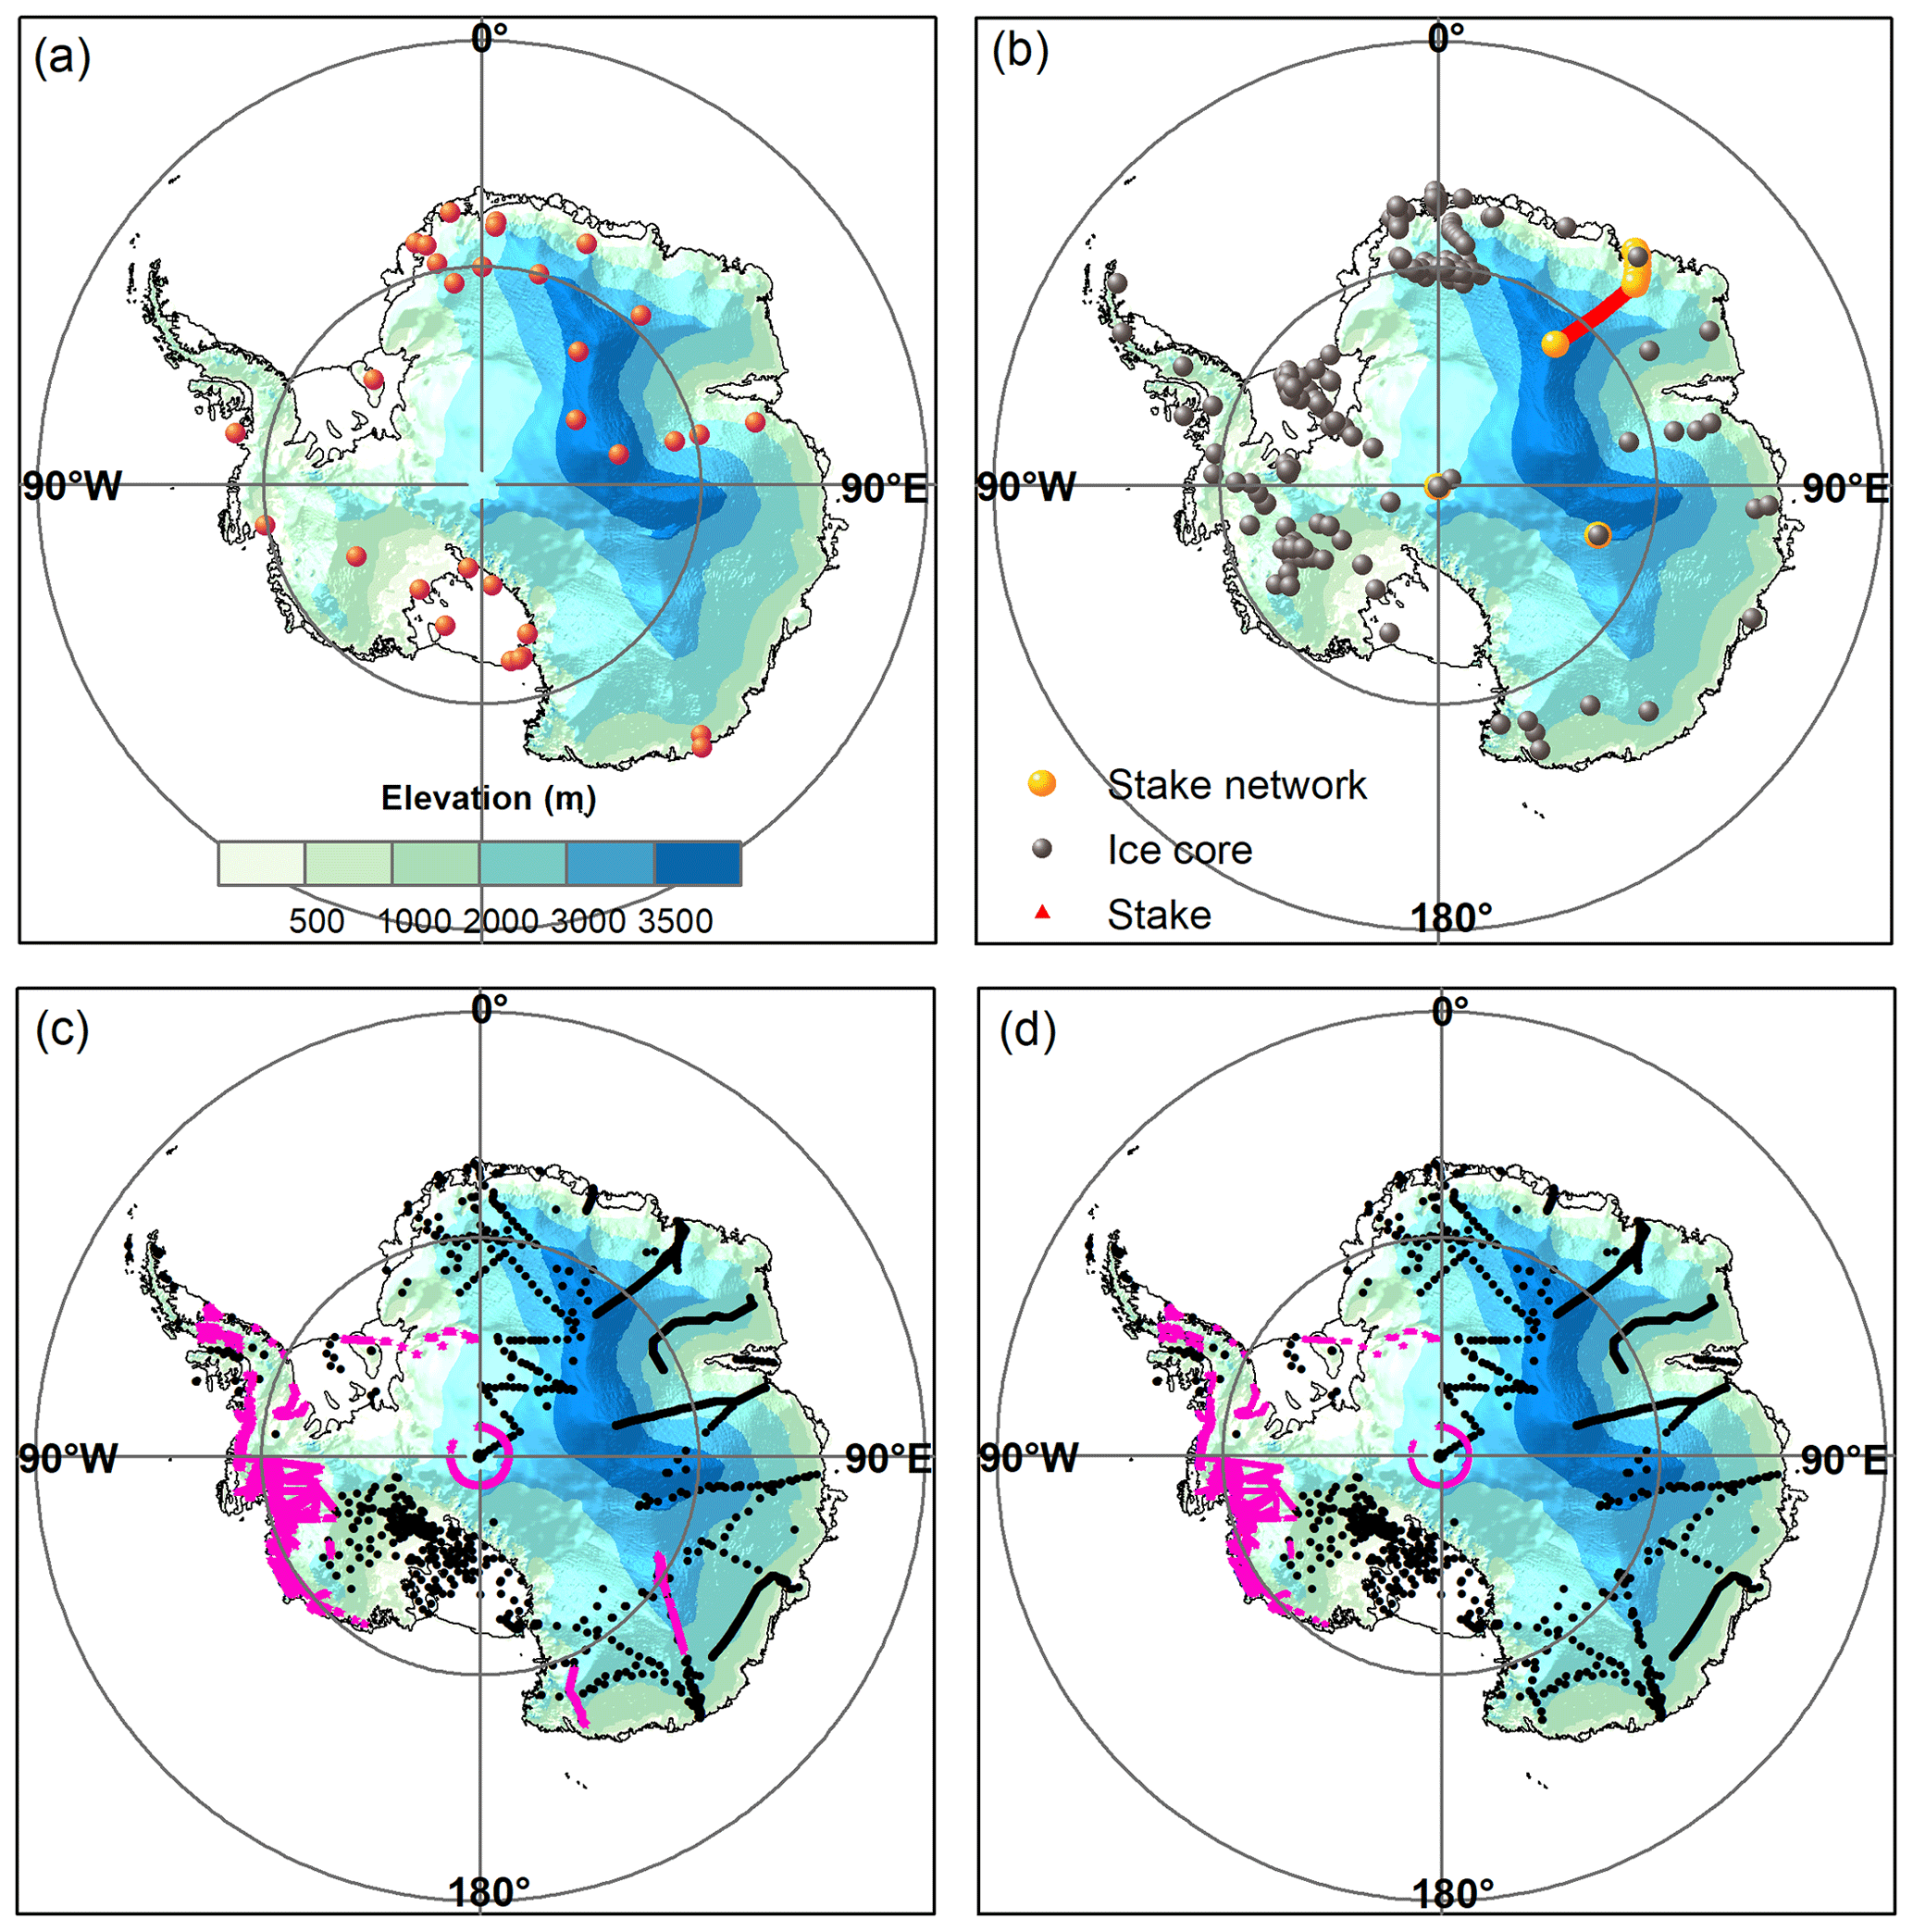
Figure 1The comprehensive dataset of Antarctic SMB observations. (a) Spatial distribution of available AWS observations. (b) Locations of available annually resolved SMB observations. (c) Locations of available multi-year-averaged SMB field data. Purple five-pointed stars standard for GPR measurements. Black points represent reliable SMB determined by stakes/stake farms and ice cores/snow pits. (d) Location of multi-year-averaged SMB data only during the second half of the 20th century selected for model validation.
2.2 Selection criteria
In order to establish a comprehensive, complete, and quality-controlled AIS SMB product for a variety of scientific applications, quantitative criteria are designed for record inclusion in the database to center on high-resolution and well-dated records and to optimize data spatial coverage. The criteria are as follows.
Firstly, the records must be published through peer review or publicly available. The duration and temporal resolution of the records vary by measurement type. We select the ultrasonic sounder records with a minimum duration of 1 year. For annually resolved archives (ice core, stake, and stake network measurements), the duration of records included in this dataset should be at least 10 years but smaller than 1000 years. For the multi-year-averaged observations, the included records for the average span more than 3 years, which is the minimum number of years for an accurate estimation of the mean local SMB with an uncertainty of smaller than 10 % (Magand et al., 2007).
Secondly, the essential parameters for each SMB datum are provided, including location, measurement methodology, data time coverage, and references to the primary data sources.
Thirdly, the different kinds of record are quality-checked to the highest degree possible and then included in the dataset. (1) To ensure the multi-year-averaged SMB data are reliable at each site, we select the data determined by the anthropogenic radionuclides and volcanic horizons with errors of smaller than 10 % or stake measurements for more than 3 years, as suggested by Magand et al. (2007). The records with dating based both on stable isotopes and chemical markers and on natural radionuclides are reliable (Magand et al., 2007) and thus included in the dataset. We also include the available GPR-based snow accumulation rate data because their uncertainties can be below 5 % at a firn depth of 10 m and decrease with the increase in the depth after post-processing including interpretation of reflectors, correct density estimates, and proper calibration with ice cores (Spikes et al., 2004; Eisen et al., 2008).
(2) SMB records of annually resolved ice cores should be either cross-dated or layer-counted. Their chronology should include at least two age control points, with one near the youngest part and another near the oldest part of the time series (Stenni et al., 2017). Also, they must be confirmed by the data generator. Furthermore, ice core SMB records are corrected for the impact of firn density and the vertical strain rate profile (Thomas et al., 2017).
(3) The preliminary quality control for AWS snow accumulation data has been performed by the data owner by means of removing the null measurements and physically anomalous snow accumulation data (i.e., data outside of the initial and final accumulation values) (e.g., Braaten, 1997, 2000). Some high-frequency noise still occurs in the AWS snow accumulation data. To reduce the noise, we discard the data points outside of 1 standard deviation of a running daily value as done by Fountain et al. (2010) and Cohen et al. (2013).
2.3 Types of data measurement collected in the AntSMB dataset
2.3.1 Stakes
Stakes are the easiest and most traditional way to measure SMB. After placing a stake vertically in the snow or ice, relative variations in snow surface heights over a certain period can be determined by repeated measurements of the distance between the top of the stake and the surface. Changes in snow heights are multiplied by snow density to yield the corresponding SMB. This simple method has been widely applied over Antarctica by almost all national glacier surveys. However, in most cases, spatial representativity of a single-stake record is very limited due to large natural spatial variability and small-scale disturbance from post-depositional effects such as the interactions between the stake and local wind. To reduce the related uncertainties, stake lines along a transect or stake farms are often used (e.g., Frezzotti et al., 2005; Kameda et al., 2008; Ding et al., 2011). In particular, these measurements are useful for the investigation of the spatial distribution of SMB at the scale of less than a kilometer.
Given the repeated measurements, stake observations are only performed over easily accessible regions. Due to logistic constraints in the extreme environment of Antarctica, the time span for the measurements usually ranges from 1 year to several years or even more.
2.3.2 Snow pits and ice cores
Snow pits and ice cores are used to construct SMB changes in time by determining the age and density of different layers. The dating is dependent on the different time markers preserved in the column of the snow pit and ice core. The annual layer is dated through the counting of seasonal changes in various parameters including the visual stratigraphy, oxygen and hydrogen isotopic composition, major chemical ion content, hydrogen peroxide, and electric conductivity. When integrated with the prominent horizons of known age from volcanic or radioactive markers, accuracy of dating is largely improved and results in time series of annual snow accumulation. Furthermore, the valuable reference horizons can also be used for the estimation of the SMB between horizons.
In Antarctica, counting annual layers based on the seasonal variations in multiparameter records combined with reference horizons can be used to calculate annual SMB in the high accumulation zones. However, seasonal cycles can hardly be identified at regions with low accumulation of smaller than 100 kg m−2 yr−1, especially for the East Antarctic Plateau. Thus, reference horizons may be the most reliable dating method in the low-accumulation areas, and a mean SMB can only be found between two reference horizons.
2.3.3 GPR
GPR maps firn stratigraphy along a profile from the surface, and the radar-identified firn layers with equal age along the continuous profiles can allow us to gain a detailed insight into SMB patterns. To calculate SMB, the isochronous layers must be well dated, which is usually dependent on the complementary depth–age of highly resolved ice core records along the radar profile. During the past few decades, grounded GPR has been widely used for the estimation of spatial variation in recent and historical SMB over Antarctica (e.g., Frezzotti et al., 2007; Anschütz et al., 2009; Müller et al., 2010). Most recently, the newly developed airborne radar systems have provided the revolutionized SMB measurements over the AIS (Kanagaratnam et al., 2004, 2007). They can robustly resolve the stratigraphy at the shallow (10 m) to intermediate (100 m) depths and hence measure annual and multi-year accumulation rates at the width of hundreds of kilometers along aircraft flight tracks. The systems were first developed by the Center for Remote Sensing of Ice Sheets and flown on the National Aeronautics and Space Administration Operation IceBridge (OIB) campaigns (Leuschen, 2010; Rodriguez-Morales et al., 2014). The AntSMB database contains records of grounded and airborne GPR observations for the 2009–2019 OIB campaigns.
Relative to point measurements such as stakes and snow pits/ice cores, the advantage of GPR observations is to yield a more accurate representation of spatial variations in SMB. Furthermore, the radar images of deep internal horizons allow us to quantify long-term variability in SMB. The errors in GPR-based SMB observations are associated with the depth and age of the reflector and extrapolation of density along the radar profile. The resulting uncertainties were estimated to be about 4 % of the calculated SMB at a firn depth of 10 m and about 0.5 % at the depth of 60 m after the calibration of depth and layer thinning and robust dating (isochronal accuracy of about 1 year) (Spikes et al., 2004).
2.3.4 AWS
In Antarctica, some AWSs equipped with ultrasonic sensors measure snow surface height changes by detecting the vertical distance to the surface. Combined with density observation, snow height changes can be converted to SMB. Despite the occasional poor quality when blowing snow or fog happens, this method can continuously yield SMB records of a high (typically hourly) temporal resolution (van den Broeke et al., 2004; Gorodetskaya et al., 2013), which can be utilized to identify individual accumulation/ablation events, to quantify seasonal cycle of snow accumulation, and also to calculate the surface energy balance coupled with other AWS observations.
In the same way as single ice core or stake observations, AWS measurements represent a single location, and spatial representativity is possibly limited. In addition, after collection of raw snow height data, the temperature-dependent speed of sound correction must be performed. The uncertainty in AWS height measurements is estimated to be ±1 cm or 0.4 % of the distance to the surface (Eisen et al., 2008). This means that the measurements are not sufficient to examine the smaller snow accumulation events that usually occur in the interior of the East Antarctic Plateau.
2.4 Structure and metadata
The AntSMB dataset includes three subsets, i.e., (1) multi-year-averaged SMB observations from stakes, ice cores, and GPR measurements; (2) annually resolved SMB measurements from ice cores, stakes, and stake networks; and (3) AWS daily snow height measurements. To facilitate data reuse, subsampling, and reanalysis for scientific research efforts, each record in the three subdatasets includes some essential information, i.e., the names of measurement sites, site locations, measurement method, time coverage of the measurements, and citations. Site locations include latitude, longitude, and surface elevation. Each location of the measurements is in units of decimal degrees relative to the WGS84 ellipsoid. As listed in the dataset's metadata, measurement techniques include firn/ice cores, snow pits, stakes/stake networks, ultrasonic sounders, and GPR. Table 1 summarizes the essential information for each measurement. Uncertainties in the measurement methods have been discussed in detail by Eisen et al. (2008).
Table 1Brief description of metadata fields used in the Antarctic SMB observation database.

Among the three subdatasets, the number of data in the multi-year mean SMB subdataset is largest, including unique measurements by radar isochrones with a coverage of 22 025 km2, 2276 stake measurements, and 1303 ice core and snow pit observations (Fig. 2). The majority of these observations are derived from airborne snow radar measurements in the coastal zone of West Antarctica and the Antarctic Peninsula, the Ronne Ice Shelf, the South Pole, and Pine Island and Thwaites glaciers (Medley et al., 2013, 2014; Dattler et al., 2019). GPR data from two transects in East Antarctica account for 30 % of all measurements in this subdataset. In most cases, SMB values come from original measurements. However, for the Japanese traverse route from Syowa Station to Dome F, we updated multi-year-averaged SMB by combining new stake surface height measurements during 2007–2013 with the improved snow density data from Wang et al. (2015).
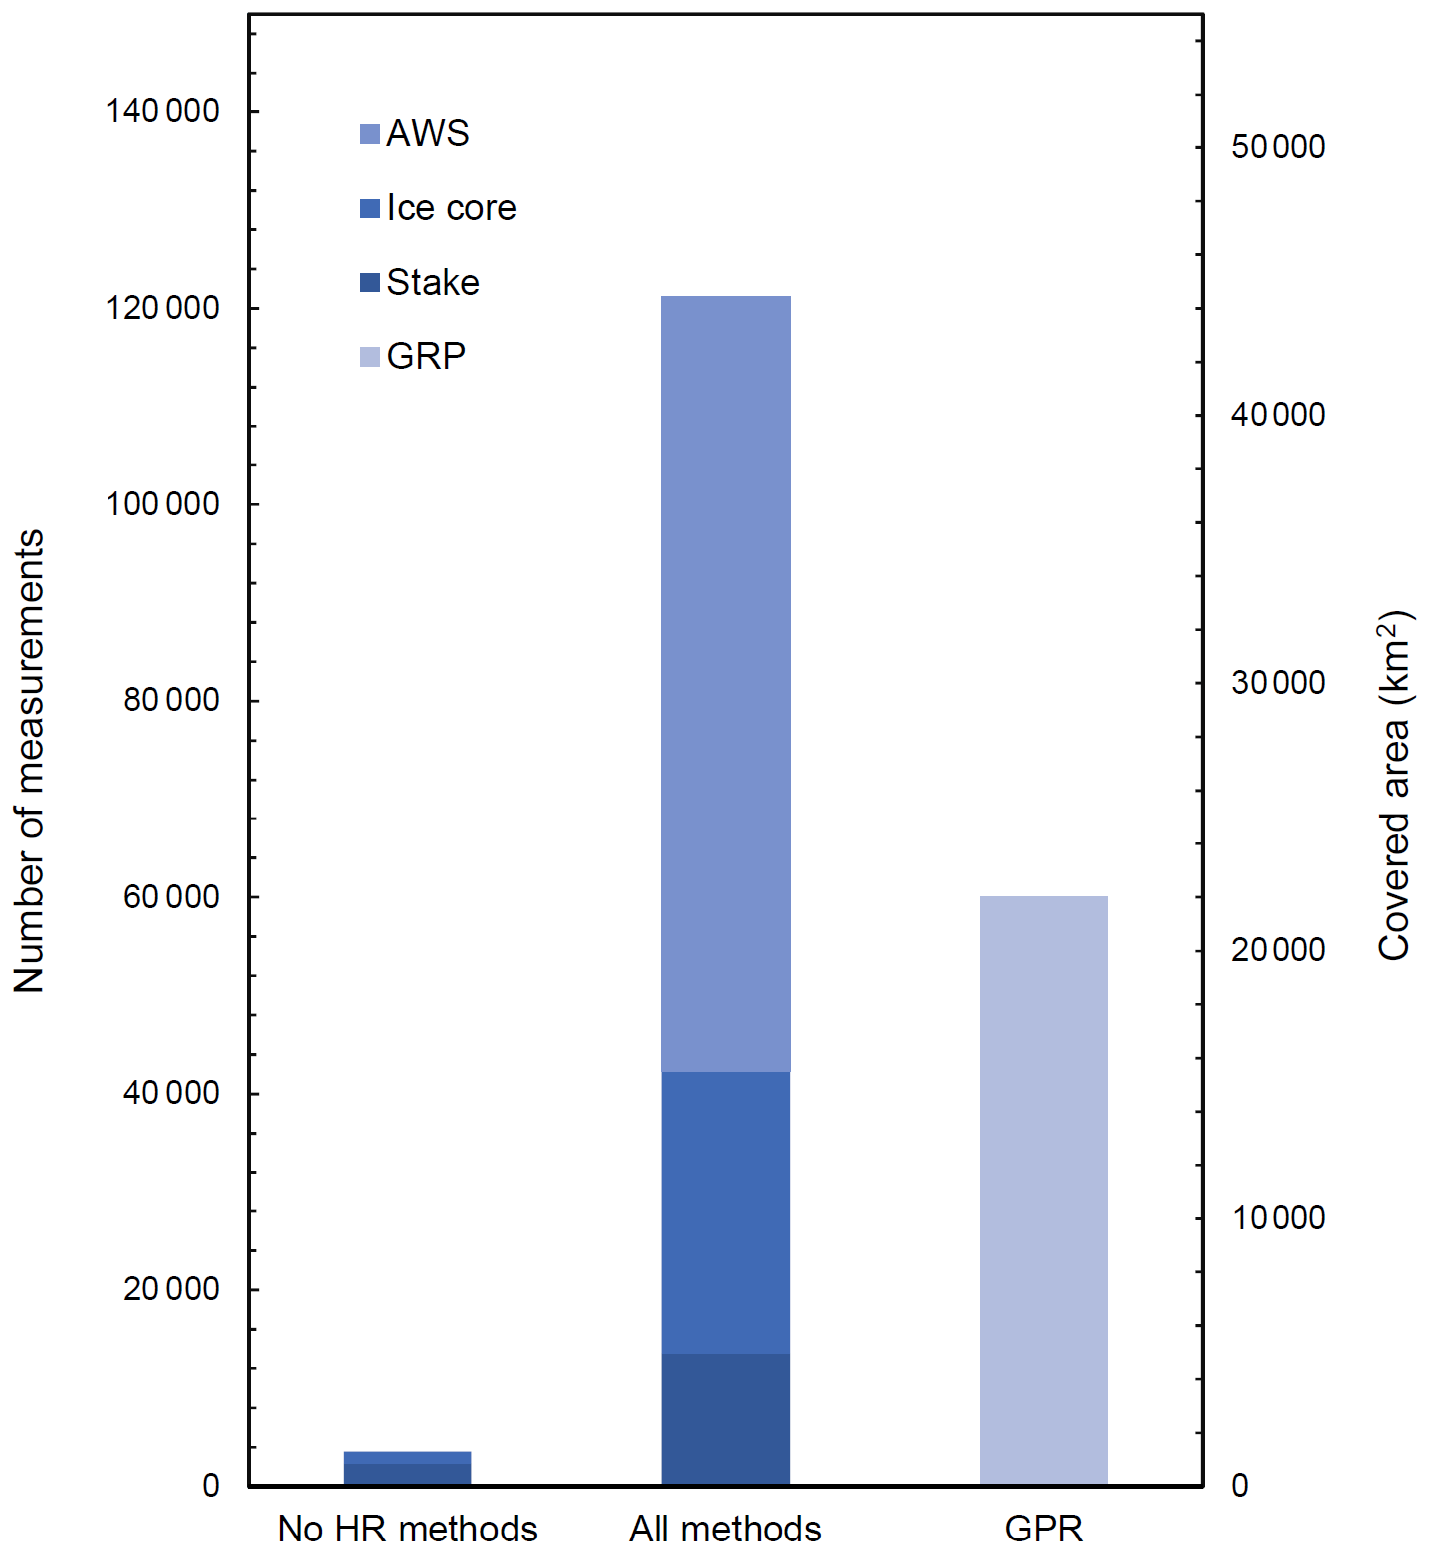
Figure 2Bar charts indicating the number of the different types of measurement technique in the SMB observation dataset. The left bar demonstrates the distribution of approaches with the exclusion of high-resolution snow accumulation measurements and GPR measurements, and the area covered by GPR measurements is shown in the right bar.
The annually resolved SMB subdataset contains 687 time series of records, of which 79 records come from the compilation of ice core snow accumulation by Thomas et al. (2017), and 26 from the shallow-firn-core records in DML collected by Altnau et al. (2015). Continuous stake surface height measurements at a sub-annual resolution since the 1970s are available for the transverse route from Syowa Station to Dome F (Motoyama et al., 2015). We converted the measurements to SMB for the subdataset by multiplying snow height changes by snow density estimated from Wang et al. (2015).
AWS snow accumulation data are measured by the determination of the variations in the vertical heights between the sensor and snow using surface ultrasonic height rangers. The measurements are performed at 32 sites, of which 10 are located at DML, 7 at the Ross Ice Shelf, and 4 along the Chinese transverse route from Zhongshan Station to Dome A.
3.1 Spatial coverage of SMB records
The comprehensive observed SMB database collects SMB field data at the daily, annual, and multi-year scales from the whole AIS. Spatial distribution of the records is uneven within Antarctica. AWS snow accumulation measurements cover a wide range of areas, including the coastal zones of East Antarctica (McMorrow et al., 2001) and West Antarctica (van Lipzig et al., 2004) with high snow accumulation, the dry East Antarctic Plateau (Reijmer and Broeke, 2003; van den Broeke et al., 2004), the Ross Ice Shelf (Cohen et al., 2013), Berkner Island, the Lambert Glacier drain, and the McMurdo Dry Valleys (Doran et al., 2002) (Fig. 1a). Availability of time series from the annual resolution SMB subdataset is rich for West Antarctica, DML, Berkner Island, and the traverse from Syowa Station to Dome F (Fig. 1b). However, large parts of the Antarctic interior with low snow accumulation remain undocumented, which is easily understood because the seasonal stratigraphy in ice cores is almost unavailable at the regions with an accumulation of smaller than 100 kg m−2 yr−1 (Frezzotti et al., 2007, 2013). Compared with SMB compilation by Favier et al. (2013), spatial coverage of the multi-year SMB subdataset has greatly improved, especially for West Antarctica and the Antarctic Peninsula. Despite the improvement of spatial distribution, SMB records are still poor for the region from the Ronne Ice Shelf via the South Pole to Dome C and for the coastal zone of East Antarctica.
3.2 Temporal variability in the SMB records
The records in the comprehensive SMB dataset cover different time spans, ranging from a minimum of 1 year to a maximum of 1000 years. The covered time periods are closely associated with the measurement method. AWS provides very high resolution measurements of snow height changes, but the records generally span only a few years (1–18 years). Although a significant advantage of ice cores is to record SMB changes over long time spans, it is difficult to perform these observations at a high spatial density. Stake farms are the easiest method to observe SMB, but continuous measurements are available for between several years and tens of years, largely due to the logistic constraints in the extreme Antarctic environment. GPR can detect the local SMB from the last tens of years to about 1000 years along continuous profiles of the snowpack. The temporal resolution of GPR measurements is dependent on the age estimates of reflection horizons, and the resulting records in our dataset range from decadal to centennial.
For the annually resolved SMB subdataset, of 183 time series from ice core and stake network measurements, 47 span from 1801 onwards (Fig. 3a). The number of time series peaks during the early 2000s when ice cores were retrieved in DML (Altnau et al., 2015) and the West AIS (Mayewski and Dixon, 2013). Prior to 1800, the number of time series decreases greatly, with only 10 with a duration beyond the past 500 years and 5 beyond the past 1000 years (Fig. 3a). The sharp decline since the mid-2000s results from a lack of coring efforts. Annually resolved stake measurements cover the past 40 years, peaking from the mid-1990s to the early 2000s (Fig. 3b).
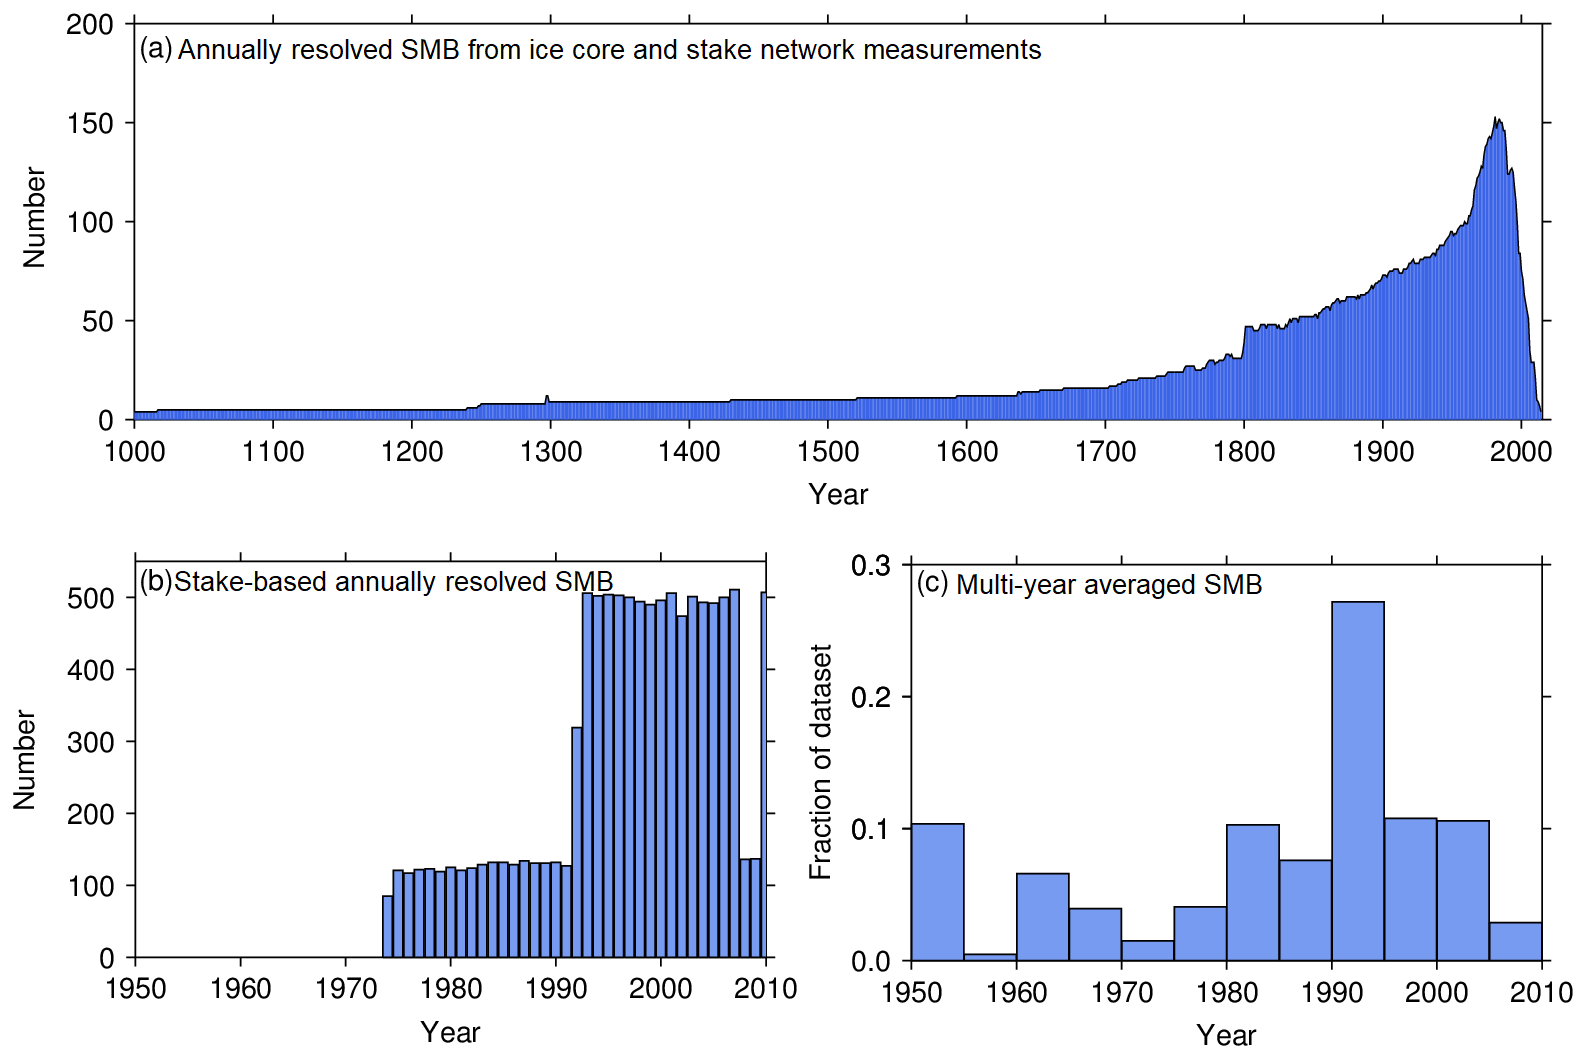
Figure 3(a) Availability of records excluding the stake measurements along the traverse from Syowa Station to Dome F in the annually resolved SMB subdatabase over time during the past 1000 years. (b) Time coverage of the stake measurements along the traverse from Syowa Station to Dome F. (c) Histograms indicating the date taken of the multi-year-averaged SMB subdataset only including ice core and stake measurements.
For the multi-year-averaged SMB subdataset, 83 % of the records with the exception of radar measurements cover less than 20 years, and 43 % span less than 5 years. Figure 3c presents the distribution of years when these records were measured from 1950 onwards. The distribution of the measurements is relatively even until the 1990s, when the number of samples increases. The temporal coverage of radar observations ranges from 25 to 185 years.
The dataset compiles the different types of SMB measurement including ice cores/snow pits, stakes, ultrasonic sensors, and GPR approaches. It is critical to investigate if the resulting data have systematic discrepancies due to the distinct measurement methods. In particular, the measurements by ice cores, stakes, and ultrasonic sensors are performed at the centimeter scale, whereas GPR samples are at the meter scale. Despite the scale difference, GPR measurements that are near 100 year averaged agree well with 5-year-averaged single-stake measurements at the corresponding locations along the transect near Talos Dome, with differences of around 10 % (Frezzotti et al., 2007). Given that no existing observed SMB dataset can be used as an independent reference of the different types of Antarctic multi-year-averaged SMB observation, the inter-comparison of SMB determined by different methods at the same or near the same locations is made, as presented in Fig. 4. The locations are mainly distributed near Talos Dome, along a transect from Terra Nova Bay to Dome C, on western DML, and at Dome F and Dome A. It is clear that despite the differently averaged time coverage, the different SMBs provide a reasonable match with each other, with the largest discrepancy of less than 20 %, which is consistent with previous, similar inter-comparison (e.g., Vaughan et al., 2004; Frezzotti et al., 2005; Anschütz et al., 2009).
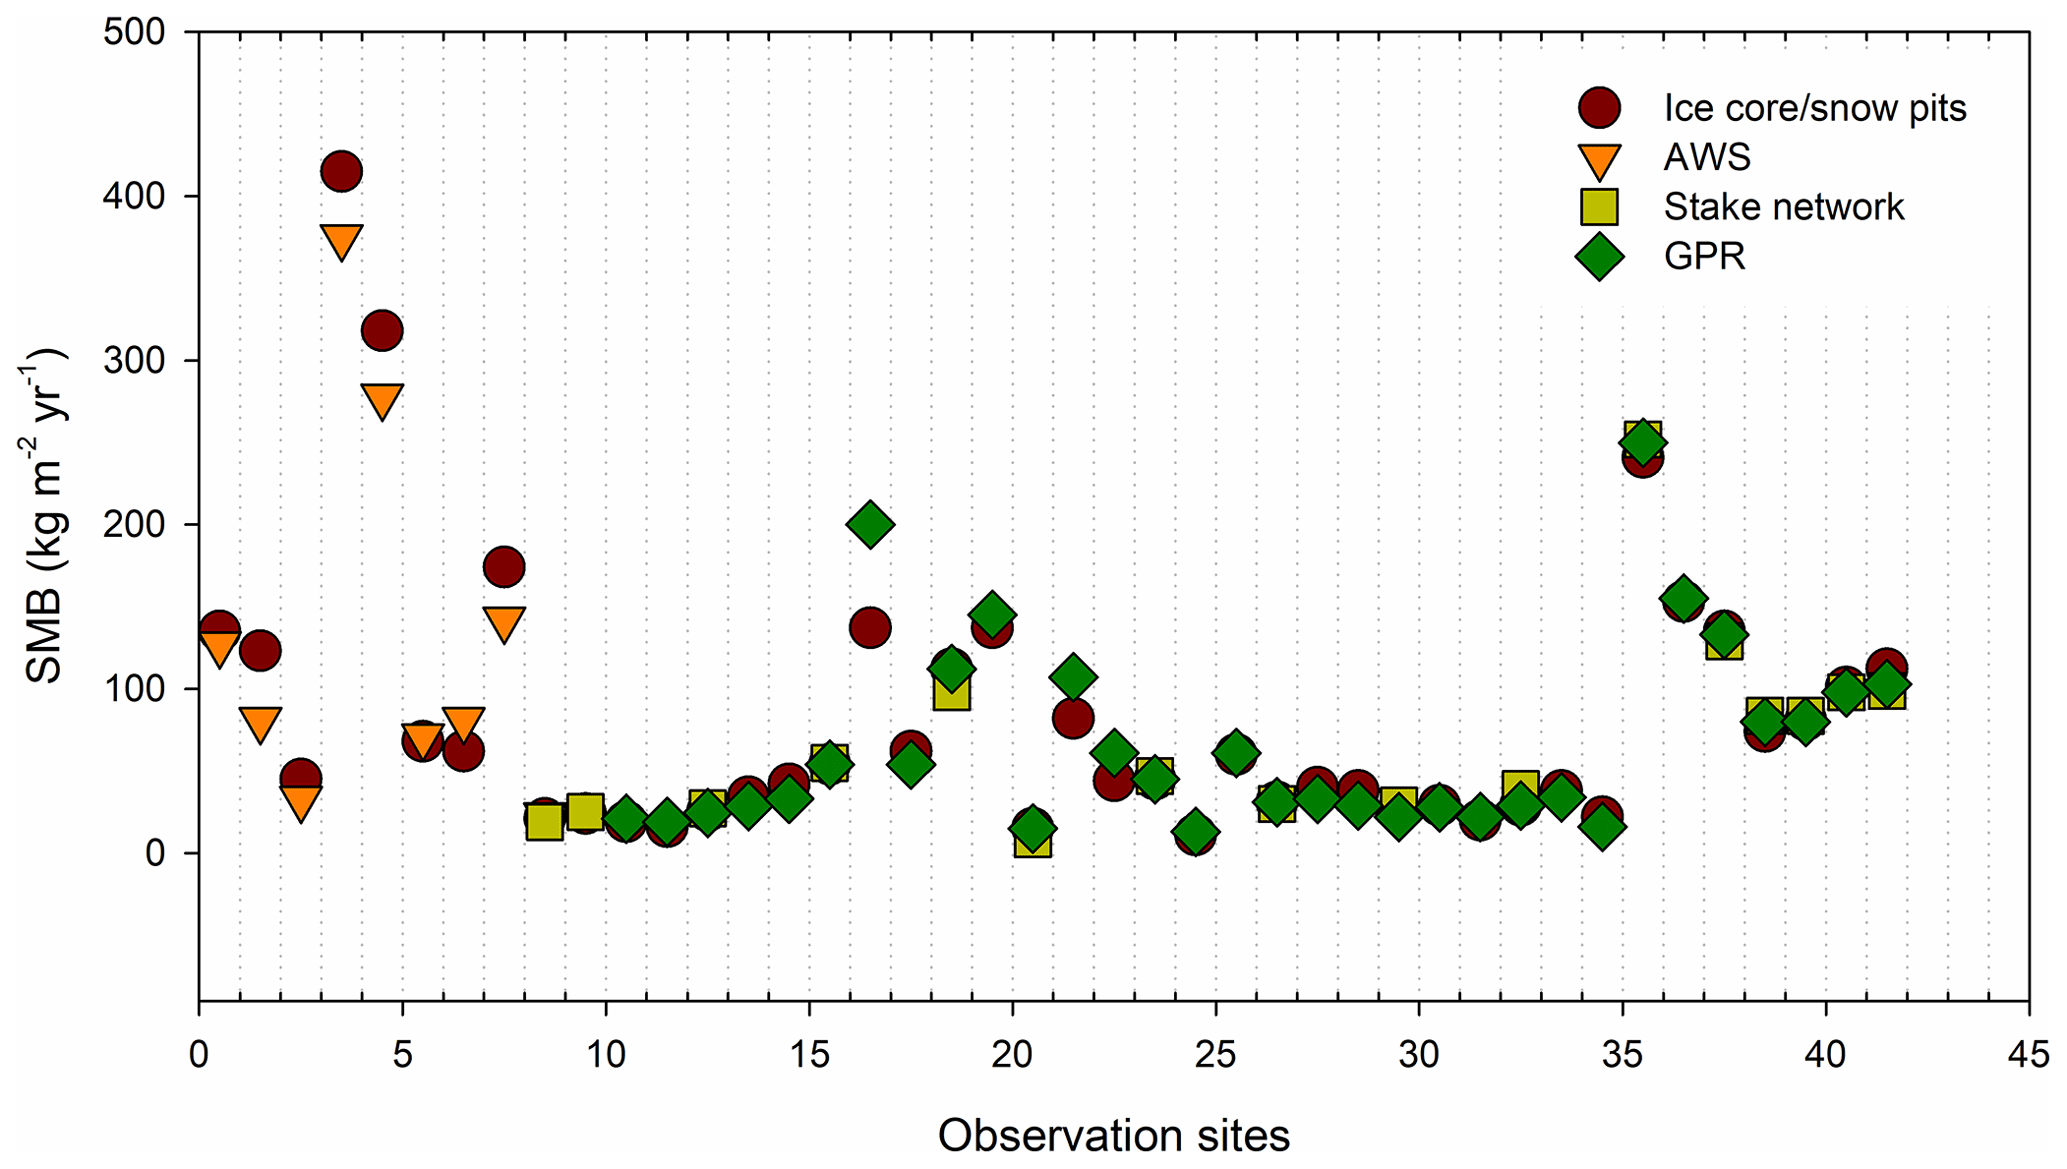
Figure 4Inter-comparison between different types of SMB measurement including AWSs, snow pits/ice cores, and GPR at 42 locations. The measurements are mainly distributed near Talos Dome, along a transect from Terra Nova Bay to Dome C, on western Dronning Maud Land, and at Dome F and Dome A.
Here, we present an unprecedentedly comprehensive compilation of SMB observations at the daily, annual, and multi-year scales. For the compilation of the multi-year-averaged SMB ground-based observations including stakes/stake farms, snow pits/ice cores, and GPR, we apply the same quality control criteria as used in the compilation by Favier et al. (2013) and updated by Wang et al. (2016). Compared with the dataset, our compilation greatly improved the data spatial coverage by updating records using more recently published observations along the margins of West Antarctica; across Marie Byrd Land and the Antarctic Peninsula; around the South Pole; between Dome C and Vostok; and along the transects of Progress Station–Vostok Station, Dumont d'Urville–Dome C, Talos Dome, etc. We also updated SMB records along the transects of Zhongshan Station–Kunlun Station and Syowa Station–Dome F based on recent revisiting measurements. In particular, our dataset provides the first comprehensive compilation of grounded and airborne GPR measurements.
In terms of the collections of annual-resolution SMB measurements from ice cores, the SUMup dataset focused on the limited ice core records at West Antarctica from the US International Trans-Antarctic Scientific Expedition during the early 2000s (US ITASE; Mayewski and Dixon, 2013), several cores drilled in 2010–2011 (Medley et al., 2013), and records over DML and Berkner Island from the European Project for Ice Coring in Antarctica (EPICA; Oerter, 2008a–l). The Antarctica 2k database constructed by Thomas et al. (2017) included 80 ice core records spanning at least 30 years, and shorter and other ground-based measurement records were omitted. However, our AntSMB dataset focuses on the collection of annually resolved snow accumulation records from different kinds of measurement covering the whole ice sheet. As a result, this dataset contains 175 annually resolved ice core snow accumulation records, 8 stake network measurements covering at least 10 years, and 512 time series of continuous stake measurements spanning more than 18 years.
Previous SMB compilations centered on glaciological observations on annual and longer timescales (e.g., Vaughan et al., 1999; Frezzotti et al., 2013; Thomas et al., 2017), which are useful for the examination of trends and large-scale variability in AIS snow accumulation. Nevertheless, they do not give insight into SMB changes at much shorter timescales, such as at synoptic scales and following accumulation events. AWSs provide high-resolution (typically hourly) snow accumulation measurements, which is an advantage in quantifying the seasonal cycle of SMB and in examining the synoptic sources of individual accumulation events, relative to the other methods such as snow pits, ice cores, and stakes. Snow accumulation data from individual or several AWSs in the different sectors of Antarctica have been published by some previous studies (e.g., Reijmer and Van den Broeke, 2003; Thiery et al., 2012; Cohen et al., 2013; Thomas and Bracegirdle, 2015). However, these data have been not well compiled until now. Our dataset is the first attempt to collect all AWS snow accumulation measurements in Antarctica.
6.1 ERA5 output
Reanalysis utilizes a large number of observations assimilated into a numerical model to generate a spatially and temporally complete state of the atmosphere. Because the main assimilated data are atmospheric and oceanic measurements, reanalysis outputs are not entirely subject to the density of surface observations and thus have the potential to provide important information over the regions with few or even no surface observations. Recent studies have revealed that European Centre for Medium-Range Weather Forecasts (ECMWF) interim reanalysis (ERA-Interim) is likely to be the best or among the best reanalysis dataset for the representation of inter-annual variability in Antarctic precipitation (e.g., Bromwich et al., 2011; Wang et al., 2016).
ERA5 is the fifth-generation ECMWF reanalysis product produced by the Integrated Forecasting System (IFS) Cy41r2 operational from 2016 (Hersbach et al., 2020). Compared with ERA-Interim (∼ 80 km and 60 pressure levels), a major advantage of ERA5 is much higher horizontal and vertical resolutions (∼ 31 km and 137 pressure levels, respectively) and more enhanced outputs (hourly). Furthermore, IFS Cy41r2 includes a more advanced 4DVar assimilation scheme together with uncertainty estimation, and many more observations are assimilated. Detailed improvements can be found in Hersbach et al. (2020). This reanalysis dataset has replaced ERA-Interim, for which updates were stopped in August 2019. Here, our main objective is to know if ERA5 is able to provide a good SMB compared to the AntSMB observational dataset. Despite the recent release of ERA5 data extending back to 1950, we only use the outputs for the 1979–2018 period due to the spurious shift in reanalysis outputs in 1979 largely caused by changes in the number of assimilated observations (e.g., Zhang et al., 2018; Huai et al., 2019; Wang et al., 2020).
6.2 A subset of data used for the comparison with ERA5
6.2.1 Multi-year-averaged SMB observations
Given that the output of climate models centers on climate information since 1979 in Antarctica, it is necessary to define a special dataset for the model comparison. To match with the coverage period of the models, we only retain observations starting from 1950 onwards in the multi-year-averaged SMB subdataset. In particular, we discard observations starting in the 1950–1978 period with a time coverage of no more than 10 years. Because blowing-snow processes are not schematized by ERA5, 190 measurements in blue-ice regions (SMB values < 0) are excluded. Finally, GPR measurements covering an area of 15 638 km2 and 3184 multi-year-averaged observations are left for model–observation comparison.
6.2.2 Annually resolved SMB observations
To estimate the temporal performance of ERA5 for snow accumulation, we use the records covering at least 10 years from the annually resolved SMB subdatabase starting from 1979. This results in 159 time series of annually resolved SMB. The representativeness of SMB measurements at a simple site for a region is influenced by local noise from the interaction between wind and the local snow surface, especially in the regions with accumulation rates of less than 120 kg m−2 yr−1 (e.g., Frezzotti et al., 2005, 2007; Ding et al., 2011). This can be confirmed by the fact that on the DML plateau, ERA5-simulated individual annual SMBs highly correlate with each other (r>0.70), but time series of SMB records from different ice cores are poorly correlated, even from the same drilling site. As a result, the relationships between ice core records and the corresponding ERA5 simulations at the drilling core location are variable, including significantly negative, positive, and insignificant correlations (Fig. 5a). Various linear relationships between the simulated and observed time series are also found over Berkner Island and the Ronne Ice Shelf with a high density of cores, with r values ranging from −0.35 to 0.67. In the two areas, the difference in the standard deviation of annual SMB values of individual ice cores is large, even for the records from the same locations (Fig. 5c). At the South Pole, ERA5 shows a significant correlation (r=0.68; p<0.05) with stake farm measurements but fails to do so with the individual ice core records (Fig. 5a). A main possibility is that SMB derived from stake networks is less noisy through the removal of small-scale spatial variability by using the average of many stakes together. At most of the sites, the standard deviation of annual ice core records is larger than the corresponding ERA5 simulations for their overlapping periods (Fig. 5d). To reduce local noise and better assess the performance of ERA5, we first average the individual observation records in the same grid cell and then stack the averaged time series in the same geographic region. If there are ice core records and stake farm observations in the same location, the measurements of stake farms are utilized. Because the sites at the top of ice domes likely have minor local noise (Monaghan et al., 2006b), the four time series of ice core records from the ice domes are not discarded in the estimate. Following Frezzotti et al. (2007, 2013), a single ice core site with accumulations of more than 700 kg m−2 yr−1 allow the determination of annual SMB at a ±10 % accuracy, which corresponds to the accuracy derived from the instrumental measurement, and hence the corresponding ice core records are retained. After the composite and filtering, 48 locations or regions with annually resolved SMB are left to compare with ERA5 simulations.

Figure 5Spatial distribution of the correlation coefficients (a) between annually resolved SMB observation and ERA5 simulations for their overlapping period (circle: ice core; diamond: stake network) and (b) between averaged observed time series in the same location/region and the corresponding simulations from ERA5; (c) standard deviation of annual observed SMB and ERA5 simulations; (d) the ratios of the standard deviation of annual SMB from EAR5 simulations to observations.
6.3 Spatial performance of ERA5 output
A comparison of the density distribution of ERA5 precipitation minus evaporation (P−E) with the filtered multi-year-averaged SMB observations reveals that the multi-year-averaged dataset is representative of the high accumulation zone but not for the bins with accumulation rates of 100–300 kg m−2 yr−1 over the West AIS (Fig. 6a). However, this dataset represents the entire P−E spectrum of the model over the East AIS (Fig. 6b). As shown in Fig. 6c and d, the dataset also represents well the samples' elevation distribution of SMB in relation to the West AIS and East AIS, especially between 200 and 1000 m elevations where it was not correctly sampled by the SMB observation dataset compiled by Favier et al. (2013).

Figure 6Relative frequency of ERA5 P−E field data and gridded averaged records from the multi-year-averaged SMB subdatabase, with a bin range of 50 kg m−2 yr−1 on (a) the West Antarctic Ice Sheet (WAIS) and (b) the East Antarctic Ice Sheet (EAIS). ERA5 field data are bilinearly interpolated over a 30 km Cartesian grid. We average SMB for each 30 × 30 km grid cell (values from points located in the same grid cell are averaged), and then the number of grid cells in each bin is calculated. The contribution of the area of the elevation bin for ERA5 grid cells containing measurements and the entire elevation range to (c) the WAIS and (d) the EAIS. The 200 m elevation bins are used.
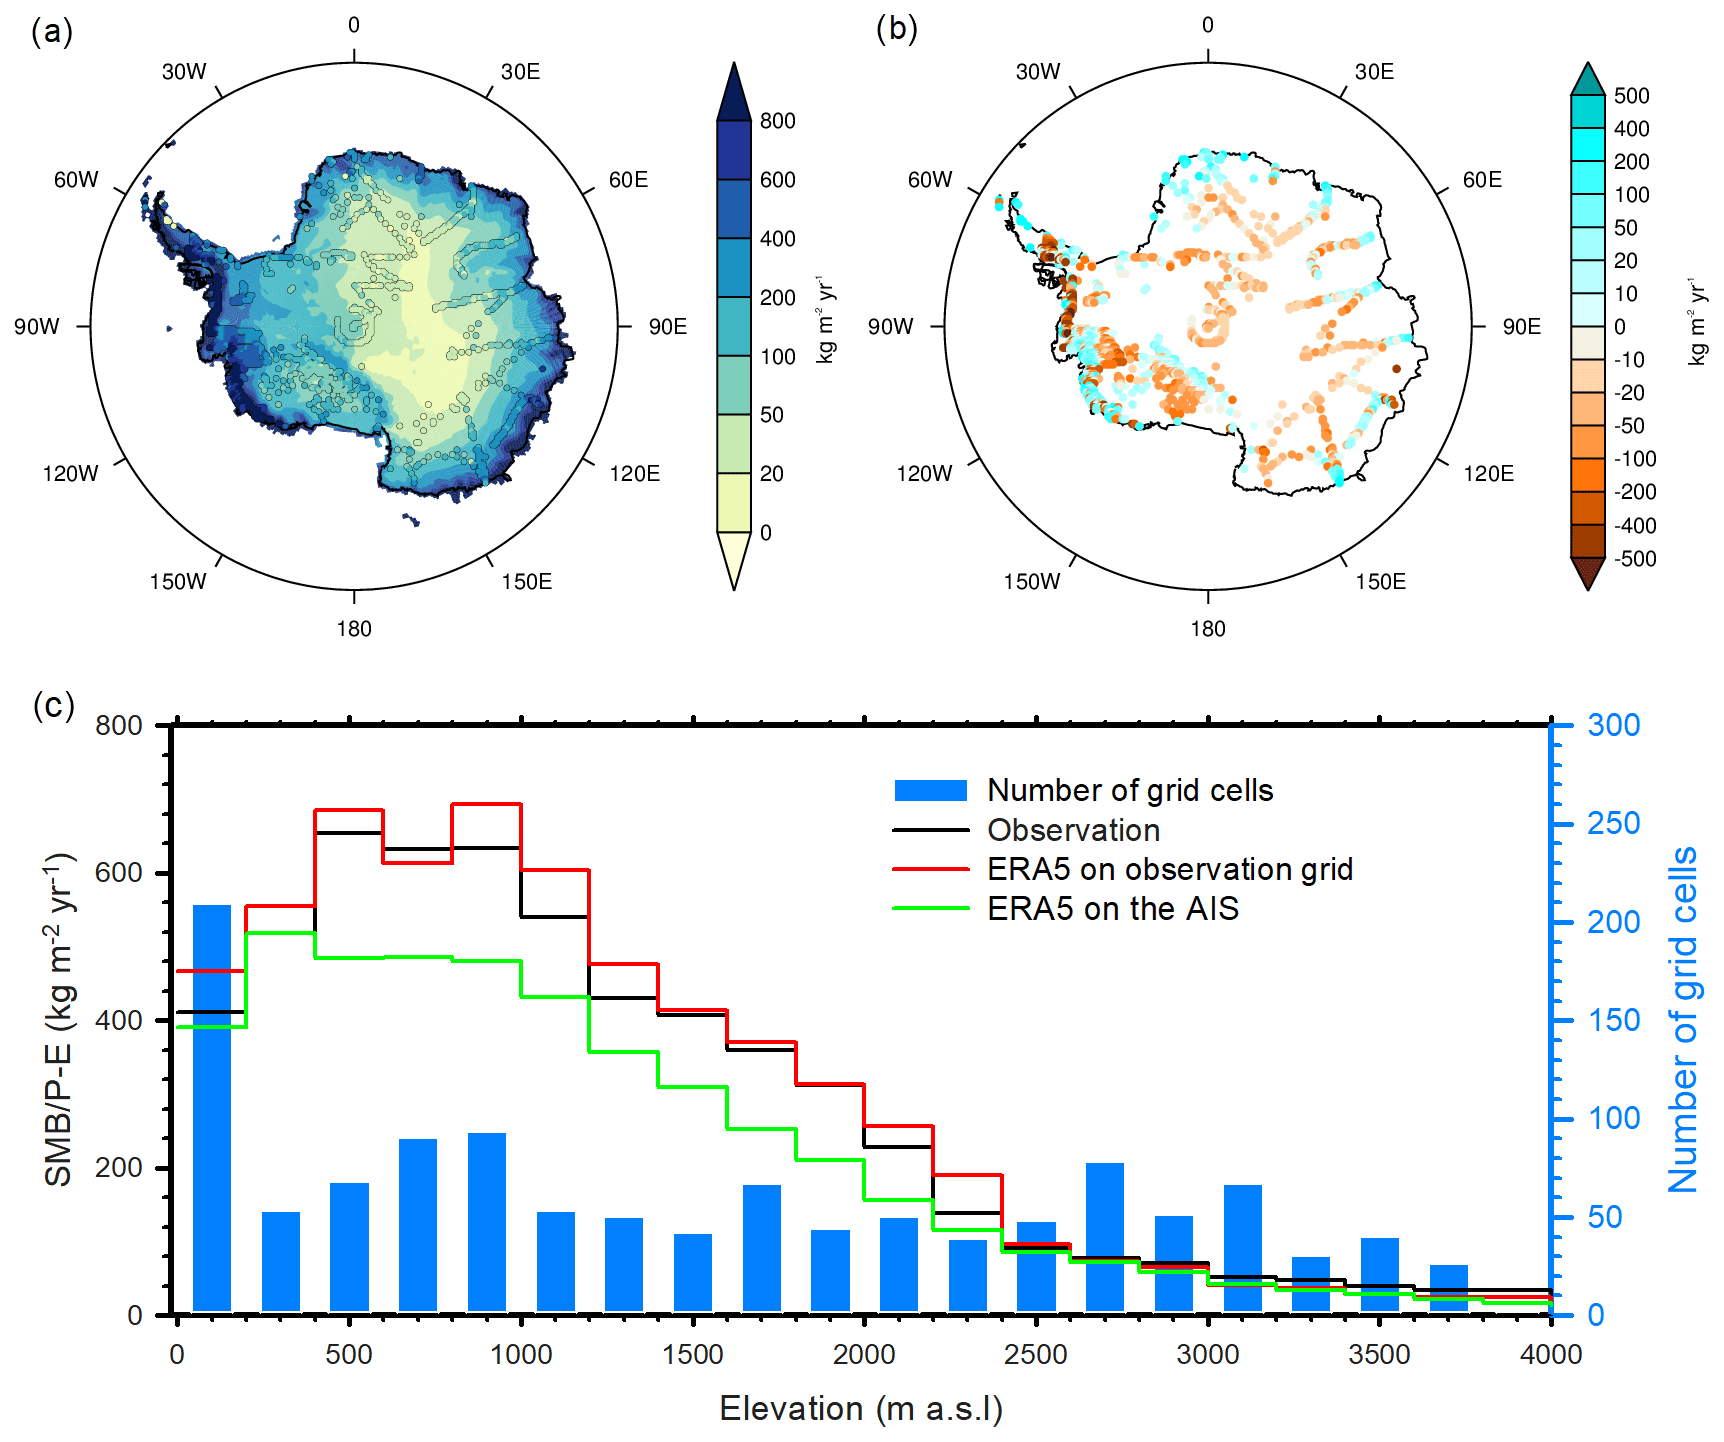
Figure 7(a) Spatial distribution of ERA5 mean precipitation minus evaporation (approximated as SMB) for the period 1979–2018, and multi-year mean SMB measurements averaged on ERA5 grid cells (30 km × 30 km). (b) ERA5 minus observed SMB averaged on the ERA5 grid cells. (c) Multi-year-averaged observations and ERA5 simulations, binned in 200 m elevation intervals. The number of ERA5 grid cells with in situ measurements in each elevation bin is shown by the blue line (right axis). Red lines denote SMB averaged by ERA5 for grid cells including observations within each elevation bin. Green lines denote SMB averaged by ERA5 over each whole bin of elevations.
ERA5 reveals large spatial gradients of snow accumulation over the AIS (Fig. 7a), with values higher than 1000 kg m−2 yr−1 at the margins and lower values (less than 30 kg m−2 yr−1) in the hinterland of the East Antarctic Plateau. There is a very high correlation between ERA5 output and the observed SMB (R2=0.93 and p<0.01, which is calculated based on the logarithm of SMB values, due to the lognormal SMB distributions). The major spatial pattern of ERA5 simulations is in good agreement with the multi-year observations (Fig. 7a). Dry biases occur in most sites of the inland East AIS and the Ross Ice Shelf and around Byrd Station, whereas wet biases occur in East AIS margins and part of sites in West AIS coastal regions (Fig. 7b). The mean bias accounts for 6.6 % of the average of observed SMB, which is slightly higher than regional climate models (MAR and RACMO2.3p2) (Agosta et al., 2019; van Wessem et al., 2018). It is obvious that ERA5 robustly captures the sharp decrease in SMB with elevation (Fig. 7c). Compared with observation in each 200 m elevation bin, ERA5 is slightly wet below 1600 m in elevation, whereas dry biases occur in inland Antarctica with elevations above 3000 m.
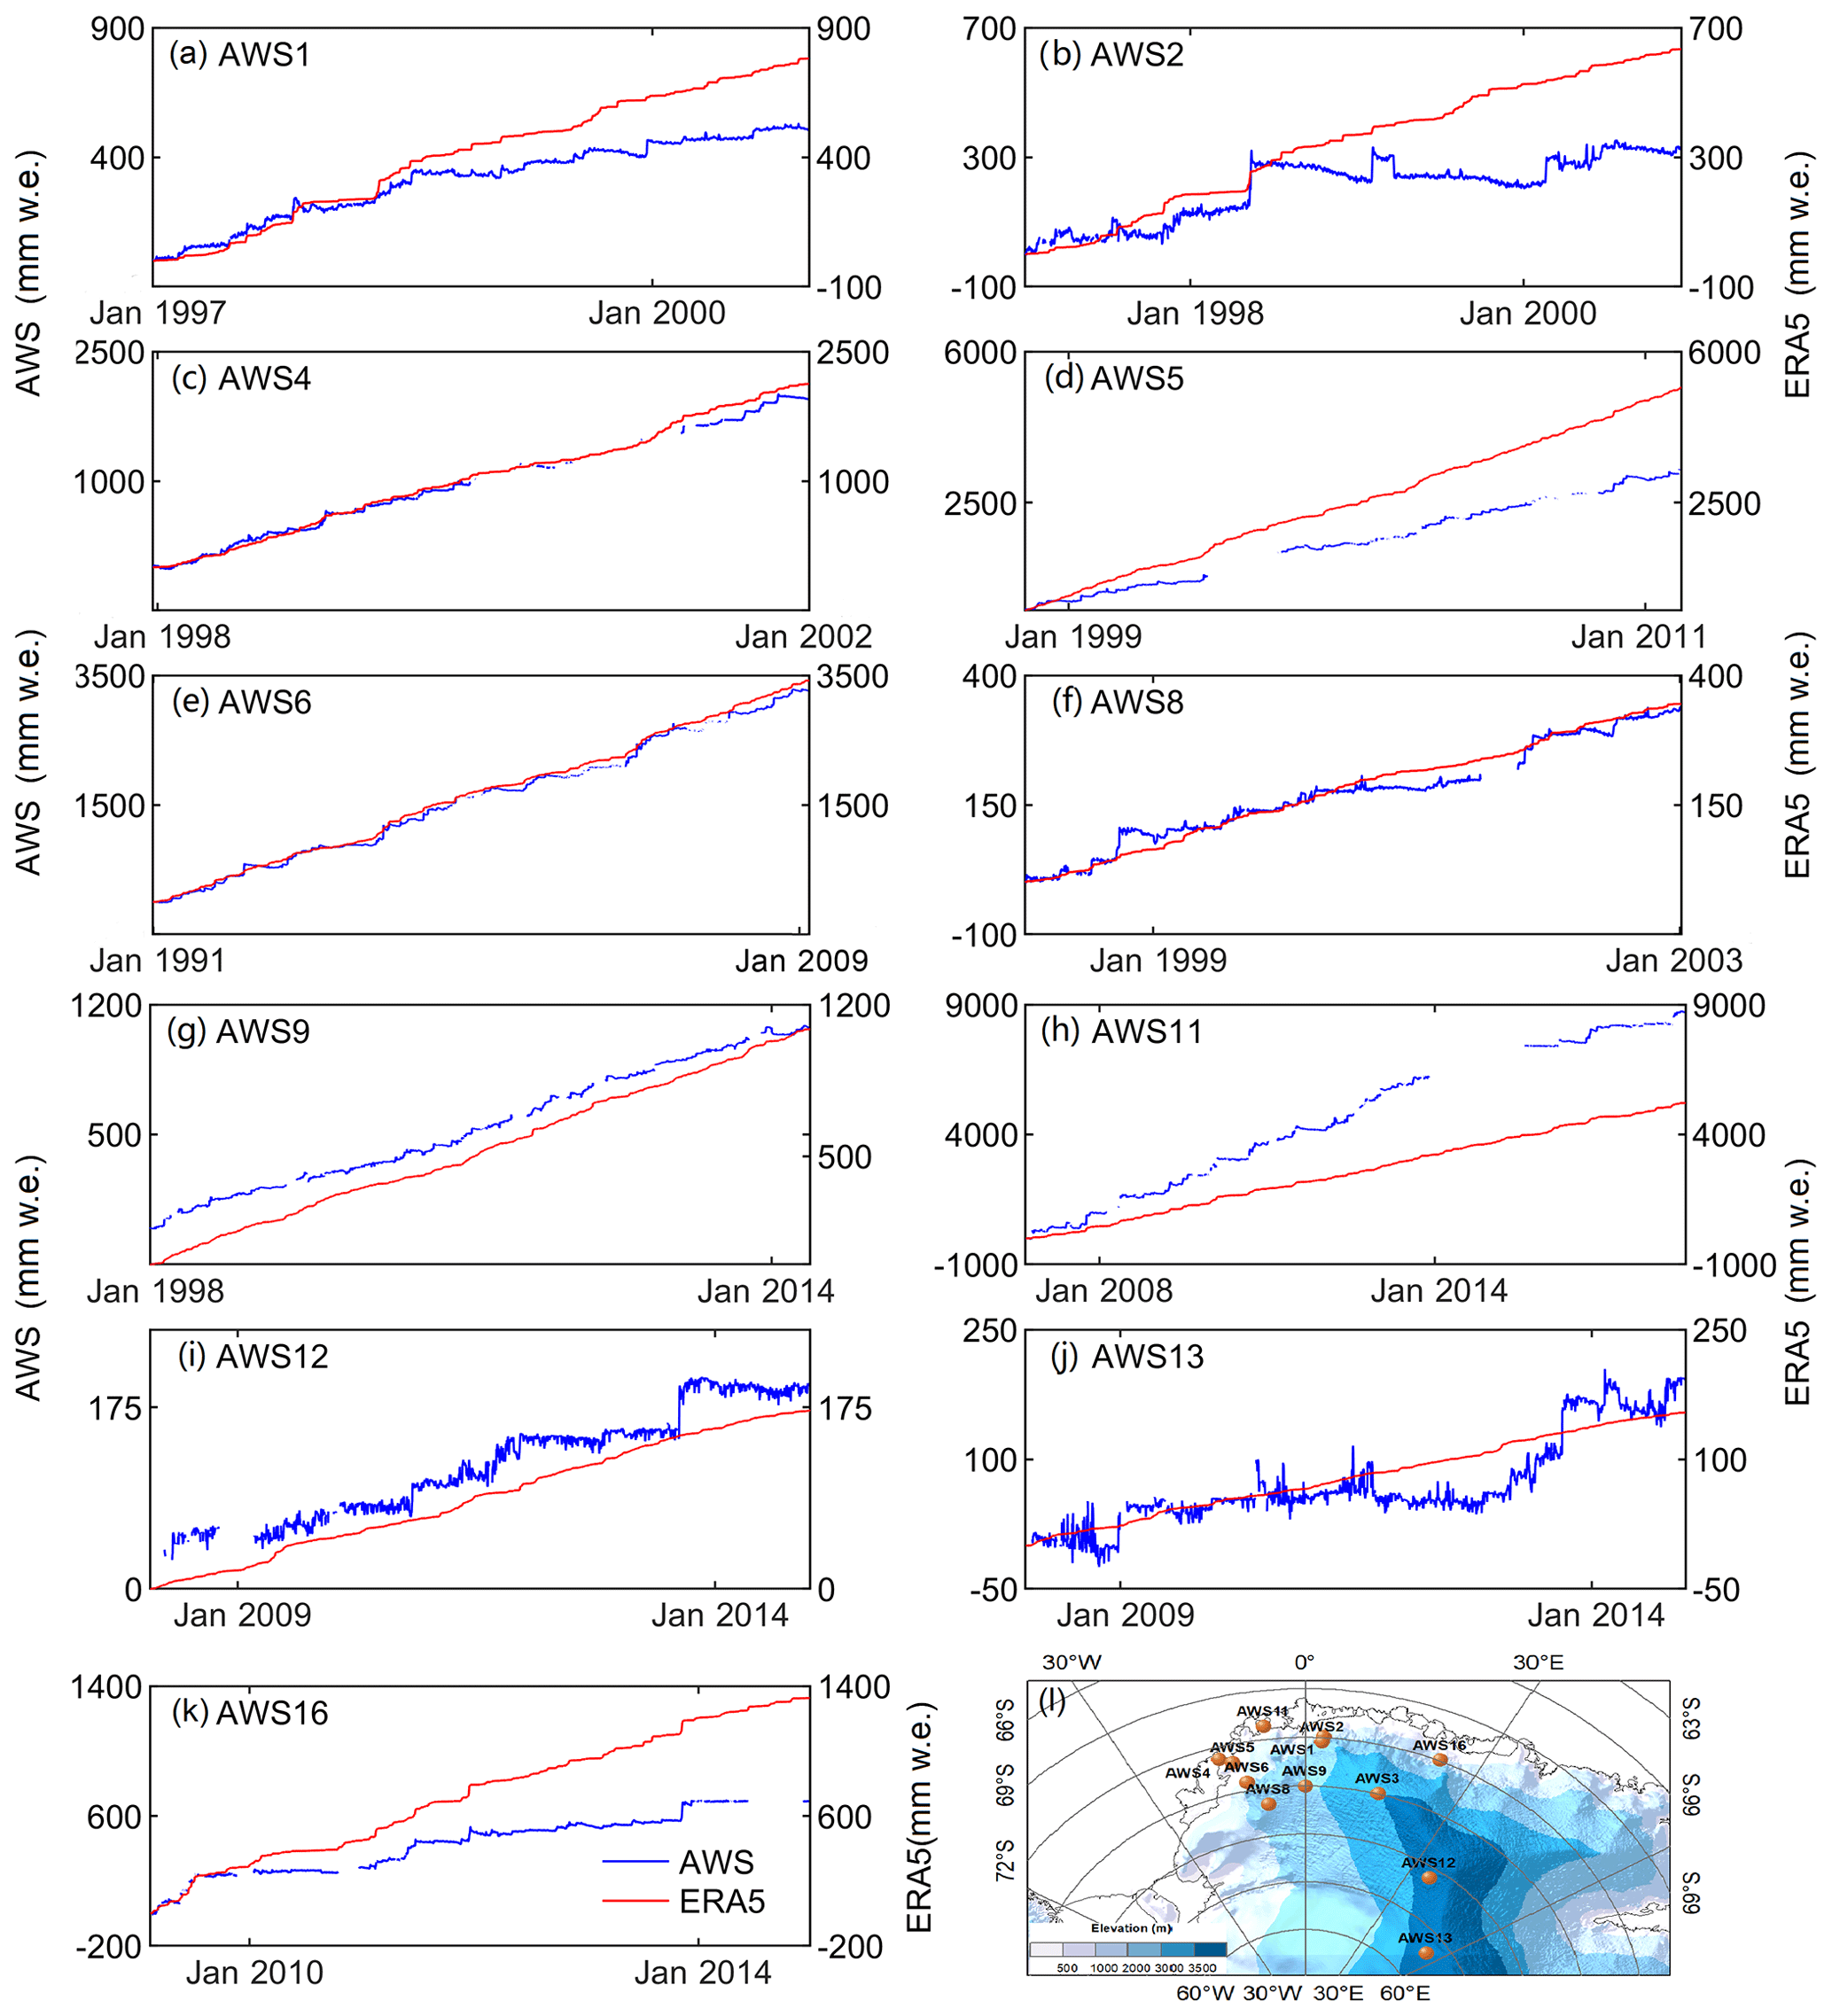
Figure 8Cumulative daily snow accumulation and snowfall over time for each station over Dronning Maud Land (a–k). (l) Spatial distribution of the AWS stations (notice that AWS3 station records are not included due to a number of missing data).
6.4 Temporal performance of ERA5 output
A recent study showed that ERA5 presents relatively good skills for representing snow accumulation changes on the synoptic timescale, observed at the AWSs over the Ross Ice Shelf and along the traverse route from Zhongshan Station to Dome A, with 56 %–88 % of extreme snowfall events captured (Liu et al., 2019). Given that these AWS observations are included in our AntSMB dataset, to avoid repetition, here we make a comparison between cumulative daily snowfall from ERA5 and the corresponding accumulation records from 11 AWS observations over DML (Fig. 8). Obviously, gaps in the AWS records occur in most stations because of the problems of sensors or data transmission. Snow accumulation decreases in the daily cumulative AWS records and reflects the important role of drifting snow, compaction, sublimation, or even ablation in the accumulation changes. Despite the noise of these post-deposition processes, stepped increases are observed for both ERA5 snowfall and AWS snow accumulation at each station in Fig. 8. Furthermore, the occurrence of large snowfall events is broadly consistent with the corresponding large accumulation events at all stations. These suggest, in spite of the limits of AWS measurements due to the complex impacts of post-deposition noise, they are very useful for evaluating synoptic changes in the precipitation from reanalysis products or climate models.

Figure 9The left map shows the locations of stake measurements along the traverse between Syowa Station and Dome F and the regional boundaries. The four right charts show the comparison of the inter-annual variability in spatially averaged stake measurements and snow accumulation simulated by ERA5 for (a) the coastal region, (b) lower katabatic region, (c) upper katabatic region, and (d) inland plateau region.
The correlation coefficients (r) between ERA5 simulations and SMB observations at 48 locations are shown in Fig. 5b. Significant and high correlations are observed at two out of five sites over the Antarctic Peninsula, with r values of more than 0.7 (p<0.05). Over the WAIS, ERA5 simulations are correlated significantly with observations (r>0.45; p<0.05) at 14 out of 18 sites, and correlation coefficients exceed 0.8 at 5 sites, suggesting relatively good skills of simulated records in capturing the observed annual variability in accumulation rates. Significant and positive correlations are present over the plateau and western and eastern coastal areas of DML. Correlation coefficients show a large fraction of inter-annual changes (>70 %) in SMB observations at Law Dome of Wilkes Land. The performances are relatively good for the South Pole, Vostok, and Talos Dome. However, no significant or negative correlations are observed at the sites of the Lambert basin, Princess Elizabeth Land, the middle DML coast, and Adélie Land.
To further assess the temporal performance of ERA5, we use the continuous time series of stake measurements along the JARE traverse route from Syowa Station to Dome F. These stake measurements are divided into four subgroups, as carried out for this traverse route by Wang et al. (2015). Stake measurements in each subgroup are stacked and then compared with the composites of ERA5 simulations for the respective subgroup (Fig. 9). ERA5 overestimates the observed SMB in the coastal and katabatic regions but underestimates that in the inland plateau region. The modeled records match particularly well with observations in the coastal, higher katabatic, and inland plateau regions, with higher r2 values of >0.5. Observed SMB at the lower katabatic region is simulated well by the reanalysis dataset.
Overall, ERA5 fits inter-annual variability in observed SMB acceptably at most sites over the AIS, and this reveals much of atmospheric circulation is represented by this reanalysis product. Nevertheless, its performance is limited at some sites of the Lambert basin, inland West Antarctica, and parts of the East Antarctic coast. This may result from the unresolved processes in ERA5 such as drifting snow, the limited performance of ERA5 for the storm frequency related to synoptic-scale circulations, and sublimation because of circulation variations. Detailed interpretation of uncertainty in ERA5 is beyond the scope of this study.
The comprehensive SMB observation dataset is available through A Big Earth Data Platform for Three Poles. The dataset can be downloaded from https://doi.org/10.11888/Glacio.tpdc.271148 (Wang et al., 2021). In this repository, the three subdatasets included in the entire dataset are provided in Excel spreadsheet format together with metadata files.
The dataset provides an unprecedentedly comprehensive compilation of SMB observations, with better spatial coverage than that of previous studies. In particular, our compilation greatly improves spatial density of measurements in the 200–1000 m elevations which are not correctly sampled by the dataset from Favier et al. (2013). However, there is a clear need to increase the spatial density of annually resolved SMB measurements over the inland East AIS, daily SMB observations over West Antarctica, and the 90–170∘ E sector of East Antarctica.
This dataset can be used to estimate the temporal and spatial changes in the AIS SMB. A temporally homogeneous climatology of SMB for the second half of the 20th century may be obtained by temporal rescaling of the multi-year-averaged SMB subdataset against ERA5 outputs as performed by Medley et al. (2019) and Wang et al. (2019). The available syntheses of time series of records from the annually resolved SMB subdataset will allow the investigation of regional snow accumulation changes during the past several decades or centuries (Kaspari et al., 2004; Frezzotti et al., 2013; Altnau et al., 2015; Thomas et al., 2017). The combination of the annual SMB subdataset with reanalysis products or the outputs of regional climate models can generate gridded datasets to better constrain the temporal and spatial variability in AIS SMB at the different scales (Monaghan et al., 2006a; Medley et al., 2019; Wang et al., 2019). The availability of AWS snow height measurements will allow insights into synoptic and seasonal patterns of SMB, which are vital for model estimation and ice core dating studies.
In the current study, we have made a comparison between observation data and ERA5 output. As a result, in spite of discrepancies in magnitude, ERA5 represents spatial variations in SMB observations well and captures a large proportion of the inter-annual variability. Similarly, this dataset can be used to evaluate the quality of other atmospheric reanalyses, and regional or global climate models such as JRA-55, MERRA-2, RACMO2.3, MAR, and CESM. Moreover, a high spatial density of stake and GPR measurements along several transections from coasts to inland is included in the dataset, which correctly samples the actual distribution of SMB and thus allow us to provide stringent constraints on the models in these specific regions. Annually resolved SMB observations in the database are also likely to be used as an important input of data assimilation for paleoclimate reconstructions (Dalaiden et al., 2020). The dataset is of vital importance for improvement of remote sensing algorithms for Antarctic snow accumulation/snowfall rates, such as the CloudSat 2C-SNOW-PROFILE product (Palerme et al., 2014; Behrangi et al., 2016).
The scientific community is expected to apply this dataset to Antarctic hydrological studies, model–data inter-comparison, and remotely sensed algorithm developments. The cryospheric community is also encouraged to further share their SMB observation data to update this dataset in the future.
The supplement related to this article is available online at: https://doi.org/10.5194/essd-13-3057-2021-supplement.
YW designed and constructed the AntSMB dataset. MD, CHR, PCJPS, and CX contributed observed data to the dataset. YW wrote the manuscript, which was edited by MD, CHR, PCJPS, SH, and CX. All authors contributed to discussion and revision of the manuscript and approved the final version.
The authors declare that they have no conflict of interest.
This article is part of the special issue “Extreme environment datasets for the three poles”. It is not associated with a conference.
Publisher's note: Copernicus Publications remains neutral with regard to jurisdictional claims in published maps and institutional affiliations.
Thanks to Cécile Agosta, the anonymous reviewer, and the editor Tao Che for providing thoughtful and constructive comments and advice to greatly improve the quality of the manuscript.
Funding for this work was provided by the Strategic Priority Research Program of the Chinese Academy of Sciences (grant no. XDA19070103), the National Natural Science Foundation of China (grant no. 41971081), the Project for Outstanding Youth Innovation Team in the Universities of Shandong Province (grant no. 2019KJH011), and the Outstanding Youth Fund of Shandong Provincial Universities (grant no. ZR2016JL030).
This paper was edited by Tao Che and reviewed by Cécile Agosta and one anonymous referee.
Altnau, S., Schlosser, E., Isaksson, E., and Divine, D.: Climatic signals from 76 shallow firn cores in Dronning Maud Land, East Antarctica, The Cryosphere, 9, 925–944, https://doi.org/10.5194/tc-9-925-2015, 2015.
Agosta, C., Amory, C., Kittel, C., Orsi, A., Favier, V., Gallée, H., van den Broeke, M. R., Lenaerts, J. T. M., van Wessem, J. M., van de Berg, W. J., and Fettweis, X.: Estimation of the Antarctic surface mass balance using the regional climate model MAR (1979–2015) and identification of dominant processes, The Cryosphere, 13, 281–296, https://doi.org/10.5194/tc-13-281-2019, 2019.
Anschütz, H., Müller, K., Isaksson, E., McConnell, J. R., Fischer, H., Miller, H., Albert, M., and Winther, J.-G.: Revisiting sites of the South Pole Queen Maud Land Traverses in East Antarctica: Accumulation data from shallow firn cores, J. Geophys. Res., 114, D24106, https://doi.org/10.1029/2009JD012204, 2009.
Arthern, R. J., Winebrenner, D. P., and Vaughan, D. G.: Antarctic snow accumulation mapped using polarization of 4.3-cm wavelength microwave emission, J. Geophys. Res., 111, D06107, https://doi.org/10.1029/2004JD005667, 2006.
Behrangi, A., Christensen, M., Richardson, M., Lebsock, M., Stephens, G., Huffman, G. J., Bolvin, D., Adler, R. F., Gardner, A., Lambrigtsen, B., and Fetzer, E.: Status of high-latitude precipitation estimates from observations and reanalyses, J. Geophys. Res.-Atmos., 121, 4468–4486, https://doi.org/10.1002/2015JD024546, 2016.
Braaten, D.: A detailed assessment of snow accumulation in katabatic wind areas on the Ross Ice Shelf, Antarctica, J. Geophys. Res., 102, 30047–30058, 1997.
Braaten, D.: Direct measurements of episodic snow accumulation on the Antarctic polar plateau, J. Geophys. Res., 105, 10119–10128, 2000.
Bromwich, D. H., Nicolas, J. P., and Monaghan, A. J.: An assessment of precipitation changes over Antarctica and the Southern Ocean since 1989 in contemporary global reanalyses, J. Climate, 24, 4189–4209. https://doi.org/10.1175/2011JCLI4074.1, 2011.
Cohen, L., Dean, S., and Renwick, J.: Synoptic weather types for the Ross Sea region, Antarctica, J. Climate, 26, 636–649, https://doi.org/10.1175/JCLI-D-11-00690.1, 2013.
Dalaiden, Q., Goosse, H., Klein, F., Lenaerts, J. T. M., Holloway, M., Sime, L., and Thomas, E. R.: How useful is snow accumulation in reconstructing surface air temperature in Antarctica? A study combining ice core records and climate models, The Cryosphere, 14, 1187–1207, https://doi.org/10.5194/tc-14-1187-2020, 2020.
Dattler, M. E., Lenaerts, J. T. M., and Medley, B.: Significant spatial variability in radar-derived West Antarctic accumulation linked to surface winds and topography, Geophys. Res. Lett., 46, 126–134, https://doi.org/10.1029/2019GL085363, 2019.
Ding, M., Xiao, C., Li, Y., Ren, J., Hou, S., Jin, B., and Sun, B.: Spatial variability of surface mass balance along a traverse route from Zhongshan station to Dome A, Antarctica, J. Glaciol., 57, 658–666, https://doi.org/10.3189/002214311797409820, 2011.
Ding, M., Xiao, C., Li, C., Qin, D., Jin, B., Shi, G., Xie, A., and Cui, X.: Surface mass balance and its climate significance from the coast to Dome A, East Antarctica, Sci. China: Earth Sci., 58, 1787–1797, https://doi.org/10.1007/s11430-015-5083-9, 2015.
Ding, M., Xiao, W., Xiao, C., Yang, J., Zhang, D., Li, R., and Zhang, T.: The snowfall history of Lambert Glacier basin during the past 300 years inferred from an ice core at LGB69, East Antarctica, 37, 1111–1118, https://doi.org/10.11928/j.issn.1001-7410.2017.05.18, 2017 (in Chinese).
Doran, P. T., McKay, C. P., Clow, G. D., Dana, G. L., Fountain, A. G., Nylen, T., and Lyons, W. B.: Valley floor climate observations from the McMurdo dry valleys, Antarctica, 1986–2000, J. Geophys. Res., 107, 4772, https://doi.org/10.1029/2001JD002045, 2002.
Eisen, O., Frezzotti, M., Genthon, C., Isaksson, E., Magand, O., van den Broeke, M. R., Dixon, D. A., Ekaykin, A., Holmlund, P., Kameda, T., Karlof, L., Kaspari, S., Lipenkov, V. Y., Oerter, H., Takahashi, S., and Vaughan, D. G.: Ground-based measurements of spatial and temporal variability of snow accumulation in East Antarctica, Rev. Geophys., 46, 26367, https://doi.org/10.1029/2006RG000218, 2008.
Favier, V., Agosta, C., Parouty, S., Durand, G., Delaygue, G., Gallée, H., Drouet, A.-S., Trouvilliez, A., and Krinner, G.: An updated and quality controlled surface mass balance dataset for Antarctica, The Cryosphere, 7, 583–597, https://doi.org/10.5194/tc-7-583-2013, 2013.
Frezzotti, M., Pourchet, M., Flora, O., Gandolfi, S., Gay, M., Urbini, S., Vincent, C., Becagli, S., Gragnani, R., Proposito, M., Severi, M., Traversi, R., Udisti, R., and Fily, M.: Spatial and temporal variability of snow accumulation in East Antarctica from traverse data, J. Glaciol., 51, 113–124, https://doi.org/10.3189/172756505781829502, 2005.
Frezzotti, M., Urbini, S., Proposito, M., Scarchilli, C., and Gandolfi, S.: Spatial and temporal variability of surface mass balance near Talos Dome, East Antarctica, J. Geophys. Res., 112, F02032, https://doi.org/10.1029/2006JF000638, 2007.
Frezzotti, M., Scarchilli, C., Becagli, S., Proposito, M., and Urbini, S.: A synthesis of the Antarctic surface mass balance during the last 800 yr, The Cryosphere, 7, 303–319, https://doi.org/10.5194/tc-7-303-2013, 2013.
Fountain, A. G., Nylen, T. H., Monaghan, A., Basaigic, H. J., and Bromwich, D.: Snow in the McMurdo Dry Valleys, Antarctica, Int. J. Climatol., 30, 633–642, https://doi.org/10.1002/joc.1933, 2010.
Genthon, C., Magand, O., Krinner, G., and Fily, M.: Do climate models underestimate snow accumulation on the Antarctic plateau? A re-evaluation of/from in situ observations in East Wilkes and Victoria Lands, Ann. Glaciol., 50, 61–65, https://doi.org/10.3189/172756409787769735, 2009.
Gorodetskaya, I. V., van Lipzig, N. P. M., van den Broeke, M. R., Mangold, A., Boot, W., and Reijmer, C. H.: Meteorological regimes and accumulation patterns at Utsteinen, Dronning Maud Land, East Antarctica: Analysis of two contrasting years. J. Geophys. Res.-Atmos., 118, 1700–1715, https://doi.org/10.1002/jgrd.50177, 2013.
Hersbach, H., Bell, B., Berrisford, P., Hirahara, S., Horányi, A., Muñoz-Sabater, J., Nicolas, J., Peubey, C., Radu, R., Schepers, D., Simmons, A., Soci, C., Abdalla, S., Abellan, X., Balsamo, G., Bechtold, P., Biavati, G., Bidlot, J., Bonavita, M., De Chiara, G., Dahlgren, P., Dee, D., Diamantakis, M., Dragani, R., Flemming, J., Forbes, R., Fuentes, M., Geer, A., Haimberger, L., Healy, S., Hogan, R. J., Hólm, E., Janisková, M., Keeley, S., Laloyaux, P., Lopez, P., Lupu, C., Radnoti, G., De Rosnay, P., Rozum, I., Vamborg, F., Villaume, S., and Thépaut, J.-N.: The ERA5 global reanalysis, Q. J. Roy. Meteor. Soc., 146, 1999–2049, https://doi.org/10.1002/qj.3803, 2020.
Huai, B., Wang, Y., Ding, M., Zhang, J., and Dong, X.: An assessment of recent global atmospheric reanalyses for Antarctic near surface air temperature, Atmos. Res., 226, 181–191, https://doi.org/10.1016/j.atmosres.2019.04.029, 2019.
Isaksson, E. and Melvold, K.: Trends and patterns in the recent accumulation and oxygen isotope in coastal Dronning Maud Land, Antarctica: interpretations from shallow ice cores, Ann. Glaciol., 35, 175–180, 2002.
Kameda, T., Motoyama, H., Fujita, S., and Takahashi S.: Temporal and spatial variability of surface mass balance at Dome Fuji, East Antarctica, by the stake method from 1995 to 2006, J. Glaciol., 54, 107–116, 2008.
Kanagaratnam, P., Gogineni, S., Ramasami, V., and Braaten, D.: A wideband radar for high-resolution mapping of near-surface internal layers in glacial ice, IEEE T. Geosci. Remote Sens., 42, 483–490, 2004.
Kanagaratnam, P., Markus, T., Lytle, V., Heavey, B., Jansen, P., Prescott, G., and Gogineni, S. P.: Ultrawideband radar measurements of thickness of snow over sea ice, IEEE T. Geosci. Remote Sens., 45, 2715–2724, 2007.
Kaspari, S., Mayewski, P. A., Dixon, D. A., Spikes, V. B., Sneed, S. B., Handley, M. J., and Hamilton, G. S.: Climate variability in West Antarctica derived from annual accumulation-rate records from ITASE firn/ice cores, Ann. Glaciol., 39, 585–594, https://doi.org/10.3189/172756404781814447, 2004.
Khodzher, T. V., Golobokova, L. P., Osipov, E. Yu., Shibaev, Yu. A., Lipenkov, V. Ya., Osipova, O. P., and Petit, J. R.: Spatial–temporal dynamics of chemical composition of surface snow in East Antarctica along the Progress station–Vostok station transect, The Cryosphere, 8, 931–939, https://doi.org/10.5194/tc-8-931-2014, 2014.
Le Meur, E., Magand, O., Arnaud, L., Fily, M., Frezzotti, M., Cavitte, M., Mulvaney, R., and Urbini, S.: Spatial and temporal distributions of surface mass balance between Concordia and Vostok stations, Antarctica, from combined radar and ice core data: first results and detailed error analysis, The Cryosphere, 12, 1831–1850, https://doi.org/10.5194/tc-12-1831-2018, 2018.
Leuschen, C.: IceBridge Snow Radar L1B Geolocated Radar Echo Strength Profiles, 18 October 2009, 19 November 2010, 9–12 November 2011, Boulder, Colorado USA, NASA DAAC at the National Snow and Ice Data Center, 2010.
Li, Y., Cole-Dai, J., and Zhou, L.: Glaciochemical evidence in an East Antarctica ice core of a recent (AD 1450–1850) neoglacial episode, J. Geophys. Res., 114, D08117, https://doi.org/10.1029/2008JD011091, 2009.
Liu, Y., Li, F., Hao, W., Barriot, J. P., and Wang, Y.: Evaluation of synoptic snowfall on the Antarctic Ice Sheet based on CloudSat, in-Situ observations and atmospheric reanalysis datasets, Remote Sens., 11, 1686, https://doi.org/10.3390/rs11141686, 2019.
Magand, O., Genthon, C., Fily, M., Krinner, G., Picard, G., Frezzotti, M., and Ekaykin, A. A.: An up-to-date quality-controlled surface mass balance data set for the 90–180∘ E Antarctica sector and 1950–2005 period, J. Geophys. Res., 112, D12106, https://doi.org/10.1029/2006JD007691, 2007.
Mayewski, P. and Dixon, D. A.: US International Trans-Antarctic Scientific Expedition (US ITASE) Glaciochemical Data, Version 2, US_ITASE_Core Info-SWE-Density_2013.xlsx, National Snow and Ice Data Center, Boulder, Colorado, USA, 2013.
Mayewski, P., Frezzotti, M., Bertler, N. A. N., van Ommen, T., Hamilton, G. S., Jacka T. H., Welch, B., Frey, M., Qin, D., Ren, J., Simöes, J., Fily, M., Oerter, H., Nishio, F., Isaksson, E., Mulvaney, R., Holmund, P., Lipenkov, V., and Goodwin, I.: The International Trans-Antarctic Scientific Expedition (ITASE): An Overview, Ann. Glaciol., 41, 180–185, 2005.
McMorrow, A., Curran, M., van Ommen, T., Morgan, V., Pook, M., and Allison, I.: Intercomparison of firn core and meteorological data, Antarct. Sci., 13, 329–337, 2001.
Medley, B. and Thomas, E. R.: Increased snowfall over the Antarctic Ice Sheet mitigated 20th century sea-level rise, Nat. Clim. Change, 9, 34–39, https://doi.org/10.1038/s41558-018-0356-x, 2019.
Medley, B., Joughin, I., Das, S. B., Steig, E. J., Conway, H., Gogineni, S., Criscitiello, A. S., McConnell, J. R., Smith, B. E., van den Broeke, M. R., Lenaerts, J. T. M., Bromwich, D. H., and Nicolas, J. P.: Airborne-radar and ice-core observations of annual snow accumulation over Thwaites Glacier, West Antarctica confirm the spatiotemporal variability of global and regional atmospheric models, Geophys. Res. Lett., 40, 3649–3654, https://doi.org/10.1002/grl.50706, 2013.
Medley, B., Joughin, I., Smith, B. E., Das, S. B., Steig, E. J., Conway, H., Gogineni, S., Lewis, C., Criscitiello, A. S., McConnell, J. R., van den Broeke, M. R., Lenaerts, J. T. M., Bromwich, D. H., Nicolas, J. P., and Leuschen, C.: Constraining the recent mass balance of Pine Island and Thwaites glaciers, West Antarctica, with airborne observations of snow accumulation, The Cryosphere, 8, 1375–1392, https://doi.org/10.5194/tc-8-1375-2014, 2014.
Montgomery, L., Koenig, L., and Alexander, P.: The SUMup dataset: compiled measurements of surface mass balance components over ice sheets and sea ice with analysis over Greenland, Earth Syst. Sci. Data, 10, 1959–1985, https://doi.org/10.5194/essd-10-1959-2018, 2018.
Monaghan, A. J., Bromwich, D. H., Fogt, R. L., Wang, S.-H., Mayewski, P. A., Dixon, D. A., Ekaykin, A., Frezzotti, M., Goodwin, I., Isaksson, E., Kaspari, S. D., Morgan, V. I., Oerter, H., Van Ommen, T. D., Van der Veen, C. J., and Wen, J.: Insignificant Change in Antarctic Snowfall Since the International Geophysical Year, Science, 313, 827–831, https://doi.org/10.1126/science.1128243, 2006a.
Monaghan, A. J., Bromwich, D. H., and Wang, S-H.: Recent trends in Antarctic snow accumulation from Polar MM5 simulations, Philis. T. Roy. Soc. A., 364, 1683–1708, https://doi.org/10.1098/rsta.2006.1795, 2006b.
Motoyama, H., Furukawa, T., Fujita, S., Shinbori, K., Tanaka, Y., Li, Y., Chung, J.-W., Nakazawa, F., Fukui, K., Enomoto, H., Sugiyama, S., Asano, H., Takeda, Y., Hirabayashi, M., Nishimura, D., Masunaga, T., Kuramoto, T., Kobashi, T., Kusaka, R., Kinase, T., Ikeda, C., Suzuki, T., Ohno, H., Hoshina, Y., Hayakawa, Y., and Kameda, T.: Glaciological Data Collected by the 48th–54th Japanese Antarctic Research Expeditions during 2007–2013, JARE Data Rep., 341, Glaciology, 35, 1–44, 2015.
Müller, K., Sinisalo, A., Anschütz, H., Hamran, S.-E., Hagen, J.-O., McConnell, J. R., and Pasteris, D. R.: An 860 km surface mas sbalance profile on the East Antarctic plateau derived by GPR, Ann. Glaciol., 55, 1–8, https://doi.org/10.3189/172756410791392718, 2010.
Oerter, H.: Annual means of δ18O and accumulation rates of snow pit DML76S05_11, https://doi.org/10.1594/PANGAEA.708113, 2008a.
Oerter, H.: Annual means of δ18O and accumulation rates of snow pit DML77S05_12, https://doi.org/10.1594/PANGAEA.708114, 2008b.
Oerter, H.: Annual means of δ18O and accumulation rates of snow pit DML78S05_13, https://doi.org/10.1594/PANGAEA.708115, 2008c.
Oerter, H.: Annual means of δ18O and accumulation rates of snow pit DML79S05_14, https://doi.org/10.1594/PANGAEA.708116, 2008d.
Oerter, H.: Annual means of δ18O and accumulation rates of snow pit DML80S05_15, https://doi.org/10.1594/PANGAEA.708117, 2008e.
Oerter, H.: Annual means of δ18O and accumulation rates of snow pit DML81S05_16, https://doi.org/10.1594/PANGAEA.708118, 2008f.
Oerter, H.: Annual means of δ18O and accumulation rates of snow pit DML82S05_17, https://doi.org/10.1594/PANGAEA.708119, 2008g.
Oerter, H.: Annual means of δ18O and accumulation rates of snow pit DML83S05_18, https://doi.org/10.1594/PANGAEA.708120, 2008h.
Oerter, H.: Annual means of δ18O and accumulation rates of snow pit DML84S05_19, https://doi.org/10.1594/PANGAEA.708121, 2008i.
Oerter, H.: Annual means of δ18O and accumulation rates of snow pit DML85S05_20, https://doi.org/10.1594/PANGAEA.708122, 2008j.
Oerter, H.: Annual means of δ18O and accumulation rates of snow pit DML86S05_21, https://doi.org/10.1594/PANGAEA.708123, 2008k.
Oerter, H.: Annual means of δ18O and accumulation rates of snow pit DML87S05_22, https://doi.org/10.1594/PANGAEA.708124, 2008l.
Palerme, C., Kay, J. E., Genthon, C., L'Ecuyer, T., Wood, N. B., and Claud, C.: How much snow falls on the Antarctic ice sheet?, The Cryosphere, 8, 1577–1587, https://doi.org/10.5194/tc-8-1577-2014, 2014.
Rignot, E., Velicogna, I., van den Broeke, M. R., Monaghan, A. J., and Lenaerts, J. T.: Acceleration of the contribution of the Greenland and Antarctic ice sheets to sea level rise, Geophys. Res. Lett., 38, L05503, https://doi.org/10.1029/2011GL046583, 2011.
Rignot, E., Mouginot, J., Scheuchl, B., van den Broeke, M., van Wessem, M. J., and Morlighem, M.: Four decades of Antarctic Ice Sheet mass balance from 1979–2017, P. Natl. Acad. Sci. USA, 116, 1095–1103, https://doi.org/10.1073/pnas.1812883116, 2019.
Reijmer, C. H. and Van den Broeke, M. R.: Temporal and spatial variability of the surface mass balance in Dronning Maud Land, Antarctica, as derived from automatic weather stations, J. Glaciol., 49, 512–520, https://doi.org/10.3189/172756503781830494, 2003.
Reijmer, C. H., Greuell, W., and Oerlemans, J.: The annual cycle of meteorological variables and the surface energy balance on Berkner Island, Antarctica, Ann. Glaciol., 29, 49–54, 1999.
Rodriguez-Morales, F., Gogineni, S., Leuschen, C. J., Paden, J. D., Li, J., Lewis, C. C., Panzer, B., Alvestegui, D. G.-G., Patel, A., Byers, K., Crowe, R., Player K., Hale, R. D., Arnold, E. J., Smith, L., Gifford, C. M., Braaten, D., and Panton, C.: Advanced Multi-Frequency Radar Instrumentation for Polar Research, IEEE T. Geosci. Rem. Sens., 52, 2824–2842, https://doi.org/10.1109/TGRS.2013.2266415, 2014.
Shepherd, A., Ivins, E. R., A. G., Barletta, V. R., Bentley, M. J., Bettadpur, S., Briggs, K. H., Bromwich, D. H., Forsberg, R., Galin, N., Horwath, M., Jacobs, S., Joughin, I., King, M. A., Lenaerts, J. T. M., Li, J., Ligtenberg, S. R. M., Luckman, A., Luthcke, S. B., McMillan, M., Meister, R., Milne, G., Mouginot, J., Muir, A., Nicolas, J. P., Paden, J., Payne, A. J., Pritchard, H., Rignot, E., Rott, H., Sørensen, L. S., Scambos, T. A., Scheuchl, B., Schrama, E. J. O., Smith, B., Sundal, A. V., van Angelen, J. H., van de Berg, W. J., van den Broeke, M. R., Vaughan, D. G., Velicogna, I., Wahr, J., Whitehouse, P. L., Wingham, D. J., Yi, D., Young, D., and Zwally, H. J.: A reconciled estimate of ice-sheet mass balance, Science, 338, 1183–1189, https://doi.org/10.1126/science.1228102, 2012.
Shepherd, A., Ivins, E., Rignot, E., Smith, B., van den Broeke, M., Velicogna, I., Whitehouse, P., Briggs, K., Joughin, I., Krinner, G., Nowicki, S., Payne, T., Scambos, T., Schlegel, N., A, G., Agosta, C., Ahlstrøm, A., Babonis, G., Barletta, V., Blazquez, A., Bonin, J., Csatho, B., Cullather, R., Felikson, D., Fettweis, X., Forsberg, R., Gallee, H., Gardner, A., Gilbert, L., Groh, A., Gunter, B., Hanna, E., Harig, C., Helm, V., Horvath, A., Horwath, M., Khan, S., Kjeldsen, K. K., Konrad, H., Langen, P., Lecavalier, B., Loomis, B., Luthcke, S., McMillan, M., Melini, D., Mernild, S., Mohajerani, Y., Moore, P., Mouginot, J., Muir, A., Nagler, T., Nield, G., Nilsson, J., Noel, B., Otosaka, I., Peltier, R., Pie, N., Rietbroek, R., Rott, H., Sandberg-Sørensen, L., Sasgen, I., Save, H., Schrama, E., Schroder, L., Seo, K.-W., Simonsen, S., Slater, T., Spada, G., Sutterley, T., Talpe, M., Tarasov, L., van de Berg, W. J., van der Wal, W., van Wessem, M., Vishwakarma, B. D., Wiese, D., Wouters, B., Wu, X., and Zwally, J.: Mass balance of the Antarctic Ice Sheet from 1992 to 2017, Nature, 558, 219–222, https://doi.org/10.1038/s41586-018-0179-y, 2018.
Spikes, V. B., Hamilton, G. S., Arcone, S. A., Kaspari, S., and Mayewski, P. A.: Variability in accumulation rates from GPR profiling on the West Antarctic plateau, Ann. Glaciol., 39, 238–244, 2004.
Stenni, B., Curran, M. A. J., Abram, N. J., Orsi, A., Goursaud, S., Masson-Delmotte, V., Neukom, R., Goosse, H., Divine, D., van Ommen, T., Steig, E. J., Dixon, D. A., Thomas, E. R., Bertler, N. A. N., Isaksson, E., Ekaykin, A., Werner, M., and Frezzotti, M.: Antarctic climate variability on regional and continental scales over the last 2000 years, Clim. Past, 13, 1609–1634, https://doi.org/10.5194/cp-13-1609-2017, 2017.
Thiery, W., Gorodetskaya, I. V., Bintanja, R., Van Lipzig, N. P. M., Van den Broeke, M. R., Reijmer, C. H., and Kuipers Munneke, P.: Surface and snowdrift sublimation at Princess Elisabeth station, East Antarctica, The Cryosphere, 6, 841–857, https://doi.org/10.5194/tc-6-841-2012, 2012.
Thomas, E. R. and Bracegirdle, T. J.: Precipitation pathways for five new ice core sites in Ellsworth Land, West Antarctica, Clim. Dynam., 44, 2067–2078, https://doi.org/10.1007/s00382-014-2213-6, 2015.
Thomas, E. R., van Wessem, J. M., Roberts, J., Isaksson, E., Schlosser, E., Fudge, T. J., Vallelonga, P., Medley, B., Lenaerts, J., Bertler, N., van den Broeke, M. R., Dixon, D. A., Frezzotti, M., Stenni, B., Curran, M., and Ekaykin, A. A.: Regional Antarctic snow accumulation over the past 1000 years, Clim. Past, 13, 1491–1513, https://doi.org/10.5194/cp-13-1491-2017, 2017.
Van den Broeke, M. R., Reijmer, C. H., and van de Wal, R. S. W.: A study of the surface mass balance in Dronning Maud Land, Antarctica, using automatic weather station. J. Glaciol., 50, 565–582, https://doi.org/10.3189/172756504781829756, 2004.
Van de Berg, W. J., Van den Broeke, M. R., Reijmer, C. H., and Van Meijgaard, E.: Reassessment of the Antarctic surface mass balance using calibrated output of a regional atmospheric climate model, J. Geophys. Res., 111, D11104, https://doi.org/10.1029/2005JD006495, 2006.
van Lipzig, N. P. M., Turner, J., Colwell, S. R., and van den Broeke, M. R.: The near-surface wind field over the Antarctic continent, Int. J. Climatol., 24, 1973–1982, 2004.
Vaughan, D. G. and Russell, J.: Compilation of surface mass balance measurements in Antarctica, Internal Rep., ES4, 56, 1–56, 1997.
Vaughan, D. G., Bamber, J. L., Giovinetto, M., Russell, J., and Cooper, A. P. R.: Reassessment of net surface mass balance in Antarctica, J. Climate, 12, 933–946, https://doi.org/10.1175/1520-0442(1999)012<0933:RONSMB>2.0.CO;2, 1999.
Vaughan, D. G., Anderson, P. S., King, J. C., Mann, G. W., Mobbs, S. D., and Ladkin R. S.: Imaging of firn isochrones across an Antarctic ice rise and implications for patterns of snow accumulation rate, J. Glaciol., 50, 413–418, 2004.
van Wessem, J. M., van de Berg, W. J., Noël, B. P. Y., van Meijgaard, E., Amory, C., Birnbaum, G., Jakobs, C. L., Krüger, K., Lenaerts, J. T. M., Lhermitte, S., Ligtenberg, S. R. M., Medley, B., Reijmer, C. H., van Tricht, K., Trusel, L. D., van Ulft, L. H., Wouters, B., Wuite, J., and van den Broeke, M. R.: Modelling the climate and surface mass balance of polar ice sheets using RACMO2 – Part 2: Antarctica (1979–2016), The Cryosphere, 12, 1479–1498, https://doi.org/10.5194/tc-12-1479-2018, 2018.
Wang, Y., Hou, S., Sun, W., Lenaerts, J. T. M., van den Broeke, M. R., and van Wessem, J. M.: Recent surface mass balance from Syowa Station to Dome F, East Antarctica: comparison of field observations, atmospheric reanalyses, and a regional atmospheric climate model, Clim. Dynam., 45, 2885–2899, https://doi.org/10.1007/s00382-015-2512-6, 2015.
Wang, Y., Ding, M., van Wessem, J., Schlosser, E., Altnau, S., van den Broeke, M. R., Lenaerts, J. T. M., Thomas, E. R., Isaksson, E., Wang, J., and Sun, W.: A comparison of Antarctic Ice Sheet surface mass balance from atmospheric climate models and in situ observations, J. Climate., 29, 5317–5337, 2016.
Wang, Y., Huai, B., Thomas, E. R., van den Broeke, M. R., van Wessem, J. M., and Schlosser, E.: A new 200-year spatial reconstruction of West Antarctic surface mass balance, J. Geophys. Res.-Atmos., 124, 5282–5295, https://doi.org/10.1029/2018JD029601, 2019.
Wang, Y., Hou, S., Ding, M., and Sun, W.: On the performance of twentieth century reanalysis products for Antarctic snow accumulation, Clim. Dynam., 54, 435–455, https://doi.org/10.1007/s00382-019-05008-4, 2020.
Wang, Y., Ding, M., Reijmer C., Smeets P., Hou, S., and Xiao, C.: A comprehensive dataset of surface mass balance field observations over the Antarctic Ice Sheet version 1.0. A Big Earth Data Platform for Three Poles, 2021.
Winski, D. A., Fudge, T. J., Ferris, D. G., Osterberg, E. C., Fegyveresi, J. M., Cole-Dai, J., Thundercloud, Z., Cox, T. S., Kreutz, K. J., Ortman, N., Buizert, C., Epifanio, J., Brook, E. J., Beaudette, R., Severinghaus, J., Sowers, T., Steig, E. J., Kahle, E. C., Jones, T. R., Morris, V., Aydin, M., Nicewonger, M. R., Casey, K. A., Alley, R. B., Waddington, E. D., Iverson, N. A., Dunbar, N. W., Bay, R. C., Souney, J. M., Sigl, M., and McConnell, J. R.: The SP19 chronology for the South Pole Ice Core – Part 1: volcanic matching and annual layer counting, Clim. Past, 15, 1793–1808, https://doi.org/10.5194/cp-15-1793-2019, 2019.
Xiao, C., Ren, J., Qin, D. H., Li, Z. Q., Sun, W. Z., and Allison, I.: Complexity of the climatic regime over the Lambert Glacier basin of the East Antarctic Ice Sheet: Firn core evidences, J. Glaciol., 47, 160–163, https://doi.org/10.3189/172756501781832539, 2001.
Zhang, Y., Wang, Y., Huai, B., Ding, M., and Sun, W.: Skill of the two 20th century reanalyses in representing Antarctic near-surface air temperature, Int. J. Climatol., 38, 11, 4225–4238, https://doi.org/10.1002/joc.5563, 2018.
- Abstract
- Introduction
- Description of the AntSMB dataset
- Spatial and temporal analysis of the AntSMB dataset
- Inter-comparison of the different types of SMB measurement
- Comparison with the previous AIS SMB observation datasets
- Comparison with ERA5
- Data availability
- Discussion and conclusions
- Author contributions
- Competing interests
- Special issue statement
- Disclaimer
- Acknowledgements
- Financial support
- Review statement
- References
- Supplement