the Creative Commons Attribution 4.0 License.
the Creative Commons Attribution 4.0 License.
 | 09 Feb 2021
Observations of the thermodynamic and kinematic state of the atmospheric boundary layer over the San Luis Valley, CO, using the CopterSonde 2 remotely piloted aircraft system in support of the LAPSE-RATE field campaign
Elizabeth A. Pillar-Little
Brian R. Greene
Francesca M. Lappin
Tyler M. Bell
Antonio R. Segales
Gustavo Britto Hupsel de Azevedo
William Doyle
Sai Teja Kanneganti
Daniel D. Tripp
Phillip B. Chilson
In July 2018, the University of Oklahoma deployed three CopterSonde remotely piloted aircraft systems (RPASs) to take measurements of the evolving thermodynamic and kinematic state of the atmospheric boundary layer (ABL) over complex terrain in the San Luis Valley, Colorado. A total of 180 flights were completed over 5 d, with teams operating simultaneously at two different sites in the northern half of the valley. A total of 2 d of operations focused on convection initiation studies, 1 d focused on ABL diurnal transition studies, 1 d focused on internal comparison flights, and the last day of operations focused on cold air drainage flows. The data from these coordinated flights provide insight into the horizontal heterogeneity of the atmospheric state over complex terrain. This dataset, along with others collected by other universities and institutions as a part of the LAPSE-RATE campaign, have been submitted to Zenodo (Greene et al., 2020) for free and open access (https://doi.org/10.5281/zenodo.3737087).
- Article
(10601 KB) - Full-text XML
- BibTeX
- EndNote


Researchers from the University of Oklahoma (OU) joined colleagues from across the world to take part in the Lower Atmospheric Profiling Studies at Elevation – a Remotely-piloted Aircraft Team Experiment (LAPSE-RATE) campaign during 13–19 July 2018 in the San Luis Valley of Colorado. This campaign brought teams together from several universities with researchers from government laboratories such as the National Center for Atmospheric Research (NCAR), National Severe Storms Laboratory (NSSL), and National Oceanic and Atmospheric Administration (NOAA) to conduct targeted observations to examine five scientific objectives: (1) valley drainage flows, (2) convection initiation, (3) aerosol properties, (4) turbulence profiling, and (5) morning boundary layer transitions with both remote (lidars, AERI, radiometer) and in situ (radiosondes, Mobile Mesonet) sensors (Bell et al., 2020b; de Boer et al., 2020c) as well as remotely piloted aircraft systems (RPASs, also commonly referred to as uncrewed aircraft systems, UASs). Additionally, the colocation of so many teams with diverse systems provided a unique opportunity to undertake an intensive comparison of the sensing capabilities of the aerial systems being utilized as a part of the campaign (de Boer et al., 2020b; Barbieri et al., 2019). It also provided an opportunity to assess the accuracy of weather forecasts that were provided by NCAR to the team as a part of the campaign (Glasheen et al., 2020; Pinto et al., 2020).
The use of RPASs in the atmospheric sciences has increased significantly with the explosive growth of technologies that are both economical and more user-friendly than previous generations of uncrewed systems (Elston et al., 2015; Brosy et al., 2017; Koch et al., 2018; Lee et al., 2017, 2018; Chilson et al., 2019). Research utilizing RPASs for weather applications at OU has been ongoing since 2009, when scientists in the School of Meteorology began exploring ways of utilizing RPASs to take highly resolved profiles of atmospheric state variables (Bonin et al., 2013, 2012), turbulence (Wainwright et al., 2015; Bonin et al., 2015), and ozone (Zielke, 2011) among other phenomena to better understand the evolution and structure of the atmospheric boundary layer (ABL). In 2016, these studies expanded to encompass sensor placement and measurement optimization (Greene et al., 2018), system design and evaluation (Segales et al., 2020a), and sensor integration (Greene et al., 2019) due in large part to the CLOUD-MAP project which facilitated the development of RPASs for the explicit purpose of conducting atmospheric measurements (Jacob et al., 2018). The capabilities of these weather-sensing RPASs have been demonstrated in a variety of collaborative field campaigns (de Boer et al., 2019; Jacob et al., 2018; Koch et al., 2018; Kral et al., 2020), calibration and validation experiments (Barbieri et al., 2019), and careful comparison against other remote sensing networks (Bell et al., 2020a).
OU deployed three CopterSonde quadcopter RPASs (Segales et al., 2020a) as a part of the LAPSE-RATE campaign. This system successfully captured vertical profiles of these variables up to 914 m above ground level (a.g.l.) during this week-long mission through direct (pressure, temperature, and humidity) and indirect (wind speed and wind direction) measurements (see Tables 1 and 2 for technical specifications). These platforms were deployed to three different sites over the course of the field campaign, typically measuring at two sites simultaneously. This approach resulted in the OU team completing 180 flights that produced quality observational data supporting three of the five campaign objectives (boundary layer transitions, drainage flows, and convection initiation).
This paper will focus on the data collected by OU in support of the scientific objectives of the campaign, including the platforms used, the data acquisition methods, and the processing and archival process. Section 2 will briefly describe the CopterSonde RPAS as well as the operational strategy for this field campaign. Section 3 will discuss the data logging, processing, and quality control procedures, while Sect. 4 will highlight some examples of data products available within this dataset. Section 5 will outline the format, location, and associated metadata of the publicly available dataset. Finally, Sect. 6 will provide concluding remarks as future outlooks regarding the future applications of the dataset. For details regarding OU's contribution to the sensor intercomparison efforts, readers are directed to Barbieri et al. (2019). More information regarding the overall campaign such as information surrounding the synoptic conditions, community engagement efforts, and campaign objectives can be found in de Boer et al. (2020s) and de Boer et al. (2020b). Finally, material outlining the contribution of the other participating institutions can be found in this special issue (Bailey et al., 2020; Bell et al., 2020b; Brus et al., 2020; de Boer et al., 2020c; Pinto et al., 2020).
2.1 CopterSonde RPAS
The RPAS utilized for this field campaign was the CopterSonde 2 (hereinafter, CopterSonde) (Fig. 1; see Segales et al., 2020a), which was designed and manufactured by the Center for Autonomous Sensing and Sampling (CASS) at OU. The CopterSonde is a rotary-wing platform that is based on a modified version of the Lynxmotion HQuad500 wide-X type quadcopter with fixed-pitch rotors that has been optimized for vertical profiling operations. The CopterSonde's technical specifications can be found in Table 1. Additional information regarding the design and development of the CopterSonde series is described in Segales et al. (2020a). The CopterSonde RPAS has been proven to be capable of collecting thermodynamic and kinematic profiles of the atmosphere in a variety of environments from summer in the southern Great Plains in pre-convective environments (Koch et al., 2018) to polar winter conditions in the Arctic (Kral et al., 2020). For the LAPSE-RATE deployment, the CopterSonde was piloted under its typical operating parameters except its standard (28×14 cm) T-style carbon fiber propellers were swapped for a (30.5×14 cm) model to increase the maximum thrust of the vehicle required to overcome the lower density altitude in south central Colorado resulting from warm temperatures and high altitudes above mean sea level (a.m.s.l.). Because the thermodynamic sensors are mounted inside a fan-aspirated L-duct on the front end of the aircraft, results from Greene et al. (2019) indicate that changing the propellers should not affect the quality of thermodynamic observations. All the CopterSonde's flights during the campaign were done in a semi-autonomous mode, meaning that the platform flew a pre-programmed mission and was only manually controlled by the operator during landing. Commands were sent to the RPAS over a telemetry link, and data collected were streamed back to the ground station where they were displayed on a customized interface that allowed for real-time monitoring. The ground station and RPAS communicated via a 900 MHz radio (RFD 900+, RFDesign) that has a range of 40 km.
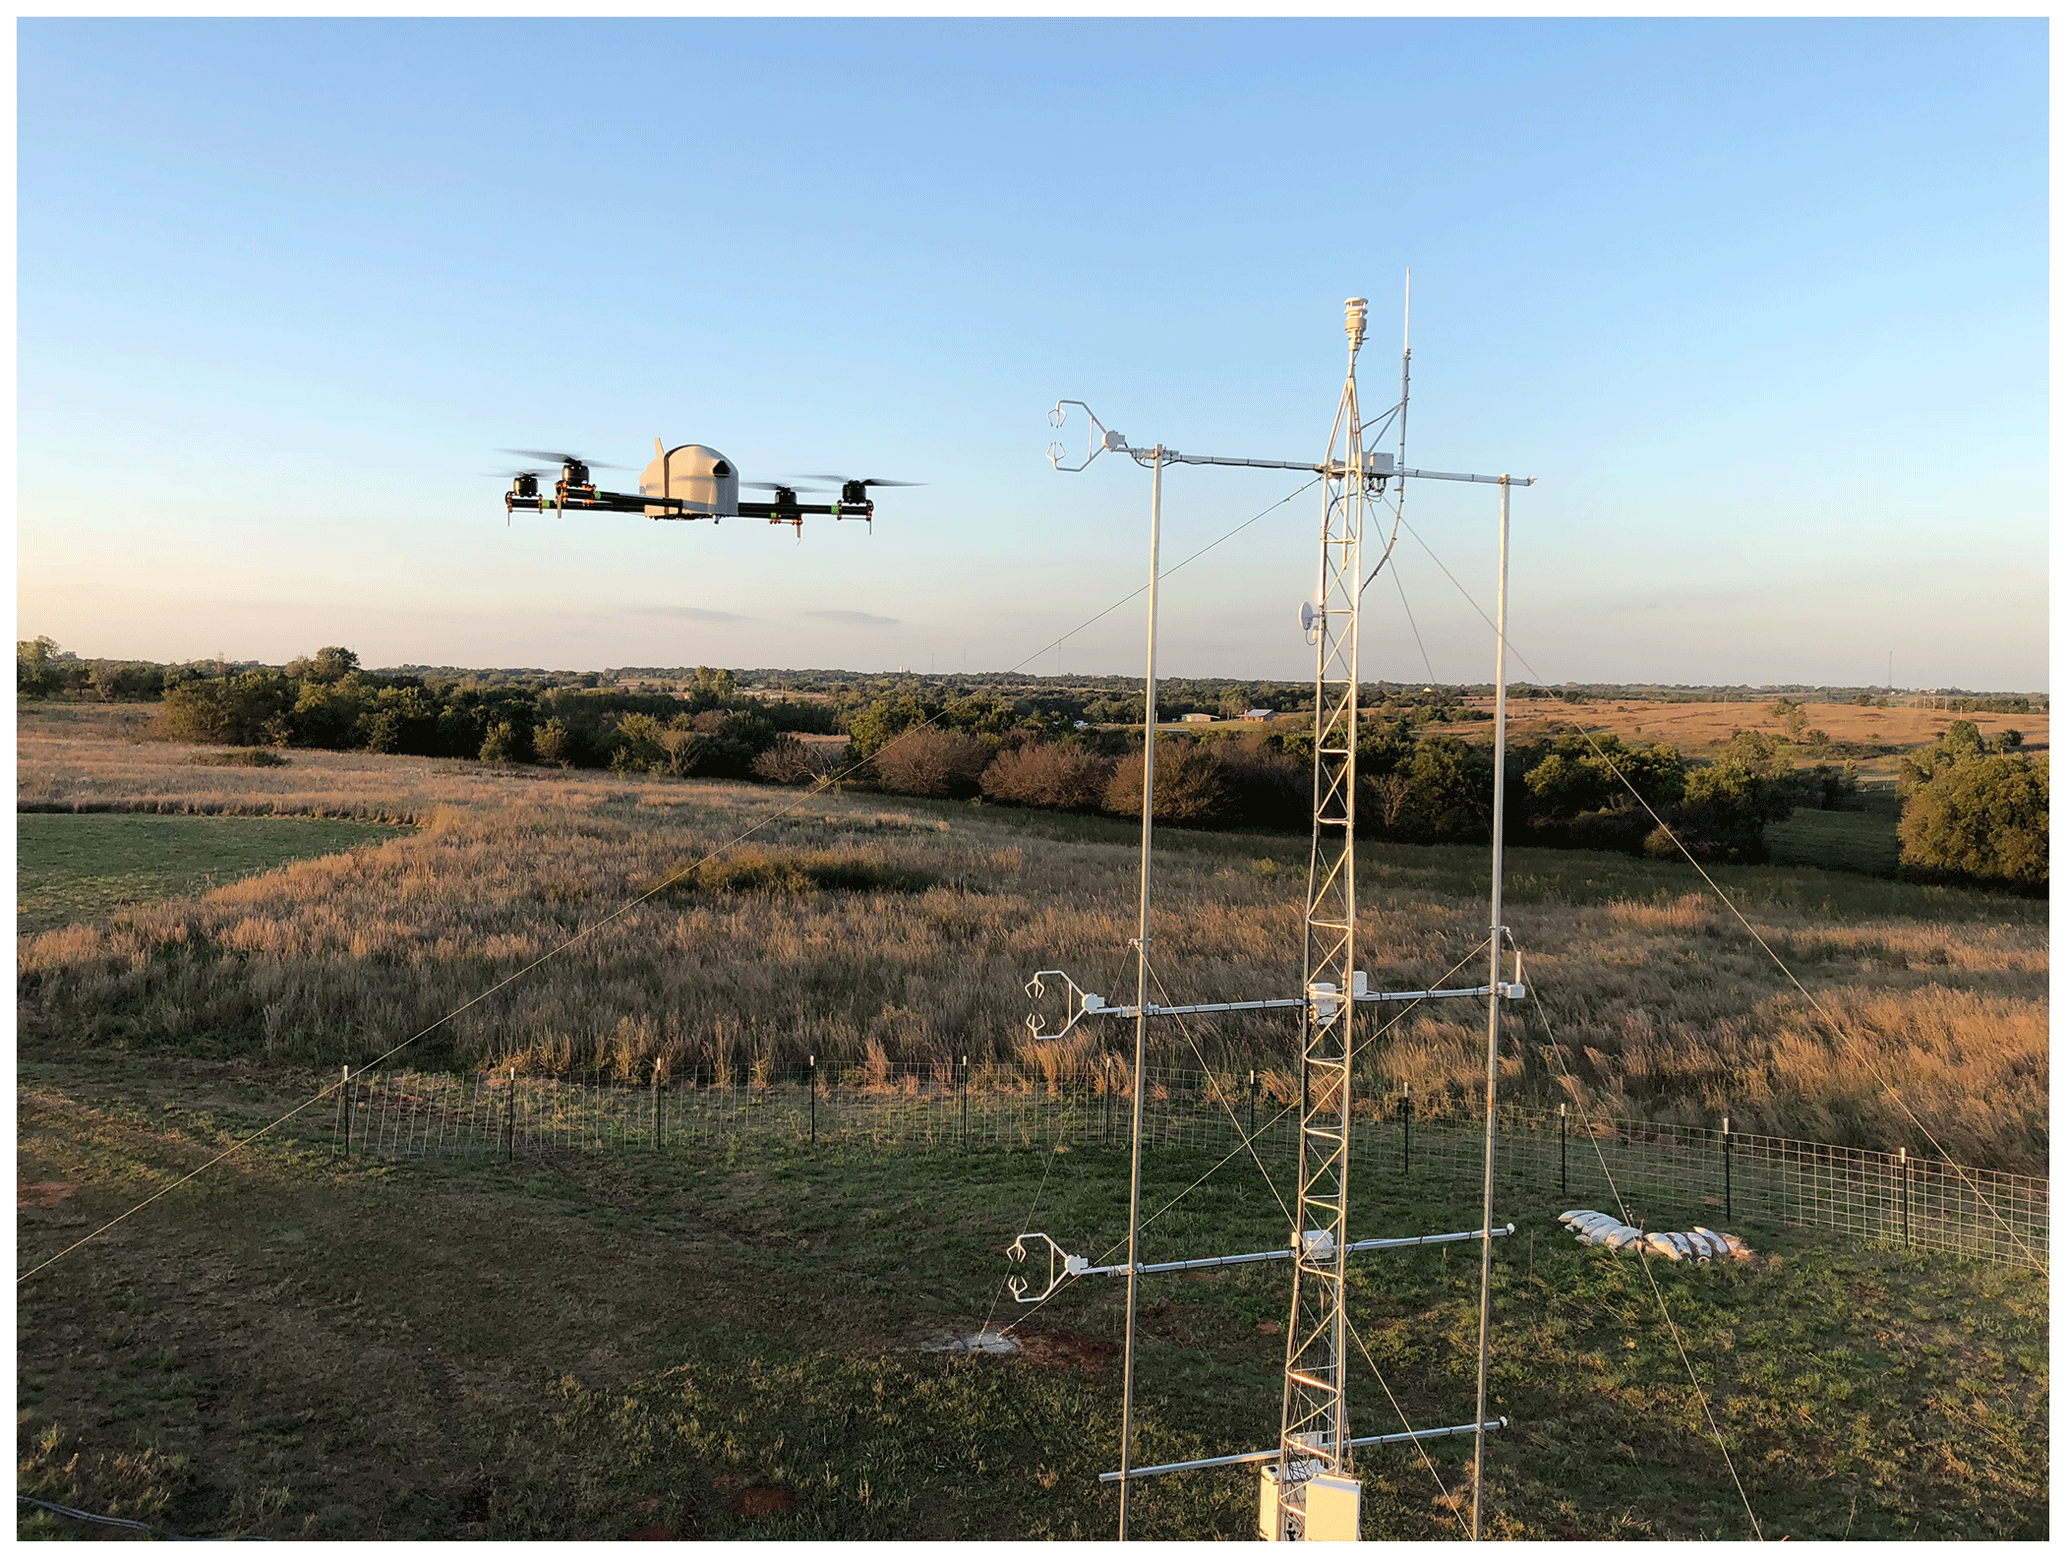
Figure 1Photograph of the OU CopterSonde RPAS (Norman, OK, USA) in flight next to an experimental 10 m flux tower.
Table 1Technical specifications of the OU CopterSonde.

a Under favorable weather conditions with low winds. b Tested temperatures; the range can be larger than stated.
Table 2Description of the thermodynamic and kinematic parameters available in each CopterSonde data file. Also includes information on the method with which each parameter was measured along with their relative accuracies based on Bell et al. (2020a) compared to Vaisala RS92-SGP radiosondes.
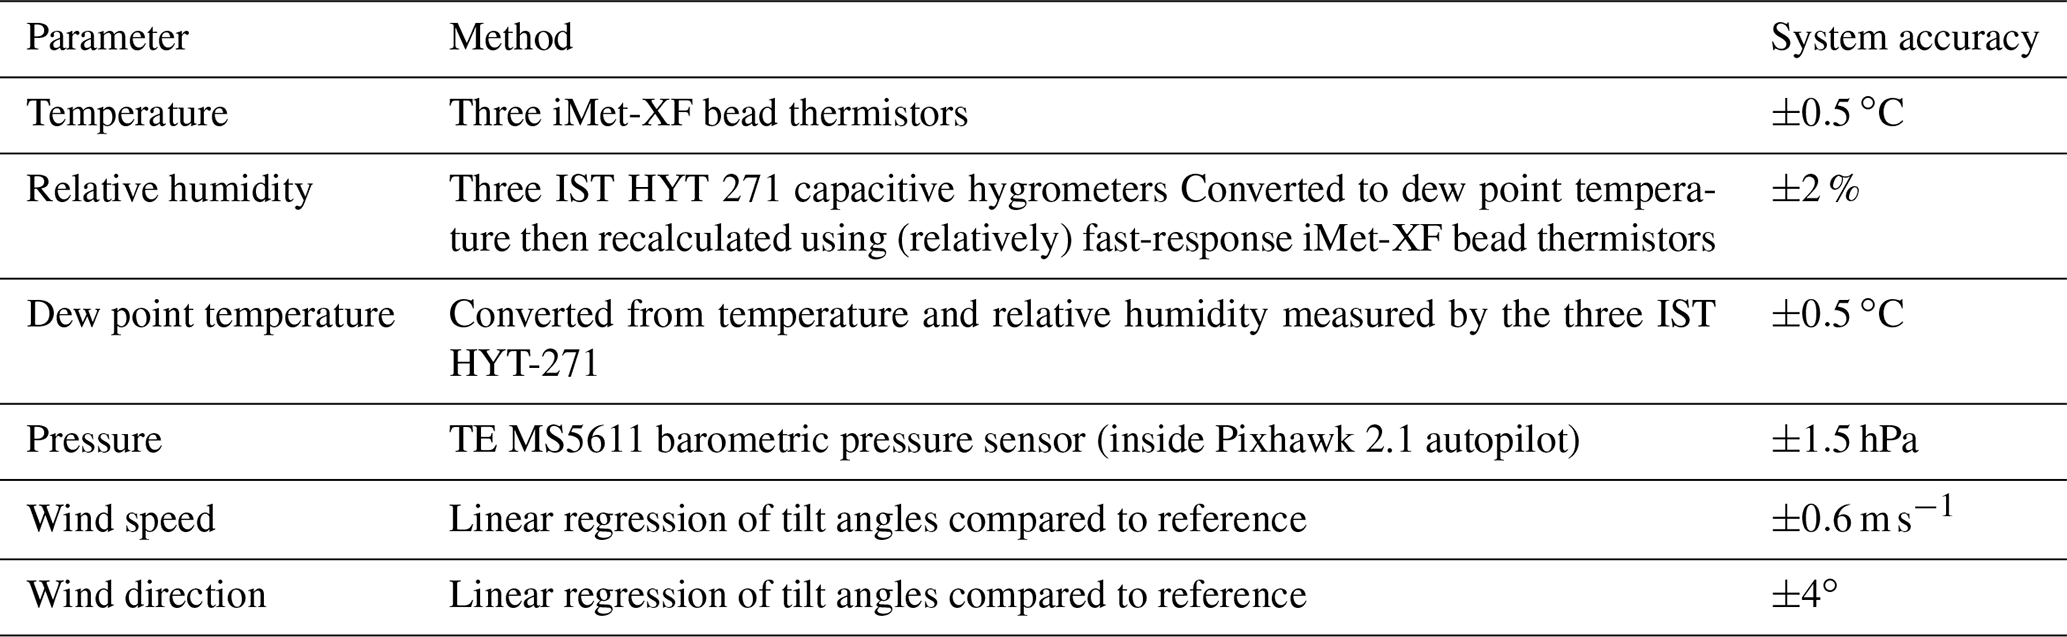
The CopterSonde is outfitted with sensors that enable it to measure atmospheric state variables as it ascends along its flight path (see Table 2 for details). The wind speed and wind direction were calculated at 10 Hz using the wind vane mode algorithm described in Segales et al. (2020a) which utilizes the roll, pitch, and yaw angles measured with the inertial measurement unit (IMU) on board the RPAS's autopilot system, the Pixhawk Cube Black. The pressure was measured at 10 Hz with a MS561 capacitive pressure sensor inside the Pixhawk Cube Black, which is also utilized for altitude. Atmospheric temperature was measured at 20 Hz with a fast-response bead thermistor (International Met Systems). Relative humidity was measured at 10 Hz using the HYT 271 capacitive humidity sensor (Innovative Sensor Technologies). As will be discussed later, data from the different sensors were interpolated or downsampled so that all observations have a common time vector. The temperature and humidity sensors were enclosed in a custom sensor scoop that was 3D printed out of polylactic acid (PLA). The sensors were located inside the tubular portion of an L-shaped duct and were mounted in an inverted V configuration. At the base of the duct was a smart fan that was programmed to aspirate the sensors at a rate of 12 m s−1 and was toggled on during ascent at a height of 1.85 m a.g.l. and off during descent at a height of 1.45 m a.g.l. to prevent dust and debris from being pulled into the scoop. Each scoop was distinguished utilizing an identification code and calibrated prior to the field campaign using the procedure outlined in Greene et al. (2019). Further information regarding considerations for sensor placement, aspiration, and shielding on the CopterSonde can be found in Greene et al. (2018, 2019). More on the data quality and statistical performances will be discussed in Sect. 3.
2.2 Flight strategies
The LAPSE-RATE campaign featured five unique scientific objectives: morning atmospheric boundary layer transitions, aerosol properties, valley drainage flows, deep convection initiation, and atmospheric turbulence profiling. Each evening, the individual LAPSE-RATE teams would gather for a weather briefing and discuss which objectives would be the most advantageous to target based on forecasts prepared by NCAR scientists. Teams would then distribute themselves across the San Luis Valley to best sample the phenomena of interest. For more detailed information about the overall campaign goals, science objectives, and synoptic and mesoscale conditions driving the selection of objectives, please see the LAPSE-RATE overview article in this special issue (de Boer et al., 2020b).
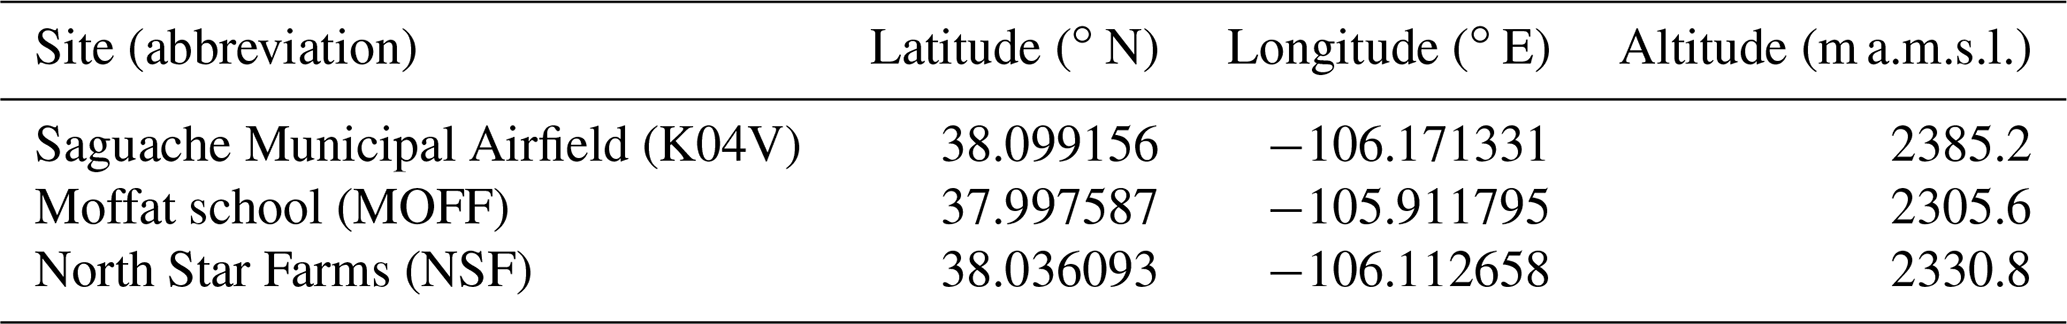
The CopterSonde was deployed at three different locations across the San Luis Valley in support of LAPSE-RATE scientific objectives. These locations were Saguache Municipal Airport (K04V), Moffat consolidated school (MOFF), and the southern edge of North Star Farms (NSF). Latitude and longitudes of these deployment locations as well as their altitude above mean sea level (m a.m.s.l.) are summarized in Table 3. A visual representation of these locations with respect to the layout of the valley is provided in Fig. 2, with the inset focusing on the layout of the multiple assets operating at MOFF. The MOFF and NSF sites were both located in the central portion of the valley whereas K04V was situated in a narrowing section of the valley with steeper valley walls to the northwest of NSF. K04V and MOFF were dominated by scrubland while NSF was primarily comprised of irrigated cropland.
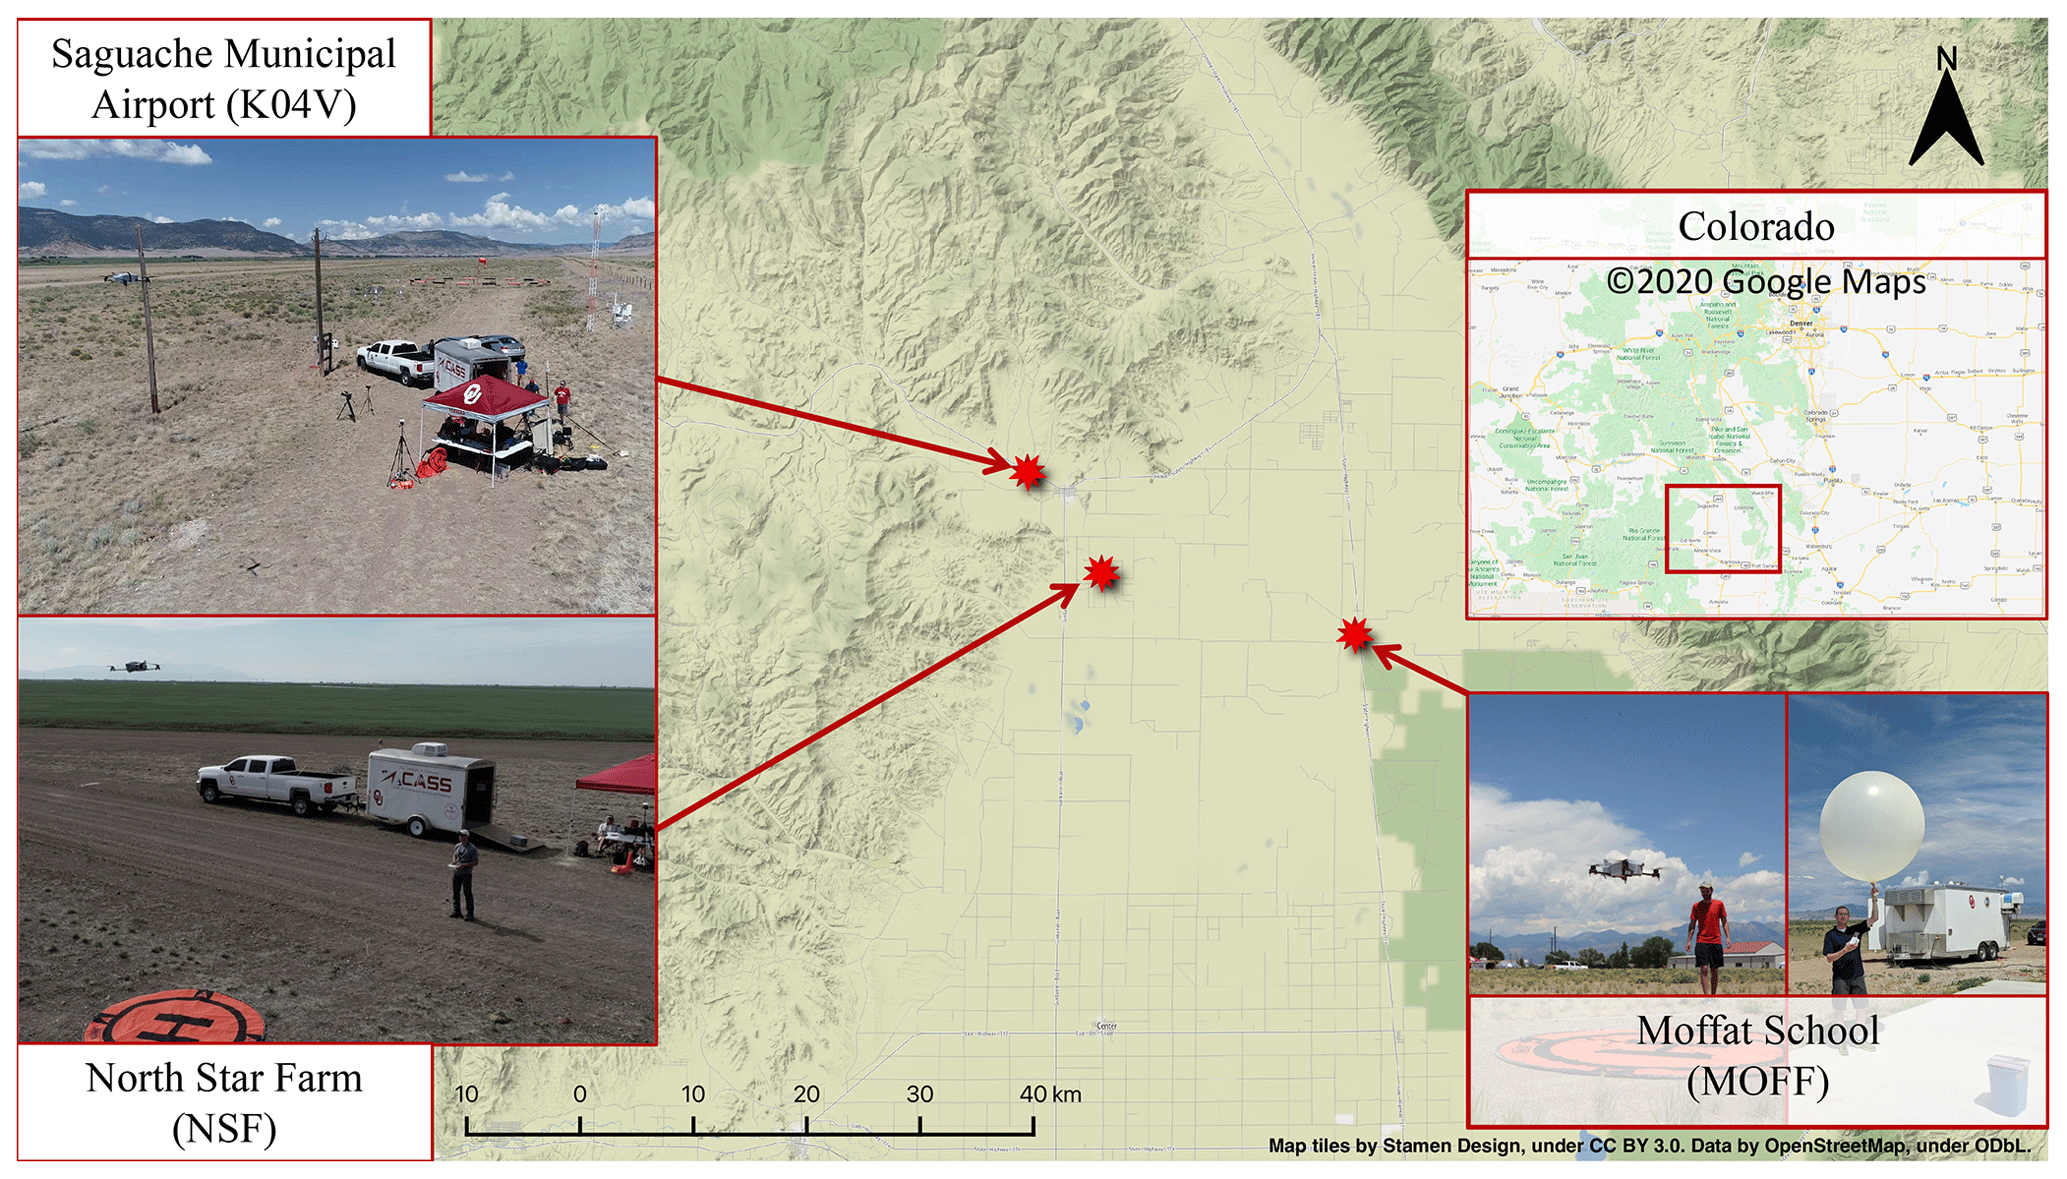
Figure 2Map of the San Luis Valley in south-central Colorado (data © 2020 OpenStreetMap), with CASS deployment locations denoted by the red stars. Inset images beginning from the top left and moving counterclockwise: Saguache Municipal Airport (K04V, photo credit William Doyle), North Star Farms (NSF, photo credit William Doyle), Moffat school (MOFF, photo credit Tyler Bell), and a map of the state of Colorado with the San Luis Valley outlined in red (courtesy © Google Maps, 2020).
OU deployed a team daily to MOFF regardless of objective due to the colocation of the Collaborative Lower Atmosphere Mobile Profiling Station (CLAMPS) at the site. Not only did this create a local supersite in the central region of the valley, it also facilitated the intercomparison of the RPAS with more conventional instrumentation such as radiosondes, atmospheric emitted radiance interferometer (AERI), microwave radiometer (MWR), and Doppler lidar (Bell et al., 2020a; Wagner et al., 2019). A second OU team was deployed to one of three locations depending on the daily objective. For the convection initiation (CI) and boundary layer transition (BLT) study days, the second team set up at K04V. For the cold air drainage study, the team deployed to NSF. Across all three sites, 180 successful flights were completed in support of LAPSE-RATE. Details regarding the number of flights per day, daily science objectives, start and stop times, and specific vehicles used are summarized in Table 4.
Table 4Summary of flights for each day broken down by aircraft and location. Local time during the campaign was mountain daylight time (UTC−6).

All flights completed by OU as a part of LAPSE-RATE were conducted either under Federal Aviation Authority (FAA) Part 107 regulations or under the Oklahoma State University's FAA Certificate of Authority (COA) 2018-WSA-1542 effective from 13–22 July 2018. This COA permitted daytime operations of small RPASs weighing less than 25 kg (55 lb) at speeds less than 45 m s−1 (87 kt) in Class E and G airspace below 914 m a.g.l. and not exceeding 3657 m a.m.s.l. in the vicinity of Alamosa County, CO, under the jurisdiction of the Denver Air Route Traffic Control Center (ARTCC). Typical COA provisions for airworthiness, operations, safety protocols, Notices to Airmen (NOTAMs), reporting, and registration were applied; however, special provisions were necessary for the coordination and deconfliction of the myriad of teams participating in flight operations as part of LAPSE-RATE. Instead of requiring each individual team to submit NOTAMs, discussions between LAPSE-RATE participants, the FAA, and Denver ARTCC led to the definition of a common area of operations that could cover the entirety of the planned LAPSE-RATE observations. Additional deconfliction was also necessary with nearby airports, military training routes (MTRs), or other restricted airspaces such as the Great Sand Dunes National Park. Within this area, two NOTAM subareas were defined so that the most appropriate areas could be activated with the necessary 24 h notice based on the next day's scientific objectives. Emergency procedures for lost links, radio communications, and other potential anomalies also had special provisions due to the number of teams operating in proximity to each other. In addition to the COA provisions, each OU operations area was overseen by a licensed private pilot who assisted with overseeing the airspace and deconflicting RPAS operations from general aviation traffic.
CopterSonde missions were programmed to fly a vertical ascent from the surface to 914 m a.g.l., utilizing the platform's wind vane mode to continuously orient itself into the wind. This permitted the RPAS to sample the vertical structure of pressure, temperature, humidity, wind speed, and wind direction in a controlled and repeatable manner that minimized influences from the platform itself (Segales et al., 2020a). These flights will be referred to as profiles in subsequent text and tables. These profiles consisted of an automatic takeoff, vertical ascent at a rate of 3.5 m s−1, loiter for 10 s at the apex of the ascent, and controlled descent to 10 m at a rate of 6 m s−1. Once the platform completed its descent, it would be brought in for a landing manually. Only the ascent portion of these vertical profiles is considered for analysis. The reason for this is two-fold: (1) increasing the rate of descent allows for the platform to reach higher maximum altitudes by increasing the amount of time the platform can spend ascending, and (2) a slower rate of ascent maximizes the vertical resolution of the profile. This allows us to maximize the performance of the CopterSonde for vertical profiles without altering the battery configuration. Data on the descending leg are discarded because errors can be introduced into the kinematic measurements by the platform descending through its own rotorwash and the rates of descent are often too fast for the thermodynamic sensors to accurately sample with the same resolution as on the ascent.
Profiles were conducted on a 15 or 30 min cadence depending on the day's primary scientific objective and how rapidly the thermodynamic and kinematic parameters of the ABL were evolving. As the CopterSonde was collocated with CLAMPS at MOFF, RPAS profiles would often coincide with radiosonde launches. When this would occur, the RPAS launch would be held until the balloon cleared the airspace (about 60 s), and then would proceed as normal.
The data collected by the CopterSonde instruments were processed and quality controlled by CASS after the conclusion of the LAPSE-RATE campaign. The CopterSondes' Pixhawk autopilot system outputs and stores a binary file on an onboard SD card during each flight, which includes logs of the aircraft's attitude angles, GPS positions, accelerations, and readings from the three temperature and three relative humidity sensors. In this format, the data are equivalent to the United States Department of Energy (DoE) Atmospheric Radiation Measurement (ARM) program's data archive “a0” level. Because the sensors log at different rates to the SD card, the binary files were converted to JavaScript Object Notation (JSON), format and relevant data parameters were interpolated/downsampled to a common 10 Hz time vector in comma-separated value (CSV) format (a1 level). The JSON file format allows for the varying sampling rates for each data stream to coexist in the same file, whereas the conversion to CSV with a common time vector markedly simplifies reading and processing the data at this stage. More information about how the CopterSonde fuses sensor readings with autopilot features can be found in Segales et al. (2020a), and the autopilot code is freely available at Segales et al. (2020b).
After converting the raw binary flight log files to CSV format, offsets for each temperature and relative humidity sensor were applied. These offsets were determined in the manner described by Greene et al. (2019) and Segales et al. (2020a), which involved isolating the CopterSondes' front L-duct sensor payloads in an environmentally controlled chamber operated by the Oklahoma Mesonet with National Institutes of Standards and Technology (NIST) traceable sensors as references. Furthermore, at this stage, the CopterSonde attitude angles were averaged to estimate the horizontal wind speed and direction using linear regression coefficients determined by hovering next to Oklahoma Mesonet towers as a reference. This process is outlined in Greene (2018) and Segales et al. (2020a) (based on Neumann and Bartholmai, 2015; Palomaki et al., 2017).
Once the thermodynamic and kinematic calibrations were accounted for, the post-processing algorithm objectively determined the window of time for evaluation. This was chosen to be between 6 m a.g.l. and the maximum point of the direct vertical profile (typically 914 m a.g.l. during LAPSE-RATE) on the ascending portion only, averaged to 3 m bins as estimated by the Pixhawk autopilot's barometer and GPS sensors (Segales et al., 2020a). These criteria were chosen for several reasons, primarily to do with the relationships between ascent rate and sensor response time. Data averaging began at 6 m so as to avoid any possible contamination due to propeller wash interacting with the ground. Furthermore, the physics behind the method of estimating horizontal wind speeds are not the same given the body forcings on a descending rotary-wing RPAS. Finally, the 3 m averaging interval was chosen under consideration of the average ascent rate (3.5 m s−1) and an approximate time constant of the sensor payload of 2 s. This time constant is based upon experiments during the ISOBAR18 campaign with an older version of the CopterSonde and identical sensors (Kral et al., 2020; Greene et al., 2021), where the aircraft was subjected to a series of quasi-step-function inputs between a sauna and the below-freezing environment of Hailuoto, Finland. The averaging interval of 3 m is therefore approximately double the vertical resolution as predicted by the response time and ascent rate, so further studies will be needed to elucidate the impacts of these decisions.
Because the CopterSondes were outfitted with three temperature and three RH sensors each, it was necessary to inspect each of their time-series outputs with respect to one another to determine potential outliers. Although an objective method of doing so is ideal, research into this is still ongoing, and thus we chose to subjectively analyze each sensor individually. A given sensor was omitted from further consideration if it did not correlate with the other sensors and/or there was a large bias between them (greater than 0.5 ∘C). All remaining sensor data were averaged together to yield a single measurement of temperature and relative humidity at each 3 m altitude interval. With an average ascent rate of 3.5 m s−1 and a 10 Hz sampling rate, this corresponds to eight to nine samples per sensor per altitude averaging bin. These post-processed ascent profiles were then exported in netCDF format (b1 level) that contains self-describing metadata including, for example, the specific aircraft and flight description (such as the information in Tables 3 and 4). The thermodynamic and kinematic measurements included in these files are outlined in Table 2.
In an effort to quantify the CopterSonde thermodynamic and kinematic observational biases relative to a ubiquitous standard, Bell et al. (2020a) compared vertical profile CopterSonde flights from LAPSE-RATE and in Oklahoma to collocated Vaisala RS92-SGP radiosondes. While unable to explicitly account for factors such as horizontal heterogeneity, the sample ranges in temperature, dew point temperature, and horizontal winds were large enough to determine baseline accuracies in each (Table 2). Namely, CopterSonde temperatures were within 0.5 ∘C of the radiosondes in the aggregate, which is largely due in part to the considerations taken for temperature sensor placement onboard the CopterSonde (Greene et al., 2018, 2019). Additionally, a broad intercomparison effort during the LAPSE-RATE campaign (Barbieri et al., 2019) resulted in similar statistics when comparing the CopterSonde observations to a common mobile meteorological reference.
4.1 Convective initiation – 15 July 2018
The environment on the morning of 15 July 2018 was rich in moisture with decreasing stability as the day progressed. This made for good conditions to target pre-convective measurements. The low wind shear and weak synoptic flow were conducive for isolated CI. This aided in spatially discerning precursors to CI. Two CASS teams were stationed at K04V and MOFF, approximately 18 km apart, with aircraft OU946 and OU955, respectively. Both teams began flying at 14:00 UTC (09:00 MDT). The team at K04V flew profiles every 30 min until 18:30 UTC (13:30 MDT). The team at MOFF had profiles every 15 min until 19:45 UTC (14:45 MDT). The cadence was reduced to 30 min once the ABL had become mixed at 15:00 UTC (10:00 MDT). At 18:30 UTC (13:30 MDT), there was convection in the vicinity, and flight cadence was increased to 15 min at both sites. The maximum flight height for both teams was 914 m. Figure 3a and b show differences in how moisture and temperature evolve with time at each site. Figure 3a shows specific humidity increasing at K04V with time but decreasing at MOFF (Fig. 3b). Evaporation of additional moisture over MOFF slowed daytime heating. Although both sites had similar temperature fields, Fig. 3a shows the temperature increasing faster with time. Since K04V was slightly drier, this led to faster destabilization and possibly preferential CI. Figure 3a also shows cooler temperatures below 300 m at 18:00 UTC. At 100 m, K04V is 2 ∘C cooler than at MOFF. This may have been caused by outflow from a nearby storm. Even though the sites were not very far apart, there is a difference in the evolution of specific humidity. More cases would need to be analyzed to determine if this could have implicated the location of CI. Further analysis of the evolution of low-level buoyancy preceding this case is conducted in Lappin et al. (2021). Previously, buoyancy has been used as a bulk stability parameter to determine storm severity (Zhang and Klein, 2010; Trier et al., 2014). This study looks into using buoyancy as a prognostic variable sensitive in time and space. It aims to discern local differences in ABL evolution in convective environments and further understanding of CI.
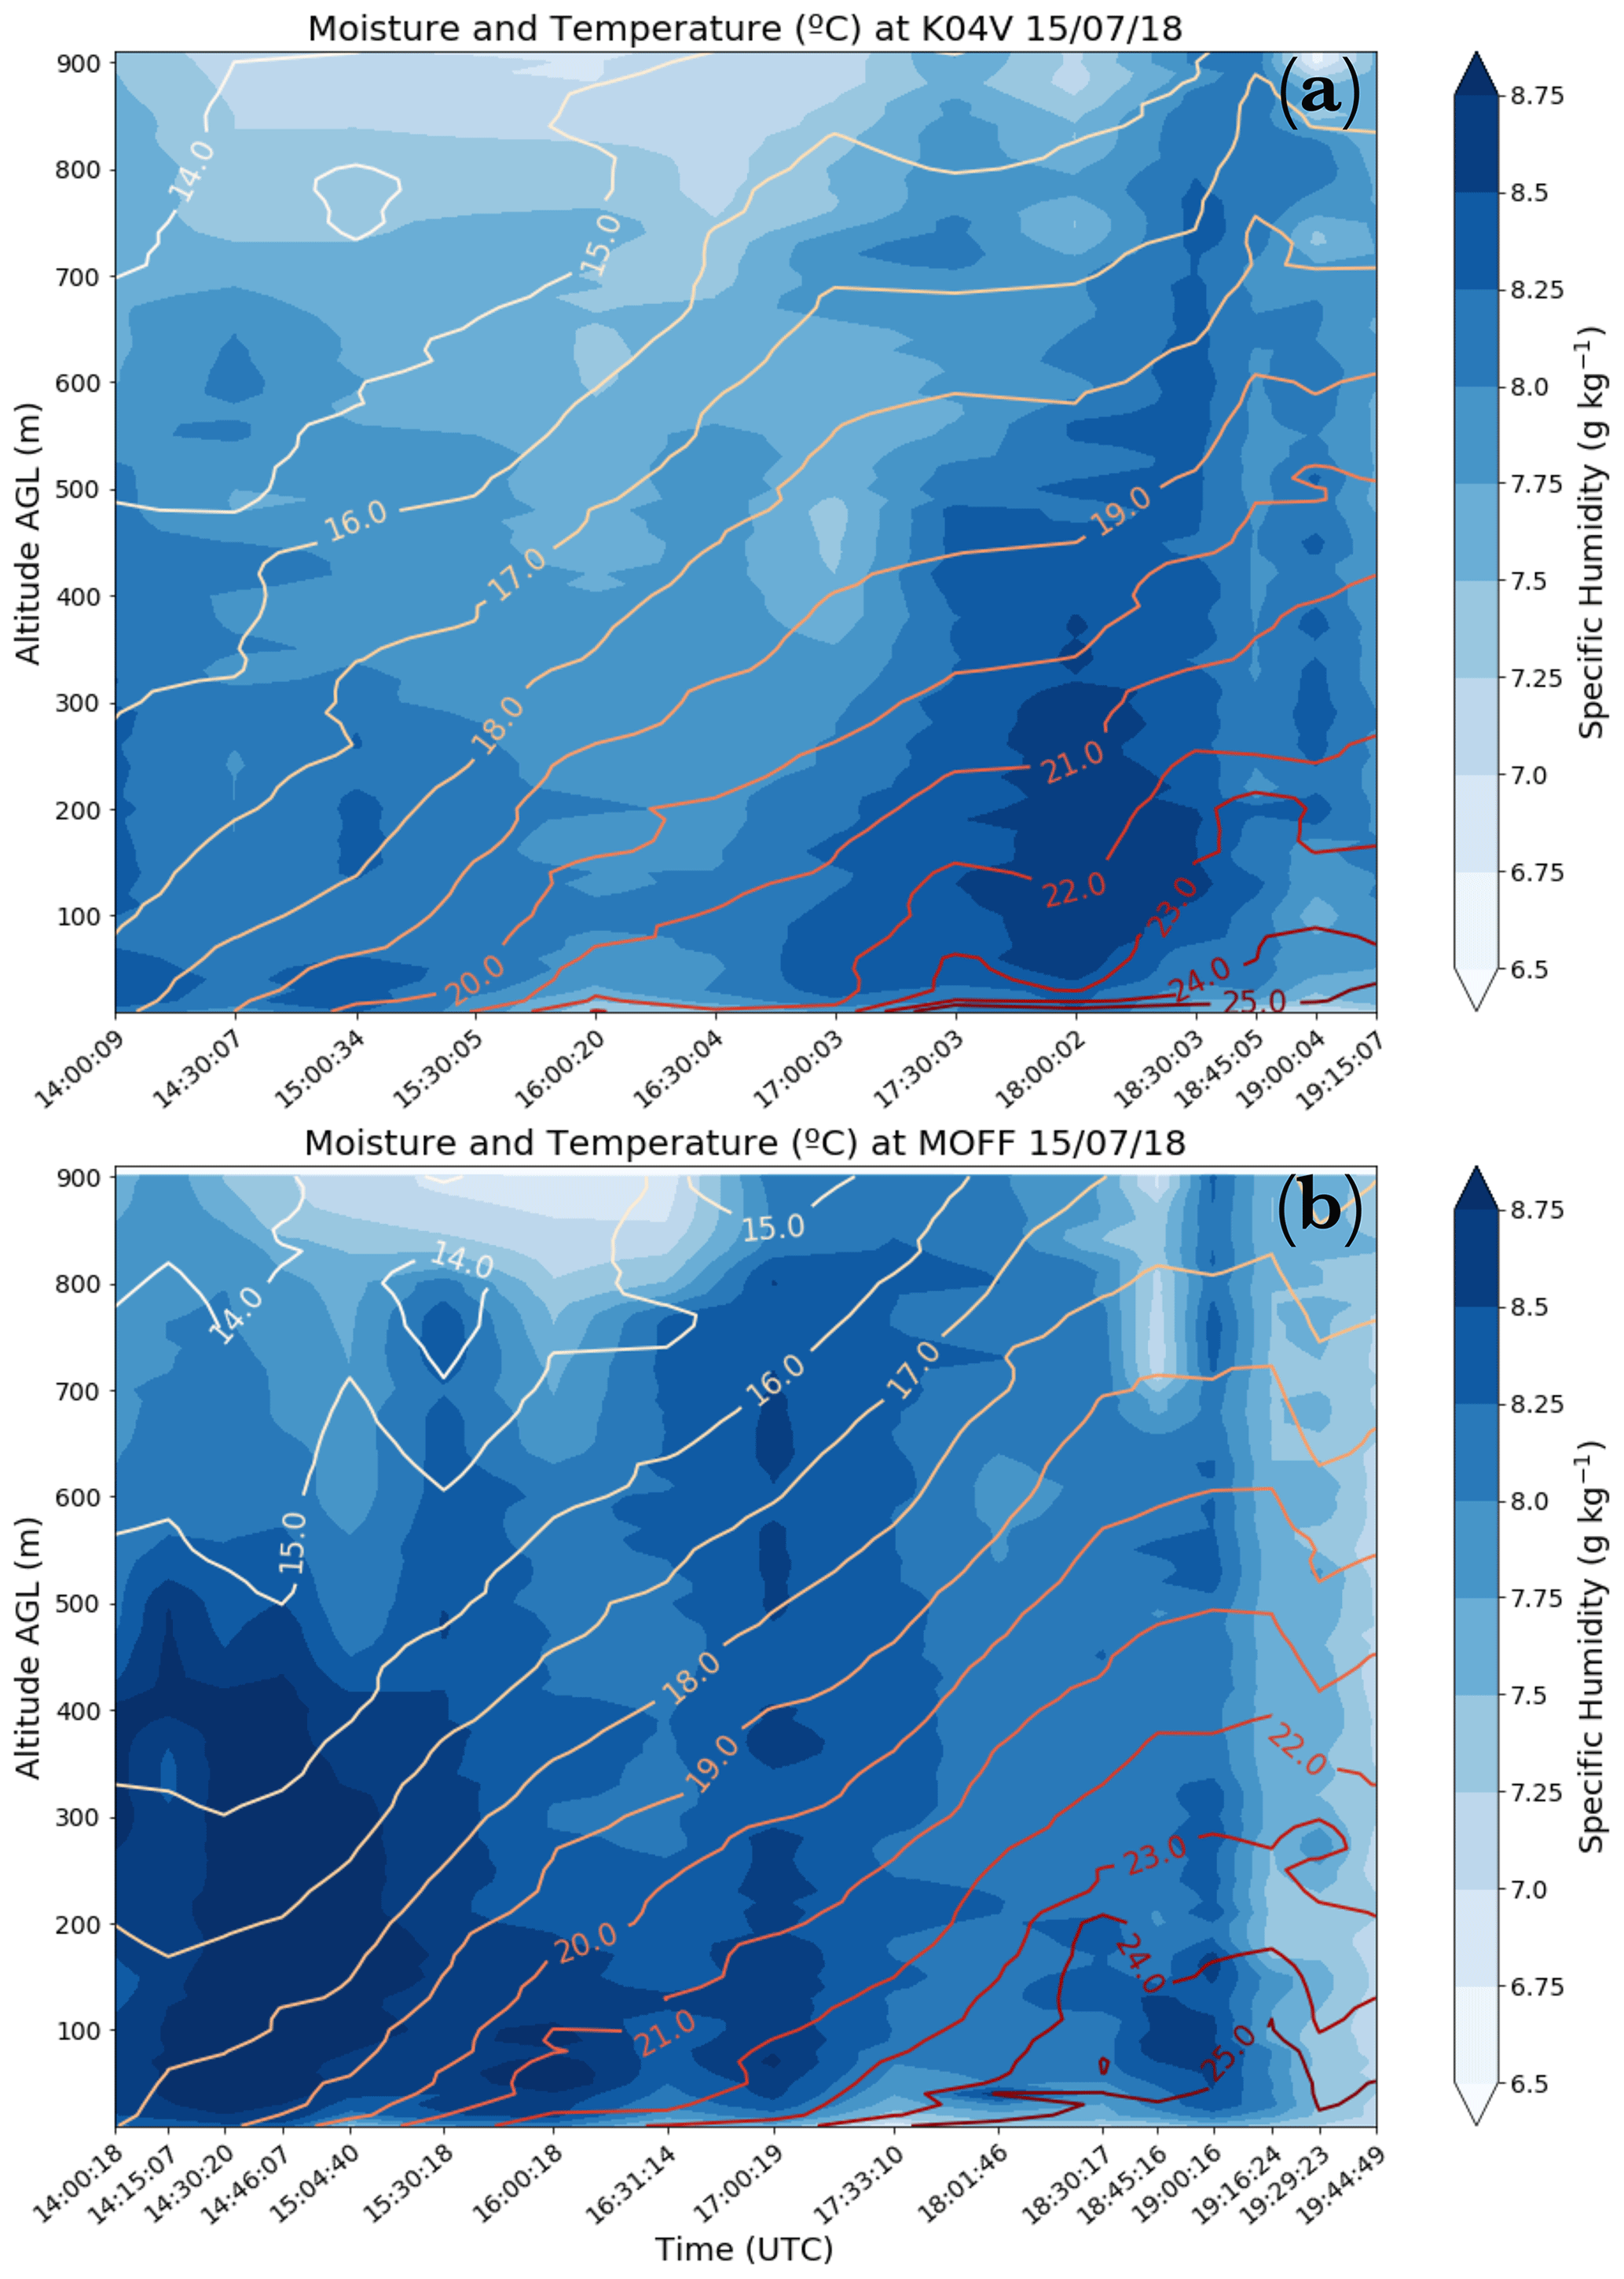
Figure 3Time–height cross-section view of moisture and temperature measurements on 15 July 2018. (a) K04V site. (b) MOFF site. This day experienced deep convection. Each time tick indicates a flight. The shaded field is specific humidity (g kg−1). Contours are temperature (∘C). Values are interpolated through time at each level between successive flights.
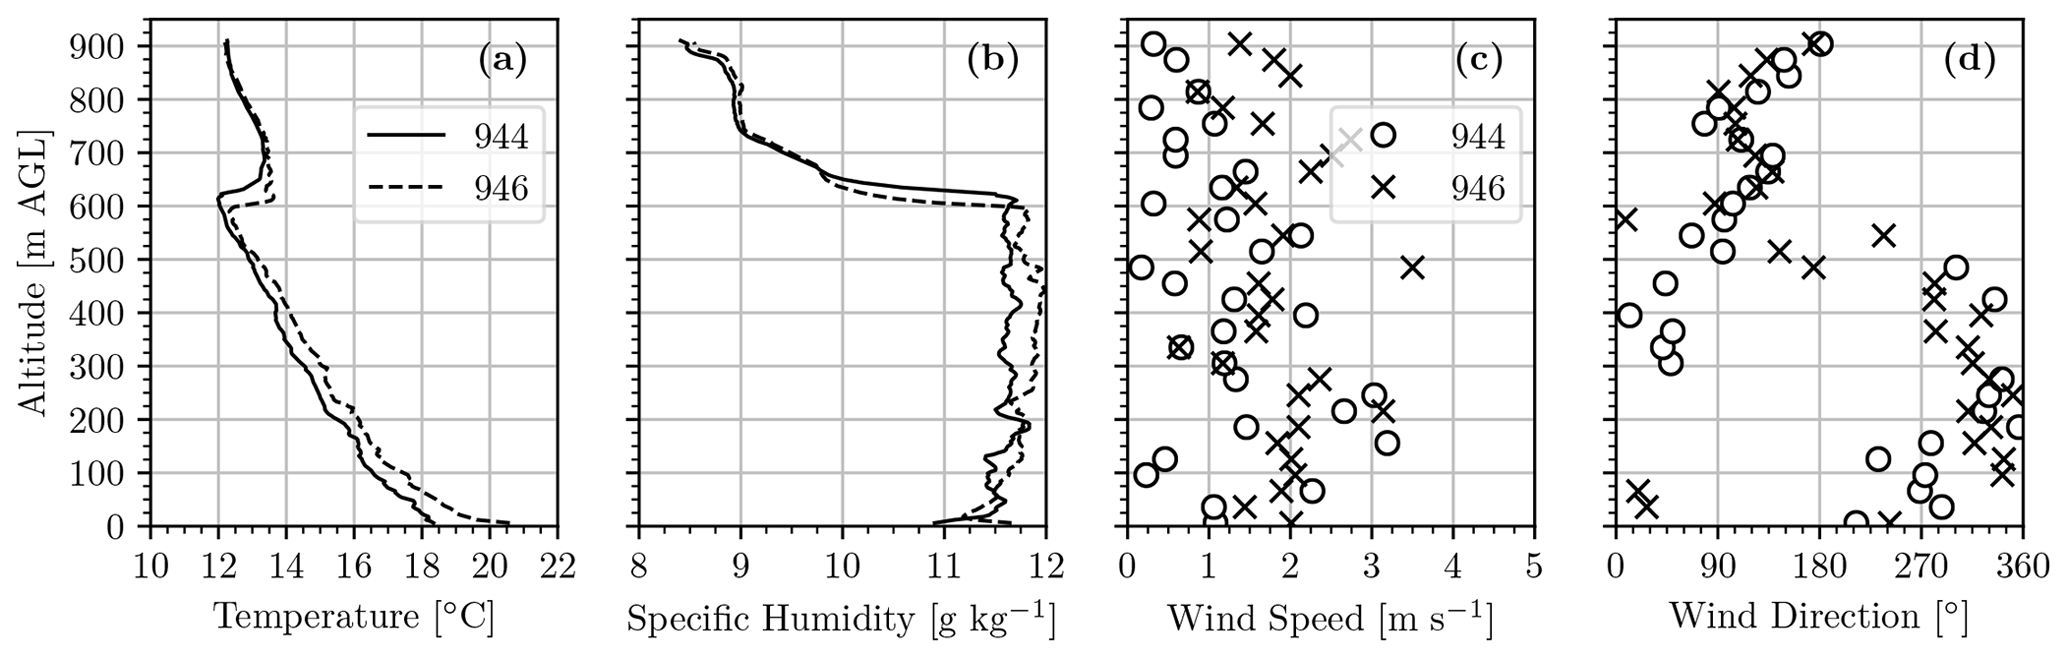
Figure 4Comparisons of two CopterSonde flights launched simultaneously at 16:02:55 UTC at MOFF on 17 July 2018. Shown here are (a) temperature (∘C), (b) specific humidity (g kg−1), (c) horizontal wind speed (m s−1), and (d) horizontal wind direction (degrees) versus altitude above ground level (a.g.l.). Note that all data are included in (a) and (b), but data are subsampled at every eight points in (c) and (d) for clarity. In (a) and (b) the solid and dashed black lines (open circles and Xs) represent the OU944 and OU946 aircraft, respectively. Wind speed and direction in general throughout the campaign were considerably variable in time and space.
4.2 CASS test flights – 17 July 2018
The LAPSE-RATE participants collectively decided for 17 July 2018 to be utilized for individual group research objectives, and so both mobile CASS teams decided to combine at the MOFF site for intercomparison flights between the CopterSondes and against CLAMPS. Between OU944 and OU946, 14 total vertical profile flights were conducted throughout the afternoon, eight of which were simultaneous for direct comparisons across platforms (Table 4). Several of these flights were also accompanied by radiosonde launches directly before the vertical profiles, which were included along with the CLAMPS AERI and Doppler lidar observations in the comparison study by Bell et al. (2020a). The LAPSE-RATE ground-based remote sensing data are outlined by Bell et al. (2020b). During these flights, the pair of CopterSondes flew about 10–20 m apart horizontally, and were also displaced about 50 m from the radiosonde launch site. An example of a direct comparison between OU944 and OU946 on the afternoon of 17 July (Fig. 4) shows that both aircraft observed similar thermodynamic features with a well-mixed, dry adiabatic atmosphere up to around 600 m a.g.l., above which it is notably drier and warmer than the ABL below. Although the general profile shapes and inversion magnitudes are consistent across the platforms, a bias in temperature is apparent in particular in the lowest 100 m. These discrepancies in the temperatures between the two identical platforms can likely be attributed to three main sources: (1) sunlight on an inadequately shielded sensor (discussed in Greene et al., 2019) at the correct relative angles of aircraft heading and sun zenith–azimuth; (2) natural variability in the atmosphere: the two aircraft were 10—20 m apart, so this is not entirely unreasonable for a convective boundary layer; and/or (3) systemic bias related to calibration of the CopterSonde thermodynamic sensor package as a whole. While a combination of these three is the most likely explanation, we believe the spatial–temporal heterogeneity of the atmosphere during these observations should not be overlooked. For example, 3 s sonic anemometer temperatures from Bailey et al. (2020) reveal that during the 10 min timeframe during these concurrent CopterSonde profiles (albeit at a different site but featuring similar land cover properties), 2 m temperatures fluctuated by up to 4 ∘C. Doppler-lidar-observed vertical velocities collocated with the CopterSondes (Bell et al., 2020a, b) also indicate roughly 3 m s−1 updrafts at the same time as the profiles in Fig. 4. Turbulent transport of temperature therefore likely contributed to large spatial and temporal heterogeneity that can be detectable at the 10–20 m separation scales in this particular comparison flight.
Moreover, the horizontal winds throughout the depth of the atmosphere were weak and variable during these profiles, but observations from both aircraft demonstrate reasonable agreement (Fig. 4c). As discussed previously, the CopterSonde estimates horizontal wind speeds and directions based on a second-order least-squares regression fit between the aircraft's tilt angle into the wind (calculated from three-dimensional Euler rotation matrices) and an Oklahoma Mesonet 10 m wind reference (Greene, 2018; Segales et al., 2020a). As more sophisticated autopilot-based adaptive wind estimation techniques become available, future studies should leverage this particular dataset along with other ground-based sensors (Bell et al., 2020b) or large-eddy simulations (Pinto et al., 2020) to examine the effects of spatial and temporal heterogeneity on instruments located less than 100 m apart. For a more detailed perspective on the relative accuracy and precision of this dataset, readers are again referred to Barbieri et al. (2019) and Bell et al. (2020a).
4.3 Boundary layer transition – 18 July 2018
The morning of 18 July 2018 featured weak ambient synoptic-scale weather conditions and clear skies throughout the valley that enabled targeted measurements of the diurnal ABL transition. On this day, the two CASS teams were situated at the K04V and MOFF sites, with operations taking place from 12:30–19:45 UTC (06:30–13:45 MDT; Table 4). At both locations, vertical profiles to 914 m a.g.l. were flown once every 15 min for the majority of the day. This particular case exemplified a canonical morning ABL transition, marked by a surface-based temperature inversion with a residual layer apparent at the top beginning around 300 m at local sunrise, which occurred at 05:55 MDT (Fig. 5, vertical red dashed line). After the sun rose above the Rocky Mountains and flooded the valley with shortwave radiation, vertical mixing dominated the lowest levels of the ABL. A surface-based dry adiabatic layer became present around 14:15 UTC (Fig. 5, red rectangle) as the ABL grew in depth. Surface-based vertical mixing appears to dominate the surface layer for several hours this morning, as the atmosphere above 300 m remains at a relatively steady state for most of the early growth of the convective boundary layer. Entrainment-based heating of the growing ABL is also apparent by tracking the level of the strongest vertical potential temperature gradient through the morning (Fig. 5, red oval).
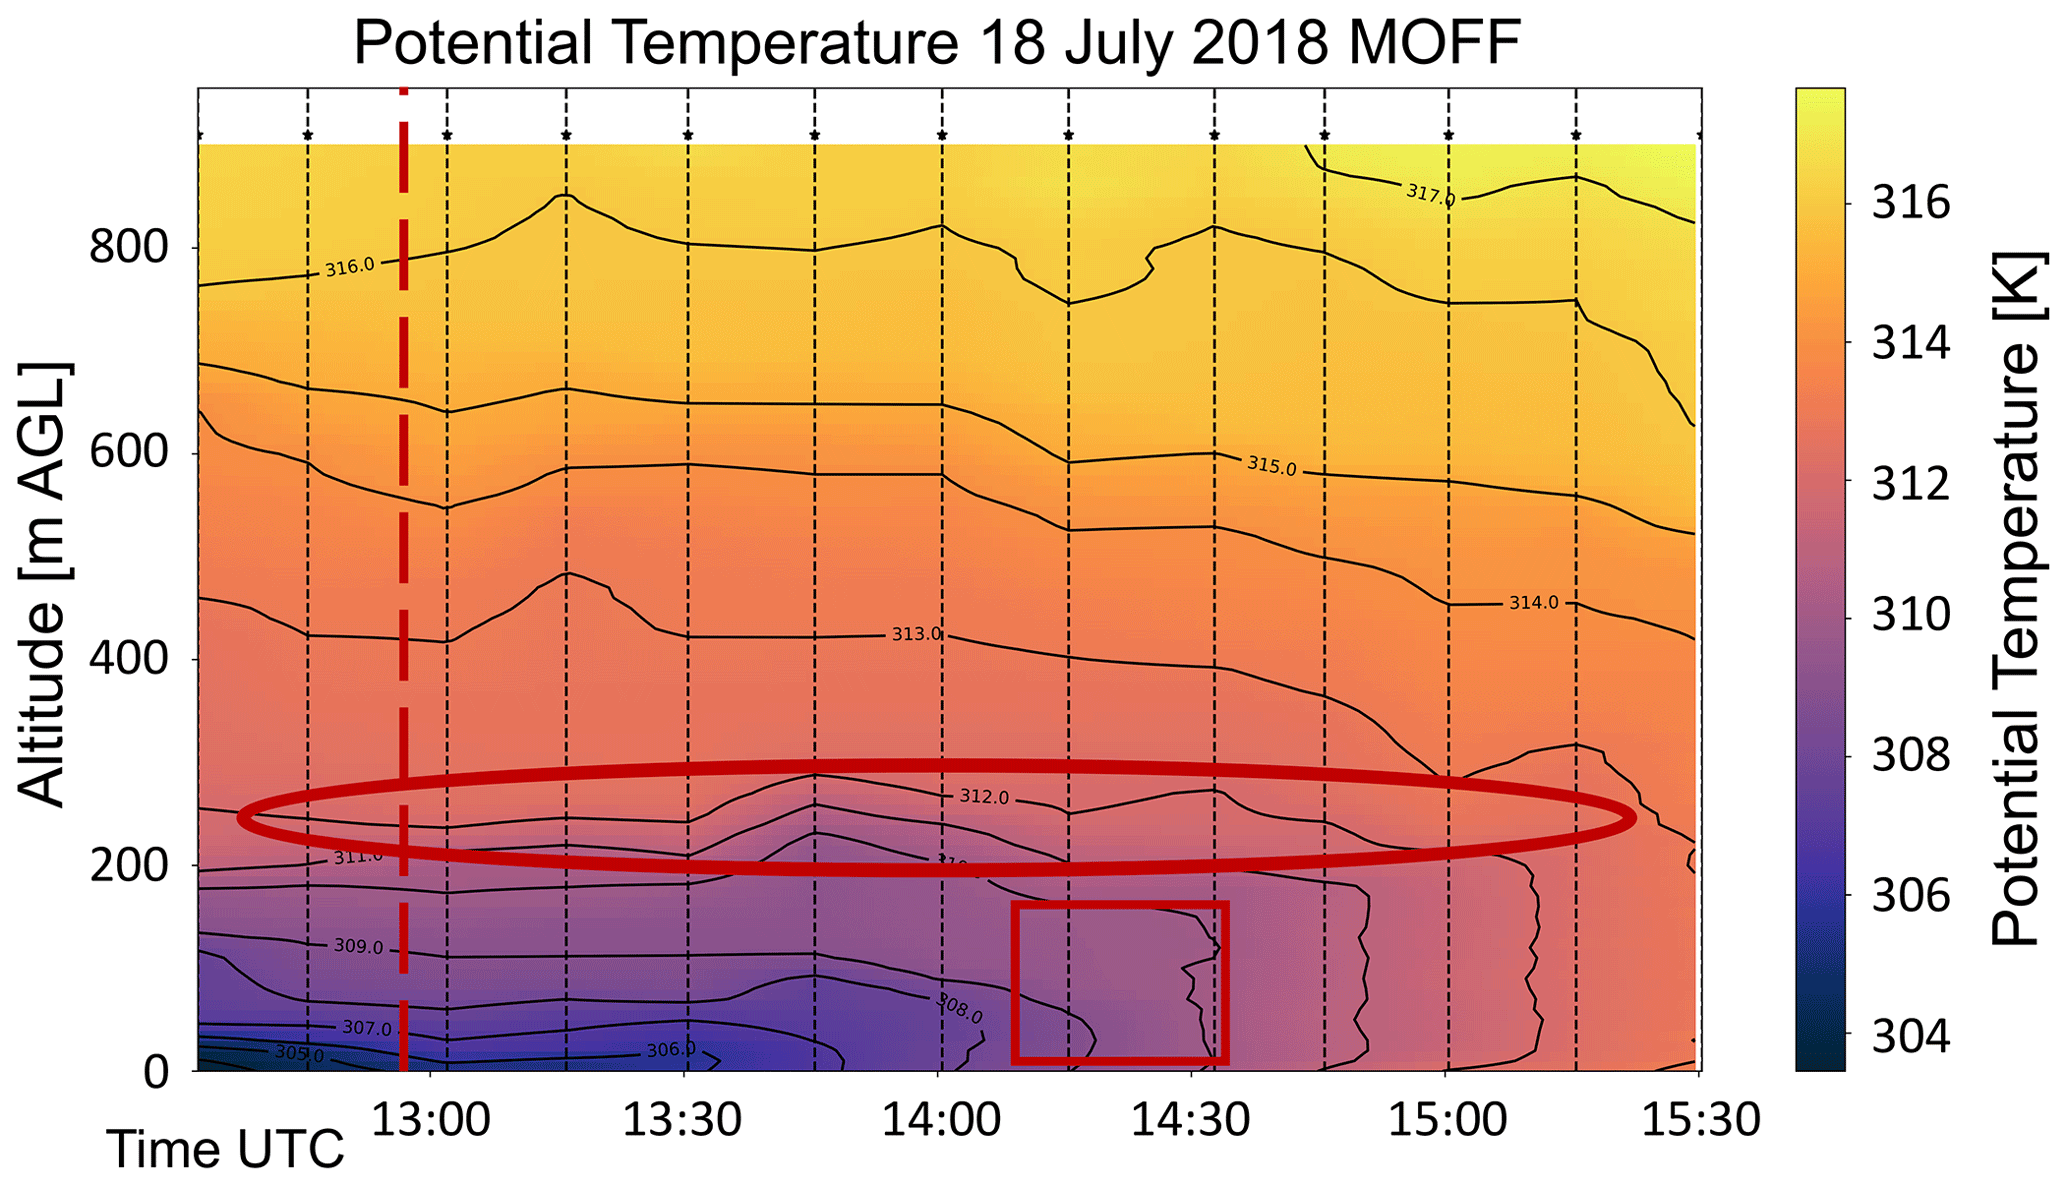
Figure 5Time–height cross-section view of CopterSonde potential temperature observations at MOFF on 18 July 2018. Shaded and contoured areas are potential temperature (K), and vertical dashed lines represent the time of CopterSonde flights. The star markers represent the maximum altitude achieved for a given profile. Values are interpolated through time at each level between successive flights. See text for discussion on the features annotated in red.
4.4 Drainage flow – 19 July 2018
The morning of 19 July 2018 was characterized by relatively quiescent conditions, making it the target of katabatic drainage flow observations. CASS flew CopterSondes from two locations (MOFF and NSF), conducting 46 total vertical profiles at 15 min intervals between 11:15–17:00 UTC (Table 4). A cursory glance at potential temperature in time–height coordinates from this day at the NSF site (Fig. 6) reveals a similar ABL transition as observed on the previous day from the MOFF site (Fig. 5). Wind speed and direction (Fig. 7a, b) are also weak but primarily from the east below 400 m and from the north above 500 m. However, closer inspection reveals several harmonic structures, with a relative warm anomaly around 100 m a.g.l. with a period of roughly 15 min at 13:15 UTC propagating vertically through the next four to five profiles (Fig. 6, red oval). Due to the highly stratified nature of the atmosphere at this time and the presence of complex topography, it is possible these disturbances are the result of internal gravity waves. Further investigation is necessary to elucidate specific details on this phenomenon and its sensitivity to spatial and temporal interpolation schemes.
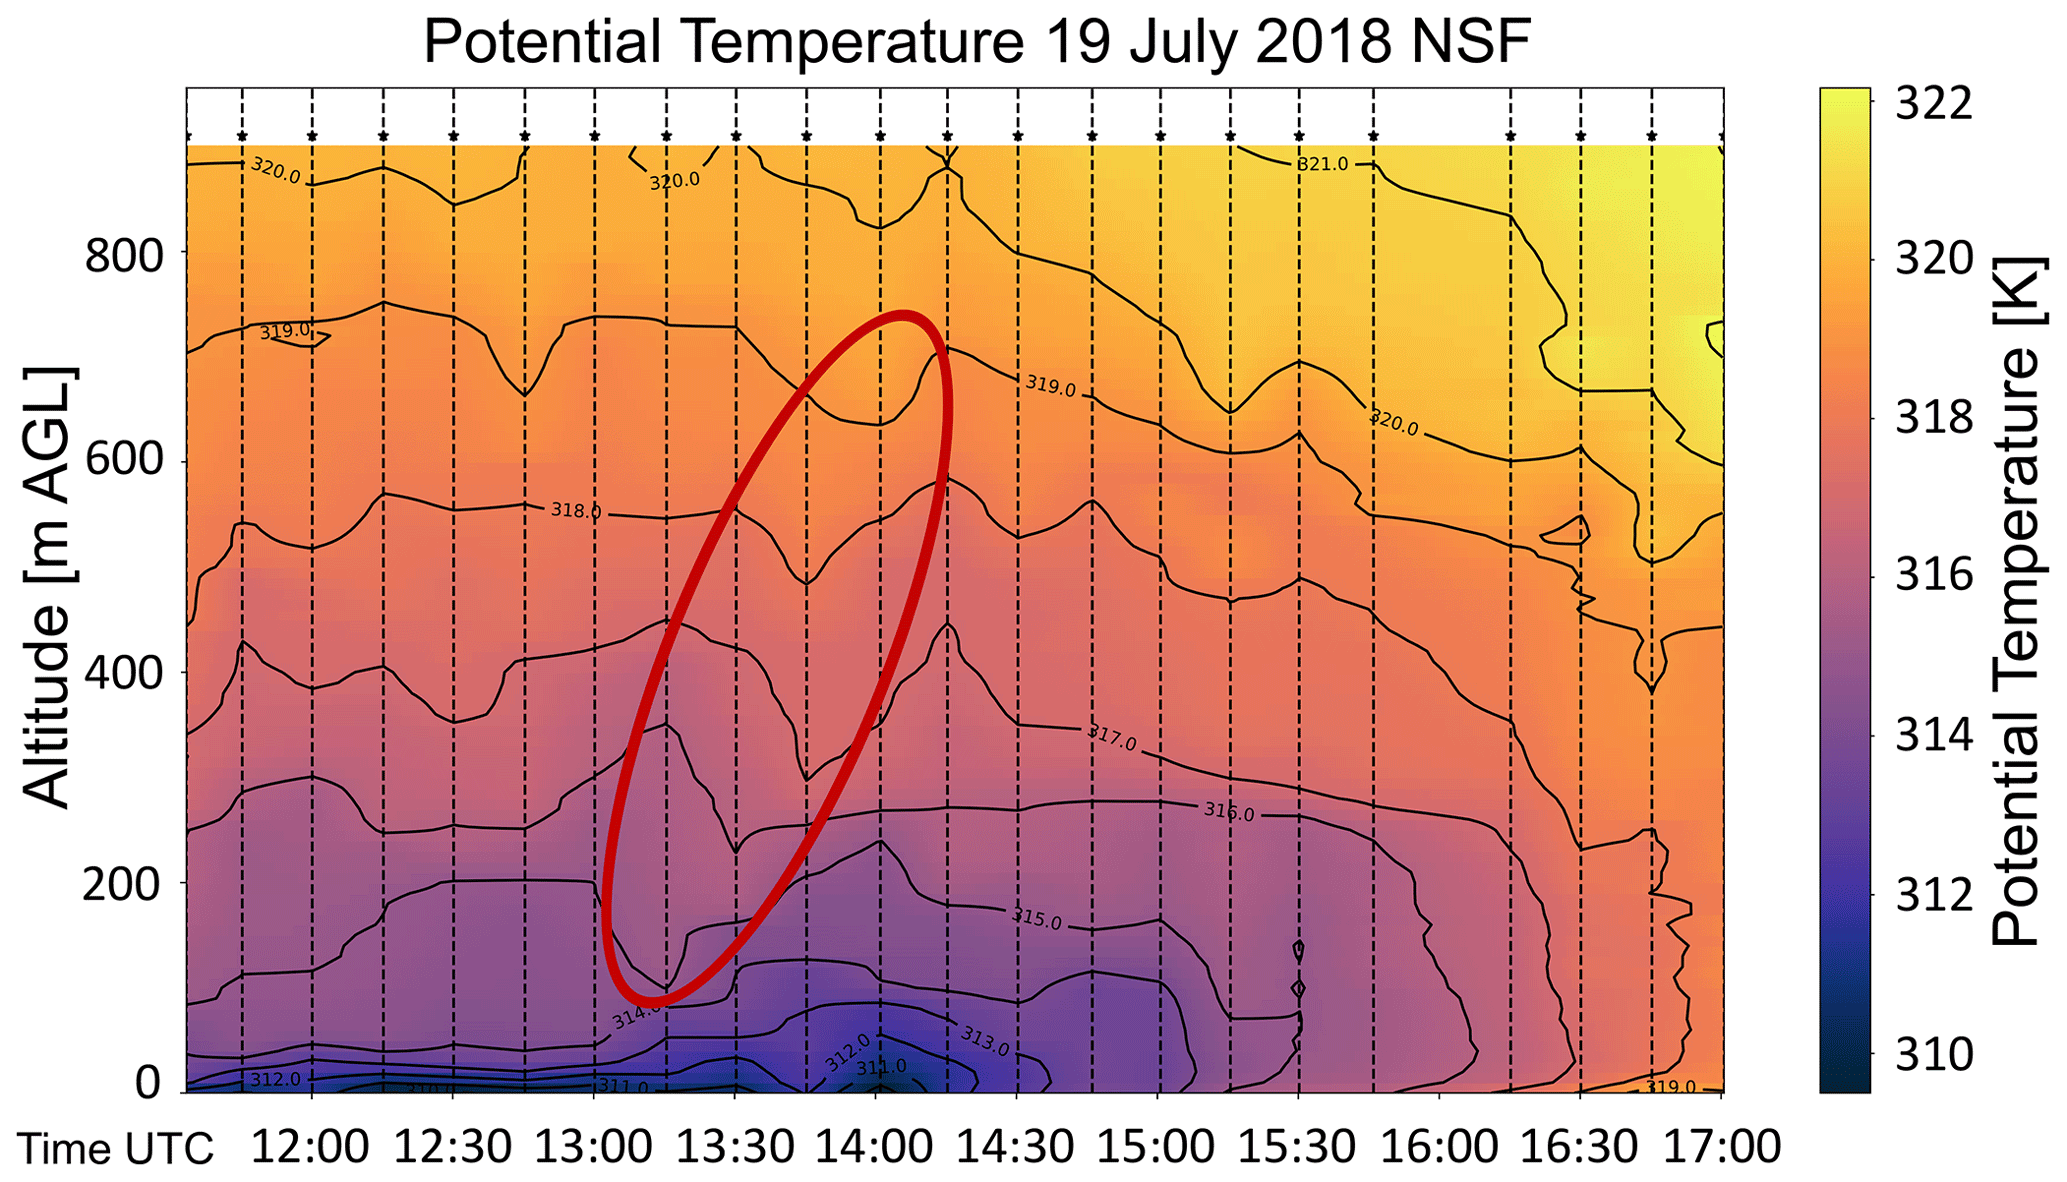
Figure 6Time–height cross-section view of CopterSonde potential temperature observations at the North Star Farms (NSF) location on 19 July 2018. Figure notations follow the same conventions as in Fig. 5. See text for discussion on the features annotated in red.
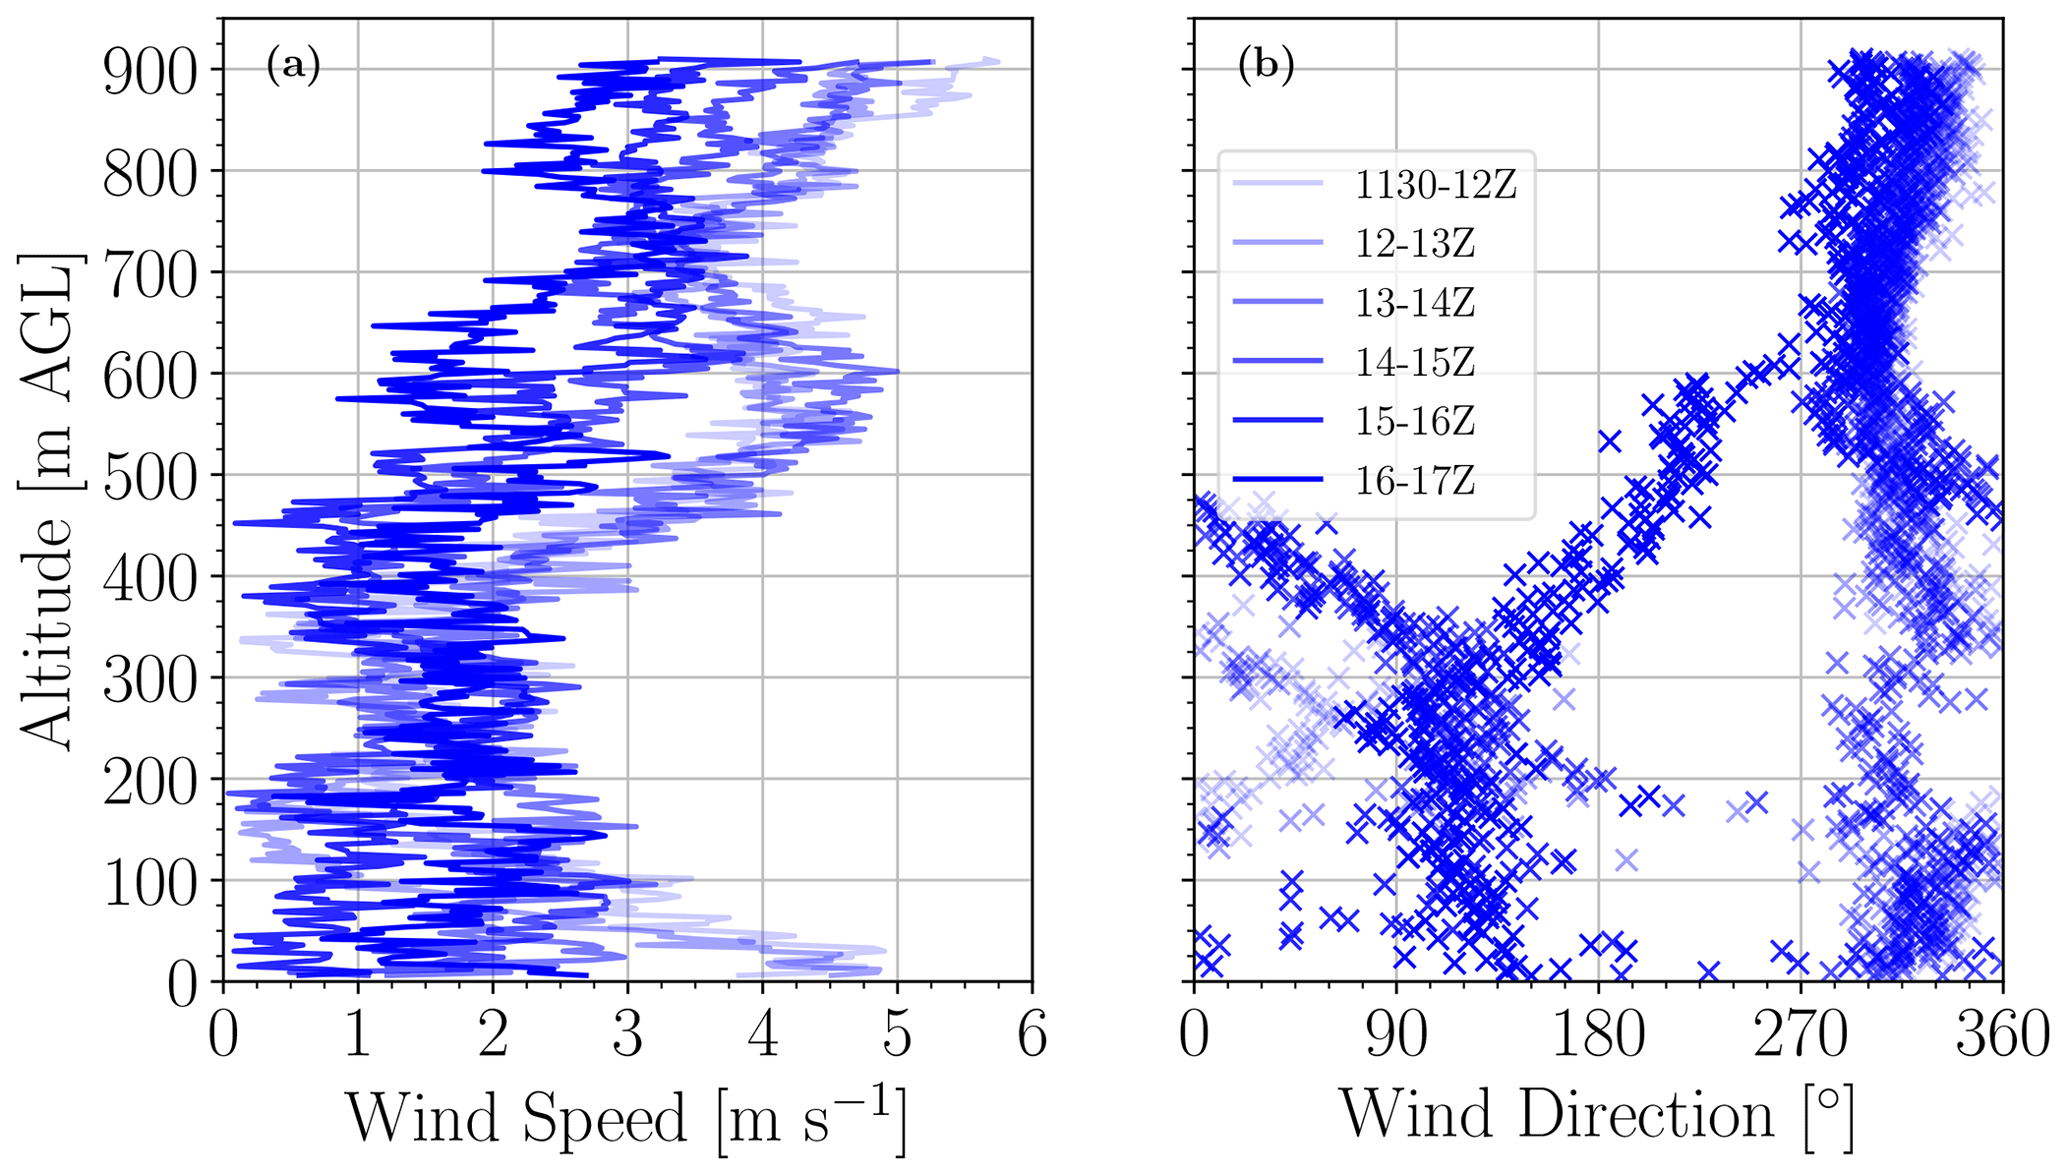
Figure 7Hourly average profiles of wind speed (a) and wind direction (b) at the North Star Farms locations on 19 July 2018.
The CopterSonde UAS runs a modified version of the open-source ArduPilot autopilot code. The custom code is managed and available for free distribution through the code-hosting platform GitHub for version control and collaboration. The code releases are tracked and time stamped by the open-access Zenodo repository which is linked to the GitHub account, located at https://doi.org/10.5281/zenodo.3974526 (Segales et al., 2020c).
The OU CopterSonde data files from the LAPSE-RATE campaign are available for public access from the Zenodo data repository (Greene et al., 2020, DOI: https://doi.org/10.5281/zenodo.3737087). They are in netCDF format with self-describing metadata and are organized by flight, aircraft tail number, and location. Included in each file are quality-controlled thermodynamic (temperature, pressure, humidity) and kinematic (wind speed and direction) measurements collected by CASS during the LAPSE-RATE campaign from 14–19 July 2018. These files are from the fleet of three individual CopterSonde rotary-wing RPASs used during the campaign.
The files follow a naming convention of UOK.ppppp.lv.yyyymmdd.hhmmss.cdf, where ppppp is a platform identification code (one of “OU944”, “OU946”, or “OU955”), lv is the data file processing level, and yyyymmdd.hhmmss is the year-month-date.hour-minute-second of the file start date and time. Further information is included in the readme text file in this repository.
During July 2018, researchers from OU's CASS participated alongside federal and university partners in the LAPSE-RATE field campaign in San Luis Valley, Colorado, USA. The OU team successfully completed 180 flights using three RPASs over the course of 6 d of operation to collect vertical profiles of the thermodynamic and kinematic state of the ABL. This article describes sampling strategies, data collection, platform intercomparability, data quality and processing, and the dataset's possible applications to convective initiation, drainage flows, and ABL transitions.
The data available from these flights provide measurements of temperature, humidity, pressure, wind speed, and wind direction at a higher spatiotemporal resolution in the ABL than many conventional strategies, such as radiosondes, which will significantly contribute to characterizing the ABL within the San Luis Valley during the campaign. The data collected from the operations and platforms described here are uploaded and available for download through the Zenodo data repository (DOI: https://doi.org/10.5281/zenodo.3737087, Greene et al., 2020). These data have already been featured in studies comparing RPAS profiling accuracies to those from more traditional profilers such as radiosondes, lidars, and AERIs (Bell et al., 2020a; Segales et al., 2020a). There will also be utilized in several ongoing studies that examine the use of RPAS data to improve temperature forecasts impacted by valley drainage flows (de Boer et al., 2020s) and the utility of using buoyancy as a metric to understand convection initiation and boundary layer transitions (Lappin et al., 2021).
The field campaign was planned by EPL and PC. Data collection was completed by EPL, BG, TB, AS, GA, WD, SK, DT, and PC. The data processing and quality control were led by BG while data analysis and visualization were completed by BG, FL, and TB. Writing was completed by EPL, BG, and FL; the project was supervised by PC and EP; and the funding was acquired by PC.
The authors declare that they have no conflicts of interest.
This article is part of the special issue “Observational and model data from the 2018 Lower Atmospheric Process Studies at Elevation – a Remotely-piloted Aircraft Team Experiment (LAPSE-RATE) campaign”. It was affiliated with the International Society for Atmospheric Research using Remotely piloted Aircraft (ISARRA 2018) conference, Boulder, USA, 9–12 July 2018.
The authors would like to thank the Moffat consolidated school for the use of their parking lot and facilities for the duration of the campaign as well as the greater San Luis Valley community for welcoming the LAPSE-RATE campaign and providing land access for flight operations. Additional support for field operations in Colorado was provided by University of Oklahoma undergraduate research assistants Brandon Albert, Samantha Bashcky, Christopher Hughes, Mark Thiel, and Brent Wolf.
This research has been supported in part by the National Science Foundation under grant no. 1539070 and internal funding from the University of Oklahoma Office of the Vice President for Research and Partnerships.
This paper was edited by Suzanne Smith and reviewed by three anonymous referees.
Bailey, S. C. C., Sama, M. P., Canter, C. A., Pampolini, L. F., Lippay, Z. S., Schuyler, T. J., Hamilton, J. D., MacPhee, S. B., Rowe, I. S., Sanders, C. D., Smith, V. G., Vezzi, C. N., Wight, H. M., Hoagg, J. B., Guzman, M. I., and Smith, S. W.: University of Kentucky measurements of wind, temperature, pressure and humidity in support of LAPSE-RATE using multisite fixed-wing and rotorcraft unmanned aerial systems, Earth Syst. Sci. Data, 12, 1759–1773, https://doi.org/10.5194/essd-12-1759-2020, 2020. a, b
Barbieri, L., Kral, S. T., Bailey, S. C., Frazier, A. E., Jacob, J. D., Reuder, J., Brus, D., Chilson, P. B., Crick, C., Detweiler, C., Doddi, A., Elston, J., Foroutan, H., González-Rocha, J., Greene, B. R., Guzman, M. I., Houston, A. L., Islam, A., Kemppinen, O., Lawrence, D., Pillar-Little, E. A., Ross, S. D., Sama, M. P., Schmale, D. G., Schuyler, T. J., Shankar, A., Smith, S. W., Waugh, S., Dixon, C., Borenstein, S., and de Boer, G.: Intercomparison of small unmanned aircraft system (sUAS) measurements for atmospheric science during the LAPSE-RATE campaign, Sensors, 19, 2179, https://doi.org/10.3390/s19092179, 2019. a, b, c, d, e
Bell, T. M., Greene, B. R., Klein, P. M., Carney, M., and Chilson, P. B.: Confronting the boundary layer data gap: evaluating new and existing methodologies of probing the lower atmosphere, Atmos. Meas. Tech., 13, 3855–3872, https://doi.org/10.5194/amt-13-3855-2020, 2020a. a, b, c, d, e, f, g, h
Bell, T. M., Klein, P. M., Lundquist, J. K., and Waugh, S.: Remote sensing and radiosonde datasets collected in the San Luis Valley during the LAPSE-RATE campaign, Earth Syst. Sci. Data Discuss. [preprint], https://doi.org/10.5194/essd-2020-314, in review, 2020b. a, b, c, d, e
Bonin, T., Chilson, P., Zielke, B., and Fedorovich, E.: Observations of the Early Evening Boundary-Layer Transition Using a Small Unmanned Aerial System, Bound.-Lay. Meteorol., 146, 119–132, https://doi.org/10.1007/s10546-012-9760-3, 2012. a
Bonin, T. A., Chilson, P. B., Zielke, B. S., Klein, P. M., and Leeman, J. R.: Comparison and application of wind retrieval algorithms for small unmanned aerial systems, Geosci. Instrum. Method. Data Syst., 2, 177–187, https://doi.org/10.5194/gi-2-177-2013, 2013. a
Bonin, T. A., Blumberg, W. G., Klein, P. M., and Chilson, P. B.: Thermodynamic and turbulence characteristics of the southern great plains nocturnal boundary layer under differing turbulent regimes, Bound.-Lay. Meteorol., 157, 401–420, https://doi.org/10.1007/s10546-015-0072-2, 2015. a
Brosy, C., Krampf, K., Zeeman, M., Wolf, B., Junkermann, W., Schäfer, K., Emeis, S., and Kunstmann, H.: Simultaneous multicopter-based air sampling and sensing of meteorological variables, Atmos. Meas. Tech., 10, 2773–2784, https://doi.org/10.5194/amt-10-2773-2017, 2017. a
Brus, D., Gustafsson, J., Kempinen, O., de Boer, G., and Hirsikko, A.: Atmospheric aerosol, gases and meteorological parameters measured during the LAPSE-RATE campaign, Earth Syst. Sci. Data Discuss. [preprint], https://doi.org/10.5194/essd-2020-251, in review, 2020. a
Chilson, P. B., Bell, T. M., Brewster, K. A., Britto Hupsel de Azevedo, G., Carr, F. H., Carson, K., Doyle, W., Fiebrich, C. A., Greene, B. R., Grimsley, J.L., Kanneganti, S. T., Martin, J., Moore, A., Palmer, R. D., Pillar-Little, E. A., Salazar-Cerreno, J. L., Segales, A. R., Weber, M. E., Yeary, M., and Droegemeier, K. K.: Moving towards a Network of Autonomous UAS Atmospheric Profiling Stations for Observations in the Earth’s Lower Atmosphere: The 3D Mesonet Concept, Sensors, 19, 2720, https://doi.org/10.3390/s19122720, 2019. a
de Boer, G., Argrow, B., Cassano, J., Cione, J., Frew, E., Lawrence, D., Wick, G., and Wolff, C.: Advancing Unmanned Aerial Capabilities for Atmospheric Research, B. Am. Meteorol. Soc., 100, ES105–ES108, https://doi.org/10.1175/BAMS-D-18-0254.1, 2019. a
de Boer, G., Diehl, C., Jacob, J., Houston, A., Smith, S. W., Chilson, P., Schmale, David G., I., Intrieri, J., Pinto, J., Elston, J., Brus, D., Kemppinen, O., Clark, A., Lawrence, D., Bailey, S. C. C., Sama, M. P., Frazier, A., Crick, C., Natalie, V., Pillar-Little, E., Klein, P., Waugh, S., Lundquist, J. K., Barbieri, L., Kral, S. T., Jensen, A. A., Dixon, C., Borenstein, S., Hesselius, D., Human, K., Hall, P., Argrow, B., Thornberry, T., Wright, R., and Kelly, J. T.: Development of Community, Capabilities, and Understanding through Unmanned Aircraft-Based Atmospheric Research: The LAPSE-RATE Campaign, B. Am. Meteorol. Soc., 101, E684–E699, https://doi.org/10.1175/BAMS-D-19-0050.1, 2020a. a, b
de Boer, G., Houston, A., Jacob, J., Chilson, P. B., Smith, S. W., Argrow, B., Lawrence, D., Elston, J., Brus, D., Kemppinen, O., Klein, P., Lundquist, J. K., Waugh, S., Bailey, S. C. C., Frazier, A., Sama, M. P., Crick, C., Schmale III, D., Pinto, J., Pillar-Little, E. A., Natalie, V., and Jensen, A.: Data generated during the 2018 LAPSE-RATE campaign: an introduction and overview, Earth Syst. Sci. Data, 12, 3357–3366, https://doi.org/10.5194/essd-12-3357-2020, 2020b. a, b, c
de Boer, G., Waugh, S., Erwin, A., Borenstein, S., Dixon, C., Shanti, W., Houston, A., and Argrow, B.: Measurements from mobile surface vehicles during LAPSE-RATE, Earth Syst. Sci. Data Discuss. [preprint], https://doi.org/10.5194/essd-2020-173, in review, 2020c. a, b
Elston, J., Argrow, B., Stachura, M., Weibel, D., Lawrence, D., and Pope, D.: Overview of Small Fixed-Wing Unmanned Aircraft for Meteorological Sampling, J, Atmos. Ocean. Tech., 32, 97–115, https://doi.org/10.1175/JTECH-D-13-00236.1, 2015. a
Glasheen, K., Pinto, J., Steiner, M., and Frew, E.: Assessment of Finescale Local Wind Forecasts Using Small Unmanned Aircraft Systems, J. Aerosp. Inform. Syst., 17, 182–192, https://doi.org/10.2514/1.I010747, 2020. a
Greene, B. R.: Boundary Layer Profiling Using Rotary-Wing Unmanned Aircraft Systems: Filling the Atmospheric Data Gap, Master thesis, The University of Oklahoma, https://hdl.handle.net/11244/301374, 2018. a, b
Greene, B. R., Segales, A. R., Waugh, S., Duthoit, S., and Chilson, P. B.: Considerations for temperature sensor placement on rotary-wing unmanned aircraft systems, Atmos. Meas. Tech., 11, 5519–5530, https://doi.org/10.5194/amt-11-5519-2018, 2018. a, b, c
Greene, B. R., Segales, A. R., Bell, T. M., Pillar-Little, E. A., and Chilson, P. B.: Environmental and sensor integration influences on temperature measurements by rotary-wing unmanned aircraft systems, Sensors, 19, 1470, https://doi.org/10.3390/s1209061470, 2019. a, b, c, d, e, f, g
Greene, B. R., Bell, T. M., Pillar-Little, E. A., Segales, A. R., Britto Hupsel de Azevedo, G., Doyle, W., Tripp, D. D., Kanneganti, S. T., and Chilson, P. B.: University of Oklahoma CopterSonde Files from LAPSE-RATE, https://doi.org/10.5281/zenodo.3737087, 2020. a, b, c
Greene, B. R., Kral, S. T., Chilson, P. B., and Reuder, J.: Gradient-based turbulence estimates from multicopter profiles of the stable boundary layer during ISOBAR18, Bound.-Lay. Meteorol., in preparation, 2021. a
Jacob, J., Chilson, P., Houston, A., and Smith, S.: Considerations for atmospheric measurements with small unmanned Aircraft systems, Atmosphere-Basel, 9, 252, https://doi.org/10.3390/atmos9070252, 2018. a, b
Koch, S. E., Fengler, M., Chilson, P. B., Elmore, K. L., Argrow, B., Andra, D. L., and Lindley, T.: On the Use of Unmanned Aircraft for Sampling Mesoscale Phenomena in the Preconvective Boundary Layer, J. Atmos. Ocean. Tech., 35, 2265–2288, https://doi.org/10.1175/JTECH-D-18-0101.1, 2018. a, b, c
Kral, S. T., Reuder, J., Vihma, T., Suomi, I., Haualand, K. F., Urbancic, G. H., Greene, B. R., Steeneveld, G.-J., Lorenz, T., Maronga, B., Jonassen, M. O., Ajosenpää, H., Båserud, L., Chilson, P. B., Holtslag, A. A. M., Jenkins, A. D., Kouznetsov, R., Mayer, S., Pillar-Little, E. A., Rautenberg, A., Schwenkel, J., Seidl, A. W., and Wrenger, B.: The Innovative Strategies for Observations in the Arctic Atmospheric Boundary Layer Project (ISOBAR): Unique fine-scale observations under stable and very stable conditions, B. Am. Meteorol. Soc., 1–64, https://doi.org/10.1175/BAMS-D-19-0212.1, online first, 2020. a, b, c
Lappin, F. M., Chilson, P. B., Bell, T. M., and Pillar-Little, E. A.: Low-level buoyancy as a tool to understand boundary layer transitions, Atmos. Meas. Tech. Discuss., in preparation, 2021. a, b
Lee, T. R., Buban, M., Dumas, E., and Baker, C. B.: A New Technique to Estimate Sensible Heat Fluxes around Micrometeorological Towers Using Small Unmanned Aircraft Systems, J. Atmos. Ocean. Tech., 34, 2103–2112, https://doi.org/10.1175/JTECH-D-17-0065.1, 2017. a
Lee, T. R., Buban, M., Dumas, E., and Baker, C. B.: On the Use of Rotary-Wing Aircraft to Sample Near-Surface Thermodynamic Fields: Results from Recent Field Campaigns, Sensors, 19, 10, https://doi.org/10.3390/s19010010, 2018. a
Neumann, P. P. and Bartholmai, M.: Real-time wind estimation on a micro unmanned aerial vehicle using its inertial measurement unit, Sensor. Actuat. A-Phys., 235, 300–310, https://doi.org/10.1016/j.sna.2015.09.036, 2015. a
Palomaki, R. T., Rose, N. T., van den Bossche, M., Sherman, T. J., and De Wekker, S. F.: Wind estimation in the lower atmosphere using multirotor aircraft, J. Atmos. Ocean. Tech., 34, 1183–1191, https://doi.org/10.1175/JTECH-D-16-0177.1, 2017. a
Pinto, J. O., Jensen, A. A., Jiménez, P. A., Hertneky, T., Muñoz-Esparza, D., Dumont, A., and Steiner, M.: Realtime WRF LES Simulations to Support UAS Flight Planning and Operations During 2018 LAPSE-RATE, Earth Syst. Sci. Data Discuss. [preprint], https://doi.org/10.5194/essd-2020-242, in review, 2020. a, b, c
Segales, A. R., Greene, B. R., Bell, T. M., Doyle, W., Martin, J. J., Pillar-Little, E. A., and Chilson, P. B.: The CopterSonde: an insight into the development of a smart unmanned aircraft system for atmospheric boundary layer research, Atmos. Meas. Tech., 13, 2833–2848, https://doi.org/10.5194/amt-13-2833-2020, 2020a. a, b, c, d, e, f, g, h, i, j, k, l
Segales, A. R., Tridgell, A., Mackay, R., Barker, P., Marchi, L. D., WickedShell, Riseborough, P., Pittenger, T., jason4short, Kancir, P., jschall, Hall, L., de Sousa, G. J., Oborne, M., Walser, J., Hickey, P., Lucas, A., Lefebvre, R., Purohit, S. B., Ferreira, F., murata, k., de Oliveira Filho, C. M., Staroselskii, G., Morphett, G., Denecke, M., Whitehorn, M., Hall, P., Shamaev, E., Jehangir, R., Goppert, J., and Vilches, V. M.: oucass/CASS-ardupilot: CASSv1.6.0-Copter-3.6.12, Zenodo, https://doi.org/10.5281/zenodo.3494655, 2020b. a
Segales, A. R., Tridgell, A., Mackay, R., Barker, P., Marchi, L. D., WickedShell, and Vilches, V. M.: oucass/CASS-ardupilot: CASSv1.6.1-Copter-3.6.12 (Version CASSv1.6.1-Copter-3.6.12), Zenodo, https://doi.org/10.5281/zenodo.3974526, 2020c. a
Trier, S. B., Davis, C. A., Ahijevych, D. A., and Manning, K. W.: Use of the parcel buoyancy minimum (B min) to diagnose simulated thermodynamic destabilization. Part I: Methodology and case studies of MCS initiation environments, Mon. Weather Rev., 142, 945–966, 2014. a
Wagner, T. J., Klein, P. M., and Turner, D. D.: A New Generation of Ground-Based Mobile Platforms for Active and Passive Profiling of the Boundary Layer, B. Am. Meteorol. Soc., 100, 137–153, https://doi.org/10.1175/BAMS-D-17-0165.1, 2019. a
Wainwright, C. E., Bonin, T. A., Chilson, P. B., Gibbs, J. A., Fedorovich, E., and Palmer, R. D.: Methods for evaluating the temperature structure-function parameter using unmanned aerial systems and large-eddy simulation, Bound.-Lay. Meteorol., 155, 189–208, 2015. a
Zhang, Y. and Klein, S. A.: Mechanisms affecting the transition from shallow to deep convection over land: Inferences from observations of the diurnal cycle collected at the ARM Southern Great Plains site, J. Atmos. Sci., 67, 2943–2959, 2010. a
Zielke, B.: A Procedure for Obtaining High-Density In-Situ Measurements of Ozone Concentration Within the Planetary Boundary Layer, Master thesis, University of Oklahoma, 2011. a