the Creative Commons Attribution 4.0 License.
the Creative Commons Attribution 4.0 License.
 | 19 May 2021
Long-term trends of ambient nitrate (NO3−) concentrations across China based on ensemble machine-learning models
Rui Li
Lulu Cui
Yilong Zhao
Wenhui Zhou
Hongbo Fu
High loadings of nitrate () in the aerosol over China significantly exacerbate the air quality and pose a great threat to ecosystem safety through dry–wet deposition. Unfortunately, limited ground-level observation data make it challenging to fully reflect the spatial pattern of levels across China. Until now, long-term monthly particulate datasets at a high resolution were still missing, which restricted the assessment of human health and ecosystem safety. Therefore, a unique monthly dataset at 0.25∘ resolution over China during 2005–2015 was developed by assimilating surface observations, satellite products, meteorological data, land use types and other covariates using an ensemble model combining random forest (RF), gradient-boosting decision tree (GBDT), and extreme gradient-boosting (XGBoost) methods. The new developed product featured an excellent cross-validation R2 value (0.78) and relatively lower root-mean-square error (RMSE: 1.19 µg N m−3) and mean absolute error (MAE: 0.81 µg N m−3). Besides, the dataset also exhibited relatively robust performance at the spatial and temporal scales. Moreover, the dataset displayed good agreement with (R2=0.85, RMSE=0.74 µg N m−3, and MAE=0.55 µg N m−3) some unlearned data collected from previous studies. The spatiotemporal variations in the developed product were also shown. The estimated concentration showed the highest value in the North China Plain (NCP) (3.55±1.25 µg N m−3); followed by the Yangtze River Delta (YRD) (2.56±1.12 µg N m−3), Pearl River Delta (PRD) (1.68±0.81 µg N m−3), and Sichuan Basin (1.53±0.63 µg N m−3), and the lowest one in the Tibetan Plateau (0.42±0.25 µg N m−3). The higher ambient concentrations in the NCP, YRD, and PRD were closely linked to the dense anthropogenic emissions. Apart from the intensive human activities, poor terrain condition might be a key factor for the serious pollution in the Sichuan Basin. The lowest ambient concentration in the Tibetan Plateau was contributed by the scarce anthropogenic emission and favourable meteorological factors (e.g. high wind speed). In addition, the ambient concentration showed a marked increasing tendency of 0.10 during 2005–2014 (p<0.05), while it decreased sharply from 2014 to 2015 at a rate of −0.40 (p<0.05). The ambient levels in Beijing–Tianjin–Hebei (BTH), YRD, and PRD displayed gradual increases at a rate of 0.20, 0.11, and 0.05 (p<0.05) during 2005–2013, respectively. The gradual increases in concentrations in these regions from 2005 to 2013 were due to the fact that the emission reduction measures during this period focused on the reduction of SO2 emission rather than NOx emission and the rapid increase in energy consumption. Afterwards, the government further strengthened these emission reduction measures and thus caused the dramatic decreases in concentrations in these regions from 2013 to 2015 (p<0.05). The long-term dataset over China could greatly deepen the knowledge about the impacts of emission reduction measures on air quality improvement. The monthly particulate levels over China during 2005–2015 are open access at https://doi.org/10.5281/zenodo.3988307 (Li et al., 2020c).
- Article
(1753 KB) - Full-text XML
-
Supplement
(1144 KB) - BibTeX
- EndNote


Reactive nitrogen (Nr) emissions displayed remarkable increases in the past decades owing to high-speed industrial development and urbanisation (Cui et al., 2016; Singh et al., 2017). Ambient reactive N emissions were mainly characterised with nitrogen oxides (NOx), accounting for about 30 % of the gross Nr emissions (Chen et al., 2015; Liu et al., 2011). These important N-bearing precursors could be transformed into the nitrate () via multiple chemical pathways (e.g. heterogeneous or liquid phase reaction) and finally deposited in the terrestrial or aquatic ecosystem (Jia et al., 2016; Qiao et al., 2015; Zhao et al., 2017). On the one hand, heavy loadings of greatly degraded the atmospheric visibility and cool the surface of the Earth system because particulate significantly scattered solar radiation (Fu and Chen, 2017). Moreover, enhanced N deposition might pose a negative effect on the ecosystem health such as biodiversity losses, freshwater eutrophication, and oceanic acidification (Compton et al., 2011; Erisman et al., 2013). Hence, deepening knowledge about the spatial patterns and long-term trends of particulate in the atmosphere is beneficial to accurately evaluate the ecological and environmental effects of N deposition.
Ground-level observation is often acknowledged to be an effective means to explore the spatial patterns of ambient concentrations. Many long-term monitoring networks including the Clean Air Status and Trends Network (CASTNET) and the Canadian Air and Precipitation Monitoring Network (CAPMoN) were established to quantify the ambient concentration and inorganic N deposition. Du et al. (2014) revealed that the deposition showed significant decrease across the United States during 1985–2012 based on these observation data. To date, most of these observation networks focused on North America and Europe, whereas few monitoring sites were located in East Asia, especially in China. Fortunately, China has constructed some ground-level observation networks such as the CARE-China observation network in recent years. On the basis of these observation networks, the overall spatiotemporal trend of particulate concentration has been clarified (Y. Wang et al., 2019b; Xu et al., 2018a). Xu et al. (2018a) observed that the particulate concentration (<4.5 µm) over China did not show significantly temporal variation during 2011–2015. Very recently, Y. Wang et al. (2019a) found that the level in fine particulate matter (PM2.5) decreased by 34 % during 2015–2017. Although the overall spatial patterns have been preliminarily revealed based on these isolated sites, these sparse ground-observed sites did not accurately reflect the high-resolution pollution, especially the regions far away from these sites, because each station only possessed limited spatial representation, and concentration was often highly variable in space and time (L. Liu et al., 2017). More importantly, the current studies only investigated the ambient concentrations in recent years, while the long-term variation in level remained unknown. It was well known that the energy consumption in China has displayed a remarkable increase in recent decades (Zhan et al., 2018a). Meanwhile, the Chinese government has also proposed pollutant emission reduction policies since 2005 to ensure the coordinated development of economic growth and environmental protection (Ma et al., 2019). However, the synergistic effects of air pollution control policies and increased energy consumption on the long-term evolution trend of pollution over China, which were extremely critical for the implementation of emission control measures, were not assessed yet.
To complement the gaps of ground-level observations, the satellite product of NO2 is regarded as a welcome addition to investigate the long-term trends of N-bearing components in the atmosphere. Ozone Monitoring Instrument (OMI) was regarded as the typical satellite product applied to simulate the ambient concentration (X. Liu et al., 2017; Vrekoussis et al., 2013). Jia et al. (2016) first used the linear regression method to predict the levels and dry deposition fluxes at the global scale based on OMI-derived NO2 column amount. However, the dry deposition fluxes of modelled by Jia et al. (2016) showed weak correlation with the measured value (R=0.47), which might be attributable to the simple linear assumption between NO2 column amount and deposition flux. It was well documented that the nonlinearity relationship between multiple predictors and concentration was hard to reveal on the basis of the simple linear model (Zhan et al., 2018a, b). To enhance the predictive performance of concentration, L. Liu et al. (2017) used the chemical transport models (CTMs) to estimate the dry deposition fluxes of N-bearing species recently based on the remotely sensed NO2 column amount. However, CTMs often suffered from high uncertainty because of the limited knowledge about the generation pathways for particulate in the atmosphere (Zhan et al., 2018a). Recently, the emergence of machine learning models provided unprecedented opportunities to estimate the concentrations of N-bearing components (Z. Y. Chen et al., 2019; Zhan et al., 2018b). It was well known that the machine-learning models generally showed better predictive accuracy than CTMs and traditional statistical models when the training samples were sufficient (Zang et al., 2019; Zhan et al., 2017). Zhan et al. (2018b) employed random forest (RF) coupled with a spatiotemporal kriging model to simulate the ambient NO2 levels over China and achieved moderate modelling performance (R2=0.62). Afterwards, J. Chen et al. (2019) used the extreme gradient-boosting (XGBoost) model combined with the kriging-calibrated satellite method to estimate the national NO2 concentration and significantly improved the predictive performance (R2=0.85). Until now, no study has utilised machine-learning models to significantly improve predictive accuracy of concentration. Moreover, nearly all of the current studies only focused on the spatial pattern of particulate level in China (L. Liu et al., 2017; Jia et al., 2016), while they cannot establish a long-term dataset across China.
Here, we first developed a high-resolution (0.25∘) monthly particulate dataset across China during 2005–2015 based an ensemble model including RF, XGBoost, and gradient-boosting decision tree (GBDT) algorithms. At first, the modelling performance and improvement of this newly developed product compared with previous datasets were evaluated. Afterwards, we analysed the spatial variation and long-term evolution trend of estimated concentration over China and explored the potential impacts of air pollution control measures on variation. The long-term datasets could supply scientific evidence for policy makers to mitigate the severe nitrate pollution in China.
2.1 Ground-level data
The monthly monitoring data during 2010–2015 were collected from the Nationwide Nitrogen Deposition Monitoring Network (NNDMN) including 32 sites (Figs. 1, S1, and S2 in the Supplement), and these sites could be divided into three types including urban, rural, and background sites (Xu et al., 2018a). Ambient concentrations of particulate were determined on the basis of an active DEnuder for Long-Term Atmospheric sampling system (DELTA). The system comprises a pump, a filter sampling instrument, and a dry gas meter with high sensitivity. Two sets of filters in a two-stage filter pack were applied to sample the aerosol particles, first with a K2CO3/glycerol-impregnated filter to obtain particles in PM10. All of the monitoring sites kept the same sampling frequency at the month scale, and these samples were continuously collected over a month. The detailed sampling and analysis procedures have been described by Xu et al. (2018a, 2019). The detection limit of particulate concentration over China is 0.01 mg N L−1.
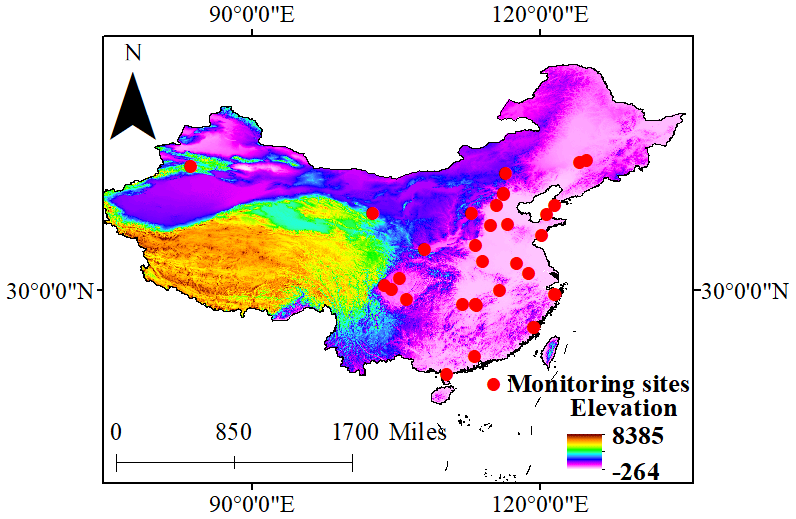
Figure 1Spatial distributions of ground-level monitoring sites used for model establishment. Red circles represent the ground-level sites during 2010–2015. The colour map denotes the elevation distribution across China.
2.2 Satellite product of NO2 column density
The OMI-NO2 level-3 tropospheric column densities (0.25∘ resolution) were used to predict the concentration (Fig. S3 in the Supplement). The OMI aboard the Aura satellite has been available since September 2004, which displayed global coverage and crossed the entire Earth each day. OMI possessed three spectral channels ranging from 270 to 500 nm and thus was often applied to monitor gaseous pollutants such as NO2, SO2, and O3.
In this study, we downloaded the daily NO2 columns during 2005–2015 from https://earthdata.nasa.gov/ (last access: 31 July 2020). The tropospheric NO2 column density data of poor quality (e.g. cloud radiance fraction>0.5, solar zenith angles>85∘, and terrain reflectivity>30 %) should be removed. Additionally, the cross-track pixels sensitive to significant row anomalies must also be deleted. Finally, the monthly NO2 columns were estimated by averaging the daily NO2 columns.
2.3 Meteorological factors, land use types, and other variables
These independent variables for particulate estimates were gained from multiple sources. The daily meteorological data (European Centre for Medium-Range Weather Forecasts reanalysis (ECMWF ERA-Interim) datasets (0.25∘ resolution)) were downloaded from the website of http://www.ecmwf.int/ (last access: 31 July 2020) (Table S1 in the Supplement). Among all of the daily meteorological data in ECMWF, 2 m temperature (T2m), 2 m dew point temperature (D2m), 10 m latitudinal wind component (U10), 10 m meridional wind component (V10), sunshine duration (Sund), surface pressure (Sp), boundary layer height (BLH), and total precipitation (Tp) were applied to estimate national levels. The elevation, gross domestic production (GDP), and population density (PD) data over China were downloaded from the website of http://www.resdc.cn/ (last access: 31 July 2020). PD and GDP in 1995, 2000, 2005, 2010, and 2015 were linearly interpolated to calculate PD and GDP in each year. Then, the yearly GDP data were divided by 12 to estimate the monthly GDP. Afterwards, these data were incorporated into the sub-model to predict the particulate concentration over China. In addition, the land use data (e.g. grassland, forest, urban, and agricultural land) were also downloaded from the website of http://www.resdc.cn/.
These independent variables collected from various sources were uniformly resampled to grids. For instance, the land use area, GDP, and PD in the 0.25∘ grid were calculated based on the area-weighted average algorithm. To ensure better predictive performance, it was necessary to employ the appropriate variable selection method to remove some redundant predictors. The basic principle of the variable choice was to remove the variables with the lower importance values. The variables could be regarded as the redundant ones when the R2 value of the final model showed a dramatic decrease after removing them. Based on this method, in the final sub-model, all of the variables except GDP, PD, and grassland have been applied to estimate the ambient concentrations across China.
3.1 Ensemble model development
In the previous studies concerning air pollution prediction, RF, gradient-boosting decision tree (GBDT) and extreme gradient-boosting (XGBoost) showed good predictive performance (Li et al., 2020a). The RF model possesses a large number of decision trees, and each one suffered from an independent sampling process, and these trees displayed the same distribution (Breiman, 2001). This model generally shows the higher prediction accuracy due to the injected randomness. The model performance mainly relies on the number of trees, the variable group, and the splitting features. The detailed algorithms are shown as follows.
Here (xi, yi) denotes the sample for in M regions (); I denotes the weight of each branch; L denotes the branch of decision tree; cm represents the response to the model; denotes the best value, m represents the feature variable; c1 denotes the mean value of the left branch; c2 denotes the mean value of the right branch and n is the split point.
The GBDT model is often considered to be a typical boosting method. Compared with the RF model, each classifier is applied to decrease the residual of the last round. The detailed equations are as follows.
ctj denotes the predicted estimation error in the last round, Rtj denotes each leaf node for the decision trees, yi represents the observed value, and ft−1(xi) is the predicted value in the last round. c was regarded as the optimal value when ctj reaches the lowest value.
The XGBoost method is an updated version of the GBDT model, and loss functions are expanded to the second-order function. On the basis of the pioneering studies (J. Chen et al., 2019), XGBoost generally shows an excellent performance because of its high efficiency and impressive accuracy. The detailed XGBoost algorithm is shown as the following formula (Zhai and Chen, 2018):
where L(t) represents the cost function at the tth period, ∂ denotes the derivative of the function, denotes the second derivative of the function, l is the differentiable convex loss function that reveals the difference of the predicted value () of the ith instance at the tth period and the target value (yi), ft(x) denotes the increment, and Ω(ft) represents the regulariser.
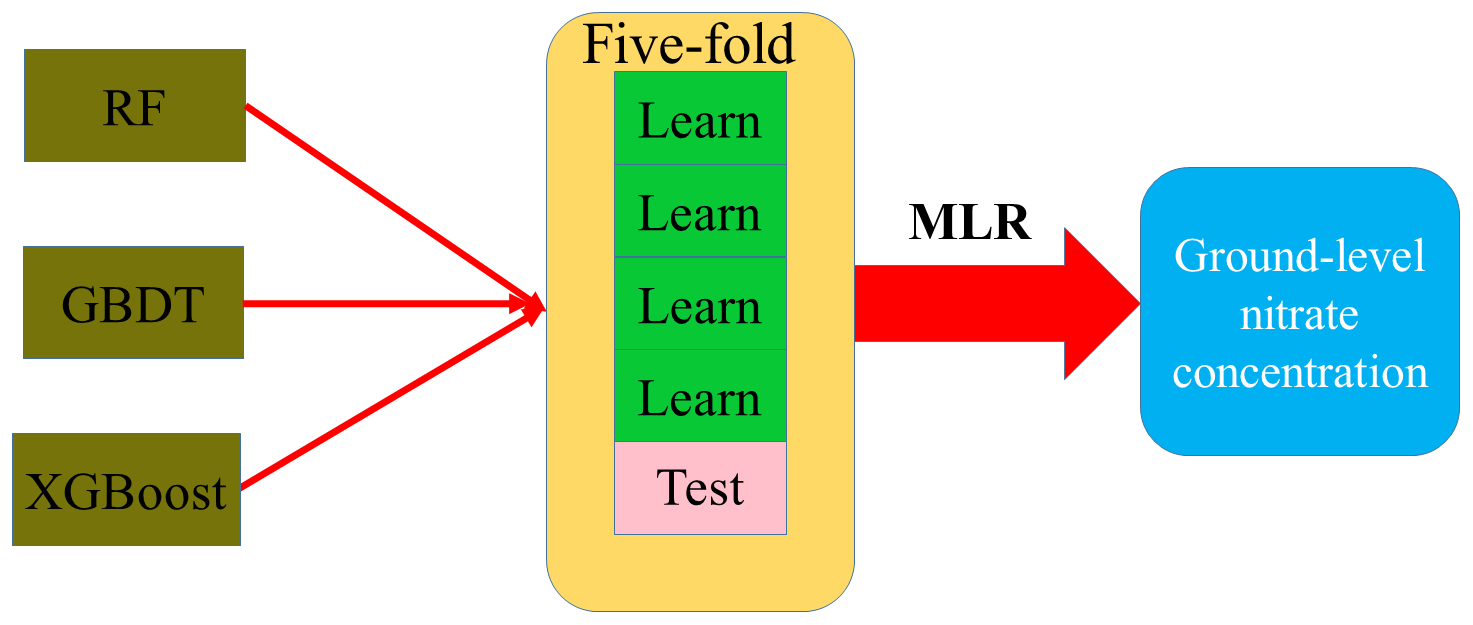
However, each model still shows some disadvantages in the prediction accuracy. Consequently, it was proposed to combine these models with a multiple linear regression (MLR) model to further estimate monthly concentration in the atmosphere over China. As shown in Fig. 2, three submodels including RF, GBDT, and XGBoost were stacked through the MLR model to estimate the monthly concentration over China. At first, a fivefold cross-validation method was adopted to train each submodel to determine the appropriate parameter. Afterwards, the MLR model was trained with the final simulated concentrations of three submodels and observations. Finally, the high-resolution ambient levels over China were estimated based on the optimal ensemble model. The detailed algorithms are shown as follows (Fig. 2):
where Pred_RF, Pred_GBDT, and Pred_XGBoost denote the predicted concentrations by RF, GBDT, and XGBoost, respectively. A, B, and C represent the partial regression coefficients of RF, GBDT, and XGBoost predictors, respectively. eij denotes the residual error. Based on the estimates, the regression coefficients including A, B, C, and the residual error (eij) determined by the MLR model were 0.42, 0.77, 0.09, and −0.87, respectively. The variance inflation factors of RF (2.01), GBDT (2.69), and XGBoost (2.08) were significantly lower than 10, which suggested the MLR model was robust.
The RF model was trained using matlab2019a with a package named random forest-master. Both the GBDT and XGBoost algorithms were conducted using many packages named gbm, caret, and xgboost in R software.
3.2 The error estimation and uncertainty assessment
The estimation performance of the ensemble model was evaluated based on a 10-fold cross-validation algorithm. The principle of this method meant that the entire datasets were divided into 10 groups with the same capacity randomly. Nine groups were applied to develop the model, and the remaining one was used to predict the level. After 10 rounds, every observed concentration showed a corresponding predicted value. Some key indices such as determination coefficient (R2), root-mean-square error (RMSE), and mean absolute prediction error (MAE) were selected as the key indicators to identify the optimal modelling method.
The uncertainty of the ensemble model was mainly derived from input ancillary variables. For instance, both the satellite data and meteorological data often suffered from some uncertainties. To quantify the uncertainties derived from meteorological data, the meteorological data at 0.25∘ across China were validated using ground-measured meteorological data downloaded from the website of the Chinese Meteorology Bureau (http://data.cma.cn/, last access: 31 July 2020). Additionally, NO2 columns generally suffered from some uncertainties, whereas the uncertainties of these NO2 columns cannot be determined because the data about the ground-level NO2 columns were not open access. In our study, we only estimated the missing ratio of the NO2 column, thereby evaluating the uncertainty of the dataset.
3.3 Trend analysis
The trend analysis of particulate concentration was performed using the Mann–Kendall nonparametric test. This method has been widely applied to analyse the historical trends of carbon fluxes (Tang et al., 2019) and air quality (Kong et al., 2019), which could reflect whether these data suffered from significant changes at a significance level of 0.05. The detailed calculation process is summarised in Mann (1945) and Kendall (1975).
4.1 Descriptive statistics of observed concentrations
The ensemble model was applied to fit the estimation model based on 1636 matched samples across China during 2010–2015. In general, the ground-observed concentration over China ranged from 0.3 µg N m−3 in Bayinbrook of Xinjiang Province to 7.1 µg N m−3 in Zhengzhou of Henan Province with the mean value of 2.7±1.7 µg N m−3. The monthly particulate concentrations displayed the highest and lowest values in the North China Plain (NCP) and Tibetan Plateau, respectively. In addition, the monthly level exhibited significant temporal variation during 2010–2015. The ambient concentrations in most sites displayed a gradual increase during 2010–2014, while they decreased sharply from 2014 to 2015. The spatiotemporal variation in ambient concentration over China shared similar characteristics with NO2 column amount (Fig. S3). The Pearson correlation analysis revealed that the monthly particulate level showed a significantly positive relationship with NO2 column amount (r=0.57, p<0.01) and urban land area (r=0.35, p<0.05) (Fig. S4 in the Supplement). However, D2m showed the remarkably negative correlation with ambient concentration (, p<0.05).
4.2 The validation of newly developed dataset and comparison with previous products
In our study, the ensemble model was applied to develop a monthly particulate dataset over China based on various predictors. In addition, three other individual models were also trained to compare with their predictive performances. The cross-validation result indicated that the R2 value of the new product developed by an ensemble decision tree model reached 0.78, significantly higher than those developed by RF (0.57), GBDT (0.73), and XGBoost (0.45). Nonetheless, both RMSE and MAE exhibited the opposite trends. The RMSE value was in the order of XGBoost (1.19 µg N m−3). The MAE value followed a similar characteristic with the order of XGBoost (0.81 µg N m−3). In some previous studies (Xiao et al., 2018), XGBoost often showed the better performance compared with RF, which seemed to be in contrast to our study. It was assumed that XGBoost showed the better performance for big data samples. However, the size of training samples in our study was relatively smaller than that in previous studies. Xiao et al. (2018) also verified that the XGBoost showed better accuracy than RF in some developed regions such as east China, while RF showed better performance than XGBoost in northwest China because monitoring sites in northwest China were relatively scarce. Wolpert (1992) suggested the combination of various machine-learning models can significantly strengthen the transferability of models. J. Chen et al. (2019) demonstrated that the ensemble model significantly outperformed the individual machine-learning model because the ensemble model can overcome the weaknesses of individual model. In addition, we also assessed the annual modelling performance of estimation. Figure S5 in the Supplement shows that the R2 value of annual estimation reached 0.81, slightly higher than monthly prediction (0.78). However, both RMSE (1.23 µg N m−3) and MAE (0.85 µg N m−3) for annual estimation were slightly higher than those of monthly prediction.
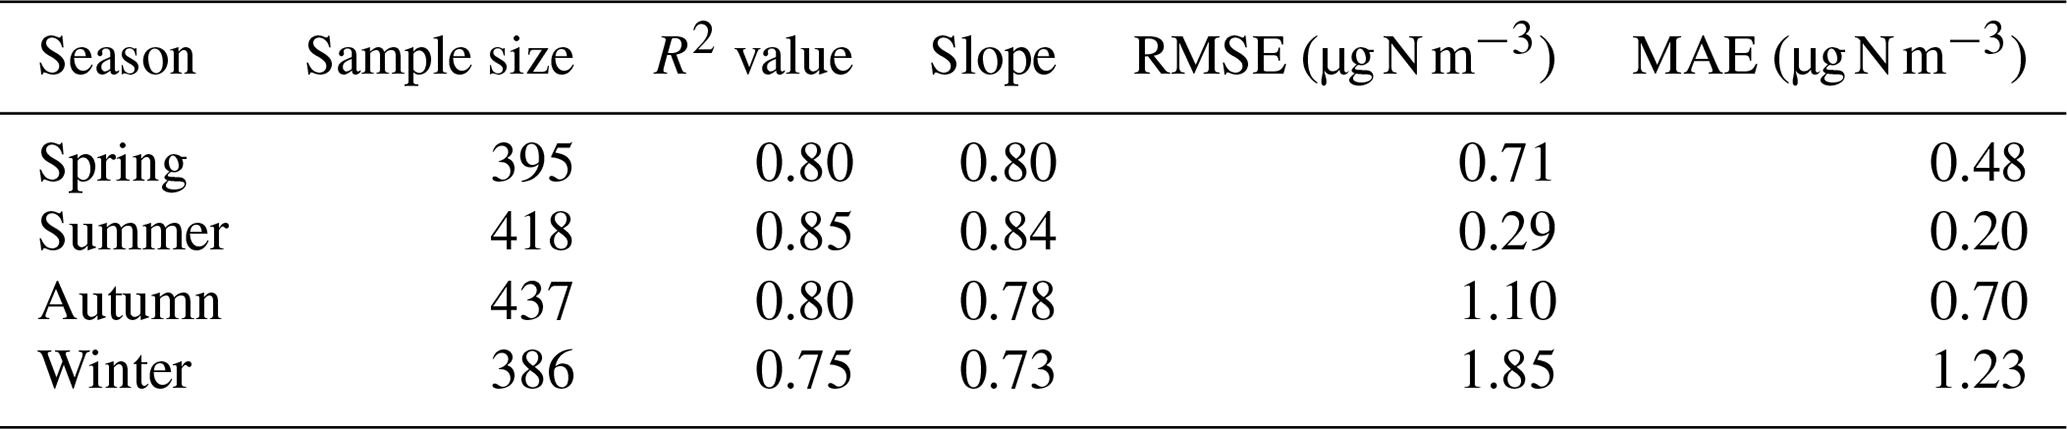
The new developed dataset showed the marked temporal discrepancy. The R2 values of estimates during 2011–2015 (0.88, 0.89, 0.83, 0.74, and 0.78) were notably higher than those during 2010 (0.62) (Table 1 and Fig. 3). The relatively lower R2 value in 2010 attested to the dominant role of sampling size in the predictive accuracy for machine-learning models. The training samples in 2010 (135 samples) were notably less than those in other years due to the lack of observation data in spring. However, both RMSE and MAE were not sensitive to the sampling size. The higher RMSE and MAE were focused in 2010, 2014, and 2015. The higher RMSE and MAE observed in 2010 might be contributed by the relatively scarce training samples, while the higher RMSE and MAE likely pertained to the higher levels during other years. In addition, the performance of the dataset varied greatly at the seasonal scale. The R2 value was in the order of summer across China (Table 2). The seasonal variation in concentration was in contrast to the results of fine particles modelled by previous studies (Li et al., 2020a; Qin et al., 2018). It was supposed that aerosol optical depth (AOD) was sensitive to the precipitation and relative humidity and thus showed the worse performance in summer. However, the predictive accuracy of estimation based on NO2 column amount was closely linked with the chemical transformation from NO2 to .
Table 1The cross-validation result of estimation over China during 2010–2015.
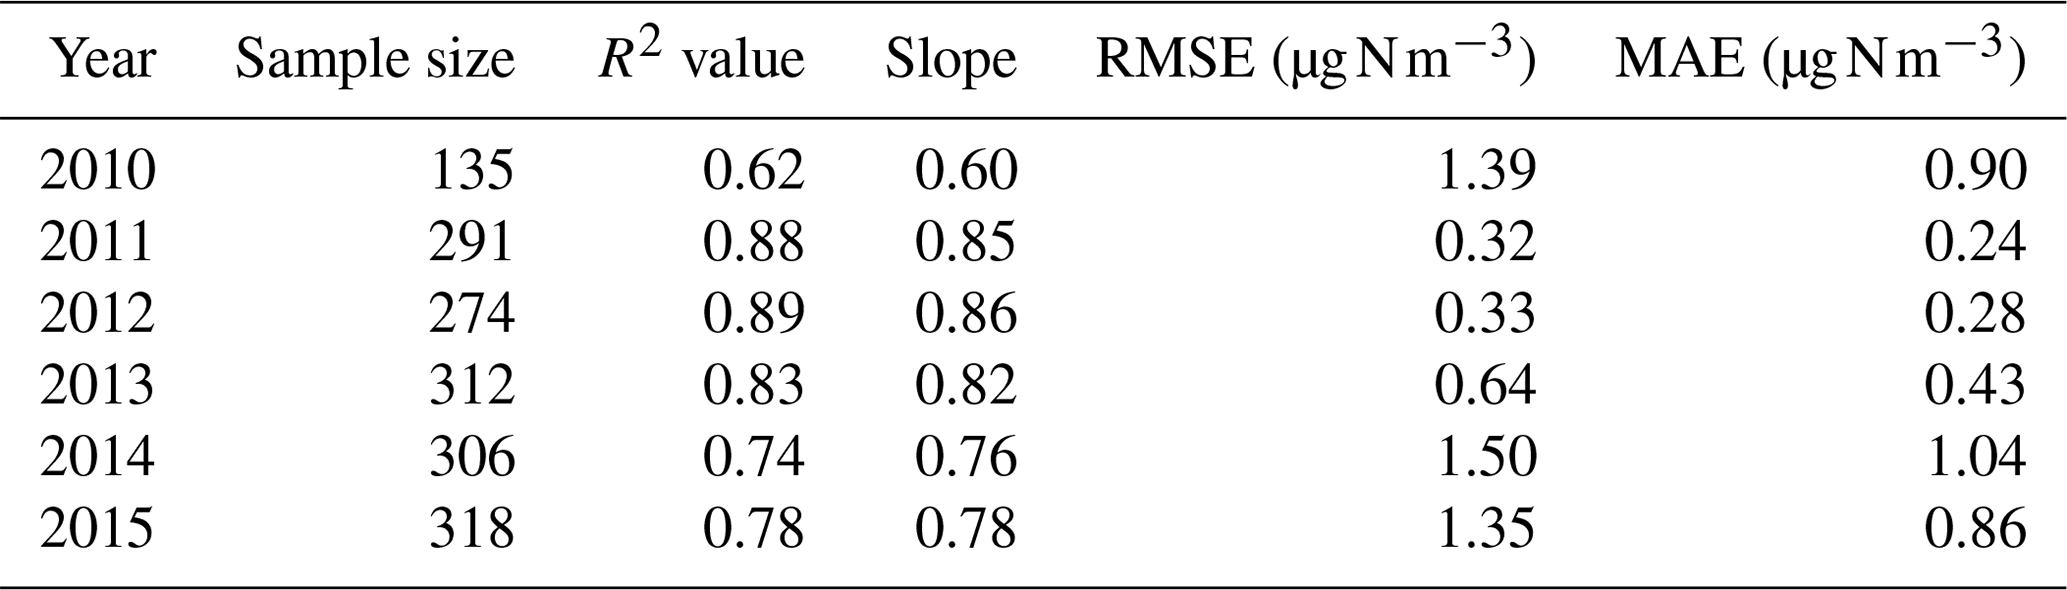
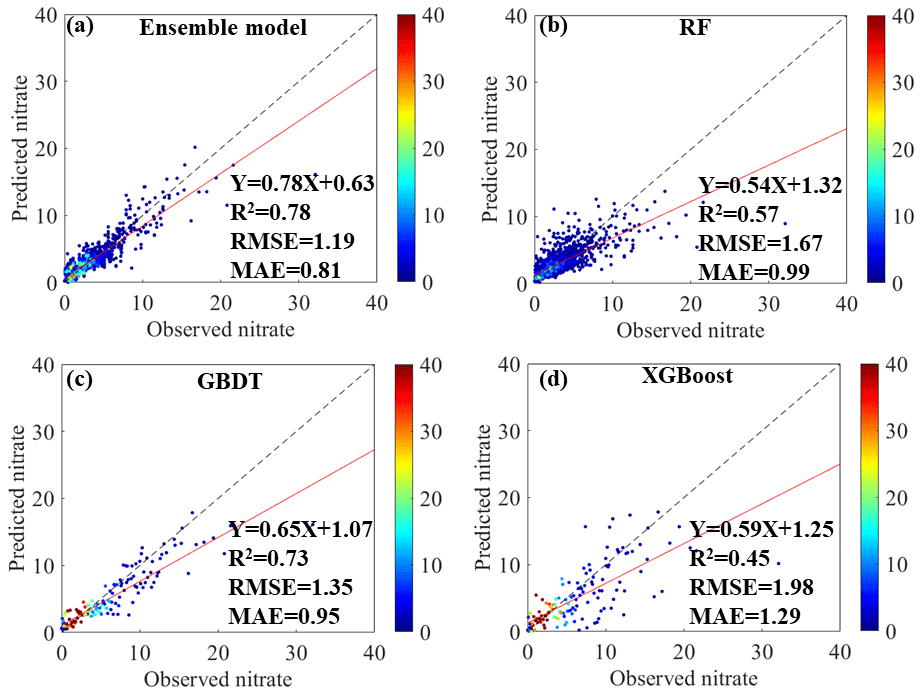
Figure 3Density scatterplots of 10-fold cross-validation results for monthly estimation (unit: µg N m−3) across China for the ensemble decision tree model (a), RF (b), GBDT (c), and XGBoost (d). The colour bar reflects the sampling size of each model. The red solid line denotes the best-fit line through the data points (1636 points). The black dashed line denotes the diagonal, which could be used to reflect the deviation of data points.
Table 2The cross-validation result of estimation over China in four seasons.
The performance of the dataset also displayed marked spatial variation. The highest R2 value was observed in the NCP (0.70), followed by southwest China (0.60), southeast China (0.59), and northwest China (0.55), and the lowest one was in northeast China (0.44) (Table 3). The highest R2 value occurring in the NCP was mainly attributable to the largest training samples (>400) compared with other regions. Southeast China and southwest China showed satisfactory cross-validation R2 values because the valid training samples in both of these regions were higher than 300. Although both northeast China and northwest China possessed limited training samples (<200), the predictive performances of these regions showed a significant discrepancy. It was assumed that the sampling sites in northeast China were very centralised, while the sampling sites in northwest China were uniformly distributed across the whole region. Geng et al. (2018) revealed that the modelling accuracy based on statistical models was significantly affected by the distribution characteristics of sampling sites. However, both RMSE and MAE showed different spatial distributions with the R2 value and slope of fitting curve. Note that the higher values of RMSE and MAE were concentrated in southwest China (2.08 and 1.41 µg N m−3) and northwest China (2.06 and 1.38 µg N m−3) rather than the NCP (1.74 and 1.06 µg N m−3). There are two reasons responsible for the result. At first, the predictive performances of southwest China and northwest China were significantly worse than that of the NCP, thereby leading to the higher RMSE and MAE. Moreover, most of the sampling sites in southwest China were focused on the Sichuan Basin, which often showed severe pollution all year round. Meanwhile, the annual mean concentrations in Yangling and Wuwei reached 4.1 and 4.5 µg N m−3, respectively. The higher loadings of concentrations for training samples led to the higher RMSE and MAE for northwest China.
Table 3The cross-validation result of estimation over China in different regions (northeast China includes Heilongjiang, Jilin, and Liaoning provinces; NCP includes Beijing, Tianjin, Hebei, Henan, Shandong, and Shanxi provinces; southeast China includes Jiangsu, Zhejiang, Fujian, Guangdong, Jiangxi, Anhui, Hunan, Hainan, Shanghai, and Hubei provinces; southwest China includes Yunnan, Guangxi, Sichuan, Tibet, Chongqing, and Guizhou provinces; northwest China includes Inner Mongolia, Xinjiang, Gansu, Qinghai, Ningxia, and Shaanxi.

Although the cross-validation result suggested the newly developed dataset achieved better modelling accuracy, the cross-validation algorithm could not test the transferability and agreement of this dataset in past years. Hence, the unlearned data (annual mean concentration in 10 cities) collected from previous references were employed to validate the transferability of this product. As shown in Fig. 4 and Table S2 in the Supplement, we found that the R2 value of the newly developed product and historical data reached 0.85 (Fig. 4), and the out-of-range R2 value was even slightly higher than the cross-validation R2 value. Moreover, the out-of-bag slope based on these unlearning data reached 0.81 and equaled the slope of the cross-validation database. In addition, the site-based cross-validation was also applied to validate the transferability of this dataset. The basic principle is that all of the sites were evenly classified into 10 clusters based on the geographical locations. Afterwards, 9 of 10 were used to train the model and then test the model based on the remaining one. After round 10, all of the observed values versus estimate values were considered to be the final result to validate the spatial transferability of this model. As depicted in Fig. S6 in the Supplement, the site-based cross-validation R2 value reached 0.73, which was slightly lower than the cross-validation R2 value of the training model (0.78). The result suggested the newly developed dataset showed excellent performance in the past decade.
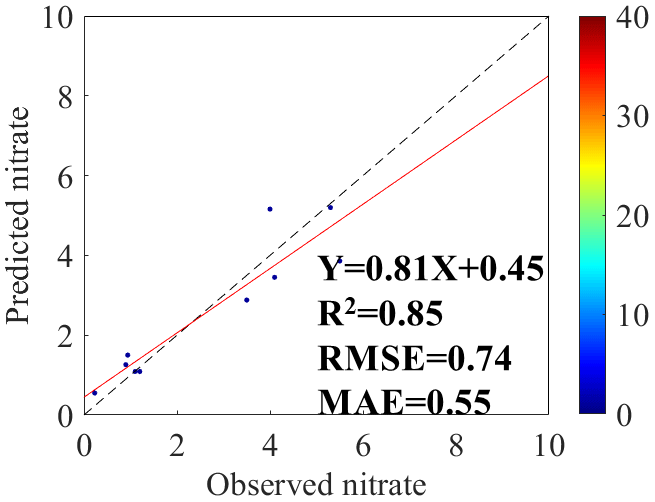
Figure 4The transferability validation of the ensemble model in estimating concentration over China based on the unlearning observation data (Shen et al., 2009, 2013; W. Wang et al., 2019; Xu et al., 2018b). The colour bar reflects the sampling size of each model. The red solid line denotes the best-fit line through the data points. The black dashed line denotes the diagonal, which could be used to reflect the deviation of data points.
Owing to the severe air pollution issue frequently observed in recent years, especially nitrogen-bearing haze events, many studies have tried to predict the concentrations in China. Most of these studies employed CTMs to simulate the ambient concentrations over China. Huang et al. (2015) employed WRF-CMAQ to estimate the inorganic nitrogen deposition over the Pearl River Delta (PRD) and confirmed that the R value only reached 0.54. Afterwards, Han et al. (2017) used RAMS-GMAQ to predict the dry deposition flux of reactive nitrogen and significantly underestimated the concentration in the atmosphere. Very recently, Geng et al. (2019) used CMAQ to estimate the concentrations over east China, and the predictive performance (R=0.53) showed a similar result to Huang et al. (2015). Apart from these CTMs, statistical models have also been applied to estimate the ambient concentration over China. Unfortunately, the predictive accuracy was not good based on traditional statistical models (e.g. linear regression) (R=0.47) (Jia et al., 2016). In terms of model performance, the developed product in our study was much better than those developed by pioneering studies. Furthermore, this product showed many extra advantages than those obtained by CTMs, especially for the estimates of air pollutants. For instance, CTMs generally required continuous emission inventory data, which were often not available and showed high uncertainties. Moreover, CTMs generally needed substantial computing time and big input data to ensure reliable predictive accuracy. Thus, the product retrieved by CTMs often lacks a long-term dataset (>10 years), and our study fills the gaps of previous studies.
4.3 Spatial pattern of newly developed dataset
The monthly concentration displayed a similar distribution characteristic to PM2.5 and PM1 (Wei et al., 2019). Overall, the concentration in east China was much higher than that in west China. The higher concentration was concentrated on NCP (3.55±1.25 µg N m−3), followed by the Yangtze River Delta (YRD) (2.56±1.12 µg N m−3), Pearl River Delta (PRD) (1.68±0.81 µg N m−3), and Sichuan Basin (1.53±0.63 µg N m−3), and the lowest one was observed in the Tibetan Plateau (0.42±0.25 µg N m−3) (Fig. 5). Most provinces over NCP such as Beijing, Hebei, Henan, and Shandong suffered from severe pollution due to dense human activities and strong industry foundation (Li et al., 2017) (Fig. S7 in the Supplement), which released a large amount of N-bearing gaseous pollutants to the atmosphere, especially in winter. In Beijing–Tianjin–Hebei (BTH) (2.97±1.97 µg N m−3), Wang et al. (2016) verified that this fresh NOx emitted from power plants or cement industries could be transformed into nitrate in the particulate phase by the aid of low air temperature. In the YRD and PRD, the combustion of fossil fuels and traffic emissions was considered to be the major source of NOx emission, which favoured the formation of nitrate events through the gas–particle conversion processes (Fu et al., 2017; Kong et al., 2020; Ming et al., 2017). Apart from the contributions of smelting industries, the poor topographical or meteorological conditions were also responsible for the severe pollution in the Sichuan Basin (Tian et al., 2017; Wang et al., 2017). The Tibetan Plateau generally showed clean air quality due to the unique landscape and scarce industrial activity (Yang et al., 2018). In addition, it was interesting to note that the Altai region and Taklimakan desert in the Xinjiang autonomous region also showed some hotspots, though these regions were often believed to be remote. It was assumed that the many petrochemical industries (e.g. Karamay oil field) were located in the Altai region (Liu et al., 2018). In addition, Qi et al. (2018) verified that the resuspension of soil dust might trigger the accumulation of concentration in the aerosol.
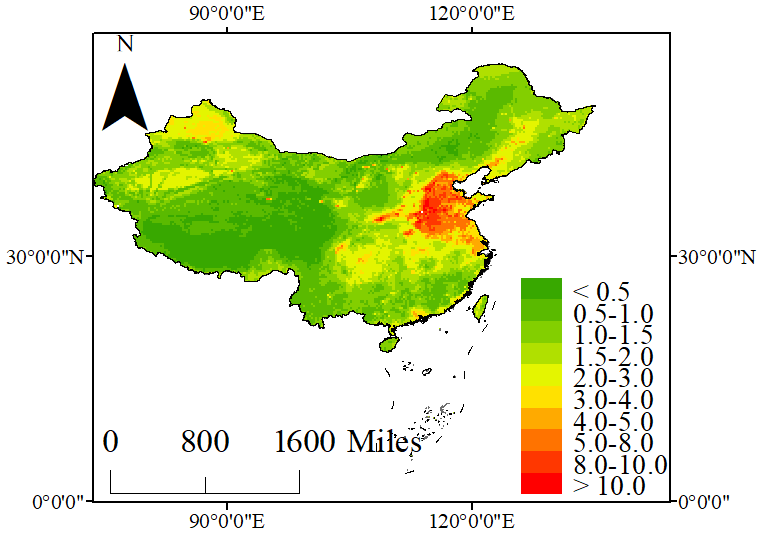
Figure 5The spatial pattern of estimated concentration (µg N m−3) over China during 2005–2015 based on the ensemble model.
4.4 Long-term trend of ambient across China
The temporal variation in levels from 2005 to 2015 over China has been clarified in Figs. 6 and 7 and Table S3 in the Supplement. Overall, the ambient concentration in China showed the significant increasing trend of 0.10 during 2005–2014, while it decreased sharply from 2014 to 2015 by −0.40 . Overall, more than 90 % of mainland China showed consistent temporal variation with a gradual increase from 2005 to 2013/14 and then rapid decrease from 2013/14 to 2015. However, the decreasing/increasing speed displayed significant spatial difference in some major regions of China. For instance, the ambient level in BTH showed a remarkable increase during 2005–2013 by 0.20 . Afterwards, the level decreased rapidly from 2013 to 2015 at a rate of −0.58 . The concentrations in the YRD (0.11 ) and PRD (0.05 ) both showed slight increases during 2005–2013, though the statistical test revealed the increases were significant (p<0.05). However, the concentrations in the YRD and PRD showed dramatic decreases with −0.48 and −0.36 during 2013–2015, respectively. As seen from 2005 to 2015, the concentration in BTH displayed on slight increase during this period. Nevertheless, the levels in the YRD and PRD both displayed slow decreases of −0.01 and −0.03 , respectively.
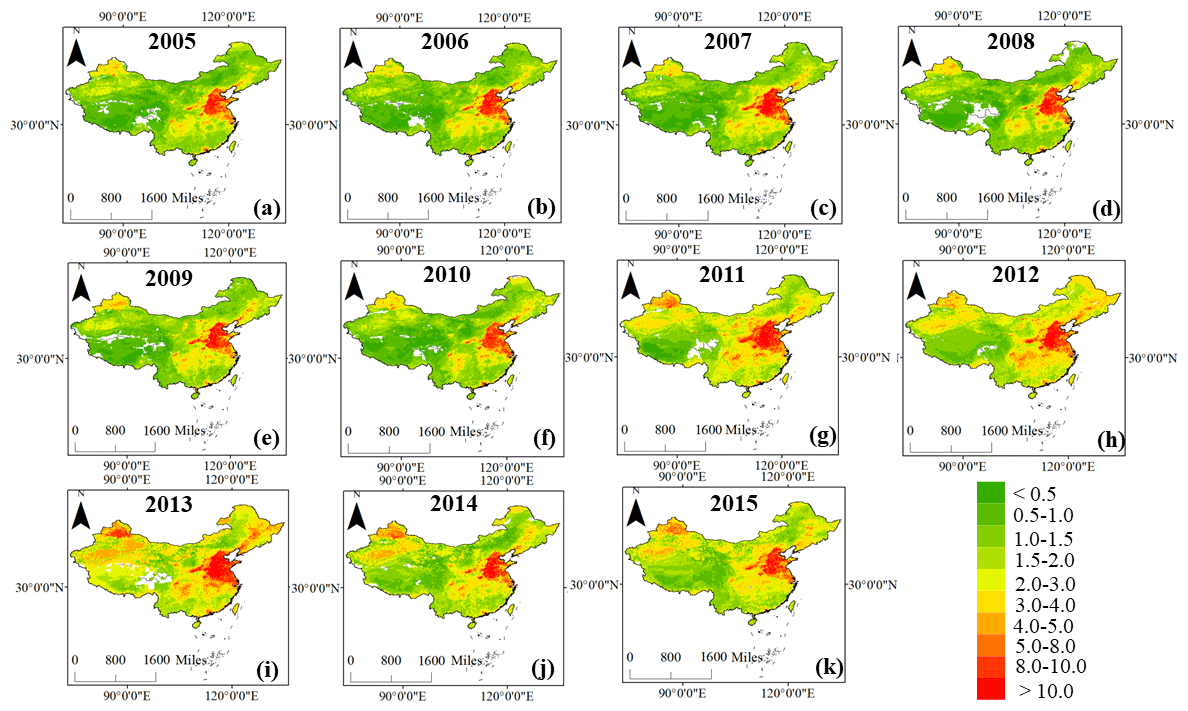
Figure 6The annual mean predicted concentrations (µg N m−3) across the entire study area from (a–k) 2005–2015 based on the ensemble model.

Figure 7The annual mean concentrations in major regions across China during 2005–2015. The solid lines denote the mean concentrations, and the shadow represents the range of concentrations.
Furthermore, the different provinces displayed disparate temporal variations, especially during 11th 5-year plan (2005–2010). A total of 31 provinces (municipalities/autonomous region) of China can be classified into three clusters based on the temporal trends of concentrations during the 11th 5-year plan. The first cluster featured a gradual increase in concentration during this period, which consisted of three provinces in northeast China (e.g. Heilongjiang) and central provinces in south China (e.g. Jiangxi, Anhui) (Table S3). The second cluster represented the provinces with stable increases of during 2005–2007 and slight decreases during 2007–2010. Some provinces of the NCP (e.g. Beijing, Hebei, Henan) and northwest China (e.g. Gansu, Inner Mongolia, Ningxia) fell into the second cluster. The last cluster featured the opposite temporal trend to the second cluster during 2005–2010, which included many southern provinces such as Fujian, Guangdong, Zhejiang, and Guangxi. Although the central government proposed the emission reduction goal in 2006, the ambient concentrations in most provinces did not display pronounced decreases, which was totally different from the decrease in PM2.5 since 2007 (Xue et al., 2019). Especially in the provinces of northeast China (e.g. Liaoning), the ambient concentrations in these provinces still showed rapid increases after the proposal of emission control measures. It was assumed that these provinces generally possessed a large amount of energy-intensive industries and coal-fired power plants (Zhang et al., 2018). Moreover, the result might be associated with the fact that the emission reduction measures focused on the reduction of SO2 emission rather than NOx emission (Kanada et al., 2013). Schreifels et al. (2012) revealed that major control measures during this period included shutting down inefficient industries, increasing the pollution levy for excessive SO2 emissions, and implementing energy conservation projects. Therefore, the total SO2 emission in 2010 decreased by more than 14 % compared with the emission in 1995. The ambient SO2 concentrations in many provinces since 2005 have displayed significant decreases compared with those in the 1990s (Li et al., 2020b; Lu et al., 2013; Zhou et al., 2015). Nonetheless, the NOx emission in China did not display a significant decrease during this period (Duncan et al., 2016; Granier et al., 2017), and thus the ambient in many provinces still maintained higher concentrations. It should be noted that the concentrations in some provinces of the NCP exhibited slow decreases after 2007. It was supposed that the energy structure adjustment and elimination of backward production capacity promoted the small decrease in concentrations (Ma et al., 2019). Unfortunately, the slight decreases were quickly offset by the rapid increase in energy consumption. Zhang et al. (2018) demonstrated that the industry-added value and private cars in BTH increased by 189.4 % and 279.6 % during 2005–2010, respectively. In addition, the decrease in SO2 emission rather than NOx emission can further lead to a increase because of decreased aerosol acidity, which was dictated by in particulate matter (Xie et al., 2020; Vasilakos et al., 2018).
Since 2010, the central government has begun to implement severe limitations in PM2.5, NOx, and soot emissions, and thus the total NOx emission during the 11th 5-year plan (2011–2015) showed a slow decrease (10 %) across China (Ma et al., 2019). However, the concentrations across China did not show a rapid response to the emission control measures. For instance, the concentrations in most provinces of China still showed rapid increases during 2010–2013 (2014) (Figs. 7 and 8). The result suggested that the control measures about the NOx emissions from vehicles and ships might not be very effective. Until 2013, the central government had issued the Action Plan for Air Pollution Prevention and Control (APPC-AP) in order to enhance air pollution prevention measures (Li et al., 2017, 2019). Many powerful economic and policy means including pricing (tax) policy and optimisation of industrial layout caused rapid decreases in concentrations after 2013 in many provinces (e.g. Beijing, Hebei, Zhejiang). Y. Wang et al. (2019a) also verified that the level in PM2.5 over BTH decreased by 20 % during 2013–2015, which was in accordance with the findings of our study. In addition to the impact of emission reduction, the rapid decrease in concentration over China after 2013 might be linked with beneficial meteorological factors because Z. Chen et al. (2019) demonstrated that favourable meteorological conditions led to about 20 % of the PM2.5 decrease in BTH during 2013–2015. However, the decreasing trend of concentration during 2014/15 in the PRD (−0.36 ) was significantly slower than that in BTH (−0.58 ) and the YRD (−0.48 ) (Table 4). Y. Wang et al. (2019a) found that the ambient concentration in a background site of the PRD even showed an upward trend during 2014–2016. Thus, it was necessary to strengthen the control of nitrogen oxide emissions.
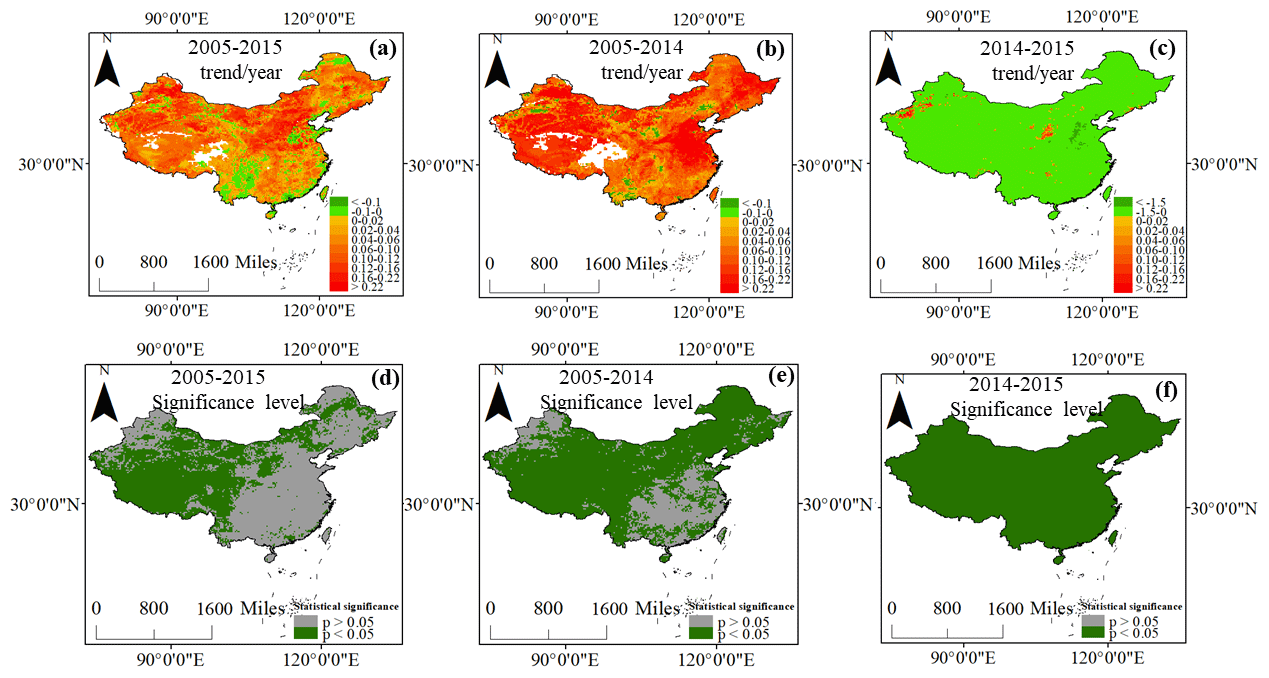
Figure 8The long-term trends of concentrations (µg N m−3) and significance levels in China (a, b, and c denote the annual variation in ambient concentration during 2005–2015, 2005–2014, and 2014/15, respectively. Panels (d), (e), and (f) represent the significance level of the trend during these periods). The pale green colour denotes the regions with significant variation in ambient concentrations (p<0.05), while the grey colour represents the regions with insignificant variation in concentrations.
Table 4The trend analysis of concentrations in China, BTH, YRD, and PRD regions during 2005–2015.

In general, the ambient concentration varied greatly at the seasonal scale (Fig. 9). China underwent the most serious pollution in winter (1.57±0.63 µg N m−3), followed by autumn (1.09±0.52 µg N m−3) and spring (0.78±0.50 µg N m−3), and the lowest one in summer (0.63±0.40 µg N m−3) (Table S4 in the Supplement). The higher concentration observed in winter might be contributed by the dense coal combustion in north China and unfavourable meteorological conditions (Itahashi et al., 2017; Quan et al., 2014; Y. L. Wang et al., 2019). The lightest pollution in summer was attributable to the abundant precipitation, which promoted the diffusion and removal of pollutants and reduced ambient level (Hu et al., 2005). The ratio of concentration in winter () and that in summer () varied greatly at the spatial scale. The in some provinces (municipalities) including Tianjin (2.11), Hebei (2.25), and Henan (2.84) displayed higher values compared with other provinces. The higher in the NCP might be affected by the fossil fuel combustion for domestic heating, while some southern provinces did not need domestic heating in winter. In contrast, the ratio of exhibited lower values in some western provinces such as Tibet and Qinghai. This might be associated with less aerosol emission from anthropogenic sources and higher wind speed (Wei et al., 2019).
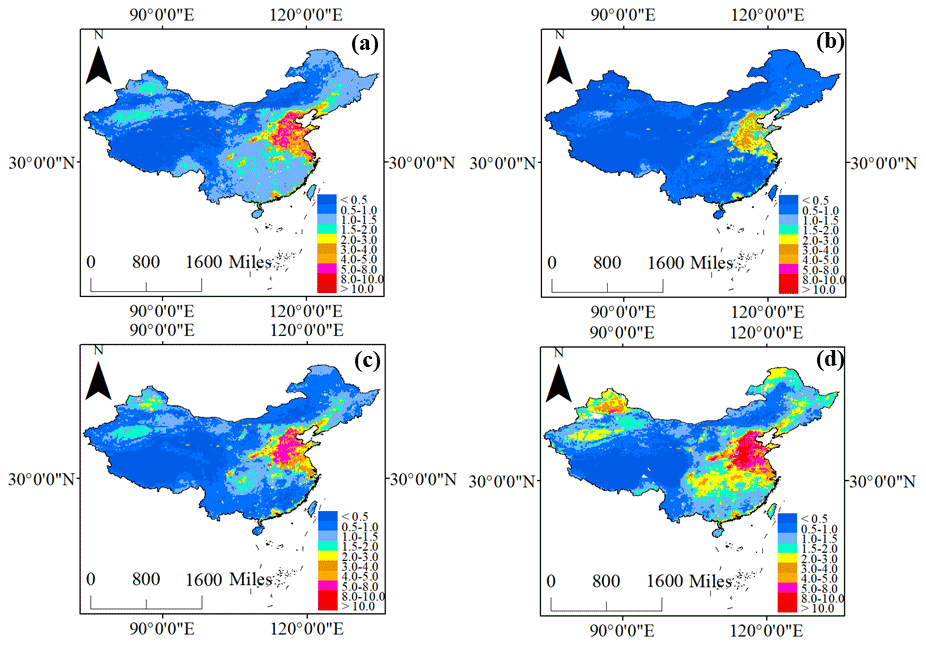
Figure 9The mean concentrations of ambient in spring (a), summer (b), autumn (c), and winter (d) during 2005–2015 over the study area.
4.5 Uncertainty analysis of estimation
The ensemble model of three machine-learning algorithms captured better accuracy in predicting the level from OMI data. Nonetheless, the ensemble model still showed some improvement space in terms of the R2 value. At first, meteorological data collected from reanalysis on the ECMWF website generally showed high uncertainty, which inevitably increased the error of estimation. In our study, we validated the gridded T2m and Tp datasets against the ground-observed datasets and found that the R2 values of T2m and Tp reached 0.98 and 0.83 (Table S5 in the Supplement), respectively. The result suggested that T2m showed a lower uncertainty, while Tp displayed relatively higher uncertainty. Except T2m and Tp, the ground-level datasets for other meteorological factors were not open access, and thus we cannot assess their uncertainties. Thus, we only reviewed some references and evaluated their uncertainties. For instance, Guo et al. (2019) found that the reanalysis BLH data also exhibited large uncertainties because few sounding data were assimilated. These uncertainties derived from predictors could be passed to the ensemble model and thus increase the uncertainties of ambient estimates.
The second reason was closely linked to the missing NO2 column amount across China. The NO2 column amount retrieval showed many nonrandom biases, especially for the arid or semi-arid area with high surface reflectance. The missing NO2 column amounts over China were not filled in our study due to the increased uncertainty of filling the NO2 column. Moreover, it should be noted that the monthly NO2 column amounts were averaged based on the daily one, and the missing ratio of daily NO2 columns during 2005–2015 reached 57.64 %. The higher missing ratio might increase the uncertainty of simulation.
Lastly, the developed ensemble model did not integrate the direct spatiotemporal weight indicators (e.g. the distance of observed sites and contiguous grids) though many predictors (e.g. month of year) reflecting spatiotemporal autocorrelation were input into the original model as the key predictors. Furthermore, the developed model was the ensemble one of three original models, which ignored the spatiotemporal autocorrelation of estimation residue from first-stage model. In future work, the ensemble model could be combined with a space-time model to further enhance the modelling performance.
The code used for this article is not publicly available, but can be obtained on request from the corresponding authors.
The monthly datasets at 0.25∘ resolution across China during 2005–2015 are available at https://doi.org/10.5281/zenodo.3988307 (Li et al., 2020c), which can be downloaded in xlsx format. The missing values are shown as NaN.
In this study, RF, GBDT, and XGBoost algorithms were combined to establish a high-resolution (0.25∘) dataset over China during 2005–2015 on the basis of multi-source predictors. The product showed a high cross-validation R2 value (0.78) but low RMSE (1.19 µg N m−3) and MAE (0.81 µg N m−3). The dataset showed the marked spatiotemporal discrepancy. The R2 value was in the order of summer (0.75) across China, and the R2 showed the highest value in the NCP. In addition, the dataset exhibited excellent transferability (R2=0.85, RMSE=0.74 µg N m−3, and MAE=0.55 µg N m−3) on the basis of the non-learning-observed data in 10 sites.
The newly developed dataset showed remarkable predictive accuracy compared with previous products developed by CTMs and linear regression models. The result might be linked to two key reasons. First of all, the new product assimilated high-resolution NO2 column amount instead of the NOx emission inventory used by CTMs. The imperfect knowledge about the chemical modules with regard to the formation and the inaccurate emission inventory decreased the predictive performance of CTMs. In contrast, the new product was obtained using an ensemble machine-learning model, which did not need to consider the photochemical or aqueous process from gaseous NO2 to particulate . Compared with the product estimated by linear regression model (R2=0.21), the new product significantly elevated the modelling performance of concentration. It was supposed that the ensemble model for the development of the new dataset did not predefine the potential relationships between explanatory variables and level like the multiple regression model, which must assume the linear linkage between dependent variables and predictors before model establishment.
On the basis of the dataset, the spatiotemporal variation in concentration over China during 2005–2015 was clarified. The annual mean concentration followed the order of NCP (0.42±0.25 µg N m−3). The higher concentrations in the NCP, YRD, and PRD were mainly contributed by the intensive industrial and traffic emissions. The Sichuan Basin suffered serious pollution due to the high loadings of aerosols and unfavourable terrain conditions. The Tibetan Plateau showed the lightest pollution because of the scarce anthropogenic emissions and favourable meteorological factors. Additionally, we also found that the ambient concentration showed significant increasing trend of 0.10 during 2005–2014, while it decreased sharply from 2014 to 2015 at a rate of −0.40 . The ambient levels in BTH, YRD, and PRD displayed slight increases at the rate of 0.20, 0.11, and 0.05 during 2013–2015, respectively. Afterwards, the concentrations decreased sharply at the speed of −0.58, −0.48, and −0.36 . Although National Economic and Social Development of China issued an emission reduction goal in 2006, the concentrations in most provinces did not show significant decreases during 2005–2010. This might be contributed by the increase in energy consumption and non-targeted emission control measures. Since 2010, the government began to decrease the NOx emission over China, whereas the concentrations in many provinces still showed slight increases during 2010–2014 because the benefits of control measures for NOx emission could be neutralised by elevated energy consumption along with rapid economic development. Since 2014, the Chinese government has issued APPC-AP and further enhanced the emission control measures, which triggered the dramatic decrease in concentration over China. Apart from the effect of emission reduction, the favourable meteorological conditions might have led to the rapid decrease in levels over China during 2014/15. Compared with the powerful emission control measures, meteorological factors only contributed a small portion of reduction in China. In addition, the decrease speed of level in China also displayed pronounced spatial heterogeneity, and some background regions have even featured an increase in air pollution in recent years. Therefore, it is still imperative to strengthen the emission reduction measures.
It must be acknowledged that our study still suffers from some limitations. First of all, the dataset was developed by machine-learning models, which lacked the chemical module concerning the transformation pathway from NO2 to , and might underestimate the ambient concentration across China. In future work, the output results of CTMs including the conversion ratio from NO2 to and dry–wet deposition flux of NO2 and in the atmosphere should be incorporated into the machine-learning model to develop a next-generation product. Second, the low-time-resolution (monthly) observation data hindered the daily estimation of concentration. The daily datasets are warranted in the future because they can be used to assess the potential impact on human health. In addition, the ultrahigh-resolution satellite (TROPOMI) can allow continuation and enhancement of the spatiotemporal estimation, and the OMI product could capture enough spatial variations across China.
The supplement related to this article is available online at: https://doi.org/10.5194/essd-13-2147-2021-supplement.
RL, LC, and HF conceived and designed the study. RL, LC, YZ, and WZ collected and processed the data. RL wrote this paper with contributions from all of the coauthors.
The authors declare that they have no conflict of interest.
This work was funded by Chinese Postdoctoral Science Foundation (2020M680589) and National Natural Science Foundation of China (no. 21777025).
This research has been supported by the National Natural Science Foundation of China (grant no. 91744205).
This paper was edited by David Carlson and reviewed by two anonymous referees.
Breiman, L.: Random forests, Mach. Learn., 45, 5–32, 2001.
Chen, H., Li, D., Gurmesa, G. A., Yu, G., Li, L., Zhang, W., Fang, H., and Mo, J.: Effects of nitrogen deposition on carbon cycle in terrestrial ecosystems of China: A meta-analysis, Environ. Pollut., 206, 352–360, https://doi.org/10.1016/j.envpol.2015.07.033, 2015.
Chen, J., Yin, J., Zang, L., Zhang, T., and Zhao, M.: Stacking machine learning model for estimating hourly PM2.5 in China based on Himawari-8 aerosol optical depth data, Sci. Total Environ., 697, 134021, https://doi.org/10.1016/j.scitotenv.2019.134021, 2019.
Chen, Z., Chen, D., Kwan, M.-P., Chen, B., Gao, B., Zhuang, Y., Li, R., and Xu, B.: The control of anthropogenic emissions contributed to 80 % of the decrease in PM2.5 concentrations in Beijing from 2013 to 2017, Atmos. Chem. Phys., 19, 13519–13533, https://doi.org/10.5194/acp-19-13519-2019, 2019.
Chen, Z. Y., Zhang, R., Zhang, T. H., Ou, C. Q., and Guo, Y.: A kriging-calibrated machine learning method for estimating daily ground-level NO2 in mainland China, Sci. Total Environ., 690, 556–564, https://doi.org/10.1016/j.scitotenv.2019.06.349, 2019.
Compton, J. E., Harrison, J. A., Dennis, R. L., Greaver, T. L., Hill, B. H., Jordan, S. J., Walker, H., and Campbell, H. V.: Ecosystem services altered by human changes in the nitrogen cycle: a new perspective for US decision making, Ecol. Lett., 14, 804–815, https://doi.org/10.1111/j.1461-0248.2011.01631.x, 2011.
Cui, S., Shi, Y., Malik, A., Lenzen, M., Gao, B., and Huang, W.: A hybrid method for quantifying China's nitrogen footprint during urbanisation from 1990 to 2009, Environ. Int., 97, 137–145, https://doi.org/10.1016/j.envint.2016.08.012, 2016.
Du, E., de Vries, W., Galloway, J. N., Hu, X., and Fang, J.: Changes in wet nitrogen deposition in the United States between 1985 and 2012, Environ. Res. Lett., 9, 095004, https://doi.org/10.1088/1748-9326/9/9/095004, 2014.
Duncan, B. N., Lamsal, L. N., Thompson, A. M., Yoshida, Y., Lu, Z., Streets, D. G., Hurwitz, M. M., and Pickering, K. E.: A space-based, high-resolution view of notable changes in urban NOx pollution around the world (2005–2014), J. Geophy. Res., 121, 976–996, https://doi.org/10.1002/2015JD024121, 2016.
Erisman, J. W., Galloway, J. N., Seitzinger, S., Bleeker, A., Dise, N. B., Petrescu, A. R., Leach, A. M., and de Vries, W.: Consequences of human modification of the global nitrogen cycle, Philos. T. R. Soc. B, 368, 20130116, https://doi.org/10.1098/rstb.2013.0116, 2013.
Fu, H. and Chen, J.: Formation, features and controlling strategies of severe haze-fog pollutions in China, Sci. Total Environ., 578, 121–138, https://doi.org/10.1016/j.scitotenv.2016.10.201, 2017.
Fu, X., Wang, S., Xing, J., Zhang, X., Wang, T., and Hao, J.: Increasing ammonia concentrations reduce the effectiveness of particle pollution control achieved via SO2 and NOX emissions reduction in east China, Environ. Sci. Tech. Lett., 4, 221–227, https://doi.org/10.1021/acs.estlett.7b00143, 2017.
Geng, G. N., Murray, N. L., Chang, H. H., and Liu, Y.: The sensitivity of satellite-based PM2.5 estimates to its inputs: Implications to model development in data-poor regions, Environ. Interna., 121, 550–560, 2018.
Geng, G. N., Xiao, Q. Y., Zheng, Y. X., Tong, D., Zhang, Y. X., Zhang, X. Y., Zhang, Q., He, K. B., and Liu, Y.: Impact of China's Air Pollution Prevention and Control Action Plan on PM2.5 chemical composition over eastern China, Atmos. Chem. Phys. Sci. China Earth Sci., 62, 1–13, 2019.
Granier, C., Granier, L., Sindelarova, K., Liousse, C., Darras, S., Bouarar, I., van der Gon, H. D., Frost, G. J., Janssens-Maenhout, G., and Crippa, M.: Trends in anthropogenic emissions from 1960 to 2015, HAL Archives, International Emission Inventory Conference “Applying Science and Streamlining Processes to Improve Inventories”, August 2017, Baltimore, United States, hal-02144893, 2017.
Guo, J., Su, T., Chen, D., Wang, J., Li, Z., Lv, Y., Guo, X., Liu, H., Cribb, M., and Zhai, P.: Declining Summertime Local-Scale Precipitation Frequency Over China and the United States, 1981–2012. The Disparate Roles of Aerosols, Geophys. Res. Lett., 46, 13281–13289, https://doi.org/10.1029/2019GL085442, 2019.
Han, X., Zhang, M., Skorokhod, A., and Kou, X.: Modeling dry deposition of reactive nitrogen in China with RAMS-CMAQ, Atmos. Environ., 166, 47–61, https://doi.org/10.1016/j.atmosenv.2017.07.015, 2017.
Hu, M., Zhang, J., and Wu, Z.: Chemical compositions of precipitation and scavenging of particles in Beijing, Sci. China Ser. B, 48, 265–272, 2005.
Huang, Z., Wang, S., Zheng, J., Yuan, Z., Ye, S., and Kang, D.: Modeling inorganic nitrogen deposition in Guangdong province, China, Atmos. Environ., 109, 147–160, https://doi.org/10.1016/j.atmosenv.2015.03.014, 2015.
Itahashi, S., Uno, I., Osada, K., Kamiguchi, Y., Yamamoto, S., Tamura, K., Wang, Z., Kurosaki, Y., and Kanaya, Y.: Nitrate transboundary heavy pollution over East Asia in winter, Atmos. Chem. Phys., 17, 3823–3843, https://doi.org/10.5194/acp-17-3823-2017, 2017.
Jia, Y., Yu, G., Gao, Y., He, N., Wang, Q., Jiao, C., and Zuo, Y.: Global inorganic nitrogen dry deposition inferred from ground-and space-based measurements, Sci. Rep., 6, 19810, https://doi.org/10.1038/srep19810, 2016.
Kanada, M., Dong, L., Fujita, T., Fujii, M., Inoue, T., Hirano, Y., Togawa, T., and Geng, Y.: Regional disparity and cost-effective SO2 pollution control in China: A case study in 5 mega-cities, Energ. Policy, 61, 1322–1331, https://doi.org/10.1016/j.enpol.2013.05.105, 2013.
Kendall, M. G.: Rank Correlation methods[M], Charles Griffin, London, 1975.
Kong, L., Hu, M., Tan, Q., Feng, M., Qu, Y., An, J., Zhang, Y., Liu, X., and Cheng, N.: Aerosol optical properties under different pollution levels in the Pearl River Delta (PRD) region of China, J. Environ. Sci., 87, 49–59, https://doi.org/10.1016/j.jes.2019.02.019, 2020.
Kong, L., Tang, X., Zhu, J., Wang, Z., Li, J., Wu, H., Wu, Q., Chen, H., Zhu, L., Wang, W., Liu, B., Wang, Q., Chen, D., Pan, Y., Song, T., Li, F., Zheng, H., Jia, G., Lu, M., Wu, L., and Carmichael, G. R.: A 6-year-long (2013–2018) high-resolution air quality reanalysis dataset in China based on the assimilation of surface observations from CNEMC, Earth Syst. Sci. Data, 13, 529–570, https://doi.org/10.5194/essd-13-529-2021, 2021.
Li, R., Cui, L., Li, J., Zhao, A., Fu, H., Wu, Y., Zhang, L., Kong, L., and Chen, J.: Spatial and temporal variation of particulate matter and gaseous pollutants in China during 2014–2016, Atmos. Environ., 161, 235–246, https://doi.org/10.1016/j.atmosenv.2017.05.008, 2017.
Li, R., Wang, Z., Cui, L., Fu, H., Zhang, L., Kong, L., Chen, W., and Chen, J.: Air pollution characteristics in China during 2015–2016: Spatiotemporal variations and key meteorological factors, Sci. Total Environ., 648, 902–915, https://doi.org/10.1016/j.scitotenv.2018.08.181, 2019.
Li, R., Cui, L., Hongbo, F., Li, J., Zhao, Y., and Chen, J.: Satellite-based estimation of full-coverage ozone (O3) concentration and health effect assessment across Hainan Island, J. Clean. Prod., 244, 118773, https://doi.org/10.1016/j.jclepro.2019.118773, 2020a.
Li, R., Cui, L., Liang, J., Zhao, Y., Zhang, Z., and Fu, H.: Estimating historical SO2 level across the whole China during 1973–2014 using random forest model, Chemosphere, 125839, https://doi.org/10.1016/j.chemosphere.2020.125839, 2020b.
Li, R., Cui, L. L., Zhao, Y. L., Zhou, W. H., and Fu, H. B.: Long-term trends of ambient nitrate () concentrations across China based on ensemble machine-learning models, https://doi.org/10.5281/zenodo.3988307, 2020c.
Liu, L., Zhang, X., Xu, W., Liu, X., Li, Y., Lu, X., Zhang, Y., and Zhang, W.: Temporal characteristics of atmospheric ammonia and nitrogen dioxide over China based on emission data, satellite observations and atmospheric transport modeling since 1980, Atmos. Chem. Phys., 17, 9365–9378, https://doi.org/10.5194/acp-17-9365-2017, 2017.
Liu, X., Duan, L., Mo, J., Du, E., Shen, J., Lu, X., Zhang, Y., Zhou, X., He, C., and Zhang, F.: Nitrogen deposition and its ecological impact in China: an overview, Environ. Pollut., 159, 2251–2264, https://doi.org/10.1016/j.envpol.2010.08.002, 2011.
Liu, X., Xu, W., Duan, L., Du, E., Pan, Y., Lu, X., Zhang, L., Wu, Z., Wang, X., and Zhang, Y.: Atmospheric nitrogen emission, deposition, and air quality impacts in China: An overview, Current Pollution Reports, 3, 65–77, 2017.
Liu, Z., Gao, W., Yu, Y., Hu, B., Xin, J., Sun, Y., Wang, L., Wang, G., Bi, X., Zhang, G., Xu, H., Cong, Z., He, J., Xu, J., and Wang, Y.: Characteristics of PM2.5 mass concentrations and chemical species in urban and background areas of China: emerging results from the CARE-China network, Atmos. Chem. Phys., 18, 8849–8871, https://doi.org/10.5194/acp-18-8849-2018, 2018.
Lu, Z., Streets, D. G., de Foy, B., and Krotkov, N. A.: Ozone Monitoring Instrument observations of interannual increases in SO2 emissions from Indian coal-fired power plants during 2005–2012, Environ. Sci. Tech., 47, 13993–14000, https://doi.org/10.1021/es4039648, 2013.
Ma, Z., Liu, R., Liu, Y., and Bi, J.: Effects of air pollution control policies on PM2.5 pollution improvement in China from 2005 to 2017: a satellite-based perspective, Atmos. Chem. Phys., 19, 6861–6877, https://doi.org/10.5194/acp-19-6861-2019, 2019.
Mann, H. B.: Nonparametric tests against trend Econometrica, J. Econom. Soc., 13, 245–259, 1945.
Ming, L., Jin, L., Li, J., Fu, P., Yang, W., Liu, D., Zhang, G., Wang, Z., and Li, X.: PM2.5 in the Yangtze River Delta, China: Chemical compositions, seasonal variations, and regional pollution events, Environ. Pollut., 223, 200–212, https://doi.org/10.1016/j.envpol.2017.01.013, 2017.
Qi, J., Liu, X., Yao, X., Zhang, R., Chen, X., Lin, X., Gao, H., and Liu, R.: The concentration, source and deposition flux of ammonium and nitrate in atmospheric particles during dust events at a coastal site in northern China, Atmos. Chem. Phys., 18, 571–586, https://doi.org/10.5194/acp-18-571-2018, 2018.
Qiao, X., Xiao, W., Jaffe, D., Kota, S. H., Ying, Q., and Tang, Y.: Atmospheric wet deposition of sulfur and nitrogen in Jiuzhaigou national nature reserve, Sichuan province, China, Sci. Total Environ., 511, 28–36, https://doi.org/10.1016/j.scitotenv.2014.12.028, 2015.
Qin, K., Zou, J., Guo, J., Lu, M., Bilal, M., Zhang, K., Ma, F., and Zhang, Y.: Estimating PM1 concentrations from MODIS over Yangtze River Delta of China during 2014–2017, Atmos. Environ., 195, 149–158, https://doi.org/10.1016/j.atmosenv.2018.09.054, 2018.
Quan, J., Tie, X., Zhang, Q., Liu, Q., Li, X., Gao, Y., and Zhao, D.: Characteristics of heavy aerosol pollution during the 2012–2013 winter in Beijing, China, Atmos. Environ., 88, 83–89, https://doi.org/10.1016/j.atmosenv.2014.01.058, 2014.
Schreifels, J. J., Fu, Y., and Wilson, E. J.: Sulfur dioxide control in China: policy evolution during the 10th and 11th Five-year Plans and lessons for the future, Energ. Policy, 48, 779–789, https://doi.org/10.1016/j.enpol.2012.06.015, 2012.
Shen, J., Tang, A., Liu, X., Fangmeier, A., Goulding, K., and Zhang, F.: High concentrations and dry deposition of reactive nitrogen species at two sites in the North China Plain, Environ. Pollut., 157, 3106–3113, https://doi.org/10.1016/j.envpol.2009.05.016, 2009.
Shen, J., Li, Y., Liu, X., Luo, X., Tang, H., Zhang, Y., and Wu, J.: Atmospheric dry and wet nitrogen deposition on three contrasting land use types of an agricultural catchment in subtropical central China, Atmos. Environ., 67, 415–424, https://doi.org/10.1016/j.atmosenv.2012.10.068, 2013.
Singh, S., Sharma, A., Kumar, B., and Kulshrestha, U.: Wet deposition fluxes of atmospheric inorganic reactive nitrogen at an urban and rural site in the Indo-Gangetic Plain, Atmos. Pollut. Res., 8, 669–677, https://doi.org/10.1016/j.apr.2016.12.021, 2017.
Tang, Q. H., Lan, C., Su, F. G., Liu, X. C., Sun, H., Ding, J., Wang, L., Leng, G. Y., Zhang, Y. Q., Sang, Y. F., Fang, H. Y., Zhang, S. F., Han, D. M., Liu, X. M., He, L., Xu, X. M., Tang, Y., and Chen, D. L.: Streamflow change on the Qinghai-Tibet Plateau and its impacts, Sci. Bull., 64, 2807–2821, 2019.
Tian, M., Wang, H., Chen, Y., Zhang, L., Shi, G., Liu, Y., Yu, J., Zhai, C., Wang, J., and Yang, F.: Highly time-resolved characterization of water-soluble inorganic ions in PM2.5 in a humid and acidic mega city in Sichuan Basin, China, Sci. Total Environ., 580, 224–234, https://doi.org/10.1016/j.scitotenv.2016.12.048, 2017.
Vasilakos, P., Russell, A., Weber, R., and Nenes, A.: Understanding nitrate formation in a world with less sulfate, Atmos. Chem. Phys., 18, 12765–12775, https://doi.org/10.5194/acp-18-12765-2018, 2018.
Vrekoussis, M., Richter, A., Hilboll, A., Burrows, J., Gerasopoulos, E., Lelieveld, J., Barrie, L., Zerefos, C., and Mihalopoulos, N.: Economic crisis detected from space: Air quality observations over Athens/Greece, Geophy. Res. Lett., 40, 458–463, https://doi.org/10.1002/grl.50118, 2013.
Wang, H., Shi, G., Tian, M., Zhang, L., Chen, Y., Yang, F., and Cao, X.: Aerosol optical properties and chemical composition apportionment in Sichuan Basin, China, Sci. Total Environ., 577, 245–257, https://doi.org/10.1016/j.scitotenv.2016.10.173, 2017.
Wang, Q., Zhuang, G., Huang, K., Liu, T., Lin, Y., Deng, C., Fu, Q., Fu, J. S., Chen, J., and Zhang, W.: Evolution of particulate sulfate and nitrate along the Asian dust pathway: Secondary transformation and primary pollutants via long-range transport, Atmos. Res., 169, 86–95, https://doi.org/10.1016/j.atmosres.2015.09.013, 2016.
Wang, W., Xu, W., Wen, Z., Wang, D., Wang, S., Zhang, Z., Zhao, Y., and Liu, X.: Characteristics of Atmospheric Reactive Nitrogen Deposition in Nyingchi City, Sci. Rep., 9, 1–11, https://doi.org/10.1038/s41598-019-39855-2, 2019.
Wang, Y., Li, W., Gao, W., Liu, Z., Tian, S., Shen, R., Ji, D., Wang, S., Wang, L., and Tang, G.: Trends in particulate matter and its chemical compositions in China from 2013–2017, Sci. China Earth Sci., 62, 1857–1871, https://doi.org/10.1007/s11430-018-9373-1, 2019a.
Wang, Y., Li, W., Gao, W., Liu, Z., Tian, S., Shen, R., Ji, D., Wang, S., Wang, L., and Tang, G.: Trends in particulate matter and its chemical compositions in China from 2013–2017, Sci. China Earth Sci., 62, 1–15, https://doi.org/10.1007/s11430-018-9373-1, 2019b.
Wang, Y. L., Song, W., Yang, W., Sun, X. C., Tong, Y. D., Wang, X. M., Liu, C. Q., Bai, Z. P., and Liu, X. Y.: Influences of atmospheric pollution on the contributions of major oxidation pathways to PM2.5 nitrate formation in Beijing, J. Geophy. Res., 124, 4174–4185, https://doi.org/10.1029/2019JD030284, 2019.
Wei, J., Huang, W., Li, Z., Xue, W., Peng, Y., Sun, L., and Cribb, M.: Estimating 1-km-resolution PM2.5 concentrations across China using the space-time random forest approach, Remote Sens. Environ., 231, 111221, https://doi.org/10.1016/j.rse.2019.111221, 2019.
Wolpert, D. H.: Stacked generalization, Neural Networks, 5, 241–259, https://doi.org/10.1016/S0893-6080(05)80023-1, 1992.
Xiao, Q., Chang, H., Geng, G., and Liu, Y.: An ensemble machine-learning model to predict historical PM2.5 concentrations in China from satellite data, Environ. Sci. Tech., 52, 13260–13269, https://doi.org/10.1021/acs.est.8b02917, 2018.
Xie, Y., Wang, G., Wang, X., Chen, J., Chen, Y., Tang, G., Wang, L., Ge, S., Xue, G., Wang, Y., and Gao, J.: Nitrate-dominated PM2.5 and elevation of particle pH observed in urban Beijing during the winter of 2017, Atmos. Chem. Phys., 20, 5019–5033, https://doi.org/10.5194/acp-20-5019-2020, 2020.
Xu, W., Liu, L., Cheng, M., Zhao, Y., Zhang, L., Pan, Y., Zhang, X., Gu, B., Li, Y., Zhang, X., Shen, J., Lu, L., Luo, X., Zhao, Y., Feng, Z., Collett Jr., J. L., Zhang, F., and Liu, X.: Spatial–temporal patterns of inorganic nitrogen air concentrations and deposition in eastern China, Atmos. Chem. Phys., 18, 10931–10954, https://doi.org/10.5194/acp-18-10931-2018, 2018a.
Xu, W., Zhao, Y., Liu, X., Dore, A. J., Zhang, L., Liu, L., and Cheng, M.: Atmospheric nitrogen deposition in the Yangtze River basin: Spatial pattern and source attribution, Environ. Pollut., 232, 546–555, https://doi.org/10.1016/j.envpol.2017.09.086, 2018b.
Xu, W., Zhang, L., and Liu, X. J.: a database of atmospheric nitrogen concentration and deposition from the nationwide monitoring network in China, Sci. Data, 6, 51, https://doi.org/10.1038/s41597-019-0061-2, 2019.
Xue, T., Zheng, Y. X., Tong, D., Zheng, B., Li, X., Zhu, T., and Zhang, Q.: Spatiotemporal continuous estimates of PM2.5 concentrations in China, 2000–2016: A machine learning method with inputs from satellites, chemical transport model, and ground observations, Environ. Int., 123, 345–357, https://doi.org/10.1016/j.envint.2018.11.075, 2019.
Yang, J., Kang, S., and Ji, Z.: Sensitivity analysis of chemical mechanisms in the WRF-chem model in reconstructing aerosol concentrations and optical properties in the Tibetan plateau, Aerosol Air Qual. Res., 18, 505–521, https://doi.org/10.4209/aaqr.2017.05.0156, 2018.
Zang, L., Mao, F., Guo, J., Wang, W., Pan, Z., Shen, H., Zhu, B., and Wang, Z.: Estimation of spatiotemporal PM1.0 distributions in China by combining PM2.5 observations with satellite aerosol optical depth, Sci. Total Environ., 658, 1256–1264, https://doi.org/10.1016/j.scitotenv.2018.12.297, 2019.
Zhai, B. X. and Chen, J. G.: Development of a stacked ensemble model for forecasting and analyzing daily average PM2.5 concentrations in Beijing, China, Sci. Total Environ., 635, 644–658, https://doi.org/10.1016/j.scitotenv.2018.04.040, 2018.
Zhan, Y., Luo, Y., Deng, X., Chen, H., Grieneisen, M. L., Shen, X., Zhu, L., and Zhang, M.: Spatiotemporal prediction of continuous daily PM2.5 concentrations across China using a spatially explicit machine learning algorithm, Atmos. Environ., 155, 129–139, https://doi.org/10.1016/j.atmosenv.2017.02.023, 2017.
Zhan, Y., Luo, Y., Deng, X., Grieneisen, M. L., Zhang, M., and Di, B.: Spatiotemporal prediction of daily ambient ozone levels across China using random forest for human exposure assessment, Environ. Pollut., 233, 464–473, https://doi.org/10.1016/j.envpol.2017.10.029, 2018a.
Zhan, Y., Luo, Y., Deng, X., Zhang, K., Zhang, M., Grieneisen, M. L., and Di, B.: Satellite-Based estimates of daily NO2 exposure in China using hybrid random forest and spatiotemporal Kriging model, Environ. Sci. Tech., 52, 4180–4189, https://doi.org/10.1021/acs.est.7b05669, 2018b.
Zhang, X. Y., Zhang, W. T., Lu, X. H., Liu, X. J., Chen, D. M., Liu, L., and Huang, X. J.: Long-term trends in NO2 columns related to economic developments and air quality policies from 1997 to 2016 in China, Sci. Total Environ., 639, 146–155, https://doi.org/10.1016/j.scitotenv.2018.04.435, 2018.
Zhao, Y., Zhang, L., Chen, Y., Liu, X., Xu, W., Pan, Y., and Duan, L.: Atmospheric nitrogen deposition to China: A model analysis on nitrogen budget and critical load exceedance, Atmos. Environ., 153, 32–40, https://doi.org/10.1016/j.atmosenv.2017.01.018, 2017.
Zhou, K., Yang, S., Shen, C., Ding, S., and Sun, C.: Energy conservation and emission reduction of China's electric power industry, Renew. Sust. Energ. Rev., 45, 10–19, https://doi.org/10.1016/j.rser.2015.01.056, 2015.