the Creative Commons Attribution 4.0 License.
the Creative Commons Attribution 4.0 License.
 | 08 May 2021
MOSEV: a global burn severity database from MODIS (2000–2020)
Esteban Alonso-González
To make advances in the fire discipline, as well as in the study of CO2 emissions, it is of great interest to develop a global database with estimators of the degree of biomass consumed by fire, which is defined as burn severity. In this work we present the first global burn severity database (MOSEV database), which is based on Moderate Resolution Imaging Spectroradiometer (MODIS) surface reflectance and burned area (BA) products from November 2000 to near real time. To build the database we combined Terra MOD09A1 and Aqua MYD09A1 surface reflectance products to obtain dense time series of the normalized burn ratio (NBR) spectral index, and we used the MCD64A1 product to identify BA and the date of burning. Then, we calculated for each burned pixel the difference of the NBR (dNBR) and its relativized version (RdNBR), as well as the post-burn NBR, which are the most commonly used burn severity spectral indices. The database also includes the pre-burn NBR used for calculations, the date of the pre- and post-burn NBR, and the date of burning. Moreover, in this work we have compared the burn severity metrics included in MOSEV (dNBR, RdNBR and post-burn NBR) with the same ones obtained from Landsat-8 scenes which have an original resolution of 30 m. We calculated the Pearson's correlation coefficients and the significance of the relationships using 13 pairs of Landsat scenes randomly distributed across the globe, with a total BA of 6904 km2 (n=32 163). Results showed that MOSEV and Landsat-8 burn severity indices are highly correlated, particularly the post-burn NBR (R=0.88; P<0.001), and dNBR (R=0.74; P<0.001) showed stronger relationships than RdNBR (R=0.42; P<0.001). Differences between MOSEV and Landsat-8 indices are attributable to variability in reflectance values and to the different temporal resolution of both satellites (MODIS: 1–2 d; Landsat: 16 d). The database is structured according to the MODIS tiling system and is freely downloadable at https://doi.org/10.5281/zenodo.4265209 (Alonso-González and Fernández-García, 2020).
- Article
(2059 KB) - Full-text XML
- BibTeX
- EndNote


More than half of the land surface on Earth can be affected by fire, an area about the size of the European Union being burned annually (Keeley et al., 2011; Moritz et al., 2012; Andela et al., 2019). Thus, fire is a phenomenon of great interest because of its relevance worldwide but also because of expected changes in fire regimes as a consequence of global warming and land use change (Moreira et al., 2020). Among these changes, previous work has reported that fire weather seasons have recently increased (18.7 % from 1979 to 2013) (Jolly et al., 2015), whereas burned area (BA) has decreased globally (24.3 % from 1996 to 2015) (Andela et al., 2017; Forkel et al., 2019) mainly because of the agricultural expansion in fire-dependent savannas (Andela et al., 2017).
The availability of satellite imagery with moderate spatial resolution (250–500 m) and daily or near-daily temporal resolution has enabled the production of several global BA products. Among the most accepted are those based on the Moderate Resolution Imaging Spectrometer (MODIS) (Chuvieco et al., 2016), which retrieves information of the entire Earth in 36 spectral bands every 1 to 2 d. The MODIS MCD64A1 C6 product (Giglio et al., 2018) is the standard NASA BA product and probably the most used by the scientific community (Boschetti et al., 2019; Humber et al., 2018). The MCD64A1 BA product is calculated with surface reflectance time series and fire active masks (Giglio et al., 2018) and was recently validated with Landsat imagery across the globe (stage-3 validation), reaching coefficients of determination above 0.70 despite an underestimation of small fires as a consequence of its moderate spatial resolution (∼ 500 m) (Boschetti et al., 2019). Global BA products are essential to know the patterns of fire occurrence, fire extent, fire propagation (Rodrigues and Febrer, 2018) and fire frequency (Andela et al., 2019). Thus, BA products may be useful to provide an estimation of the global carbon emissions from biomass consumption (Veraverbeke et al., 2015; van der Werf et al., 2017). However, to go one step further in determining fire impacts on ecosystems, as well as global carbon emissions, it is necessary to characterize burned areas according to the degree of biomass consumption (Keeley, 2009; van der Werf et al., 2017).
The term used to define the degree of biomass consumption and the overall impact caused by fire on ecosystems is fire severity (preferred for field measurements) or burn severity (preferred for remote sensing measurements) (Keeley, 2009). Traditionally, burn severity has been quantified from Landsat sensors through different methods, including those based on radiative transfer models (Chuvieco et al., 2006; De Santis et al., 2009), spectral unmixing (Quintano et al., 2017) and spectral indices (Chu and Guo, 2014; Fernández-García et al., 2018a). Among them, the standard method to quantify burn severity is through the delta normalized burn ratio (dNBR) (Key and Benson, 2006) spectral index and its relativized version (RdNBR) (Miller and Thode, 2007) which is less dependent on the pre-fire vegetation and potentially more suitable than dNBR for comparisons among zones with different environmental conditions (Miller and Thode, 2007; Rahman et al., 2018). Both spectral indices are based on the change caused by fire in near-infrared (NIR) and shortwave-infrared (SWIR) reflectance, which are highly sensitive to canopy density and moisture content respectively (Chuvieco, 2010). The dNBR and RdNBR indices calculated from Landsat have shown a high capacity (R2 about 0.75) to correlate field measurements of biomass consumption and plant mortality in the Mediterranean (Fernández-García et al., 2018a), temperate (Parks et al., 2014), boreal (Soverel et al., 2011) and tropical ecosystems (Rozario et al., 2018). Despite the possibility of calculating burn severity indices with satellites allowing planetary coverage such as MODIS (Veraverbeke et al., 2011; Rahman et al., 2018), there are not yet available products of burn severity at the global scale, which would be useful to make advances in the fire and CO2 sciences.
In this work we present a new burn severity database based on MODIS Terra and Aqua satellites. The presented database (MOdis burn SEVerity: MOSEV) provides monthly burn severity data (dNBR, RdNBR and post-burn NBR) with global coverage since 2000 at 500 m spatial resolution. Additionally, this work describes the algorithm to develop the database, and we compared the MOSEV burn severity data with their Landsat-8 equivalents.
2.1 Input data
The MOSEV database was built using the following remote sensing data available since November 2000 as input (Fig. 1).
-
All scenes of MODIS Terra MOD09A1 and Aqua MYD09A1 version 6. Terra MOD09A1 and Aqua MYD09A1 scenes are 8 d composites with seven surface reflectance bands and quality information at a spatial resolution of 500 m and global coverage. The reflectance value of each pixel is the best possible observation in the 8 d period, selected according to quality criteria including cloud cover, cloud shadow, solar zenith and aerosol loading.
-
All scenes of MCD64A1 version 6 product. MCD64A1 is a monthly 500 m pixel product that contains daily global information on burn date, uncertainty in burn date, quality assurance indicators, and first and last day of the year of reliable change detection.
MOD09A1, MYD09A1 and MCD64A1 data were downloaded from the Land Processes Distributed Active Archive Center (LP-DAAC): https://lpdaac.usgs.gov/ (last access: 1 November 2020).
2.2 Pre-processing
Terra MOD09A1 and Aqua MYD09A1 scenes were masked to remove water bodies, glaciers, clouds and snow. Masks were obtained directly from the MOD09A1 and MYD09A1 quality bands (surface reflectance 500 m band quality control flags). Likewise, MOD09A1 and MYD09A1 scenes not registering land surface were removed from subsequent analysis.
2.3 Algorithm overview
The method to obtain burn severity indices was structured in two steps (Fig. 1): (i) calculation of dense time series of the normalized burn ratio (NBR) from merged Terra MOD09A1 and Aqua MYD09A1 scenes; and (ii) selection of the pre- and post-fire NBR for each burned pixel and calculation of differenced burn severity indices (dNBR and RdNBR).
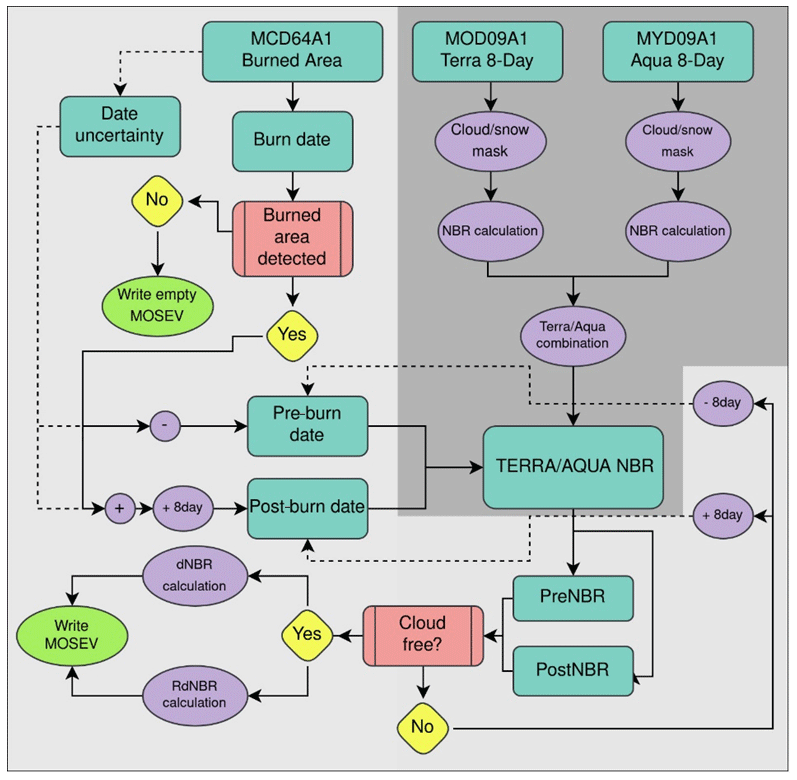
Figure 1Methodology flow chart used for building the MOSEV database (2000–present). MOD09A1 and MYD09A1 are 8 d reflectance products at 500 m spatial resolution from MODIS Terra and Aqua respectively. MCD64A1 is the monthly MODIS burned area product at 500 m spatial resolution. NBR, dNBR and RdNBR are burn severity spectral indices (normalized burn ratio, difference of the NBR and relativized dNBR respectively).
2.3.1 Calculation of dense time series of the normalized burn ratio (NBR)
The normalized burn ratio (NBR) spectral index was calculated for each Terra MOD09A1 and Aqua MYD09A1 scene according to the formula proposed by López-García and Caselles (1991) (Eq. 1). Terra NBR gaps (masked areas) were re-filled with the synchronous Aqua NBR values when available. The combination of Terra and Aqua imagery is useful to reduce cloud contamination and therefore increase the data availability and decrease uncertainty (Yu et al., 2015; Muhammad and Thapa, 2021). Thus, we obtained Terra–Aqua NBR composites with global coverage and a temporal resolution of 8 d from November 2000 onwards.
where ρ2 and ρ7 are the land surface reflectance values of bands 2 (841–876 nm) and 7 (2105–2155 nm) from Terra MOD09A1 and Aqua MYD09A1 scenes.
2.3.2 Selection of the pre- and post-burn NBR and calculation of burn severity indices
BA locations and dates were obtained from the MCD64A1 product. With the burn date and uncertainty in days, and considering the 8 d nature of our Terra–Aqua NBR, we have selected the immediate pre-burn (Eq. 2) and post-burn (Eq. 3) Terra–Aqua NBR dates for each MCD64A1 burned pixel.
When NBR values for the immediate pre-burn NBR date were not available (see Sect. 2.2), the previous NBR image was selected. In contrast, when NBR values for the immediate post-burn date were not available, the next NBR image was selected. These processes were repeated until pre- and post-burn NBR values were detected for each burned pixel on a cell by cell basis.
We have obtained the pre-burn NBR value and the post-burn NBR value from the pre- and post-fire Terra–Aqua NBR dates which were used to calculate the dNBR and RdNBR value for each burned pixel of the MCD64A1 product. Both dNBR and RdNBR are bi-temporal spectral indices that account for the change caused by fire in NIR and SWIR reflectance.
The dNBR index is the reference burn severity spectral index used by the European Forest Fire Information System (https://effis.jrc.ec.europa.eu/about-effis, last access: 1 May 2021) and by the Monitoring Trends in Burn Severity programme of the USA (https://www.mtbs.gov, last access: 1 May 2021), and it was calculated according to Key and Benson (2006) (Eq. 4), dNBR values increasing with burn severity.
Likewise, RdNBR is also an outspread burn severity spectral index used by the Monitoring Trends in Burn Severity programme of the USA (https://www.mtbs.gov/, last access: 1 May 2021). RdNBR was calculated according to Miller and Thode (2007) (Eq. 5), higher RdNBR values indicating higher burn severity.
2.4 Implementation
Burn date from MCD64A1, pre-burn NBR date, post-burn NBR date, pre-burn NBR, post-burn NBR, dNBR and RdNBR have been written in monthly scenes since November 2000 at a spatial resolution of 500 m (MOSEV database). All operations to calculate and write the database were carried out in the R programming language using the rspatial/luna (Ghosh et al., 2020) and terra (Hijmans et al., 2020) libraries and Bash Unix shell command language. All the calculations and data manipulation were performed at the supercomputing facilities of the Spanish Research Council (CSIC).
2.5 Comparison with Landsat burn severity indices
In order to evaluate the MOSEV database, we have compared MOSEV burn severity indices (dNBR, RdNBR and post-burn NBR) with the same indices manually obtained from higher-spatial-resolution imagery. To perform the comparison, we have selected Landsat scenes which have 30 m spatial resolution and have been the most used imagery for burn severity assessments (Key and Benson, 2006; Fernández-García et al., 2018a). We selected 13 regions of 185 km × 180 km (Landsat-8 tile dimension) with a large extent of BA and which are randomly distributed across the globe (See Table A1 in the Appendix). Pre- and post-burn consecutive scenes (16 d span) with low cloud cover (< 25 %) of the Landsat-8 Collection 1 Level-2 product were selected for each region and downloaded from the USGS Earth Explorer (https://earthexplorer.usgs.gov/ last access: 1 November 2020). Landsat-8 Collection 1 Level-2 scenes are composed of seven land surface reflectance bands at a spatial resolution of 30 m and a quality band which was used to mask cloud covered areas. Bands 5 (850–880 nm) and 7 (2110–2290 nm), which are comparable to MODIS bands 2 (841–876 nm) and 7 (2105–2155 nm), were aggregated and resampled averaging the Landsat values to the MODIS grid in order to match the spatial resolution of the MOSEV products (500 m). Landsat-8 resampled bands were used to calculate the pre-burn NBR and the post-burn NBR (Eq. 6), as well as the dNBR (Eq. 4) and RdNBR (Eq. 5) spectral indices.
where ρ5 and ρ7 are the land surface reflectance values of Landsat-8 bands 5 (850–880 nm) and 7 (2110–2290 nm) resampled to the spatial resolution of MOSEV products.
To assess the relationships between the burn severity indices included in the MOSEV database with the same ones derived from Landsat-8, we sampled all available burned pixels (n=32 163) of the 13 study regions from both MOSEV and Landsat-8 dNBR, RdNBR and post-burn NBR layers (Table A1). Then, we performed scatterplots, and we calculated the Pearson's correlation coefficients (R) and the significance of the correlations (P).
The MOSEV database (doi:10.5281/zenodo.4265209, Alonso-González and Fernández-García, 2020) is composed of monthly scenes from November 2000 onwards with a spatial resolution of 500 m. The scenes are organized following the tiling system of MODIS (sinusoidal tile grid). In total, the database is structured in 246 non-overlapping tiles that cover an area of 10∘×10∘ on the Equator (Fig. 2). The name of each MOSEV scene encodes the year, Julian day indicating the month and MODIS tile. For instance, the MOSEV A2019305.h31v11 scene corresponds to the year 2019, month of November (month ended on the Julian day 305) and h31v11 MODIS tile.
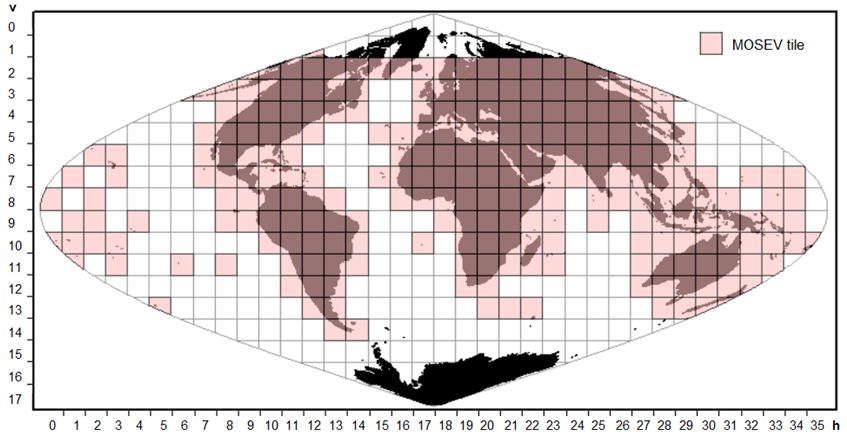
Figure 2MODIS sinusoidal tiling system and available MOSEV tiles.
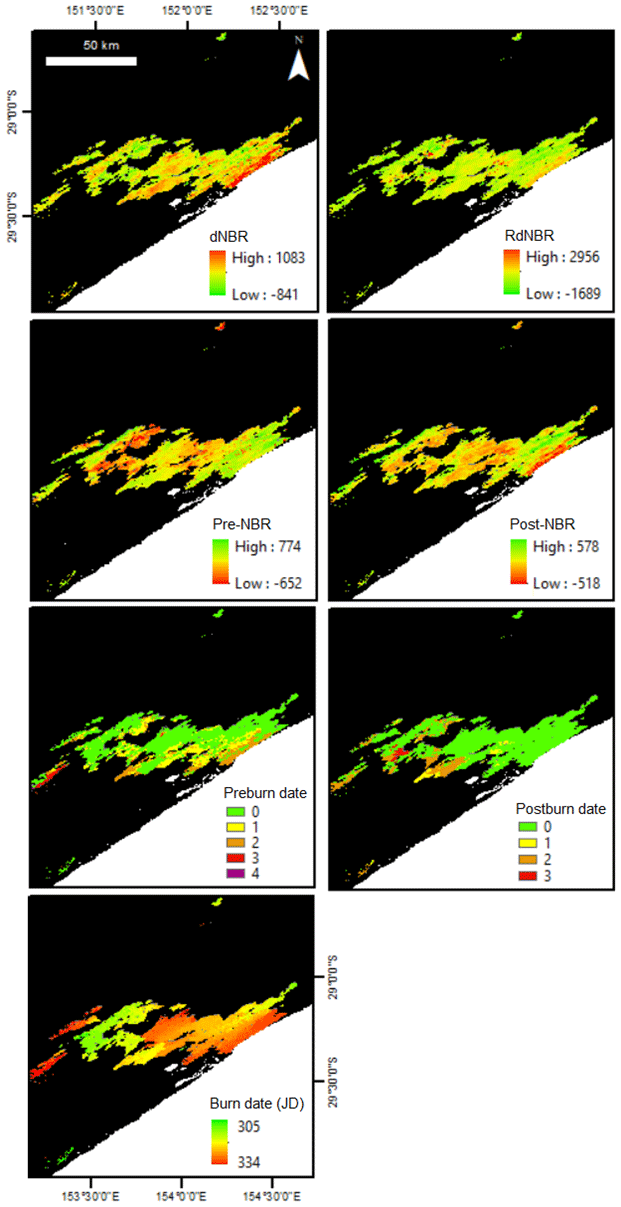
Figure 3Example of the layers included in a MOSEV scene (A2019305.h31v11) representing some of the 2019 wildfires in Australia (New South Wales). Spectral indices dNBR, RdNBR, pre-NBR and post-NBR are unitless. The pre-burn and post-burn dates indicate the number of cycles or iterations necessary to find available NBR values (each cycle added to 0 corresponds to a difference of 8 d). The burn date is expressed in Julian days. White areas are water bodies (value of 32 767), and black areas are unburned land (value of −32 767).
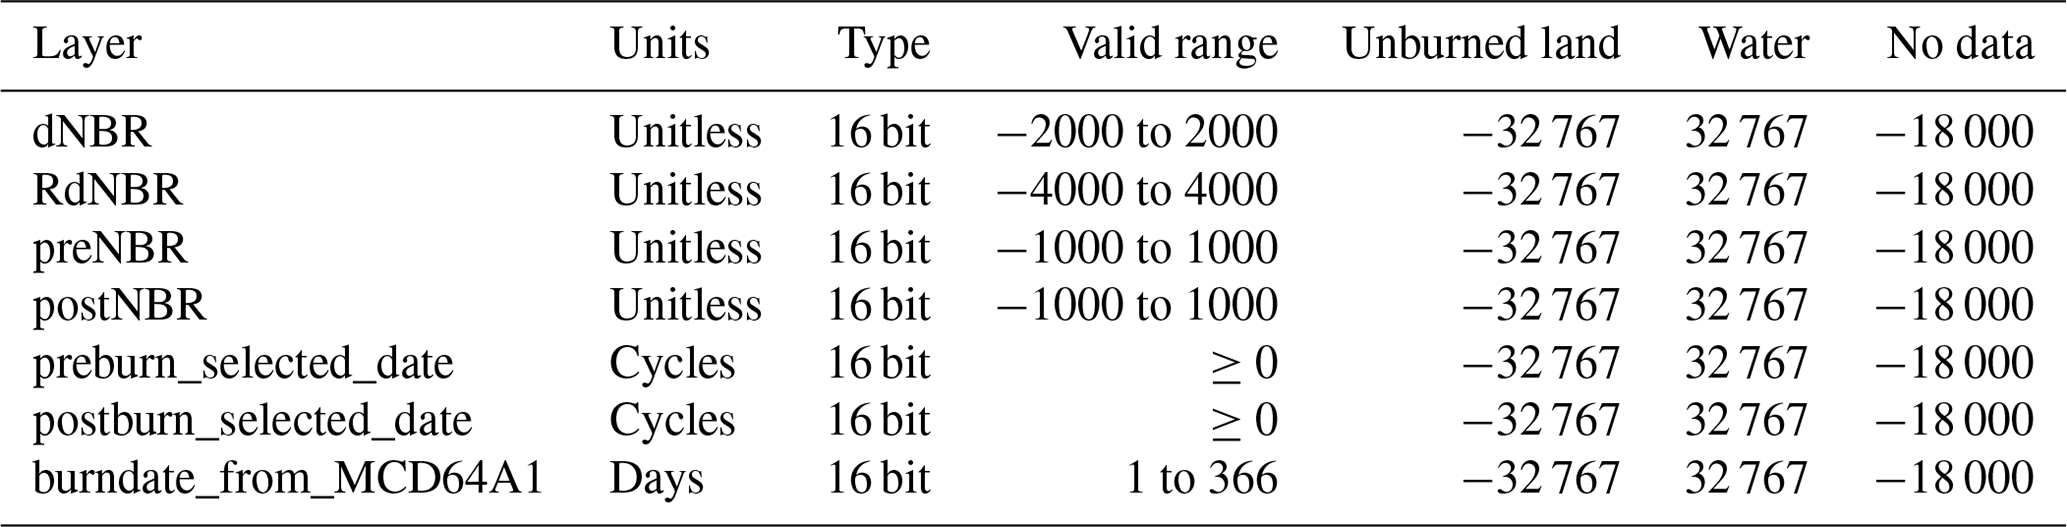
Each MOSEV scene is composed of seven layers (Table 1; Fig. 3): dNBR, RdNBR, pre-burn NBR, post-burn NBR, pre-burn selected date, post-burn selected date and the burn date from MCD64A1. In all layers we assigned the values of −32 767 to unburned land, 32 767 to water bodies and −18 000 to those areas where it was not possible to fill with a severity value or the severity value was out of the allowed range.
-
dNBR. The valid range in the MOSEV database corresponds to their mathematical feasible range (−2000 to 2000) (see Eq. 4), although values above 1200 are not usual (Key and Benson, 2006).
-
RdNBR. The valid range in the MOSEV database was bounded from −4000 to 4000 since values outside these limits are feasible (see Eq. 5) but anomalous (Miller and Thode, 2007; Miller et al., 2009).
-
Pre- and post-burn NBR. Both spectral indices are the Terra–Aqua composites used in the calculation of dNBR and RdNBR. Likewise, the post-burn NBR is the most common mono-temporal burn severity spectral index, its value decreasing as burn severity increases. The pre- and post-burn NBR valid range in the MOSEV database corresponds to their mathematically feasible range (−1000 to 1000) (see Eq. 1).
-
Pre- and post-burn selected dates. These are estimators of the pre- and post-burn NBR dates and represent the number of iterations necessary to find available pre- and post-burn NBR values. Specifically, a value of 0 in the selected date indicates that the NBR date is the immediate NBR according to the Eq. (2) (pre-burn) and Eq. (3) (post-burn). A value of 1 indicates that the immediate NBR value was not available, and the previous (in the case of the pre-fire) or the next (in the case of post-fire) NBR value was used instead.
-
Burn date from MCD64A1. This is the date of burning in Julian days registered in the MCD64A1 BA product. It was used as the basis for identifying the pre- and post-burn selected dates and pre- and post-burn NBR values.
In order to reduce the overall size of the database, the MOSEV scenes where no fires were detected are composed of a single empty layer entitled “burndate_from_MCD64A1”. We did it in this way in order to maintain the same number of MOSEV files per tile even in the unburned scenarios, similar to the original MCD64A1 product. Each MOSEV file is a multi- or single-band GeoTIFF in 16-bit integers, compressed using the lossless compression algorithm Lempel–Ziv–Welch (LZW). The MOSEV scenes are distributed as a zipped file, constituted by all the scenes of each tile. The complete dataset can be freely downloaded at https://doi.org/10.5281/zenodo.4265209 (Alonso-González and Fernández-García, 2020).
In this work we have developed the MOSEV product, which is a global burn severity database based on MODIS Terra and Aqua surface reflectance and MODIS BA products. The database includes dNBR, RdNBR and NBR burn severity indices at 500 m pixel size, which are usually calculated at local scale using higher-resolution imagery, traditionally with Landsat scenes (Chuvieco, 2010; Key and Benson, 2006; Miller and Thode, 2007; Fernández-García et al., 2018a) and more recently with Sentinel-2 scenes (Fernández-Manso et al., 2016).
4.1 Comparison with Landsat burn severity indices
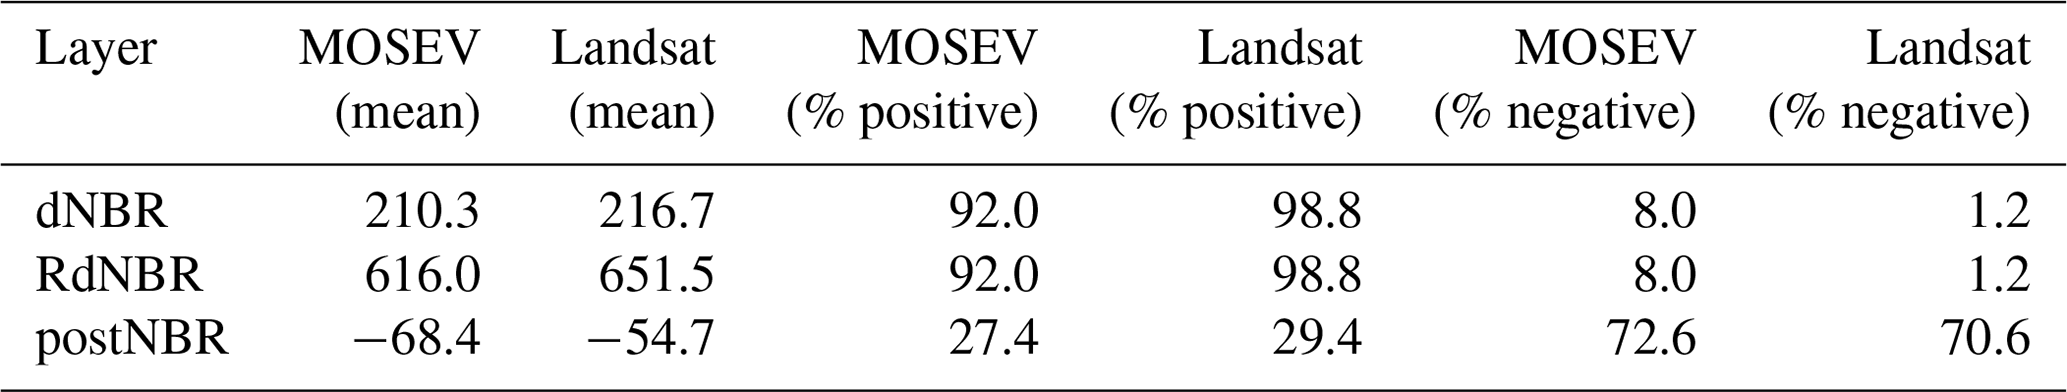
The probability density functions of MOSEV and Landsat burn severity indices (dNBR, RdNBR and post-burn NBR), as well as their relationships, are shown in Fig. 4. In general, results showed a high similarity between MOSEV and Landsat probability density functions, with values more concentrated to the mean for Landsat indices and a slight negative bias for the three spectral indices as MOSEV mean values tended to be lower than those in Landsat data (Table 2). MOSEV and Landsat burn severity indices were highly correlated (P<0.001) for the three burn severity indices. Specifically, the post-burn NBR showed a higher correlation coefficient (R=0.88) than dNBR (R=0.74) and RdNBR (R=0.42).
Table 2Mean values and proportion of positive and negative values of the burn severity spectral indices included in the MOSEV database (dNBR, RdNBR and post-burn NBR spectral indices) and the equivalent obtained from 13 Landsat-8 scenes randomly distributed across the globe (n=32 163).
Previous research has found discrepancies in surface reflectance when comparing both MODIS and Landsat satellites (Feng et al., 2013; Veraverbeke et al., 2011; Ke et al., 2015; Potapov et al., 2020). These differences could be explained by several reasons. (i) The higher temporal resolution of MODIS imagery used to build the database enables us to use pre-fire information very close to the burning event. This has a significant influence on the pre-burn NBR values, which typically decrease as the fire season approaches and when drought conditions are more severe (Wang et al., 2008). This fact explains the lower pre-burn NBR values and the higher proportion of negative values in the MOSEV product compared with Landsat (Fig. A1, Table A2) which unavoidably lead to some differences in dNBR and RdNBR values and could contribute to a higher proportion of negative values in these indices in the MOSEV database (Table 2). Also the post-fire information in the MOSEV product is very close to the burning event, thus potentially allowing a better assessment of burn severity compared with the lower temporal resolution of the Landsat constellation. (ii) There are potential errors in radiometric gains from Landsat imagery, which are used for rescaling digital numbers to radiance values (Chander et al., 2009). (iii) Saturation problems in bright surfaces have been detected by Feng et al. (2013) in Landsat imagery but not for MODIS. This effect may influence the quality of the pre-fire NIR and the post-fire SWIR reflectance, which have high values in severely burned areas (Key and Benson, 2006). (iv) Differences in imagery pre-processing may affect the final reflectance values. In this sense, Landsat imagery is resampled using a cubic convolution method (uses 16 nearest-neighbour data points) in the geometric correction stage (Landsat 8 Data Users Handbook Version 5.0, 2019), whereas MODIS reflectance products are resampled using bilinear interpolation (four nearest-neighbour data points) (MODIS Science Data Support Team, 1997). The use of cubic convolution method smooths reflectance values more than bilinear interpolation, contributing to moderate extreme values. This assumption is supported by the probability density functions (Fig. 4) which show a higher abundance of extreme values for the spectral indices when calculated from MODIS instead of Landsat. Similarly, it was necessary to resample the Landsat products to the MODIS grid to make it comparable considering the big resolution shift, introducing some obvious and unavoidable uncertainty.
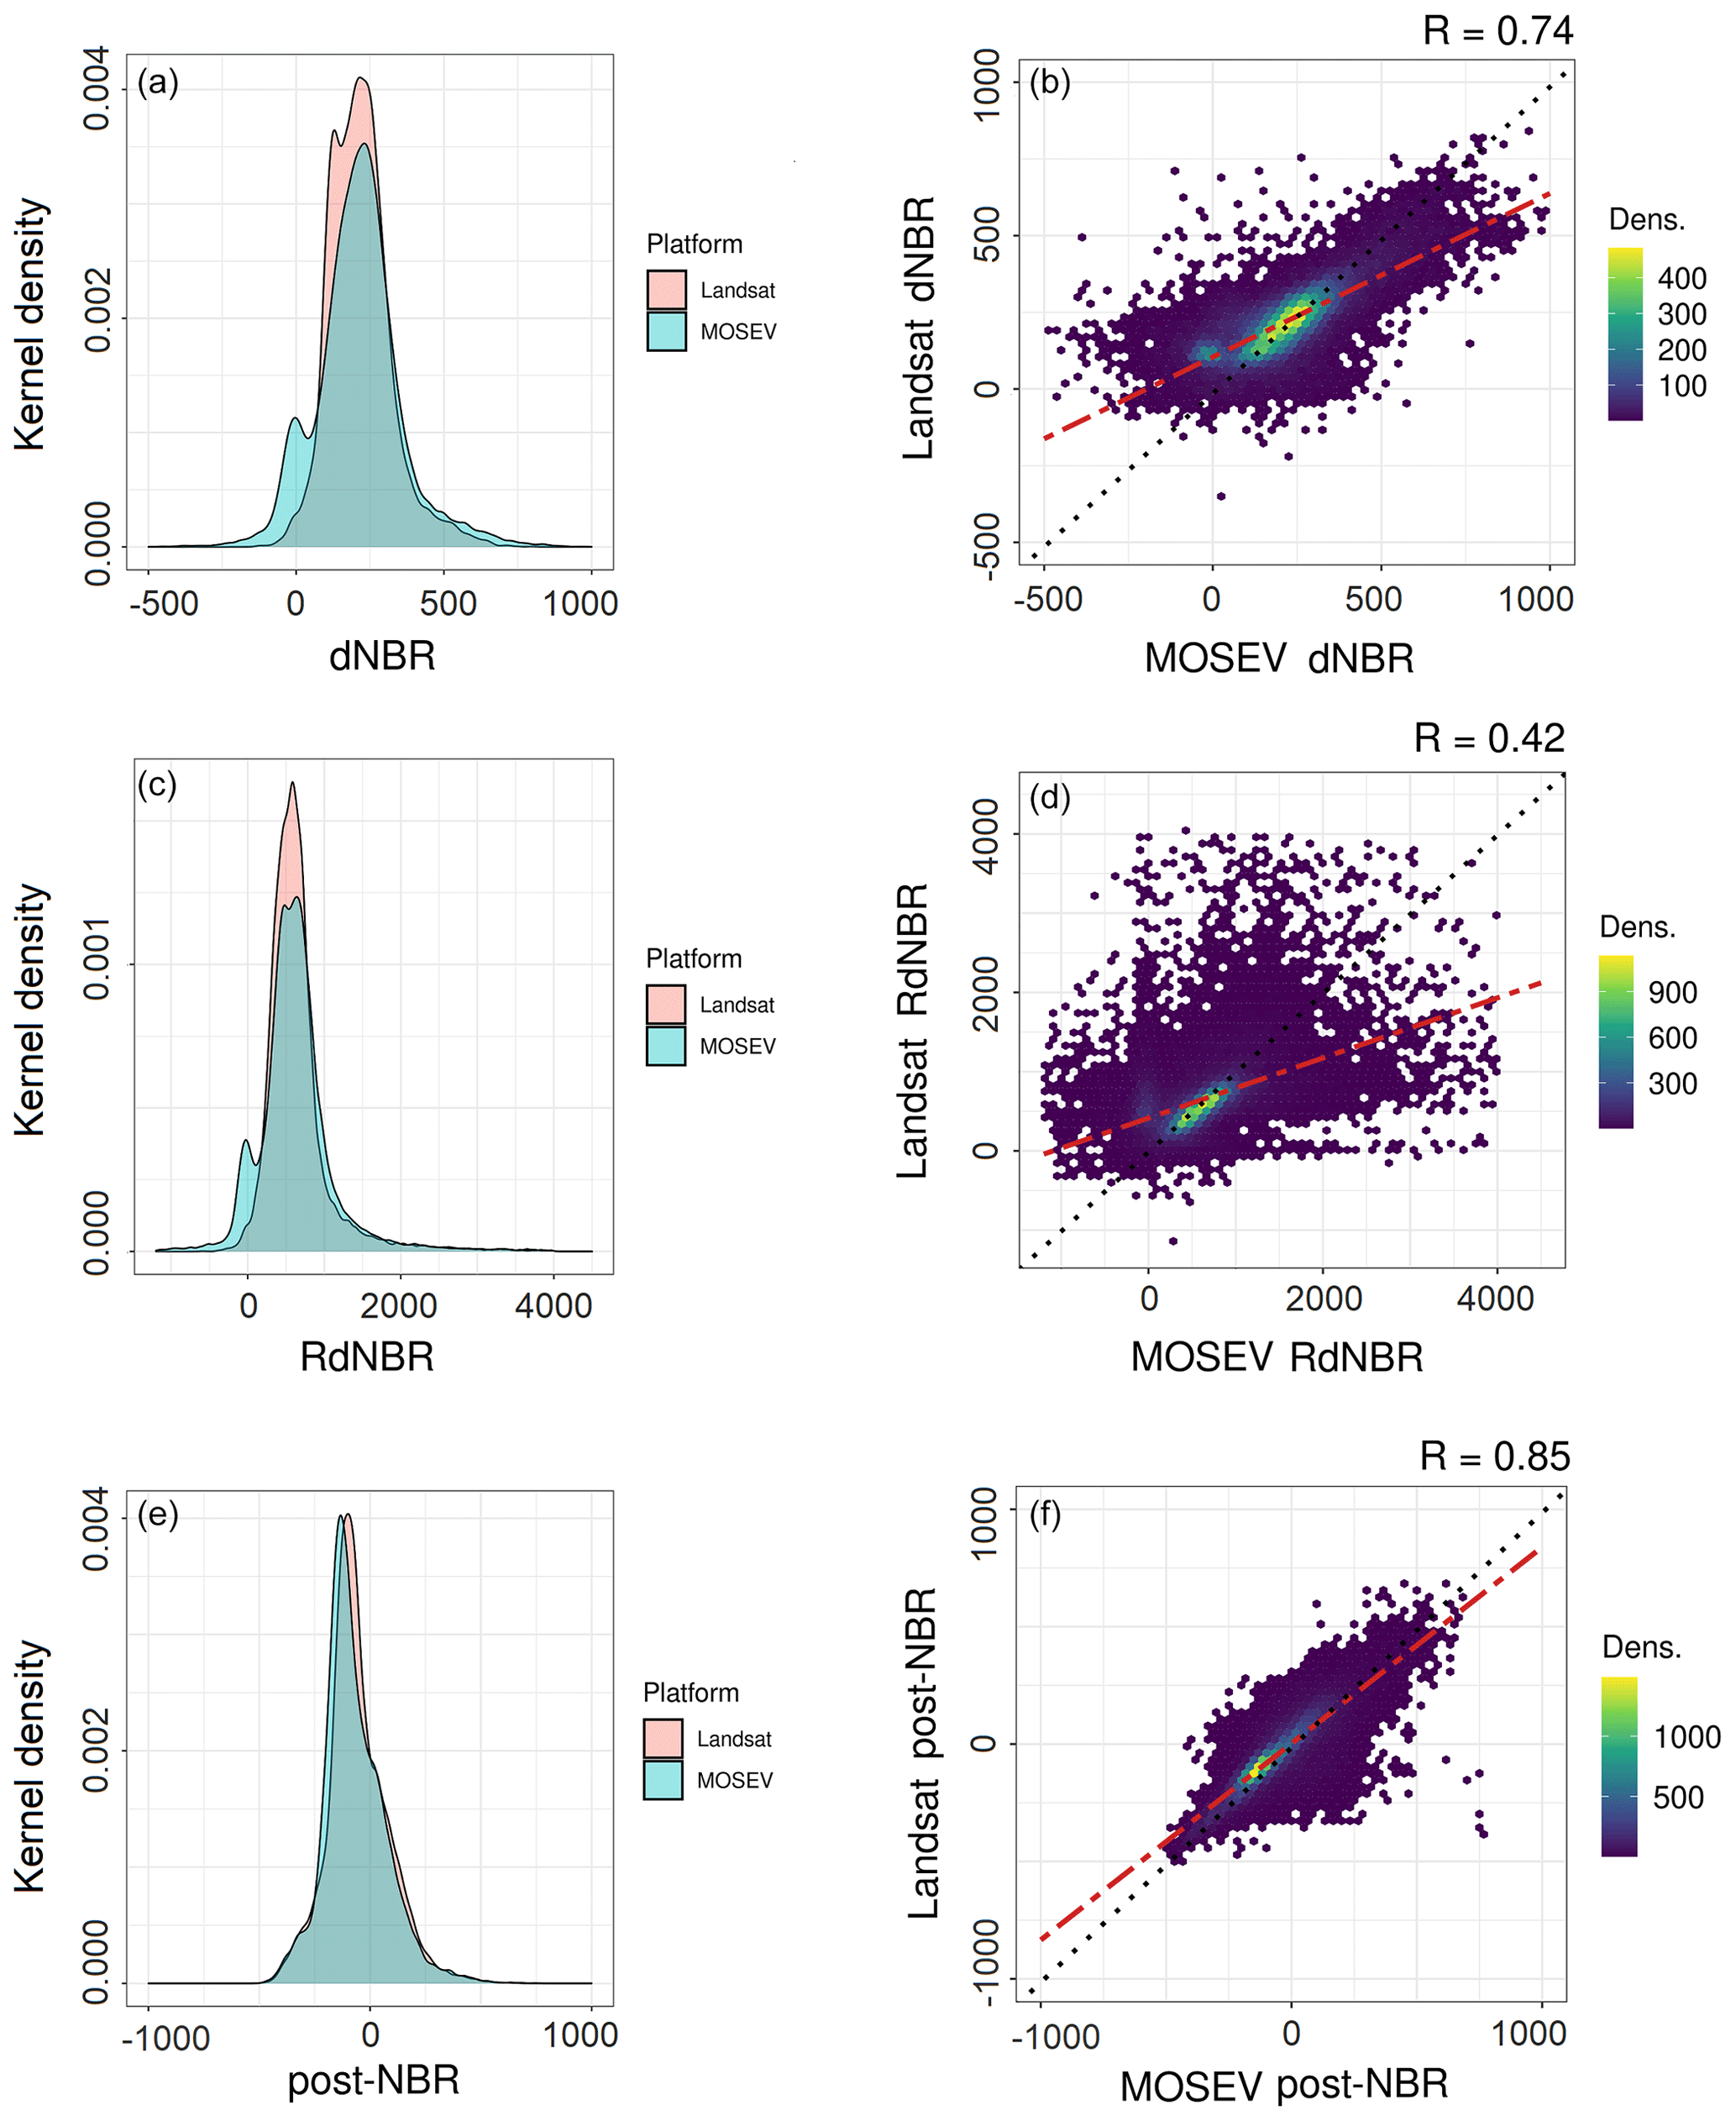
Figure 4Gaussian kernel densities (a, c, e) and scatterplots (b, d, f) showing the relationships between the burn severity data included in the MOSEV database (dNBR, RdNBR and post-burn NBR spectral indices) and the equivalent data obtained from 13 Landsat-8 scenes randomly distributed across the globe (n=32 163). R is Pearson's correlation coefficient, and Dens. signifies density of points. See Table A1 for further information.
Likewise, we detected variability in the correlations between MOSEV and Landsat among the three studied burn severity indices. The higher correspondence of the pre-burn and post-burn NBR spectral indices suggests that the mono-temporal approach contributes to achieve higher correlations (see post-NBR in Fig. 4 and pre-NBR in Fig. A1). In contrast, combining the information of two scenes (bi-temporal approach) entails higher differences in satellite reflectance and therefore in bi-temporal spectral indices (dNBR and RdNBR). Focusing on dNBR and RdNBR, we found higher correlations between MOSEV and LANDSAT dNBR than RdNBR, which can be the direct consequence of the RdNBR algorithm (see Eq. 5) as low pre-burn NBR absolute values may cause really high and even anomalous RdNBR values, generating heteroscedasticity (see Fig. 4). However, in general both burn severity products showed good levels of agreement considering the unavoidable uncertainties associated with the very different nature of Landsat and MODIS. Thus, the comparison of MOSEV and Landsat burn severity proves the consistency of the developed algorithm, the dNBR relationships being similar (Veraverbeke et al., 2011) or even better (Rahman et al., 2018) than those found in previous studies that compared retrieved burn severity information from both products.
4.2 Indices interpretation and validity
NBR, dNBR and RdNBR spectral indices were developed to provide optimum measurements of fire effects and biomass consumption from multispectral imagery (Key and Benson, 2006; Miller and Thode, 2007). The three indices are based on the change caused by burning on NIR and SWIR reflectance. NIR reflectance is highly sensitive to canopy density, being lower in burned than in vegetated areas. In contrast, SWIR reflectance is sensitive to moisture content and ash and is significantly higher in burned areas than in vegetated zones. The NBR index (López-García and Caselles, 1991) uses this information to estimate burn severity from a mono-temporal approach. In general, high positive NBR values indicate vegetated areas, whereas bare soil and burned areas present low and usually negative NBR values: the more negative, the more severely burned. The validation of burn severity indices has been widely addressed using Landsat imagery and field measurements at a similar spatial resolution (∼30 m) because of the high difficulty of taking accurate field measurements at coarser spatial scales. The most popular field measurements to assess the performance of burn severity spectral indices are those indices based on the composite burn index (CBI) (Key and Benson, 2006), which combines information on fuel consumption and related changes caused by fire, including plant mortality, char height and soil colour. In general, the literature shows high variability in the goodness-of-fit between NBR- and CBI-type indices. For instance, Picotte and Robertson (2011) found R2 values ranging from 0.61 to 0.86 in different ecosystems across North America the following months after fire; De Santis and Chuvieco (2009) reported R2 values between 0.32 and 0.66, largely varying depending on the CBI-type index used; and Fernández-García et al. (2018a) obtained R2 values between 0.69 and 0.88 for different forest ecosystems on the Iberian Peninsula. Although NBR has a proven capacity to indicate burn severity, it is usually overcome by differenced indices such as the dNBR and RdNBR, which account for the pre-burn conditions (Key and Benson, 2006; Fernández-García et al., 2018a).
The dNBR and RdNBR indices provide quantitative measurement of the environmental change between the pre- and post-burn situation (i.e. biomass consumption and related changes) (Key and Benson, 2006). The dNBR is a measurement of severity understood as absolute change, whereas the RdNBR was designed to relativize the dNBR to the pre-fire situation; thus, the total combustion of areas with different amounts of vegetation would lead to similar RdNBR values, but dNBR would be higher in the most vegetated area (Miller and Thode, 2007). The performance of both dNBR and RdNBR indices obtained from Landsat has been validated in numerous studies across the globe. For instance, Zhu et al. (2006) reported mean R2 values of 0.67 (dNBR) and 0.60 (RdNBR) when correlating CBI in different ecosystems in North America; Parks et al. (2014) found mean R2 values of 0.76 (dNBR) and 0.77 (RdNBR) in the western United States; Fernández-García et al. (2018a) used a CBI-type index to analyse the goodness-of-fit of both dNBR (R2=0.81) and RdNBR (R2=0.78) indices in forest ecosystems on the Iberian Peninsula; Cai and Wang (2020) found a better performance of dNBR (R2=0.84) than RdNBR (R2=0.79) when correlating a descriptive burn severity index in south-east China; and Rozario et al. (2018) found that dNBR (R2=0.56) and RdNBR (R2=0.58) indices were able to indicate the percentage of scorched vegetation in tropical dry forests of Costa Rica.
The values of both dNBR and RdNBR increase proportionally to burn severity, and in general, values below zero indicate unburned or recovered areas. The dNBR and RdNBR continuous data can be used to differentiate burn severity categories. The number of classes and burn severity thresholds is entirely up to the user's objective, and empirical thresholding based on the relationships with field data is useful to provide ecological meaning to the spectral-index-based categories (Key and Benson, 2006; Fernández-García et al., 2018b). An option when field data are not available is to define thresholds according to the literature (Rozario et al., 2018). In this sense, Key and Benson (2006) provided six dNBR thresholds to differentiate seven burn severity categories, whereas Miller and Thode (2007) provided three thresholds (41, 176 and 366 for dNBR; 69, 315 and 640 for RdNBR) to differentiate unchanged, low, moderate and high severities in forest ecosystems of North America with the post-fire image taken 1 year after fire. Preferred threshold values are higher when the post-fire image is closer to the fire date (Key and Benson, 2006), as is the case of MOSEV indices. Examples of thresholds in forest ecosystems with the post-fire images taken immediately after fire are those provided by Botella-Martínez and Fernández-Manso (2017) which differentiated unburned, low, moderate and high with three threshold values (160, 260 and 481 for dNBR; 230, 475 and 835 for RdNBR).
4.3 Advancements and limitations
The main asset of the MOSEV database is that it is the first global burn severity database which complements the existing global BA data such as the FireCCI50 (Chuvieco et al., 2018) or the MCD64A1 C6 products (Giglio et al., 2018). One of the most important strengths of MOSEV is a consequence of MODIS revisit time (1 to 2 d), which is shorter than Landsat-8 (16 d) and Sentinel-2 (5 d). This high temporal resolution allowed us to obtain dense free-cloud NBR time series that can be indispensable to calculate burn severity indices in regions of persistent cloud cover. In fact, Ju and Roy (2008) show that the probability of finding two consecutive Landsat scenes within a month is 0.63 globally but near 0 in many regions such as Russia and Canada and many areas of Central Africa among others. Likewise, another improvement of MOSEV burn severity indices over indices calculated from other satellites such as Landsat or Sentinel is the higher temporal consistency of the data, as Terra and Aqua satellites have used the same MODIS sensor since 2000.
The main limitation of the MOSEV database is related to its spatial resolution of 500 m, which impedes accounting for fine-grain spatial heterogeneity. However, this spatial resolution enables the study of burn severity at regional and planetary scale with low computational costs. Another fact to consider is the error in the classification of burned areas in the MCD64A1 BA product on which MOSEV is based. In this sense, Giglio et al. (2018) reported a global commission error (CE) of 24 % and an omission error (OE) of 37 %, whereas Boschetti et al. (2019) in a stage-3 validation indicated a global CE of 40 % and an OE of 73 %. The lowest errors were detected in regions where fires are larger and fire scars persistent, such as in boreal forests.
4.4 Potential applications
Burn severity metrics from the MOSEV database can be useful to analyse temporal trends in burn severity, to study the global spatial patterns of burn severity, to identify areas where the post-fire recovery of soil and vegetation can be endangered and to enhance global models of carbon emissions, among other applications. In addition, it will constitute a cost-effective way of monitoring the global burn severity in a close to real time way as MOSEV could be upgraded to the same temporal frequency as the MCD64A1 product.
In relation to the temporal trends of burn severity, it is common in the fire ecology literature to assume increases in burn severity owing to climate change (e.g. García-Llamas et al., 2019; Moreira et al., 2020). However, there is little evidence of that at the planetary scale since there was no global burn severity data. Previous studies in that line have analysed temporal trends in burn severity at the regional scale, mainly in the USA and Europe (Fried et al., 2004; Parks et al., 2016; Picotte et al., 2016). With the MOSEV database it is possible to study global trends in burn severity and study relationships between burn severity and global change.
Spatial patterns of fire occurrence and burn severity have also captured the interest of several researchers (e.g. Duffy et al., 2007; Kennedy and Johnson, 2014; Stevens et al., 2017), but research at the global scale is limited to the study of BA (Andela et al., 2017). Thus, the MOSEV database opens the possibility of expanding the study of fire patterns to the planetary scale including the variable burn severity.
Burn severity is a variable of high interest to predict ecosystem responses (Keeley, 2009). Among the most relevant ecosystem responses for forest managers is soil erosion (De Luis et al., 2003) and vegetation recovery (Fernández-García et al., 2018b, 2019, 2020). Thus, MOSEV burn severity indices may serve as a tool for land managers to roughly identify target areas for post-fire forest management, as well as to study predictors of burn severity which could be useful for pre-fire management (García-Llamas et al., 2019).
Moreover, previous work has shown the importance of including burn severity metrics as predictors of CO2 emissions caused by fires (e.g. Veraverbeke et al., 2015; van der Werf et al., 2017). The MOSEV database will be useful for the enhancement of global CO2 emission models.
The MOSEV database is freely downloadable at https://doi.org/10.5281/zenodo.4265209 (Alonso-González and Fernández-García, 2020).
We have introduced the newly developed MOSEV database, which is the first burn severity database with global coverage, available from November 2000 onwards. The algorithm used to build the database is based on MODIS Terra and Aqua surface reflectance imagery, as well as on the MCD64A1 BA product. MOSEV data include seven layers at 500 m pixel size with the most commonly used burn severity spectral indices (dNBR, RdNBR and post-burn NBR), the pre-burn NBR, estimators of the date of the pre- and post-burn MODIS surface reflectance scenes used for calculations and the date of burning. The burn severity indices from MOSEV showed consistent relationships with Landsat-derived burn severity indices, which have been the most used for burn severity assessments. Thus, this database could be the basis to accomplish future studies of burn severity at the global scale in a computationally cost-effective way, as well as research on where burn severity could be a relevant factor such as in forest management and CO2 emissions research.
Table A1Scenes and number of pixels (n) used to compare MOSEV and Landsat-8-derived (L8) burn severity indices (dNBR, RdNBR and post-burn NBR).
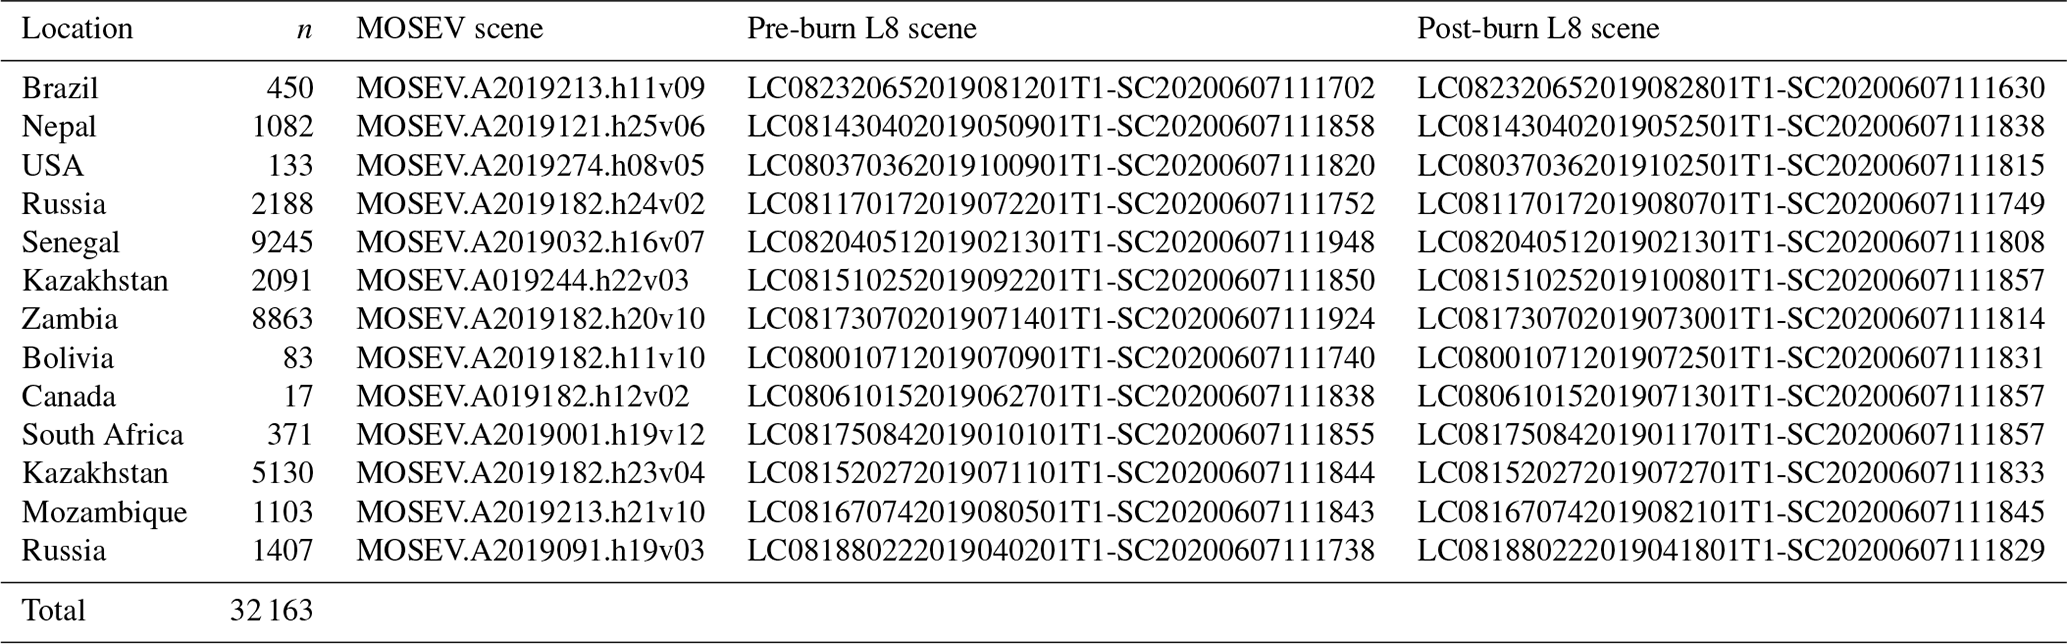
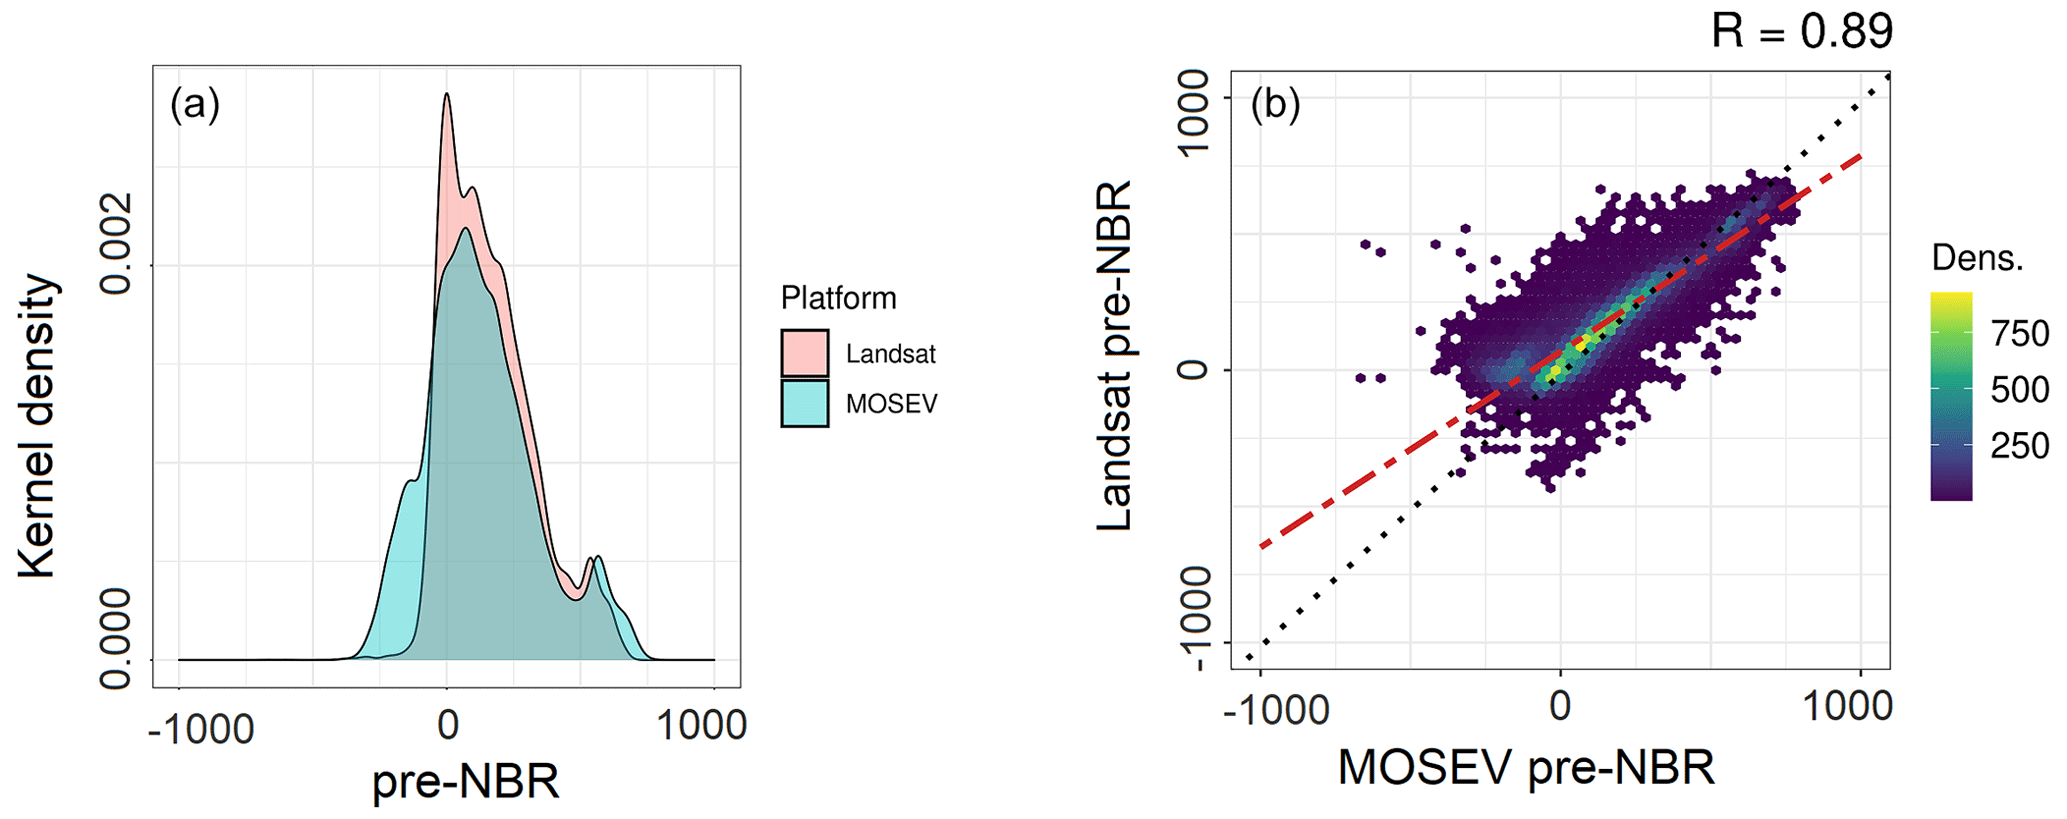
Figure A1Gaussian kernel densities (a) and scatterplots (b) showing the relationships between the pre-burn NBR spectral index included in the MOSEV database and the equivalent obtained from 13 Landsat-8 scenes randomly distributed across the globe (n=32 163). R is Pearson's correlation coefficient, and Dens. signifies density.
Table A2Mean values and proportion of positive and negative values of the pre-burn NBR spectral index included in the MOSEV database and the equivalent obtained from 13 Landsat-8 scenes randomly distributed across the globe (n=32 163).

EAG and VFG designed the database and the structure of the manuscript. EAG developed the algorithms and the MOSEV database. VFG prepared the Landsat-8 data. EAG did the statistical analysis of the data. EAG and VFG made the figures. VFG wrote the first draft of the manuscript, and EAG contributed to writing the manuscript.
The authors declare that they have no conflict of interest.
This paper was edited by David Carlson and reviewed by two anonymous referees.
Alonso-González, E. and Fernández-García, V.: MOSEV: a global burn severity database from MODIS (2000–2020), Zenodo [data set], https://doi.org/10.5281/zenodo.4265209, last access: 1 November 2020.
Andela, N., Morton, D. C., Giglio, L., Chen, Y., van der Werf, G. R., Kasibhatla, P. S., DeFries, R. S., Collatz, G. J., Hantson, S., Kloster, S., Bachelet, D., Forrest, M., Lasslop, G., Li, F., Mangeon, S., Melton, J. R., Yue, C., and Randerson, J. T.: A human-driven decline in global burned area, Science, 356, 1356–1362, https://doi.org/10.1126/science.aal4108, 2017.
Andela, N., Morton, D. C., Giglio, L., Paugam, R., Chen, Y., Hantson, S., van der Werf, G. R., and Randerson, J. T.: The Global Fire Atlas of individual fire size, duration, speed and direction, Earth Syst. Sci. Data, 11, 529–552, https://doi.org/10.5194/essd-11-529-2019, 2019.
Boschetti, L., Roy, D. P., Giglio, L., Huang, H., Zubkova, M., and Humber, M. L.: Global validation of the collection 6 MODIS burned area product, Remote Sens. Environ., 235, 111490, https://doi.org/10.1016/j.rse.2019.111490, 2019.
Botella-Martínez, M. A. and Fernández-Manso, A: Estudio de la severidad post-incendio en la Comunidad Valenciana comparando los índices dNBR, RdNBR y RBR a partir de imágenes Landsat 8, Revista de Teledetección, 49, 33–47, https://doi.org/10.4995/raet.2017.7095, 2017.
Cai, L. and Wang, M.: Is the RdNBR a better estimator of wildfire burn severity than the dNBR? A discussion and case study in southeast China, Geocarto Int., 1–15, https://doi.org/10.1080/10106049.2020.1737973, 2020.
Chander, G., Markham, B. L., and Helder, D. L.: Summary of current radiometric calibration coefficients for Landsat MSS, TM, ETM+, and EO-1 ALI sensors, Remote Sens. Environ., 113, 893–903, https://doi.org/10.1016/j.rse.2009.01.007, 2009.
Chu, T. and Guo, X.: Remote Sensing Techniques in Monitoring Post-Fire Effects and Patterns of Forest Recovery in Boreal Forest Regions: A Review, Remote Sens., 6, 470–520, https://doi.org/10.3390/rs6010470, 2014.
Chuvieco, E., Riaño, D., Danson, F. M., and Martin, P.: Use of a radiative transfer model to simulate the postfire spectral response to burn severity, J. Geophys. Res., 111, G04S09, https://doi.org/10.1029/2005JG000143, 2006.
Chuvieco, E. (Ed.): Teledetección ambiental. La observación de la Tierra desde el espacio, 3rd edn., Ariel, Barcelona, Spain, 2010.
Chuvieco, E., Yue, C., Heil, A., Mouillot, F., Alonso-Canas, I., Padilla, M., Pereira, J. M., Oom, D., and Tansey, K.: A new global burned area product for climate assessment of fire impacts, Global Ecol. Biogeogr., 25, 619–629. https://doi.org/10.1111/geb.12440, 2016.
Chuvieco, E., Lizundia-Loiola, J., Pettinari, M. L., Ramo, R., Padilla, M., Tansey, K., Mouillot, F., Laurent, P., Storm, T., Heil, A., and Plummer, S.: Generation and analysis of a new global burned area product based on MODIS 250 m reflectance bands and thermal anomalies, Earth Syst. Sci. Data, 10, 2015–2031, https://doi.org/10.5194/essd-10-2015-2018, 2018.
De Luis, M., González-Hidalgo, J. C., and Raventós, J.: Effects of fire and torrential rainfall on erosion in a Mediterranean gorse community, Land Degrad. Dev., 14, 203–213, https://doi.org/10.1002/ldr.547, 2003.
De Santis, A. and Chuvieco, E.: GeoCBI: A modified version of the Composite Burn Index for the initial assessment of the short-term burn severity from remotely sensed data, Remote Sens. Environ., 113, 554–562, https://doi.org/10.1016/j.rse.2008.10.011, 2009.
De Santis, A., Chuvieco, E., and Vaughan, P. J.: Short-term assessment of burn severity using the inversion of PROSPECT and GeoSail models, Remote Sens. Environ., 113, 126–136, https://doi.org/10.1016/j.rse.2008.08.008, 2009.
Duffy, P. A., Epting, J., Graham, J. M., Rupp, T. S., and McGuire, A. D.: Analysis of Alaskan burn severity patterns using remotely sensed data, Int. J. Wildland Fire, 16, 277–284, https://doi.org/10.1071/WF06034, 2007.
Feng, M., Sexton, J. O., Huang, C., Masek, J. G., Vermote, E. F., Gao, F., Narasimhan, R., Channan, S., Wolfe, R. E., and Townshend, J. R.: Global surface reflectance products from Landsat: Assessment using coincident MODIS observations, Remote Sens. Environ., 134, 276–293, https://doi.org/10.1016/j.rse.2013.02.031, 2013.
Fernández-García, V., Santamarta, M., Fernández-Manso, A., Quintano, C., Marcos, E., and Calvo, L.: Burn severity metrics in fire-prone pine ecosystems along a climatic gradient using Landsat imagery, Remote Sens. Environ., 206, 205–217, https://doi.org/10.1016/j.rse.2017.12.029, 2018a.
Fernández-García, V., Quintano, C., Taboada, A., Marcos, E., and Calvo, L.: Fernández-Manso, A. Remote Sensing Applied to the Study of Fire Regime Attributes and Their Influence on Post-Fire Greenness Recovery in Pine Ecosystems, Remote Sens., 10, 733, https://doi.org/10.3390/rs10050733, 2018b.
Fernández-García, V., Fulé, P. Z., Marcos, E., and Calvo, L.: The role of fire frequency and severity on the regeneration of Mediterranean serotinous pines under different environmental conditions, Forest Ecol. Manag., 444, 59–68, https://doi.org/10.1016/j.foreco.2019.04.040, 2019.
Fernández-García, V., Marcos, E. Fulé, P. Z., Reyes, O., Santana, V. M., and Calvo, L.: Fire regimes shape diversity and traits of vegetation under different climatic conditions, Sci. Total Environ., 716, 137137, https://doi.org/10.1016/j.scitotenv.2020.137137, 2020.
Fernández-Manso, A., Fernández-Manso, O., and Quintano, C.: SENTINEL-2A red-edge spectral indices suitability for discriminating burn severity, Int. J. Appl. Earth Obs. Geoinformation, 50, 170–175, https://doi.org/10.1016/j.jag.2016.03.005, 2016.
Forkel, M., Dorigo, W., Lasslop, G., Chuvieco, E., Hantson, S., Heil, A., Teubner, I., Thonicke, K., and Harrison, S. P.: Recent global and regional trends in burned area and their compensating environmental controls, Environ. Res. Communications, 1, 051005, https://doi.org/10.1088/2515-7620/ab25d2, 2019.
Fried, J. S., Tor, M. S., and Mills, E.: The Impact of Climate Change on Wildfire Severity: A Regional Forecast for Northern California, Climatic Change, 64, 169–191, https://doi.org/10.1023/B:CLIM.0000024667.89579.ed, 2004.
García-Llamas, P., Suárez-Seoane, S., Taboada, A., Fernández-Manso, A., Quintano, C., Fernández-García, V., Fernández-Guisuraga, J. M., Marcos, E., and Calvo, L.: Environmental drivers of fire severity in extreme fire events that affect Mediterranean pine forest ecosystems, Forest Ecol. Manag., 433, 24–32, https://doi.org/10.1016/j.foreco.2018.10.051, 2019.
Ghosh, A., Mandel, A., Kenduiywo, B., and Hijmans, R.: rspatial/luna: Tools for satellite remote sensing (Earth Observation) data processing, Version 0.3-2, https://rdrr.io/github/rspatial/luna/, last access: 1 November 2020.
Giglio, L., Boschetti, L., Roy, D. P., Humber, M. L., and Justice, O. C.: The Collection 6 MODIS burned area mapping algorithm and product, Remote Sens. Environ, 217, 72–85, https://doi.org/10.1016/j.rse.2018.08.005, 2018.
Hijmans, R. J., Bivand, R., Forner, K., Ooms, J., and Pebesma, E.: Package “terra”, Version 0.8-6, https://rspatial.org/terra, last access: 1 November 2020.
Humber, M. L., Boschetti, L., Giglio, L., and Justice, C. O.: Spatial and temporal intercomparison of four global burned area products, Int. J. Digit. Earth, 4, 460–484, https://doi.org/10.1080/17538947.2018.1433727, 2018.
Jolly, W. M., Cochrane, M. A., Freeborn, P. H., Holden, Z. A., Brown, T. J., Williamson, G. J., and Bowman, D. M. J. S.: Climate-induced variations in global wildfire danger from 1979 to 2013, Nat. Commun., 6, 7537, https://doi.org/10.1038/ncomms8537, 2015.
Ju, J. and Roy, D. P.: The availability of cloud-free Landsat ETM+ data over the conterminous United States and globally, Remote Sens. Environ., 112, 1196–1211, https://doi.org/10.1016/j.rse.2007.08.011, 2008.
Ke, Y., Im, J., Lee, j., Gong, H., and Ryu, Y.: Characteristics of Landsat 8 OLI-derived NDVI by comparison with multiple satellite sensors and in-situ observations, Remote Sens. Environ., 164, 298–313. https://doi.org/10.1016/j.rse.2015.04.004, 2015.
Keeley, J. E.: Fire intensity, fire severity and burn severity: a brief review and suggested usage, Int. J. Wildland Fire, 18, 116–126, https://doi.org/10.1071/WF07049, 2009.
Keeley, J. E., Bond, W. J., Bradstock, R. A., Pausas, J. G., and Rundel, P. W. (Eds.): Fire in Mediterranean ecosystems: Ecology, evolution and management, Cambridge University Press, Cambridge, United Kingdom, 2011.
Kennedy, M. C. and Johnson, M. C.: Fuel treatment prescriptions alter spatial patterns of fire severity around the wildland–urban interface during the Wallow Fire, Arizona, USA, Forest Ecol. Manag., 318, 122–132, https://doi.org/10.1016/j.foreco.2014.01.014, 2014.
Key, C. H. and Benson, N. C.: Landscape assessment (LA) sampling and analysis methods, USDA Forest Service General Technical Report, RMRS-GTR-164-CD, U.S. Department of Agriculture, Forest Service, Fort Collins, Colorado, United States of America, 2006.
Landsat 8 Data Users Handbook Version 5.0: https://prd-wret.s3.us-west-2.amazonaws.com/assets/palladium/production/atoms/files/LSDS-1574_L8_ Data_Users_Handbook-v5.0.pdf (last access: 1 November 2020), 2019.
López-García, M. J. and Caselles, V.: Mapping burns and natural reforestation using thematic mapper data, Geocarto Int., 1 31–37, https://doi.org/10.1080/10106049109354290, 1991.
Miller, J. D. and Thode, A. E.: Quantifying burn severity in a heterogeneous landscape with a relative version of the delta normalized burn ratio (dNBR), Remote Sens. Environ., 109, 66–80, https://doi.org/10.1016/j.rse.2006.12.006, 2007.
Miller, J. D., Safford, H. D., Crimmins, M., and Thode, A. E.: Quantitative evidence for increasing forest fire severity in the Sierra Nevada and Southern Cascade Mountains, California and Nevada, USA, Ecosystems, 12, 16–32, https://doi.org/10.1007/s10021-008-9201-9, 2009.
MODIS Science Data Support Team: https://modis.gsfc.nasa.gov/data/atbd/atbd_mod28_v3.pdf (last access: 1 November 2020), 1997.
Moreira, F., Ascoli, D., Safford, H., Adams, M. A., Moreno J. M., Pereira, J.M., Catry, F. X., Armesto, J., Bond, W., González, M. E., Curt, T., Koutsias, N., McCaw, L., Price, O., Pausas, J. G,, Rigolot, E., Stephens, S., Tavsanoglu, C., Vallejo, V. R., Van Wilgen, B. W., Xanthopoulos, G., and Fernandes, P. M.: Wildfire management in Mediterranean-type regions: paradigm change needed, Environ. Res. Lett., 15, 011001, https://doi.org/10.1088/1748-9326/ab541e, 2020.
Moritz, M. A., Parisien, M. A., Batllori, E., Krawchuk, M. A., Van Dorn, J., Ganz, D. J., and Hayhoe, K.: Climate change and disruptions to global fire activity, Ecosphere, 3, 1–22, https://doi.org/10.1890/ES11-00345.1, 2012.
Muhammad, S. and Thapa, A.: Daily Terra–Aqua MODIS cloud-free snow and Randolph Glacier Inventory 6.0 combined product (M*D10A1GL06) for high-mountain Asia between 2002 and 2019, Earth Syst. Sci. Data, 13, 767–776, https://doi.org/10.5194/essd-13-767-2021, 2021.
Parks, S. A., Dillon, G. K., and Miller, C.: A new metric for quantifying burn severity: the relativized burn ratio, Remote Sens., 6, 1827–1844, https://doi.org/10.3390/rs6031827, 2014.
Parks, S. A., Miller, C., Abatzoglou, J. T., Holsinger, L. M., Parisien, M. A., and Dobrowski, S. Z.: How will climate change affect wildland fire severity in the western US?, Environ. Res. Lett., 11, 035002, https://doi.org/10.1088/1748-9326/11/3/035002, 2016.
Picotte, J. J. and Robertson, K. M.: Validation of remote sensing of burn severity in south-eastern US ecosystems, Int. J. Wildland Fire, 20, 453–464, https://doi.org/10.1071/WF10013, 2011.
Picotte, J. J., Peterson, B., Meier, G., and Howard, S. M.: 1984–2010 trends in fire burn severity and area for the conterminous US, Int. J. Wildland Fire, 25, 413–420, https://doi.org/10.1071/WF15039, 2016.
Potapov, P., Hansen, M. C., Kommareddy, I., Kommareddy, A., Turubanova, S., Pickens, A., Adusei, B., Tyukavina, A., and Ying, Q.: Landsat Analysis Ready Data for Global Land Cover and Land Cover Change Mapping, Remote Sens., 12, 426, https://doi.org/10.3390/rs12030426, 2020.
Quintano, C., Fernández-Manso, A., and Roberts, D. A.: Burn severity mapping from Landsat MESMA fraction images and land surface temperature, Remote Sens. Environ., 190, 83–95, https://doi.org/10.1016/j.rse.2016.12.009, 2017.
Rahman, S., Chang, H., Hehir, W., Magilli, C., and Tomkins, K.: Inter-Comparison of Fire Severity Indices from Moderate (Modis) and Moderate-To-High Spatial Resolution (Landsat 8 & Sentinel-2A) Satellite Sensors, IGARSS 2018 – 2018 IEEE International Geoscience and Remote Sensing Symposium, Valencia, Spain, https://doi.org/10.1109/IGARSS.2018.8518449, 2018.
Rodrigues, M. and Febrer, M.: Spatial-temporal modeling of forest fire behavior: modeling fire ignition and propagation from MCD64A1, in: Proceedings of the 20th EGU General Assembly, Vienna, Austria, 4–13 April 2018.
Rozario, P. F., Madurapperuma, B. D., and Wang, Y.: Remote Sensing Approach to Detect Burn Severity Risk Zones in Palo Verde National Park, Costa Rica, Remote Sens., 10, 1427, https://doi.org/10.3390/rs10091427, 2018.
Soverel, N. O., Coops, N. C., Perrakis, D. B., Daniels, L., and Gergel, S.: The transferability of a dNBR-derived model to predict burn severity across ten wildland fires in Western Canada, Int. J. Wildland Fire, 20, 1–14, https://doi.org/10.1071/WF10081, 2011.
Stevens, J. T., Collins, B. M., Miller, J. D., North, M. P., and Stephens, S. L.: Changing spatial patterns of stand-replacing fire in California conifer forests, Forest Ecol. Manag., 405, 28–36, https://doi.org/10.1016/j.foreco.2017.08.051, 2017.
van der Werf, G. R., Randerson, J. T., Giglio, L., van Leeuwen, T. T., Chen, Y., Rogers, B. M., Mu, M., van Marle, M. J. E., Morton, D. C., Collatz, G. J., Yokelson, R. J., and Kasibhatla, P. S.: Global fire emissions estimates during 1997–2016, Earth Syst. Sci. Data, 9, 697–720, https://doi.org/10.5194/essd-9-697-2017, 2017.
Veraverbeke, S., Lhermitte, S., Verstraeten, W. W., and Goosens, R.: A time-integrated MODIS burn severity assessment using the multi-temporal differenced normalized burn ratio (dNBRMT), Int. J. Appl. Earth Obs. Geoinformation, 13, 52–58, https://doi.org/10.1016/j.jag.2010.06.006, 2011.
Veraverbeke, S., Rogers, B. M., and Randerson, J. T.: Daily burned area and carbon emissions from boreal fires in Alaska, Biogeosciences, 12, 3579–3601, https://doi.org/10.5194/bg-12-3579-2015, 2015.
Wang, L., Qu, J. J., and Hao, X: Forest fire detection using the normalized multi-band drought index (NMDI) with satellite measurements, Agric. For. Meteorol., 148, 1767–1776, https://doi.org/10.1016/j.agrformet.2008.06.005, 2008.
Yu, J., Zhang, G., Yao, T., Xie, H., Zhang, H., Ke, C., and Yao, R.: Developing Daily Cloud-Free Snow Composite Products From MODIS Terra–Aqua and IMS for the Tibetan Plateau, IEEE T. Geosci. Remote Sens., 54, 2171–2180, https://doi.org/10.1109/TGRS.2015.2496950, 2015.
Zhu, Z., Key, C., Ohlen, D., and Benson, N.: Evaluate sensitivities of burn-severity mapping algorithms for different ecosystems and fire histories in the United States, Final Report to the Joint Fire Science Program, JFSP 01-1-4-12, USGS, National Center for Earth Resources Observation and Science Joint Fire Science Program, Sioux Falls, South Dakota, United States of America, 2006.