the Creative Commons Attribution 4.0 License.
the Creative Commons Attribution 4.0 License.
 | 17 Dec 2020
A satellite-derived database for stand-replacing windthrow events in boreal forests of European Russia in 1986–2017
Alexander V. Chernokulsky
Igor O. Azhigov
Anastasia V. Semakina
Severe winds are among the main causes of disturbances in boreal and temperate forests. Here, we present a new geographic information system (GIS) database of stand-replacing windthrow events in the forest zone of European Russia (ER) for the 1986–2017 period. The delineation of windthrow areas was based on the full Landsat archive and two Landsat-derived products on forest cover change, namely the Global Forest Change and the Eastern Europe's forest cover change datasets. Subsequent verification and analysis of each windthrow was carried out manually to determine the type of related storm event, its date or date range, and geometrical characteristics. The database contains 102 747 elementary areas of damaged forest that were combined into 700 windthrow events caused by 486 convective or non-convective storms. The database includes stand-replacing windthrows only with an area > 0.05 and > 0.25 km2 for the events caused by tornadoes and other storms, respectively. Additional information such as weather station reports and event descriptions from media sources is also provided. The total area of stand-replacing windthrows amounts to 2966 km2, which is 0.19 % of the forested area of the study region. Convective windstorms contribute 82.5 % to the total wind-damaged area, while tornadoes and non-convective windstorms are responsible for 12.9 % and 4.6 % of this area, respectively. Most of the windthrow events in ER happened in summer, which is in contrast to Western and Central Europe, where they mainly occur in autumn and winter. Due to several data and method limitations, the compiled database is spatially and temporally inhomogeneous and hence incomplete. Despite this incompleteness, the presented database provides a valuable source of spatial and temporal information on windthrow in ER and can be used by both science and management. The database is available at https://doi.org/10.6084/m9.figshare.12073278.v6 (Shikhov et al., 2020).
- Article
(35496 KB) - Full-text XML
- BibTeX
- EndNote


Forests are a valuable natural resource that are important for the economy, society, and sustainable development. Forest ecosystems are regularly exposed to natural disturbance agents such as fires, droughts, insect outbreaks, and windstorms. Being an intrinsic part of forest ecosystem dynamics (Attiwill, 1994; Seidl et al., 2017), natural disturbances cause substantial environmental and economic damage (Schelhaas et al., 2003; Gardiner et al., 2010; van Lierop et al., 2015). In boreal and temperate forests, windstorms constitute one of the main drivers of natural disturbances (Ulanova, 2000; Forzieri et al., 2020). In Europe, windthrows contribute more than half of the total area of natural disturbances, including abiotic and biotic causes (Schelhaas et al., 2003; Gardiner et al., 2010).
Recently, disturbance regimes have changed considerably in many forest ecosystems worldwide (Seidl et al., 2011, 2017; Senf et al., 2018). In particular, both the occurrence and severity of disturbances have increased in different regions, including those related to forest fires (Westerling, 2016), insect outbreaks (Kautz et al., 2017), and droughts (Millar and Stephenson, 2015). Researchers have revealed a statistically significant increase in wind-related forest disturbances in Western, Central, and Northern Europe (Seidl et al., 2014; Gregow et al., 2017) and in European Russia (ER; Potapov et al., 2015).
The observed increase in the frequency and severity of windthrow events is associated with changes in forest structure, like increasing growing stock and median age, primarily in coniferous forests (Schelhaas et al., 2003; Senf et al., 2018), and with climatic changes (Overpeck et al., 1990; Lassig and Moĉalov, 2000; Seidl et al., 2011, 2014, 2017). An intensification of winter windstorms (Gardiner et al., 2010; Usbeck et al., 2010; Gregow et al., 2017) and an increase in the frequency and intensity of severe convective storms in the warm season (Overpeck et al., 1990; Diffenbaugh et al., 2013; Chernokulsky et al., 2017; Radler et al., 2019) can be considered as the main climatic drivers for increasing wind-related damage in boreal and temperate forests.
For the correct attribution of forest windthrow to particular causes, it is important to obtain corresponding data on such events. Recently, several long-term databases of windthrow events in boreal and temperate forests, often together with other types of disturbances, have been collected at a national and international scale. The longest windthrow data series have been compiled in Sweden (Nilsson et al., 2004) and Switzerland (Usbeck et al., 2010) based on literature reviews and forestry services reports. The European Forest Institute compiled the database of destructive storms in European forests for 1951–2010 (Gardiner et al., 2010). A new geographic information system (GIS) database of wind disturbance in European forests has been compiled in 2019 by aggregating multiple datasets collected by 26 research institutes and forestry services across Europe (Forzieri et al, 2020). It comprises more than 80 000 forested areas that were disturbed by wind in 2000–2018. Compared to other European countries, windthrow events in Russia remain understudied. Long-term databases of windthrow events have been collected only for individual regions, for example, for the middle Urals (Lassig and Moĉalov, 2000) and the Central Forest Reserve in the Tver region (Ulanova, 2000).
The main data sources of previously compiled windthrow databases in Russia were the literature reviews, reports of forestry services, aerial observations, and field investigations (Skvortsova et al., 1983; Lassig and Moĉalov, 2000; Ulanova, 2000). Meanwhile, satellite images have become the important data source for windthrow monitoring in Russian forests in recent decades (Krylov et al., 2012). Indeed, satellite data can be especially informative for studying Russian low-populated boreal forests, known in Russia as the taiga, which represent the largest forested region globally. They cover approximately 7.63 million km2, which is 22 % of the world's forested areas (WWF, 2007).
The use of satellite images for obtaining information on windthrow was proposed back in 1975 (Sayn-Wittgenstein and Wightman, 1975). However, the widespread utilization of satellite data to estimate the interannual variability in wind-related forest damage (e.g., Fraser et al., 2005; Baumann et al., 2014) became feasible after the opening of the Landsat archive (Wulder et al., 2012) and two Landsat-based products, namely the Global Forest Change (GFC) map (Hansen et al., 2013) and Eastern Europe's forest cover change (EEFCC) dataset (Potapov et al., 2015). Thus, GIS databases of windthrow events have been collected for some Russian regions based on Landsat archive and the GFC data, i.e., for the Urals and the northeastern part of ER (Shikhov and Zaripov, 2018; Shikhov et al., 2019b), the Kostroma region and adjacent areas (Petukhov and Nemchinova, 2014), and southern Sakhalin (Korznikov et al., 2019). Shikhov and Chernokulsky (2018) found 110 previously unknown tornado-induced windthrow areas in ER based on satellite images. However, for the entire ER, there are only rough estimates of storm-related forest damage (Potapov et al., 2015). The contribution of various weather phenomena like convective and non-convective windstorms, snowstorms, and tornadoes to the total wind-induced forest damage, as well as the interannual and seasonal distribution of windthrow events, remains unknown for ER territory. The appearance of such data can be helpful for forest science and management, as well as for the investigation of severe storms.
In this study, we present a detailed GIS database of relatively large stand-replacing windthrow events in the forest zone of ER for the period 1986–2017. The database contains windthrow areas with an indication of storm event types and dates, geometrical characteristics of windthrow areas, and additional information. To determine these characteristics, we use the Landsat archive, the GFC and EEFCC Landsat-based forest loss data products, high-resolution satellite images from public map services, supplementary information including weather station observations, databases on hazardous weather events, damage reports in the media sources, and reanalysis data. We describe the data used and the study region in Sect. 2 and explain the database structure in Sect. 3. Section 4 describes the windthrow delineation process and assessment of the geometrical parameters of windthrow areas. Section 5 presents spatiotemporal variability in wind-damaged areas and distributions of their geometrical characteristics. Section 6 discusses the main limitations of the method and the compiled dataset, while Sect. 8 draws the main conclusions of the paper.

Figure 1Land cover types within the study area according to the map of vegetation cover of Russia developed by the Space Research Institute of the Russian Academy of Sciences (Bartalev et al., 2016).
2.1 The study region
The study region includes the forest zone of ER (Fig. 1) between the forest–steppe transition zone in the south and forest–tundra transition zone in the north. The availability of the EEFCC dataset determines the eastern boundary of the study region that broadly coincides with the Ural Ridges.
We used the 250 m resolution map of the vegetation cover of Russia (Bartalev et al., 2016) to estimate forest-covered area and dominant forest species (Fig. 1). Forests cover 54.6 % of the study region. The most widespread dominant forest species are dark coniferous (Picea abies, Picea obovata, Abies sibirica), light coniferous (Pinus sylvestris), small-leaved (Betula pendula, Betula pubescens, Populus tremula), and some broadleaved species (Tilia cordata, Quercus robur and others) (Kalyakin et al., 2004). Secondary (regrown after logging or wildfires) small-leaved and mixed forests cover approximately 61 % of the total forested area. Old-growth dark coniferous forests are widespread on the western slope of the northern Urals and adjacent plain, and pine forests cover the largest area (> 100 000 km2) in the northwest of ER (Fig. 1).
2.2 Initial data
We used multiple data sources to collect information on windthrow events for the 1986–2017 period. In particular, we utilized satellite data to delineate windthrow areas and determine a storm event type and used additional information to determine the dates of storm events.
2.2.1 Primary information for windthrow delineation and verification
The Landsat-based GFC data were utilized to search and delineate forested areas affected by storm events in 2001–2017. The data come as the integer raster with a 30 m cell size. It contains information on stand-replacing forest disturbances at annual temporal resolution. In the boreal forest regions, the overall accuracy of the forest loss detection in the GFC is 99.3 %, while user's and producer's accuracies are 93.9 % and 88.0 %, respectively (Hansen et al., 2013). Here, producer's accuracy is the ratio of correctly classified forest loss area to the actual forest loss area; user's accuracy is the ratio of correctly classified forest loss area to the same area according to the verified forest loss area. The GFC data were downloaded from http://earthenginepartners.appspot.com/google.com/gMG7KbLG (last access: 15 December 2020). The EEFCC dataset was used to search and delineate windthrow areas in 1986–2000. The data come as the integer raster with a 30 m cell size. It contains information on forest loss classified into four broad periods: 1986–1988, 1989–2000, 2001–2006, and 2007–2012. This rough time determination is associated with rareness of the Landsat images between 1989 and 1998. The detection of gross forest loss in the EEFCC has producer's and user's accuracy of 88 % and 89 %, respectively (Potapov et al., 2015). The data were downloaded from https://glad.geog.umd.edu/dataset/eastern-europe-forset-cover-dynamics-1985-2012/ (last access: 15 December 2020).
Landsat images (L1T processing level), i.e., images from the Landsat Thematic Mapper (TM), the Enhanced Thematic Mapper Plus (ETM+), and the Operational Land Imager (OLI), were used to confirm the wind-related nature of forest disturbance and determine the storm types and dates (or ranges of dates) of windthrow occurrence in 1986–2017. It addition, many windthrow areas appearing before 2001 were delineated with Landsat images (see Sect. 3.1.3 for details). Sentinel-2 images were used to confirm the wind-related nature of forest disturbance and determine the storm types and dates (or ranges of dates) of windthrow event occurrence for the 2016–2017 period. We downloaded the Landsat and Sentinel-2 images from https://earthexplorer.usgs.gov/ (last access: 15 December 2020) and https://eos.com/landviewer (last access: 15 December 2020).
High-resolution (0.5–2 m) satellite images, hereinafter HRIs, were used to discriminate the type of storm event causing the windthrow (windstorm or tornado). Usually two to eight high-resolution images are available for the period 2001–2017. No HRIs are available before 2001. To view and analyze the HRIs, we used mainly Google Earth Pro, while other public map services (i.e., Bing Maps, ESRI Imagery, Here) were used to a lesser degree. We should highlight that the availability of the HRIs substantially varies among different parts of ER. In particular, some areas in the northern part of ER are not covered by the HRIs.
Table 1Attribute table of the GIS layer of elementary damaged areas (EDAs).
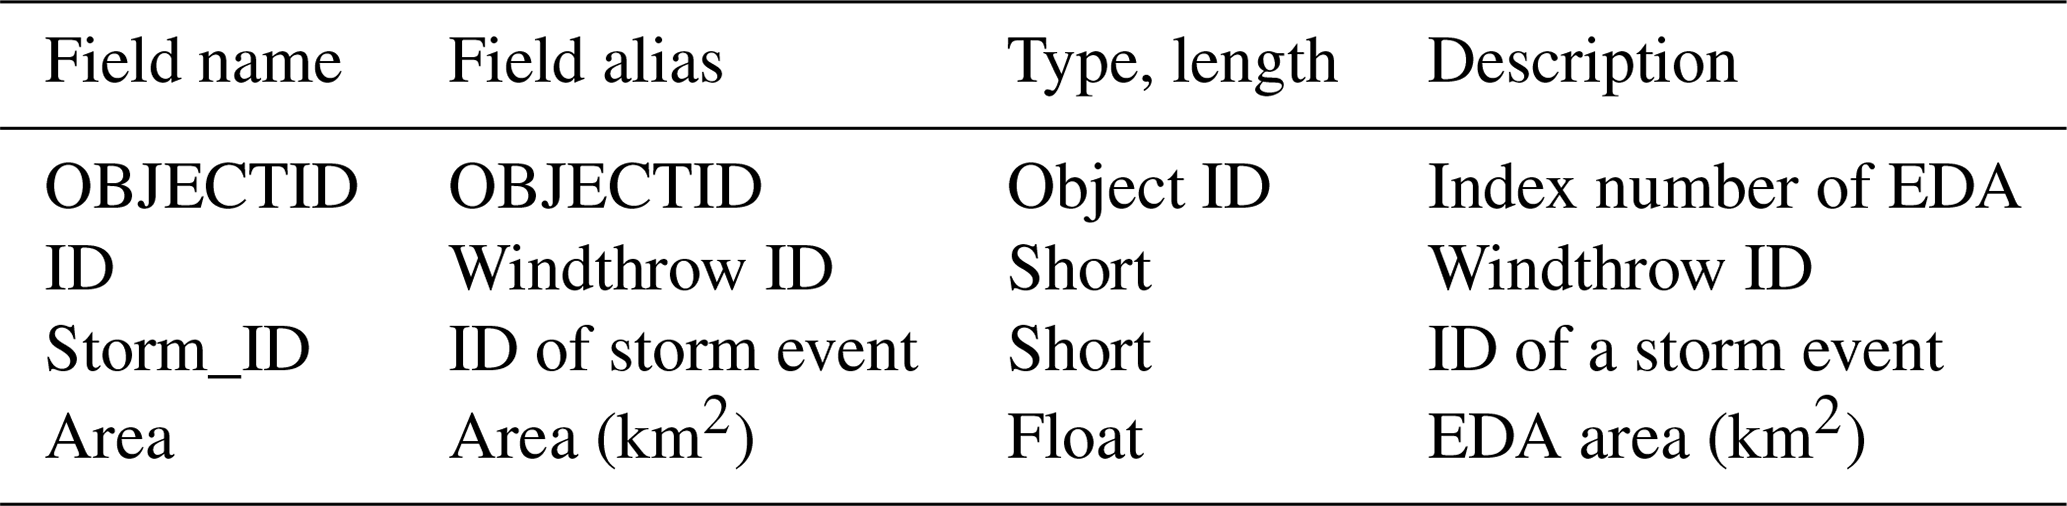
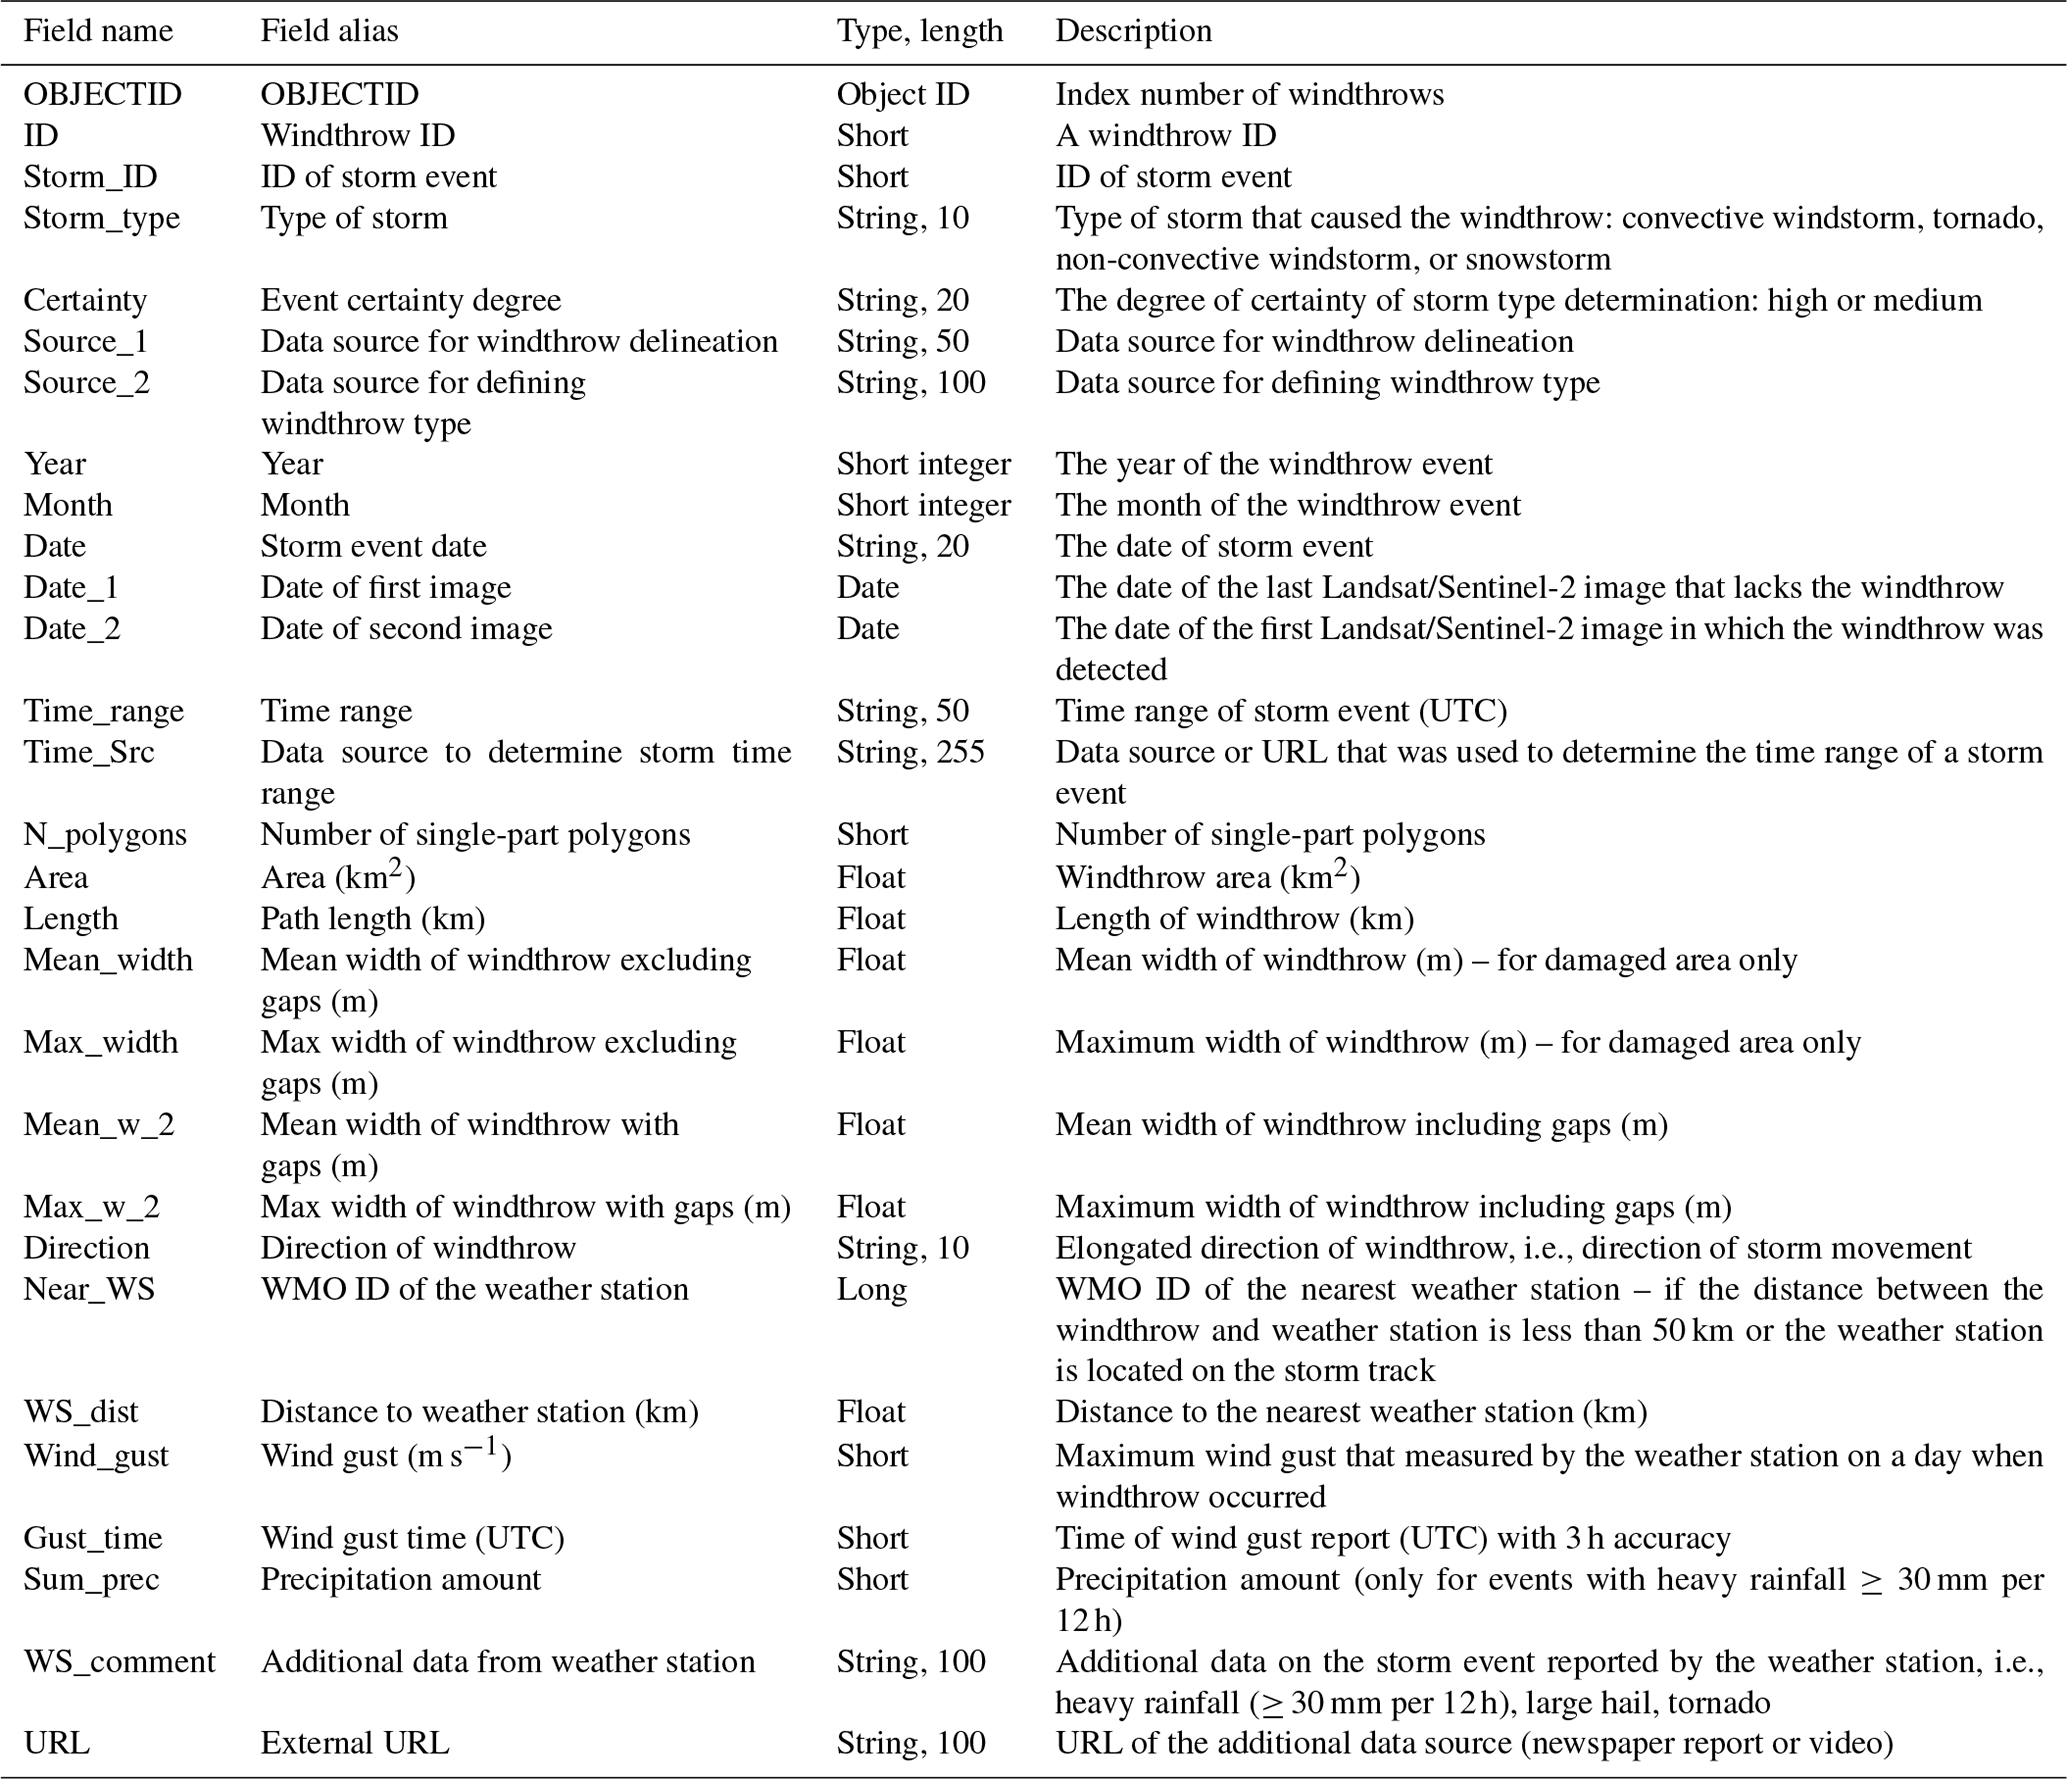
Table 2Attribute table of the GIS layer of windthrow areas in the forest zone of ER (1986–2017).
2.2.2 Additional information on storm events
Information of 3-hourly weather reports was used to determine storm event dates and match the reported wind gusts, if any, with windthrow events. We utilized information on observed wind speed, precipitation, and hail and thunderstorm occurrence. The routine meteorological observations have been collected at 402 meteorological stations located within the studied area and have been initially processed at the All-Russian Research Institute of Hydrometeorological Information – World Data Center (RIHMI-WDC) from 1966 to the present (Bulygina et al., 2014). Monthly reviews of hazardous weather events occurring in Russia, which are published in the Russian Meteorology and Hydrology journal (http://mig-journal.ru/en/archive-eng, last access: 15 December 2020) but not translated, were also used to determine storm event dates for the 2001–2017 period. Additionally, these reviews contain the descriptions of hazardous weather events and damage reports. We included this information in our database. The RIHMI-WDC database of hazardous weather events (Shamin et al., 2019) and information from regional departments of the Russian state weather service were also utilized to determine the dates of several storms that caused windthrow events in 1986–2017. Media news and witness reports in social networks, including photos and videos, were used for obtaining additional information on the type of event, i.e., tornadic or non-tornadic, for the 1986–2017 period. Data from meteorological satellites Terra/Aqua MODIS (from 2001) and Meteosat-8 (from 2016) were used for obtaining additional information on storm events causing windthrows, especially for determining storm date and time. In particular, the Collection 6 MODIS Active Fire data (Giglio et al., 2016) were used to discriminate fire- and wind-related forest disturbances in 2001–2017. Data were downloaded from https://earthdata.nasa.gov/data/near-real-time-data/firms (last access: 15 December 2020). Data from Russian weather radars (Dyaduchenko et al., 2014) were used only for several events occurring in 2012, 2014, and 2016 to determine the time of storm event causing windthrow.
The compiled database of stand-replacing windthrow events in the forest zone of ER in 1986–2017 is publicly available at https://doi.org/10.6084/m9.figshare.12073278.v6 (Shikhov et al., 2020). We divided the spatial and attributive information on windthrow events into three hierarchical levels that correspond to three GIS layers, i.e., three shapefiles (.shp), in the database:
-
“elementary damaged area” (EDA), which is a single-part polygon of wind-damaged forest;
-
“windthrow area”, which represents a group of closely spaced wind-damaged areas, i.e., a multi-part polygon, associated with one storm event;
-
“storm event track”, which is a cluster of windthrow areas having a similar direction and the same date (or same date range) of occurrence, which were most likely induced by one convective or non-convective storm.
GIS layers have the WGS84 geographic coordinate system (EPSG:4326). The key fields ID and storm_ID associate each damaged area with the spatial features in the datasets of windthrow and storm event tracks, respectively, using a one-to-many relation. ID values of windthrow areas are set according to the date of occurrence of storm events. Within 1 year, numbers are first set for windthrow areas with known dates and then for ones with unknown dates. If two or more windthrow areas are caused by one storm event, their numbers are sequential according to storm movement direction. The numbering of EDAs is organized according to the numbering of windthrow areas. EDAs related to one windthrow area are numbered from the lower left corner, that is from southwest to northeast. The structure of the attribute tables of each shapefile (stored in .dbf files) is presented in Tables 1–3. The determination process of the presented characteristics is described in Section 4 and schematically presented in Fig. 2. Figure 3 shows an example with all three hierarchical levels of the database.
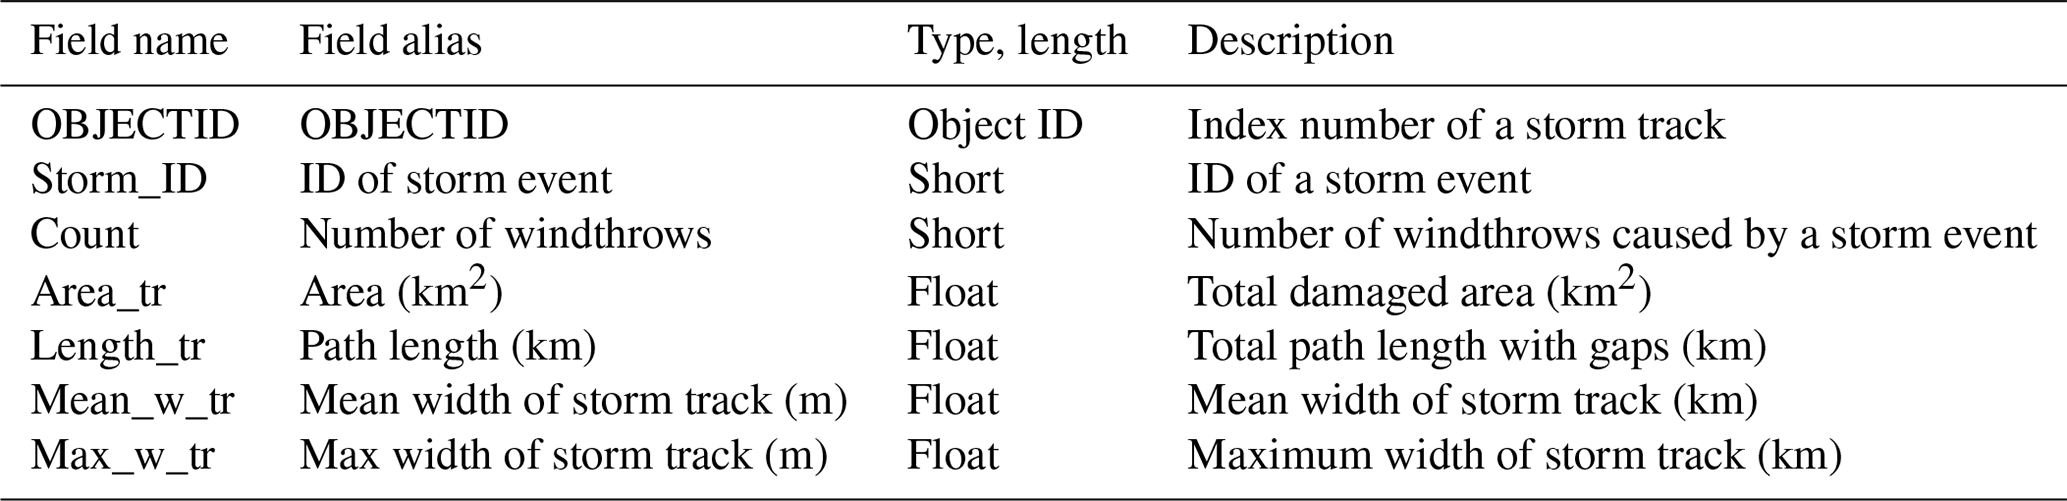
Table 3Attribute table of the GIS layer of storm events tracks.
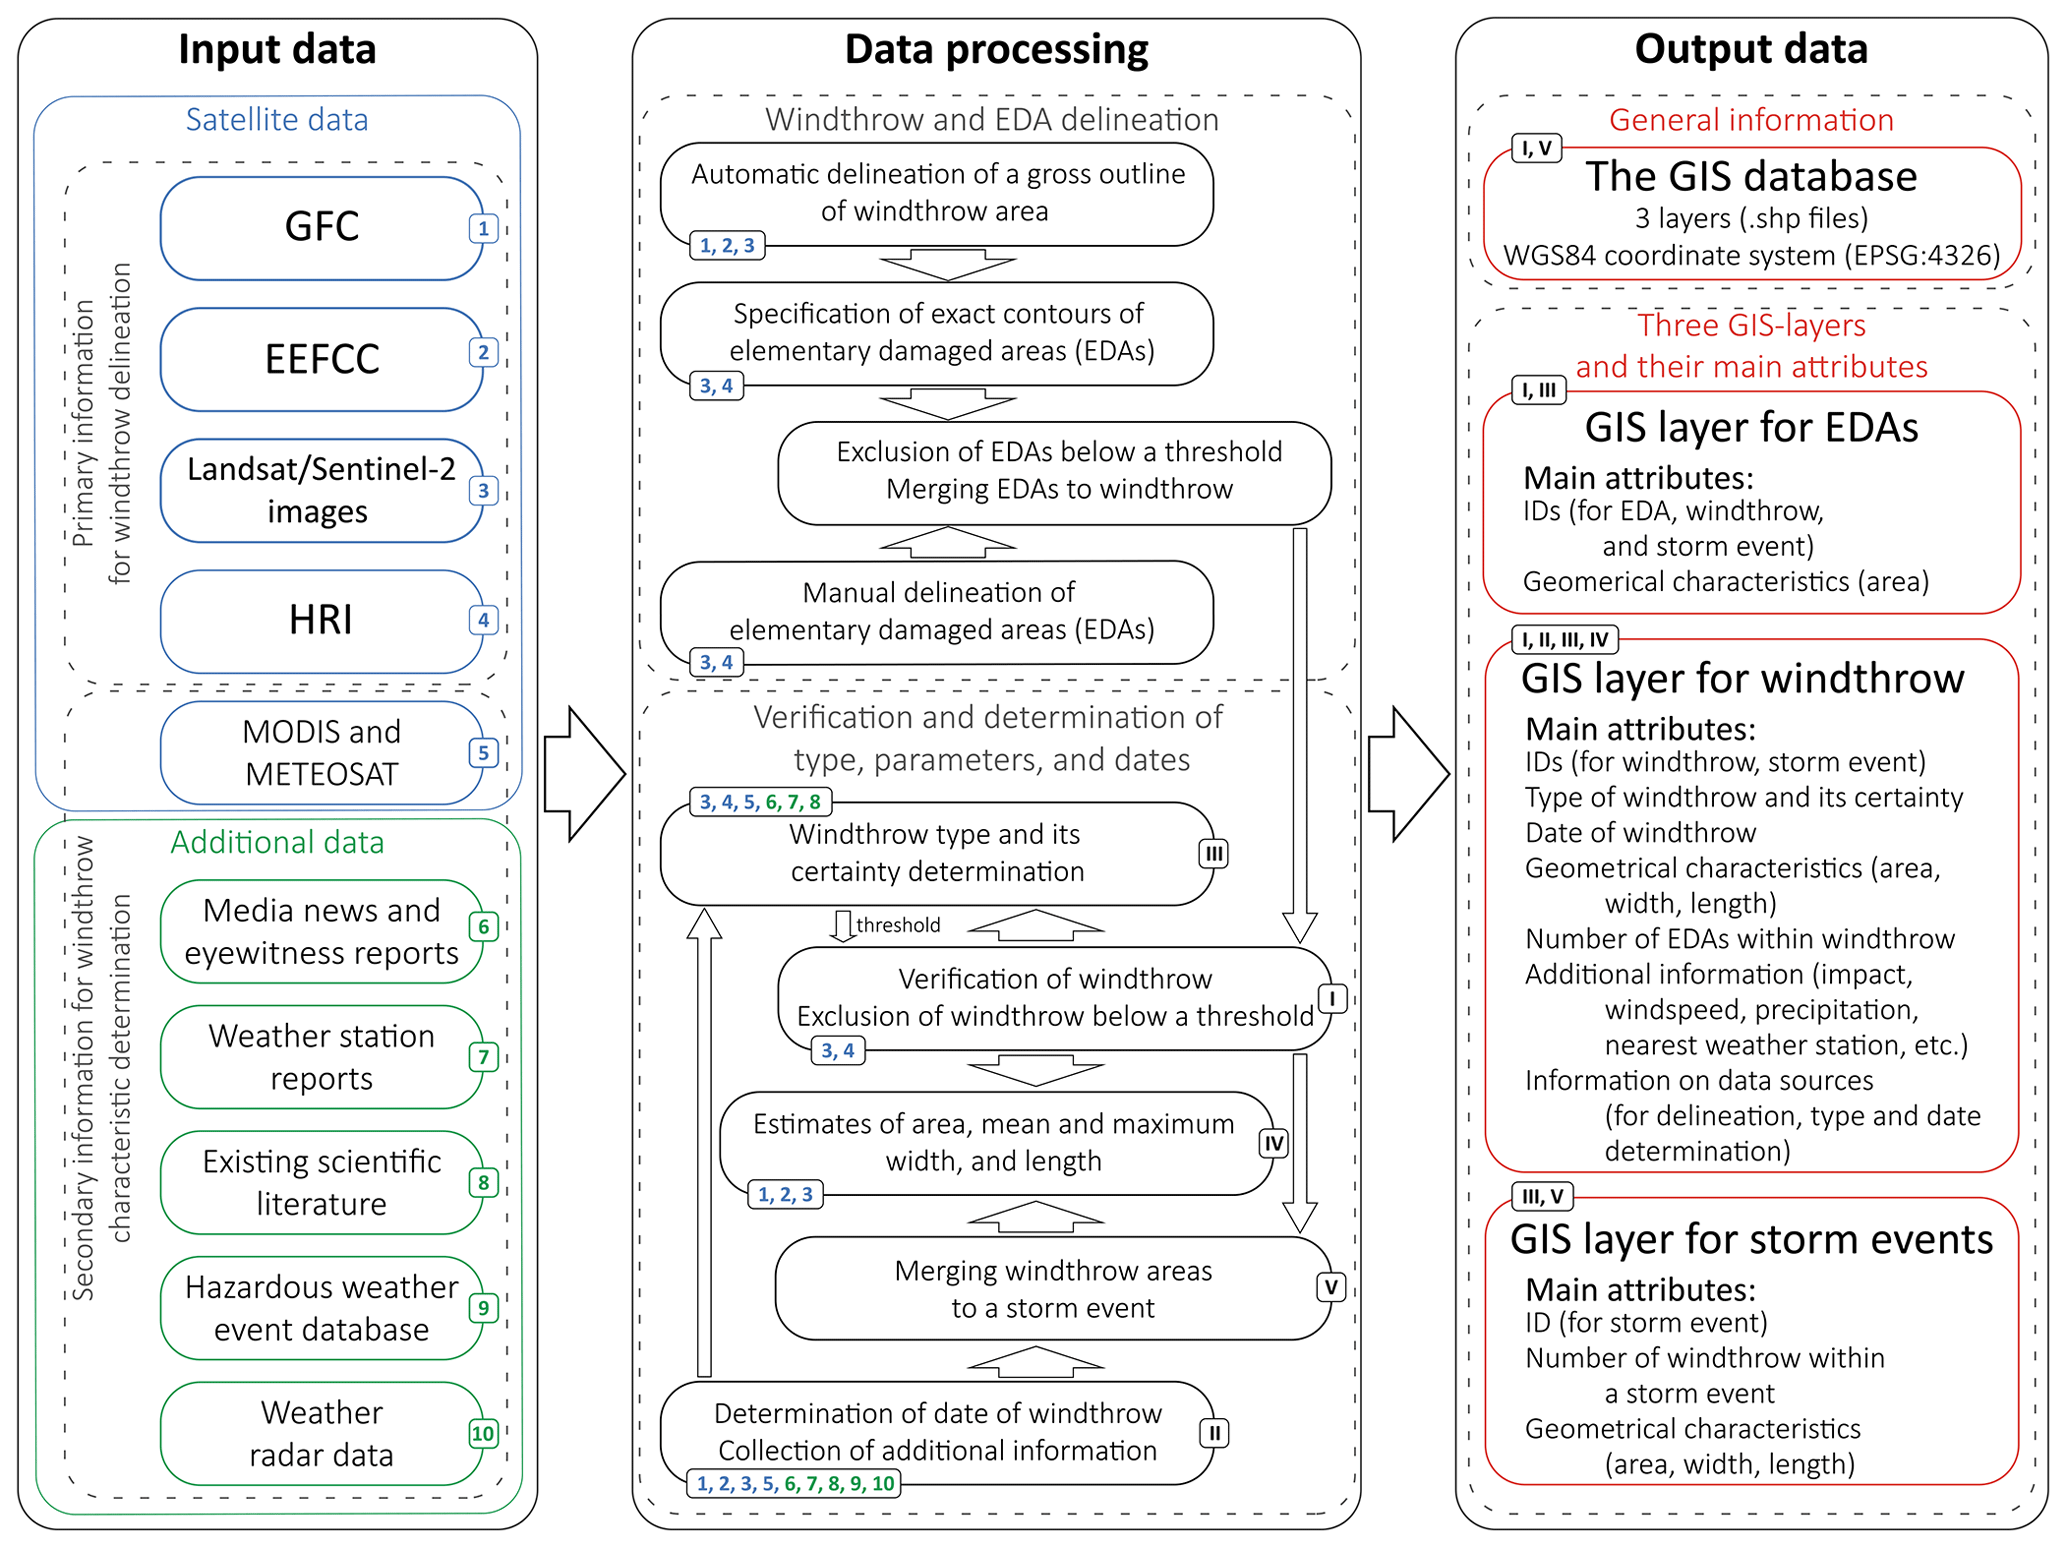
The process of windthrow identification and attribution to a particular type includes four stages (Fig. 2): (1) delineation of a windthrow using the Landsat-based global file system (GFS) and EEFCC products or time series of the Landsat or Sentinel satellite images, (2) subsequent verification of a windthrow using the HRIs and the determination of the type of storm event causing a windthrow, (3) estimation of geometrical characteristics of a windthrow, and (4) determination of storm date or range of dates by utilizing additional information. Most of the data collection stages were performed manually using standard GIS tools except for the data extraction from the GFC and EEFCC products and calculation of the geometrical characteristics of windthrow areas (which were automated with the Python language). Due to several limitations of the data sources and the use of expert knowledge at different stages of the data collection workflow (Fig. 2), the compiled database is spatially and temporally inhomogeneous and hence incomplete. In particular, the database lacks small-scale forest disturbances with area below thresholds (Fig. 2). The main data and method limitations are discussed in Sect. 6.
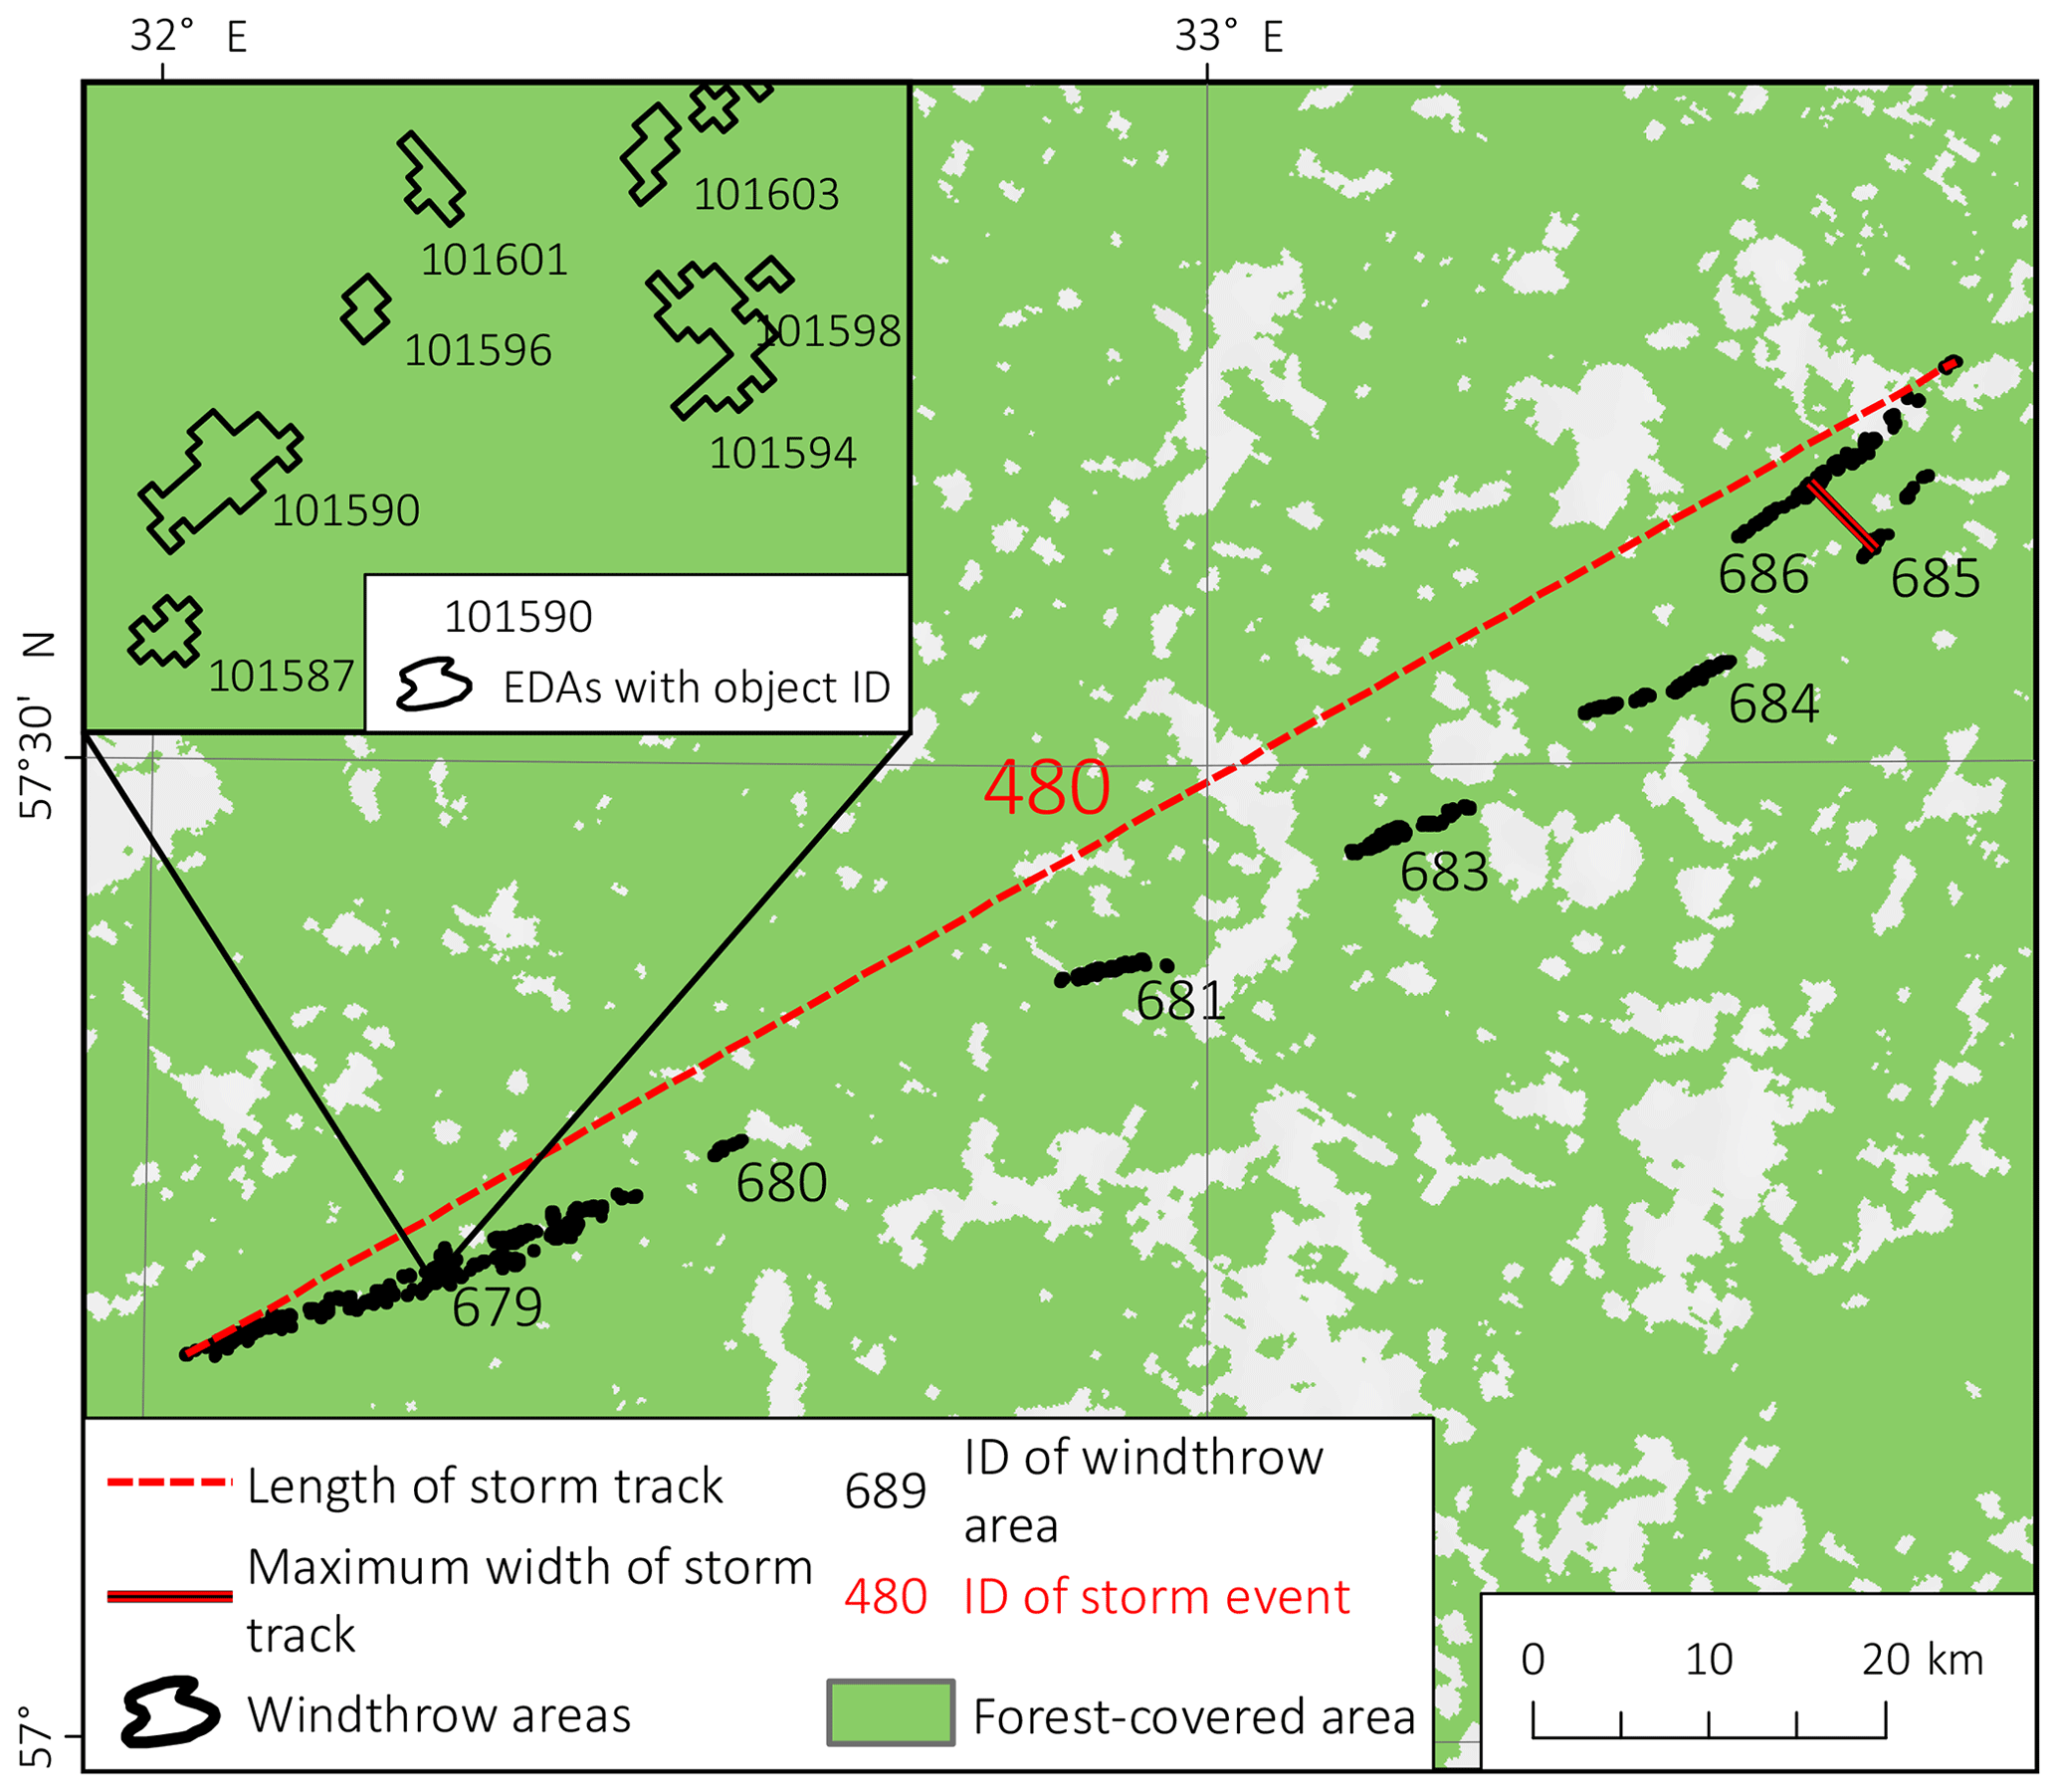
Figure 3An example of three hierarchical levels of the database for the event occurring on 2 August 2017. A scheme for the determination of geometrical parameters of a storm event is also shown. Parallel (680, 681) and successive (684, 689, 682, 678) locations of windthrow areas are indicated as well.
4.1 Delineation of windthrow areas
4.1.1 GFC-based delineation (2001–2017)
We systematically searched through the GFC dataset for forest loss areas that have characteristic windthrow-like signatures. The search was performed for each cell of a supplemental grid with a 50 km cell size that was built for ER. In particular, we looked for forest disturbances with the shape stretched along the direction of storm or tornado movement. Wind-related forest disturbances rarely have quasi-circular/elliptic or regular shapes that are characteristic for fire-related disturbances and logged areas, respectively (Shikhov and Chernokulsky, 2018, Shikhov et al., 2019b). Windstorm- or snow- and/or ice-storm-caused windthrow areas have an amorphous spatial structure and a varying degree of forest damage, whereas tornado-induced windthrow areas have a quasi-linear spatial structure and almost total removal of the canopy (Chernokulsky and Shikhov, 2018). After selecting an area affected by a windthrow, we extracted respective pixels from the GFC data and converted them from raster to multi-part vector polygons, which consist of many single-part polygons, so-called elementary damaged areas (EDAs; Figs. 2, 3). We removed all EDAs with an area ≤ 1800 m2, which equals the area of two GFC pixels. We filtered out such small-scale disturbances since it is virtually impossible to confirm their wind-related origin. Moreover, the area of a local windthrow can be almost 3 times overestimated by Landsat images (Koroleva and Ershov, 2012). We found that the absence of a minimum accepted area for EDAs will increase the area of windthrows by 2 %–3 % on average (up to 6 % for several windthrow areas with an amorphous spatial structure). However, the number of EDAs mistakenly referred to as windthrows can be substantially overestimated.
In total, we delineated 450 windthrow areas using the GFC dataset and clarified contours of 126 of them manually using the Landsat, Sentinel-2, or the high-resolution images (see Sect. 4.2 for details).
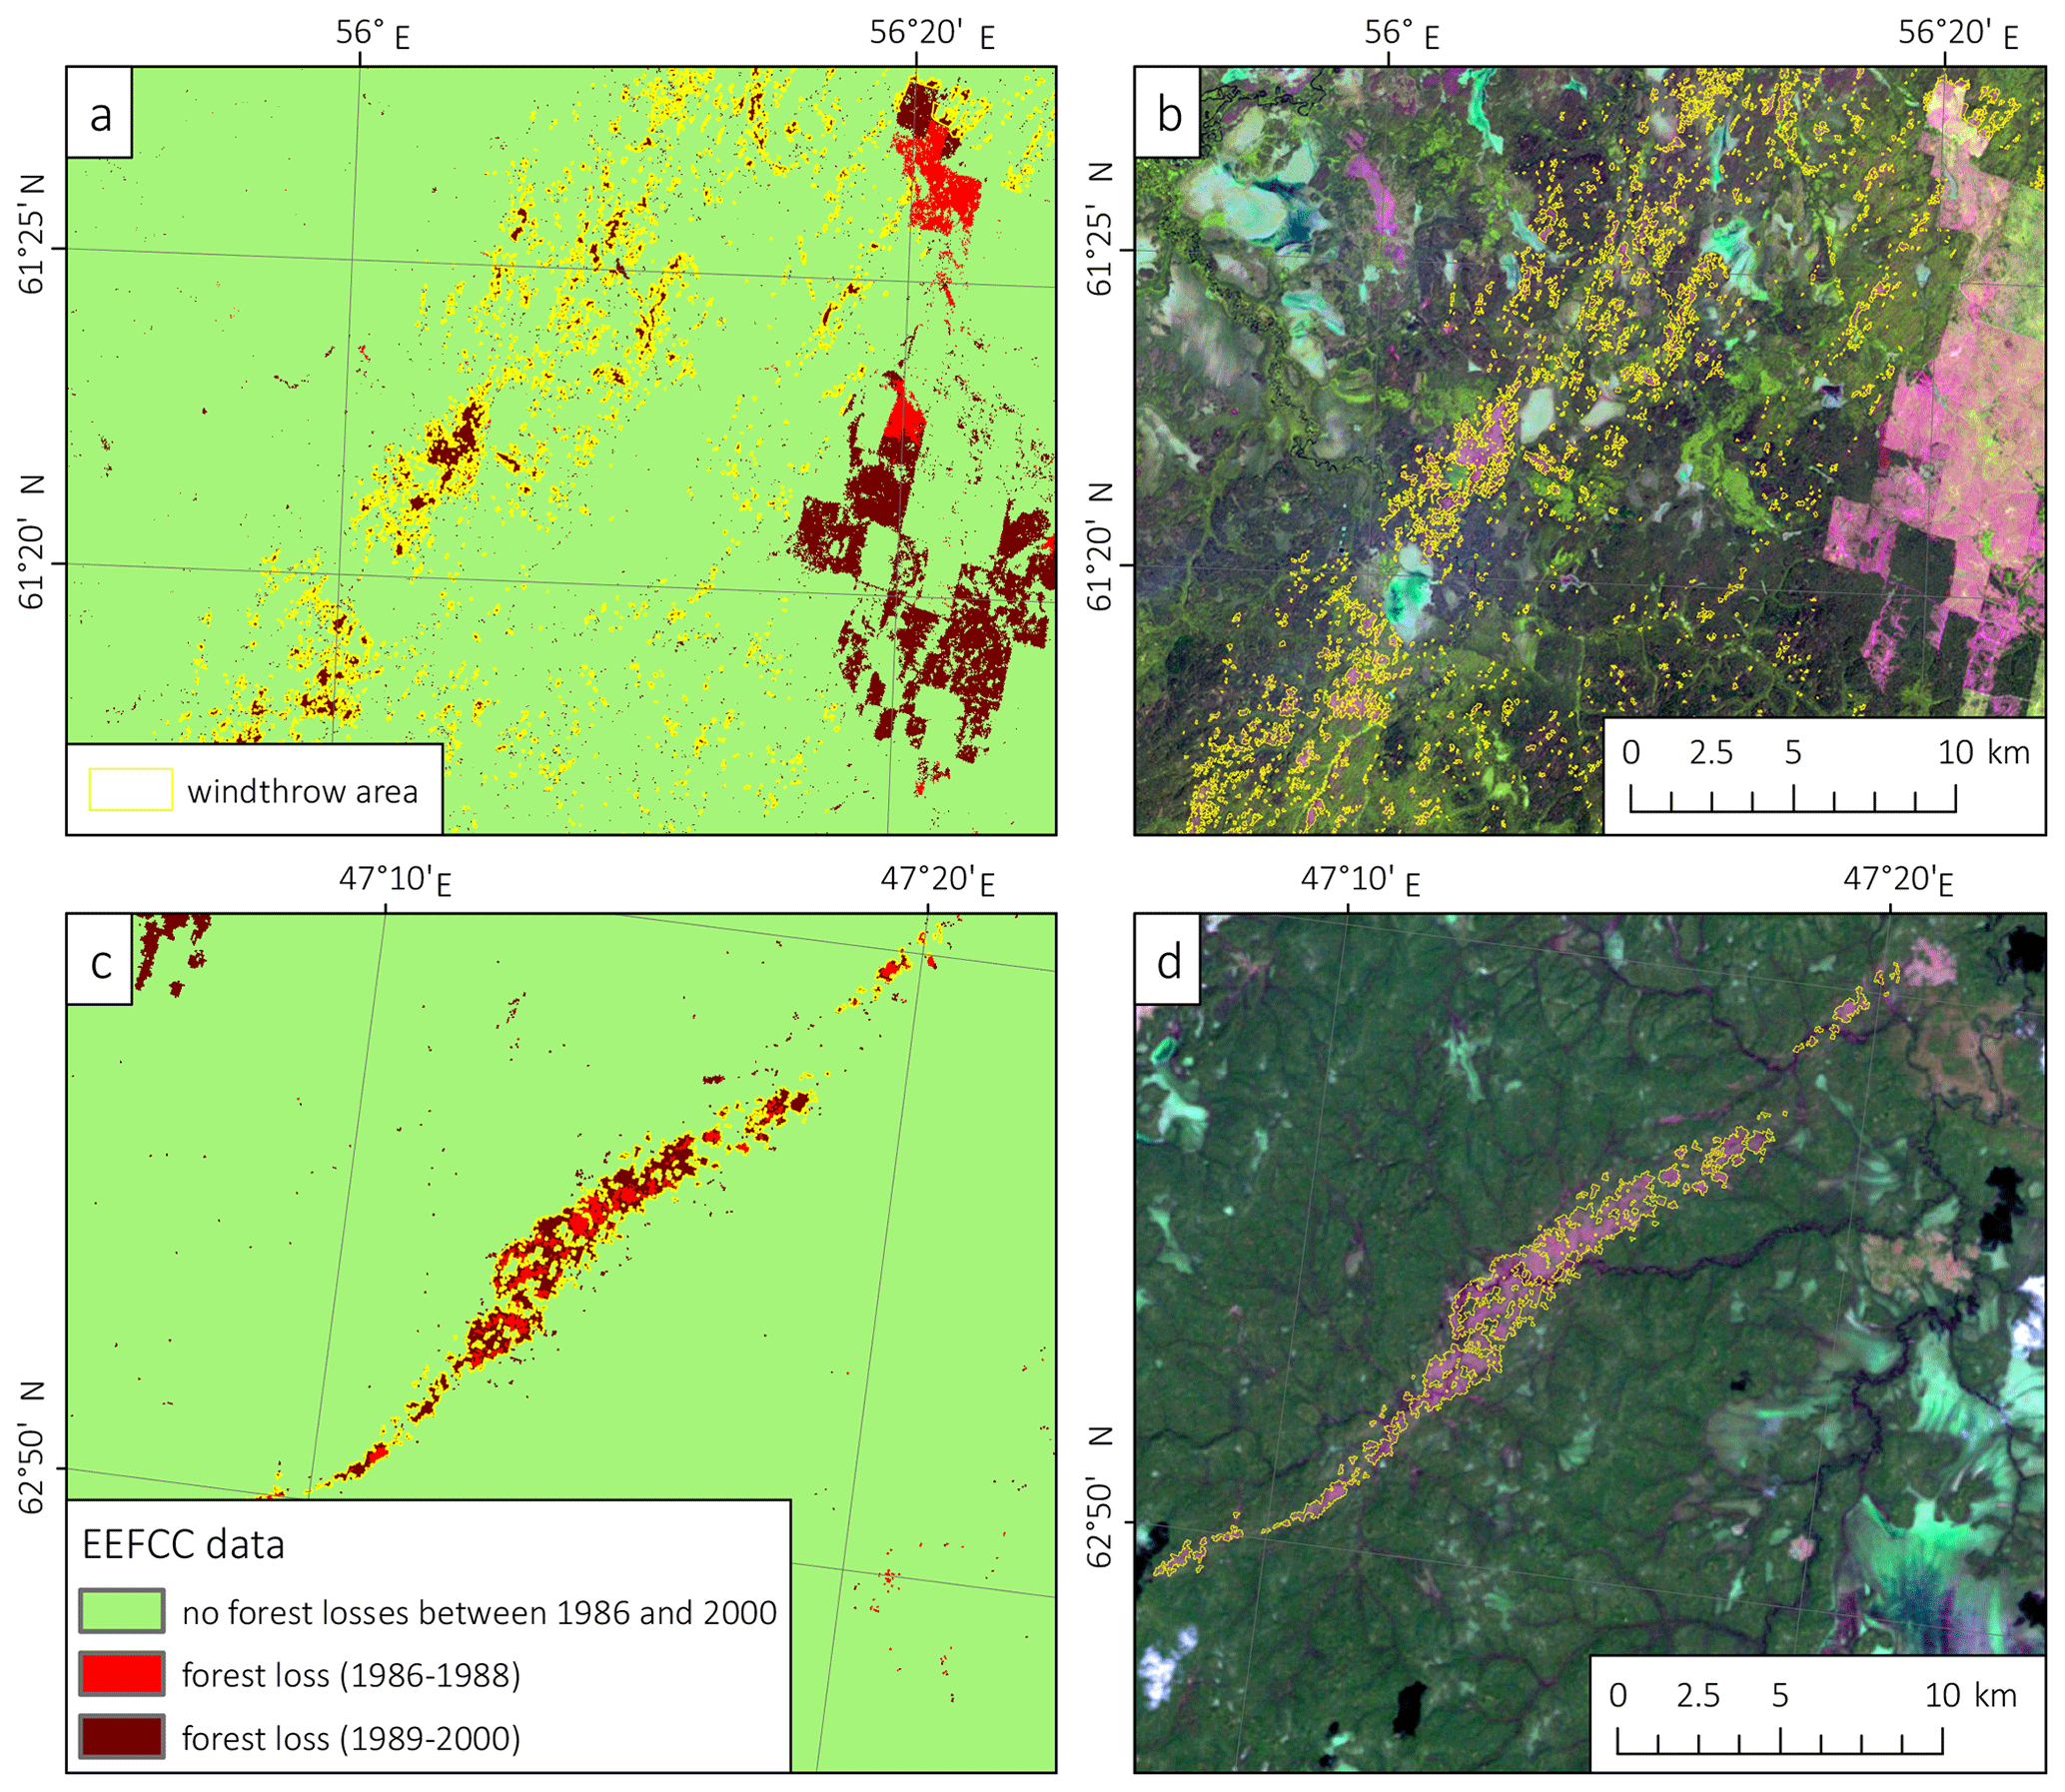
Figure 4Delineation of (a, b) storm- and (c, d) tornado-induced windthrows occurring on 4 July 1992 and 24 July 1988, respectively, based on (a, c) the EEFCC dataset and (b, d) its subsequent verification by the Landsat images shown in the RGB combination of the TM5 (1.65 µm), TM4 (0.85 µm), and TM3 (0.66 µm) spectral bands.
4.1.2 EEFCC-based delineation (1986–2000)
For the EEFCC data, we performed a similar process to the GFC searching and delineation of windthrow areas with, however, some limitations. The main limitation is related to the classification of forest losses into broad periods, i.e., 1986–1988 and 1989–2000. Thereby, a windthrow area can be correctly delineated only if it lacks an overlap with other forest disturbances, namely logging and wildfires, occurring in the same period. For instance, in highly populated areas, salvage logging is usually performed in 1–2 years for most of the wind-damaged forests. Such windthrow areas were delineated by the Landsat images with a semiautomated NDII-based (normalized difference infrared index) method (see Sect. 4.1.3). Based on the EEFCC, we were able to delineate windthrow areas with high confidence mainly in the low-populated northern part of ER (Fig. 4). To partially avoid missing windthrow areas, using Landsat images, we performed additional verifications of all large-scale forest loss areas (with areas more than 5 km2) in highly populated regions independently from their geometry since windthrow areas can be totally masked out by logged areas. We were able to find three large-scale windthrow areas (≥ 10 km2) in these regions. However, some windthrow events could still be missed.
In total, we delineated 153 windthrow areas using the EEFCC dataset. Contours of 32 % of them were then substantially clarified manually with the Landsat images obtained before and after the storm events. Another 22 windthrow areas that occurred before 2001 were delineated manually using the Landsat images. As for the GFC data, we removed all EDAs with an area < 1800 m2 since it is often impossible to confirm their wind-related origin.
4.1.3 NDII-based delineation (1987–2000)
We used Landsat TM/ETM+ images (Level 1T) obtained before and after the storm event in the growing season to delineate seven large-scale windthrow occurring before 2001. We used the difference of normalized difference infrared index (NDII; Hardisky et al., 1983) to detect and delineate wind-related disturbances. The high efficiency of the NDII-based windthrow identification in Landsat images has been shown previously (Wang et al., 2010; Wang and Xu, 2010; Chernokulsky and Shikhov, 2018). The NDII was formulated as follows:
where TM4 and TM5 are the reflectance in bands 4 (0.85 µm) and 5 (1.65 µm) of the Landsat TM/ETM+ data, while the difference was calculate as ΔNDII = NDIIbefore − NDIIafter, in which subscripts “before” and “after” denote two cloud-free images closest to an event obtained, respectively, before and after the windthrow occurrence but in the growing season only.
We applied no atmospheric correction algorithm for preprocessing Landsat images since the NDII is based on the near-infrared (0.76–0.90 nm) and middle-infrared (1.55–1.75 nm) spectral bands that are almost insensitive to atmospheric impact. For the NDII-based delineation process, we used only images with cloudiness less than 10 % based on the CFMask algorithm (Foga et al., 2017). For other purposes (verification, type, and date determination), we visually inspected Landsat images for a lack of clouds over the area of interest (i.e., a windthrow area).
The masking of forested lands was performed on the “before” image with the use of the iterative self-organizing data analysis technique algorithm's (Ball and Hall, 1965) unsupervised classification. Then, the NDII was calculated only within the mask of the forested area. The same technique was successfully applied previously to delineate windthrow areas caused by the 1984 Ivanovo tornado outbreak (Chernokulsky and Shikhov, 2018).
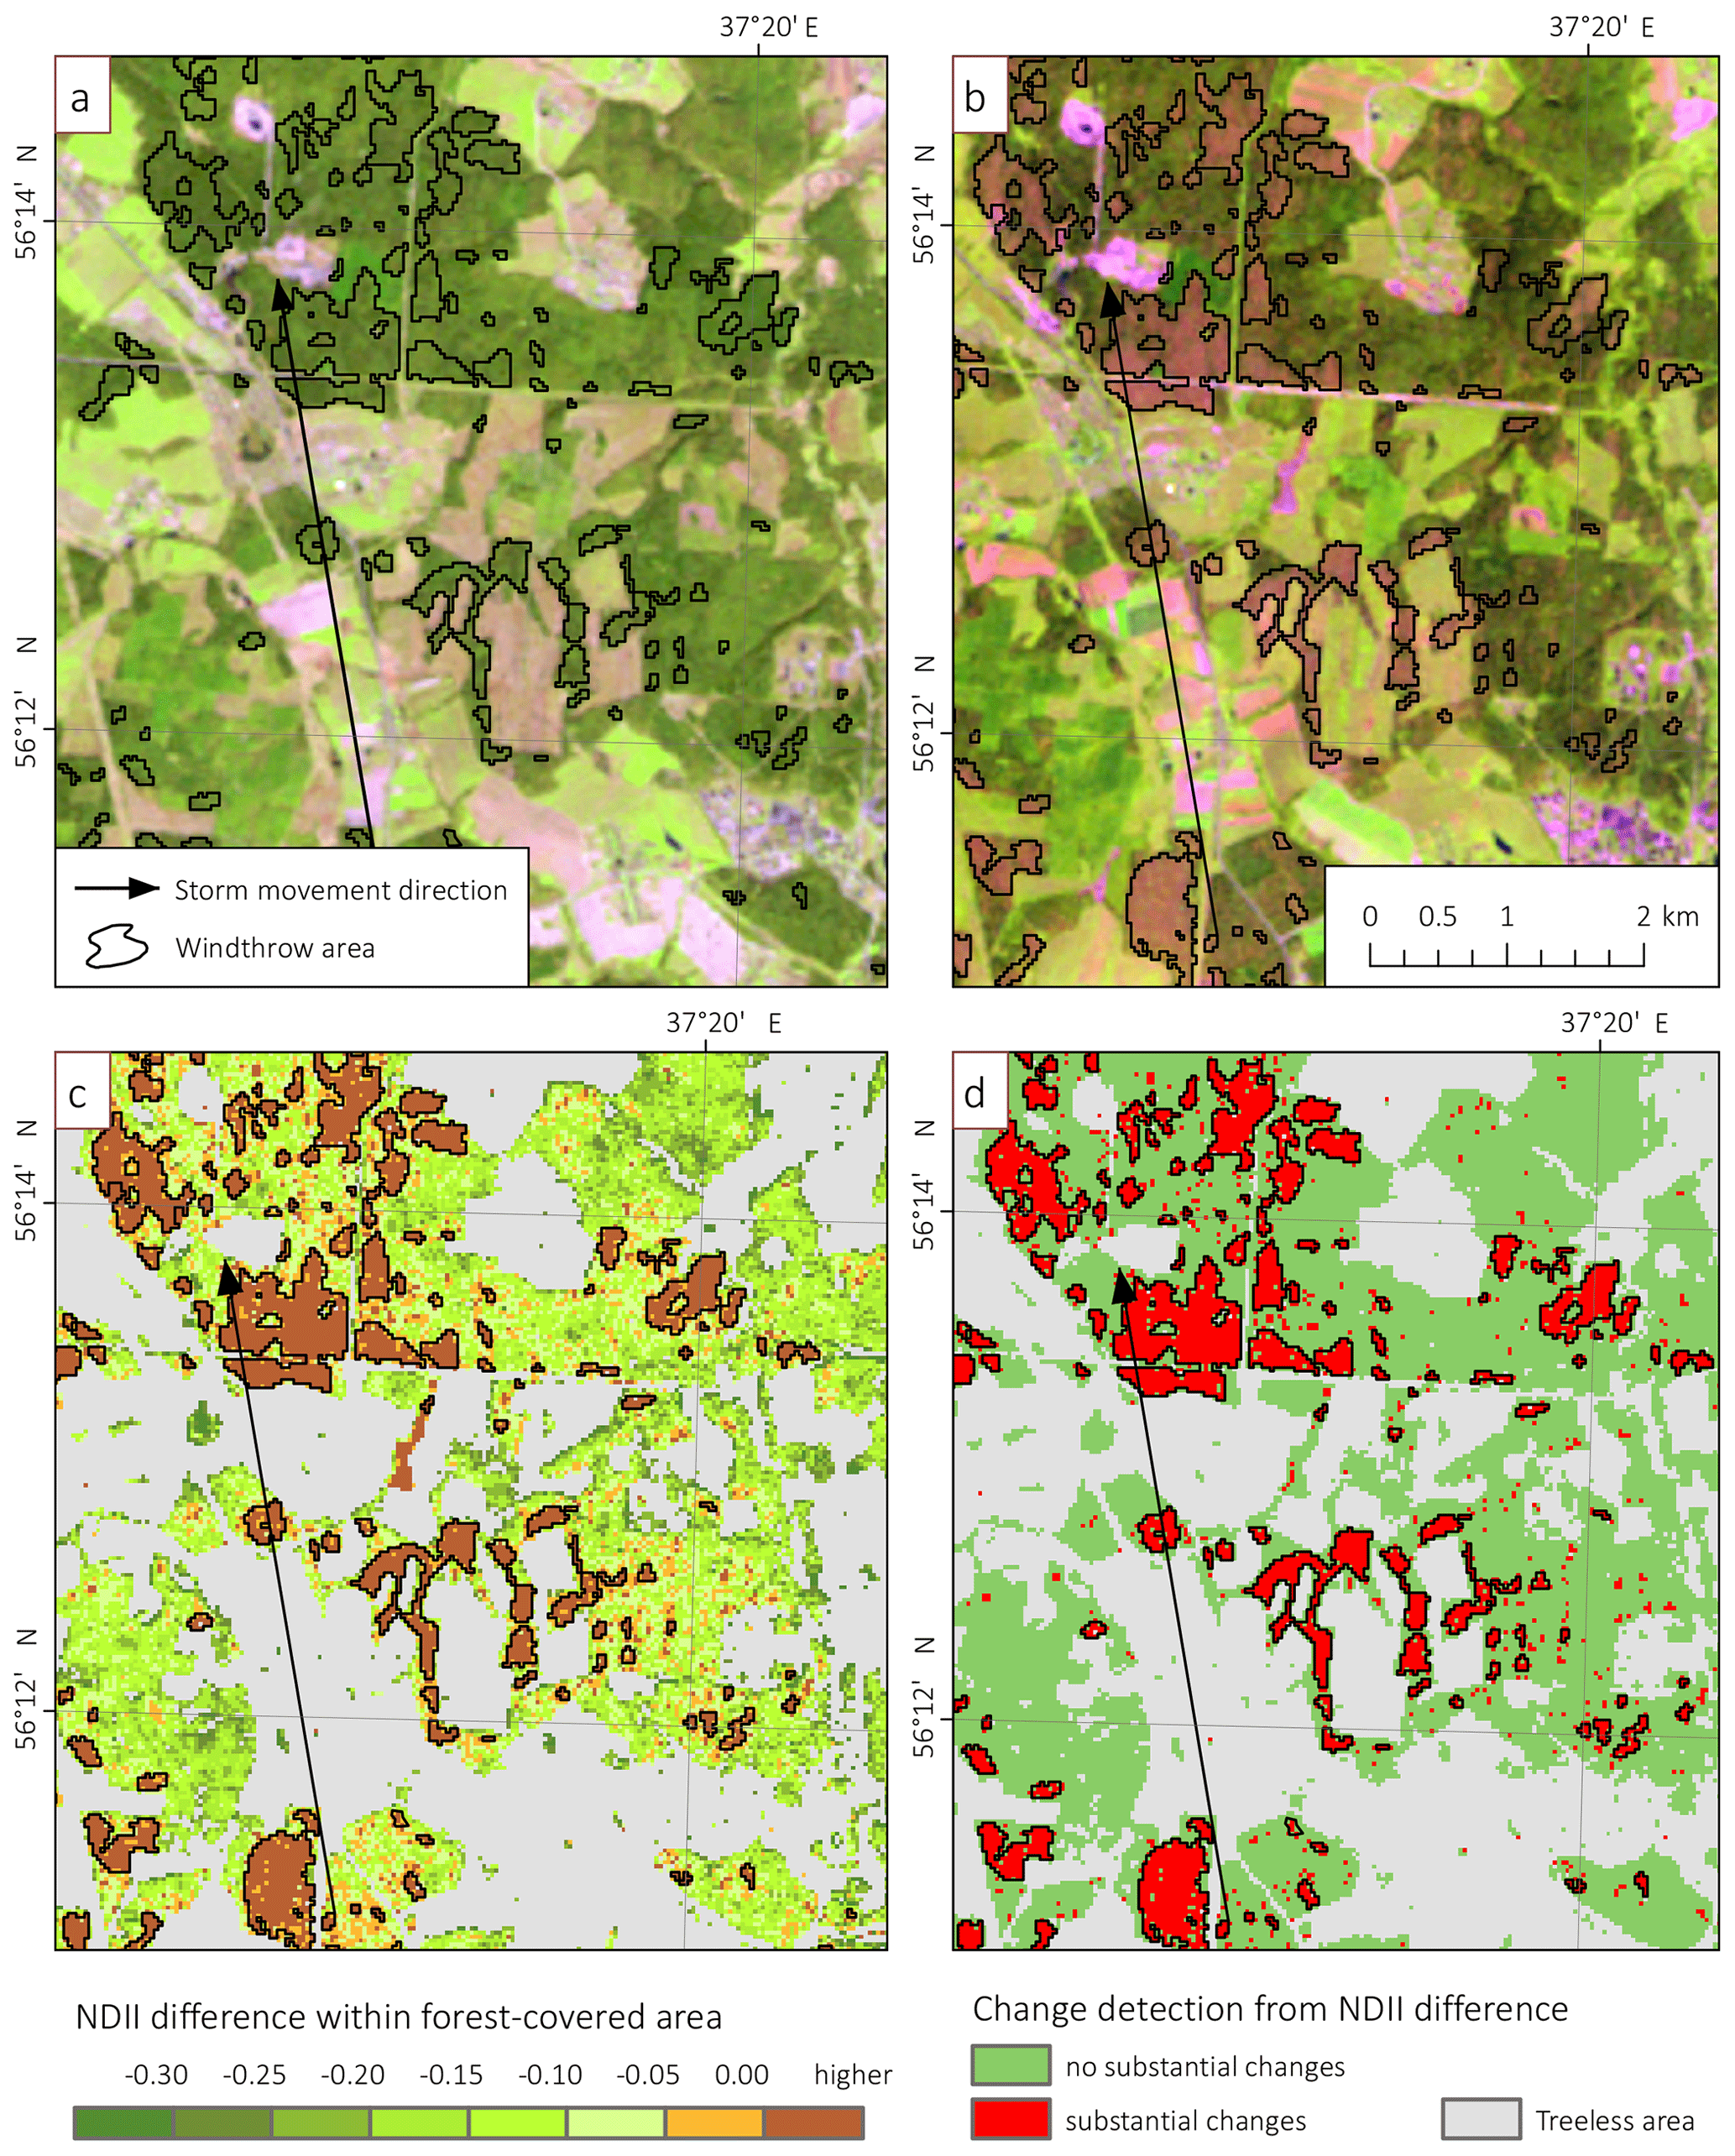
Figure 5Delineation of windthrow caused by the windstorm that occurred on 21 June 1998 in Moscow region based on the NDII difference method: the Landsat-5 images obtained (a) before and (b) after the storm event on 11 May and 30 July 1998, respectively, (c) the NDII difference within forest-covered area, and (d) the areas with the substantial decrease in the NDII.
Windthrow and other forest disturbances are characterized by a sharp decrease in the NDII. However, threshold values of ΔNDII for distinguishing between stand-replacing disturbance and moderately damaged or undamaged forests differ for each pair of images. We estimated threshold value from the statistics of the ΔNDII raster. Firstly, we obtained the mean value and standard deviation of ΔNDII within the entire forest-covered area in the image. Stand-replacing forest disturbance inherently has ΔNDII values substantially higher than the image average. To separate a stand-replacing forest disturbance from other forest-covered areas, we used the threshold value of 2 standard deviations, which was previously tested by Koroleva and Ershov (2012). However, in some cases the ΔNDII distribution within the entire image was skewed (e.g., due to the presence of cloud decks or haze in the post-event image). In such cases, we lowered the threshold value of ΔNDII iteratively by comparing the detected changes with results of visual identification of a windthrow in a post-event image (using several examples located in different parts of a windthrow). As a result, actual threshold values ranged from 1.5 to 2 standard deviations. Then, a binary raster of detected changes (i.e., forest losses) was created (see Fig. 5d) and converted to a shapefile. At the next step, windthrow areas were separated from logged areas and other disturbances (see Sect. 3.2). The EDAs ≤ 1800 m2 were removed. Figure 5 presents the example of the NDII-based identification of the aftermath of the 21 June 1998 Moscow windstorm (Los Angeles Times, 1998).
4.1.4 Combining delineated polygons to windthrow areas and windthrow areas to storm event tracks
In general, a group of closely spaced EDAs caused by one storm event was assigned to one windthrow. By “close distance” we meant in most cases a distance of tens or hundreds of meters between the nearest EDAs. This distance is determined manually by the proportion of stand-replacing damage and the presence of treeless areas. The maximum distance between the nearest EDAs combined as one windthrow area may reach 10 km if a windthrow crossed treeless areas.
Most of the windthrow areas were extracted from the GFC dataset (450), from the EEFCC dataset (153), or with NDII-based methods (7). These windthrow areas were first automatically delineated as multi-part polygons, and then we specified the exact contours of their components – single-part polygons (EDAs). After that, we correctly merged them to a windthrow itself (Fig. 2). We delineated other 90 windthrow areas manually using the Landsat images, Sentinel-2 images, or HRIs – 30, 17, and 43 windthrow areas, respectively. In this case, we first delineated EDAs and then merged them into a windthrow.
Many storms induced a series of successive windthrow areas, which are separated from each other by tens or even hundreds of kilometers of undamaged forests, treeless areas, or water bodies (Fig. 3). In general, we divided the damaged areas into two separate windthrows (two records in the dataset) if the gap between them exceeded 10 km. This threshold is based on the study of Doswell and Burgess (1988), who proposed the 5–10 miles (8–16 km) threshold for the gap to discriminate between one skipping tornado and two successive tornadoes. A few exceptions were associated with changes in windthrow direction, with transformations of one windthrow type to another identified by the HRIs, i.e., tornado-induced to non-tornado-induced, and with an abrupt change in forest damage degree – from 60 %–80 % to 5 %–10 % of stand-replacing disturbances. In these cases, the distance between two distinct windthrow areas was less; for instance, the minimum distance was about 1 km when a tornado-induced windthrow transformed to a squall-induced one.
If several close windthrow areas have a similar direction, differ by no more than 30∘, and have the same date (or date range) of occurrence, we assigned them to one storm event. We highlight successive and parallel windthrow areas (Fig. 3). Successive windthrow areas induced by one storm event follow downwind one after another and approximately fall on one straight line (the angle of deviation from this line does not exceed 10–20∘). Such windthrows are presumably induced by one convective cell generating a sequence of squalls or tornadoes. In contrast, parallel windthrow areas that are located within one storm event are situated parallel to each other (with an angle less than 30∘). They are presumably associated with two or more different convective cells or mesocyclones generating squalls or tornadoes often embedded into one mesoscale convective system.
The expert-based process of windthrow areas combining to a storm event was based as well on various additional information including the storm dates and types (see next sections), information from weather station reports, eyewitness and newspaper reports, data from meteorological satellites, and so on. In total, the dataset of storm event tracks contains 486 items.
4.2 Verification of windthrow events and determination of their type
We verified each windthrow area in the database using pre- and post-event Landsat/Sentinel-2 images, high-resolution images, and additional information. This verification was performed to ensure that the forest disturbance was caused by wind and to determine the type of storm that caused the windthrow. In total, we verified 54 % of windthrow areas with the HRIs mainly for the 2001–2015 period. Other events were verified using the Landsat images (22 % of windthrow), the Sentinel-2 images (9 %), and additional data sources like weather station and eyewitness reports (15 %). As a result, the probability that any forest disturbance was mistakenly referred to as a windthrow is minimal.
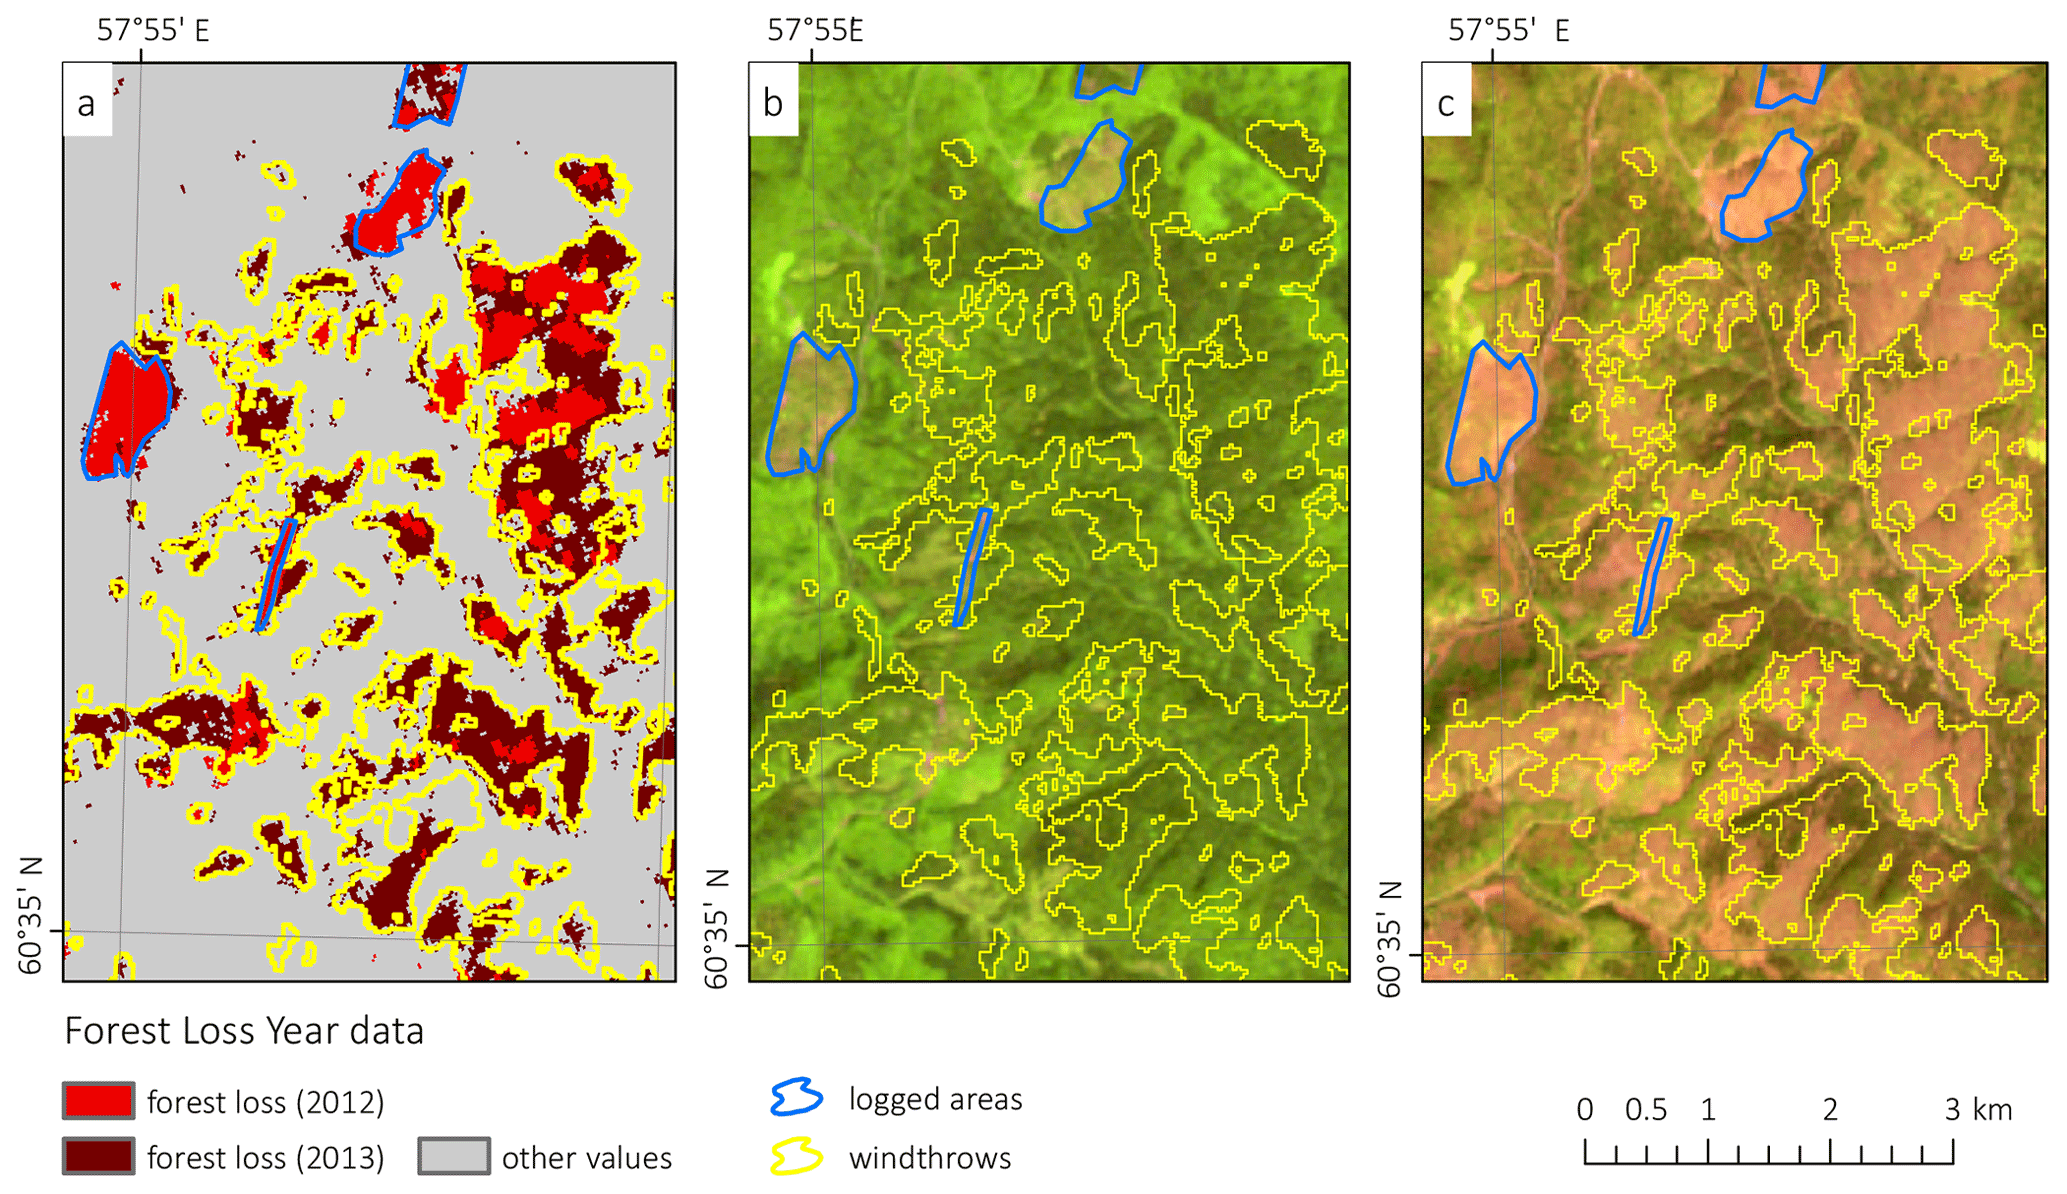
Figure 6Separation of the windthrow occurring on 18 July 2012 from logged areas based on (a) the GFC data on forest losses and the Landsat images obtained (b) before (i.e., 8 July 2012) and (c) after (i.e., 18 August 2012) the storm event.
In addition, we used the last cloud-free Landsat or Sentinel-2 image obtained before a storm and the first image obtained after it to separate windthrow areas from other disturbances, mainly from logged areas. We removed forest disturbances that were not related to a storm event (Fig. 6). During the verification, we also found and delineated several storm-damaged areas that were missed in the GFC/EEFCC data. Such areas are located mainly in small-leaved or broadleaved forests. After the verification, we determined the type of windthrow depending on the weather phenomenon inducing this windthrow. We selected tornado-induced and non-tornado-induced windthrow areas; the latter were subdivided into those induced by convective and those by non-convective storms. In turn, non-convective storms include also snowstorms, which are indicated in the database but not analyzed separately further in the paper. By convective storms we mean squalls and downbursts; however, this more detailed division is lacking in the database.
To distinguish tornado-induced windthrow areas from other wind-related disturbances, we determined the direction of fallen trees using the HRIs. Indeed, the main signature of tornado-induced windthrow is the counterclockwise, or infrequently clockwise, rotation of the fallen trees (Beck and Dotzek, 2010; Shikhov and Chernokulsky, 2018). With the lack of HRIs, we considered three additional signatures of a tornado-induced windthrow, namely (1) a quasi-linear structure of a windthrow with a ratio of length and width ≥ 10 : 1, (2) a gradual turn of a storm track, and (3) a predominant total removal of forest stands (Shikhov and Chernokulsky, 2018; Shikhov et al., 2019b). Note that the ratio of length and width of a tornado track ≥ 10 : 1 is also typical for the United States (Schaefer and Edwards, 1999). Based on these three signatures and additional information from weather station reports, witness reports, photos, and videos, we assigned the high or medium degree of certainty of storm type determination for each windthrow (Table 4).
Table 4The signatures used to assess the degree of certainty of windthrow type determination.

Windthrow areas, caused by non-convective windstorms or snowstorms, have specific geometrical features as well that are seen in satellite images. Specifically, windthrow areas related to non-convective windstorms typically have a damage track with an enormous length and width, up to 200 and 45 km, respectively, with, however, a slight or moderate degree of forest damage. Stand-replacing disturbances caused by non-convective windstorms usually occur in dark coniferous forests only (Dobbertin, 2002; Schmoeckel and Kottmeier, 2008). Since non-convective storms affect large areas and last for relatively long period, they are typically well-reported by weather stations, which simplify the attribution of related windthrow. In its turn, snowstorm-induced windthrow areas are distinguishable from other disturbances primarily based on the dates of occurrence: they happen usually in autumn; although – one severe snowstorm occurred in early summer. It is of note that we found none of the snowstorm-induced stand-replacing windthrows happening in winter.
After determining a storm event type, we excluded from the database tornado-induced windthrows with an area ≤ 0.05 km2 and other windthrows with an area ≤ 0.25 km2. We took into account the following reasons during the exclusion of such small-scale windthrow areas:
-
the difficulty to prove that these disturbances were actually caused by wind, especially with the lack of HRIs;
-
the difficulty to determine storm event dates with the Landsat images for these windthrow areas;
-
the high uncertainty of estimated geometrical characteristics of small-scale windthrows (Koroleva and Ershov, 2012; Shikhov and Chernokulsky, 2018).
Only five squall-induced windthrows with an area < 0.25 km2 were stored in the database since they are associated with severe weather outbreaks with proven dates. It is of note that a typical tornado-induced windthrow consists of a relatively small number of EDAs with a total removal of forest stands that are well-detected by the Landsat images. In its turn, a typical, non-tornado-induced windthrow includes a larger number of small-scale (i.e., 2–4 Landsat pixels) areas of stand-replacing disturbances that are poorly detected by satellite images. This difference results in the necessity of using two distinct thresholds for tornado- and non-tornado-induced windthrow areas.
The threshold values used in Sect. 4.1–4.2 have some subjectivity, and their modification may substantially change the number of allocated windthrow areas in the dataset. The optimization of the above-described threshold values can be evaluated in further studies that should involve ground-based data.
4.3 Estimation of geometrical parameters of windthrow areas and storm tracks and its accuracy
We used the Landsat data and the Landsat-based products GFC and EEFCC to estimate geometrical parameters of windthrow areas. We determined the path length (L), mean and maximum widths (Wmean and Wmax), and damaged area (A) for each windthrow using the technique that had been successfully implemented for tornado-induced windthrow areas (Shikhov and Chernokulsky, 2018). The calculation of these parameters was performed in the Lambert equal area and equidistant projection for North Asia to avoid possible projection-related distortions.
We calculated A in the ArcGIS 10.4 as the sum of the area of forest damaged plots which are attributed to one windthrow. We determined L as a length of the central line drawn through a damaged area, i.e., the distance between the two farthest points of a windthrow. The central line was created automatically (using a Python tool) as the distance between the two farthest points of a windthrow. It is insensitive to the allocation of patches to windthrow area.
We calculated Wmean as the mean length of several transects that are perpendicular to a storm track with a 200 m step; this step had been found optimal in terms of quality and counting efficiency (Shikhov and Chernokulsky, 2018). Only stand-replacing windthrow areas were taken into account in this calculation. In comparison to Shikhov and Chernokulsky (2018), in which Wmax was calculated manually using the HRI data, in this study, we assigned the length of the largest transect to Wmax because of the lack of HRIs for many windthrow areas.
In addition to windthrow characteristics, we estimated geometric characteristics of EDAs and those of storm tracks. In particular for EDAs, we calculated their area AEDA. For storm tracks, we estimated maximum and mean width (WTRmean and WTRmax), path length (LTR), and damaged area (ATR). We calculated WTRmean based on the same transects that were used to calculate Wmean but without excluding undamaged forests and treeless areas. Similarly, the length of the largest transect that includes undamaged forests and treeless areas was assigned to WTRmax (Fig. 7). If a track consists of two (or more) parallel windthrow areas, then its width was calculated within the outermost boundaries of these windthrow areas (Fig. 3). The same calculation was performed for LTR in the case of two (or more) subsequent windthrow areas (Fig. 3). Thus, the 10 km threshold used (see Sect. 4.1.4) may influence geometrical characteristics of a single windthrow area but do not affect those of a storm event.
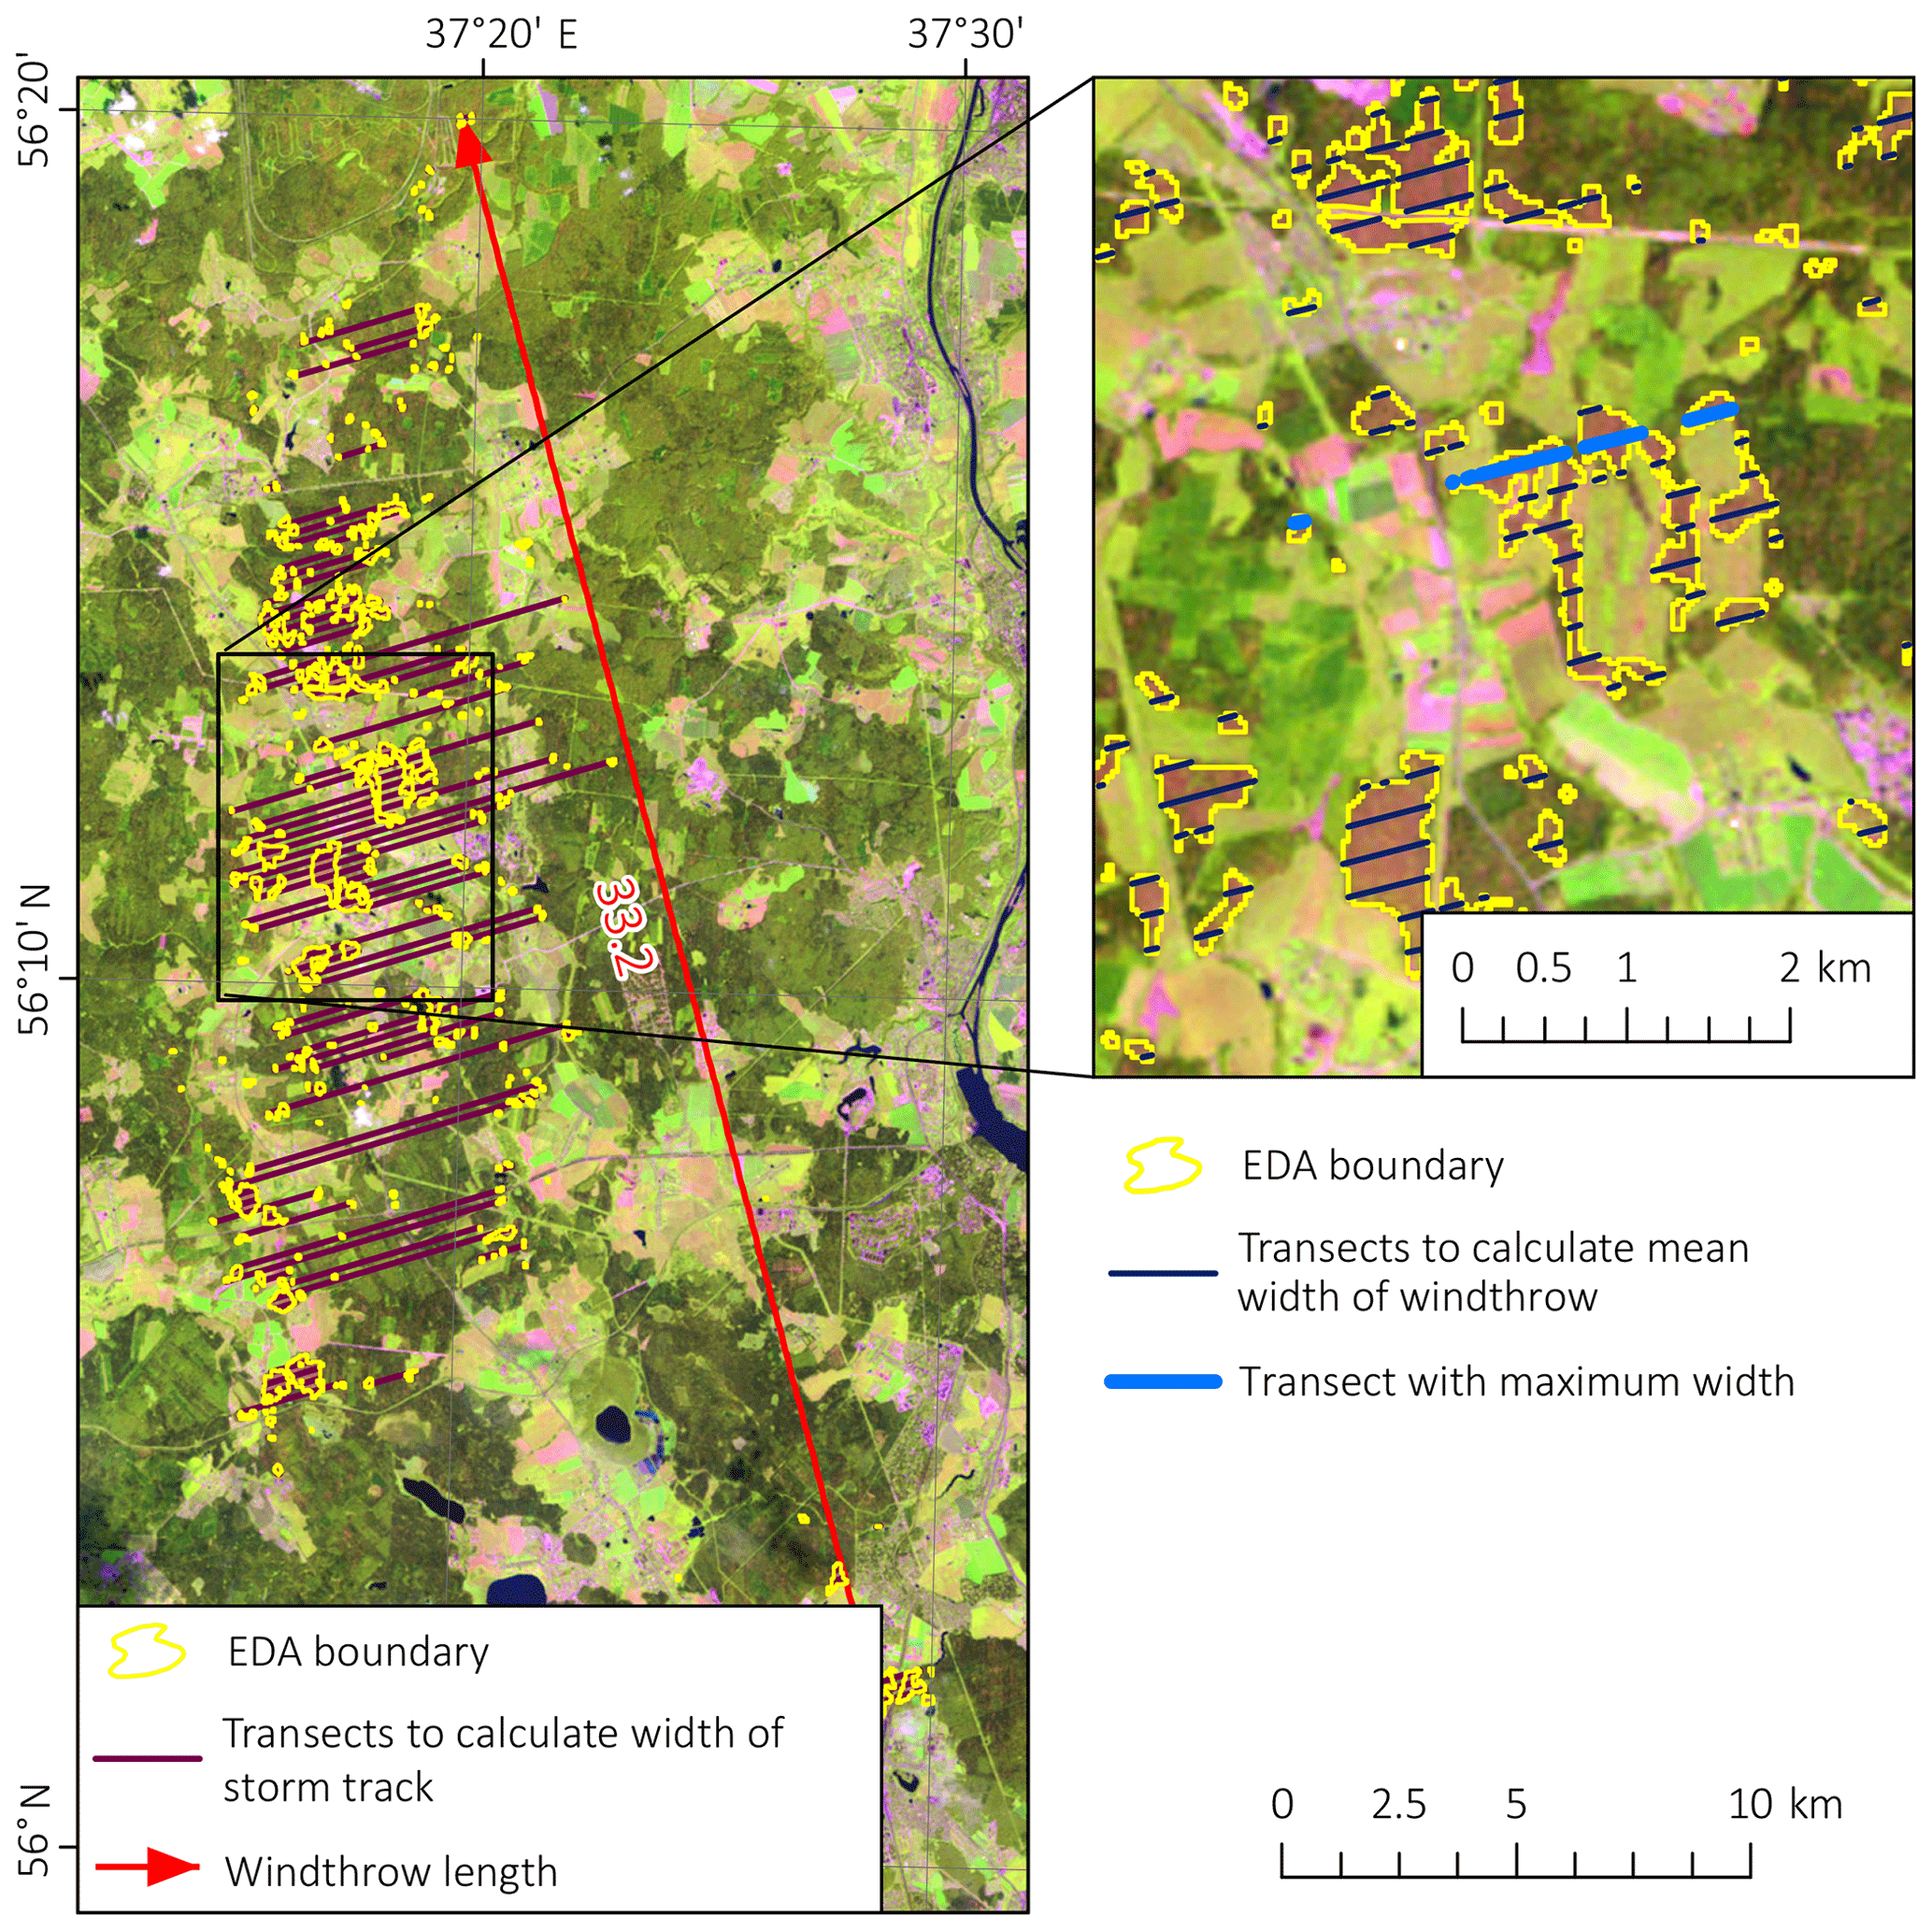
Figure 7A scheme for the determination of the geometrical parameters of a windthrow based on the Landsat image using the example of the windthrow in the Moscow region occurring on 21 June 1998.

Figure 8Overlapping of windthrow areas extracted from the GFC dataset and delineated manually using the HRIs for (a) a convective-storm-induced windthrow (18 July 2012) and (b) a tornado-induced windthrow (June 2011).
Table 5Comparison of windthrow geometrical parameters estimated using the GFC and HRI data.
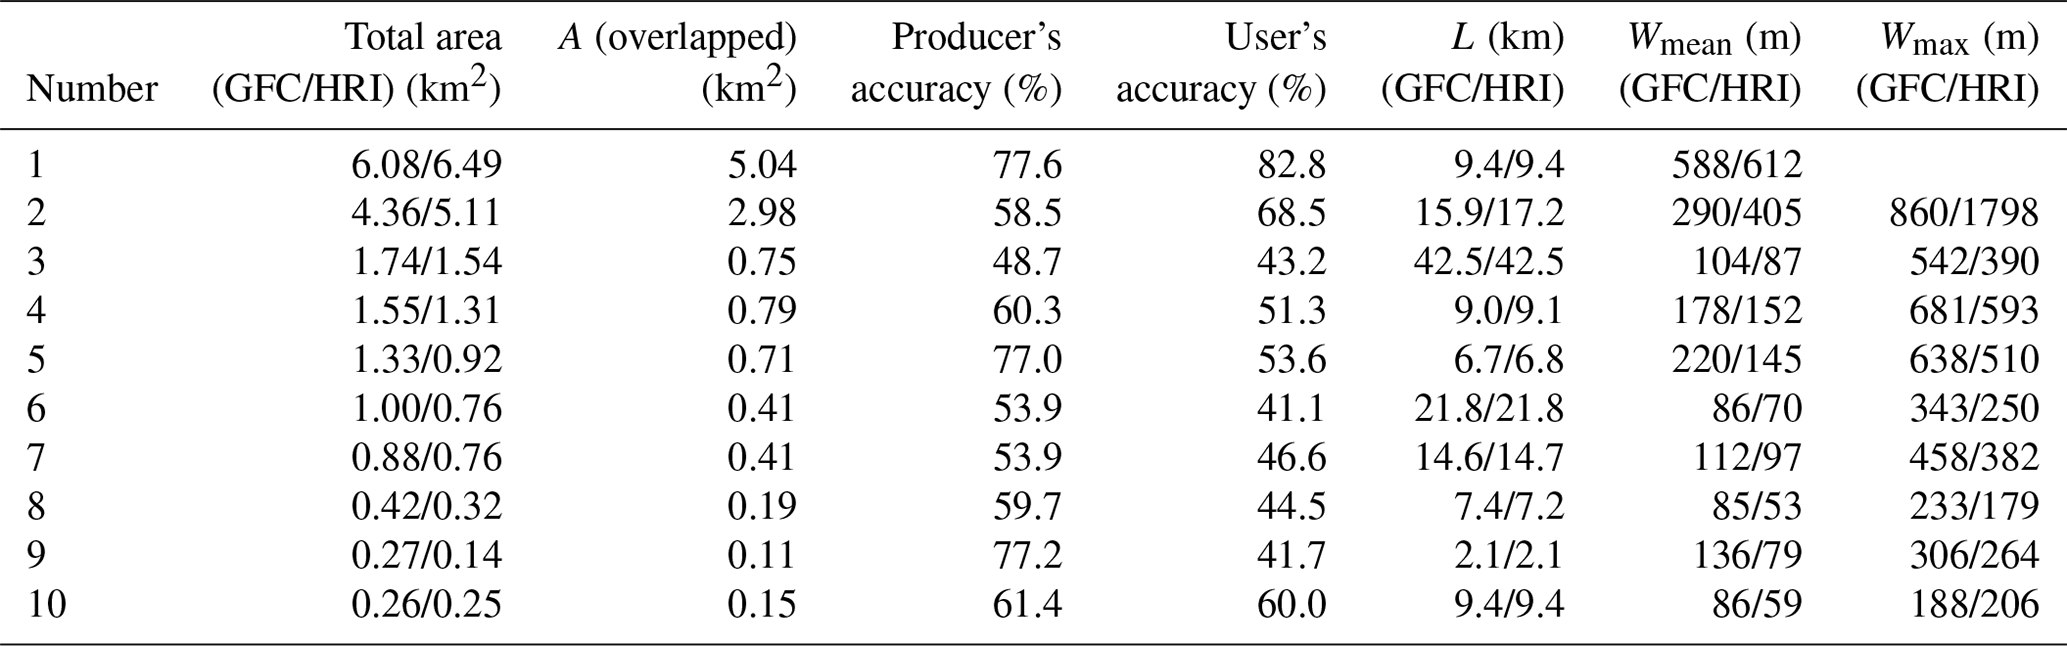
We assessed the accuracy of GFC-based estimates of windthrow geometrical parameters by comparing them with the same parameters calculated manually with the use of HRIs. We performed just such a procedure for 10 windthrow areas caused by squalls, whose areas range from 0.26 to 6.09 km2 (Table 5). The distribution of their A is close to the one for the full dataset.
We delineated manually all EDAs within these 10 windthrow areas using the HRIs. In total, we found 837 and 947 EDAs according to the GFC and the HRI data, respectively. Owing to the relatively correct georeference of the Landsat data (USGS, 2019), we found no systematic spatial bias between contours of GFC-based and HRI-based windthrow areas. Despite their general matching, there is no complete overlap due to the different spatial resolutions of the GFS and HRIs (Fig. 8). For example, one GFC-based EDA may intersect with several HRI-based ones, and vice versa. We found that only 66.5 % of the total area is attributed to windthrow in both GFC and HRIs, while EDAs with a small area can be missed. In particular, 263 HRI-based EDAs with the total area of 0.97 km2 were completely missed in the GFC, while 146 GFC-based EDAs with the total area of 0.52 km2 were missed in the HRIs. For overlapped EDAs, we found that the mean absolute error and root mean square error of AEDA estimates amounted to 27.6 % and 13.1 %, respectively. We found that the relative error decreases for large EDAs and for those having a simple shape, i.e., quasi-circular. The user's and producer's accuracies increase from 20 %–25 % for EDAs with AEDA<0.01 km2 to 70 %–75 % for EDAs with AEDA>0.1 km2. In general, for the overlapped EDAs, the GFC overestimates their AEDA (by 4 % on average) primarily in coniferous forests. The mutual effect of more frequent omissions of small EDAs in the GFC compared to the HRIs and overestimation of overlapped EDAs results in the approximate equality in the total area of delineated windthrows, 17.11 and 17.13 km2, based on the GFC and HRIs, respectively.
Table 6Comparison of windthrow geometrical parameters estimated using the EEFCC and HRI data.

For the entire windthrow area, we calculated the accuracy of their geometrical characteristic estimates as well. In particular, we calculated the user's and producer's accuracies of the GFC-based delineation for each of 10 selected windthrows. These accuracies are mainly determined by the complexity of windthrow shapes and composition. In particular, the accuracy is higher for a windthrow consisting of a relatively small number of simple-shape EDAs. Otherwise, the accuracy decreases down to 50 % for a windthrow having very amorphous spatial structure. In our sample, the GFC data tends to overestimate the area of a windthrow – 8 cases out of 10 were overestimated. The mean absolute percent error (MAPE) for A is 14.6 %. The major overestimation of A by the GFC data, as well as Wmean and Wmax, was revealed for relatively small windthrow areas. This is in line with the previous findings by Koroleva and Ershov (2012). They showed that the reliable estimate (with 15 % accuracy) of the damaged area using the Landsat images is possible only for windthrow areas exceeding 0.026 km2. It is of note that for tornado-induced windthrow areas, Shikhov and Chernokulsky (2018) found that the GFC data generally tend to underestimate A, with MAPE amounting for 17.9 %.
The assessment of geometrical parameters of windthrow areas appearing before 2000 and being found by the EEFCC is challenging due to the low availability of the HRIs or other independent data sources, e.g., the data of forestry services. Windthrow areas induced by storm events that occurred > 20 years ago can be delineated by the HRIs only if a storm passed through old-growth forests that have not been affected by other disturbances, i.e., timber harvesting or wildfires, in subsequent years. Such forests are widespread only in the northeastern part of ER (Pakhuchiy, 1997). We found five EEFCC-based windthrows occurring between 1998 and 2000 that were most well-detected by the HRIs: four tornado-induced and one storm–induced windthrow. We delineated them with the EEFCC and HRI and compared their characteristics (Table 6). We found a general overestimation of A, Wmean, and Wmax in the EEFCC that was larger than in the GFC. It may be related to the inclusion into a windthrow of not only the real wind-damaged area but also the surrounding pixels where trees died after a storm event mostly because of bark beetles (Köster et al., 2009). The intensity of this mortality is highest during the second year after a storm event (Köster et al., 2009).
4.4 Determination of windthrow dates
We aimed to establish the exact date or even the exact time for each windthrow appearance. However, due to data constraints, dates of some windthrow events were determined with 6 months accuracy. We iteratively refined a date, or a date range, by using different data. The process, related to the determination of the date of a tornado-induced windthrow only, was described previously in Shikhov and Chernokulsky (2018).
First, the year of a windthrow can be obtained directly from the Landsat products but with some limitations. In the GFC, forest disturbances are accompanied by information on the year of the event's occurrence. However, the exact year is determined correctly only for 75.2 % of forest loss pixels; for 24.8 % of them, the date can be either 1–2 years earlier or later (Hansen et al., 2013). In the EEFCC, a year of windthrow occurrence is not explicitly determined and came within the ranges of 1986–1988 and 1989–2000.
Next, we refined a range of dates based on all available images from the Landsat and Sentinel-2 satellites. The accuracy of such refinements depends on the frequency of observations and cloudiness. The availability of cloudless Landsat images varied from year to year. The lowest number of cloud-free images (2–4 images a year on average) is available for 2003–2006 and 2012, when only Landsat-7 data after scan line corrector failure are available (Potapov et al., 2015). Hence, the worse accuracy of windthrow date determination is typical for these years. On average, 8–10 images per year can be used for windthrow date determination. Due to the launch of the Sentinel-2A satellite, the number of images per year had an abrupt increase after the summer of 2016. We used images taken throughout the year. Despite the frequency of cloudless images in autumn and winter being lower than in the summer season, it was sufficient for analysis. Thus, wintertime images (of land covered with snow) were successfully used for windthrow identification, especially if a storm occurred at the end of the summer season, and the autumn season lacked cloud-free images.
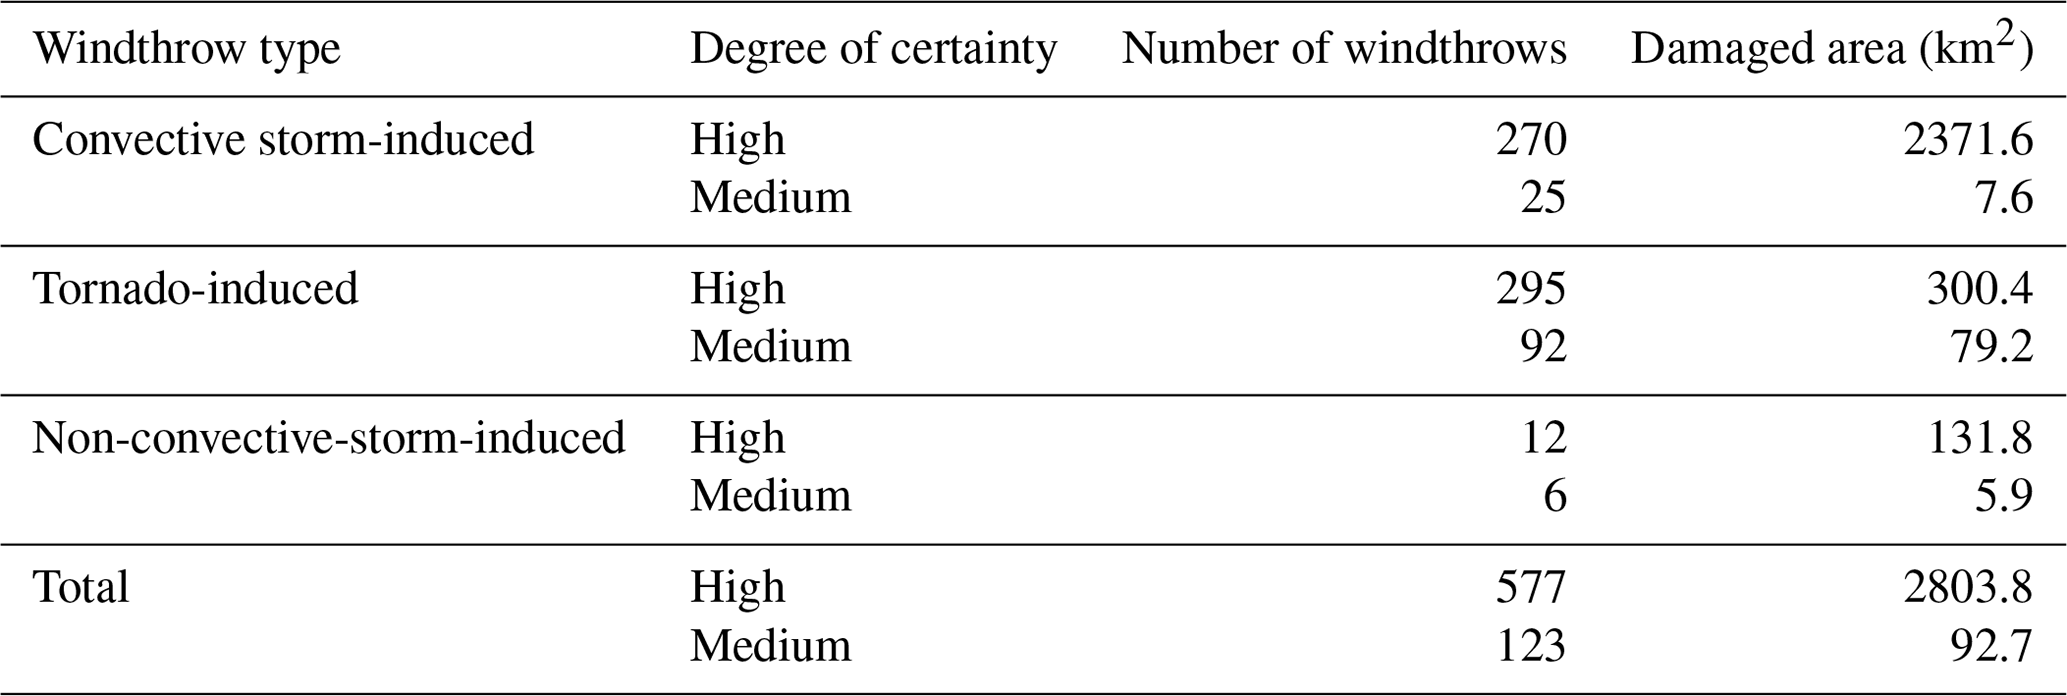
Table 7Total number of windthrow events of different types and corresponding damaged forested areas.
Further, given the satellite-derived range of possible event dates, we made the subsequent analysis using additional data, such as weather station observations, various databases and reviews on hazardous weather events, damage reports, photos and videos in the media and social networks, and reanalysis data (see Shikhov and Chernokulsky, 2018, for details). This analysis allowed us to establish the exact dates for 48.4 % of all windthrow events, including 39.2 % and 59.7 % of tornado- and non-tornado-induced windthrow events, respectively.
The dates of storm-induced windthrow events were defined more successfully than those for tornado-induced ones due to the local nature of convective storms, especially of tornadoes, and the relatively large distance between Russian weather stations. Specifically, the average and median distance between the nearest weather stations within the study area amounted to 53.7 and 49.9 km, respectively. Consequently, many storm events were reported by weather stations located on a storm path at a distance of 50–100 km from a windthrow, while the closest stations did not report strong wind gusts since they were away from the storm path. In total, we matched storm reports of weather stations, namely reports with wind gusts ranging from 15 to 34 m s−1, with only 34.5 % of windthrow events with known dates.
Another reason for the more successful determination of dates of appearance for large-scale windthrow areas than for small-scale ones, e.g., tornado-induced, is an increase in the probability that a corresponding storm passes through a settlement(s) and is covered in the media. In total, we used media reports, information from regional weather services, witness photos and videos, and existing scientific literature (e.g., Dmitrieva and Peskov, 2013; Petukhov and Nemchinova, 2014; Shikhov and Chernokulsky, 2018; Shikhov et al., 2019a) to specify the date and time of 29.7 % of windthrow events.
Dates and times of some cases (7.8 % of all cases) were established using images from the meteorological satellites Terra/Aqua MODIS and METEOSAT-8 and Russian weather radar data (Dyaduchenko et al., 2014). However, the routine usage of these data is time-consuming and limited due to some access restrictions. The subsequent clarification of the exact time of windthrows can be carried out in further studies.
5.1 Windthrow type
The compiled database includes three shapefiles (.shp) corresponding to three hierarchical levels such as elementary damaged areas, windthrow, and storm events. The database includes 102 747, 700, and 486 objects for each level, respectively. The total area of the spatial features is equal to 2966.1 km2. It is of note that we cannot determine whether the trees were felled or broken by the wind based on satellite images that even have very high resolution. Therefore, we use the single term “windthrow” for all types of wind-induced forest damage.
The overwhelming majority of stand-replacing windthrows found in ER, namely 97.4 % of the events and 95.3 % of wind-damaged area, are associated with convective storms and tornadoes (Table 7). More than half of all windthrow events are tornado-induced with, however, a relatively small damaged area (less than 13 % of the total wind-damaged area). Non-convective storms and snowstorms are responsible for less than 5 % of the area of stand-replacing windthrow in ER. This is somewhat in contrast to Western and Central Europe where most forest damage is induced by non-convective wind events, namely winter storms, caused by strong extratropical cyclones (Gardiner et al., 2010; Gregow et al., 2017). Indeed, winter windstorms affect Eastern Europe less compared to Western and Central Europe (Haylock, 2011).
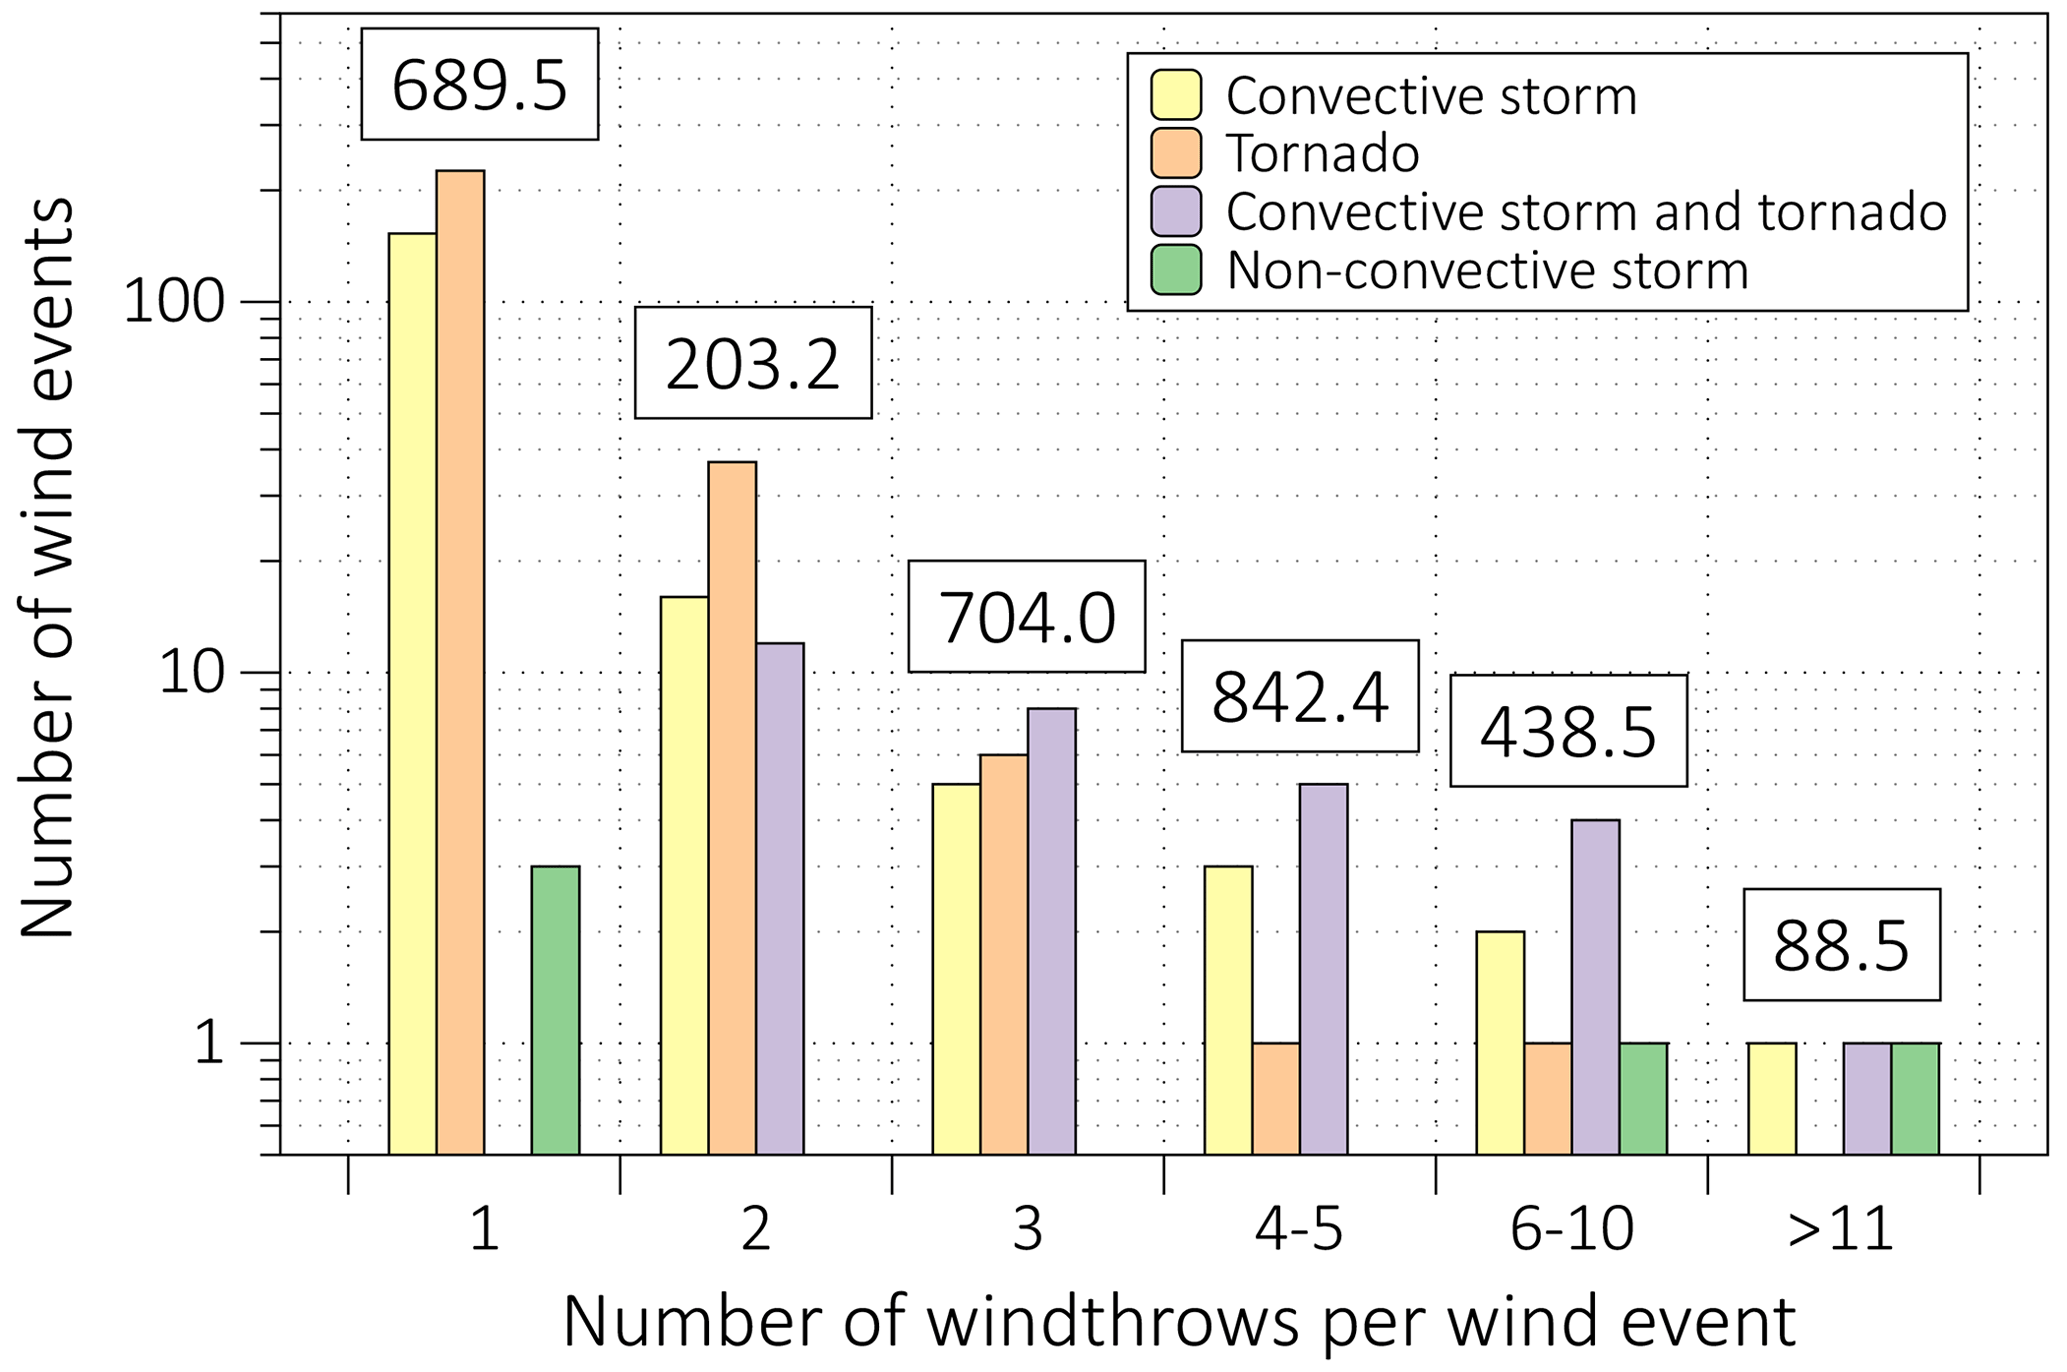
Figure 9Number of windthrows per one storm event. The total damaged area (in km2) corresponding to all types of windthrows is shown in the box for each category.
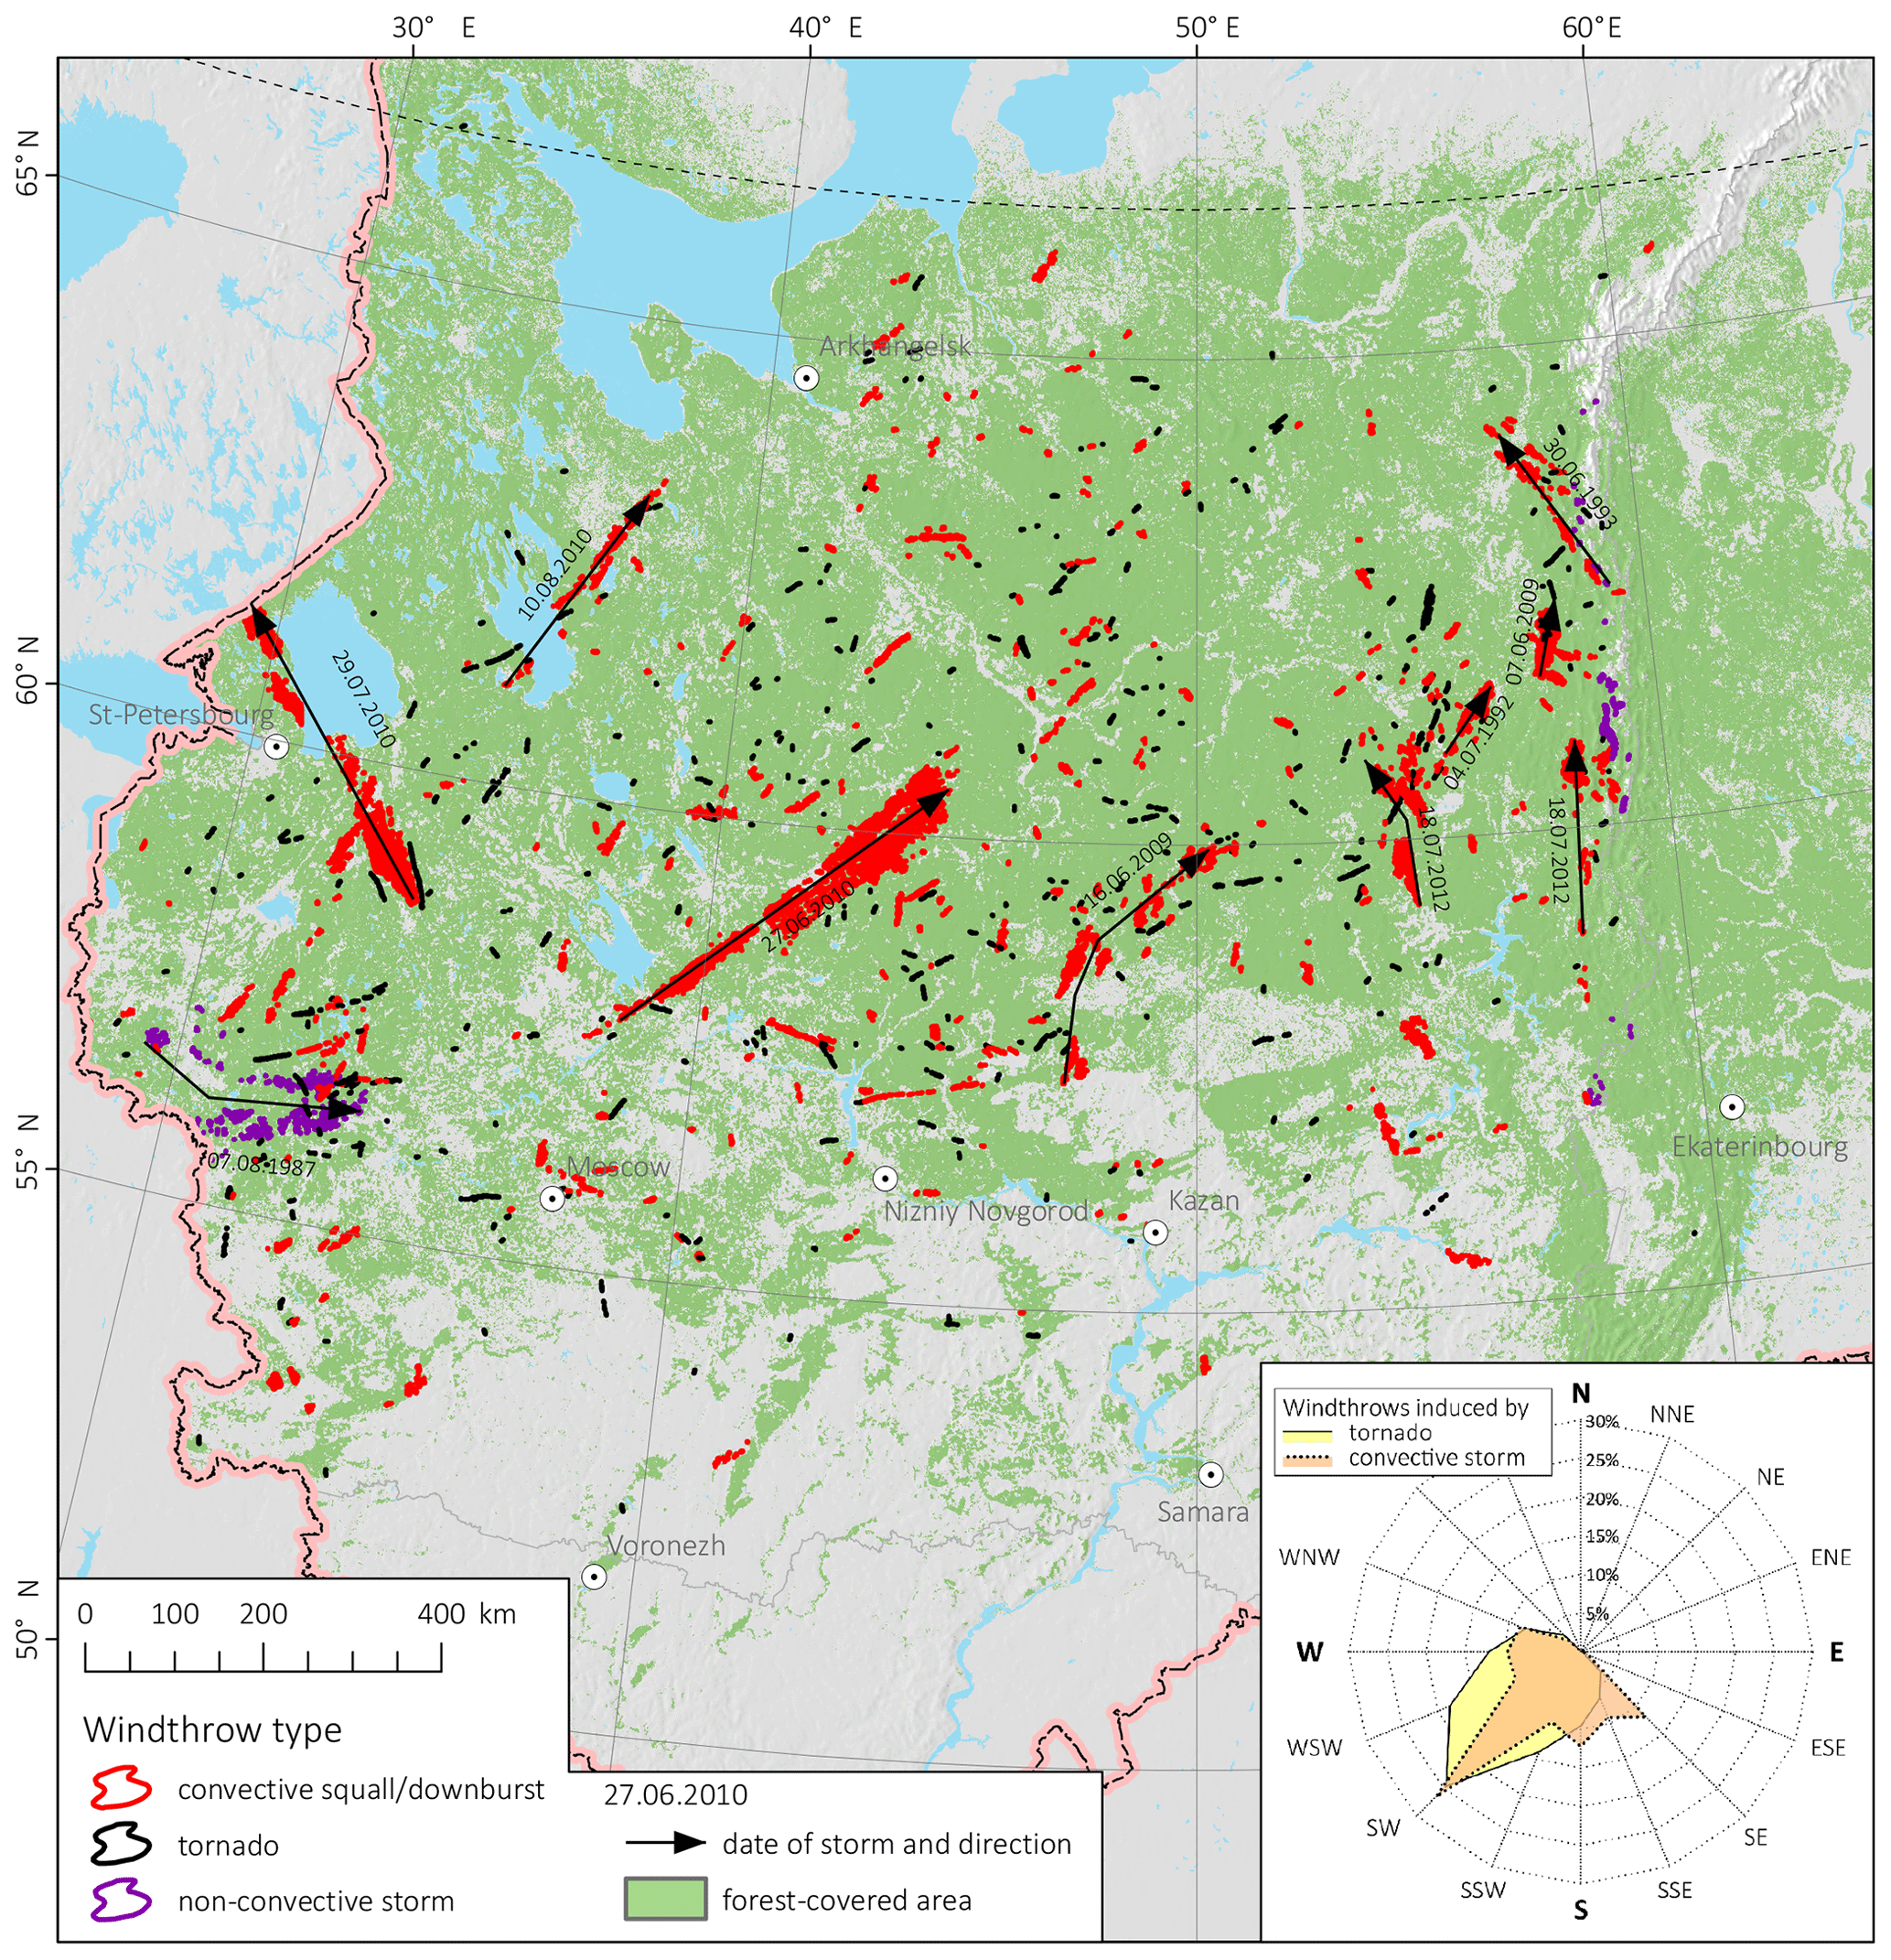
Figure 10Spatial distribution of stand-replacing windthrows in ER in 1986–2017. The 10 most catastrophic windthrows with the largest damaged area are shown by arrows and indicated by the corresponding dates of the windthrow. Forest-covered area is estimated according to the data from Bartalev et al. (2016). The inset shows the direction from which the windthrow originated.
Among 486 storm events that caused windthrow, 381 yielded only one windthrow area (Fig. 9), primarily tornado-induced. The rest of the 105 storms resulted in a smaller number of windthrow events (319) but larger damaged area – 2276.6 km2, namely 76.8 % of all damaged area. Most of these storms induced two or three successive or parallely located windthrow areas, and only 14 storms caused 5 or more windthrow events. We found a maximum of 17 separate windthrow areas that related to one storm. We found 71 storm events resulting in two or more successive windthrow areas, while 12 storm events led to the formation of two or more parallel windthrow areas, and 22 storm events include a family of both parallel and successive ones (Fig. 3). The maximum distances between the two nearest successive and two parallel windthrow areas amount to 150 and 26 km, respectively.
It should be noted that a single storm may cause both tornado- and non-tornado-induced windthrow, e.g., a supercell can lead to the formation of a tornado and a rear-flank downdraft (Karstens et al., 2013), both causing forest damage. In total, we found 30 storms that resulted in the formation of two types of windthrow.
We managed to match several storm events with storm reports at weather stations; in particular, the database contains 89 such cases. Among these 89 station reports, we found eight reports with wind gusts ≥ 30 m s−1, 14 reports with wind gusts 25–29 m s−1, and 30 reports with wind gusts 20–24 m s−1. This information has been included in the database and can be used in further studies to estimate the critical wind speed causing windthrow and to analyze the role of other accompanying weather phenomena, e.g., with snow, heavy rainfall, large hail, etc.
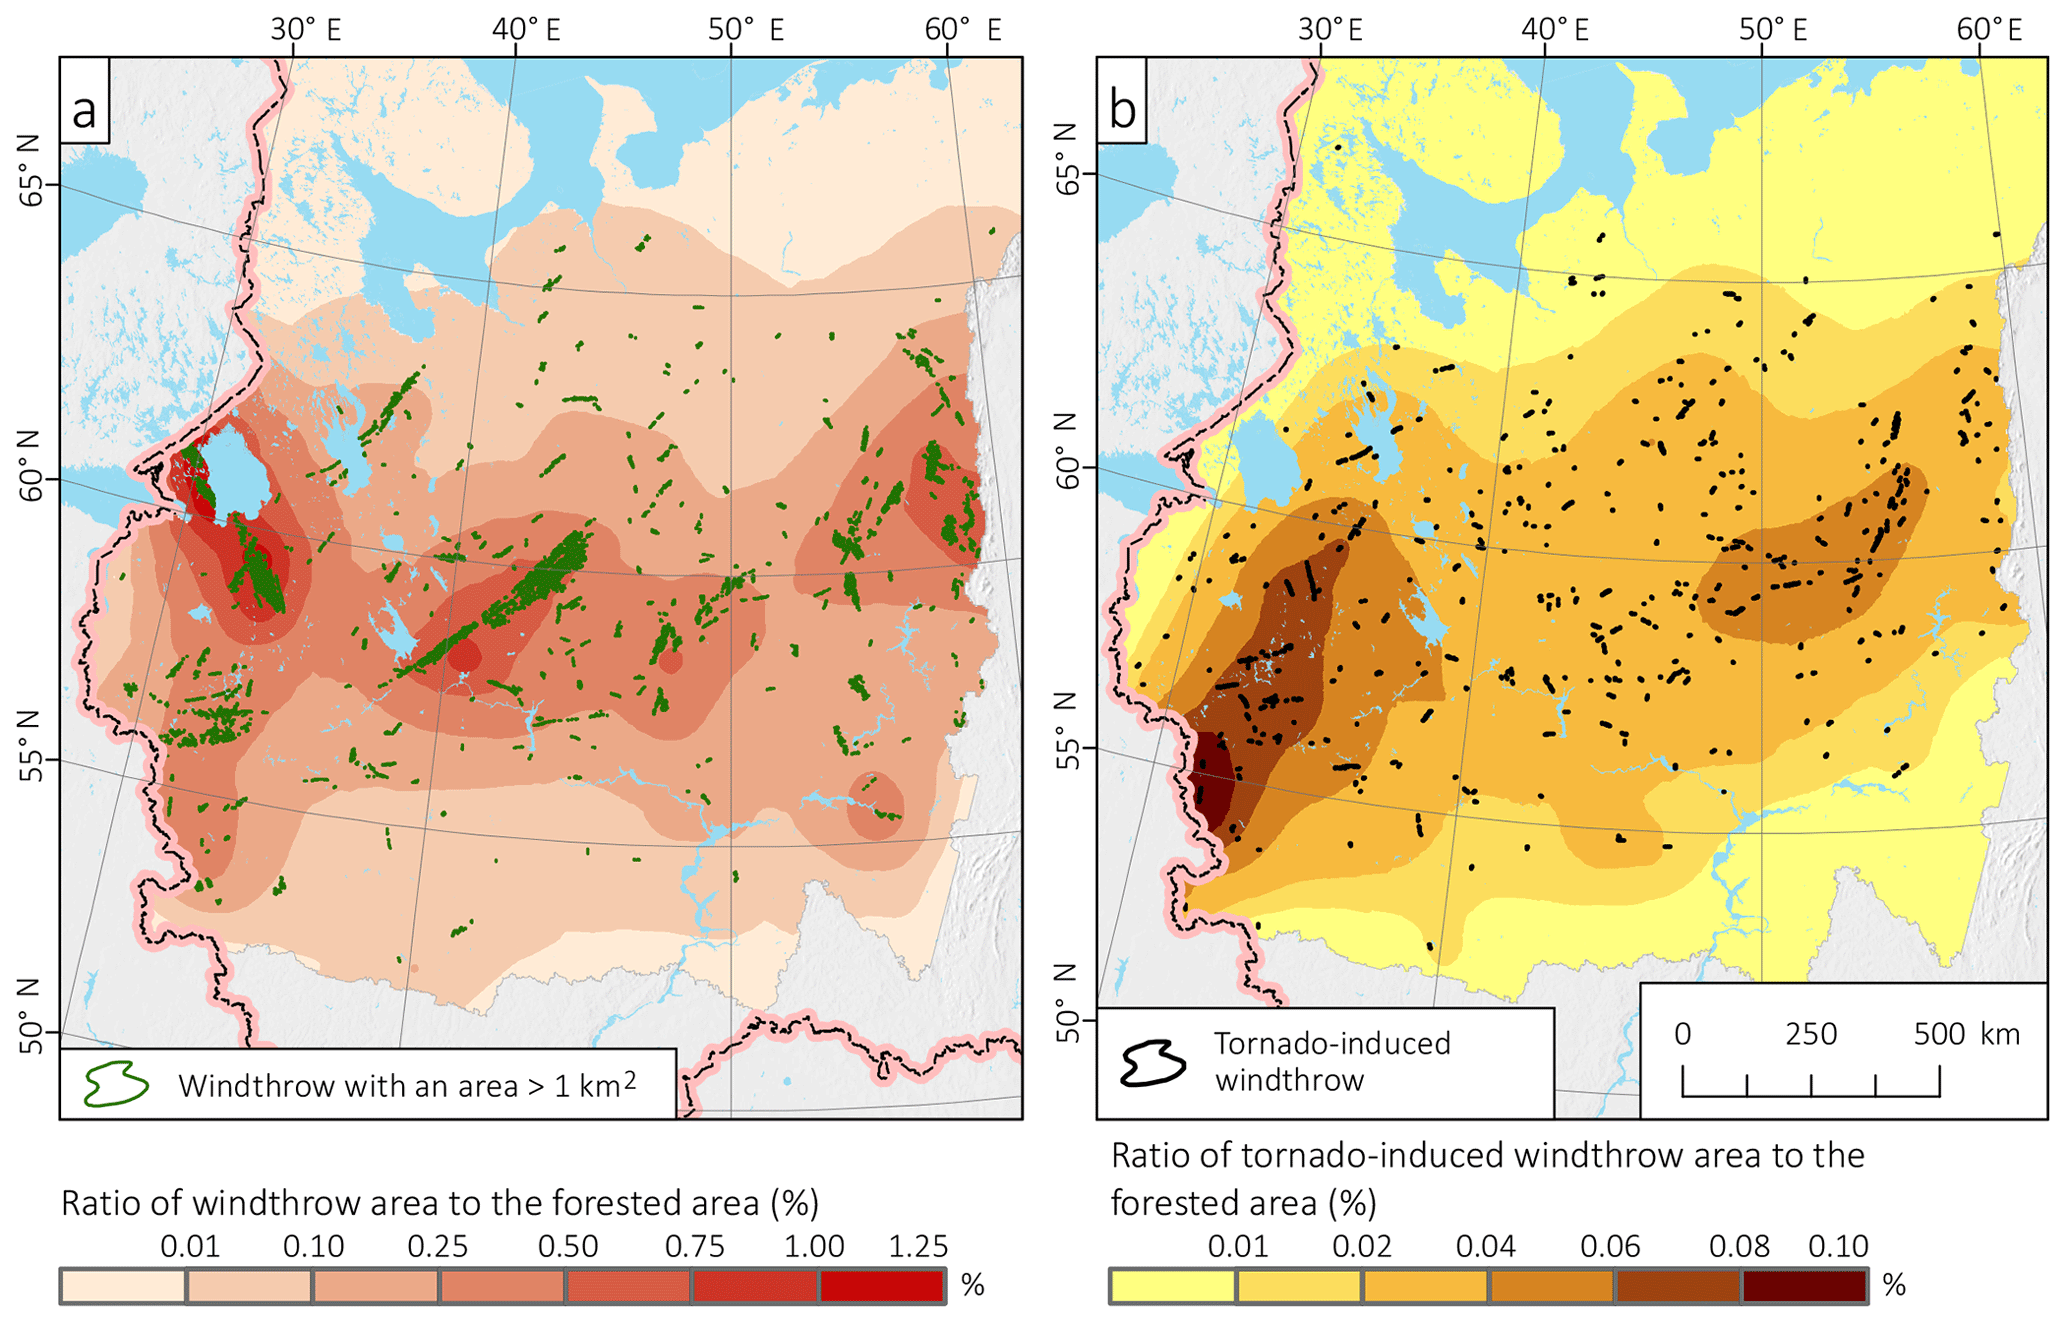
Figure 11Ratio of damaged area to the forest-covered area for (a) all windthrow and (b) tornado-induced windthrow only. The ratio of windthrow area to the forest-covered area was calculated for a 100 km2 cell and then interpolated with the local polynomial interpolation method from ArcGis Geostatistical Analyst.
5.2 Spatial distribution of windthrow areas
Windthrow events occur in the entire forest zone of ER (Fig. 10). However, the highest density is observed near 60∘ N and somewhat coincides with the highest percentage of forest-covered area (see Fig. 1). It is of note that two windthrow areas are located north of 66∘ N and one of them is even north of the Arctic Circle. The dominant direction of both tornado-induced and other windthrows is SW–NE (Fig. 15b), which is in line with previous studies on tornado climatology in northern Eurasia (Shikhov and Chernokulsky, 2018; Chernokulsky et al., 2020).
Three regions where windthrows have affected more than 0.75 % of forests can be highlighted (Fig. 11a). Two of them are related to the catastrophic storms which occurred on 27 June and 29 July 2010. In total, these two storms have damaged 1140 km2 of forests, which is 38.4 % of the total area of stand-replacing windthrow in ER in 1986–2017. The third area is located on the western slope of the northern Urals and coincides with the largest extent of dark coniferous forests in ER (Pakhuchiy, 1997). The most important windthrow events occurred here in June 1993, July 2012, and October 2016. The latter was induced by a snowstorm. The relatively high frequency of windthrow in this region was emphasized previously (Lassig and Mocalov, 2000; Shikhov and Chernokulsky, 2018; Shikhov et al., 2019b). It was hypothesized that it may be related to the combination of several factors, namely widespread old-growth forests, a high annual precipitation rate (up to 1000 mm yr−1), and large soil wetness, which all contribute to the forest's wind susceptibility (Dobbertin, 2002).
The highest density of tornado-induced windthrows is found between 59 and 62∘ N, 48 and 56∘ E (Fig. 11b), which is in good agreement with previous estimates (Shikhov and Chernokulsky, 2018). However, the ratio of the tornado-damaged area to the total forested area is higher in the western part of ER (Fig. 11b). It is of note that higher values of so-called convective instability indices are also observed in this region (Taszarek et al., 2018).
The species composition and age of forest stands have substantial influence on the spatial distribution of windthrow (Dobbertin, 2002, Suvanto et al., 2016; Gregow et al., 2017). Using the presented dataset, estimates of the relationship between windthrow area and forest stands characteristics can be carried out in future studies at a regional scale.
5.3 Temporal variability in windthrow and storm events
We successfully determined the year of occurrence for all windthrow events and the month of occurrence for 263 (67.9 %) tornado-induced and 224 (71.5 %) non-tornado-induced windthrow events. We established the dates of occurrence for 339 windthrow events, including 149 (39.2 %) tornado-induced and 187 (59.7 %) non-tornado-induced ones. It is of note that the dates of the most impactful large-scale windthrows with a damage area > 10 km2 were determined for 44 out of 49 cases (90 %). Windthrow events with known dates have a total area of 2599 km2, i.e., 87.7 % of the total wind-damaged area.
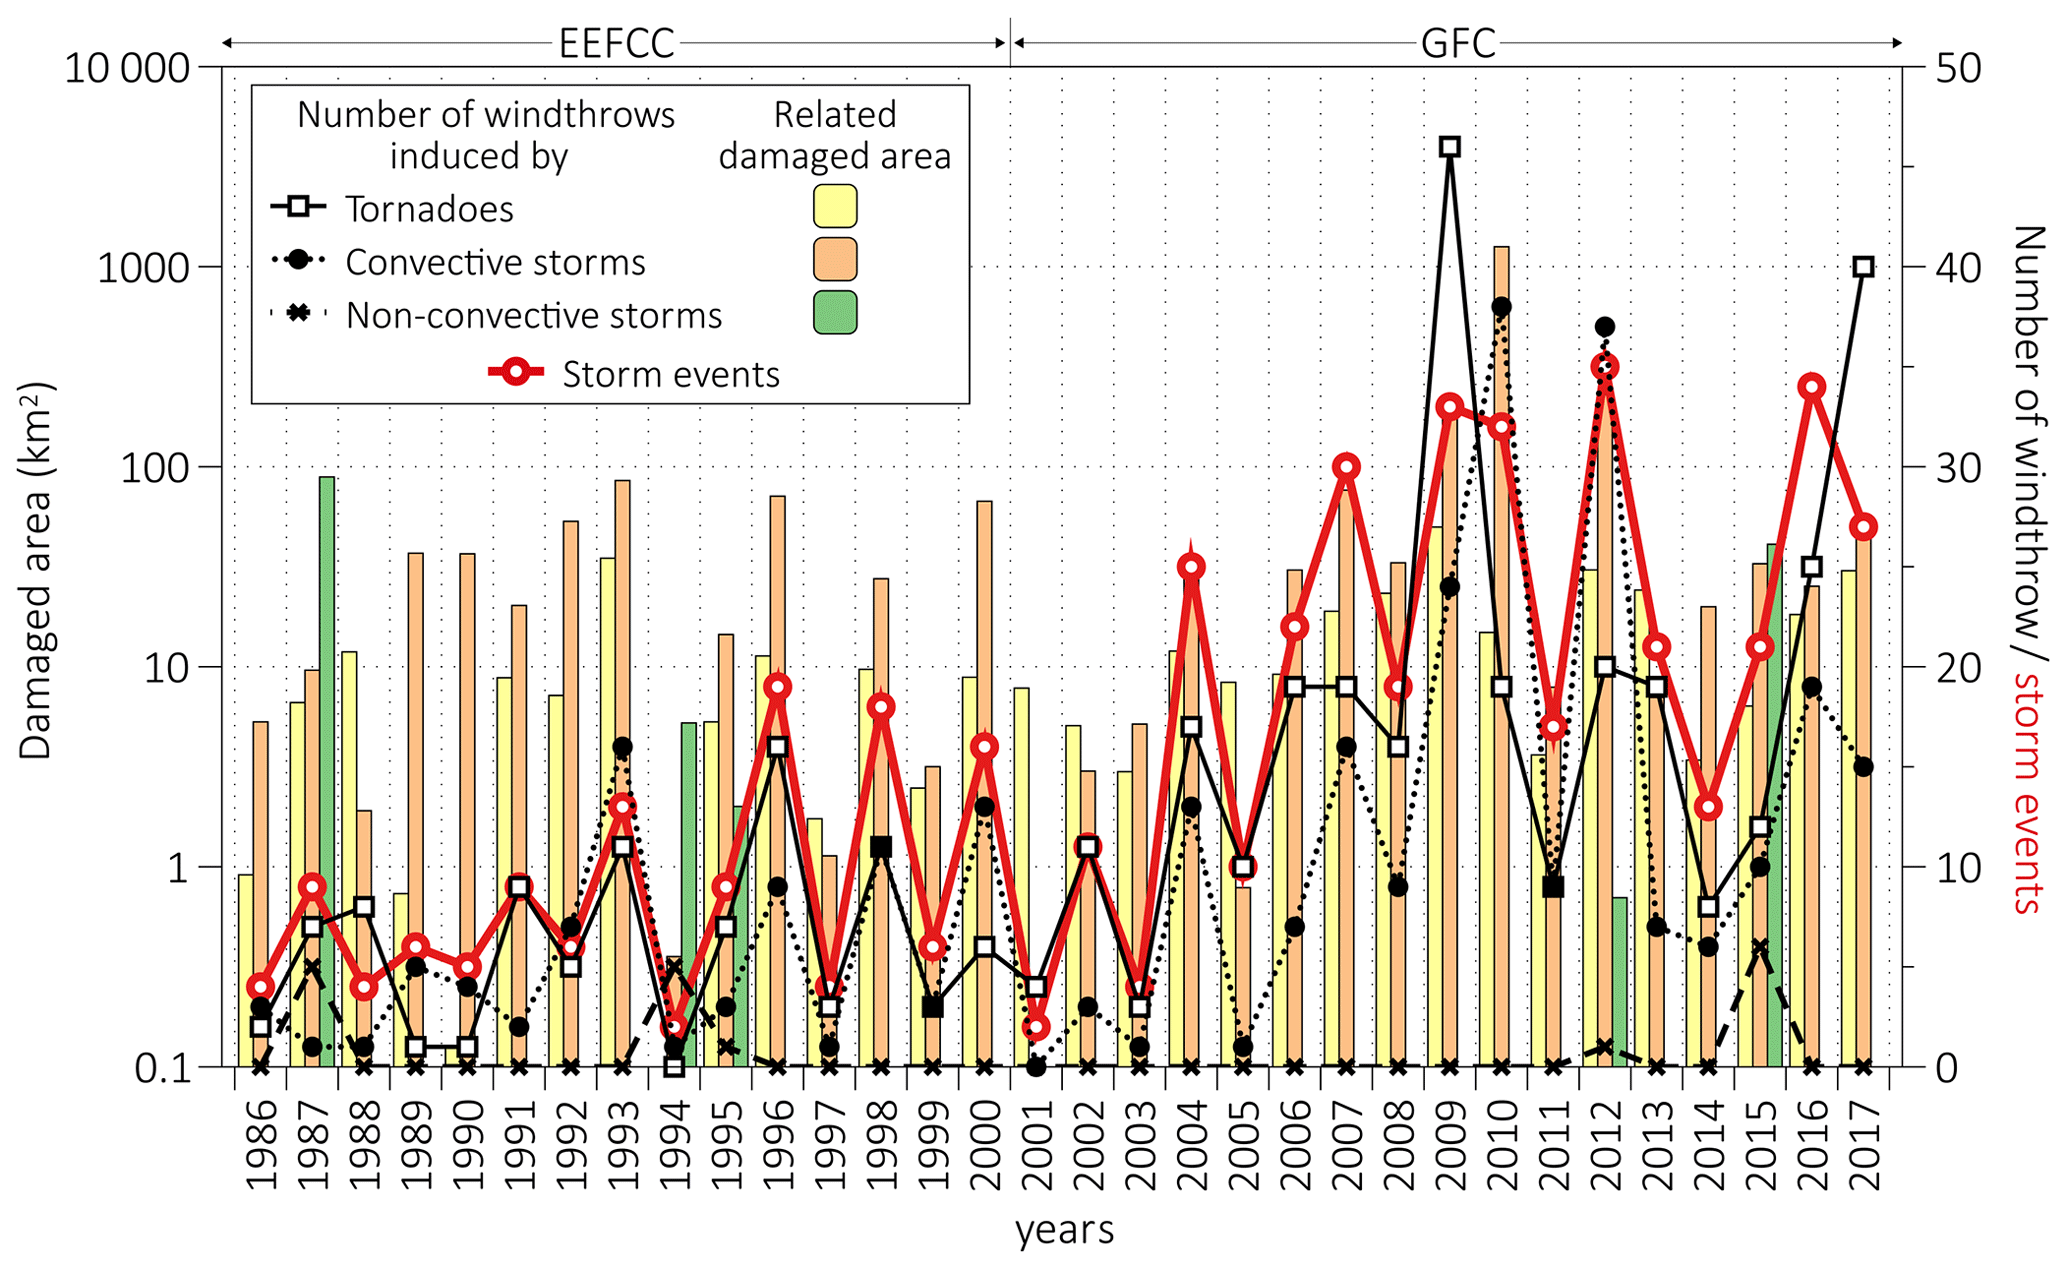
Figure 12Interannual variability in the number of windthrows, related damaged area, and number of storm events. Note the logarithmic scale for the damaged area. Periods for the EEFCC and GFC datasets are indicated.
The storm-damaged area has a relatively high interannual variability (Fig. 12). The largest area of windthrow, i.e., > 1200 km2, is found in 2010, when two exceptional storm events occurred. An extremely high number of tornado-induced windthrow events occurred in 2009 and 2017. Storm events causing windthrows have been observed every year and range from 2 to 36, with the maximum in 2012 and minimum in 2001. In general, the annual number of windthrows and storm events was lower before 2001, when the EEFCC data were used to identify windthrow, and higher after 2001, when the GFC data were utilized. The annual number of windthrow events for these periods amounts to 12.1 and 30.5, respectively; in its turn, the annual number of storm events amounts to 8.3 and 20.9. This temporal inhomogeneity, related to the different initial data used, should be taken into account when interannual variability is analyzed. More details on the dataset limitations are provided in Sect. 6.
Windthrow events occur in ER from May to October (Fig. 13). The seasonal maximum of the number of windthrow events is found in June – both for tornadoes and for other storm events. This is in concordance with the previous estimates on tornado climatology (Shikhov and Chernokulsky, 2018; Chernokulsky et al., 2020). The maximum frequency of the occurrence of storm events causing windthrows is also observed in June. Moreover, more than 90 % of storm events with known dates occur in summer. It is important to note that we failed to establish the month of appearance for 127 tornado-induced windthrow areas and 98 non-tornado-induced ones, which have a total area of 245 km2.
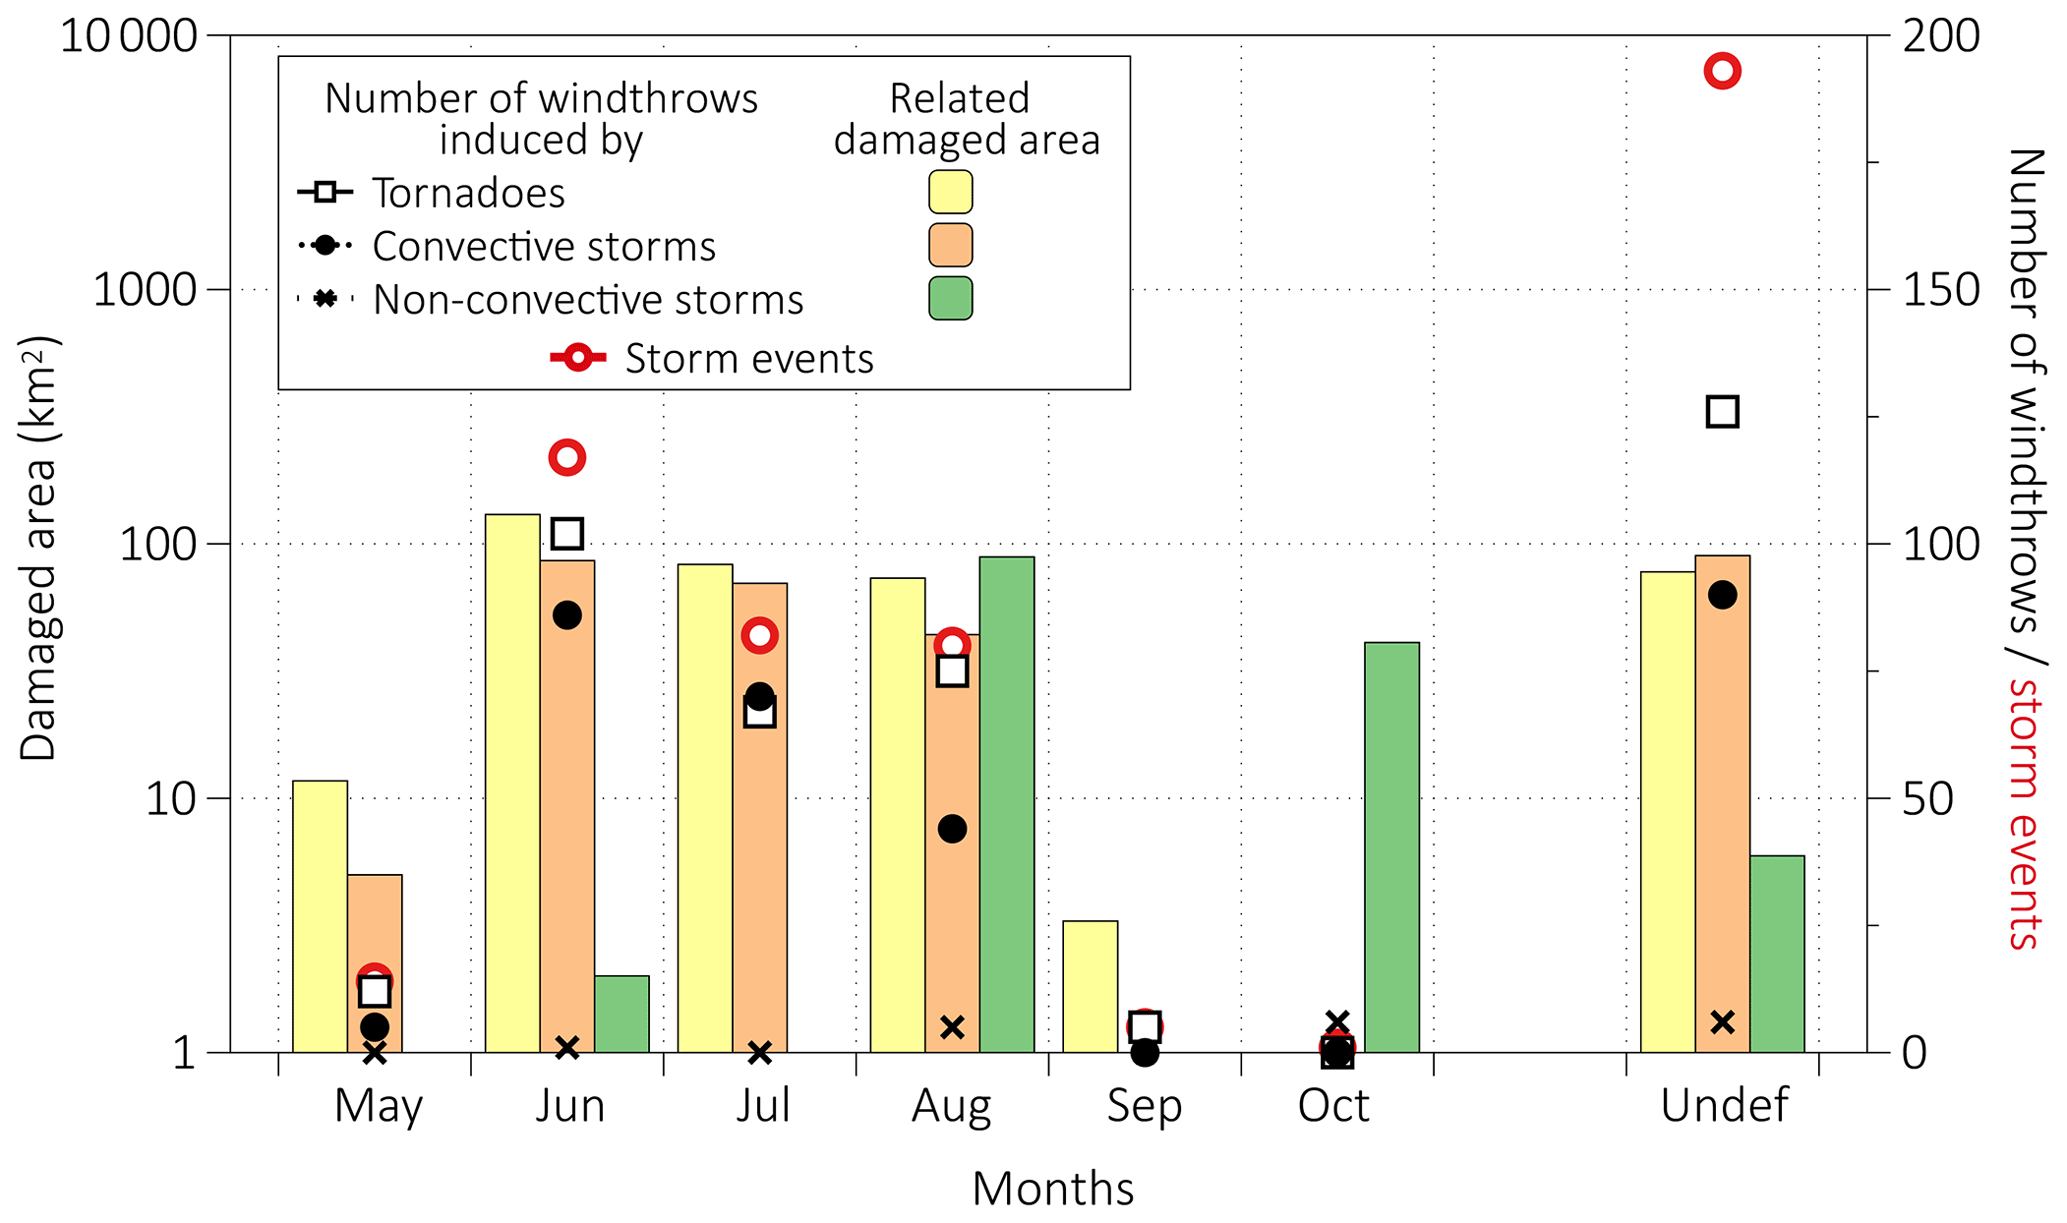
Figure 13Annual cycle of the number of windthrows, related damaged area, and number of storm events. Note the logarithmic scale for damaged area.
Sometimes, two or more storm events causing windthrows occurred in ER on the same day. In total, we found 7 outbreaks with more than 10 windthrow areas per day. The most remarkable outbreaks occurred on 18 July 2012 when 9 storms resulted in 25 windthrow areas and on 7 June 2009 when 5 storms resulted in 24 windthrow areas. However, the largest forest damage is associated with a single storm, namely the long-lived convective storm “Asta” (Suvanto et al., 2016). This storm passed over the northwestern part of ER and Finland on 29 July 2010 and damaged 639 km2 of forests in Russia alone.
No winter windthrow events were found. It is of note that both GFC and EEFCC Landsat-based products reveal stand-replacing windthrow areas regardless of the season of their appearance. In particular, if windthrow happened in winter, it would be clearly seen in images taken in subsequent vegetation periods because of a rather slow forest recovery process. Therefore, the lack of winter windthrow revealed is feasibly due to the climatic conditions of the study area and is not associated with data limitations. In particular, winter storms from Western Europe reach the territory of Russia that is already weakened (Haylock, 2011), In addition, in ER and Northern Europe, low temperatures and soil freezing also prevent trees from falling because of windstorms during the winter season (Suvanto et al., 2016). According to Suvanto et al. (2016), winter windthrows are not typical for Finland either.
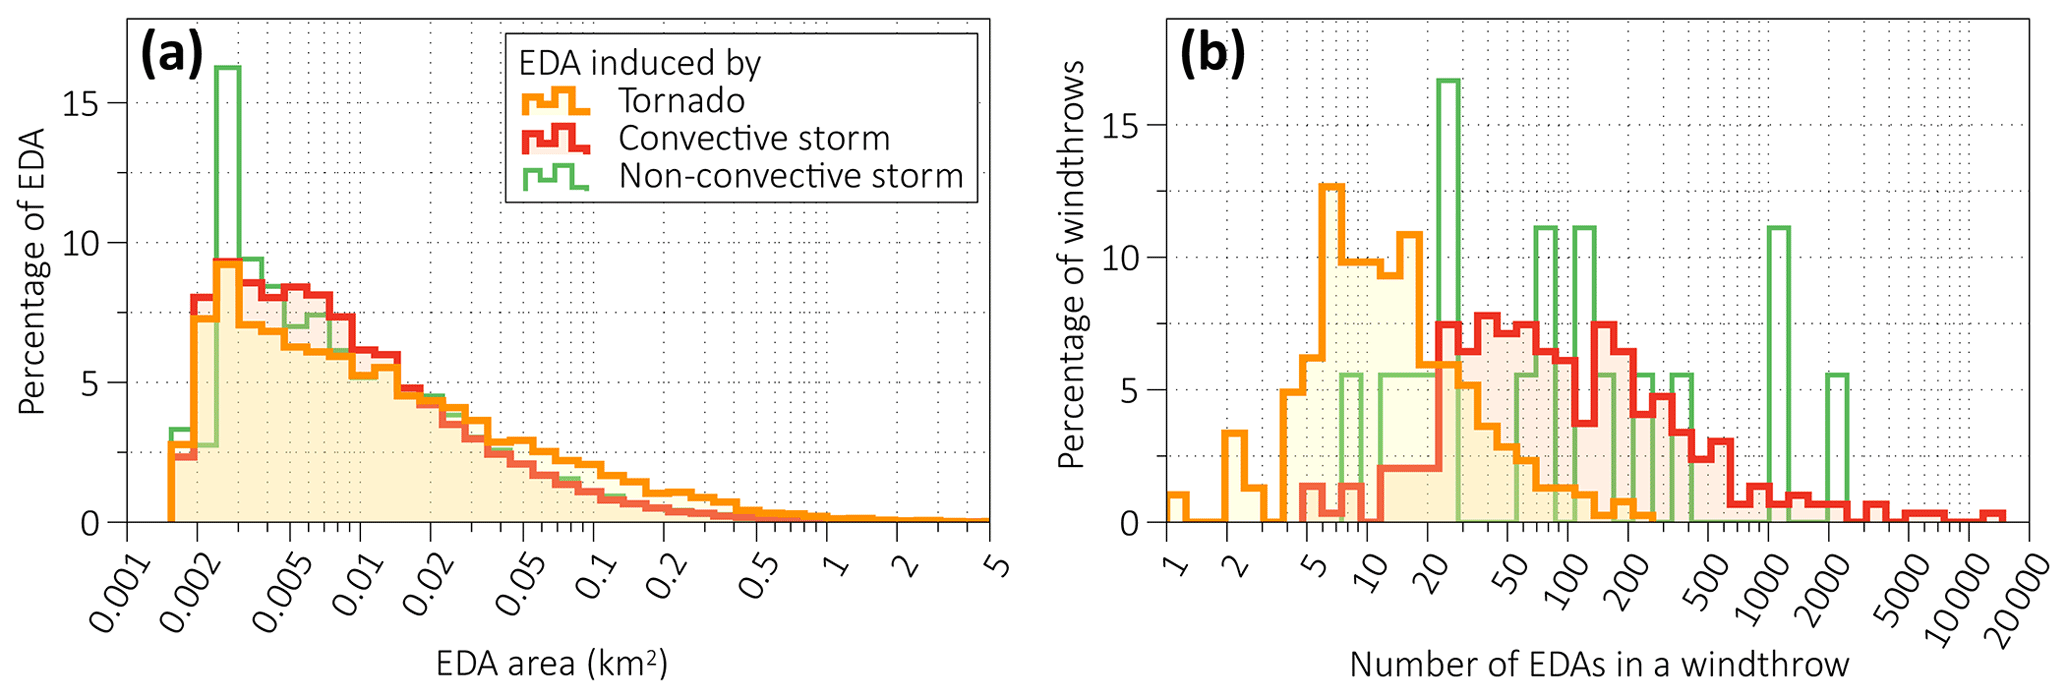
Figure 14Distribution of (a) the size of EDAs for different types of windthrows and of (b) a number of EDAs within one windthrow.
We restored the time of occurrence with 6 h accuracy for 216 windthrow events, 136 among them using weather station reports and 80 using other data sources. We found 122 windthrow events (56.4 %) occurring between 15:00 and 21:00 LT (local time), which coincides with the afternoon maximum of the development of a deep convection. However, several more impactful storms, including, for instance, the “Asta” storm, occurred around midnight local time. No windthrows were found between 06:00 and 10:00 LT during the morning minimum of the convection diurnal cycle. A similar diurnal cycle was found for tornado events in northern Eurasia (Chernokulsky et al., 2020).
5.4 Geometrical parameters of windthrow areas, elementary damaged areas, and storm tracks
The area of EDAs varies between 0.0018 and 30.9 km2. Most of the EDAs are less than 0.01 km2 (Fig. 14a), but their total area is less than 10 %. In turn, 1 % of the largest EDAs account for 36.8 % of the total area of windthrows. Using the Kolmogorov–Smirnov (K–S) test, we found that at the 0.01 significance level, we can reject the null hypothesis that two samples of AEDA within each pair of windthrow types are drawn from the same distribution (at the 0.01 level). Because of the small sample size of windthrow areas induced by non-convective storms, later in the article, we will not discuss the results of the K–S test to compare distributions of characteristics of this type with those of other types.
Tornado-induced windthrow areas contain fewer EDAs than windthrow areas induced by strong wind (Fig. 14b). In particular, most of the tornado-induced windthrow areas include 10–25 EDAs, and only 2.5 % of them consist of more than 100 EDAs. In contrast, about 43 % of non-tornado-induced windthrow areas include more than 100 EDAs, while 5.5 % of them consist of more than 1000 EDAs. Based on the K–S test, we found that samples of a number of EDAs in tornado- and convective-storm-induced windthrow areas are from different distributions.
A relatively small number of severe storm events are responsible for most of the area of windthrow (Fig. 15a). Indeed, the 10 most destructive storm events occurred in ER over 1986–2017 and damaged 1758 km2 of forests, namely 59.2 % of the total area of windthrows in the database. This peculiarity is less pronounced for tornado-induced windthrow areas since their area usually is less than 10 km2. In particular, 10 tornadoes with the largest areas damaged 96.6 km2 of forests – 25.5 % of the total tornado-damaged area. Thus, the distribution of tornado-damaged areas is less skewed to high values than the distribution of other windthrow areas. The K–S test shows that samples of A for tornado- and convective-storm-induced windthrow areas are from different distributions.
The length of windthrows ranges from 0.8 to 283.6 km (Fig. 15b). More than 44 % of tornado-induced windthrow areas have path length < 5 km, while path lengths of 5–15 km are most frequent for non-tornado-induced ones. Based on the K–S test, we found that samples of the number of L for tornado- and convective-storm-induced windthrow areas are from different distributions. The maximum length of a storm track, consisting of several subsequent windthrow areas, reaches 544 km. This damage track was caused by the storm on 27 June 2010. In addition, another nine storm tracks have a length exceeding 250 km – most of them are among the most destructive in terms of forest-damaged area. Such series of windthrows with exceptionally long path lengths were likely caused by derechos. Derechos are long-lived mesoscale convective systems producing widespread damaging winds and causing large-scale forest damage in the United States (Johns and Hirt, 1987; Peterson, 2000), Europe (Taszarek et al., 2019), and South America (Negrón-Juárez et al., 2010), although not a single derecho event has been reported previously in Russia. A more detailed further analysis of these storm events should be carried out to confirm their nature.
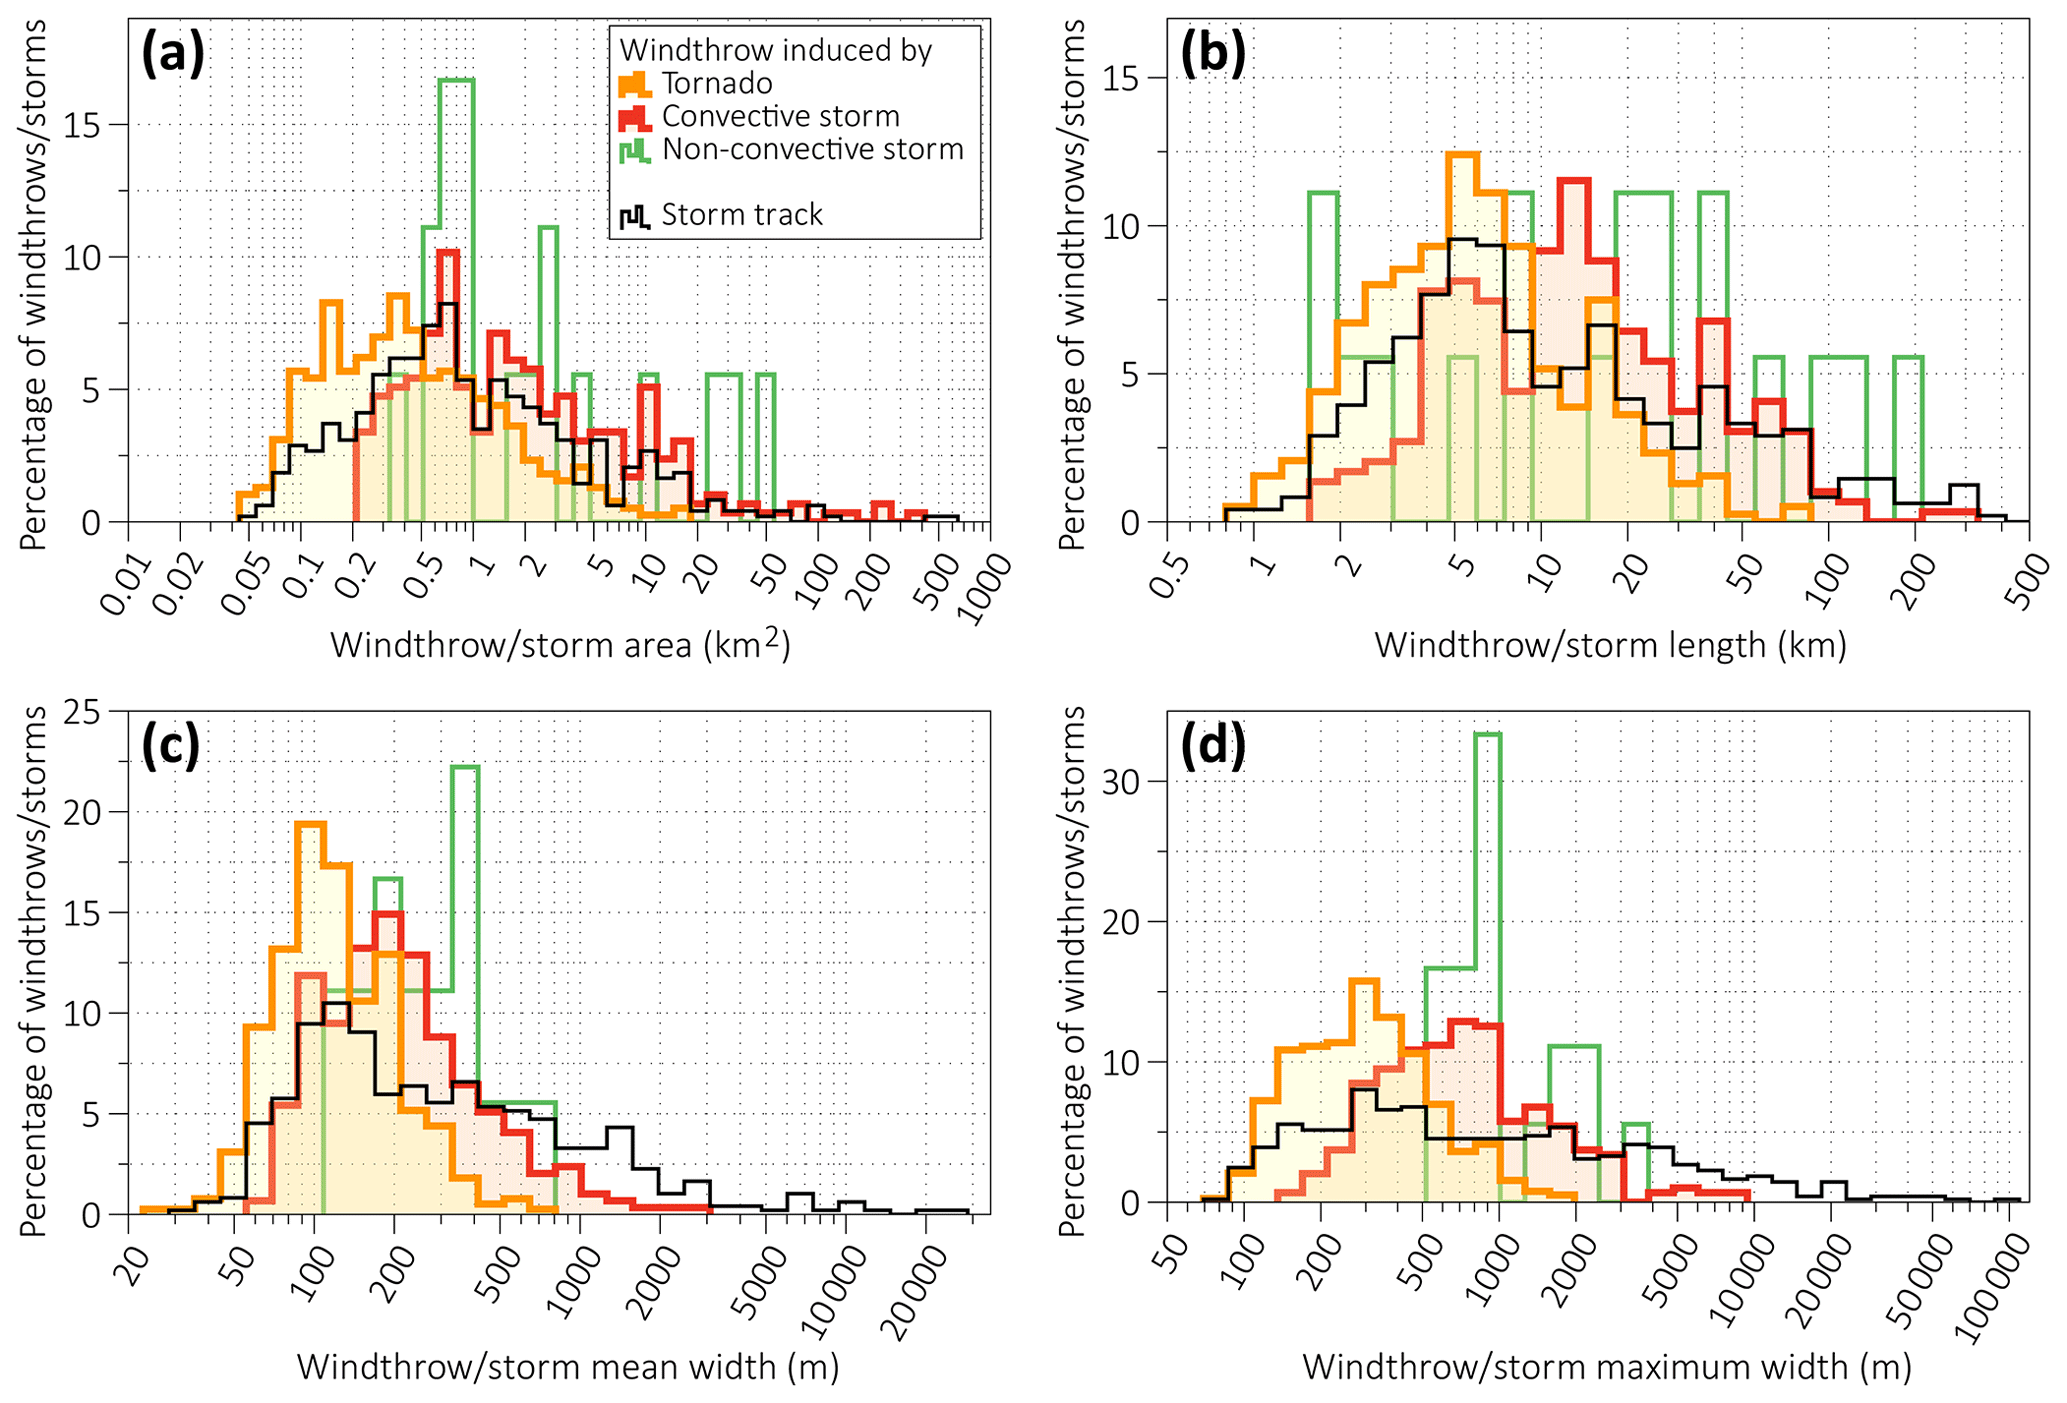
Figure 15Distribution of geometric parameters of windthrows of different types and storm tracks: (a) area, (b) length, (c) mean width, and (d) maximum width.
Most of the tornado-induced windthrow areas have Wmax and Wmean less than 200 m (Fig. 15c, d). Instead, the distribution of Wmax of non-tornado-induced windthrow areas shifted toward larger Wmax. In particular, 103 windthrow areas (32.9 %) have Wmax>1000 m. The K–S test shows that samples of both Wmax and Wmean for tornado- and convective-storm-induced windthrow areas are from different distributions. The width of storm tracks is several times higher than the width of windthrow areas. Moreover, WTRmax of non-tornadic storms is several times higher than their WTRmean. WTRmax exceeds 30 km for the three widest convective storms: two derechos occurred on 27 June and 29 July 2010, and one non-convective storm occurred on 7–8 August 1987.
Due to several data and method limitations, the presented database is spatially and temporally inhomogeneous and hence incomplete. Specifically, since most of the windthrows were delineated from the GFC and EEFCC datasets, forest loss areas which are initially missed or underestimated in these datasets could be missed in our database as well. The verification performed with the Landsat images and the HRIs allows us to reduce these omissions. In particular, we found several windthrows in small-leaved or broadleaved forests that were substantially underestimated in the GFC dataset.
The efficiency of the method depends on the percentage of forest-covered area. In general, our data are more complete for the low-populated northern and eastern part of ER where forests cover 70 %–90 % of the territory and dark coniferous forests are widespread (Bartalev et al., 2016). However, some regions in the northern part of ER are not covered by HRIs, which prevents the thorough verification of some windthrow areas.
In the southern part of the study area, the dataset is likely less complete since some windthrow areas can be overlooked. In particular, it is possible to miss windthrow area if a storm or tornado passed through areas of intensive timber harvesting or agricultural lands (Shikhov and Chernokulsky, 2018). Salvage logging performed shortly after a storm event also complicates the identification of wind-related forest damage (Baumann et al., 2014). However, in most cases, the time interval between storm event and salvage logging in ER was quite long, i.e., more than a year, except for more populated southern regions.
Temporal inhomogeneity of our database, especially for small-scale windthrow areas, comes from the following causes.
-
Two different Landsat-based products were used to search for windthrow-like disturbances: the EEFCC before 2001 and the GFC after. The GFC data have a higher accuracy of forest loss detection and of initial time assignment than the EEFCC (see Sect. 4.1 for details), which allows us to detect more windthrow areas. Thus, the annual number of windthrow events is 2.5 times higher in the GFC period compared to the EEFCC period.
-
After 2002–2003, the HRIs became available, which made it possible to confirm the tornadic nature of windthrow events. The observed increase in the number of tornado-induced windthrow events after 2003 is very likely related to the appearance of the HRIs.
-
The start of the Sentinel-2 mission in 2015 providing images with a 10 m spatial resolution (Drusch et al., 2012) has also increased the possibility for windthrow identification.
-
A strong decrease in the volume of timber harvesting occurred in ER, especially in its northeastern part, after the dissolution of the Soviet Union (Potapov et al., 2015). This could lead to more omissions of windthrow areas in the late 1980s compared to the subsequent period because of their overlapping with logged areas.
-
The number of windthrow areas and storm events has been determined with the use of arbitrary threshold values. It could have changed substantially due to modifications to these thresholds (see Sect. 4.1.4. and 4.3. for more details). So, the data on the number of windthrow events may be more inhomogeneous than the assessment of the wind-affected area.
Thus, the presented database should be used for assessing interannual variability with caution. Special assumptions should be made to estimate linear trends. For instance, they can be obtained for particular regions, e.g., for those with little changes in forestry practices, and for relatively large windthrow areas that are well-detected from both the EEFCC and the GFC data. For instance, the linear trend in the number of windthrows with an area ≥ 1 km2 amounts to 0.27 yr−1 and is statistically significant at the 0.05 level1. This increase in wind-related forest disturbances is in line with the observed increase in such characteristics as convective precipitation (Ye et al., 2017; Chernokulsky et al., 2019), convective cloudiness (Sun et al., 2001; Chernokulsky et al., 2011), and convective instability indices (Riemann-Campe et al., 2009; Chernokulsky et al., 2017) in ER in the last decades.
Currently, the proposed method requires expert verification at almost all stages, which prevents it being switched into the automatic mode. The possibility of automated searching throughout the GFC and EEFCC datasets is limited by a wide variety of windthrow shapes and their overlapping with other forest disturbances. The data collection process requires the use of numerous and diverse sources such as the HRIs from various public web services, weather station reports, eyewitness and media reports, etc.
While the algorithms for automated forest disturbance detection based on satellite data are well-developed and applied from the regional to global scale (Huo et al., 2019), the automated attribution of forest disturbances to their causes, namely windstorms, logging, wildfires, insect outbreaks, and others, remains a critical challenge for satellite-based forest monitoring. The spectral characteristics of various types of disturbance, e.g., windthrow and logged areas, are often similar (Baumann et al., 2014), which complicates the automated attribution. The promising approaches in this process is the complex use of spectral, temporal, and topography-related metrics (Oeser et al., 2017), as well as implementing advanced image classification/segmentation methods (Oeser et al., 2017; Liu et al., 2018; Huo et al., 2019). In future studies, such approaches can be applied to automate the delineation of windthrow areas in ER using satellite data with various spatial resolutions.
The data are freely available at https://doi.org/10.6084/m9.figshare.12073278.v6 (Shikhov et al., 2020). It will be periodically updated with new and historical windthrow events.
The compiled GIS database contains the most complete information on relatively large stand-replacing windthrow areas in the forest zone of ER in 1986–2017. The database contains 102 747 elementary damaged areas, combined into 700 windthrow areas, which were caused by 486 storm events. For each windthrow, we determined its type with degree of certainty, dates or date ranges, and geometrical characteristics. The database also contains weather station reports and links to additional information on storm events from the media. We included in the database only the stand-replacing windthrows with an area > 0.05 and > 0.25 km2 for the tornado- and non-tornado-induced windthrows, respectively.
The total windthrow area amounts to 2966 km2, namely 0.19 % of the forested area within the study region. Most of the windthrows in ER, i.e., 82.5 % of the total wind-damaged area, are related to convective squalls and downbursts, which occur mainly in June and July. The 10 most impactful storms are responsible for 59.2 % of the total forest damage. More than 55 % of windthrow events in the database are tornado-induced, but their contribution to total damaged area is much lower – it is less than 13 %. Non-convective windstorms and snowstorms caused only 4.6 % of the storm-damaged area.
The largest area of windthrows is assigned to the year 2010, when two exceptionally destructive storm events occurred: on 27 June and 29 July 2010. An extremely high number of tornado-induced windthrows were observed in 2009 and 2017: 45 and 40 tornadoes, respectively.
The presented method has several limitations resulting in the spatial and temporal inhomogeneity of the compiled database specifically for small-scale windthrow areas, and hence the dataset is determined to be incomplete. Because of the influence of the forested area percentage and forestry practices, such windthrow areas can be rather missed in the southern part of ER compared to the northern part. Because of the coarser resolution of the EEFCC data and lack of HRIs, windthrow areas can be rather missed before 2001. The obtained increases in the number of windthrow events and affected areas are mainly artificial.
Despite the incompleteness, the compiled database provides a valuable source of spatial and temporal information on windthrow events in ER. On the one hand, the database allows us to estimate the role of wind-related disturbances in comparison to other natural disturbances in forests and to improve our understanding of different forest species susceptible to windstorms. On the other hand, the database presents a unique source of information on storm and tornado events causing forest damage in ER. It includes numerous, previously unknown storms and tornadoes which caused forest damage and also clarifies information on the known storm events. Thus, the database substantially contributes to the climatology of severe storms and tornadoes in ER. Based on the compiled database, further studies may be carried out to determine the contribution of climate variability to the interannual variability in wind-related forest damage and to quantify the risk of windthrow to forests in all of ER.
ASh and AC designed the study. ASh and ASe performed the windthrow identification using satellite data. ASh and IA carried out an analysis of additional information to determine storm event types and dates. Ash and ACh, with contributions from IA, wrote the initial draft of the paper and produced the maps and figures.
The authors declare that they have no conflict of interest.
The study was funded by the Russian Foundation for Basic Research (projects nos. 19-05-00046 and 20-35-70044). The determination of storm track characteristics was supported by the Russian Science Foundation (project no. 18-77-10076). The authors thank Barry Gardiner and two anonymous reviewers for their comments that helped to improve the paper.
The study was funded by the Russian Foundation for Basic Research (projects nos. 19-05-00046 and 20-35-70044). The determination of storm track characteristics was supported by the Russian Science Foundation (project no. 18-77-10076).
This paper was edited by Birgit Heim and reviewed by two anonymous referees.
Attiwill, P. M.: The disturbance of forest ecosystems: the ecological basis for conservative management, Forest Ecol. Manage., 63, 247–300, https://doi.org/10.1016/0378-1127(94)90114-7, 1994.
Ball, G. H. and Hall, D. J.: ISODATA, a Novel Method of Data Analysis and Pattern Classification, Stanford Research Institute, Menlo Park, 1965.
Bartalev, S. A., Egorov, V. A., Zharko, V. O., Lupyan, E. A., Plotnikov, D. E., Khvostikov, S. A., and Shabanov, N. V.: Satellite-based mapping of the vegetation cover of Russia, Moscow, Institute of Space Research of RAS, 208 pp., 2016 (in Russian).
Baumann, M., Ozdogan, M., Wolter, P. T., Krylov, A. M., Vladimirova, N. A., and Radelo, V. C.: Landsat remote sensing of forest windfall disturbance, Remote Sens. Environ., 143, 171–179, https://doi.org/10.1016/j.rse.2013.12.020, 2014.
Beck, V. and Dotzek, N.: Reconstruction of near-surface tornado wind fields from forest damage, J. Appl. Meteorol. Climatol., 49, 1517–1537, https://doi.org/10.1175/2010JAMC2254.1, 2010.
Bulygina, O. N., Veselov, V. M., Razuvaev, V. N., and Aleksandrova, T. M.: Description of the dataset of observational data on major meteorological parameters from Russian weather stations, available at: http://meteo.ru/data/163-basicparameters (last access: 15 December 2020), 2014.
Chernokulsky, A., Kurgansky, M., Mokhov, I., Shikhov, A., Azhigov, I., Selezneva, E., Zakharchenko, D., Antonescu, B., and Kühne, T.: Tornadoes in Northern Eurasia: from the Middle Age to the Information Era, Mon. Weather Rev., 148, 3081–3111, https://doi.org/10.1175/MWR-D-19-0251.1, 2020.
Chernokulsky, A., Kozlov, F., Zolina, O., Bulygina, O., Mokhov, I. I., and Semenov, V. A.: Observed changes in convective and stratiform precipitation in Northern Eurasia over the last five decades, Environ. Res. Lett., 14, 045001, https://doi.org/10.1088/1748-9326/aafb82, 2019.
Chernokulsky, A. V., Kurgansky, M. V., and Mokhov I. I.: Analysis of changes in tornadogenesis conditions over Northern Eurasia based on a simple index of atmospheric convective instability, Doklady Earth Sciences, 477, 1504–1509, https://doi.org/10.1134/S1028334X17120236, 2017.
Chernokulsky, A. V., Bulygina, O. N., and Mokhov, I. I.: Recent variations of cloudiness over Russia from surface daytime observations, Environ. Res. Lett., 6, 035202, https://doi.org/10.1088/1748-9326/6/3/035202, 2011.
Chernokulsky, A. V. and Shikhov, A. N.: 1984 Ivanovo tornado outbreak: Determination of actual tornado tracks with satellite data, Atmos. Res., 207, 111–121, https://doi.org/10.1016/j.atmosres.2018.02.011, 2018.
Diffenbaugh, N. S., Scherer, M., and Trapp, R. J.: Robust increases in severe thunderstorm environments in response to greenhouse forcing, P. Natl. Acad. Sci. USA, 110, 16361–16366, https://doi.org/10.1073/pnas.1307758110, 2013.
Dmitrieva, T. G. and Peskov B. E.: Numerical forecast with the mesosynoptic specification of extremely severe squalls in the European part of Russia (Case study for June 13 and July 29, 2010), Russ. Meteorol. Hydrol., 38, 71–79, https://doi.org/10.3103/S1068373913020027, 2013.
Dobbertin, M.: Influence of stand structure and site factors on wind damage comparing the storms Vivian and Lothar, Forest Snow and Landscape Research, 77, 187–205, 2002.
Doswell, C. A. and Burgess, D. W.: On some issues of United States tornado climatology, Mon. Weather Rev., 116, 495–501, 1988.
Drusch, M., Del Bello, U., Carlier, S., Colin, O., Fernandez, V., Gascon, F., Hoersch, B., Isola, C., Laberinti, P., Martimort, P., Meygret, A., Spoto, F., Sy, O., Marchese, F., and Bargellini, P.: Sentinel-2: ESA's Optical High-Resolution Mission for GMES Operational Services, Remote Sens. Environ., 120, 25–36, https://doi.org/10.1016/j.rse.2011.11.026, 2012.
Dyaduchenko, V., Pavlyukov, Y. B., and Vylegzhanin, I.: Doppler weather radars in Russia, Science in Russia, 1, 23–27, 2014 (in Russian).
Foga, S., Scaramuzza, P. L., Guo, S., Zhu, Z., Dilley, R. D., Beckmann, T., Schmidt, G. L., Dwyer, J. L., Hughes, M. J., and Laue, B.: Cloud detection algorithm comparison and validation for operational Landsat data products, Remote Sens. Environ., 194, 379–390, https://doi.org/10.1016/j.rse.2017.03.026, 2017.
Forzieri, G., Pecchi, M., Girardello, M., Mauri, A., Klaus, M., Nikolov, C., Rüetschi, M., Gardiner, B., Tomaštík, J., Small, D., Nistor, C., Jonikavicius, D., Spinoni, J., Feyen, L., Giannetti, F., Comino, R., Wolynski, A., Pirotti, F., Maistrelli, F., Savulescu, I., Wurpillot-Lucas, S., Karlsson, S., Zieba-Kulawik, K., Strejczek-Jazwinska, P., Mokroš, M., Franz, S., Krejci, L., Haidu, I., Nilsson, M., Wezyk, P., Catani, F., Chen, Y.-Y., Luyssaert, S., Chirici, G., Cescatti, A., and Beck, P. S. A.: A spatially explicit database of wind disturbances in European forests over the period 2000–2018, Earth Syst. Sci. Data, 12, 257–276, https://doi.org/10.5194/essd-12-257-2020, 2020.
Fraser, R. H.: An analysis of large-scale forest cover disturbance in Canada (1998–2004) based on multi-temporal coarse resolution data, Proc. Third Int. Workshop on the Analysis of Multi-Temporal Remote Sensing Images 2005, 1469880, 236–240, https://doi.org/10.1109/AMTRSI.2005.1469880, 2005.
Gardiner, B., Blennow, K., Carnus, J.-M., Fleischer, P., Ingemarson, F., Landmann, G., Lindner, M., Marzano, M., Nicoll, B., Orazio, C., Peyron, J.-L., Reviron, M.-P., Schelhaas, M.-J., Schuck, A., Spielmann, M., and Usbeck, T.: Destructive Storms in European Forests: Past and forthcoming Impacts, European Forest Institute, 2010.
Giglio, L., Schroeder, W., and Justice, C. O.: The collection 6 MODIS active fire detection algorithm and fire products, Remote Sens. Environ., 178, 31–41, https://doi.org/10.1016/j.rse.2016.02.054, 2016.
Gregow, H., Laaksonen, A., and Alper, M. E.: Increasing large scale windstorm damage in Western, Central and Northern European forests, 1951–2010, Sci. Rep., 7, 46397, https://doi.org/10.1038/srep46397, 2017.
Hansen, M. C., Potapov, P. V., Moore, R., Hancher, M., Turubanova, S. A., Tyukavina, A., Thau, D., Stehman, S. V., Goetz, S. J., Loveland, T. R., Kommareddy, A., Egorov, A., Chini, L., Justice, C. O., and Townshend, J. R. G.: High-Resolution Global Maps of 21st-Century Forest Cover Change, Science, 342, 850–853, https://doi.org/10.1126/science.1244693, 2013.
Hardisky, M. A., Klemas, V., and Smart, R. M.: The influence of soil salinity, growth form, and leaf moisture on the spectral radiance of Spartina alterniflora canopies, Photogramm. Eng. Remote Sens., 49, 77–83, 1983.
Haylock, M. R.: European extra-tropical storm damage risk from a multi-model ensemble of dynamically-downscaled global climate models, Nat. Hazards Earth Syst. Sci., 11, 2847–2857, https://doi.org/10.5194/nhess-11-2847-2011, 2011.
Huo, L.-Z., Boschetti, L., and Sparks, A. M.: Object-based classification of forest disturbance types in the conterminous United States, Remote Sensing, 11, 477, https://doi.org/10.3390/rs11050477, 2019.
Johns, R. H. and Hirt, W. D.: Derechos: Widespread convectively induced windstorms, Weather Forecast., 2, 32–49, 1987.
Kalyakin, V. N., Smirnova, O. V., Bobrovskii, M. V., Turubanova, S. A., Potapov, P. V. and Yaroshenko, A. Y.: History of the Eastern European forest cover, in: Forests of Eastern Europe, edited by: Smirnova, O. V., 151–153, Moscow, Russia, 2004 (in Russian).
Karstens, C. D., Gallus Jr., W. A., Lee, B. D., and Finley, C.A.: Analysis of tornado-Induced tree fall using aerial photography from the Joplin, Missouri, and Tuscaloosa-Birmingham, Alabama, Tornadoes of 2011, J. Appl. Meteorol. Climatol., 52, 1049–1068, https://doi.org/10.1175/JAMC-D-12-0206.1, 2013.
Kautz, M., Meddens, A. J. H., Hall, R. J., and Arneth, A.: Biotic disturbances in Northern Hemisphere forests – a synthesis of recent data, uncertainties and implications for forest monitoring and modelling, Global Ecol. Biogeogr., 26, 533–552, https://doi.org/10.1111/geb.12558, 2017.
Koroleva, N. V. and Ershov, D. V.: Estimation of error in determining the forest windfall disturbances area on high spatial resolution space images of LANDSAT-TM, in: Current Problems in Remote Sensing of the Earth From Space, 9, 80–86, 2012 (in Russian).
Korznikov, K. A., Kislov, D. E., Belyaeva, N. G.: The first record of catastrophic windthrow in boreal forests of South Sakhalin and the South Kurils (Russia) during October 2015 tropical cyclones, Botanica Pacifica, 8, 31–38, https://doi.org/10.17581/bp.2019.08115, 2019.
Köster, K., Voolma, K., Jõgiste, K., Metslaid, M., and Laarmann, D.: Assessment of tree mortality after windthrow using photo-derived data, Ann. Bot. Fennici, 46, 291–298, https://doi.org/10.5735/085.046.0405, 2009.
Krylov, A. M., Malahova, E. G., and Vladimirova, N. A.: Identification and assessment of forest areas damaged by windfalls in 2009–2010 by means of remote sensing, Bulletin Of Saint-Petersburg Academy of Forest Management, 200, 197–207, 2012 (in Russian).
Lassig, R. and Moĉalov, S. A.: Frequency and characteristics of severe storms in the Urals and their influence on the development, structure and management of the boreal forests, Forest Ecol. Manage., 135, 179–194, https://doi.org/10.1016/S0378-1127(00)00309-1, 2000
Liu, Z., Peng, C., Work, T., Candau, J.-N., Desrochers, A., and Kneeshaw, D.: Application of machine-learning methods in forest ecology: Recent progress and future challenges, Environ. Rev., 26, 339–350, https://doi.org/10.1139/er-2018-0034, 2018.
Los Angeles Times: 6 Die, 122 Hurt as Windy Storm Rips Up Moscow, available at: https://www.latimes.com/archives/la-xpm-1998-jun-22-mn-62451-story.html (last access: 3 April 2020), 1998.
Millar, C. I. and Stephenson, N. L.: Temperate forest health in an era of emerging megadisturbance, Science, 349, 823–826, https://doi.org/10.1126/science.aaa9933, 2015.
Negrón-Juárez, R. I., Chambers, J. Q., Guimaraes, G., Zeng, H., Raupp, C. F. M., Marra, D. M., Ribeiro, G. H. P. M., Saatchi, S. S., Nelson, B. W., and Higuchi, N.: Widespread Amazon forest tree mortality from a single cross-basin squall line event, Geophys. Res. Lett., 37, 1–5, https://doi.org/10.1029/2010GL043733, 2010.
Nilsson, C., Stjernquist, I., Bärring, L., Schlyter, P., Jönsson, A. M., and Samuelsson, H.: Recorded storm damage in Swedish forests 1901–2000, Forest Ecol. Manage., 199, 165–173, https://doi.org/10.1016/j.foreco.2004.07.031, 2004.
Oeser, J., Pflugmacher, D., Senf, C., Heurich, M., and Hostert, P.: Using intra-annual Landsat time series for attributing forest disturbance agents in Central Europe, Forests, 8, 251, https://doi.org/10.3390/f8070251, 2017.
Overpeck, J. T., Rind, D., and Goldberg, R.: Climate-induced changes in forest disturbance and vegetation, Nature, 343, 51–53, https://doi.org/10.1038/343051a0, 1990.
Pakhuchiy, V. V.: Virgin stands of coniferous taiga in the far southeastern Komi republic, Polar Geography, 21, 213–223, https://doi.org/10.1080/10889379709377626, 1997.
Peterson, C. J.: Catastrophic wind damage to North American forests and the potential impact of climate change, Sci. Total Environ., 262, 287–311, https://doi.org/10.1016/S0048-9697(00)00529-5, 2000.
Petukhov, I. N. and Nemchinova, A. V.: Windthrows in forests of Kostroma oblast and the neighboring lands in 1984–2011, Russian J. Forest Sci., 6, 16–24, 2014 (in Russian).
Potapov, P. V., Turubanova, S. A., Tyukavina, A., Krylov, A. M., McCarty, J. L., Radeloff, V. C., and Hansen, M. C.: Eastern Europe's forest cover dynamics from 1985 to 2012 quantified from the full Landsat archive, Remote Sens. Environ., 159, 28–43, https://doi.org/10.1016/j.rse.2014.11.027, 2015.
Radler, T., Groenemeijer, P., Faust, E., Sausen, R., and Púčik, T.: Frequency of severe thunderstorms across Europe expected to increase in the 21st century due to rising instability, NPJ Climate and Atmospheric Science, 30, https://doi.org/10.1038/s41612-019-0083-7, 2019.
Riemann-Campe, K., Fraedrich, K., and Lunkeit, F.: Global climatology of convective available potential energy (CAPE) and convective inhibition (CIN) in ERA-40 reanalysis, Atmos. Res., 93, 534–545, https://doi.org/10.1016/j.atmosres.2008.09.037, 2009.
Sayn-Wittgenstein, L. and Wightman, J. M.: Landsat application in Canadian forestry, in: Proceeding of the 10th Int. Symp. on Remote Sensing of Environment, 2, 1209–1218, 1975.
Schaefer, J. T. and Edwards, R. The SPC tornado/severe thunderstorm database, in: Preprints, 11th Conf. on Applied Climatology, Amer. Meteor. Soc, Dallas, TX, available at: https://ams.confex.com/ams/99annual/abstracts/1360.htm (last access: 15 December 2020), 1999.
Schelhaas, M. J., Nabuurs, G. J., and Schuck, A.: Natural disturbances in the European forests in the 19th and 20th centuries, Glob. Change Biol., 9, 1620–1633, https://doi.org/10.1046/j.1365-2486.2003.00684.x, 2003.
Schmoeckel, J. and Kottmeier, C.: Storm damage in the Black Forest caused by the winter storm “Lothar” – Part 1: Airborne damage assessment, Nat. Hazards Earth Syst. Sci., 8, 795–803, https://doi.org/10.5194/nhess-8-795-2008, 2008.
Seidl, R., Schelhaas, M.-J., and Lexer, M. J.: Unraveling the drivers of intensifying forest disturbance regimes in Europe, Glob. Change Biol., 17, 2842–2852, https://doi.org/10.1111/j.1365-2486.2011.02452.x, 2011.
Seidl, R., Schelhaas, M.-J., Rammer, W., and Verkerk, P. J.: Increasing forest disturbances in Europe and their impact on carbon storage, Nat. Clim. Change, 4, 806–810, https://doi.org/10.1038/nclimate2318, 2014.
Seidl, R., Thom, D., Kautz, M., Martin-Benito, D., Peltoniemi, M., Vacchiano, G., Wild, J., Ascoli, D., Petr, M., Honkaniemi, J., Lexer, M.J., Trotsiuk, V., Mairota, P., Svoboda, M., Fabrika, M., Nagel, T. A., and Reyer, C. P. O.: Forest disturbances under climate change, Nat. Clim. Change, 7, 395–402, https://doi.org/10.1038/nclimate33 03, 2017.
Senf, C., Pflugmacher, D., Zhiqiang, Y., Sebald, J., Knorn, J., Neumann, M., Hostert, P., and Seidl, R.: Canopy mortality has doubled in Europe's temperate forests over the last three decades, Nat. Commun., 9, 4978, https://doi.org/10.1038/s41467-018-07539-6, 2018.
Shamin, S. I., Buhonova, L. K., and Sanina, A. T.: Database of hazardous and unfavourable hydrometeorological events that did damage to the economy and population of the Russian Federation, available at: http://meteo.ru/english/climate/weather_and_hazards.php (last access: 15 December 2020), 2019.
Skvortsova, E. B., Ulanova, N. G., and Basevich, V. F.: The ecological role of windthrow, Moscow, 1983 (in Russian).
Shikhov, A. N. and Chernokulsky, A. V.: A satellite-derived climatology of unreported tornadoes in forested regions of northeast Europe, Remote Sens. Environ., 204, 553–567, https://doi.org/10.1016/j.rse.2017.10.002, 2018.
Shikhov, A., Chernokulsky, A., Azhigov, I., and Semakina, A.: A satellite-derived database for stand-replacing windthrow events in boreal forests of European Russia in 1986–2017, figshare, Dataset, https://doi.org/10.6084/m9.figshare.12073278.v6, 2020.
Shikhov, A. N., Chernokulsky, A. V., Sprygin, A. A., and Azhigov, I. O.: Identification of mesoscale convective cloud systems with tornadoes using satellite data, Sovremennye problemy distantsionnogo zondirovaniya Zemli iz kosmosa, 16, 223–236, https://doi.org/10.21046/2070-7401-2019-16-1-223-236, 2019a.
Shikhov, A. N., Perminova E. S., and Perminov S. I.: Satellite-based analysis of the spatial patterns of fire and storm-related forest disturbances in the Ural region, Russia, Natural Hazards, 97, 283–308, https://doi.org/10.1007/s11069-019-03642-z, 2019b.
Shikhov A. N. and Zaripov A. S.: Long-term dynamics of fire- and wind-related forest losses in northeast European Russia from satellite data, Sovremennye problemy distantsionnogo zondirovaniya Zemli iz kosmosa, 15, 114–128, https://doi.org/10.21046/2070-7401-2018-15-7-114-128, 2018 (in Russian).
Sun, B., Groisman, P. Y., and Mokhov I. I.: Recent Changes in Cloud-Type Frequency and Inferred Increases in Convection over the United States and the Former USSR, J. Climate, 14, 1864–1880, https://doi.org/10.1175/1520-0442(2001)014<1864:RCICTF>2.0.CO;2, 2001.
Suvanto, S., Henttonen, H. M., Nöjd, P., and Mäkinen, H.: Forest susceptibility to storm damage is affected by similar factors regardless of storm type: Comparison of thunder storms and autumn extra-tropical cyclones in Finland, Forest Ecol. Manage., 381, 17–28, https://doi.org/10.1016/j.foreco.2016.09.005, 2016.
Taszarek, M., Brooks, H. E., Czernecki, B., Szuster, P., and Fortuniak, K.: Climatological Aspects of Convective Parameters over Europe: A Comparison of ERA-Interim and Sounding Data, J. Climate, 31, 4281–4308, https://doi.org/10.1175/JCLI-D-17-0596.1, 2018.
Taszarek, M., Pilguj, N., Orlikowski, J., Surowiecki, A., Walczakiewicz, S., Pilorz, W., Piasecki, K., Pajurek, L., and Półrolniczak, M.: Derecho evolving from a Mesocyclone-A Study of 11 August 2017 severe weather outbreak in Poland: Event analysis and high-resolution simulation, Mon. Weather Rev., 147, 2283–2306, https://doi.org/10.1175/MWR-D-18-0330.1, 2019.
Ulanova, N. G.: The effects of windthrow on forests at different spatial scales: a review, Forest Ecol. Manage., 135, 155–167, https://doi.org/10.1016/S0378-1127(00)00307-8, 2000.
Usbeck, T., Wohlgemuth, T., Dobbertin, M., Pfister, C., Bürgi, A., and Rebetez, M.: Increasing storm damage to forests in Switzerland from 1858 to 2007, Agr. Forest Meteorol., 150, 47–55, https://doi.org/10.1016/j.agrformet.2009.08.010, 2010.
USGS: Landsat Collection 1, U.S. Geological Survey, available at: https://www.usgs.gov/land-resources/nli/landsat/landsat-collection-1?qt-science_support_page_related_con=1{#}qt-science_support_page_related_con (last access: 2 April 2020), 2019.
van Lierop, P., Lindquist, E., Sathyapala, S., and Franceschini, G.: Global forest area disturbance from fire, insect pests, diseases and severe weather events, Forest Ecol. Manage., 352, 78–88, https://doi.org/10.1016/j.foreco.2015.06.010, 2015.
Wang, F., and Xu, Y. J.: Comparison of remote sensing change detection techniques for assessing hurricane damage to forests, Environ. Monitor. Assess., 162, 311–326, https://doi.org/10.1007/s10661-009-0798-8, 2010.
Wang, W., Qu, J. J., Hao, X., Liu, Y., and Stanturf, J. A.: Post-hurricane Forest damage assessment using satellite remote sensing, Agr. Forest. Meteorol., 150, 122–132, https://doi.org/10.1016/j.agrformet.2009.09.009, 2010.
Westerling, A. L.: Increasing western US forest wildfire activity: Sensitivity to changes in the timing of spring, Philos. T. Roy. Soc. B, 371, 20150178, https://doi.org/10.1098/rstb.2015.0178, 2016.
Wulder, M. A., Masek, J. G., Cohen, W. B., Loveland, T. R., and Woodcock, C. E.: Opening the archive: how free data has enabled the science and monitoring promise of Landsat, Remote Sens. Environ., 122, 2–10, https://doi.org/10.1016/j.rse.2012.01.010, 2012.
WWF: Russia's Boreal Forests, Forest Area Key Facts & Carbon Emissions from Deforestation, available at: http://assets.panda.org/downloads/russia_forest_cc_final_13nov07.pdf (last access: 3 April 2020), 2007.
Ye, H., Fetzer, E. J., Wong, S., and Lambrigtsen, B. H.: Rapid decadal convective precipitation increase over Eurasia during the last three decades of the 20th century, Sci. Adv., 3, e1600944, https://doi.org/10.1126/sciadv.1600944, 2017.
Trends were computed with the Theil–Sen estimator. Significance was obtained with the nonparametric Mann–Kendall test.
- Abstract
- Introduction
- Region and data
- Structure of the GIS database
- Methods: windthrow delineation and parameter determination
- Results and discussion
- Data and method limitations
- Data availability
- Conclusions
- Author contributions
- Competing interests
- Acknowledgements
- Financial support
- Review statement
- References