the Creative Commons Attribution 4.0 License.
the Creative Commons Attribution 4.0 License.
 | 11 Dec 2020
Deep-sea sediments of the global ocean
Although the deep-sea floor accounts for approximately 60 % of Earth's surface, there has been little progress in relation to deriving maps of seafloor sediment distribution based on transparent, repeatable, and automated methods such as machine learning. A new digital map of the spatial distribution of seafloor lithologies below 500 m water depth is presented to address this shortcoming. The lithology map is accompanied by estimates of the probability of the most probable class, which may be interpreted as a spatially explicit measure of confidence in the predictions, and probabilities for the occurrence of five lithology classes (calcareous sediment, clay, diatom ooze, lithogenous sediment, and radiolarian ooze). These map products were derived by the application of the random-forest machine-learning algorithm to a homogenised dataset of seafloor lithology samples and global environmental predictor variables that were selected based on the current understanding of the controls on the spatial distribution of deep-sea sediments. It is expected that the map products are useful for various purposes including, but not limited to, teaching, management, spatial planning, design of marine protected areas, and as input for global spatial predictions of marine species distributions and seafloor sediment properties. The map products are available at https://doi.org/10.1594/PANGAEA.911692 (Diesing, 2020).
- Article
(12560 KB) - Full-text XML
- BibTeX
- EndNote


The deep-sea floor accounts for > 85 % of seafloor area (Harris et al., 2014) and > 60 % of Earth's surface. It acts as a receptor of the particle flux from the surface layers of the global ocean, is a place of biogeochemical cycling (Snelgrove et al., 2018), records environmental and climate conditions through time, and provides habitat for benthic organisms (Danovaro et al., 2014). Being able to map the spatial patterns of deep-sea sediments is therefore a major prerequisite for many studies addressing aspects of marine biogeochemistry, deep-sea ecology, and palaeoenvironmental reconstructions.
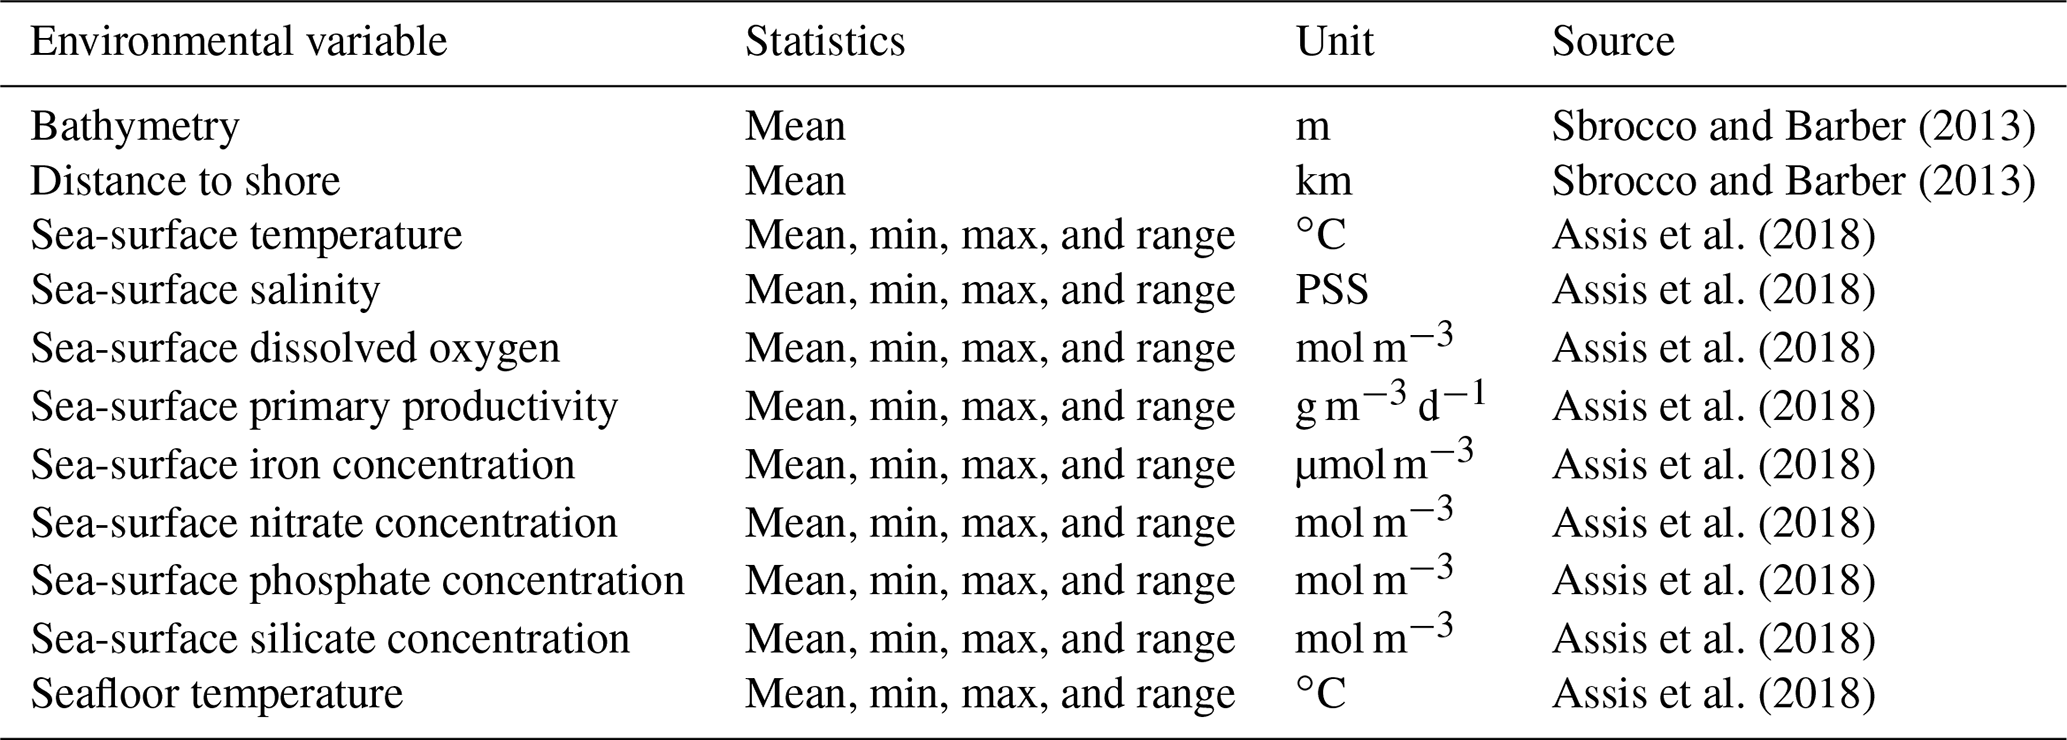
Table 1Environmental predictor variables tested in this study. PSS: practical salinity scale.
Until recently, maps of global deep-sea sediments were essentially variants of a hand-drawn map presented by Berger (1974) and typically depicted five to six sediment types, namely calcareous ooze, siliceous ooze (sometimes split into diatom ooze and radiolarian ooze), deep-sea (abyssal) clay, terrigenous sediment, and glacial sediment. Since then, Dutkiewicz et al. (2015) collated and homogenised approximately 14 500 samples from original cruise reports and interpolated them using a support vector machine algorithm (Cortes and Vapnik, 1995). Their map displayed the spatial distribution of 13 lithologies across the world ocean and exhibited some marked differences from earlier maps.
The controls on the distribution of deep-sea sediments have long been discussed (e.g. Seibold and Berger, 1996): biogenous oozes (> 30 % microscopic skeletal material by weight) dominate on the deep-sea floor, and their composition is controlled by productivity in overlying surface ocean waters, dissolution during sinking, and sedimentation and dilution with other materials. The ocean is undersaturated with silica. Preservation of siliceous shells is therefore a function of shell thickness, sinking time (water depth), and water temperature, as siliceous shells dissolve slower in colder water. The dissolution of calcareous shells is increased with increasing pressure (water depth) and CO2 content of the water (decreasing temperature). The water depth at which the rate of supply with calcium carbonate to the seafloor equals the rate of dissolution (calcite compensation depth; CCD) varies across ocean basins. Deep-sea clays dominate in the deepest parts of ocean basins below the CCD. Deposition of terrigenous material is thought to be a function of proximity to land (distance to shore).
Dutkiewicz et al. (2016) investigated the bathymetric and oceanographic controls on the distribution of deep-sea sediments with a quantitative machine-learning approach. The influence of temperature, salinity, dissolved oxygen, productivity, nitrate, phosphate, silicate at the sea surface, and bathymetry on lithogenous sediment, clay, calcareous sediment, radiolarian ooze, and diatom ooze were quantified. They found that bathymetry, sea-surface temperature, and sea-surface salinity had the largest control on the distribution of deep-sea sediments. Calcareous and siliceous oozes were not linked to high surface productivity according to their analysis. Diatom and radiolarian oozes were associated with low sea-surface salinities and discrete sea-surface temperature ranges.
The aim of this study is to derive a map of deep-sea sediments of the global ocean by utilising environmental predictor variables for the development and application of a machine-learning spatial-prediction model. Besides a categorical map giving the spatial representation of seafloor types in the deep sea, probability surfaces for individual sediment classes and a map displaying the probability of the most probable class in the final prediction will also be provided.
2.1 Predictor variables
The initial choice of the predictor variables was informed by the current understanding of the controls on the distribution of deep-sea sediments and the availability of data with full coverage of the deep sea at a reasonable resolution. We not only chose predictor variables mentioned above but also included sea-surface iron concentration, which was not available to Dutkiewicz et al. (2016) but which is an important nutrient for phytoplankton (Table 1). The predictor variable raster layers from Bio-ORACLE (ocean rasters for analysis of climate and environment; Assis et al., 2018; Tyberghein et al., 2012) and MARSPEC (ocean climate layers for marine spatial ecology, http://www.marspec.org/, last access: 10 December 2020; Sbrocco and Barber, 2013) were utilised. Whenever available, statistics of the variable other than mean were downloaded. These included the minimum, maximum, and range (maximum minus minimum).
2.2 Response variable
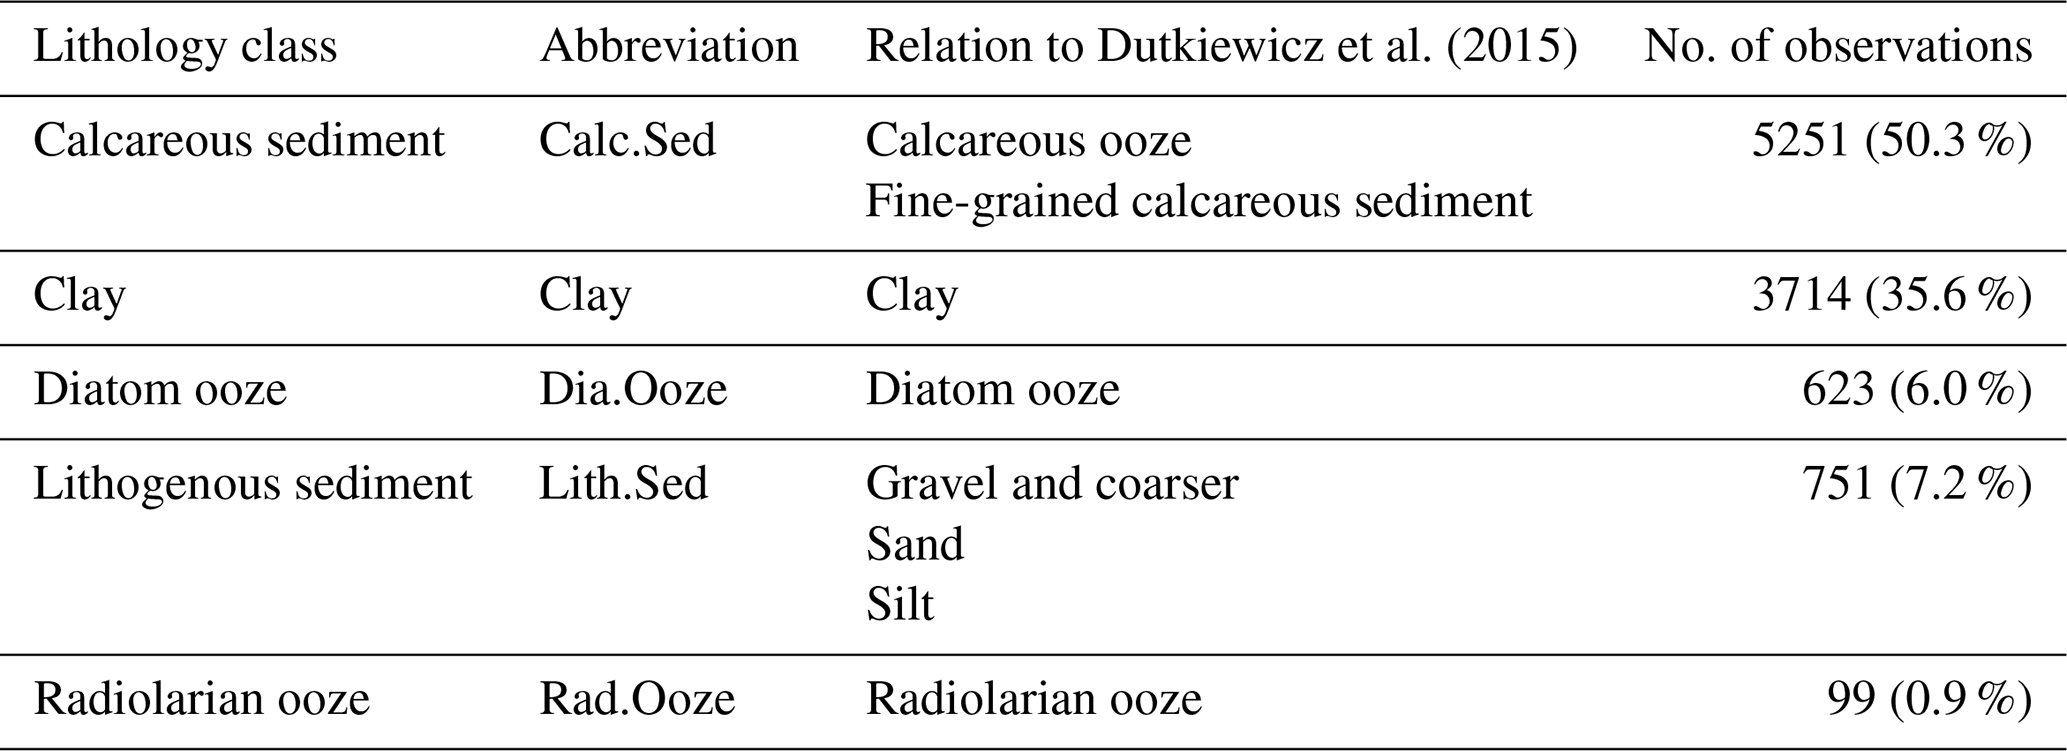
The response variable is seafloor lithology, a qualitative multinomial variable. The seafloor sediment sample data (seafloor_data.npz) from Dutkiewicz et al. (2015) were downloaded from ftp://ftp.earthbyte.org/papers/ Dutkiewicz_etal_seafloor_lithology/iPython_notebook_and_input_data/ (last access: 7 December 2020). The original dataset consisted of 13 seafloor lithology classes, while Dutkiewicz et al. (2016) simplified these to five major classes. The latter scheme was chosen here (Table 2), as the five major classes agree well with lithologies typically depicted in hand-drawn maps. For a detailed description of the original lithology classes, refer to GSA (Geological Society of America) Data Repository 2015271 (https://doi.org/10.1130/2015271, last access: 7 December 2020).
Table 2Seafloor lithology classes used in this study, their abbreviations, their relationships to classes in Dutkiewicz et al. (2015) and the number and percentage of samples. Not included are ash and volcanic sand or gravel, mixed calcareous–siliceous ooze, siliceous mud, sponge spicules, and shells and coral fragments of the original classification.
The general workflow for building a predictive spatial model was outlined by Guisan and Zimmermann (2000). This involves five main steps: (1) development of a conceptual model, (2) statistical formulation of the predictive model, (3) calibration (training) of the model, (4) model predictions, and (5) evaluation of the model results (accuracy assessment). The conceptual model was already presented in the Introduction. The remaining steps are described in the following sections. The analysis was performed in R 3.6.1 (R Core Team, 2018) and RStudio 1.2.1335 and is documented as an executable research compendium (ERC), see Sect. 8.
3.1 Data pre-processing
The raster layers (predictor variables) were stacked, limited to water depths below 500 m, projected to a Wagner IV global equal-area projection with a pixel resolution of 10 km × 10 km, and scaled.
The sample data (response variable) were pre-processed in the following way: only samples of the five major lithologies (Table 2) deeper than 500 m were used, and duplicates were removed from the original sample dataset. The number of records was therefore reduced from 14 400 to 10 438. The data were projected to a Wagner IV projection. Locations of the sample locations and their respective lithology class are shown in Fig. 1. Predictor variable values were extracted for every sample location. The class frequencies are shown in Table 2.
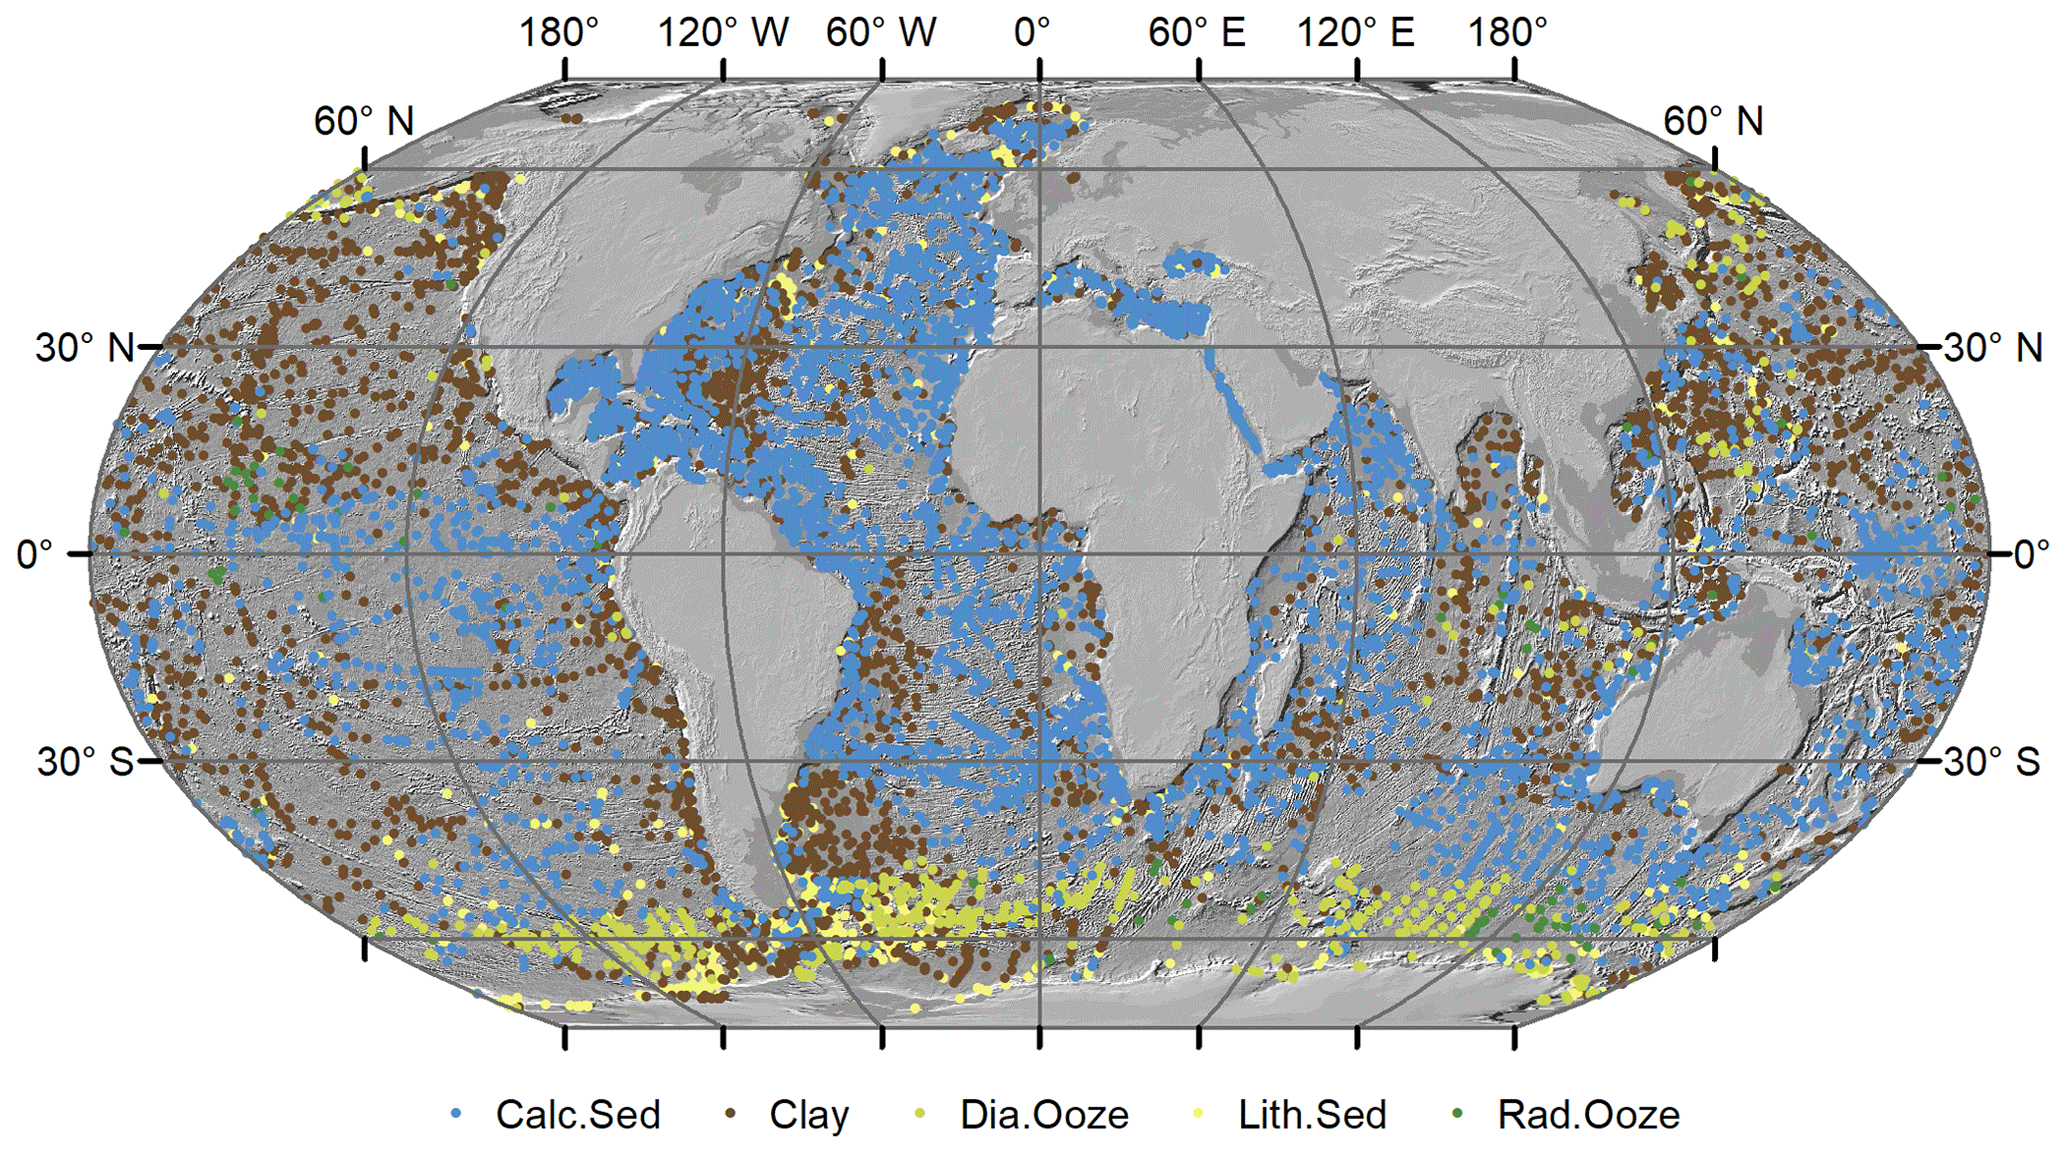
Figure 1Locations of samples used in this study based on data from Dutkiewicz et al. (2015). Land masses are derived from ESRI (2010). Hillshade topography is derived from GEBCO (2015).
3.2 Predictor variable selection
Variable selection reduces the number of predictor variables to a subset that is relevant to the problem. The aims of variable selection are threefold: (1) to improve the prediction performance, (2) to enable faster predictions, and (3) to increase the interpretability of the model (Guyon and Elisseeff, 2003). It is generally advisable to reduce high-dimension datasets to uncorrelated important variables (Millard and Richardson, 2015). Here, a two-step approach was utilised to achieve this goal. The first step identifies those variables that are relevant to the problem. The second step minimises redundancy in the remaining predictor variables.
Initially, the Boruta variable selection wrapper algorithm (Kursa and Rudnicki, 2010) was employed to identify all potentially important predictor variables. Wrapper algorithms identify relevant features by performing multiple runs of predictive models, testing the performance of different subsets (Guyon and Elisseeff, 2003). The Boruta algorithm creates so-called shadow variables by copying and randomising predictor variables. Variable importance scores for predictor and shadow variables are subsequently computed with the random-forest algorithm (see below). The maximum-importance score among the shadow variables (MZSA) is determined, and for every predictor variable, a two-sided test of equality is performed with the MZSA. Predictor variables that have a variable importance score significantly higher than the MZSA are deemed important, while those with a variable importance score significantly lower than the MZSA are deemed unimportant. Tentative variables have a variable importance score that is not significantly different from the MZSA. Increasing the maximum number of iterations (maxRuns) might resolve tentative variables (Kursa and Rudnicki, 2010). Only important variables were retained for further analysis.
The Boruta algorithm is an “all-relevant” feature selection method (Nilsson et al., 2007), which identifies all predictors that might be relevant for classification (Kursa and Rudnicki, 2010). It does not address the question of redundancy in the predictor variable data, which would be required for “minimal-optimal” feature selection (Nilsson et al., 2007) usually preferred for model building. To limit redundancy, a second step seeks to identify predictor variables that are correlated with other predictors of higher importance. To achieve this, the Boruta importance score was used to rank the remaining predictor variables. Beginning with the most important variable, correlated variables with lower importance were subsequently removed. Values of the correlation coefficient r were trialled between 0.1 and 1 with a step size of 0.01 to find an appropriate r value that strikes a balance between prediction performance and model interpretability.
3.3 Environmental space
It is generally preferable to apply a suitable sampling design for model calibration and evaluation. This would ensure that the environmental variable space is sampled in a representative way. Various methods have been proposed to optimise sampling effort, including stratified random, generalised random tessellation stratified (Stevens and Olsen, 2003), and conditioned Latin hypercube sampling (Minasny and McBratney, 2006) among others. However, such approaches are not feasible here due to time and financial constraints. Instead, we utilised available (legacy) sampling data. It might nevertheless be prudent to assess to what extent the selected samples cover the environmental space of the predictor variables. This was achieved by creating a random subsample (n=10 000) of the selected environmental predictor variables and displaying the density distribution of the random subsample together with the density distribution of environmental variables based on the observations. This allows for a qualitative check to what degree the environmental space is sampled in a representative way.
3.4 Random-forest classification model
The random-forest (RF) prediction algorithm (Breiman, 2001) was chosen for the analysis due to its high predictive performance in a number of domains (Che Hasan et al., 2012; Cutler et al., 2007; Diesing et al., 2017; Diesing and Thorsnes, 2018; Huang et al., 2014; Prasad et al., 2006). The RF is an ensemble technique based on classification trees (Breiman, 1984). Randomness is introduced in two ways: by constructing each tree from a bootstrapped sample of the training data and by using a random subset of the predictor variables at each split in the tree-growing process. As a result, every tree in the forest is unique. By aggregating the predictions over a large number of uncorrelated trees, prediction variance is reduced and accuracy improved (James et al., 2013, p. 316). The “votes” for a specific class can be interpreted as a measure of probability for that class occurring in a specific location. The final prediction is determined by the class with the highest probability (vote count) to occur in a specific location. The “randomForest” package (Liaw and Wiener, 2002) was used to perform the analysis.
RF generally performs well with default settings, i.e. without the tuning of parameters. Initial tuning of the number of trees in the forest (ntree) and the number of variables to consider at any given split (mtry) showed a very limited impact on model performance, while at the same time the tuning process was very time-consuming. It was therefore decided to use the default parameter values.
The response variable is highly imbalanced (Table 2). This was accounted for by utilising a balanced version of RF (Chen et al., 2004). This is achieved by specifying the strata and sampsize arguments of the randomForest() function. The strata are the lithology classes, and the sample size is determined by c⋅nmin, where c is the number of lithology classes (seven) and nmin is the number of samples in the least frequent class. Hence, downsampling is applied when growing individual trees. However, each sample is drawn from all available observations, as many trees are grown, making this scheme likely more effective than downsampling the dataset prior to model building.
RF also provides a relative estimate of predictor variable importance. The importance() function of the randomForest package allows to assess variable importance as the mean decrease in either accuracy or node purity. However, the latter approach might be biased when predictor variables vary in their scale of measurement or their number of categories (Strobl et al., 2007) and was not used here. Variable importance is therefore measured as the mean decrease in accuracy associated with each variable when it is assigned random but realistic values and the rest of the variables are left unchanged. The worse a model performs when a predictor is randomised, the more important that predictor is in predicting the response variable. The mean decrease in accuracy was left unscaled as recommended by Strobl and Zeileis (2008) and is reported as a fraction ranging from 0 to 1. By default, individual trees of the forest are built using sampling with replacement (replace = TRUE). However, it has been shown that this choice might lead to bias in predictor variable importance measures (Strobl et al., 2007). It was therefore opted to use sampling without replacement.
3.5 Spatial cross-validation
Detailed guidelines for optimising sampling design for accuracy assessment have been developed (Olofsson et al., 2014; Stehman and Foody, 2019). However, this would require collecting new samples after modelling, which was not feasible given the geographic scope. Cross-validation schemes are frequently used to deal with such situations. It can be assumed that the response variable is spatially structured to some extent, and cross-validation therefore requires accounting for the spatial structure (Roberts et al., 2017). Here, a spatial leave-one-out cross-validation (S-LOO CV) scheme was applied. In a conventional LOO CV, a single observation is removed from the dataset, and all other observations (n−1) are used to train the model. The class of the withheld observation is then predicted using the n−1 model. This is repeated for every observation in the dataset, producing observed and predicted classes at every location. In a S-LOO CV scheme, a buffer is placed around the withheld observation, and training data from within this buffer are omitted from both model training and testing so that there are no training data proximal to the test. The S-LOO CV scheme used here was adapted from Misiuk et al. (2019). The buffer size was estimated with the spatialAutoRange() function of the “blockCV” package (Valavi et al., 2018).
3.6 Accuracy assessment
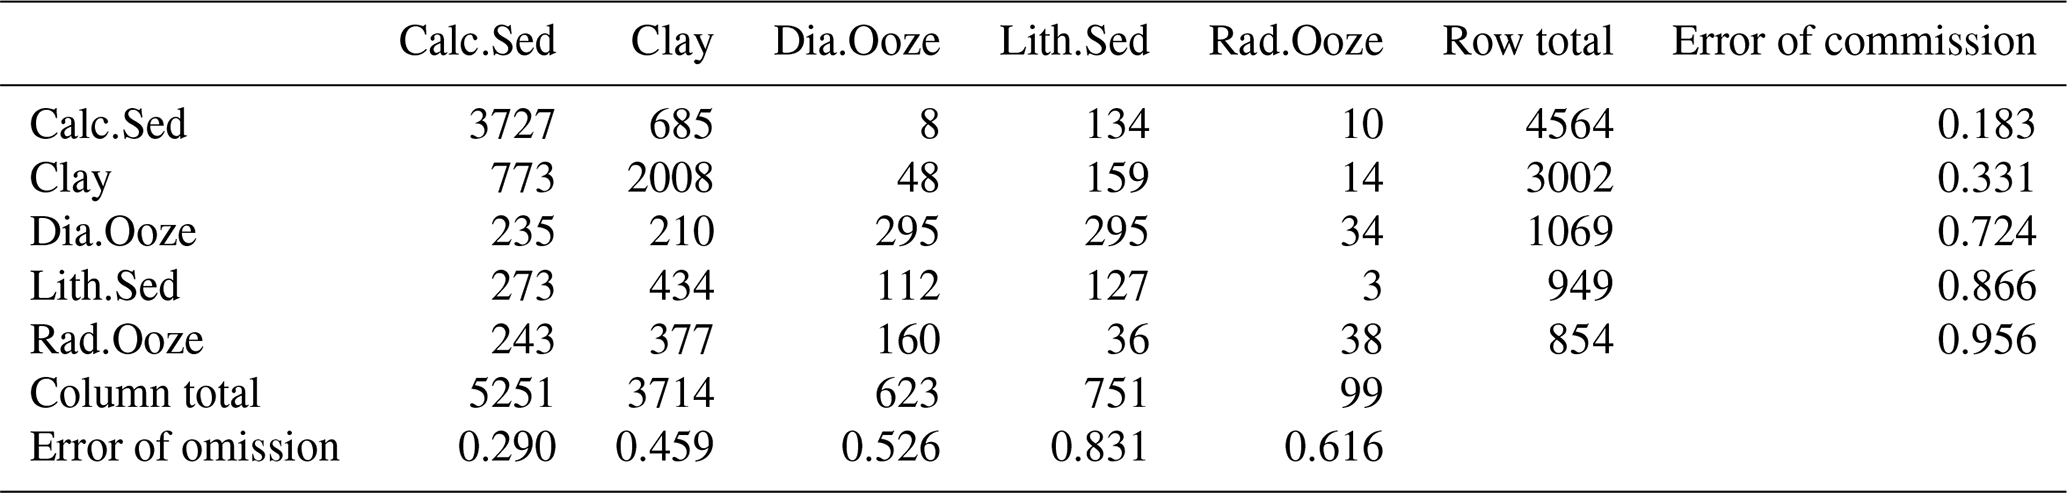
The accuracy of the model was assessed based on a confusion matrix that was derived by the S-LOO CV. Overall accuracy and the balanced error rate (BER) were used to evaluate the global accuracy of the model, while error of omission and error of commission were selected as class-specific metrics of accuracy. The overall accuracy gives the percentage of cases correctly allocated and is calculated by dividing the total number of correct allocations by the total number of samples (Congalton, 1991). The BER is the average of the error rate for each class (Luts et al., 2010). The error of omission is the number of incorrectly classified samples of one class divided by the total number of reference samples of that class. The error of commission is the number of incorrectly classified samples of one class divided by the total number of samples that were classified as that class (Story and Congalton, 1986). The overall accuracy, its 95 % confidence intervals, and a one-sided test to evaluate whether the overall accuracy was significantly higher than the no information rate (NIR) were calculated by applying the confusionMatrix() function of the “caret” package (Kuhn, 2008). The confidence interval is estimated using a binomial test. The NIR is taken to be the proportion of the most frequent class. Errors of omission and commission are not provided by the function but can be calculated from the confusion matrix. The BER was calculated with the BER() function of the package “measures” (Probst, 2018).
4.1 Variable selection
The Boruta algorithm was run with maxRuns = 500 iterations and a p value of 0.05, leaving no variables unresolved (i.e. tentative). All 38 predictor variables initially included in the model were deemed important according to the Boruta analysis (Fig. 2). Based on a plot of the RF out-of-bag (OOB) error estimates over the correlation coefficient r, a value of 0.5 was selected (Fig. 3). This selection ensured high model performance while at the same time minimising the number of predictor variables. Subsequent correlation analysis reduced the number of retained predictor variables to eight. These were bathymetry (MS_bathy_5m), distance to shore (MS_biogeo5_dist_shore_5m), sea-surface temperature range (BO2_temprange_ss), sea-surface maximum primary productivity (BO2_ppmax_ss), seafloor minimum temperature (BO2_tempmin_bdmean), sea-surface maximum salinity (BO2_salinitymax_ss), sea-surface salinity range (BO2_salinityrange_ss), and sea-surface minimum silicate (BO2_silicatemin_ss). The strongest correlation between the remaining predictor variables (Fig. 4) was found between bathymetry and seafloor minimum temperature (r=0.38), sea-surface maximum salinity and sea-surface minimum silicate (), and bathymetry and distance to shore (). Maps of the selected predictor variables are shown in Fig. A1.
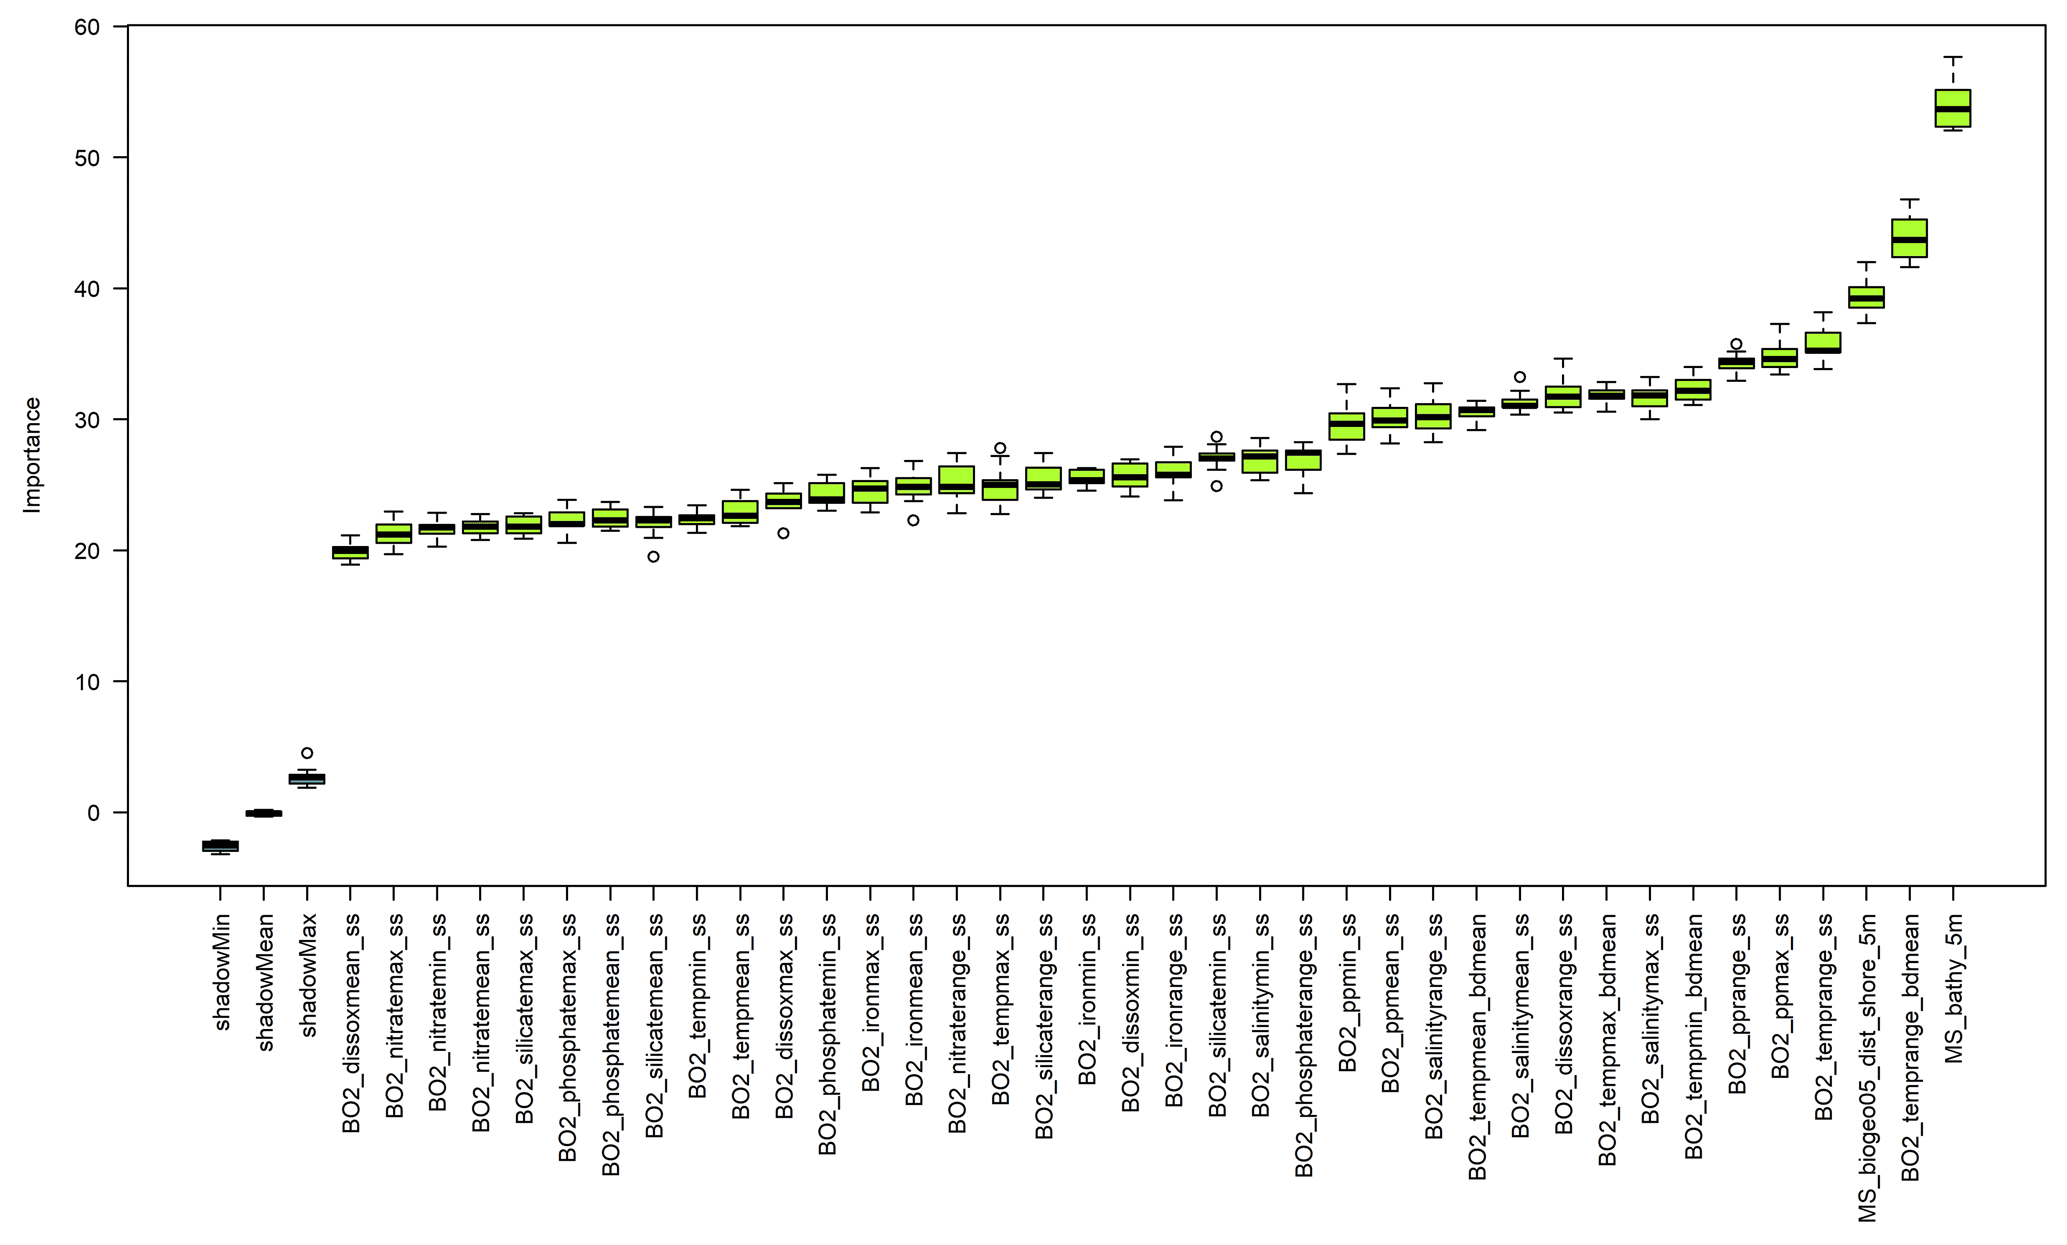
Figure 2Results of the Boruta variable selection process. All environmental predictor variables had an importance significantly higher than the shadow variables (shadowMin, shadowMean, and shadowMax).
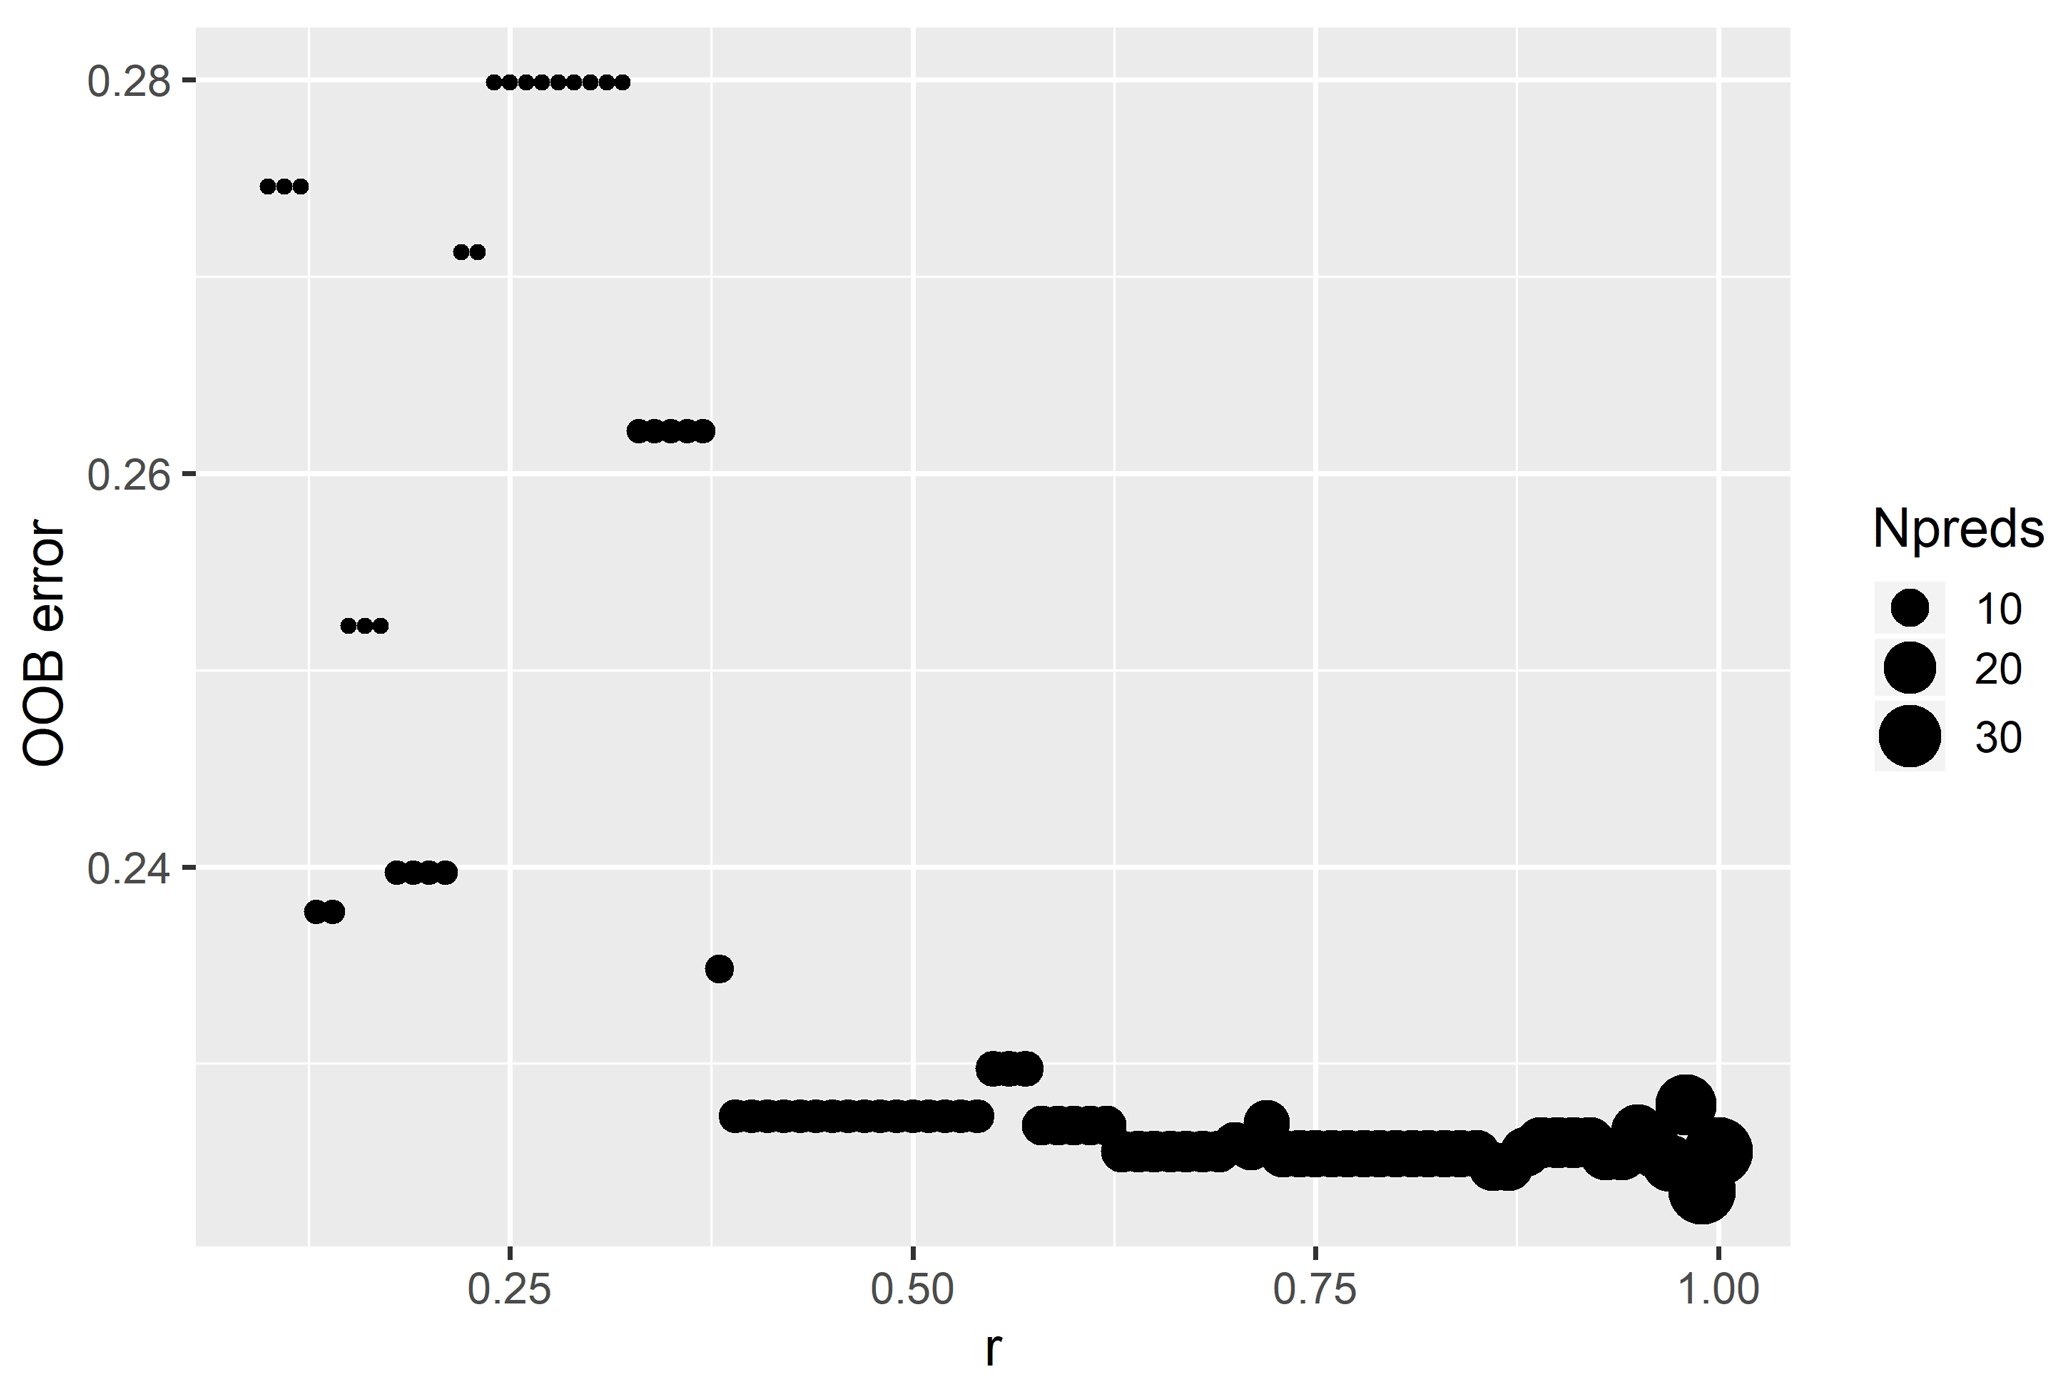
Figure 3Influence of r value on the out-of-bag error of a random-forest model with default parameters. The size of the circles indicates the number of selected predictor variables (Npreds).
4.2 Environmental space
The environmental space (Fig. 5) is generally sampled adequately, although there is a tendency for an overrepresentation of shallower water depths and areas closer to land. Sea-surface temperature range, sea-surface maximum primary productivity, seafloor minimum temperature, and sea-surface maximum salinity are all slightly biased towards higher values. Sea-surface salinity range and sea-surface minimum silicate are the environmental variables that are most closely represented by the samples.
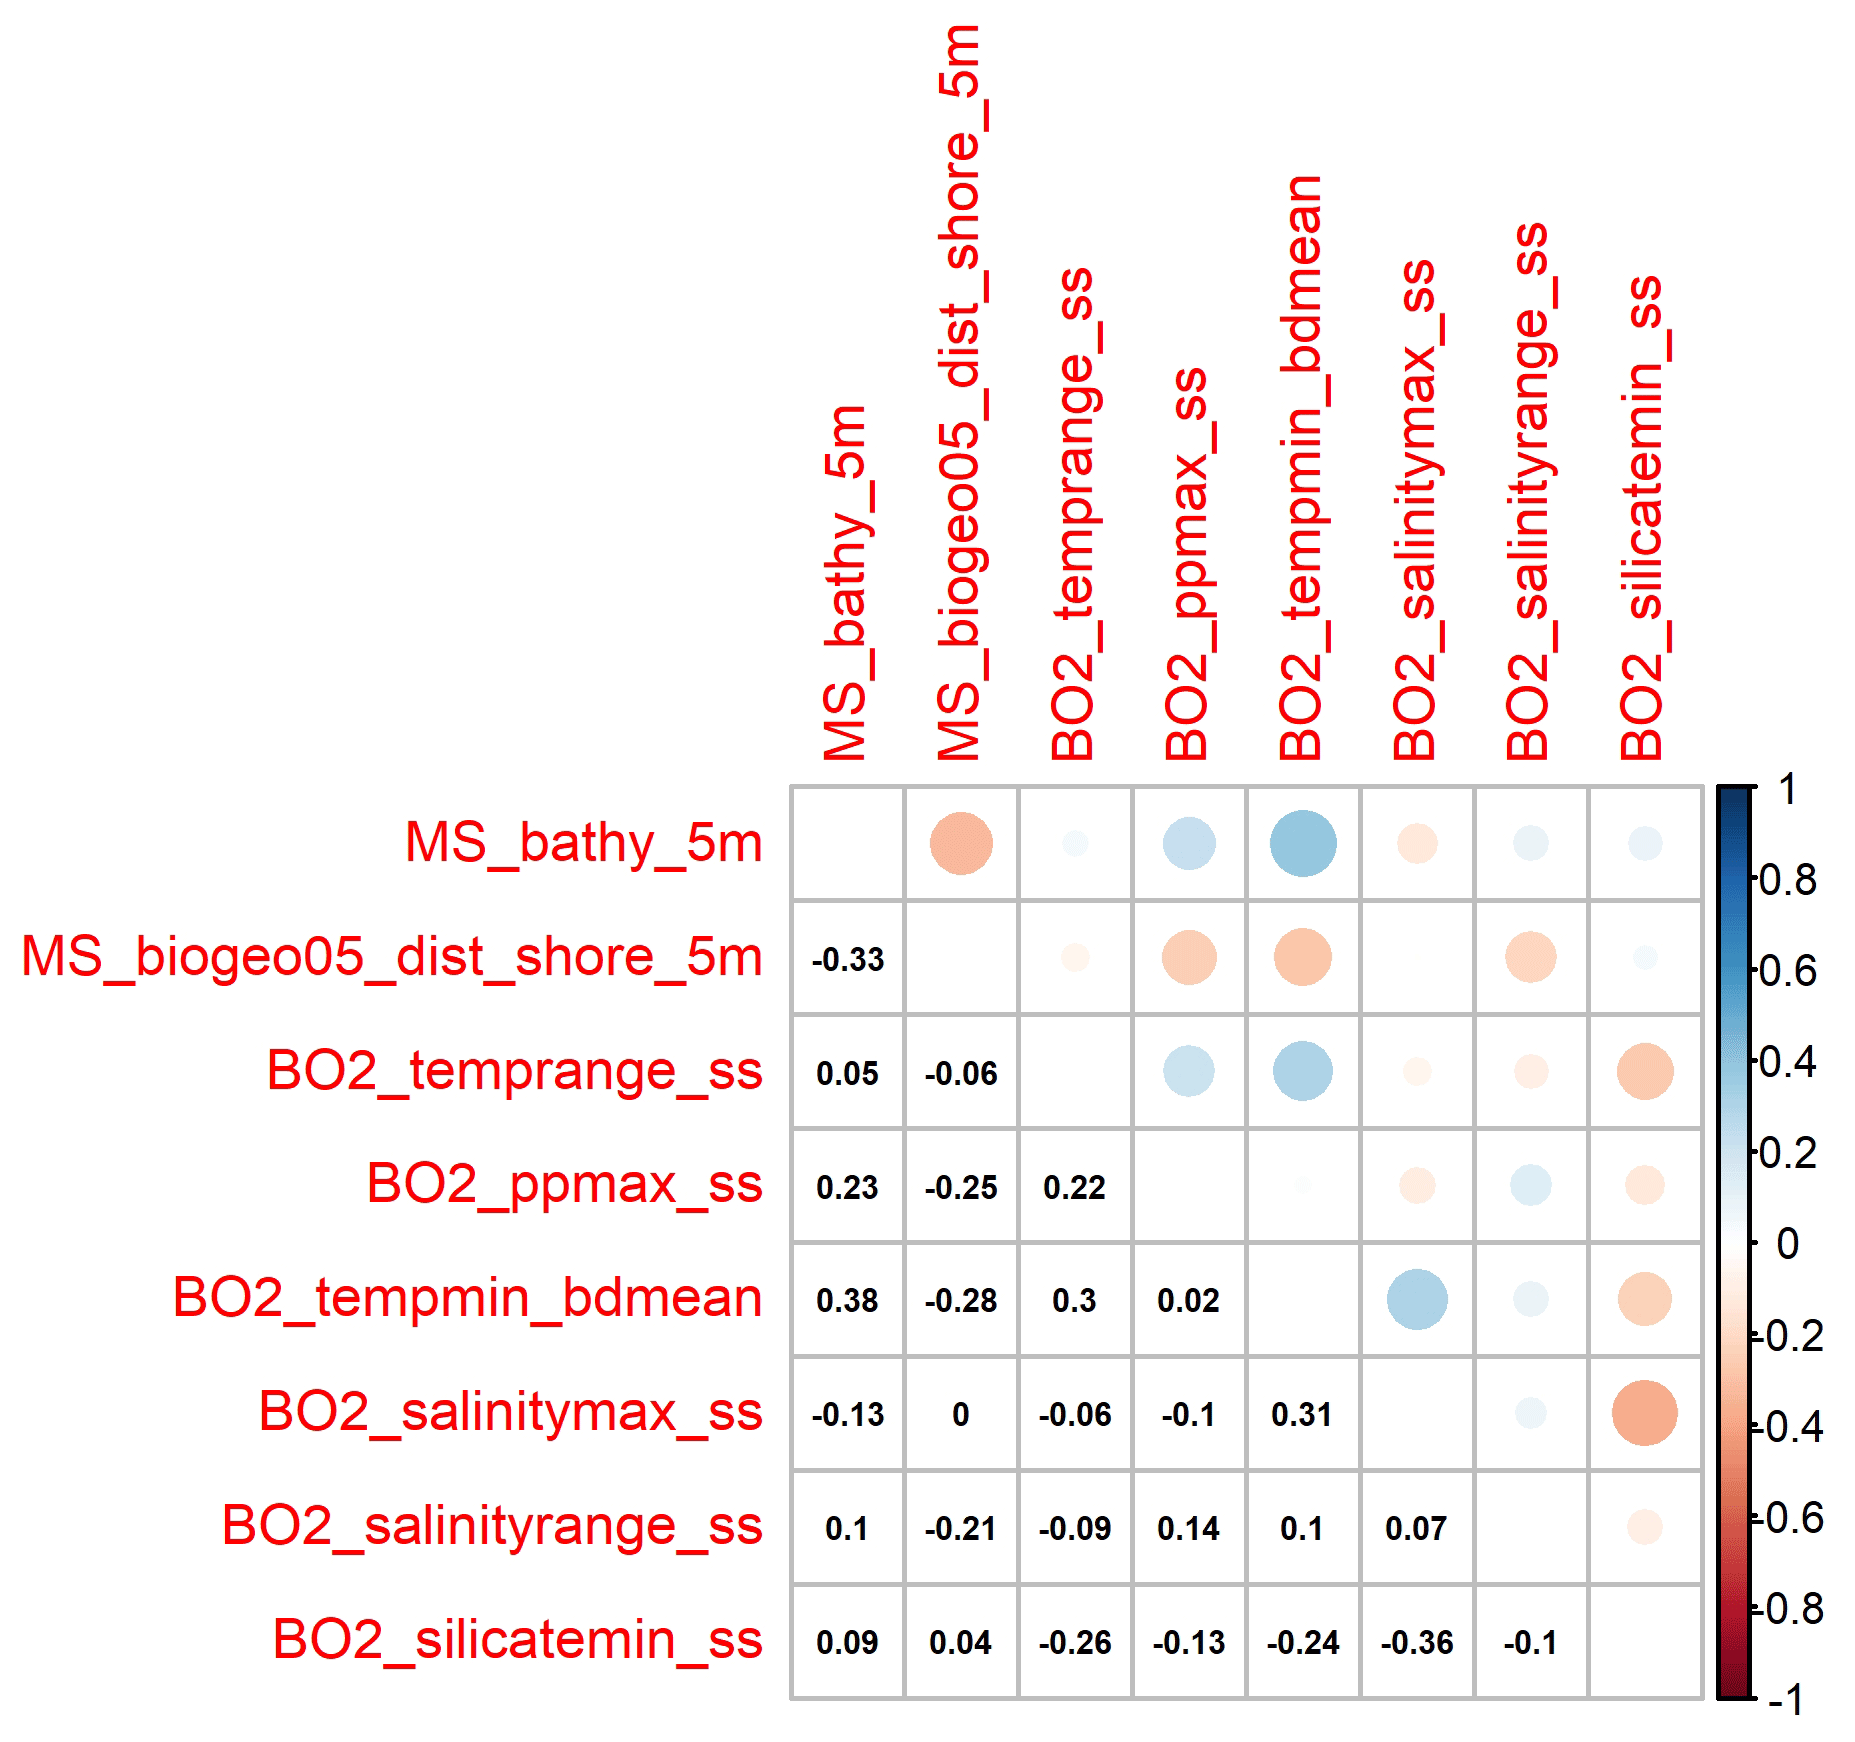
Figure 4Correlation plot showing the correlation coefficients of the selected predictor variables.
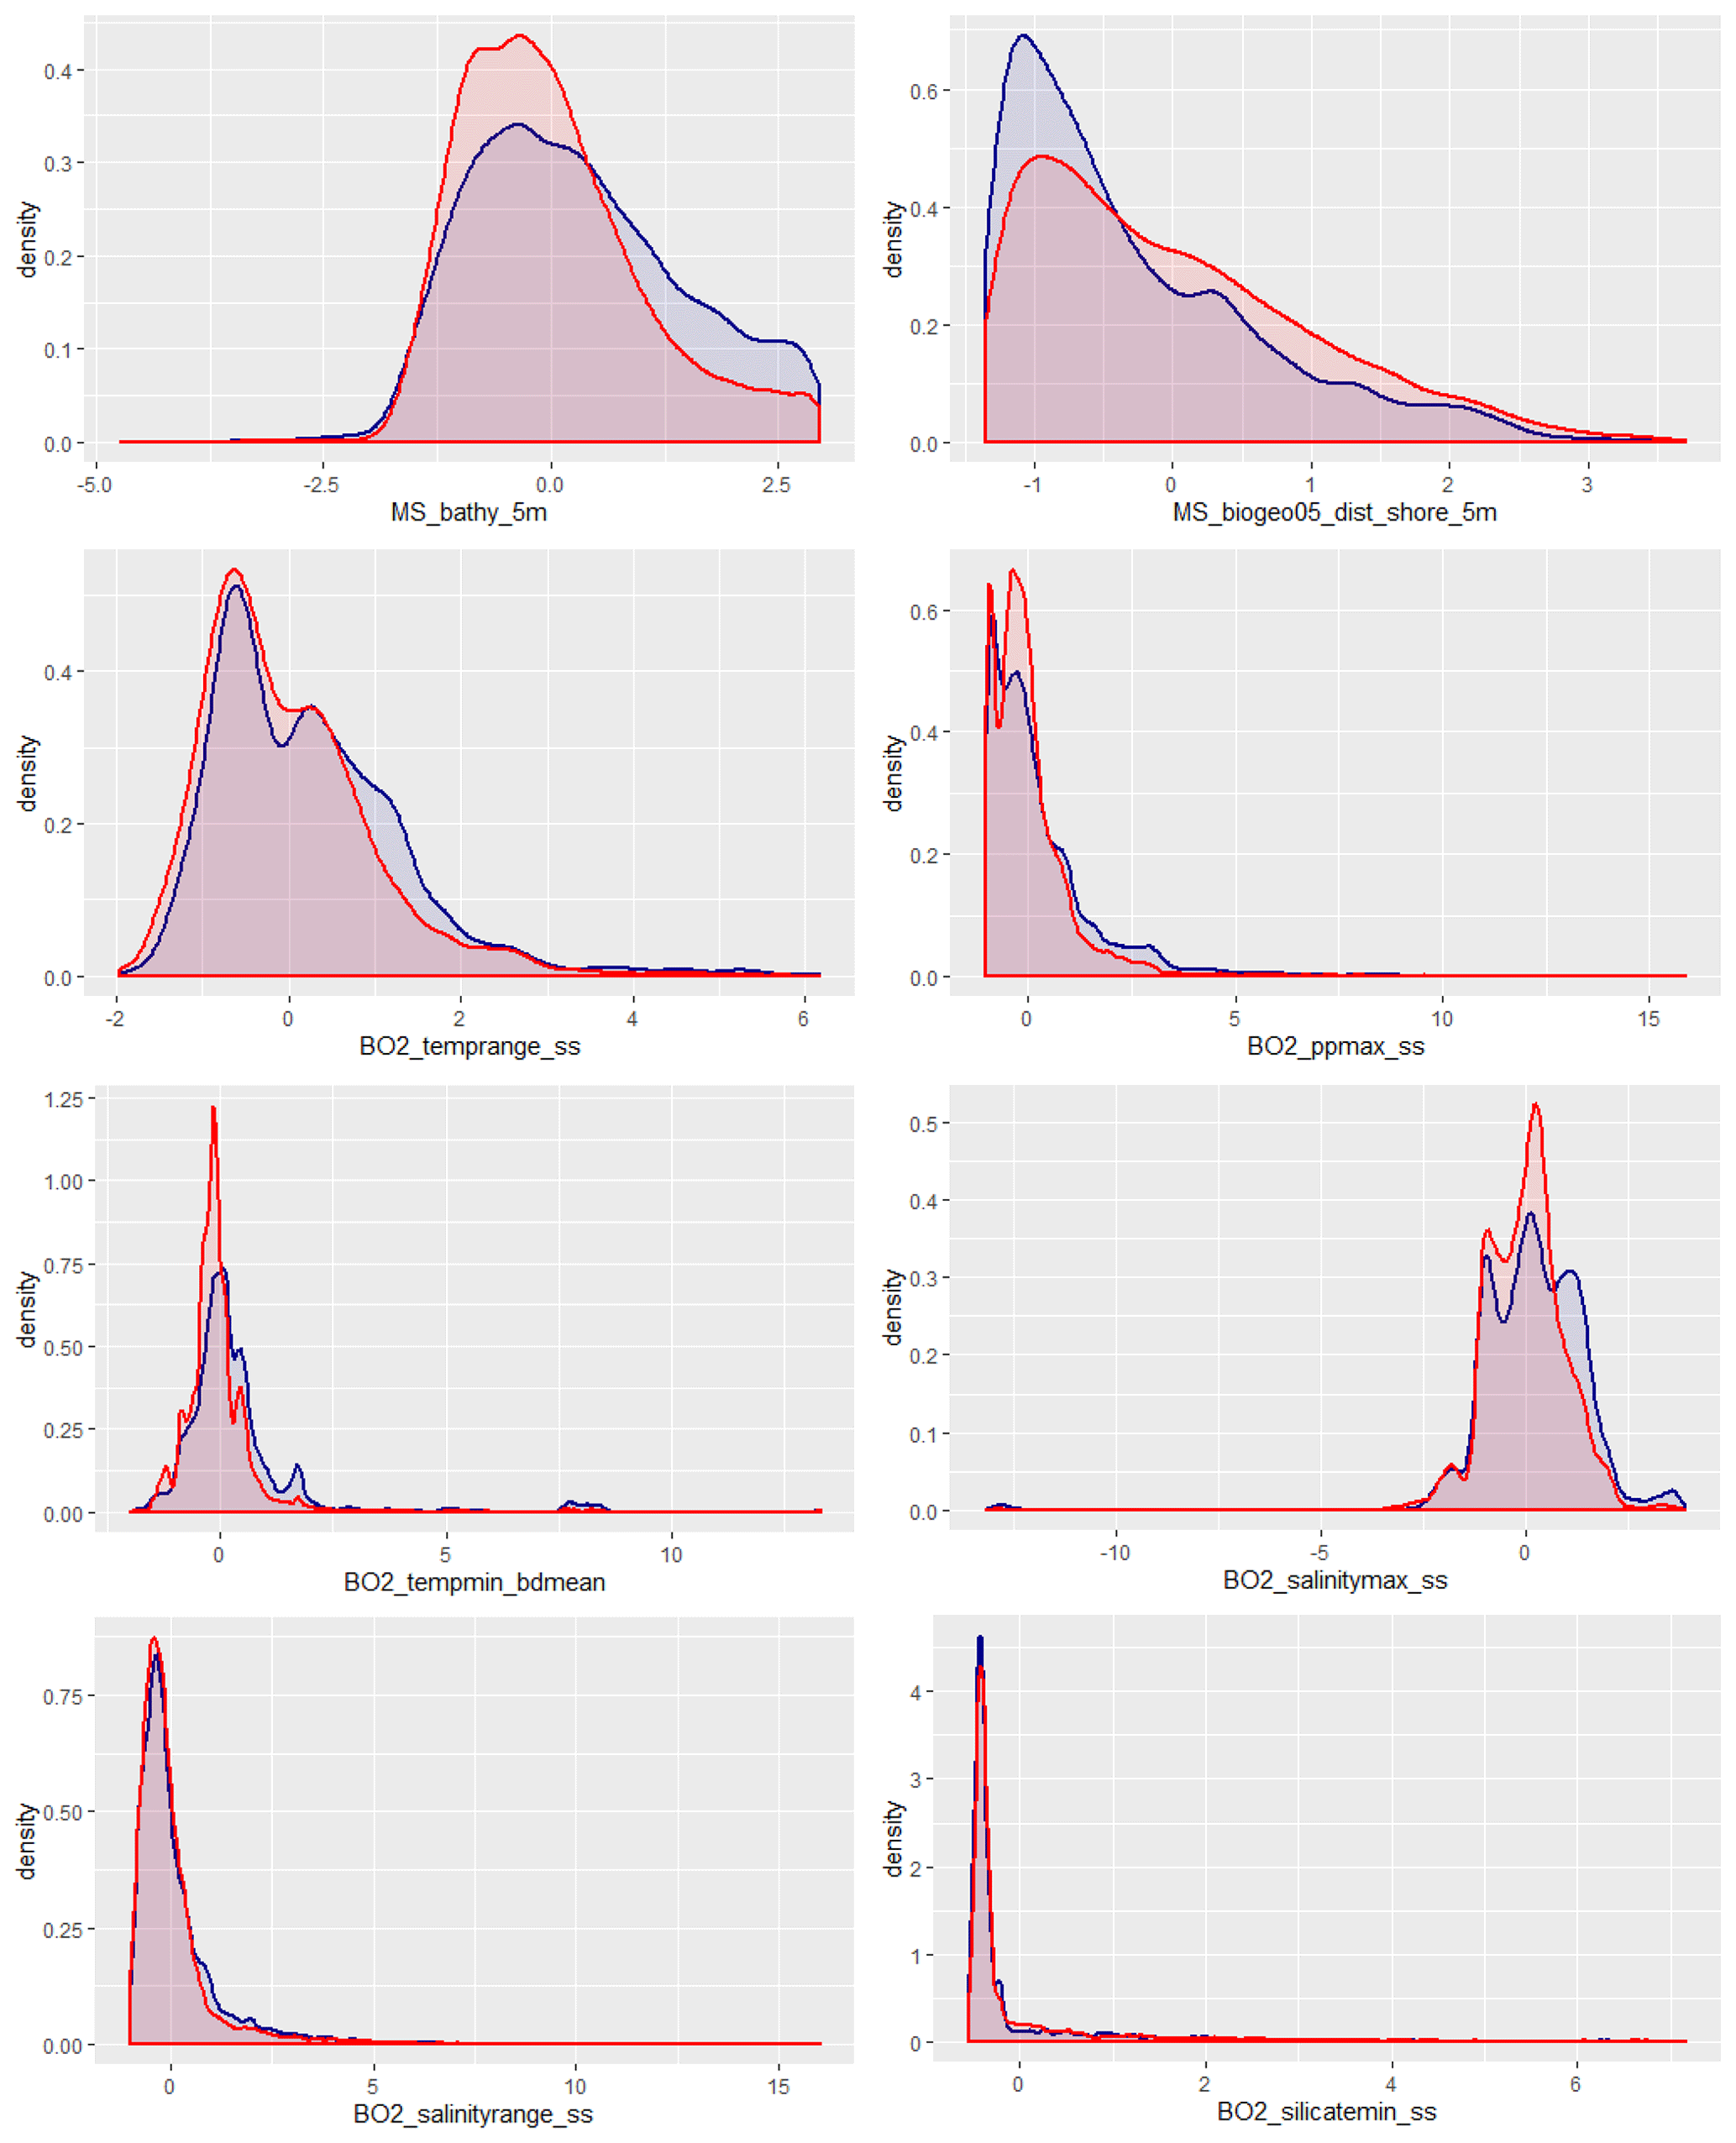
Figure 5A visual check to what extent the samples cover the environmental space. Blue: samples; red: environmental data.
4.3 Model accuracy
The confusion matrix based on the S-LOO CV is shown in Table 3. The overall accuracy of the model is 59.4 %, with 95 % confidence limits of 58.4 % and 60.3 %. This is significantly higher () than the NIR (50.3 %). The BER is 0.54. The two dominant classes, calcareous sediment and clay, have the lowest error of commission with 18.3 % and 33.1 %, respectively. Calcareous sediment is most frequently misclassified as clay and vice versa. All other classes have high errors of commission (>70 %). Errors of omission are slightly higher than those of commission for the frequently occurring lithologies calcareous sediment and clay, while lower for the rare classes diatom ooze, lithogenous sediment, and radiolarian ooze.
Table 3Confusion matrix. Observed (reference) classes are in columns; predicted classes are in rows.
4.4 Spatial distribution of deep-sea sediments
Probability surfaces of individual sediment classes with verbal descriptions of likelihood (Mastrandrea et al., 2011) based on the estimated probabilities are displayed in Fig. 6. For any given pixel on the map, the final lithology class is that one with the highest probability. The probability of the most probable class might be interpreted as a spatially explicit measure of map confidence. The resulting maps of the spatial distribution of deep-sea sediments and their associated confidence are shown in Fig. 7. Calcareous sediment and clay dominate throughout the Pacific, Atlantic, and Indian oceans, whereas clay occupies the deep basins and calcareous sediment is found in shallower parts of the ocean basins. In the Southern Ocean, seafloor sediments are arranged in a banded pattern around Antarctica, with lithogenous sediment forming an inner ring closest to land (Fig. A2). An outer ring of siliceous oozes (diatom ooze and radiolarian ooze) dominates in the Southern Ocean. The width of this “opal belt” (Lisitzin, 1971) varies, and in places, most notably south of South America, it is discontinuous. Overall, map confidence varies between 0.21 and 1. It is generally lower in the vicinity of class boundaries and higher in the geographic centre of a class.
Table 4Breakdown of areal coverage by lithology types in the global ocean below 500 m water depth.
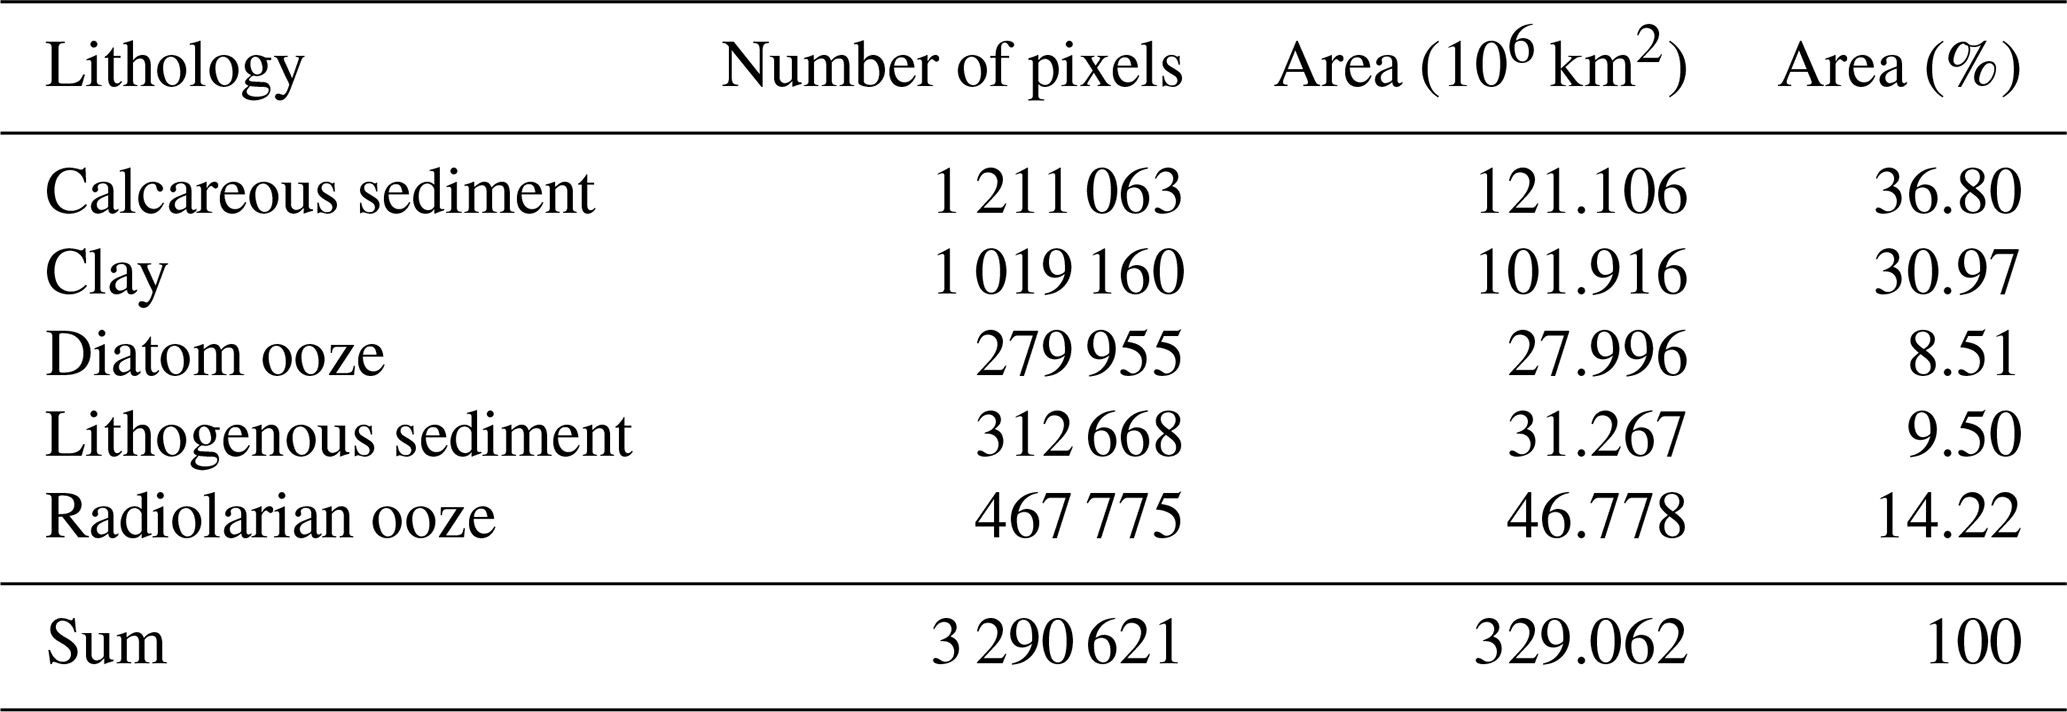
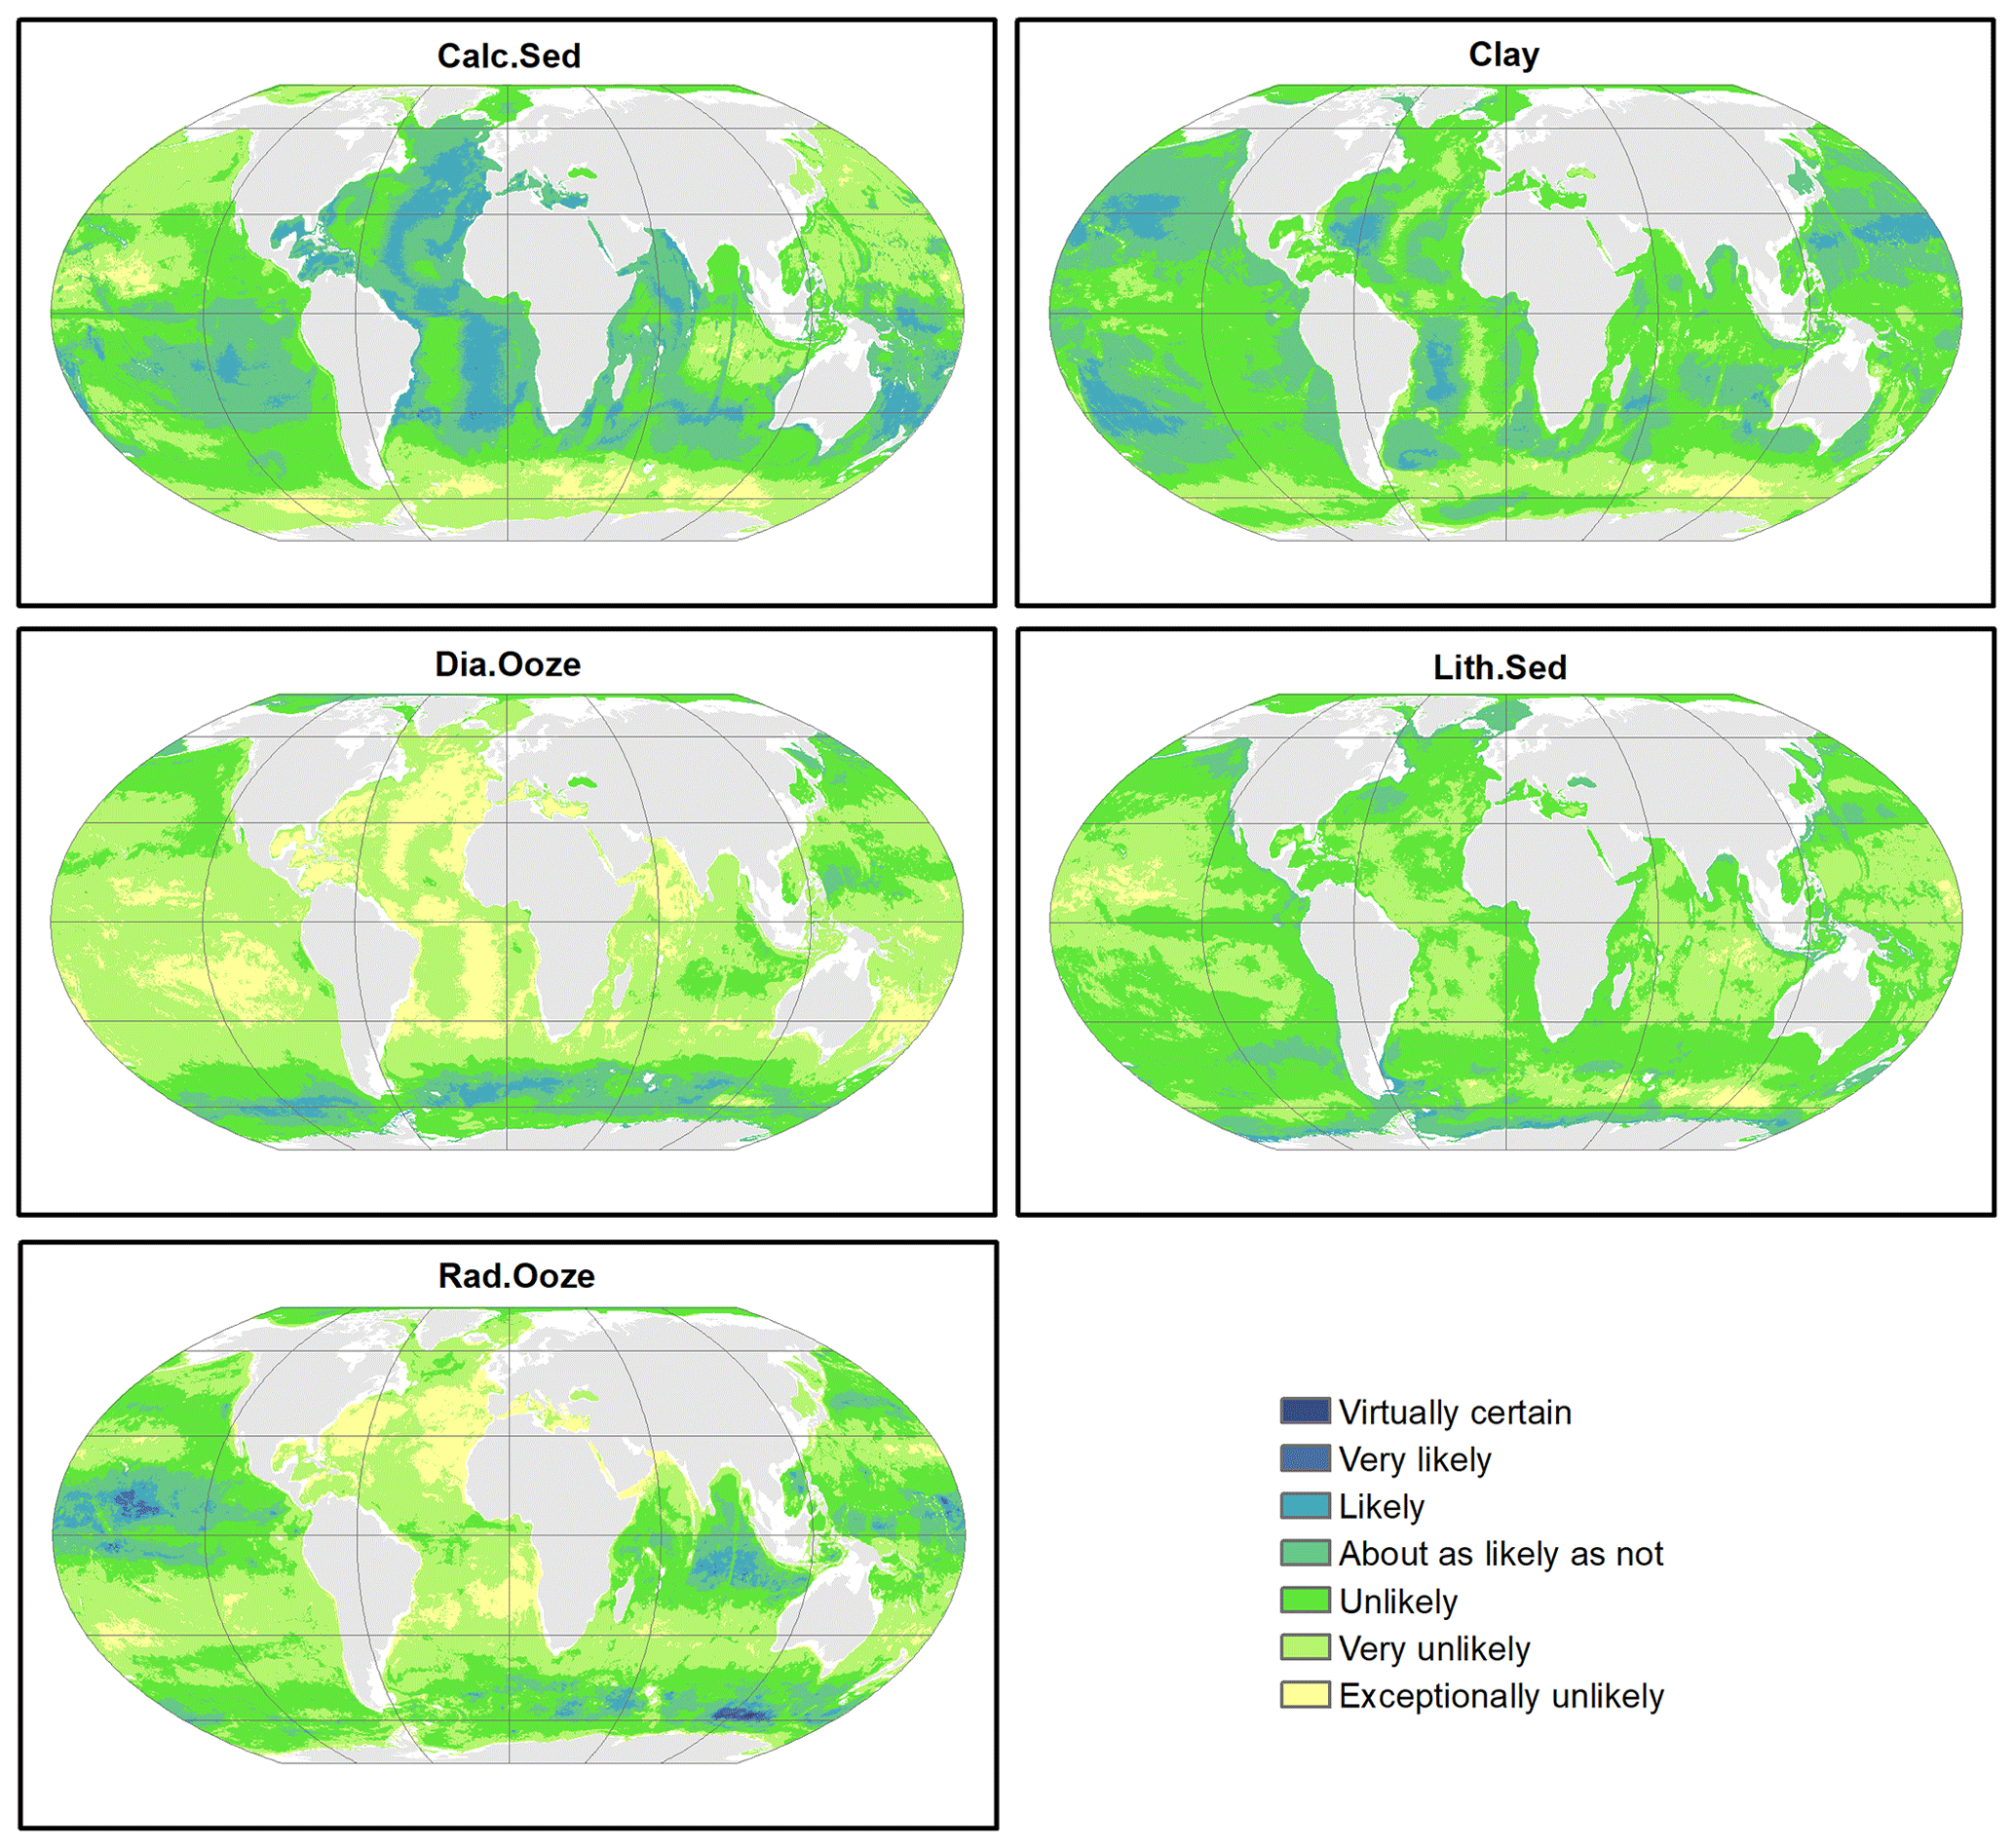
Figure 6Probability surfaces of the five predicted lithologies. The verbal likelihood scale is based on Mastrandrea et al. (2011). Land masses are derived from ESRI (2010).
The seafloor lithology map bears a notable resemblance with previously published hand-drawn maps (e.g. Berger, 1974). The general patterns are very similar, e.g. the distribution of calcareous sediment, clay, and diatom ooze in the major ocean basins. Patterns of radiolarian ooze in the Indian Ocean resemble those in Thurman (1997: Fig. 5-22). In the Pacific Ocean, radiolarian ooze is mapped widespread in the vicinity of the Equator, although not in the form of a narrow band as frequently depicted in hand-drawn maps (Berger, 1974; Thurman, 1997).
Based on the predicted distribution of lithology classes, calcareous sediments cover approximately 121×106 km2 of seabed below 500 m water depth, equivalent to 36.8 % of the total area (Table 4). Clays are the second most frequent lithology occupying 102×106 km2 (31.0 %). Diatom ooze, lithogenous sediment, and radiolarian ooze account for 8.5 %, 9.5 %, and 14.2 % of deep-sea floor, respectively.
4.5 Predictor variable importance
The three most important predictor variables were sea-surface maximum salinity, bathymetry, and seafloor maximum temperature with mean decreases in accuracy above 5 % (Fig. 8). These findings are similar to results from Dutkiewicz et al. (2016), who determined sea-surface salinity, sea-surface temperature, and bathymetry as the most important controls on the distribution of deep-sea sediments. Sea-surface minimum silicate was of medium importance (4.3 % decrease in accuracy), while sea-surface temperature range, sea-surface maximum primary productivity, distance to shore, and sea-surface salinity range were of lower importance (< 3 % decrease in accuracy).
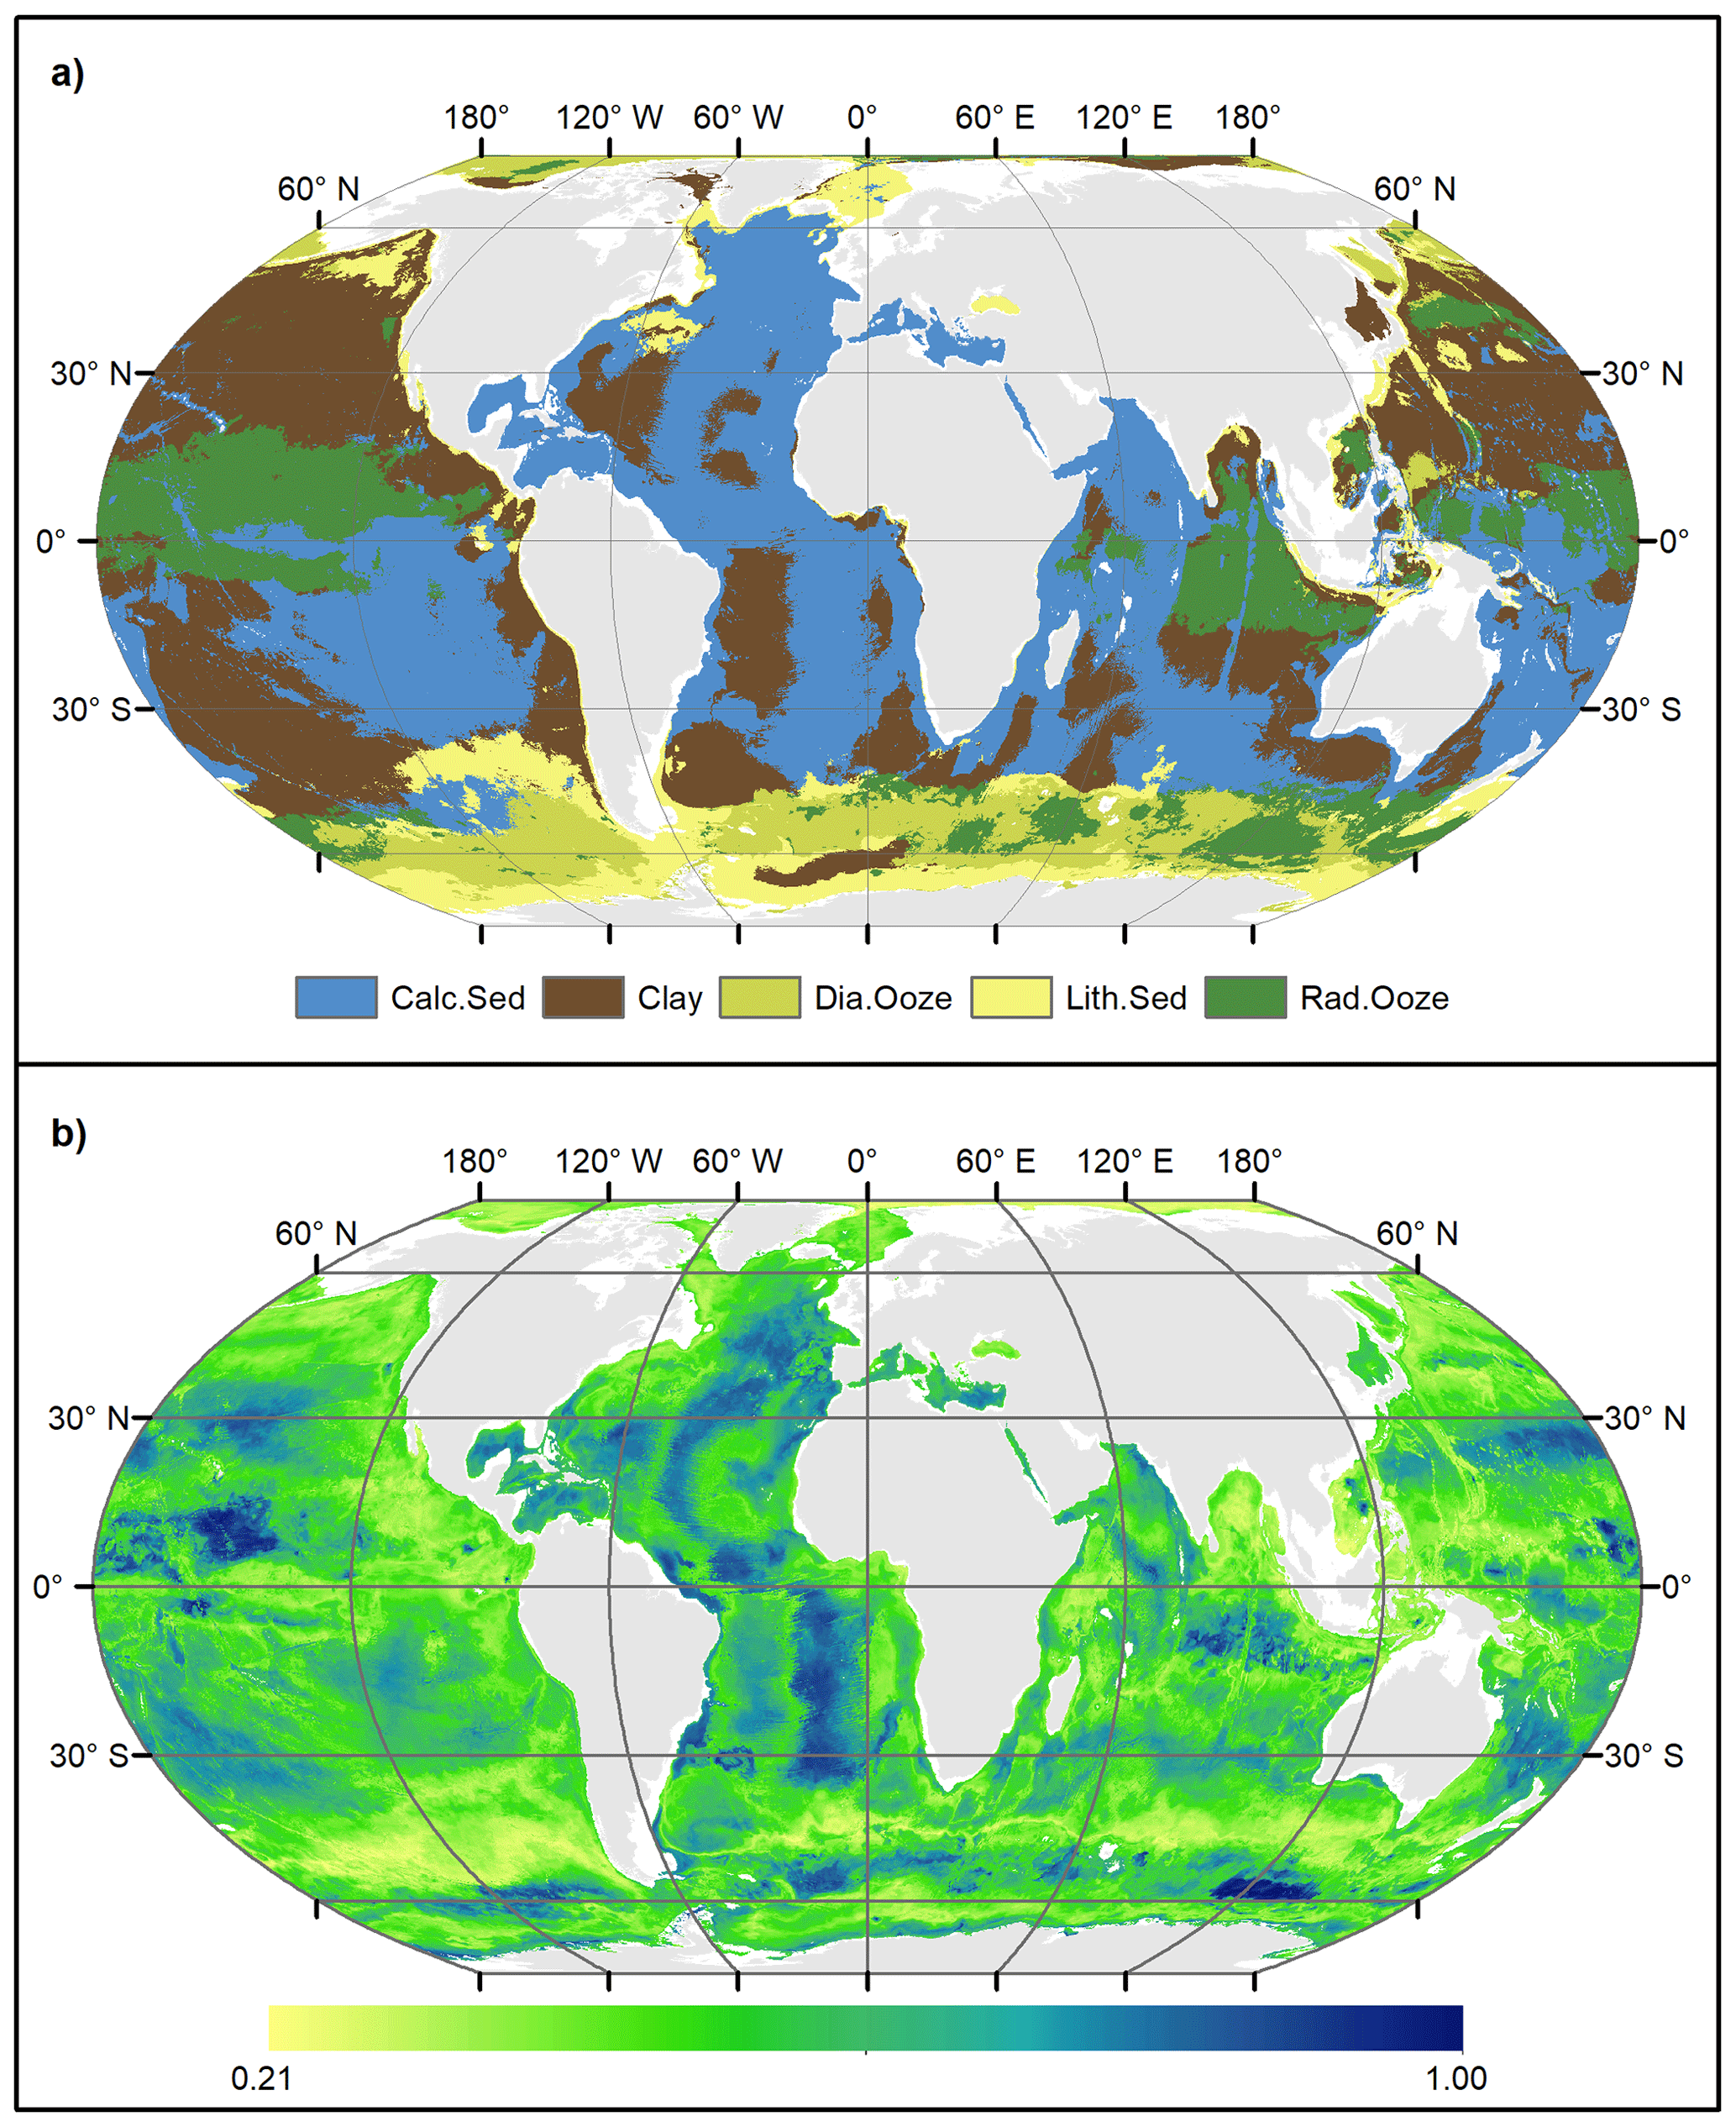
Figure 7(a) Predicted lithology classes and (b) associated confidence in the predictions. Land masses are derived from ESRI (2010).

This study utilised legacy sampling data to make predictions of the spatial distribution of seafloor lithologies in the deep sea. This is the only viable approach, as it is unrealistic to finance and execute a survey programme that samples the global ocean with adequate density within a reasonable timeframe. However, this approach also has some drawbacks.
The presented spatial predictions were based on forming relationships between lithology classes and environmental predictor variables. For such a task, it would be desirable to cover the range of values of each of the predictor variables used in the model (Minasny and McBratney, 2006). Although it was not possible to design a sampling survey, it became nevertheless obvious that the environmental space is reasonably well covered, presumably because of the relatively large number of observations, which was achievable, as there was virtually no cost associated with “collecting” the samples. However, it might not always be the case that a large sample dataset leads to adequate coverage of the environmental space. In such a case, it might be desirable to draw a suitable subsample that approximates the distribution of the environmental variables.
Data originating from many cruises over long time periods are most likely heterogeneous, which might lead to increased uncertainty in the predictions. Sources of uncertainty might relate to sampling gear type, vintage and timing of sampling, representativeness of subsampling, analytical pre-treatment, inconsistency of classification standards, and more (van Heteren and Van Lancker, 2015). However, Dutkiewicz et al. (2015) made efforts to homogenise the data. From a total number of more than 200 000 samples, they selected 14 400 based on strict quality-control criteria. Only surface and near-surface samples that were collected using coring, drilling, or grabbing methods were included. Furthermore, only samples whose descriptions could be verified using original cruise reports, cruise proceedings, and core logs were retained. Their classification scheme is deliberately generalised in order to successfully depict the main types of sediments found in the global ocean and to overcome shortcomings of inconsistent, poorly defined, and obsolete classification schemes and terminologies (Dutkiewicz et al., 2015).
Additional uncertainty might be introduced through imprecise positioning of the samples, which might lead to incorrect relations between the response variable and the predictor variables. No metadata exist on the positioning accuracy or even the method of determining the position, which might give some clues on the error associated with the recorded positions. However, the chances that this shortcoming leads to significant problems when making associations between target and predictor variables are relatively low, as the chosen model resolution of 10 km is relatively coarse when compared with positioning accuracy.
The initial choice of predictor variables was informed by the current understanding of the controls on deep-sea sedimentation (Dutkiewicz et al., 2016; Seibold and Berger, 1996). Consequently, all selected predictor variables were deemed important (Fig. 2). The three most important predictor variables (Fig. 8) are also in good agreement with Dutkiewicz et al. (2016). However, the large errors of omission and especially commission for the rare lithologies diatom ooze, lithogenous sediment, and radiolarian ooze might indicate that the environmental controls are less well represented for these sediment types. Lithogenous sediment comprises a wide range of grain sizes (silt, sand, gravel, and coarser), and proximity to land might be an insufficient predictor. In fact, distance to shore had the second lowest variable importance (Fig. 8).
Sedimentation rates in the deep sea typically range on the order of 1–100 mm per 1000 years (Seibold, 1975). The sample depths in the dataset used here might have ranged from core top to a few dm. The lithologic signal might therefore be integrated over timescales of approximately 100 years to a few 100 000 years. The model hindcasts to derive the oceanographic predictors typically cover approximately 25 years, while bathymetry and distance to coast might be nearly constant, since global sea-level rise ceased approximately 6700 years ago (Lambeck et al., 2014). Hence, there likely exists a mismatch between the time intervals, although oceanographic variables might not have changed dramatically over timescales much longer than a few decades.
Despite the good agreement with previously published maps and a reasonable overall map accuracy of approximately 60 %, there is large variation in the class-specific error as well as the spatial distribution of map confidence. It is therefore recommended to always consult the information on map confidence along with the map of seafloor lithologies.
The probability surfaces of the seven lithologies might be used as input for spatial prediction and modelling, e.g. marine species distribution modelling on a global scale, which typically lacks information on seafloor sediments, although substrate type is assumed to be an important environmental predictor. Additionally, the presented data layers might be useful for the spatial prediction of sediment properties (e.g. carbonate and organic carbon content).
The categorical map might serve as a resource for education and teaching; provide context for research pertaining to the global seafloor; support marine planning, management, and decision-making; and underpin the design of marine protected areas globally. Additionally, the provided lithology map might be useful for survey planning, especially in conjunction with confidence information to target areas where a certain lithology is most likely to occur. Conversely, areas of low confidence could be targeted to further improve the accuracy of and confidence in the global map of deep-sea sediments.
The input sample data (five major classes below 500 m water depth) and the presented model results (probability surfaces of the five lithologies, lithology map, and associated confidence map) are archived at https://doi.org/10.1594/PANGAEA.911692 (Diesing, 2020).
The analysis is documented as an executable research compendium, which can be accessed at https://o2r.uni-muenster.de/#/erc/GWME2voTDb5oeaQFuTWMCEMveKS1MiXm (Diesing and Nüst, 2020).
Based on a homogenised dataset of seafloor lithology samples (Dutkiewicz et al., 2015) and global environmental predictor variables from Bio-ORACLE (Assis et al., 2018; Tyberghein et al., 2012) and MARSPEC (Sbrocco and Barber, 2013) it was possible to spatially predict the distribution of deep-sea sediments globally. The general understanding about the controls on deep-sea sedimentation helped build a spatial model that gives a good representation of the main lithologies calcareous sediment, clay, diatom ooze, lithogenous sediment, and radiolarian ooze. Further improvements should be directed towards the controls on the distribution of rarer lithologies (diatom ooze, lithogenous sediment, and radiolarian ooze).
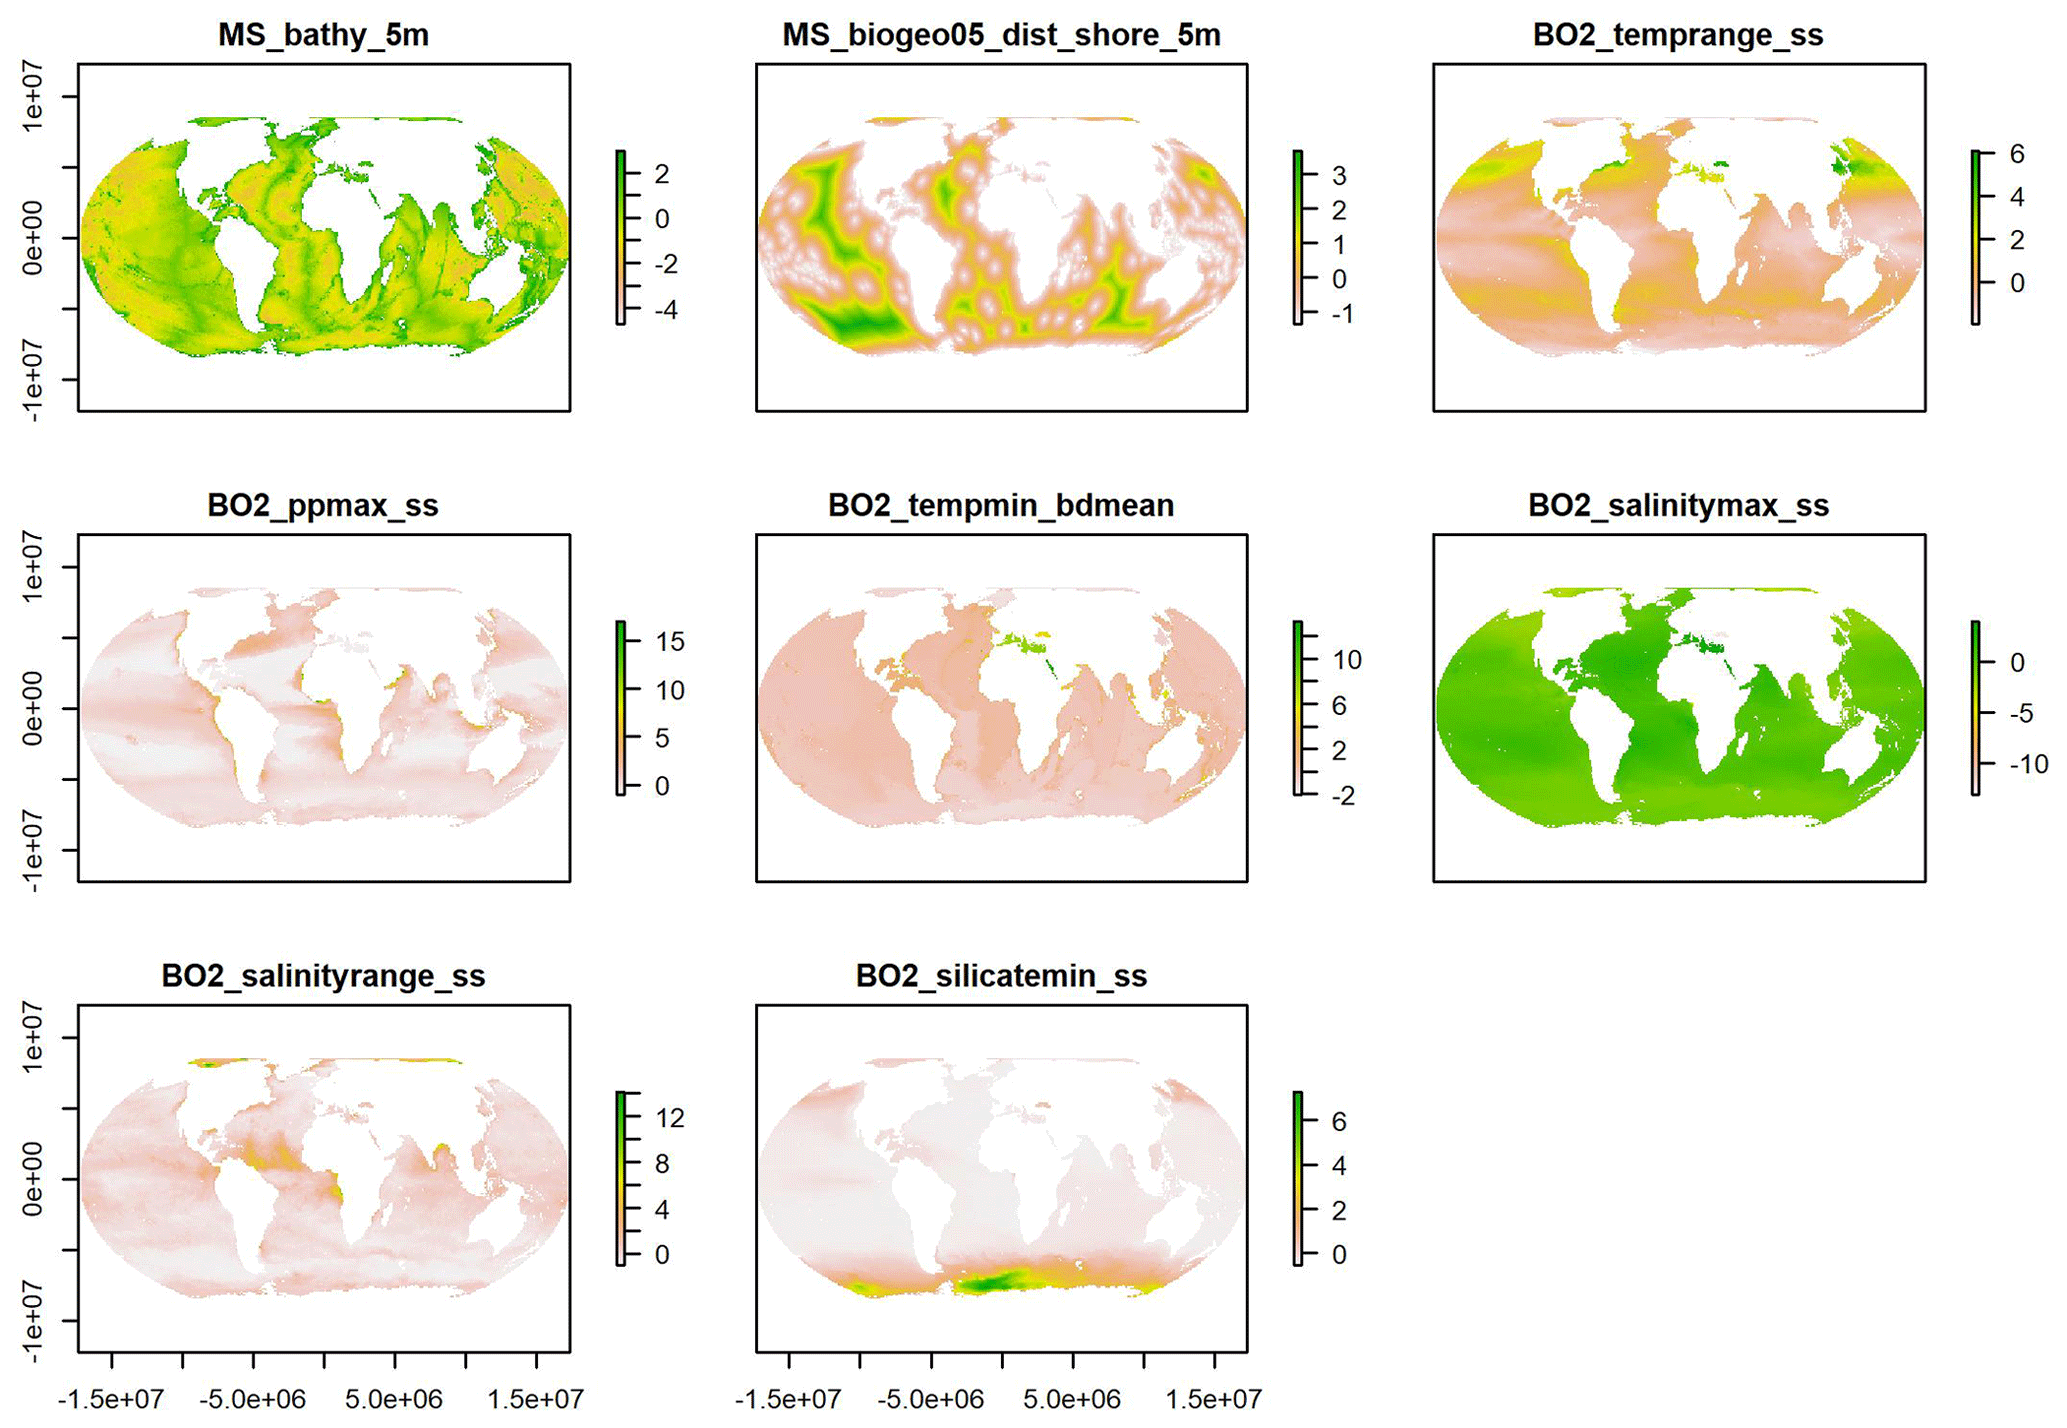
Figure A1Plots of the selected scaled predictor variables.
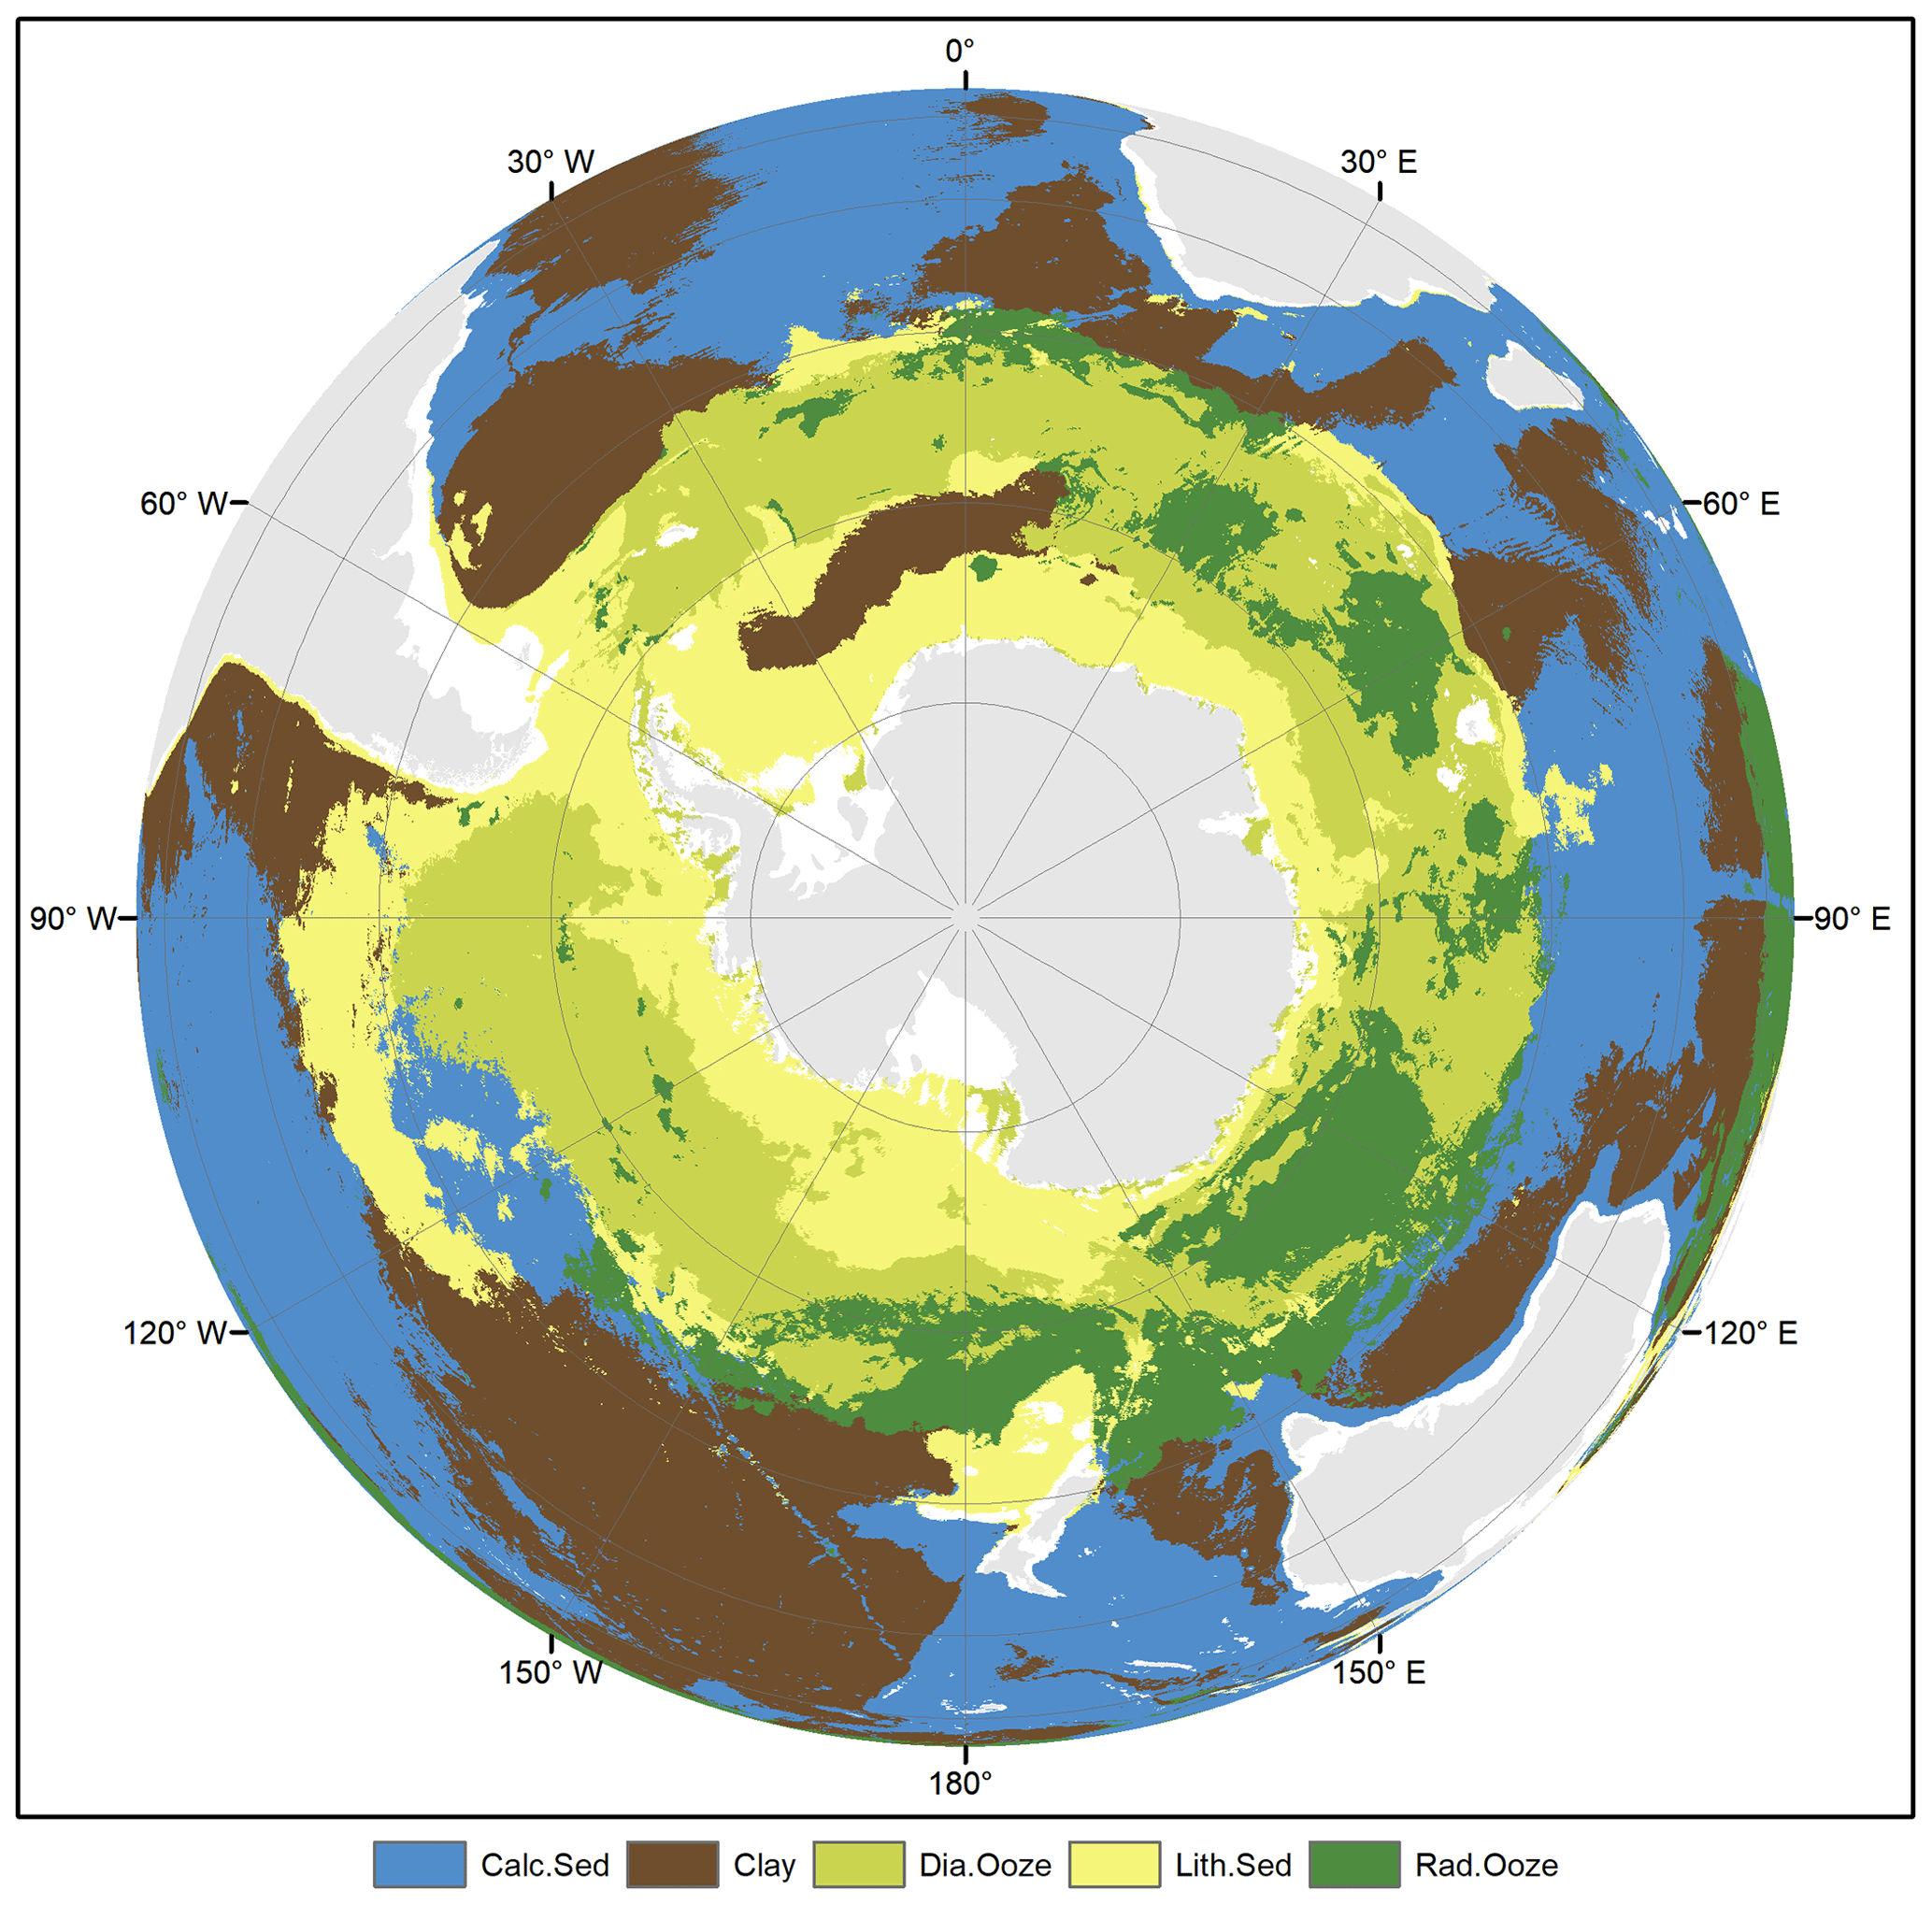
Figure A2Predicted lithology classes in the Southern Ocean. Land masses are derived from ESRI (2010).
MD designed the study, developed the model code, executed the analysis, and wrote the paper.
The author declares that there is no conflict of interest.
Thanks to Karl Fabian (NGU) and Benjamin Misiuk (Memorial University of Newfoundland) for providing valuable feedback. The reviews from Everardo González Ávalos and an anonymous reviewer were extremely helpful and led to significant improvements in the methodology and the paper.
This paper was edited by Dirk Fleischer and reviewed by Everardo González Ávalos and one anonymous referee.
Assis, J., Tyberghein, L., Bosch, S., Verbruggen, H., Serrão, E. A., and De Clerck, O.: Bio-ORACLE v2.0: Extending marine data layers for bioclimatic modelling, Glob. Ecol. Biogeogr., 27, 277–284, https://doi.org/10.1111/geb.12693, 2018.
Berger, W. H.: Deep-Sea Sedimentation, in: The Geology of Continental Margins, edited by: Burk, C. A. and Drake, C. L., Springer Berlin and Heidelberg, Germany, 213–241, 1974.
Breiman, L.: Classification And Regression Trees, Routledge, New York, USA, 1984.
Breiman, L.: Random Forests, Mach. Learn., 45, 5–32, 2001.
Che Hasan, R., Ierodiaconou, D., and Monk, J.: Evaluation of Four Supervised Learning Methods for Benthic Habitat Mapping Using Backscatter from Multi-Beam Sonar, Remote Sens., 4, 3427–3443, 2012.
Chen, C., Liaw, A., and Breiman, L.: Using Random Forest to Learn Imbalanced Data, available at: https://statistics.berkeley.edu/sites/default/files/tech-reports/666.pdf (last access: 7 December 2020), 2004.
Congalton, R. G.: A review of assessing the accuracy of classifications of remotely sensed data, Remote Sens. Environ., 37, 35–46, 1991.
Cortes, C. and Vapnik, V.: Support-vector networks, Mach. Learn., 20, 273–297, https://doi.org/10.1007/BF00994018, 1995.
Cutler, D., Edwards, T., Beards, K., Cutler, A., Hess, K., Gibson, J., and Lawler, J.: Random Forests for classification in Ecology, Ecology, 88, 2783–2792, 2007.
Danovaro, R., Snelgrove, P. V. R., and Tyler, P.: Challenging the paradigms of deep-sea ecology, Trends Ecol. Evol., 29, 465–475, https://doi.org/10.1016/J.TREE.2014.06.002, 2014.
Diesing, M.: Deep-sea sediments of the global ocean mapped with Random Forest machine learning algorithm, PANGAEA, https://doi.org/10.1594/PANGAEA.911692, 2020.
Diesing, M. and Nüst, D.: Global Deep-Sea Sediments, available at: https://o2r.uni-muenster.de/#/erc/GWME2voTDb5oeaQFuTWMCEMveKS1MiXm, last access: 7 December 2020.
Diesing, M. and Thorsnes, T.: Mapping of Cold-Water Coral Carbonate Mounds Based on Geomorphometric Features: An Object-Based Approach, Geosciences, 8, 34, https://doi.org/10.3390/geosciences8020034, 2018.
Diesing, M., Kröger, S., Parker, R., Jenkins, C., Mason, C., and Weston, K.: Predicting the standing stock of organic carbon in surface sediments of the North-West European continental shelf, Biogeochemistry, 135, 183–200, https://doi.org/10.1007/s10533-017-0310-4, 2017.
Dutkiewicz, A., Müller, R. D., O'Callaghan, S., and Jónasson, H.: Census of seafloor sediments in the world's ocean, Geology, 43, 795–798, https://doi.org/10.1130/G36883.1, 2015.
Dutkiewicz, A., O'Callaghan, S., and Müller, R. D.: Controls on the distribution of deep-sea sediments, Geochem. Geophys. Geosy., 17, 3075–3098, https://doi.org/10.1002/2016GC006428, 2016.
ESRI: World Continents, available at: https://www.arcgis.com/home/item.html?id=a3cb207855b348a297ab85261743351d (last access: 24 August 2017), 2010.
GEBCO: The GEBCO_2014 Grid, version 20150318, availabe at: http://www.gebco.net (last access: 24 January 2019), 2015.
Guisan, A. and Zimmermann, N. E.: Predictive habitat distribution models in ecology, Ecol. Modell., 135, 147–186, https://doi.org/10.1016/S0304-3800(00)00354-9, 2000.
Guyon, I. and Elisseeff, A.: An Introduction to Variable and Feature Selection, J. Mach. Learn. Res., 3, 1157–1182, 2003.
Harris, P. T., Macmillan-Lawler, M., Rupp, J., and Baker, E. K.: Geomorphology of the oceans, Mar. Geol., 352, 4–24, https://doi.org/10.1016/j.margeo.2014.01.011, 2014.
Huang, Z., Siwabessy, J., Nichol, S. L., and Brooke, B. P.: Predictive mapping of seabed substrata using high-resolution multibeam sonar data: A case study from a shelf with complex geomorphology, Mar. Geol., 357, 37–52, 2014.
James, G., Witten, D., Hastie, T., and Tibshirani, R.: Tree-Based Methods, in: An Introduction to Statistical Learning, Springer, New York, USA, 303–335, 2013.
Kuhn, M.: Building Predictive Models in R Using the caret Package, J. Stat. Software, 1, 1–26, https://doi.org/10.18637/jss.v028.i05, 2008.
Kursa, M. and Rudnicki, W.: Feature selection with the Boruta Package, J. Stat. Softw., 36, 1–11, 2010.
Lambeck, K., Rouby, H., Purcell, A., Sun, Y., and Sambridge, M.: Sea level and global ice volumes from the Last Glacial Maximum to the Holocene, Proc. Natl. Acad. Sci., 111, 15296–15303, https://doi.org/10.1073/pnas.1411762111, 2014.
Liaw, A. and Wiener, M.: Classification and regression by randomForest, R News, 2, 18–22, https://doi.org/10.1159/000323281, 2002.
Lisitzin, A. P.: Distribution of siliceous microfossils in suspension and in bottom sediments, in: The Micropaleontology of Oceans, edited by: Funnell, B. M. and Reidel, W. R., Cambridge University Press, Cambridge, UK, 173–195, 1971.
Luts, J., Ojeda, F., Plas, R., Van De Moor, B., De Huffel, S., and Van Suykens, J. A. K.: A tutorial on support vector machine-based methods for classification problems in chemometrics, Anal. Chim. Acta, 665, 129–145, 2010.
Mastrandrea, M. D., Mach, K. J., Plattner, G. K., Edenhofer, O., Stocker, T. F., Field, C. B., Ebi, K. L., and Matschoss, P. R.: The IPCC AR5 guidance note on consistent treatment of uncertainties: A common approach across the working groups, Clim. Change, 108, 675, https://doi.org/10.1007/s10584-011-0178-6, 2011.
Millard, K. and Richardson, M.: On the importance of training data sample selection in random forest image classification: A case study in peatland ecosystem mapping, Remote Sens., 7, 8489–8515, https://doi.org/10.3390/rs70708489, 2015.
Minasny, B. and McBratney, A. B.: A conditioned Latin hypercube method for sampling in the presence of ancillary information, Comput. Geosci., 32, 1378–1388, https://doi.org/10.1016/J.CAGEO.2005.12.009, 2006.
Misiuk, B., Diesing, M., Aitken, A., Brown, C. J., Edinger, E. N., and Bell, T.: A spatially explicit comparison of quantitative and categorical modelling approaches for mapping seabed sediments using random forest, Geosciences, 9, 254, https://doi.org/10.3390/geosciences9060254, 2019.
Nilsson, R., Peña, J. M., Björkegren, J., and Tegnér, J.: Consistent feature selection for pattern recognition in polynomial time, J. Mach. Learn. Res., 8, 589–612, 2007.
Olofsson, P., Foody, G. M., Herold, M., Stehman, S. V, Woodcock, C. E., and Wulder, M. A.: Good practices for estimating area and assessing accuracy of land change, Remote Sens. Environ., 148, 42–57, https://doi.org/10.1016/j.rse.2014.02.015, 2014.
Prasad, A. M., Iverson, L. R., and Liaw, A.: Newer classification and regression tree techniques: Bagging and random forests for ecological prediction, Ecosystems, 9, 181–199, https://doi.org/10.1007/s10021-005-0054-1, 2006.
Probst, P.: Performance Measures for Statistical Learning, availabe at: https://cran.r-project.org/web/packages/measures/measures.pdf (last access: 7 December 2020), 2018.
R Core Team: R: A Language and Environment for Statistical Computing, 2018.
Roberts, D. R., Bahn, V., Ciuti, S., Boyce, M. S., Elith, J., Guillera-Arroita, G., Hauenstein, S., Lahoz-Monfort, J. J., Schröder, B., Thuiller, W., Warton, D. I., Wintle, B. A., Hartig, F., and Dormann, C. F.: Cross-validation strategies for data with temporal, spatial, hierarchical, or phylogenetic structure, Ecography, 40, 913–929, https://doi.org/10.1111/ecog.02881, 2017.
Sbrocco, E. J. and Barber, P. H.: MARSPEC: ocean climate layers for marine spatial ecology, Ecology, 94, 979, https://doi.org/10.1890/12-1358.1, 2013.
Seibold, E.: Der Meeresboden Forschungsstand und Zukunftsaufgaben, Naturwissenschaften, 62, 321–330, https://doi.org/10.1007/BF00608892, 1975.
Seibold, E. and Berger, W. H.: The sea floor, An introduction to marine geology, 3rd edition, Springer, Berlin, Germany, 1996.
Snelgrove, P. V. R., Soetaert, K., Solan, M., Thrush, S., Wei, C.-L., Danovaro, R., Fulweiler, R. W., Kitazato, H., Ingole, B., Norkko, A., Parkes, R. J., and Volkenborn, N.: Global Carbon Cycling on a Heterogeneous Seafloor, Trends Ecol. Evol., 33, 96–105, https://doi.org/10.1016/J.TREE.2017.11.004, 2018.
Stehman, S. V. and Foody, G. M.: Key issues in rigorous accuracy assessment of land cover products, Remote Sens. Environ., 231, 111199, https://doi.org/10.1016/J.RSE.2019.05.018, 2019.
Stevens Jr., D. L. and Olsen, A. R.: Variance estimation for spatially balanced samples of environmental resources, Environmetrics, 14, 593–610, https://doi.org/10.1002/env.606, 2003.
Story, M. and Congalton, R. G.: Accuracy Assessment: A User's Perspective, Photogramm. Eng. Remote Sens., 52, 397–399, 1986.
Strobl, C. and Zeileis, A.: Danger: High Power! – Exploring the Statistical Properties of a Test for Random Forest Variable Importance, availabe at: https://epub.ub.uni-muenchen.de/2111/1/techreport.pdf (last access: 7 December 2020), 2008.
Strobl, C., Boulesteix, A.-L., Zeileis, A., and Hothorn, T.: Bias in random forest variable importance measures: Illustrations, sources and a solution, BMC Bioinformatics, 8, 25, https://doi.org/10.1186/1471-2105-8-25, 2007.
Thurman, H. V.: Introductory Oceanography, 8th edn., Prentice-Hall, Upper Saddle River, New Jersey, USA, 1997.
Tyberghein, L., Verbruggen, H., Pauly, K., Troupin, C., Mineur, F., and De Clerck, O.: Bio-ORACLE: a global environmental dataset for marine species distribution modelling, Glob. Ecol. Biogeogr., 21, 272–281, https://doi.org/10.1111/j.1466-8238.2011.00656.x, 2012.
Valavi, R., Elith, J., Lahoz-Monfort, J. J., and Guillera-Arroita, G.: BLOCKCV: An R package for generating spatially or environmentally separated folds for k-fold cross-validation of species distribution models, Methods Ecol. Evol., 10, 225–232, https://doi.org/10.1111/2041-210X.13107, 2018.
van Heteren, S. and Van Lancker, V.: Collaborative Seabed-Habitat Mapping: Uncertainty in Sediment Data as an Obstacle in Harmonization, in: Collaborative Knowledge in Scientific Research Networks, edited by: Diviacco, P., Fox, P., Pshenichy, C., and Leadbetter, A., Information Science Reference, Hershey PA, USA, 154–176, 2015.