the Creative Commons Attribution 4.0 License.
the Creative Commons Attribution 4.0 License.
 | 10 Dec 2020
A global mean sea surface temperature dataset for the Last Interglacial (129–116 ka) and contribution of thermal expansion to sea level change
Richard T. Jones
Nicholas P. McKay
Erik van Sebille
Zoë A. Thomas
Claus-Dieter Hillenbrand
Christopher J. Fogwill
A valuable analogue for assessing Earth's sensitivity to warming is the Last Interglacial (LIG; 129–116 ka), when global temperatures (0 to +2 ∘C) and mean sea level (+6 to 11 m) were higher than today. The direct contribution of warmer conditions to global sea level (thermosteric) is uncertain. We report here a global network of LIG sea surface temperatures (SST) obtained from various published temperature proxies (e.g. faunal and floral plankton assemblages, Mg ∕ Ca ratios of calcareous organisms, and alkenone U). We summarize the current limitations of SST reconstructions for the LIG and the spatial temperature features of a naturally warmer world. Because of local δ18O seawater changes, uncertainty in the age models of marine cores, and differences in sampling resolution and/or sedimentation rates, the reconstructions are restricted to mean conditions. To avoid bias towards individual LIG SSTs based on only a single (and potentially erroneous) measurement or a single interpolated data point, here we report average values across the entire LIG. Each site reconstruction is given as an anomaly relative to 1981–2010, corrected for ocean drift, and where available seasonal estimates are provided (189 annual, 99 December–February, and 92 June–August records). To investigate the sensitivity of the reconstruction to high temperatures, we also report maximum values during the first 5 millennia of the LIG (129–124 ka). We find mean global annual SST anomalies of 0.2 ± 0.1 ∘C averaged across the LIG and an early maximum peak of 0.9 ± 0.1 ∘C, respectively. The global dataset provides a remarkably coherent pattern of higher SST increases at polar latitudes than in the tropics (demonstrating the polar amplification of surface temperatures during the LIG), with comparable estimates between different proxies. Polewards of 45∘ latitude, we observe annual SST anomalies averaged across the full LIG of > 0.8 ± 0.3 ∘C in both hemispheres with an early maximum peak of > 2.1 ± 0.3 ∘C. Using the reconstructed SSTs suggests a mean LIG global thermosteric sea level rise of 0.08 ± 0.1 m and a peak contribution of 0.39 ± 0.1 m, respectively (assuming warming penetrated to 2000 m depth). The data provide an important natural baseline for a warmer world, constraining the contributions of Greenland and Antarctic ice sheets to global sea level during a geographically widespread expression of high sea level, and can be used to test the next inter-comparison of models for projecting future climate change. The dataset described in this paper, including summary temperature and thermosteric sea level reconstructions, is available at https://doi.org/10.1594/PANGAEA.904381 (Turney et al., 2019).
- Article
(6810 KB) - Full-text XML
-
Supplement
(1135 KB) - BibTeX
- EndNote


The timing and impacts of past and future abrupt and extreme climate change remain highly uncertain. A key challenge is that historical records of change are too short (since 1850 CE) and their amplitude too small relative to projections for the next century (IPCC, 2013; PAGES2k Consortium et al., 2017), raising concerns over our ability to successfully plan for future change. While a wealth of geological, chemical, and biological records (often referred to as “natural archives” or “palaeo”) indicate that large-scale and often multi-millennial duration shifts in the Earth system took place in the past (Thomas, 2016; Steffen et al., 2018; Lenton et al., 2008; Thomas et al., 2020), there are limited global datasets of such events. A comprehensive database of environmental conditions during periods of warmer-than-present-day climate is essential for constraining uncertainties surrounding projected future change, including sea level rise, extreme weather events, and the climate–carbon cycle. In this regard, the Last Interglacial (LIG), an interval spanning approximately 129 000 to 116 000 years ago, is of great value (Dutton et al., 2015). Described as a “super-interglacial” (Turney and Jones, 2010; Overpeck et al., 2005), the LIG was one of the warmest periods of the last 800 kyr, experiencing relatively high polar temperatures compared to the global mean (“polar amplification”) (Past Interglacials Working Group of PAGES, 2016; Hoffman et al., 2017; Turney and Jones, 2010; Capron et al., 2017), with the most geographically widespread expression of high global mean sea level in the recent geological record (GMSL, +6.6 to +11.4 m) (Dutton et al., 2015; Grant et al., 2014; Kopp et al., 2009; Rohling et al., 2017), abrupt shifts in regional hydroclimate (Wang et al., 2008; Thomas et al., 2015), and elevated atmospheric CO2 concentrations (relative to the pre-industrial period) of ∼ 290 ppm (Köhler et al., 2017; Schneider et al., 2013; Barnola et al., 1987; Petit et al., 1999), suggesting non-linear responses in the Earth system to forcing (Steffen et al., 2018; Thomas, 2016; Dakos et al., 2008; Thomas et al., 2020). Importantly, there remains considerable debate over the contribution of sources to the highstand in global sea level (Dutton et al., 2015; Rohling et al., 2019). Previous work has suggested ocean thermal expansion contributed some 0.4 m (McKay et al., 2011), while Greenland Ice Sheet melt is estimated at some 2 m (NEEM Community Members, 2013) and melting mountain glaciers ∼ 0.6 m (Dutton et al., 2015), implying Antarctic mass loss > 3.6 m (Fogwill et al., 2014; Turney et al., 2020a; DeConto and Pollard, 2016; Dutton et al., 2015; Rohling et al., 2019). Constraining the different contributions to GMSL during the LIG requires a comprehensive ocean temperature database to precisely quantify the role of ocean thermal expansion, compare them to climate model-generated temperature estimates, and use these temperature estimates to drive ice sheet models (Fogwill et al., 2014; Mercer, 1978; DeConto and Pollard, 2016; Sutter et al., 2016; Hoffman et al., 2017; Clark et al., 2020).
Quantified temperature reconstruction data for the LIG are often drawn from disparate publications and repositories (usually reported alongside other Late Pleistocene data). To obtain reliable temperature reconstructions, it has until recently proved necessary to determine a global estimate of the magnitude of warming using only a selected number of “high-quality” records; the resulting temperature reconstructions of LIG temperatures ranged from 0.1 to > 2 ∘C warmer than present (CLIMAP, 1984; White, 1993; Hansen, 2005; Rohling et al., 2008; Turney and Jones, 2010). With the ever-increasing number of quantified temperature reconstructions of the LIG reported in individual publications, it is crucial that these datasets are brought together to derive a comprehensive reconstruction of global change during the LIG. A further consideration is that, in contrast to terrestrial sequences, marine records typically provide a continuous record of LIG conditions (Turney and Jones, 2010, 2011) and, thus, an opportunity to determine the sensitivity of GMSL to sea surface temperature (SST) conditions during the interglacial (including early maximum temperatures). Given a possible warming of 2 ∘C (Turney and Jones, 2010; Fischer et al., 2018), the LIG potentially provides insights into the drivers of sea level rise and the long-term impacts under a global temperature target set out in the 2016 Paris Climate Agreement (Schellnhuber et al., 2016).
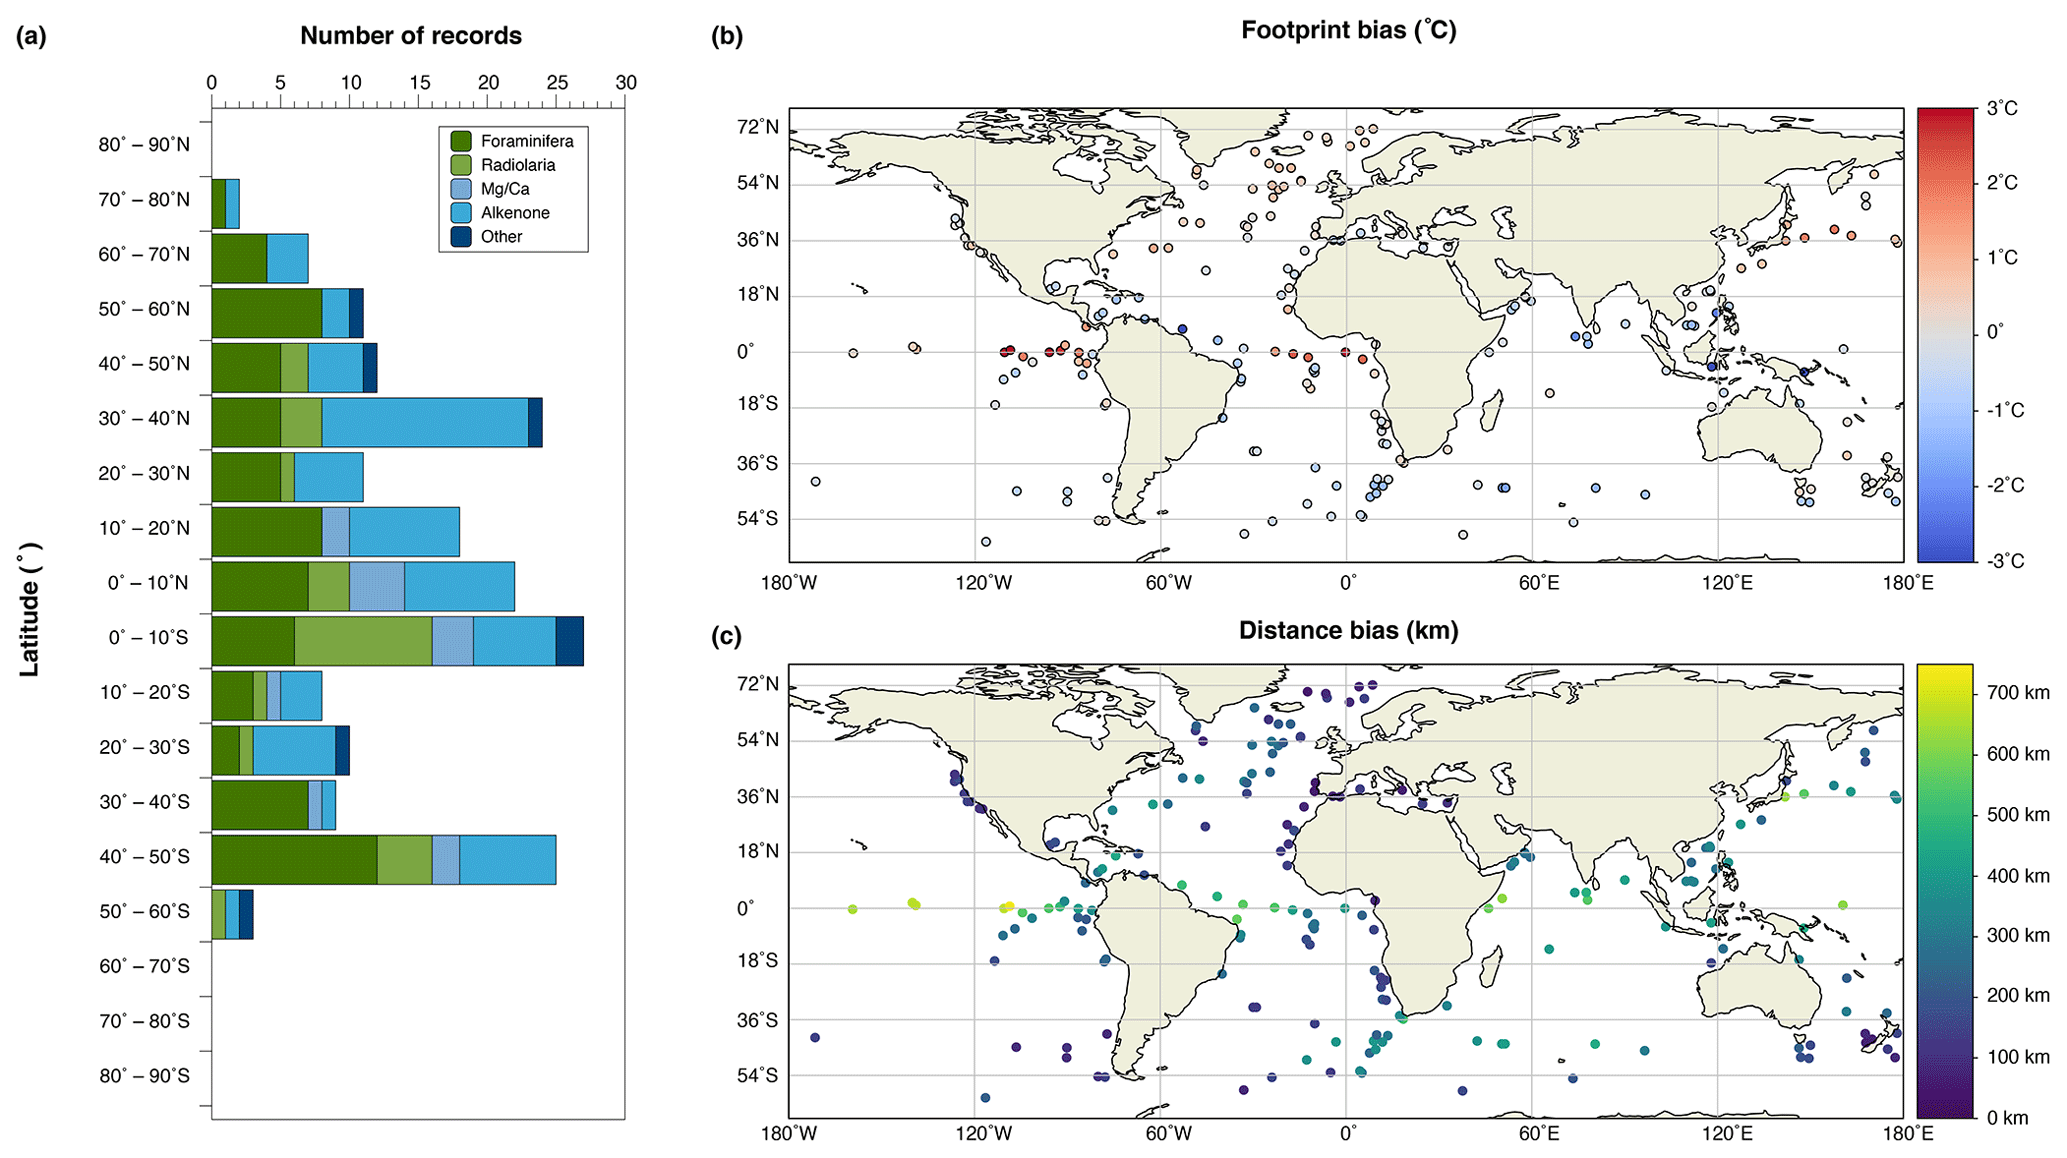
Figure 1Last Interglacial proxy-based annual sea surface temperature dataset and modelled inherited signal. Histogram showing the number of Last Interglacial records of annual sea surface temperature binned by 10∘ latitude (a) with virtual microfossil temperature offsets defined as the difference between along-trajectory recorded temperatures and local temperatures (b) and distance (c) travelled in the Japanese Ocean model For the Earth Simulator (OFES; run between 1981 and 2010 CE) determined for 30 d “lifespans” of planktic organisms (van Sebille et al., 2015).
Here we present version 1.0 of the Last Interglacial SST database (Turney et al., 2019). This database builds on the previously published 2010 data compilation of Turney and Jones (2010), and includes substantially more records. Importantly, the micro-organisms used to determine SSTs move along with the currents and encounter a range of temperatures during their life cycle (van Sebille et al., 2015; Doblin and van Sebille, 2016; von Gyldenfeldt et al., 2000). As a result, previous work has suggested that ocean drift of micro-organisms can have a major influence on reconstructed environmental change (van Sebille et al., 2015; Monroy et al., 2017; Kienast et al., 2016; Hellweger et al., 2016; Rembauville et al., 2016; Viebahn et al., 2016; Nooteboom et al., 2019) and also potentially explains the divergence between laboratory culture and core-top calibrations (Anand et al., 2003; Müller et al., 1998; Prahl et al., 2003; Sikes et al., 2005; Segev et al., 2016; Elderfield and Ganssen, 2000), and palaeoclimate estimates and model outputs (Otto-Bliesner et al., 2013; Bakker and Renssen, 2014; NEEM Community Members, 2013; Lunt et al., 2013), including the recently recognized historic (Anthropocene) change in modern plankton communities, which has major implications for calibration studies (Jonkers et al., 2019). The influence of ocean currents has not been explored (or corrected for) in previous studies of the LIG (Hoffman et al., 2017; Capron et al., 2014; Turney and Jones, 2010) and is important for obtaining correct absolute SSTs. This descriptor describes the contents of the database, the criteria for inclusion, and quantifies the relation of each record with instrumental temperature, including the estimated impact of ocean current drift on individual sites and global averages. The current database includes a large number of metadata fields to facilitate the reuse of the data and identification of key records for future investigations into the LIG. Specific criteria were developed to gather all published proxy records that meet the key objective and reproducible criteria. The database will be updated yearly as newly reported records are published.
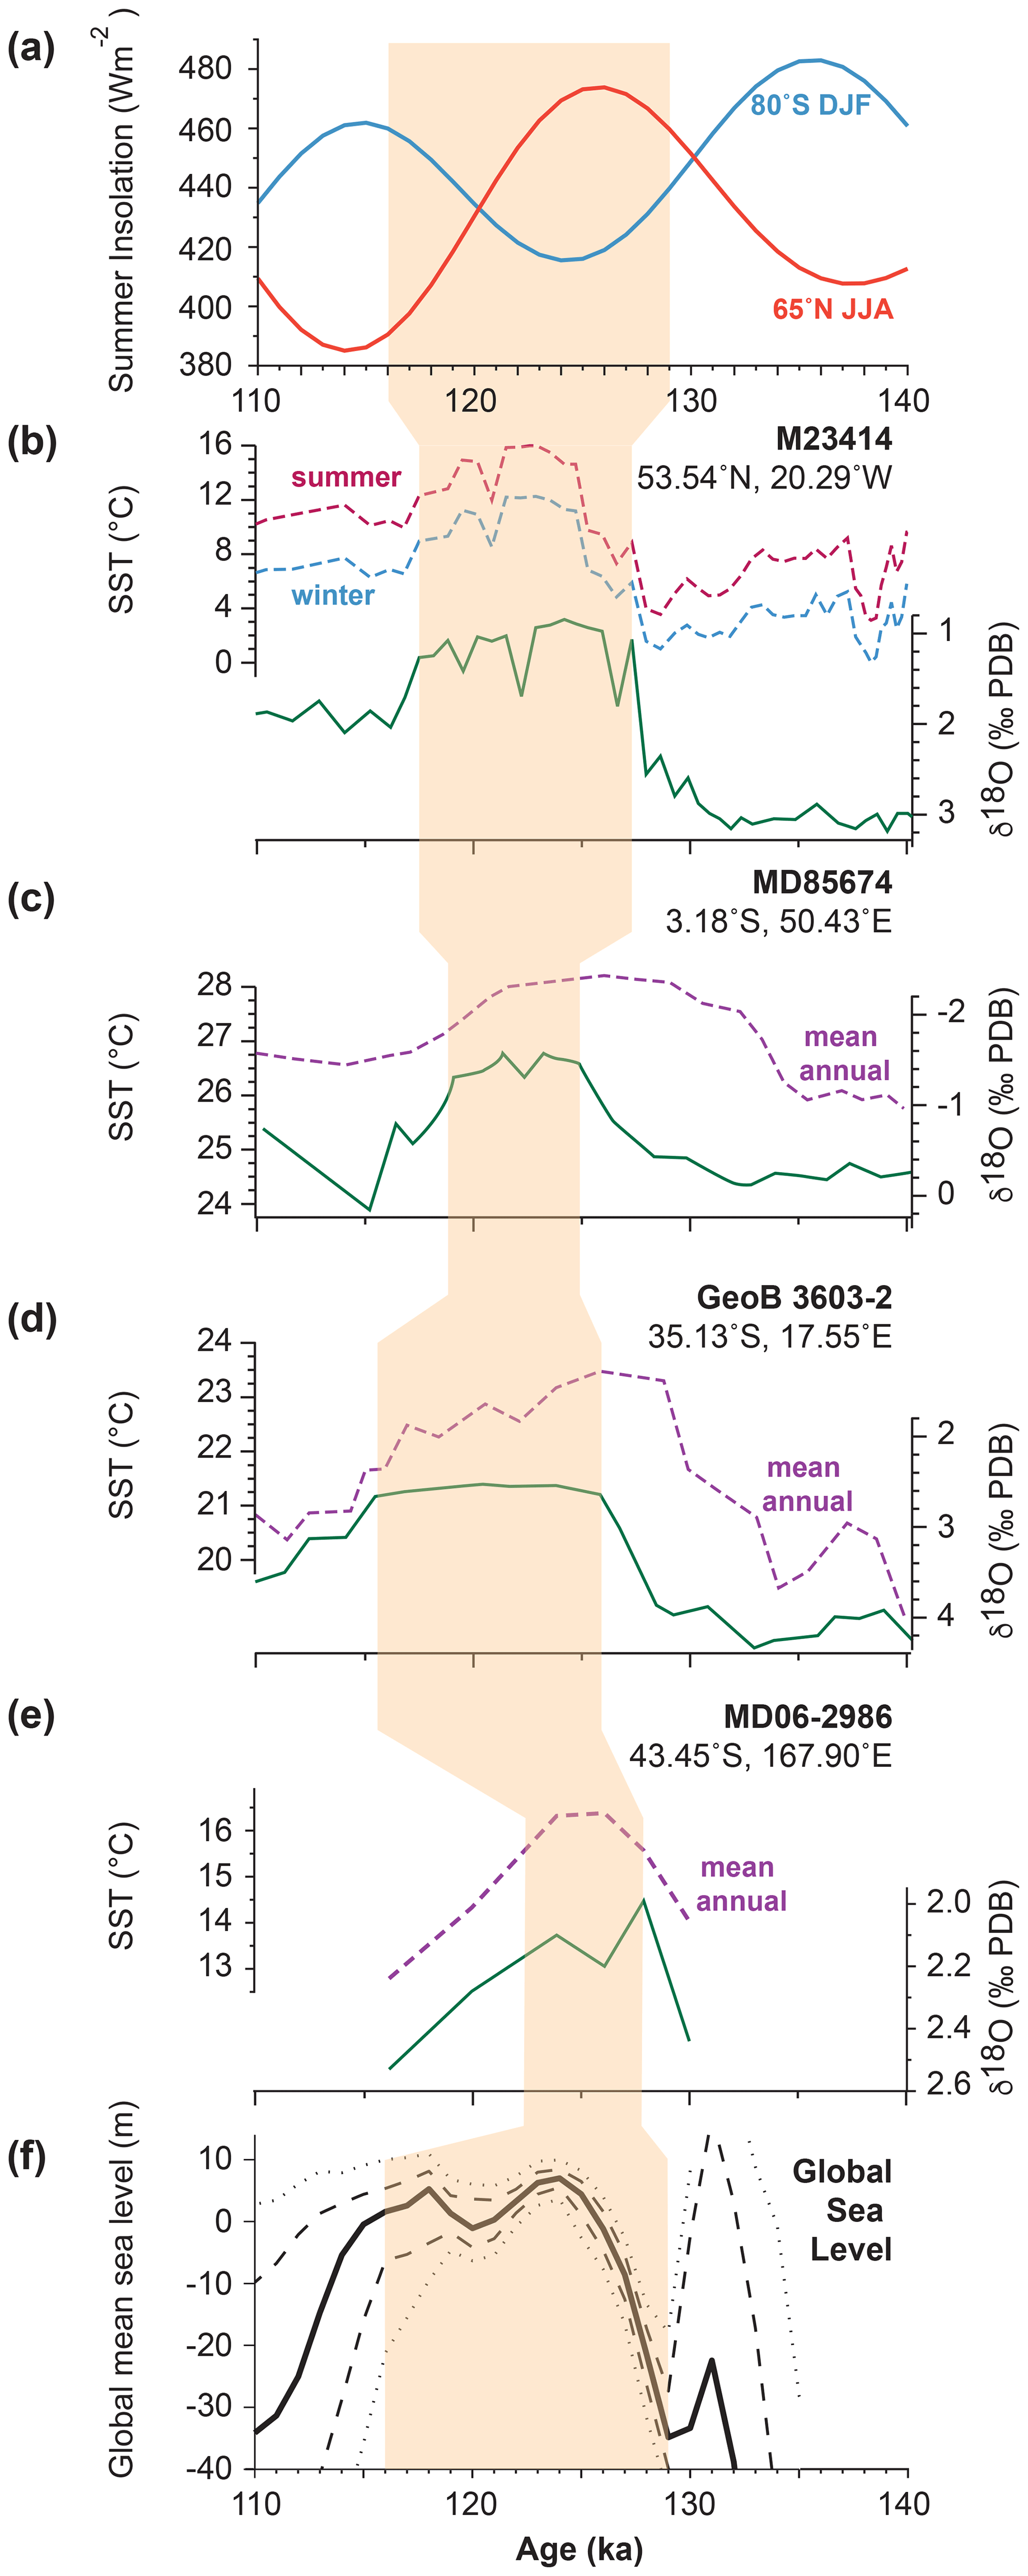
Figure 2Relationships between δ18O plateau and sea surface temperatures and environmental changes across the Last Interglacial. (a) Insolation changes calculated from Laskar et al. (2004). Sea surface temperatures (dashed purple lines) across the Last Interglacial (light orange shading) compared to the benthic foraminifera δ18O data (solid green lines) for selected sites in different ocean basins: (b) M23414 (North Atlantic) (Kandiano et al., 2004), (c) MD85674 (equatorial Indian Ocean) (Bard et al., 1997), (d) GeoB 3603-2 (southern Indian Ocean) (Schneider et al., 1999), and (e) MD06-2986 (southern Pacific Ocean) (Cortese et al., 2013). (f) The probabilistic reconstructed global sea level curve is reported by Kopp et al. (2009); heavy lines mark median projections, dashed lines the 16th and 84th percentiles, and dotted lines the 2.5th and 97.5th percentiles.
2.1 Global compilation
We have compiled a global network of published quantified SSTs using faunal and floral plankton assemblages, Mg ∕ Ca and Sr ∕ Ca ratios of calcareous organisms, and U estimates across the period of record interpreted as representing the LIG. In many instances, we used the period represented by low 18O values in benthic foraminifera shells (the lightest isotopic values during 90–150 ka representing minimum global ice volume). In some sequences, δ18O values were not reported, and therefore we relied on other complementary proxies, for instance, the CaCO3 content of sediments as a measure of glacial–interglacial variability (Turney and Jones, 2010; Cortese et al., 2013) (Figs. 1 and 2). Whilst the age control points defining the plateaus in δ18O and other proxies are not absolutely dated with chronological uncertainties of 1 to 2 millennia (Martinson et al., 1987; Lisiecki and Raymo, 2005), it is important to note that we are not aiming to resolve centennial- and millennial-scale variability through the interglacial. We acknowledge that some individual SST estimates may not fall within the LIG or have been excluded (due to these chronological uncertainties), but we consider the averaging of values across the full interglacial to provide a robust value for each record and ultimately the regional and global reconstructions.
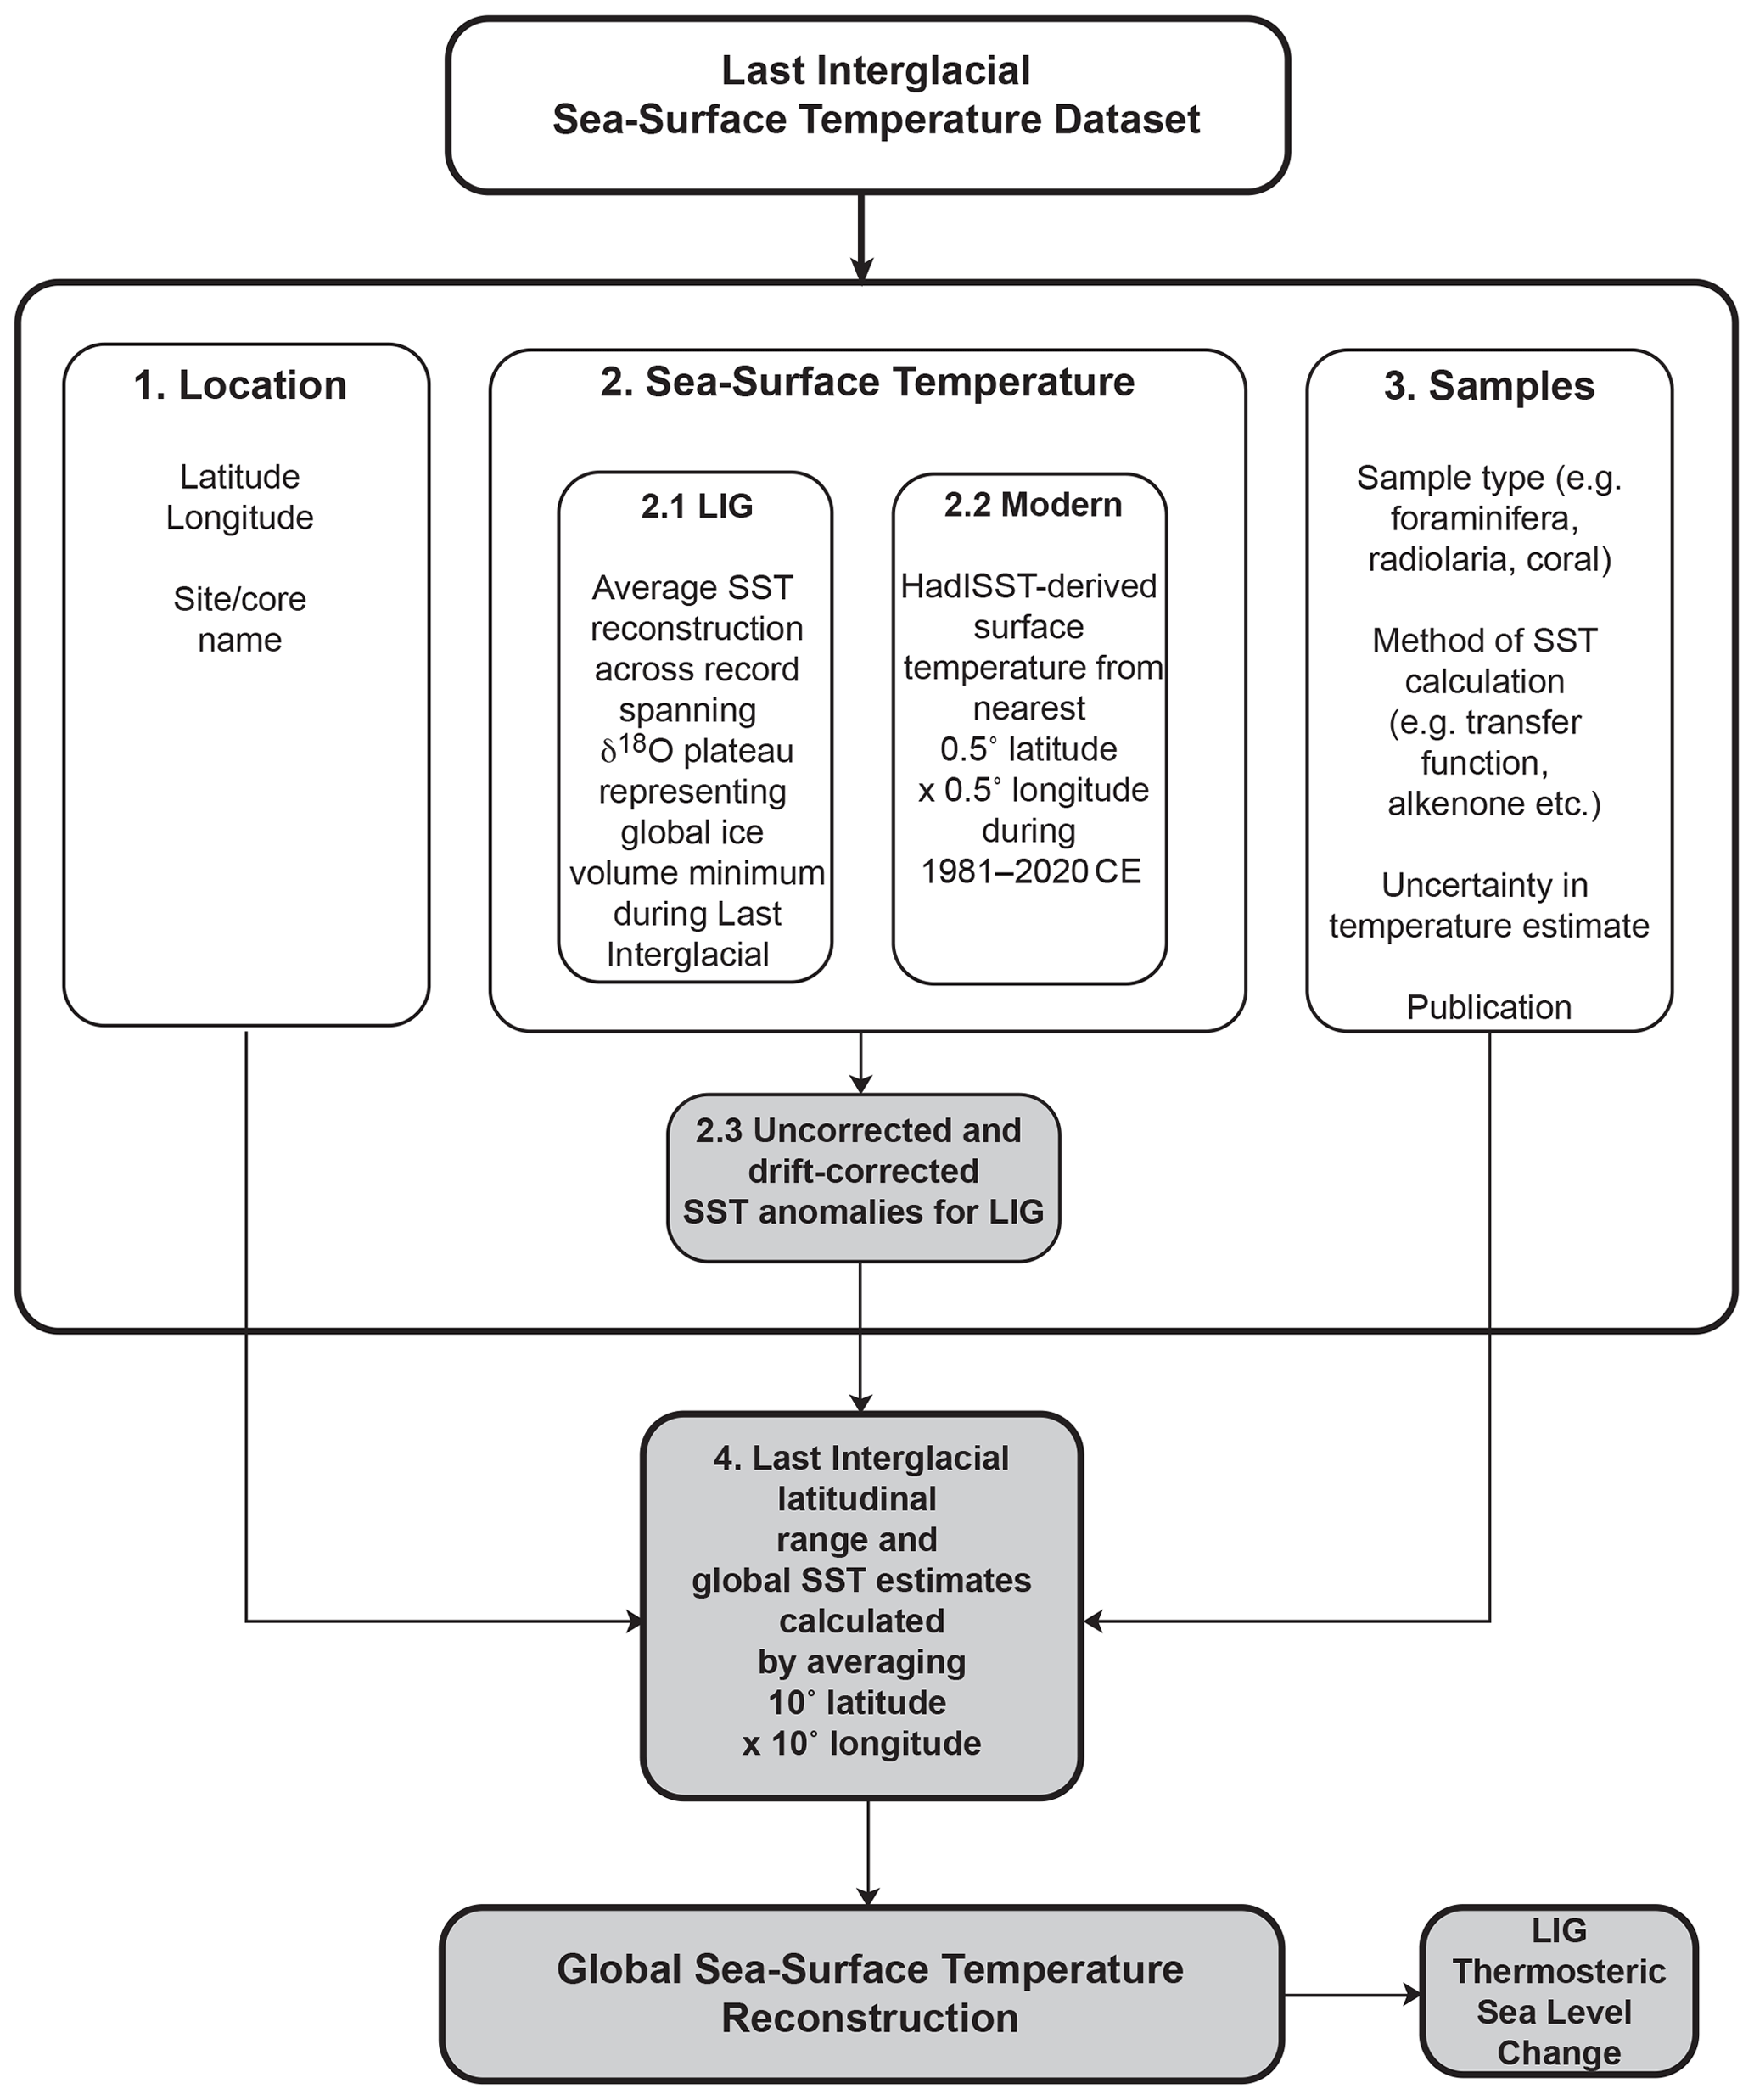
Figure 3Simplified scheme for the generation of the Last Interglacial (LIG) sea surface temperature (SST) database providing an overview of the data collection and processing. The numbered boxes set out the stages required to generate a global database of surface temperatures from marine records: (1) location, (2) Last Interglacial and modern SSTs (including drift calculation), and (3) metadata, including method of temperature reconstruction and associated uncertainty. Grey boxes indicate additional processing of data from the original publications, generating new outputs (which are provided in the database).
We have therefore not attempted to generate a time series of SSTs through the LIG. Previous studies have highlighted that individual site δ18O changes in benthic foraminifera (for instance, during deglaciation) may be offset by several millennia as a result of local deep-water temperature and δ18O seawater variations (Govin et al., 2015; Waelbroeck et al., 2008) (Fig. 2). In an attempt to bypass some of these issues, other studies have attempted alignment of marine records to speleothem-dated ice core reconstructions (Hoffman et al., 2017), but modelled age uncertainties can be in the order of millennia (e.g. Hoffman et al., 2017, Fig. S7), while the assumed synchroneity of extra-regional changes has challenges; for instance, more than half of reported Pacific marine cores (those from the Northern Hemisphere) in a recent study were correlated to the Antarctic EPICA Dome C δD (Hoffman et al., 2017), with warming in the south known to lead the north by 1 to 2 millennia (Hayes et al., 2014; NEEM Community Members, 2013; Kim et al., 1998; Rohling et al., 2019). The development of accurate and precise age estimates for LIG records is urgently needed to resolve the timing of global climate change but will require a considerable future international effort (Govin et al., 2015). Given the relatively large chronological uncertainties associated with comparing global SST time series (Hoffman et al., 2017; Govin et al., 2015; Capron et al., 2017), we have therefore not attempted to generate a time series of changes within the LIG but instead determine average temperatures as a robust estimate of mean climatic conditions. Whilst not offering precisely dated geochronological frameworks, the global ice volume minima as represented by the δ18O plateau and/or associated proxy measures of interglacial conditions are sufficiently well-defined in all marine records to accommodate local deep-water temperature and δ18O variations, sampling resolution, and/or sedimentation rates to identify the LIG, thereby maximizing the number of records that have reported quantified SSTs across the interglacial (Cortese et al., 2013; Govin et al., 2015); a minimum of three SST values across the LIG in each record was required for inclusion in our dataset. This is not to downplay the significance of millennial-scale climate variability across the LIG (Galaasen et al., 2014; Rohling et al., 2002; Tzedakis et al., 2018; Jones et al., 2017), but our approach does provide some benefits. Whilst our approach sacrifices temporal control, it does minimize the uncertainty of zonal and global temperature averages.
To quantify the temperature difference between the LIG and present day, we do not compare the LIG estimates to the relatively poor observational coverage of earlier periods, including the 19th century (pre-industrial) (Hoffman et al., 2017) or the long-term annual means calculated from 1900 to 1997 (Capron et al., 2014), both of which have considerable uncertainties given the limited network of “observations” prior to the satellite era (Brohan et al., 2006; Huang et al., 2020). Here instead we report SSTs expressed as anomalies relative to global “modern” instrumental and satellite observations across the period 1981–2010 obtained from HadISST (Rayner et al., 2003). Each LIG temperature record is linked to at least one literature source, the citation of which includes author(s), year of publication, and typical archiving information (e.g. journal, volume, issue, pages, publisher, and place of publication). Where multiple temperature estimates have been published over time from the same site, we chose the most recent publication for inclusion in the database (so long as the data were not flagged as erroneous) (Fig. 3). Note that alkenone proxies are interpreted as providing annual SST estimates.
Here we use the mean temperature estimates to constrain the role of thermal expansion in global sea level rise across the LIG and provide boundary conditions for future modelling studies investigating the impact of warming on polar ice sheets. To determine the greatest possible contribution of warming to ocean thermal expansion and ice sheet melt, we used the published age models to identify the maximum annual SST within the first 5 kyr of the LIG (i.e. 129–124 ka). For the purpose of this sensitivity analysis, the maximum temperatures were assumed to be synchronous globally, a scenario we recognize as unlikely but which does provide an upper limit for warming in the “early” LIG. To provide an upper estimate on the magnitude of warming in polar waters over the deglaciation, we also report here the difference between late Marine Isotope Stage 6 mean SSTs (∼ 140–135 ka) and the maximum early LIG SSTs for marine cores in the mid- to high-latitudes. To calculate the anomaly relative to present day, we utilize SSTs from the nearest 0.5∘ latitude × 0.5∘ longitude averaged across the period 1981–2010 (Rayner et al., 2003). For the uncertainties calculated for the regional and global SST anomalies, we incorporate the uncertainties from the proxies (reported in the database), and the uncertainties associated with estimating regional and global temperatures from limited spatial coverage. To achieve this we propagated the SST uncertainties for each measurement through each of the averaging steps (i.e. temporal to grid cell to zonal to area-weighted global) in our ocean-area-weighted average (McKay et al., 2011). We used quoted uncertainty estimates for each study where reported; if not available, we applied proxy-specific uncertainty estimates. Although the impact of the spatial coverage was not explored in this study, it has been previously estimated using the same approach (McKay et al., 2011). In that study, the uncertainty associated with the limited spatial range of the oceanographic proxies was estimated by calculating 1000 random 1-year global SST anomalies over the 20th century and comparing them to averages derived using only the palaeoceanographic network. No systematic biases were identified, with a 1σ uncertainty estimated to be < 0.1 ∘C. In this study, we have expanded the spatial network and consider ±0.1 ∘C to be a reasonable, high-end uncertainty estimate.
The database comprises six worksheets of data comprising maximum annual temperatures during the early LIG (defined here as the maximum temperature reported within the first 5 millennia of the LIG; 129–125 ka), mean annual temperature, the Marine Isotope Stage 6/5 SST difference, December to February temperature (DJF; Northern Hemisphere winter and Southern Hemisphere summer), June to August temperature (JJA; Northern Hemisphere summer and Southern Hemisphere winter), and summary statistics (see the Supplement).
-
The early maximum and mean annual SST dataset comprises 189 marine sediment and coral records from latitudes spanning from 55.55∘ S (radiolaria assemblage transfer function reconstruction obtained from site V18-68) (CLIMAP, 1984) to 72.18∘ N (planktonic foraminifera assemblage modern analogue technique from site V27-60) (Vogelsang et al., 2001).
-
The mean December–February SST dataset comprises 99 marine sediment records from latitudes spanning from 61.24∘ S (diatoms transfer function reconstruction obtained from site PS58/271-1) (Esper and Gersonde, 2014) to 72.18∘ N (planktonic foraminifera assemblage modern analogue technique from site V27-60) (Vogelsang et al., 2001).
-
The mean June–August SST dataset comprises 92 marine sediment records from latitudes spanning from 54.55∘ S (radiolaria assemblage transfer function reconstruction obtained from site V18-68) (CLIMAP, 1984) to 72.18∘ N (planktonic foraminifera assemblage modern analogue technique from site V27-60) (Vogelsang et al., 2001).
In total, the Last Interglacial SST database comprises a total of 203 unique sites described in 100 publications.

Figure 4Quality control plot of latitudinal distribution of proxy mean annual Last Interglacial sea surface temperature anomalies. Estimates given relative to the modern period (1981–2010) (Rayner et al., 2003) with no drift correction (upper panel) and 30 d drift (lower panel). The lower panel shows drift-corrected SSTs as open symbols with the uncorrected SSTs given as filled symbols. Uncertainties in the upper panel given at 1σ.
2.2 Ocean drift
Crucially, modern calibration relationships are an average developed using a selected number of locations that will not necessarily capture the range of “signal drift”. This drift is caused by the fact that planktic SST recorders can be transported over considerable distances in the water column before being deposited, which particularly applies to all those sites that lie under strong boundary currents or near major ocean fronts (van Sebille et al., 2015). Unfortunately, Ocean General Circulation Models (OGCMs) typically have insufficient spatial resolution to capture mesoscale features that are critical for modelling the lateral drift of particles (Nooteboom et al., 2020). To investigate the impact of drift on SST reconstructions, we therefore used contemporary ocean circulation as a first-order approximation for the LIG. Whilst we acknowledge that there was likely a weakening of the Atlantic Meridional Overturning Circulation (AMOC) during the early LIG (Shackleton et al., 2020; Turney et al., 2020a; Thomas et al., 2020; Jones et al., 2017), subsequent recovery after 127 ka appears to have established a global circulation comparable to present day as suggested by recent ocean δ13C modelling results across the mid-interglacial (Bengtson et al., 2020). We performed an experiment with virtual particles in an eddy-resolving ocean model (the Japanese Ocean model For the Earth Simulator, OFES) (Masumoto et al., 2004), which has a 1∕10∘ horizontal resolution and near-global coverage between 75∘ S and 75∘ N (van Sebille et al., 2012). Utilizing the 3D velocity field of the model, we used the Parcels code (http://oceanparcels.org/, last access: 4 December 2020; Lange and van Sebille, 2017) to compute the trajectories of more than 170 000 virtual planktic particles that end up at each of the sites by tracking them backwards in time, first simulating the sinking to these sites at 200 m d−1 and subsequently the advection at 30 m depth for a lifespan of 30 d; coral SSTs were not corrected for drift. Given the lifespan of most organisms that have been used to generate a temperature signal (Jonkers et al., 2015; Bijma et al., 1990), we consider a 30 d drift provides a reasonable estimate of the drift distance. Previous work has demonstrated comparable uncertainties between different models (van Sebille et al., 2015), providing confidence in the use of the OFES for the purposes of this study.
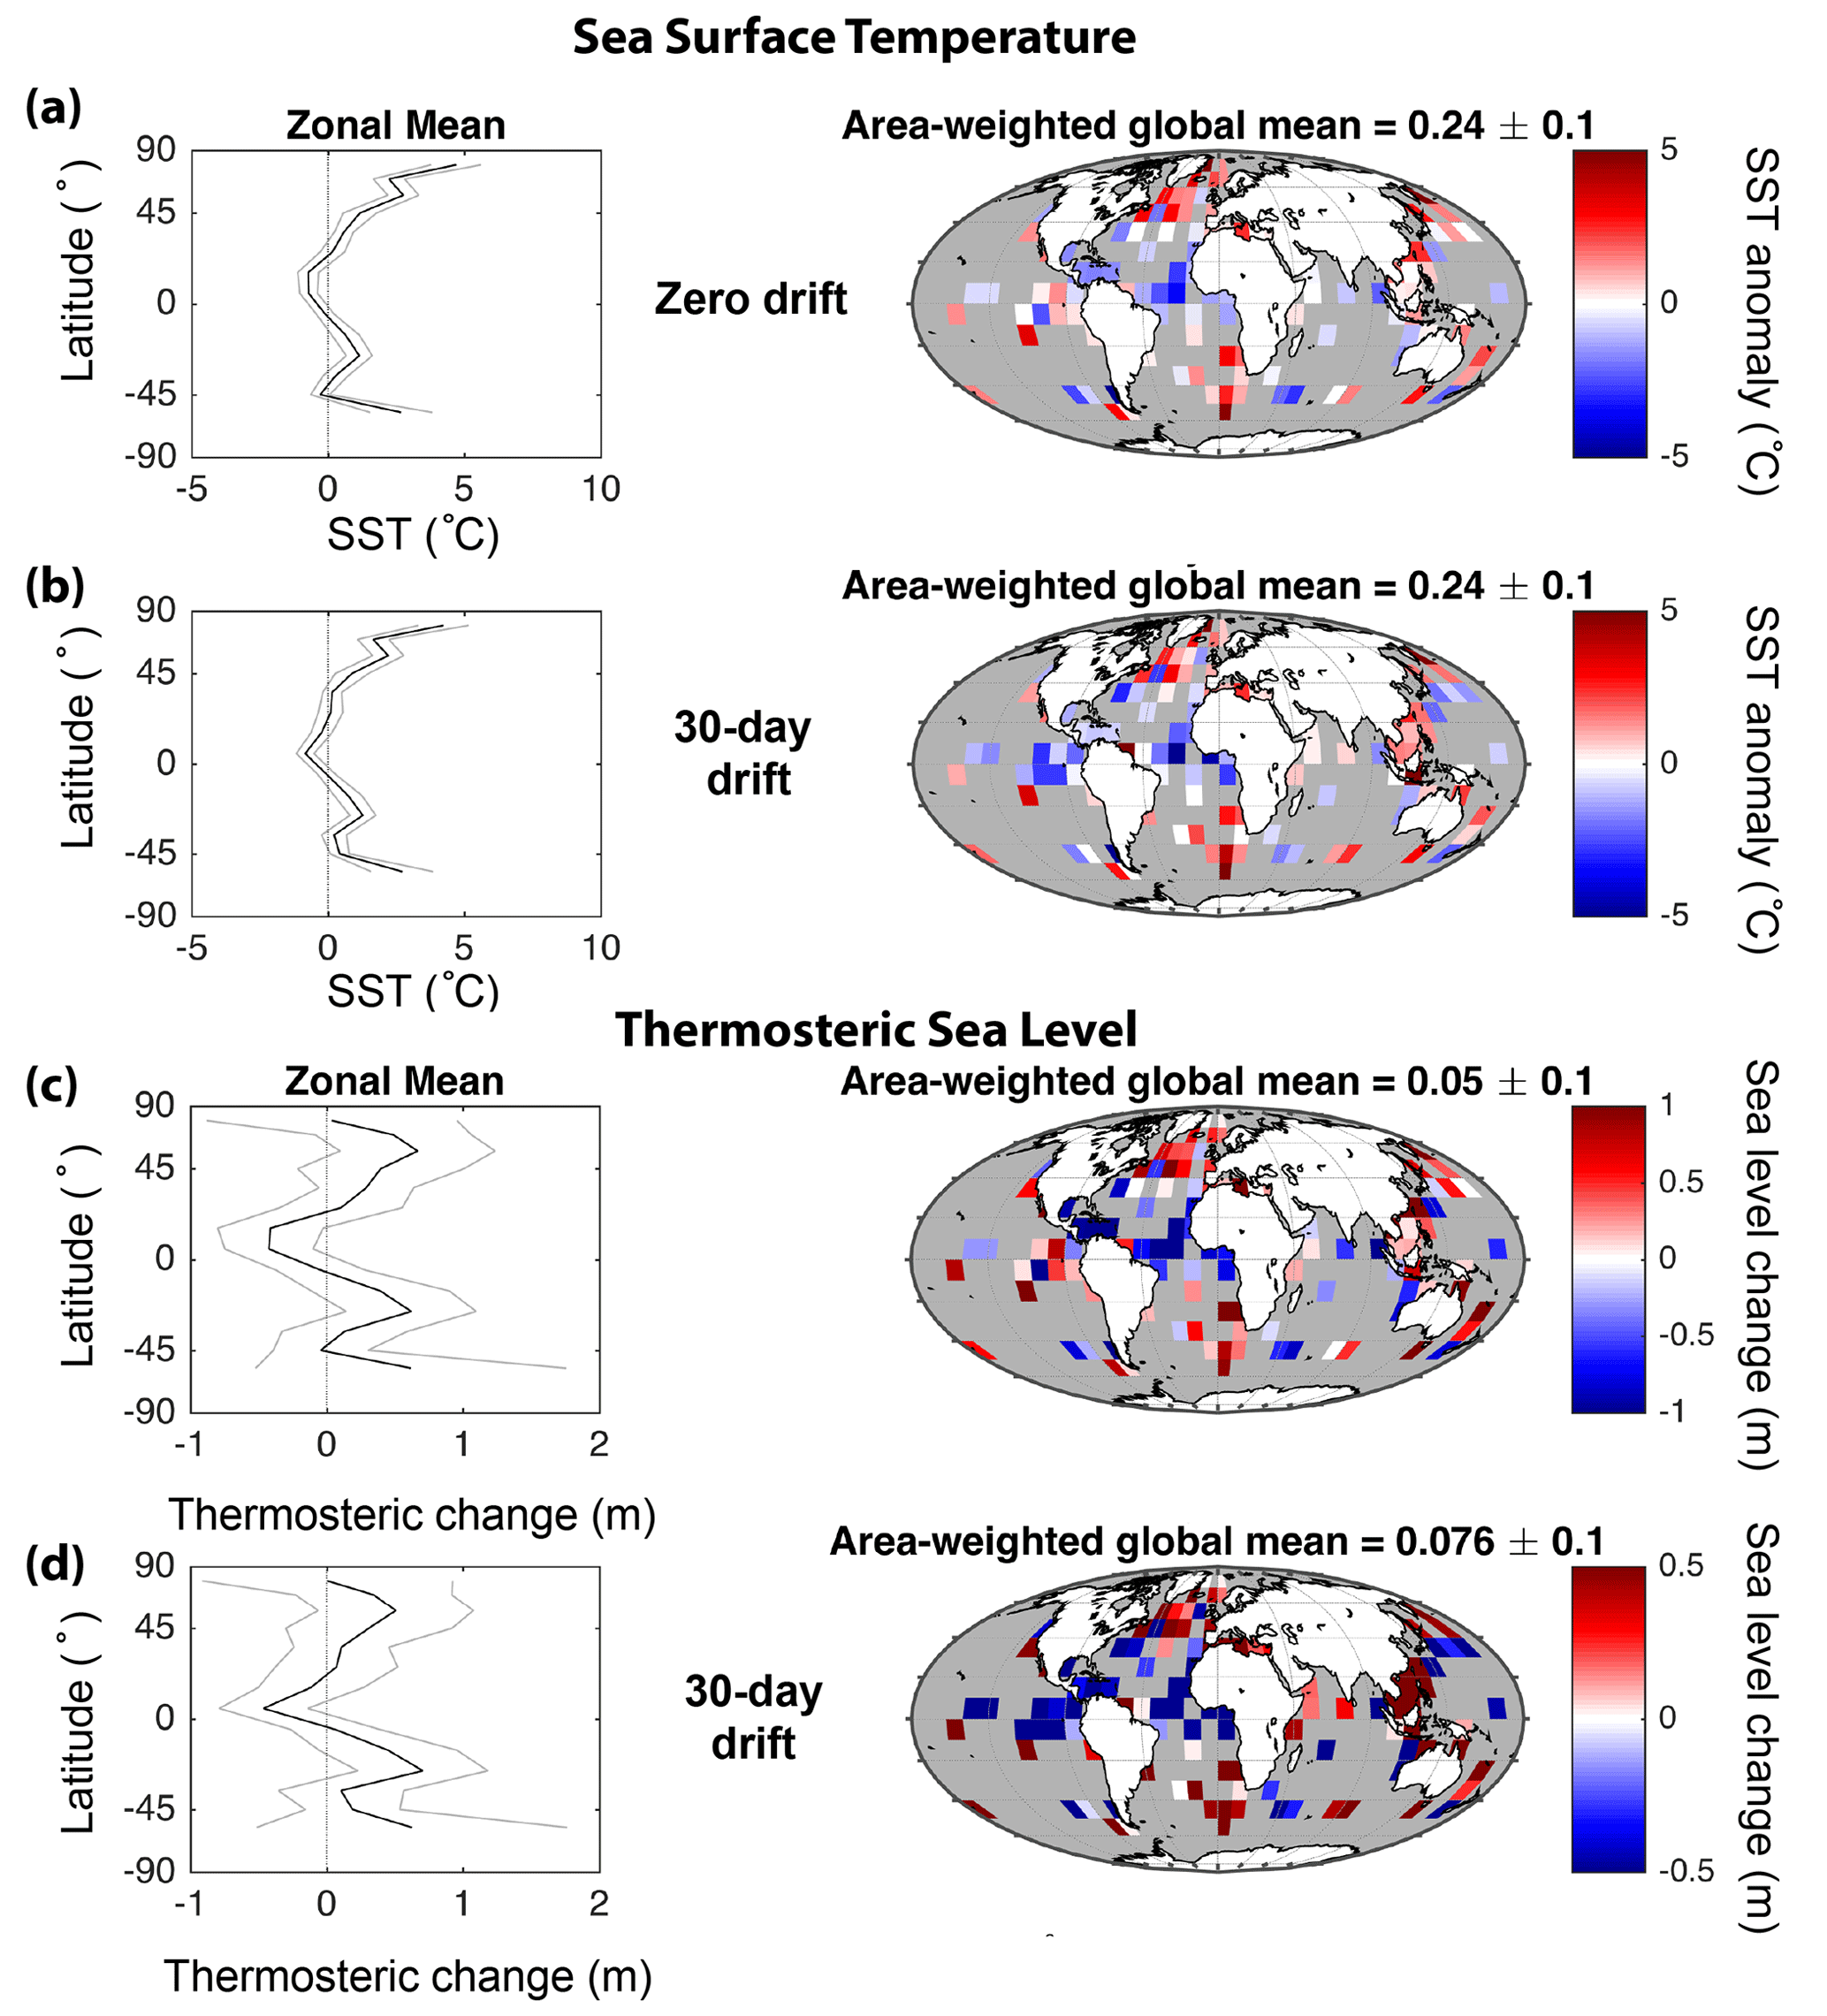
Figure 5Global and zonal mean annual sea surface temperature (SST) anomalies and SST-derived thermosteric sea level change across the full Last Interglacial reported as uncorrected (panels a and c, respectively) and corrected values, i.e. after applying 30 d (panels b and d, respectively) temperature offsets arising from drift with ocean currents. Uncertainty for zonal average reconstructions given at 1σ. Here ocean warming is assumed to have penetrated to 2000 m depth on average. Temperature estimates are relative to the modern period (1981–2010 CE).
During the 30 d lifespans, we recorded the temperatures along the trajectories and compared those to the local temperature at 30 m water depth at the site where the particles would end up on the ocean floor. This resulted in daily temperature anomalies along the trajectories, which were averaged through the lifespan and over the 840 virtual particles that ended up at each site and then subtracted from the reported LIG estimates (Fig. 1 and Database). With the recent recognition that core-top calibrations may be incorrect given historic changes in marine communities that have accompanied anthropogenic warming (Jonkers et al., 2019), it should be noted that SST proxy calibrations based on regional core-top calibrations may give an incorrect absolute value, an aspect that will form the focus of future work.
2.3 Hemispheric and global calculations
Global mean SST anomalies were calculated by averaging anomalies in a 10∘ latitude × 10∘ longitude grid and then averaging them globally after weighting for the area of ocean in each grid cell (Fig. 5). The uncertainty calculated for global SST anomalies incorporates uncertainties in the SST proxies as reported in the original studies, which typically range from 1 to 2 ∘C, and is then propagated through subsequent steps in the analysis. Additional uncertainty associated with estimating global anomalies from limited spatial coverage and the potential impacts of age uncertainty or averaging non-synchronous data are not considered here. Consequently, the derived estimates do not capture all of the uncertainty in global and zonal SST anomalies; however, the zonal consistency of the results suggests that the signal is large enough to overcome these unquantified sources of uncertainty. Furthermore, whilst some regions may exhibit substantial differences arising from drift (Fig. 4), globally the mean annual temperature estimates are comparable (Fig. 5). The new LIG SST dataset allows us to report the estimated thermosteric contribution to LIG sea levels using the method reported by (McKay et al., 2011). We use the above temperature changes to calculate the thermosteric contribution to LIG sea levels by using the Thermodynamic Equation of Seawater 2010 (TEOS-10). To provide an estimate of thermosteric sea level rise, we explored a range of scenarios where warming penetrated different ocean depths: 700 m, 2000 m (approximately the upper half of the ocean), and 3500 m (the whole ocean). We determined the change in the specific volume of the warmed water column of each 10∘ latitude × 10∘ grid cell while holding the salinity constant and neglecting changes in ocean area. Here absolute temperature is considered, as specific volume is more sensitive to temperature changes at warmer temperatures.
3.1 Quality control
The Last Interglacial SST database is derived from published articles that have already been peer-reviewed. To generate the database, we undertook a comprehensive check to remove duplicate records, erroneous location information, and other errors. In addition, to ensure consistency of data processing and any recalculations (for instance, sea surface temperature anomalies relative to the period 1981–2010 CE), we also checked uncertain metadata reported for individual sites, and directly communicated with selected article authors and/or other experts as part of the record-validation process.
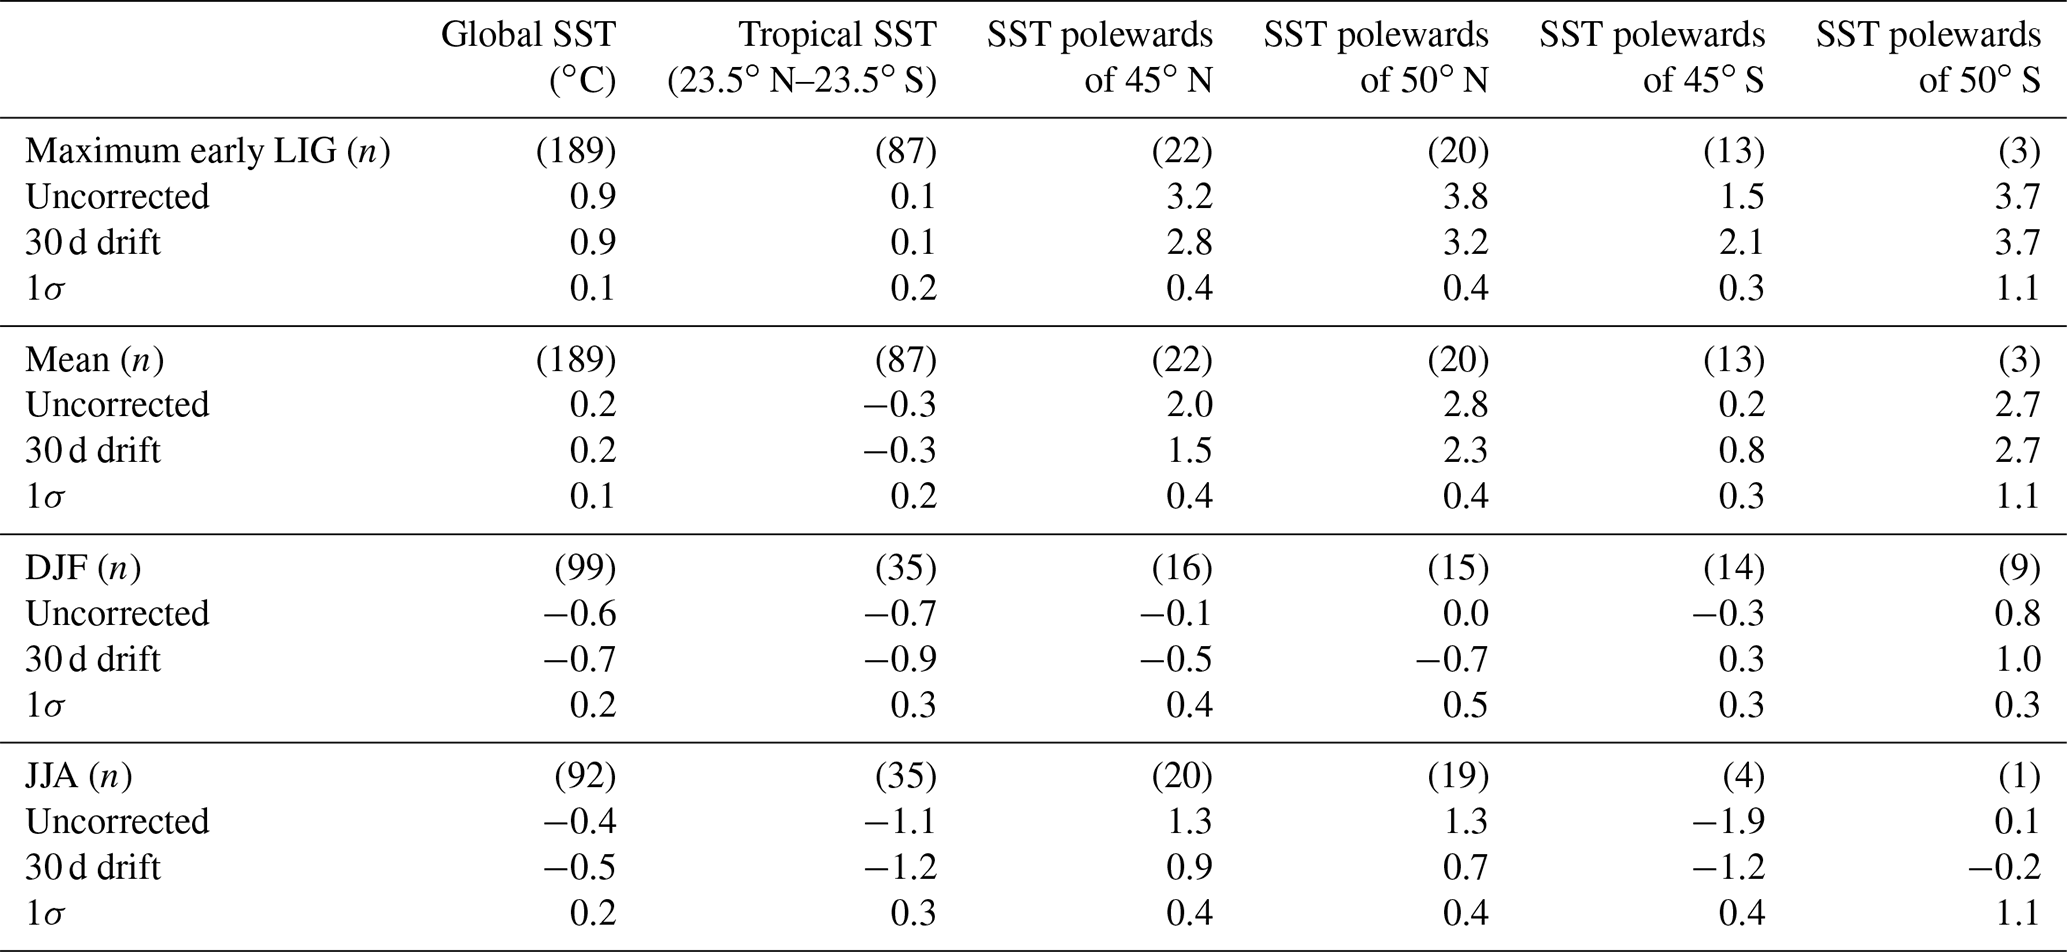
Table 1Annual and seasonal temperature estimates for the Last Interglacial. DJF: December to February; JJA: June to August. Temperature anomalies relative to the period 1981–2010 CE. Maximum early temperature is defined as the maximum annual temperature recorded during the estimated first 5 millennia of the Last Interglacial.
3.2 Ocean circulation
A challenge for the Last Interglacial is determining what influence (if any) ocean circulation had on the temperatures experienced (and reconstructed) by organisms that are used to generate SST reconstructions. Addressing this issue is an important objective of the current study, but we found the magnitude of temperature offset (bias) is limited to only a few key locations (Fig. 1), with similar final reconstructions for individual sites, and latitudinally averaged and globally averaged temperatures (Figs. 4 and 5, and Table 1). This provides an important check of our temperature recalculations. As a sensitivity test, we therefore explored virtual planktic particles that “live” for 30 d to investigate whether a prolonged period of drift made a discernible difference (data not reported here). Only a few species have been suggested as living for a longer period of time. For instance, in laboratory experiments the planktic foraminifer Neogloboquadrina pachyderma sinistral has been shown to survive up to 230 d (Spindler, 1996), but this species may be an exception due to its ability to survive in sea ice (Dieckmann et al., 1991).
Using 30 d drift to simulate the travelling time and lifespans of virtual planktic particles in the upper part of the water column, we quantified the inherited temperature signal of flora and fauna at each site in the database. The virtual microorganisms with a 30 d “lifespan” travelled from a few dozen to a few hundred kilometres. The temperature offsets are almost all positive in the tropical eastern Pacific, the North Atlantic, and the South China Sea, meaning that the planktic particles originated from warmer climates and hence record a higher temperature estimate than local conditions would suggest; the opposite effect was observed in the tropical western Pacific and Southern Ocean (Fig. 1). The offset can be substantial – with values ranging from −6.9 ∘C for site MD98-2162 at 4.7∘ S in the tropical western Pacific (Visser et al., 2003) and up to 3.5 ∘C for site RC13-110 on the Equator (Pisias and Mix, 1997) – with the largest changes associated with boundary currents and major ocean fronts. Intriguingly, these values are comparable to the difference previously reported for Mg ∕ Ca foraminifera core-top calibration with those obtained from laboratory-cultured Mg ∕ Ca calibrations (Elderfield and Ganssen, 2000; Hönisch et al., 2013). Both the uncorrected and 30 d drift temperatures are provided in the database. These temperature reconstructions led to statistically indistinguishable global temperature (and thermosteric sea level change; Fig. 5). Users of the database are therefore able to use either the authors' original sea surface temperature determinations or our drift-corrected estimates, as required.
3.3 Proxy and seasonal effects
To evaluate potential biases in our analysis, we further subsampled our database by proxy type (Fig. 4). The large network of sites and proxies does not appear to demonstrate any significant offset in annual reconstructions (at least within the uncertainty of the reconstructions), although there is a tendency for alkenone temperatures to be at the upper end of the range, implying there may be a seasonal bias, as reported previously (Hoffman et al., 2017). Importantly, we also compiled seasonal quantified temperature estimates that have been reported as the seasonally warmest or coolest months in the year (taken here to represent June–August and December–February depending on the hemisphere being considered). Our result suggests that any bias, if real, is smaller than the uncertainties at the global or zonal level reported here. Intriguingly, the warmest month estimates for the high latitudes in both hemispheres show more muted warming than the mean annual estimates, while the low to mid-latitudes exhibit considerably cooler estimates (Table 1). In contrast to the alkenone estimates for the annual estimates, the more muted response of foraminifera, radiolaria and diatoms for the seasonal reconstructions implies that they are influenced by a larger part of the seasonal cycle. We therefore consider that seasonal reconstructions should be treated as conservative estimates of temperature for the LIG.
3.4 Average and early temperatures during the Last Interglacial
We find global average annual temperatures across the full duration of the LIG were only marginally warmer than present day. We derive a global mean annual temperature anomaly of 0.2 ± 0.1 ∘C, the same value obtained after correcting for drift (Table 1). These values, however, mask considerable zonal differences, with significantly cooler mean annual uncorrected temperatures (i.e. not corrected for drift) within 23.5∘ of the Equator (−0.3 ± 0.2 ∘C) and amplified warming polewards (Fig. 5). Ideally, we would have a dense network of records in the mid-latitudes to high latitudes for investigating the impact of warming surrounding polar ice sheets, but unfortunately the number of sites and their spatial distribution does appear to have an impact on the reconstructed values. Comparison of the SST anomalies poleward of 45 and 50∘ latitude (Table 1) shows substantial differences, most notably in the Southern Hemisphere where a large increase in zonally averaged SST occurs alongside a decrease in the number of records polewards of 50∘ S (Table 1). For instance, the drift-corrected SSTs for the LIG are 0.8 ± 0.3 ∘C (n=13) and 2.7 ± 1.1 ∘C (n=3) polewards of 45 and 50∘ S, respectively. It should also be noted that while the Northern Hemisphere polar estimates are similar for both latitudinal ranges, the majority of sites are in the North Atlantic, with limited representation in the Pacific Ocean (Fig. 1). We therefore recommend that when considering mid- to high-latitude zonal SST averages, the values derived from records polewards of 45∘ latitude are more likely robust but acknowledge these may be conservative estimates (with considerably larger warming further to the south). We therefore estimate uncorrected “polar” warming in the Northern Hemisphere to be 2.0 ± 0.4 ∘C and 0.2 ± 0.3 ∘C in the Southern Hemisphere (Table 1). Correcting for drift decreased the northern estimate to 1.5 ± 0.4 ∘C and increased in the south to a mean annual SST to 0.8 ± 0.3 ∘C.
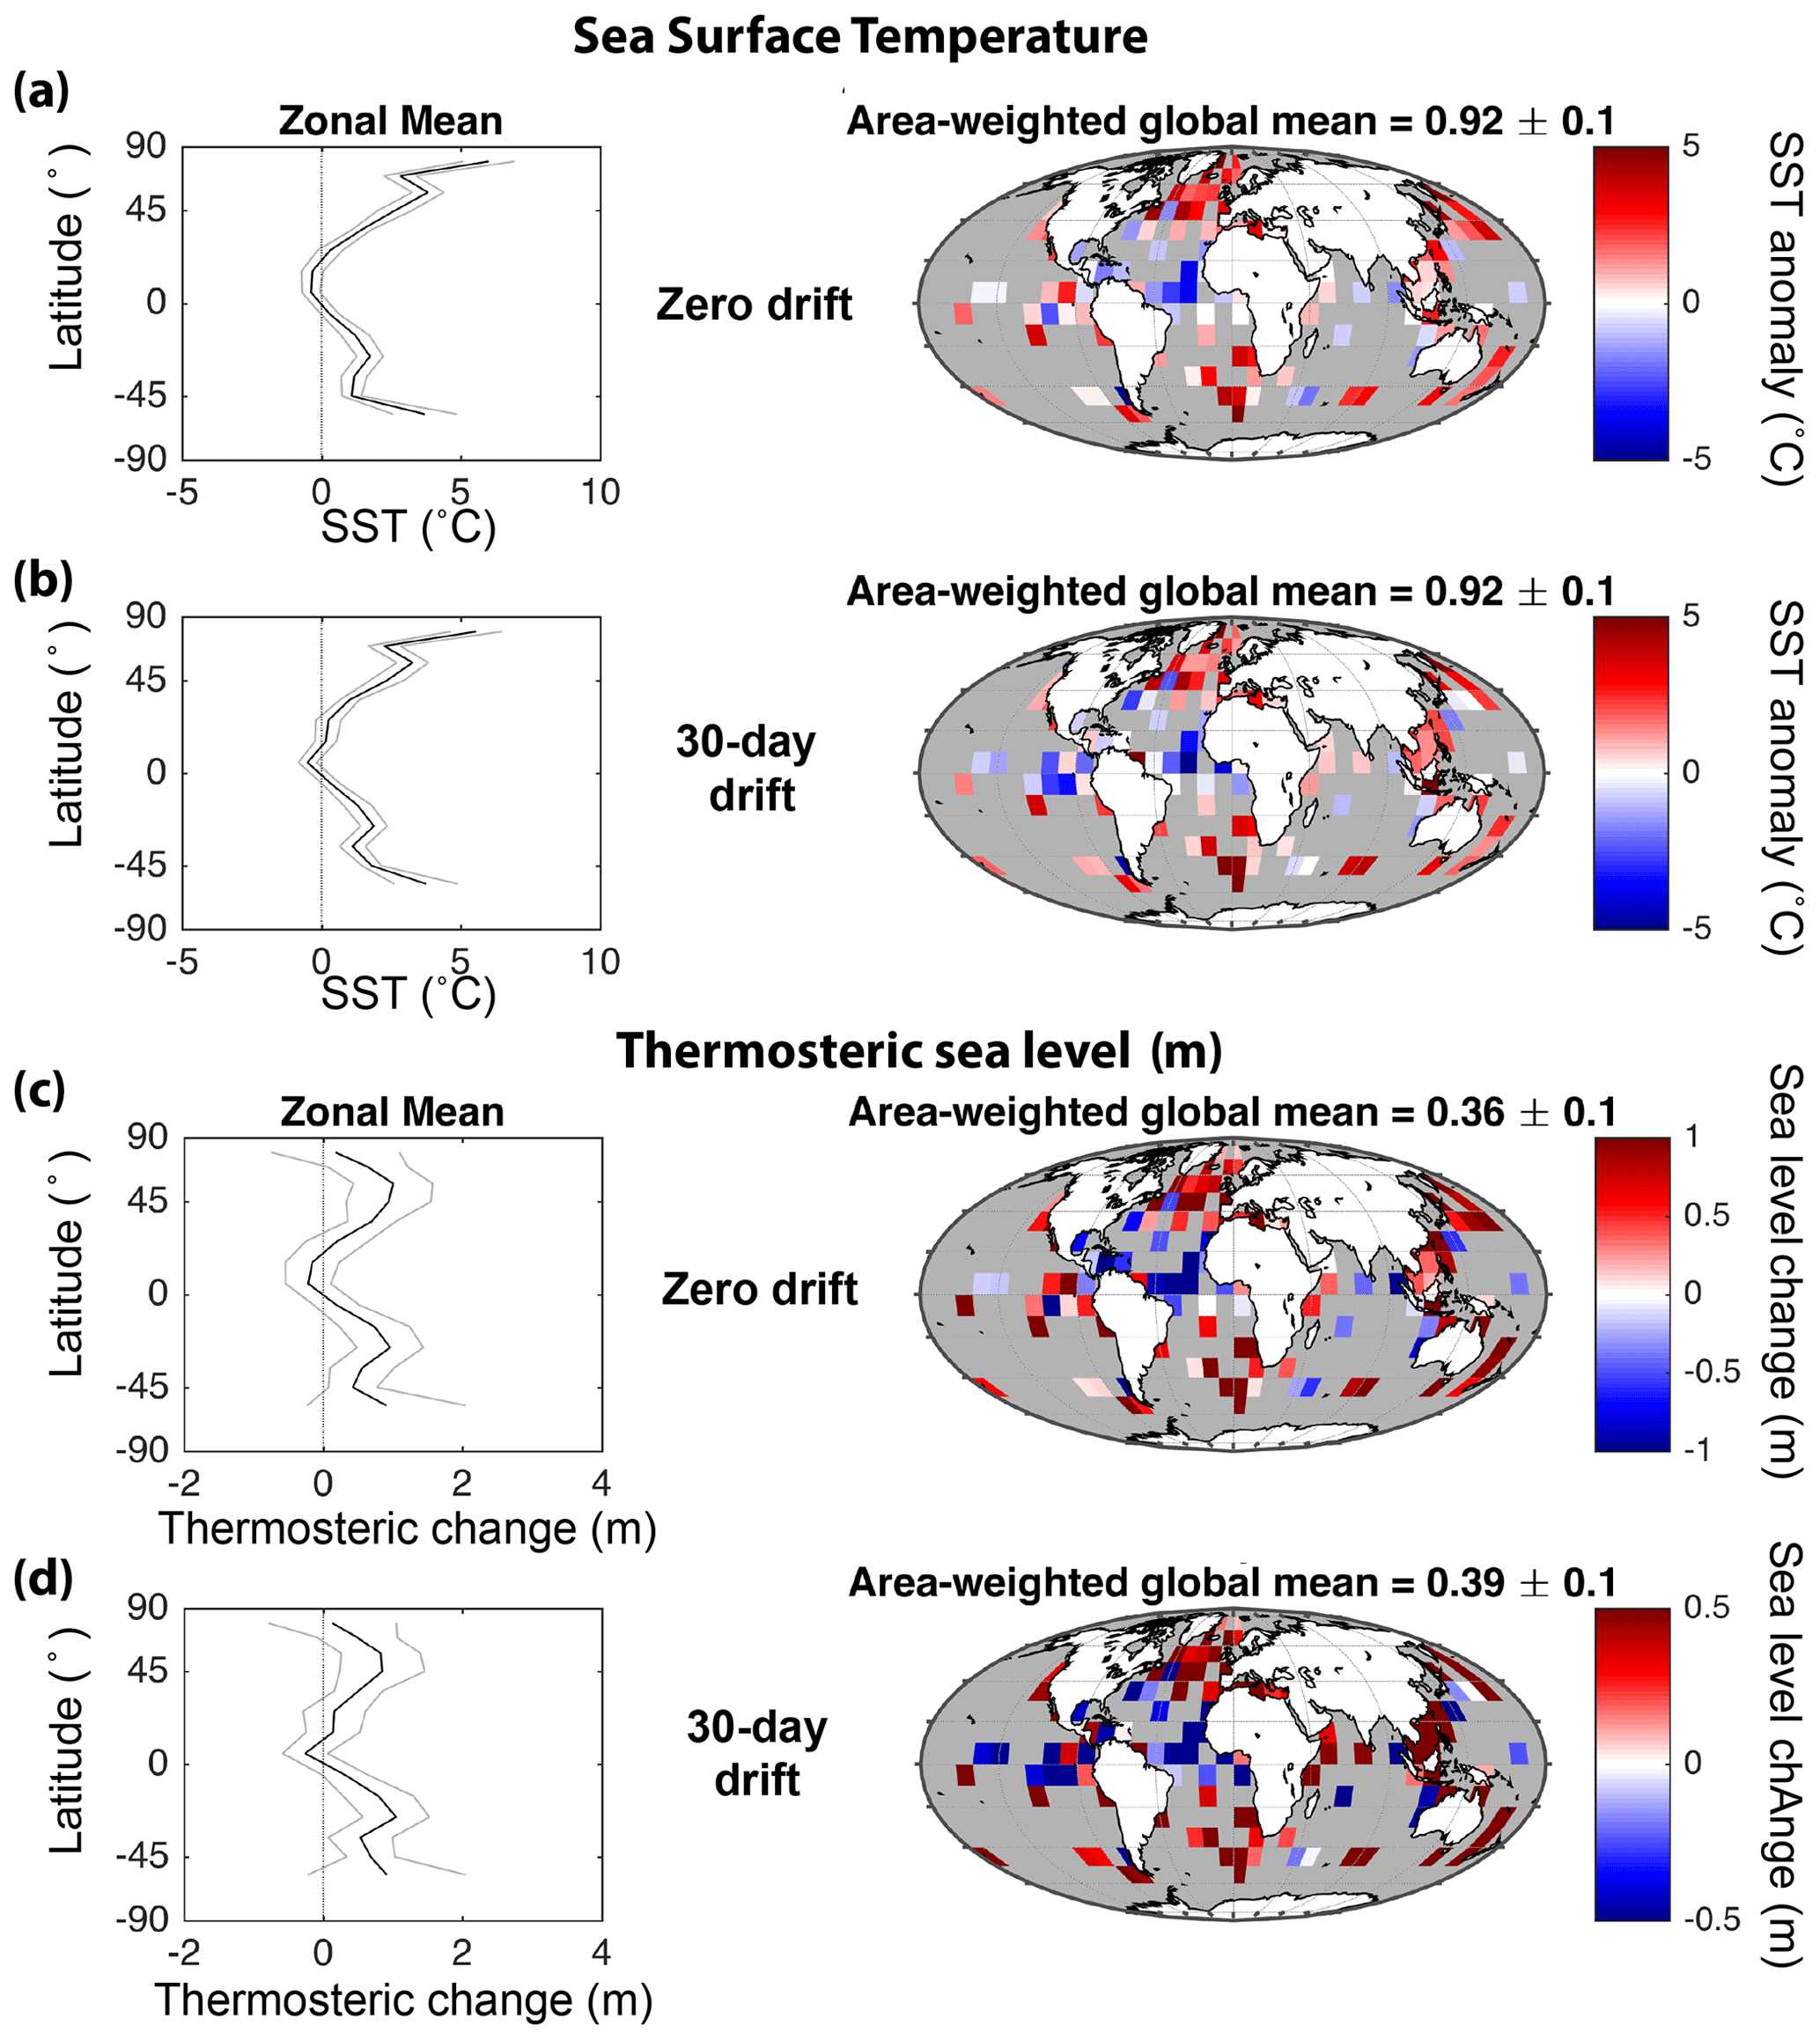
Figure 6Global and zonal mean annual sea surface temperature (SST) anomalies and SST-derived thermosteric sea level change during the early Last Interglacial reported as uncorrected (panels a and c, respectively) corrected values, i.e. after applying 30 d (panels b and d, respectively) temperature offsets arising from drift with ocean currents. Uncertainty for zonal average reconstructions are given at 1σ. Here ocean warming is assumed to have penetrated to 2000 m depth on average. Temperature estimates are relative to the modern period (1981–2010 CE).
The maximum temperatures of the early LIG were up to 0.9 ± 0.1 ∘C warmer than 1981–2010, regardless of whether the values were corrected for drift or not (Table 1 and Fig. 6). Similar to the mean SSTs of the LIG, there were apparently considerable zonal differences in the uncorrected values: 0.1 ± 0.2 ∘C within 23.5∘ of the Equator, 3.2 ± 0.4 ∘C polewards of 45∘ N, and 1.5 ± 1.1 ∘C polewards of 45∘ S. After correcting for drift, the estimated SST in the north changed to 2.8 ± 0.4 ∘C and in the south it changed to 2.1 ± 1.1 ∘C. The latter estimate from the Southern Hemisphere is ∼ 2 ∘C (relative to 1981–2010), potentially providing an important constraint for future Antarctic ice sheet model simulations for the LIG (Turney et al., 2020a; Golledge et al., 2015). These data support previous work which reported substantial polar temperature amplification during the LIG, particularly in the Northern Hemisphere (described in the literature as “Arctic amplification”) (Overpeck et al., 2006; Mercer, 1978; Mercer and Emiliani, 1970; Thomas et al., 2020; Miller et al., 2010). The global temperature pattern closely follows insolation changes across this period, during which the Earth's greater eccentricity led to reduced radiation over the Equator and more intense high-latitude spring–summer insolation (Fig. 2) (Overpeck et al., 2006; Hoffman et al., 2017). Comparison to Marine Isotope Stage 6 SSTs appears to show the greatest warming in the northeastern Atlantic and southern Atlantic (Fig. 7), suggesting that the Greenlandic and the West Antarctic ice sheets would have been particularly vulnerable to warming in the early interglacial (Clark et al., 2020; Turney et al., 2020a; Dutton et al., 2015; Mercer, 1978) though we cannot resolve the relative timing of mass loss in this analysis (Rohling et al., 2019; Hayes et al., 2014). Recent work suggests the earliest warming took place in the Atlantic (and Indian) Ocean sectors of the Southern Ocean (Chadwick et al., 2020), consistent with our findings. However, our observed polar warming is larger than in some climate model simulations, implying the latter fail to capture one or more key feedbacks (e.g. carbon, sea ice and ice sheet feedbacks) in the climate system (Bakker et al., 2013; Otto-Bliesner et al., 2013; Thomas et al., 2020; Clark et al., 2020; Fogwill et al., 2015).
Table 2Annual temperature-derived thermosteric contributions to global sea level during the Last Interglacial for ocean warming down to different water depths.
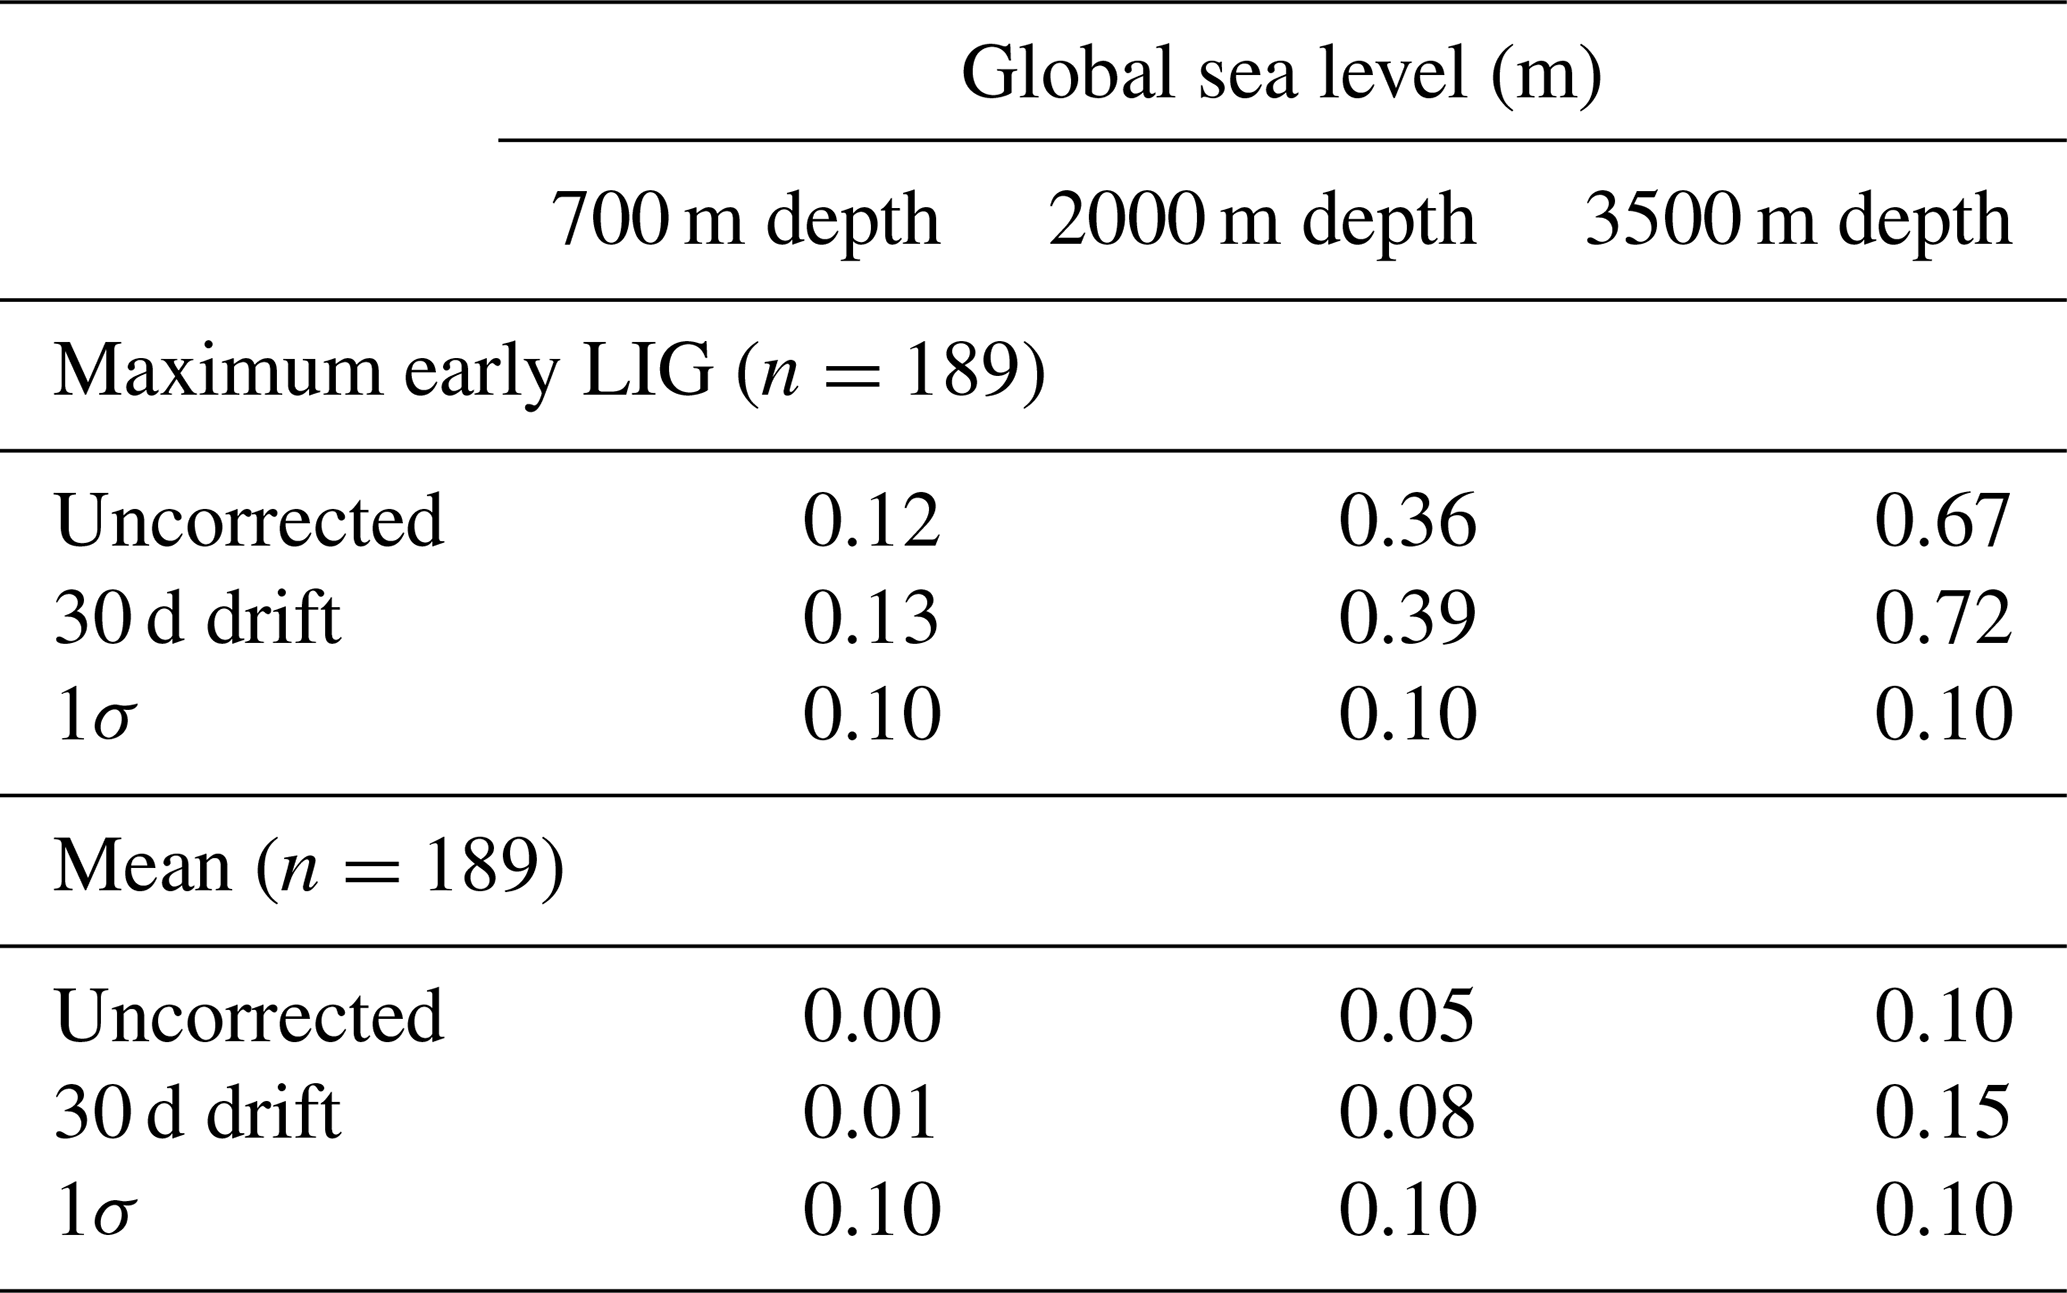
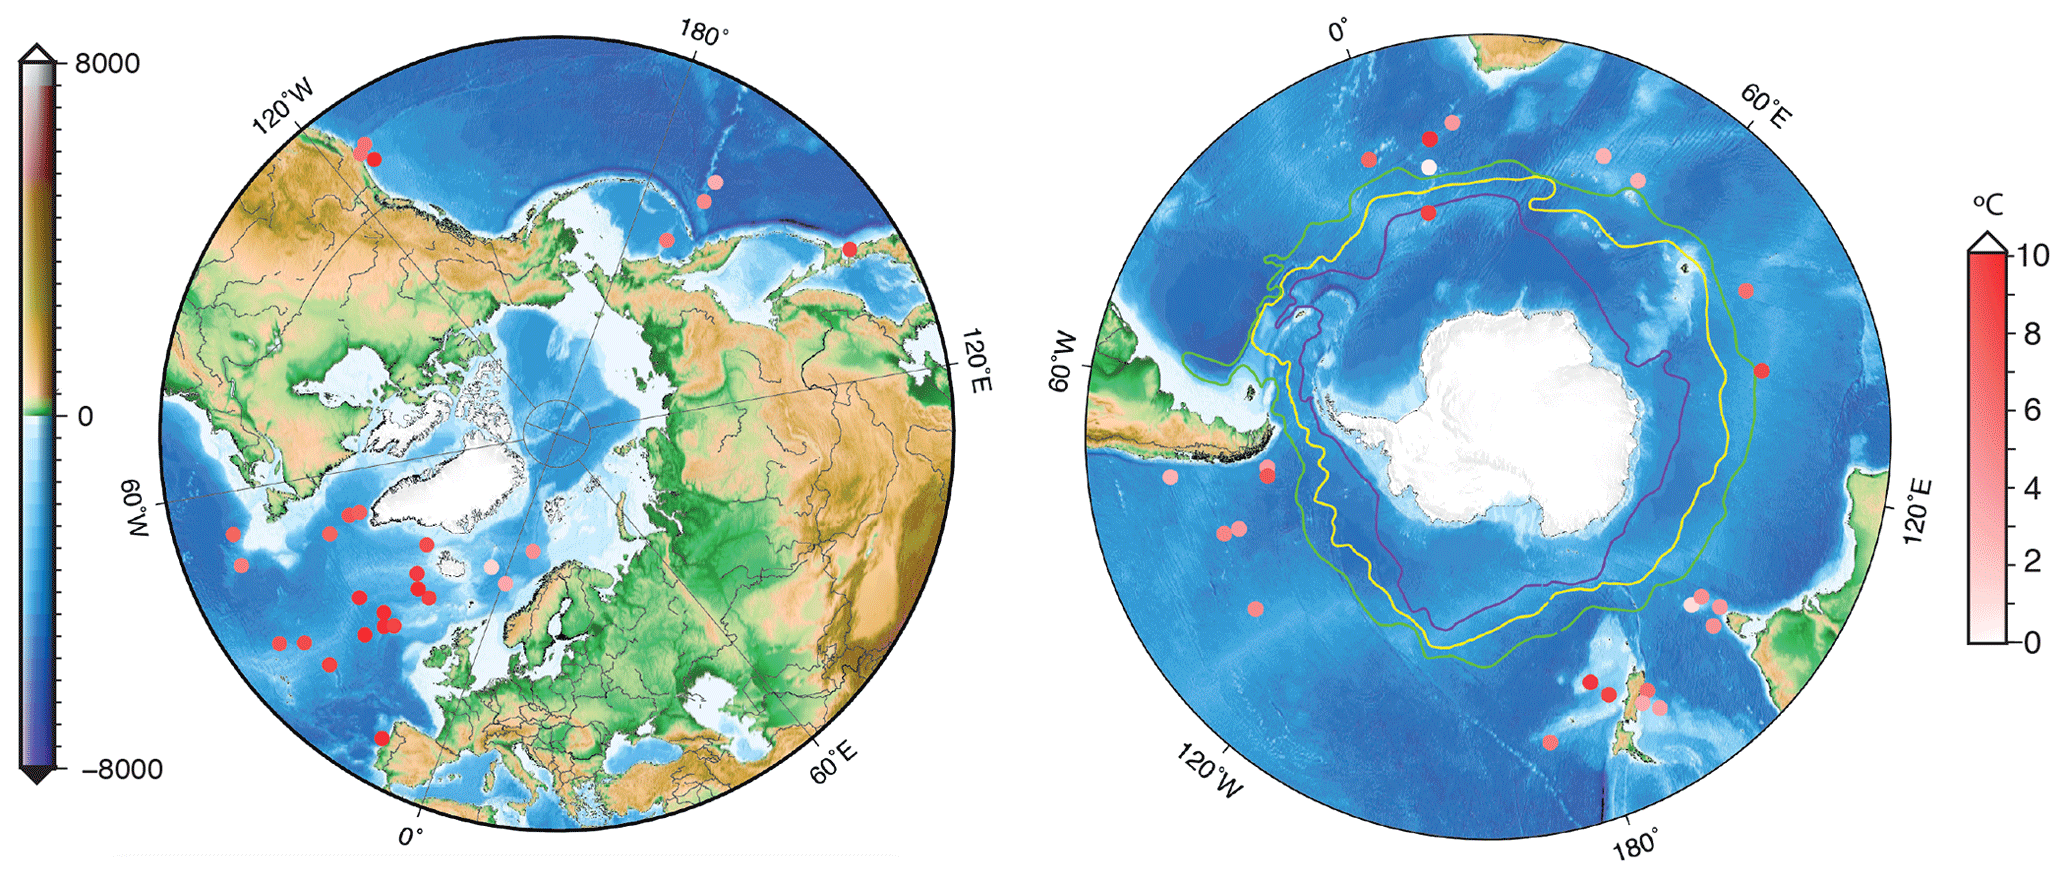
Figure 7Mid- to high-latitude sea surface temperature (SST) differences between SSTs in late Marine Isotope Stage 6 and maximum SSTs of the early Last Interglacial (Stage 5). Map made using Generic Mapping Tools (GMT) (Wessel et al., 2013).
3.5 Thermal expansion contribution to Last Interglacial sea level
The LIG is characterized by higher GMSL than present day (+6.6 to +11.4 m) (Grant et al., 2014; Dutton et al., 2015; Turney and Jones, 2010; Rohling et al., 2017, 2019). Here we quantified the contribution of the relatively high temperatures to global sea levels through ocean thermal expansion for warming down to 2000 m water depth (Table 2). We find that through the LIG, the average SST contribution to thermosteric sea level was negligible, approximately 0.05 ± 0.10 m uncorrected for ocean drift and 0.08 ± 0.10 m corrected for drift, consistent with a recent reconstruction of near-modern global ocean heat content and negligible thermosteric sea level rise (Shackleton et al., 2020). But for the early LIG (129–124 ka), using our maximum SST estimate, we obtained high-end estimates of thermal expansion to GMSL of 0.36 ± 0.10 m (uncorrected) and 0.39 ± 0.10 m (drift-corrected). These quantified estimates are comparable to a previously reported value of 0.4 ± 0.3 m (McKay et al., 2011), which used the same methodology as here but a smaller network of SST records. However, we should recognize that the depth of ocean warming is uncertain, and could have extended deeper than 2000 m. If we assume warming penetrated the full ocean depth (down to 3500 m), we obtained a maximum early LIG thermosteric sea level rise of 0.67 ± 0.10 m (uncorrected) and 0.72 ± 0.10 m (drift-corrected) (Table 2). The recently reported early LIG (∼ 129 ka) peak in global ocean heat content reconstructed from isotopic ratios of atmospheric trace gases has determined a maximum thermal expansion of 0.7 ± 0.3 m (Shackleton et al., 2020). To achieve ∼ 0.7 m of thermosteric sea level rise during the early interglacial peak in temperatures, we have to use both our maximum estimate of temperature rise and our maximum estimate of the depth of warming. A recent modelling-proxy estimate proposed a range of 0.08 to 0.51 m for peak LIG warmth centred at 125 ka (Hoffman et al., 2017), which is more consistent with our results. Even though 125 ka is later than the peak in global ocean heat content, this is effectively the same event but represents the age uncertainties in the marine records. Although some uncertainty remains in the amplitude of thermal expansion between these studies, it is clear that the sustained high global sea levels across the LIG and the limited role of warming on thermal expansion implies a greater contribution from ice sheets, mountain glaciers, permafrost, and hydrological change. With the greatest warming relative to Marine Isotope Stage 6 in the Atlantic basin (Fig. 7), our results are consistent with previous studies suggesting substantial mass loss from the Greenland and the West Antarctic ice sheets early in the Last Interglacial (Clark et al., 2020; Turney et al., 2020a; Dutton et al., 2015; Mercer, 1978; Hayes et al., 2014; Rohling et al., 2019).
The Last Interglacial SST database is provided as an Excel workbook in the Supplement and by the PANGAEA Data Publisher at https://doi.org/10.1594/PANGAEA.904381 (Turney et al., 2019); the data are also available on the NCEI-Paleo/World Data Service for Paleoclimatology at https://www.ncdc.noaa.gov/paleo/study/26851 (Turney et al., 2020b). This release comprises a single tab-delimited Excel file. We welcome contributions of additional or clarifying information from authors. These will be incorporated into any subsequent iteration of the database. When using data in this compilation, the original data collector(s), as well as the data compiler(s), will be credited. Given the typically large uncertainties in the absolute dating of each individual record, no attempt has been made to develop individual time series, and only mean values across the LIG have been compiled. For simplicity we record the 1σ (68 %) confidence interval in the site temperature reconstructions. The inclusion of key metadata allows users to interrogate individual records for their own appropriate screening criteria.
During the Last Interglacial (LIG; 129–116 ka), global temperatures were up to 2 ∘C warmer than present, with marked polar amplification and global sea levels between 6.6 and 11.4 m higher than present, offering a powerful opportunity to obtain key insights into the drivers of future change (a so-called “process analogue”). The contributions of different sources to the LIG sea level highstand remain highly uncertain, however. As a result of relatively warm surface temperatures, ocean thermal expansion was previously estimated to have contributed 0.4 ± 0.3 m. To more precisely constrain this contribution to global mean sea level, we report a new comprehensive database of quantified SST estimates derived from faunal and floral assemblages, Mg ∕ Ca and Sr ∕ Ca ratios of calcareous organisms, and U estimates from records spanning 55.55∘ S to 72.18∘ N. Here we have calculated maximum annual SSTs during the early interglacial (129–124 ka) and mean annual SSTs through the LIG (129–116 ka; 189 sites) alongside mean December–February (99 records) and June–August (92 records) values. Temperatures are reported as anomalies relative to the period 1981–2010 CE. To estimate the temperature footprint arising from ocean circulation we also report SST anomalies corrected for 30 d drift to simulate the travelling time and lifespans of virtual planktic particles in the upper part of the water column. Our reconstruction suggests an early LIG maximum global mean annual SST of 0.9 ± 0.1 ∘C and an average warming across the LIG of 0.2 ± 0.1 ∘C. However, these values are strongly driven by polar warming of several degrees, with little to no warming in the tropics. We find that the influence of warming on ocean thermal expansion had a limited influence on global mean sea levels across the full LIG, but with a likely range between 0.39 ± 0.1 m and 0.72 ± 0.10 m early in the interglacial. Our findings therefore imply a relatively greater contribution of ice sheets, mountain glaciers, permafrost, and hydrological change to global sea level during the LIG, likely driven by polar amplification of temperatures. We hope this database may provide a springboard for future studies that can bring to bear new geochronological methods (e.g. tephra) to constrain the age models of individual sequences to sub-millennial uncertainty, something currently not possible for most reported marine sequences. An improved network of high-resolution, well-dated and quantified LIG climate reconstructions (particularly in data-sparse locations) will enable precise integration of ice sheet, marine, and terrestrial records to better understand Earth system responses to high-latitude warming. The Southern Ocean and North Pacific are regions where major knowledge gaps currently exist.
The supplementary figures and version 1.0 of the database (Excel file) are available in the Supplement. The supplement related to this article is available online at: https://doi.org/10.5194/essd-12-3341-2020-supplement.
RTJ and CSMT conceived the research. CT, NPM, EvS, and ZT designed the methods and performed the analysis. CT wrote the paper with substantial input from all authors.
The authors declare that they have no conflict of interest.
It is our great sadness that our close friend and colleague Richard T. Jones was not alive to see the publication of this study. Without Richard this work would not have been possible. He is sorely missed.
Chris S. M. Turney and Christopher J. Fogwill were supported by their Australian Research Council (ARC) fellowships (FL100100195 and FT120100004). We also acknowledge the important role of the International Ocean Discovery Program (IODP), the Australian and New Zealand International Ocean Discovery Consortium (ANZIC), and the previous scientific ocean drilling programmes. Their results underpin this study, and this analysis would not have been possible without them. We are grateful to the four reviewers and editor for helping improve the first draft of this paper.
This research has been supported by the Australian Research Council (grant nos. FL100100195, FT120100004, and DE200100907).
This paper was edited by Giuseppe M. R. Manzella and reviewed by Jeremy Hoffman and two anonymous referees.
Anand, P., Elderfield, H., and Conte, M. H.: Calibration of Mg/Ca thermometry in planktonic foraminifera from a sediment trap time series, Paleoceanography, 18, 1050, https://doi.org/10.1029/2002pa000846, 2003.
Bakker, P. and Renssen, H.: Last interglacial model–data mismatch of thermal maximum temperatures partially explained, Clim. Past, 10, 1633–1644, https://doi.org/10.5194/cp-10-1633-2014, 2014.
Bakker, P., Stone, E. J., Charbit, S., Gröger, M., Krebs-Kanzow, U., Ritz, S. P., Varma, V., Khon, V., Lunt, D. J., Mikolajewicz, U., Prange, M., Renssen, H., Schneider, B., and Schulz, M.: Last interglacial temperature evolution – a model inter-comparison, Clim. Past, 9, 605–619, https://doi.org/10.5194/cp-9-605-2013, 2013.
Bard, E., Rostek, F., and Sonzogni, C.: Interhemispheric synchrony of the last deglaciation inferred from alkenone palaeothermometry, Nature, 385, 707–710, 1997.
Barnola, J. M., Raynaud, D., Korotkevich, Y. S., and Lorius, C.: Vostok ice core provides 160,000 year record of atmospheric CO2, Nature, 329, 408–413, 1987.
Bengtson, S. A., Menviel, L. C., Meissner, K. J., Missiaen, L., Peterson, C. D., Lisiecki, L. E., and Joos, F.: Lower oceanic δ13C during the Last Interglacial compared to the Holocene, Clim. Past Discuss., https://doi.org/10.5194/cp-2020-73, in review, 2020.
Bijma, J., Erez, J., and Hemleben, C.: Lunar and semi-lunar reproductive cycles in some spinose planktonic foraminifers, J. Foramin. Res., 20, 117–127, 1990.
Brohan, P., Kennedy, J. J., Harris, I., Tett, S. F. B., and Jones, P. D.: Uncertainty estimates in regional and global observed temperature changes: A new data set from 1850, J. Geophys. Res., 111, D12106, https://doi.org/10.1029/2005JD006548, 2006.
Capron, E., Govin, A., Stone, E. J., Masson-Delmotte, V., Mulitza, S., Otto-Bliesner, B., Rasmussen, T. L., Sime, L. C., Waelbroeck, C., and Wolff, E. W.: Temporal and spatial structure of multi-millennial temperature changes at high latitudes during the Last Interglacial, Quatern. Sci. Rev., 103, 116–133, https://doi.org/10.1016/j.quascirev.2014.08.018, 2014.
Capron, E., Govin, A., Feng, R., Otto-Bliesner, B. L., and Wolff, E. W.: Critical evaluation of climate syntheses to benchmark CMIP6/PMIP4 127 ka Last Interglacial simulations in the high-latitude regions, Quatern. Sci. Rev., 168, 137–150, 2017.
Chadwick, M., Allen, C. S., Sime, L. C., and Hillenbrand, C. D.: Analysing the timing of peak warming and minimum winter sea-ice extent in the Southern Ocean during MIS 5e, Quatern. Sci. Rev., 229, 106134, https://doi.org/10.1016/j.quascirev.2019.106134, 2020.
Clark, P. U., He, F., Golledge, N. R., Mitrovica, J. X., Dutton, A., Hoffman, J. S., and Dendy, S.: Oceanic forcing of penultimate deglacial and last interglacial sea-level rise, Nature, 577, 660–664, https://doi.org/10.1038/s41586-020-1931-7, 2020.
CLIMAP: The Last Interglacial ocean, Quatern. Res., 21, 123–224, 1984.
Cortese, G., Dunbar, G. B., Carter, L., Scott, G., Bostock, H., Bowen, M., Crundwell, M., Hayward, B. W., Howard, W., Martínez, J. I., Moy, A., Neil, H., Sabaa, A., and Sturm, A.: Southwest Pacific Ocean response to a warmer world: Insights from Marine Isotope Stage 5e, Paleoceanography, 28, 585–598, https://doi.org/10.1002/palo.20052, 2013.
Dakos, V., Scheffer, M., van Nes, E. H., Brovkin, V., Petoukhov, V., and Held, H.: Slowing down as an early warning signal for abrupt climate change, P. Natl. Acad. Sci. USA, 105, 14308–14312, 2008.
DeConto, R. M. and Pollard, D.: Contribution of Antarctica to past and future sea-level rise, Nature, 531, 591–597, https://doi.org/10.1038/nature17145, 2016.
Dieckmann, G., Spindler, M., Lange, M. A., Ackley, S. F., and Eicken, H.: Antarctic sea ice: a habitat for the foraminifer Neogloboquadrina pachyderma, J. Foramin. Res., 21, 182–189, 1991.
Doblin, M. A. and van Sebille, E.: Drift in ocean currents impacts intergenerational microbial exposure to temperature, P. Natl. Acad. Sci. USA, 113, 5700–5705, https://doi.org/10.1073/pnas.1521093113, 2016.
Dutton, A., Carlson, A., Long, A., Milne, G., Clark, P., DeConto, R., Horton, B., Rahmstorf, S., and Raymo, M.: Sea-level rise due to polar ice-sheet mass loss during past warm periods, Science, 349, aaa4019, https://doi.org/10.1126/science.aaa4019, 2015.
Elderfield, H. and Ganssen, G.: Past temperature and δ18O of surface ocean waters inferred from foraminiferal Mg ∕ Ca ratios, Nature, 405, 442–445, https://doi.org/10.1038/35013033, 2000.
Esper, O. and Gersonde, R.: Quaternary surface water temperature estimations: New diatom transfer functions for the Southern Ocean, Palaeogeog. Palaeocl., 414, 1–19, 2014.
Fischer, H., Meissner, K. J., Mix, A. C., Abram, N. J., Austermann, J., Brovkin, V., Capron, E., Colombaroli, D., Daniau, A.-L., Dyez, K. A., Felis, T., Finkelstein, S. A., Jaccard, S. L., McClymont, E. L., Rovere, A., Sutter, J., Wolff, E. W., Affolter, S., Bakker, P., Ballesteros-Cánovas, J. A., Barbante, C., Caley, T., Carlson, A. E., Churakova, O., Cortese, G., Cumming, B. F., Davis, B. A. S., de Vernal, A., Emile-Geay, J., Fritz, S. C., Gierz, P., Gottschalk, J., Holloway, M. D., Joos, F., Kucera, M., Loutre, M.-F., Lunt, D. J., Marcisz, K., Marlon, J. R., Martinez, P., Masson-Delmotte, V., Nehrbass-Ahles, C., Otto-Bliesner, B. L., Raible, C. C., Risebrobakken, B., Sánchez Goñi, M. F., Arrigo, J. S., Sarnthein, M., Sjolte, J., Stocker, T. F., Velasquez Alvárez, P. A., Tinner, W., Valdes, P. J., Vogel, H., Wanner, H., Yan, Q., Yu, Z., Ziegler, M., and Zhou, L.: Palaeoclimate constraints on the impact of 2 ∘C anthropogenic warming and beyond, Nat. Geosci., 11, 474–485, https://doi.org/10.1038/s41561-018-0146-0, 2018.
Fogwill, C. J., Turney, C. S. M., Meissner, K. J., Golledge, N. R., Spence, P., Roberts, J. L., England, M. H., Jones, R. T., and Carter, L.: Testing the sensitivity of the East Antarctic Ice Sheet to Southern Ocean dynamics: past changes and future implications, J. Quaternary Sci., 29, 91–98, https://doi.org/10.1002/jqs.2683, 2014.
Fogwill, C. J., Phipps, S. J., Turney, C. S. M., and Golledge, N. R.: Sensitivity of the Southern Ocean to enhanced regional Antarctic ice sheet meltwater input, Earth's Future, 3, 317–329, https://doi.org/10.1002/2015EF000306, 2015.
Galaasen, E. V., Ninnemann, U. S., Irvalı, N., Kleiven, H. F., Rosenthal, Y., Kissel, C., and Hodell, D. A.: Rapid reductions in North Atlantic Deep Water during the peak of the Last Interglacial period, Science, 343, 1129–1132, https://doi.org/10.1126/science.1248667, 2014.
Golledge, N. R., Kowalewski, D. E., Naish, T. R., Levy, R. H., Fogwill, C. J., and Gasson, E. G. W.: The multi-millennial Antarctic commitment to future sea-level rise, Nature, 526, 421–425, https://doi.org/10.1038/nature15706, 2015.
Govin, A., Capron, E., Tzedakis, P. C., Verheyden, S., Ghaleb, B., Hillaire-Marcel, C., St-Onge, G., Stoner, J. S., Bassinot, F., Bazin, L., Blunier, T., Combourieu-Nebout, N., El Ouahabi, A., Genty, D., Gersonde, R., Jimenez-Amat, P., Landais, A., Martrat, B., Masson-Delmotte, V., Parrenin, F., Seidenkrantz, M. S., Veres, D., Waelbroeck, C., and Zahn, R.: Sequence of events from the onset to the demise of the Last Interglacial: Evaluating strengths and limitations of chronologies used in climatic archives, Quatern. Sci. Rev., 129, 1–36, https://doi.org/10.1016/j.quascirev.2015.09.018, 2015.
Grant, K. M., Rohling, E. J., Ramsey, C. B., Cheng, H., Edwards, R. L., Florindo, F., Heslop, D., Marra, F., Roberts, A. P., Tamisiea, M. E., and Williams, F.: Sea-level variability over five glacial cycles, Nat. Commun., 5, 5076, https://doi.org/10.1038/ncomms6076, 2014.
Hansen, J. E.: A slippery slope: How much global warming constitutes “dangerous anthropogenic interference”?, Clim. Change, 68, 269–279, 2005.
Hayes, C. T., Martínez-García, A., Hasenfratz, A. P., Jaccard, S. L., Hodell, D. A., Sigman, D. M., Haug, G. H., and Anderson, R. F.: A stagnation event in the deep South Atlantic during the last interglacial period, Science, 346, 1514–1517, https://doi.org/10.1126/science.1256620, 2014.
Hellweger, F. L., van Sebille, E., Calfee, B. C., Chandler, J. W., Zinser, E. R., Swan, B. K., and Fredrick, N. D.: The Role of Ocean Currents in the Temperature Selection of Plankton: Insights from an Individual-Based Model, PLOS ONE, 11, e0167010, https://doi.org/10.1371/journal.pone.0167010, 2016.
Hoffman, J. S., Clark, P. U., Parnell, A. C., and He, F.: Regional and global sea-surface temperatures during the last interglaciation, Science, 355, 276–279, https://doi.org/10.1126/science.aai8464, 2017.
Huang, B., Menne, M. J., Boyer, T., Freeman, E., Gleason, B. E., Lawrimore, J. H., Liu, C., Rennie, J. J., Schreck III, C. J., Sun, F., Vose, R., Williams, C. N., Yin, X., and Zhang, H.-M.: Uncertainty Estimates for Sea Surface Temperature and Land Surface Air Temperature in NOAAGlobalTemp Version 5, J. Climate, 33, 1351–1379, https://doi.org/10.1175/jcli-d-19-0395.1, 2020.
Hönisch, B., Allen, K. A., Lea, D. W., Spero, H. J., Eggins, S. M., Arbuszewski, J., deMenocal, P., Rosenthal, Y., Russell, A. D., and Elderfield, H.: The influence of salinity on Mg ∕ Ca in planktic foraminifers–Evidence from cultures, core-top sediments and complementary δ18O, Geochim. Cosmochim. Ac., 121, 196–213, 2013.
IPCC: Climate Change 2013: The Physical Science Basis. Contribution of Working Group I to the Fifth Assessment Report of the Intergovernmental Panel on Climate Change, Cambridge University Press, Cambridge, UK, New York, NY, USA, 1535 pp., 2013.
Jones, R. T., Turney, C. S. M., Lang, B., Brooks, S. J., Rundgren, M., Hammarlund, D., Björck, S., and Fogwill, C. J.: Delayed maximum northern European summer temperatures during the Last Interglacial as a result of Greenland Ice Sheet melt, Geology, 45, 23–26, https://doi.org/10.1130/g38402.1, 2017.
Jonkers, L., Reynolds, C. E., Richey, J., and Hall, I. R.: Lunar periodicity in the shell flux of planktonic foraminifera in the Gulf of Mexico, Biogeosciences, 12, 3061–3070, https://doi.org/10.5194/bg-12-3061-2015, 2015.
Jonkers, L., Hillebrand, H., and Kucera, M.: Global change drives modern plankton communities away from the pre-industrial state, Nature, 570, 372–375, https://doi.org/10.1038/s41586-019-1230-3, 2019.
Kandiano, E. S., Bauch, H. A., and Müller, A.: Sea surface temperature variability in the North Atlantic during the last two glacial-interglacial cycles: comparison of faunal, oxygen isotopic, and Mg ∕ Ca-derived records, Palaeogeog. Palaeocl., 204, 145–164, 2004.
Kienast, S. S., Winckler, G., Lippold, J., Albani, S., and Mahowald, N. M.: Tracing dust input to the global ocean using thorium isotopes in marine sediments: ThoroMap, Glob. Biogeochem. Cy., 30, 1526–1541, https://doi.org/10.1002/2016GB005408, 2016.
Kim, S.-J., Crowley, T. J., and Stössel, A.: Local orbital forcing of Antarctic climate change during the Last Interglacial, Science, 280, 728–730, 1998.
Kopp, R. E., Simons, F. J., Mitrovica, J. X., Maloof, A. C., and Oppenheimer, M.: Probabilistic assessment of sea level during the last interglacial stage, Nature, 462, 863–867, 2009.
Köhler, P., Nehrbass-Ahles, C., Schmitt, J., Stocker, T. F., and Fischer, H.: A 156 kyr smoothed history of the atmospheric greenhouse gases CO2, CH4, and N2O and their radiative forcing, Earth Syst. Sci. Data, 9, 363–387, https://doi.org/10.5194/essd-9-363-2017, 2017.
Lange, M. and van Sebille, E.: Parcels v0.9: prototyping a Lagrangian ocean analysis framework for the petascale age, Geosci. Model Dev., 10, 4175–4186, https://doi.org/10.5194/gmd-10-4175-2017, 2017.
Laskar, J., Robutel, P., Joutel, F., Gastineau, M., Correia, A. C. M., and Levrard, B.: A long-term numerical solution for the insolation quantities of the earth, Astronom. Astrophys., 428, 261–285, https://doi.org/10.1051/0004-6361:20041335, 2004.
Lenton, T. M., Held, H., Kriegler, E., Hall, J. W., Lucht, W., Rahmstorf, S., and Schellnhuber, H. J.: Tipping elements in the Earth's climate system, P. Natl. Acad. Sci. USA, 105, 1786–1793, 2008.
Lisiecki, L. E. and Raymo, M. E.: A Pliocene-Pleistocene stack of 57 globally distributed benthic δ18O records, Paleoceanography, 20, PA1003, https://doi.org/10.1029/2004PA001071, 2005.
Lunt, D. J., Abe-Ouchi, A., Bakker, P., Berger, A., Braconnot, P., Charbit, S., Fischer, N., Herold, N., Jungclaus, J. H., Khon, V. C., Krebs-Kanzow, U., Langebroek, P. M., Lohmann, G., Nisancioglu, K. H., Otto-Bliesner, B. L., Park, W., Pfeiffer, M., Phipps, S. J., Prange, M., Rachmayani, R., Renssen, H., Rosenbloom, N., Schneider, B., Stone, E. J., Takahashi, K., Wei, W., Yin, Q., and Zhang, Z. S.: A multi-model assessment of last interglacial temperatures, Clim. Past, 9, 699–717, https://doi.org/10.5194/cp-9-699-2013, 2013.
Martinson, D. G., Pisias, N. G., Hays, J. D., Imbrie, J., Moore, T. C., and Shackleton, N. J.: Age dating and the orbital theory of the Ice Ages: Development of a high-resolution 0 to 300,000-year chronostratigraphy, Quatern. Res., 27, 1–29, 1987.
Masumoto, Y., Sasaki, H., Kagimoto, T., Komori, N., Ishida, A., Sasai, Y., Miyama, T., Motoi, T., Mitsudera, H., Takahashi, K., Sakuma, H., and Yamagata, T.: A fifty-year eddy-resolving simulation of the world ocean – Preliminary outcomes of OFES (OGCM for the Earth simulator), J. Earth Simulator, 1, 35–56, 2004.
McKay, N. P., Overpeck, J. T., and Otto-Bliesner, B. L.: The role of ocean thermal expansion in Last Interglacial sea level rise, Geophys. Res. Lett., 38, L14605, https://doi.org/10.1029/2011gl048280, 2011.
Mercer, J. H.: West Antarctic ice sheet and CO2 greenhouse effect: a threat of disaster, Nature, 271, 321–325, 1978.
Mercer, J. H. and Emiliani, C.: Antarctic ice and interglacial high sea levels, Science, 168, 1605–1606, https://doi.org/10.1126/science.168.3939.1605-a, 1970.
Miller, G. H., Alley, R. B., Brigham-Grette, J., Fitzpatrick, J. J., Polyak, L., Serreze, M. C., and White, J. W. C.: Arctic amplification: can the past constrain the future?, Quatern. Sci. Rev., 29, 1779–1790, https://doi.org/10.1016/j.quascirev.2010.02.008, 2010.
Monroy, P., Hernández-García, E., Rossi, V., and López, C.: Modeling the dynamical sinking of biogenic particles in oceanic flow, Nonlin. Processes Geophys., 24, 293–305, https://doi.org/10.5194/npg-24-293-2017, 2017.
Müller, P. J., Kirst, G., Ruhland, G., von Storch, I., and Rosell-Melé, A.: Calibration of the alkenone paleotemperature index U37K' based on core-tops from the eastern South Atlantic and the global ocean (60∘ N-60∘ S), Geochim. Cosmochim. Ac., 62, 1757–1772, https://doi.org/10.1016/S0016-7037(98)00097-0, 1998.
NEEM Community Members: Eemian interglacial reconstructed from a Greenland folded ice core, Nature, 493, 489–494, 2013.
Nooteboom, P. D., Bijl, P. K., van Sebille, E., von der Heydt, A. S., and Dijkstra, H. A.: Transport bias by ocean currents in sedimentary microplankton assemblages: Implications for paleoceanographic reconstructions, Paleoceanogr. Paleocl., 34, 1178–1194, https://doi.org/10.1029/2019pa003606,
Nooteboom, P. D., Delandmeter, P., van Sebille, E., Bijl, P. K., Dijkstra, H. A., and von der Heydt, A. S.: Resolution dependency of sinking Lagrangian particles in ocean general circulation models, PLOS ONE, 15, e0238650, https://doi.org/10.1371/journal.pone.0238650, 2020.
Otto-Bliesner, B. L., Rosenbloom, N., Stone, E. J., McKay, N. P., Lunt, D. J., Brady, E. C., and Overpeck, J. T.: How warm was the last interglacial? New model–data comparisons, Philos. T. R. Soc. A, 371, 20130097, https://doi.org/10.1098/rsta.2013.0097, 2013.
Overpeck, J., Sturm, M., Francis, J. A., Perovich, D. K., Serreze, M. C., Benner, R., Carmack, E. C., Chapin, F. S. I., Gerlach, S. C., Hamilton, L. C., Hinzman, L. D., Holland, M., Huntington, H. P., Key, J., .R., Lloyd, A. H., MacDonald, G. M., McFadden, J., Noone, D., Prowse, T. D., Schlosser, P., and Vörösmarty, C.: Arctic system on trajectory to new, seasonally ice-free state, Eos T. AGU, 86, 309–313, 2005.
Overpeck, J., Otto-Bliesner, B., Miller, G., Muhs, D., Alley, R., and Kiehl, J.: Paleoclimatic evidence for future ice-sheet instability and rapid sea-level rise, Science, 311, 1747–1750, https://doi.org/10.1126/science.1115159, 2006.
PAGES2k Consortium, Emile-Geay, J., McKay, N. P., Kaufman, D. S., von Gunten, L., Wang, J., Anchukaitis, K. J., Abram, N. J., Addison, J. A., Curran, M. A. J., Evans, M. N., Henley, B. J., Hao, Z., Martrat, B., McGregor, H. V., Neukom, R., Pederson, G. T., Stenni, B., Thirumalai, K., Werner, J. P., Xu, C., Divine, D. V., Dixon, B. C., Gergis, J., Mundo, I. A., Nakatsuka, T., Phipps, S. J., Routson, C. C., Steig, E. J., Tierney, J. E., Tyler, J. J., Allen, K. J., Bertler, N. A. N., Björklund, J., Chase, B. M., Chen, M.-T., Cook, E., de Jong, R., DeLong, K. L., Dixon, D. A., Ekaykin, A. A., Ersek, V., Filipsson, H. L., Francus, P., Freund, M. B., Frezzotti, M., Gaire, N. P., Gajewski, K., Ge, Q., Goosse, H., Gornostaeva, A., Grosjean, M., Horiuchi, K., Hormes, A., Husum, K., Isaksson, E., Kandasamy, S., Kawamura, K., Kilbourne, K. H., Koç, N., Leduc, G., Linderholm, H. W., Lorrey, A. M., Mikhalenko, V., Mortyn, P. G., Motoyama, H., Moy, A. D., Mulvaney, R., Munz, P. M., Nash, D. J., Oerter, H., Opel, T., Orsi, A. J., Ovchinnikov, D. V., Porter, T. J., Roop, H. A., Saenger, C., Sano, M., Sauchyn, D., Saunders, K. M., Seidenkrantz, M.-S., Severi, M., Shao, X., Sicre, M.-A., Sigl, M., Sinclair, K., St. George, S., St. Jacques, J.-M., Thamban, M., Kuwar Thapa, U., Thomas, E. R., Turney, C., Uemura, R., Viau, A. E., Vladimirova, D. O., Wahl, E. R., White, J. W. C., Yu, Z., and Zinke, J.: A global multiproxy database for temperature reconstructions of the Common Era, Sci. Data, 4, 170088, https://doi.org/10.1038/sdata.2017.88, 2017.
Past Interglacials Working Group of PAGES: Interglacials of the last 800,000 years, Rev. Geophys., 54, 162–219, https://doi.org/10.1002/2015RG000482, 2016.
Petit, J. R., Jouzel, J., Raynaud, D., Barkov, N. I., Barnola, J. M., Basile, I., Bender, M., Chappellaz, J., Davis, M., Delaygue, G., Delmotte, M., Kotlyakov, V. M., Legrand, M., Lipenkov, V. Y., Lorius, C., Pepin, L., Ritz, C., Saltzman, E., and Stievenard, M.: Climate and atmospheric history of the past 420,000 years from the Vostok ice core, Antarctica, Nature, 399, 429–436, https://doi.org/10.1038/20859, 1999.
Pisias, N. G. and Mix, A. C.: Spatial and temporal oceanographic variability of the eastern equatorial Pacific during the late Pleistocene: Evidence from radiolaria microfossils, Paleoceanography, 12, 381–393, 1997.
Prahl, F. G., Sparrow, M. A., and Wolfe, G. V.: Physiological impacts on alkenone paleothermometry, Paleoceanography, 18, 1025, https://doi.org/10.1029/2002pa000803, 2003.
Rayner, N. A., Parker, D. E., Horton, E. B., Folland, C. K., Alexander, L. V., Rowell, D. P., Kent, E. C., and Kaplan, A.: Global analyses of sea surface temperature, sea ice, and night marine air temperature since the late nineteenth century, J. Geophys. Res.-Atmos., 108, 4407, https://doi.org/10.1029/2002JD002670, 2003.
Rembauville, M., Manno, C., Tarling, G. A., Blain, S., and Salter, I.: Strong contribution of diatom resting spores to deep-sea carbon transfer in naturally iron-fertilized waters downstream of South Georgia, Deep-Sea Res. Pt. I, 115, 22–35, https://doi.org/10.1016/j.dsr.2016.05.002, 2016.
Rohling, E. J., Cane, T. R., Cooke, S., Sprovieri, M., Bouloubassi, I., Emeis, K. C., Schiebel, R., Kroon, D., Jorissem, F. J., Lorre, A., and Kemp, A. E. S.: African monsoon variability during the previous interglacial maximum, Earth Planet. Sc. Lett., 202, 61–75, 2002.
Rohling, E. J., Grant, K., Hemleben, C., Siddall, M., Hoogakker, B. A. A., Bolshaw, M., and Kucera, M.: High rates of sea-level rise during the last interglacial period, Nat. Geosci., 1, 38–42, https://doi.org/10.1038/ngeo.2007.28, 2008.
Rohling, E. J., Hibbert, F. D., Williams, F. H., Grant, K. M., Marino, G., Foster, G. L., Hennekam, R., de Lange, G. J., Roberts, A. P., Yu, J., Webster, J. M., and Yokoyama, Y.: Differences between the last two glacial maxima and implications for ice-sheet, δ18O, and sea-level reconstructions, Quatern. Sci. Rev., 176, 1–28, https://doi.org/10.1016/j.quascirev.2017.09.009, 2017.
Rohling, E. J., Hibbert, F. D., Grant, K. M., Galaasen, E. V., Irvalı, N., Kleiven, H. F., Marino, G., Ninnemann, U., Roberts, A. P., Rosenthal, Y., Schulz, H., Williams, F. H., and Yu, J.: Asynchronous Antarctic and Greenland ice-volume contributions to the last interglacial sea-level highstand, Nat. Commun., 10, 5040, https://doi.org/10.1038/s41467-019-12874-3, 2019.
Schellnhuber, H. J., Rahmstorf, S., and Winkelmann, R.: Why the right climate target was agreed in Paris, Nat. Clim. Change, 6, 649–653, https://doi.org/10.1038/nclimate3013, 2016.
Schneider, R., Schmitt, J., Köhler, P., Joos, F., and Fischer, H.: A reconstruction of atmospheric carbon dioxide and its stable carbon isotopic composition from the penultimate glacial maximum to the last glacial inception, Clim. Past, 9, 2507–2523, https://doi.org/10.5194/cp-9-2507-2013, 2013.
Schneider, R. R., Müller, P. J., and Acheson, R.: Atlantic alkenone sea-surface temperature records, in: Reconstructing Ocean History: A Window into the Future, Kluwer Academic/Plenum Publishers, New York, 33–55, 1999.
Segev, E., Castañeda, I. S., Sikes, E. L., Vlamakis, H., and Kolter, R.: Bacterial influence on alkenones in live microalgae, J. Phycol., 52, 125–130, https://doi.org/10.1111/jpy.12370, 2016.
Shackleton, S., Baggenstos, D., Menking, J. A., Dyonisius, M. N., Bereiter, B., Bauska, T. K., Rhodes, R. H., Brook, E. J., Petrenko, V. V., McConnell, J. R., Kellerhals, T., Häberli, M., Schmitt, J., Fischer, H., and Severinghaus, J. P.: Global ocean heat content in the Last Interglacial, Nat. Geosci., 13, 77–81, https://doi.org/10.1038/s41561-019-0498-0, 2020.
Sikes, E. L., O'Leary, T., Nodder, S. D., and Volkman, J. K.: Alkenone temperature records and biomarker flux at the subtropical front on the Chatham Rise, SW Pacific Ocean, Deep-Sea Res. Pt. I, 52, 721–748, 2005.
Spindler, M.: On the salinity tolerance of the planktonic foraminifer Neogloboquadrina pachyderma from Antarctic sea ice, Proc. NIPR Symp. Polar Biol., 85–91, 1996.
Steffen, W., Rockström, J., Richardson, K., Lenton, T. M., Folke, C., Liverman, D., Summerhayes, C. P., Barnosky, A. D., Cornell, S. E., Crucifix, M., Donges, J. F., Fetzer, I., Lade, S. J., Scheffer, M., Winkelmann, R., and Schellnhuber, H. J.: Trajectories of the Earth System in the Anthropocene, P. Natl. Acad. Sci. USA, 115, 8252–8259, https://doi.org/10.1073/pnas.1810141115, 2018.
Sutter, J., Gierz, P., Grosfeld, K., Thoma, M., and Lohmann, G.: Ocean temperature thresholds for Last Interglacial West Antarctic Ice Sheet collapse, Geophys. Res. Lett., 43, 2675–2682, https://doi.org/10.1002/2016GL067818, 2016.
Thomas, Z. A., Kwasniok, F., Boulton, C. A., Cox, P. M., Jones, R. T., Lenton, T. M., and Turney, C. S. M.: Early warnings and missed alarms for abrupt monsoon transitions, Clim. Past, 11, 1621–1633, https://doi.org/10.5194/cp-11-1621-2015, 2015.
Thomas, Z. A.: Using natural archives to detect climate and environmental tipping points in the Earth System, Quatern. Sci. Rev., 152, 60–71, https://doi.org/10.1016/j.quascirev.2016.09.026, 2016.
Thomas, Z. A., Jones, R. T., Turney, C. S. M., Golledge, N., Fogwill, C., Bradshaw, C. J. A., Menviel, L., McKay, N. P., Bird, M., Palmer, J., Kershaw, P., Wilmshurst, J., and Muscheler, R.: Tipping elements and amplified polar warming during the Last Interglacial, Quatern. Sci. Rev., 233, 106222, https://doi.org/10.1016/j.quascirev.2020.106222, 2020.
Turney, C. S. M. and Jones, R. T.: Does the Agulhas Current amplify global temperatures during super-interglacials?, J. Quaternary Sci., 25, 839–843, 2010.
Turney, C. S. M. and Jones, R. T.: Response to Comment on “Does the Agulhas Current amplify global temperatures during super-interglacials?, J. Quaternary Sci., 26, 870–871, https://doi.org/10.1002/jqs.1556, 2011.
Turney, C. S. M., Jones, R., McKay, N., Van Sebille, E., Thomas, Z., Hillenbrand, C.-D., and Fogwill, C.: A global reconstruction of sea-surface temperatures for the Last Interglacial (129–116 kyr), PANGAEA, https://doi.org/10.1594/PANGAEA.904381, 2019.
Turney, C. S. M., Fogwill, C. J., Golledge, N. R., McKay, N. P., van Sebille, E., Jones, R. T., Etheridge, D., Rubino, M., Thornton, D. P., Davies, S. M., Ramsey, C. B., Thomas, Z. A., Bird, M. I., Munksgaard, N. C., Kohno, M., Woodward, J., Winter, K., Weyrich, L. S., Rootes, C. M., Millman, H., Albert, P. G., Rivera, A., van Ommen, T., Curran, M., Moy, A., Rahmstorf, S., Kawamura, K., Hillenbrand, C.-D., Weber, M. E., Manning, C. J., Young, J., and Cooper, A.: Early Last Interglacial ocean warming drove substantial ice mass loss from Antarctica, P. Natl. Acad. Sci. USA, 117, 3996–4006, https://doi.org/10.1073/pnas.1902469117, 2020a.
Turney, C. S. M., Jones, R. T., McKay, N. P., Van Sebille, E., Thomas, Z. A., Hillenbrand, C.-D., and Fogwill, C. J.: Global ocean Last Interglacial sea surface temperatures, NOAA, PANGAEA, available at: https://www.ncdc.noaa.gov/paleo-search/study/26851, last access: 4 December 2020b.
Tzedakis, P. C., Drysdale, R. N., Margari, V., Skinner, L. C., Menviel, L., Rhodes, R. H., Taschetto, A. S., Hodell, D. A., Crowhurst, S. J., Hellstrom, J. C., Fallick, A. E., Grimalt, J. O., McManus, J. F., Martrat, B., Mokeddem, Z., Parrenin, F., Regattieri, E., Roe, K., and Zanchetta, G.: Enhanced climate instability in the North Atlantic and southern Europe during the Last Interglacial, Nat. Commun., 9, 4235, https://doi.org/10.1038/s41467-018-06683-3, 2018.
van Sebille, E., England, M. H., Zika, J. D., and Sloyan, B. M.: Tasman leakage in a fine-resolution ocean model, Geophys. Res. Lett., 39, L06601, https://doi.org/10.1029/2012GL051004, 2012.
van Sebille, E., Scussolini, P., Durgadoo, J. V., Peeters, F. J. C., Biastoch, A., Weijer, W., Turney, C., Paris, C. B., and Zahn, R.: Ocean currents generate large footprints in marine palaeoclimate proxies, Nat. Commun., 6, 6521, https://doi.org/10.1038/ncomms7521, 2015.
Viebahn, J. P., Heydt, A. S., Le Bars, D., and Dijkstra, H. A.: Effects of Drake Passage on a strongly eddying global ocean, Paleoceanogr. Paleocl., 31, 564–581, 2016.
Visser, K., Thunell, R., and Stott, L.: Magnitude and timing of temperature change in the Indo-Pacific warm pool during deglaciation, Nature, 421, 152–155, 2003.
Vogelsang, E., Sarnthein, M., and Pflaumann, U.: δ18O stratigraphy, chronology, and sea surface temperatures of Atlantic sediment records (GLAMAP-2000 Kiel), Universität Kiel, Kiel, Germany, 244 pp., 2001.
von Gyldenfeldt, A.-B., Carstens, J., and Meincke, J.: Estimation of the catchment area of a sediment trap by means of current meters and foraminiferal tests, Deep-Sea Res. Pt. II, 47, 1701–1717, https://doi.org/10.1016/S0967-0645(00)00004-7, 2000.
Waelbroeck, C., Frank, N., Jouzel, J., Parrenin, F., Masson-Delmotte, V., and Genty, D.: Transferring radiometric dating of the last interglacial sea level high stand to marine and ice core records, Earth Planet. Sc. Lett., 265, 183–194, 2008.
Wang, Y. J., Cheng, H., Edwards, R. L., Kong, X. G., Shao, X. H., Chen, S. T., Wu, J. Y., Jiang, X. Y., Wang, X. F., and An, Z. S.: Millennial- and orbital-scale changes in the East Asian monsoon over the past 224,000 years, Nature, 451, 1090–1093, https://doi.org/10.1038/nature06692, 2008.
Wessel, P., Smith, W. H., Scharroo, R., Luis, J., and Wobbe, F.: Generic mapping tools: improved version released, Eos T. AGU, 94, 409–410, 2013.
White, J. W. C.: Don't touch that dial, Nature, 364, 186, https://doi.org/10.1038/364186a0, 1993.