the Creative Commons Attribution 4.0 License.
the Creative Commons Attribution 4.0 License.
 | 25 Nov 2020
The CH-IRP data set: a decade of fortnightly data on δ2H and δ18O in streamflow and precipitation in Switzerland
Maria Staudinger
Stefan Seeger
Barbara Herbstritt
Michael Stoelzle
Jan Seibert
Kerstin Stahl
Markus Weiler
The stable isotopes of oxygen and hydrogen, 18O and 2H, provide information on water flow pathways and hydrologic catchment functioning. Here a data set of time series data on precipitation and streamflow isotope composition in medium-sized Swiss catchments, CH-IRP, is presented that is unique in terms of its long-term multi-catchment coverage along an alpine to pre-alpine gradient. The data set comprises fortnightly time series of both δ2H and δ18O as well as deuterium excess from streamflow for 23 sites in Switzerland, together with summary statistics of the sampling at each station. Furthermore, time series of δ18O and δ2H in precipitation are provided for each catchment derived from interpolated data sets from the ISOT, GNIP and ANIP networks. For each station we compiled relevant metadata describing both the sampling conditions and catchment characteristics and climate information. Lab standards and errors are provided, and potentially problematic measurements are indicated to help the user decide on the applicability for individual study purposes. For the future, the measurements are planned to be continued at 14 stations as a long-term isotopic measurement network, and the CH-IRP data set will, thus, continuously be extended. The data set can be downloaded from data repository Zenodo at https://doi.org/10.5281/zenodo.4057967 (Staudinger et al., 2020).
- Article
(7810 KB) - Full-text XML
- BibTeX
- EndNote


There are significant differences in the isotopic contents of seawater, freshwater (Gilfillan, 1934), rain and snow. The isotopic composition in precipitation further depends on meteorological influences such as air temperature, rainfall amount and rainfall intensity, and location parameters such as altitude, latitude and distance from the coast (Dansgaard, 1953, 1964; Epstein, 1956; Friedman, 1953).

Figure 1Map of the sampling locations and related catchments in Switzerland. The zoomed-in inset shows the five Alptal catchments. Black dots indicate the source stations for the interpolation of the isotopic compositions in precipitation. The source of the underlying relief map is the Swiss Federal Office of Topography.
When tracing the path of water through a hydrological system such as a catchment, the composition of the stable water isotopes δ18O and δ2H of precipitation changes by the time it reaches the stream. The isotopic signal in the precipitation is changed along the water flow pathways through a catchment, resulting in a temporal delay and a dampened amplitude of the signal in the streamflow. This signal change can be modelled using water transit time distributions or other approaches to consider water ages and, hence, can help improve the understanding of hydrological functioning of catchments. Event-based isotope sampling has long been the basis for hydrograph separation in hydrological research and allows quantifying pre-event and event water contributions to soil water, streamflow or groundwater (Christophersen et al., 1990; Klaus and McDonnell, 2013; Sprenger et al., 2019). More extended time series of the isotopic composition of catchment discharge – i.e., streamflow – allow the estimation of water transit times and storage of catchments (McGuire and McDonnell, 2006). Besides their value in the development, calibration and validation of a wide variety of catchment hydrological models, these data sets also have a demonstrated value for catchment intercomparisons in, for instance, Sweden (Lyon et al., 2010), Oregon (McGuire et al., 2005) and different northern regions (Tetzlaff et al., 2009). McGuire et al. (2005) used isotopic data for a 3-year period to quantify mean transit times for seven partly nested catchments in the Cascades, Oregon, USA, and found good relations to topographic indices such as the catchment average of L ∕ G, where L is the distance from the stream and G is the gradient to the stream. In a similar study in northern Sweden based on 15 snow-dominated subcatchments of the Krycklan catchment, Lyon et al. (2010) found wetlands to be a controlling factor for catchment transit times. Tetzlaff et al. (2009) compiled a data set of 55 catchments in different regions in the northern temperate zone. Their analysis showed that topography is an essential control in catchments with a pronounced topography, whereas the topographic influences are smaller in regions with a flatter topography. In the latter, hydrological soil characteristics become relatively more important.
Here, we present a long-term data set consisting of δ2H and δ18O values for streamflow and precipitation for 23 catchments in Switzerland and discuss the applicability of the data. The collection of this data set started in 2010 as part of the DROUGHT-CH project (Seneviratne et al., 2013) and is still continuing.
2.1 δ2H and δ18O for streamflow
2.1.1 Data sampling
The data were collected in 23 catchments with near-natural streamflow in Switzerland. The catchments were selected based on two different criteria, and two different temporal sampling resolutions were chosen. The majority of catchments were selected with the focus on studying and comparing low-flow behaviour. Therefore, we selected catchments without major water abstractions or transfers, where the gauging stations provided precise streamflow measurements even during low flows (see https://opendata.swiss/de/dataset/niedrigwasserstatistik-nqstat, last access: 8 February 2020, and Marti and Kan, 2003). These catchments vary in size, mean elevation, topographic characteristics and underlying geology (Table 1, Fig. 1). For these catchments the sampling was done fortnightly.
Table 1Catchment characteristics: ID is the identification number that is used throughout the paper. FOEN ID is the identification number that is used by the Swiss Federal Office of the Environment (FOEN); if there is no FOEN ID, the station is maintained on a cantonal level or by the WSL and indicated with the acronym of the respective organization. Gauge coordinates are given using the official Swiss reference system: CH1903+. Aquifer productivity is given as relative catchment area with low, varying and high productivity (Bitterli et al., 2004).
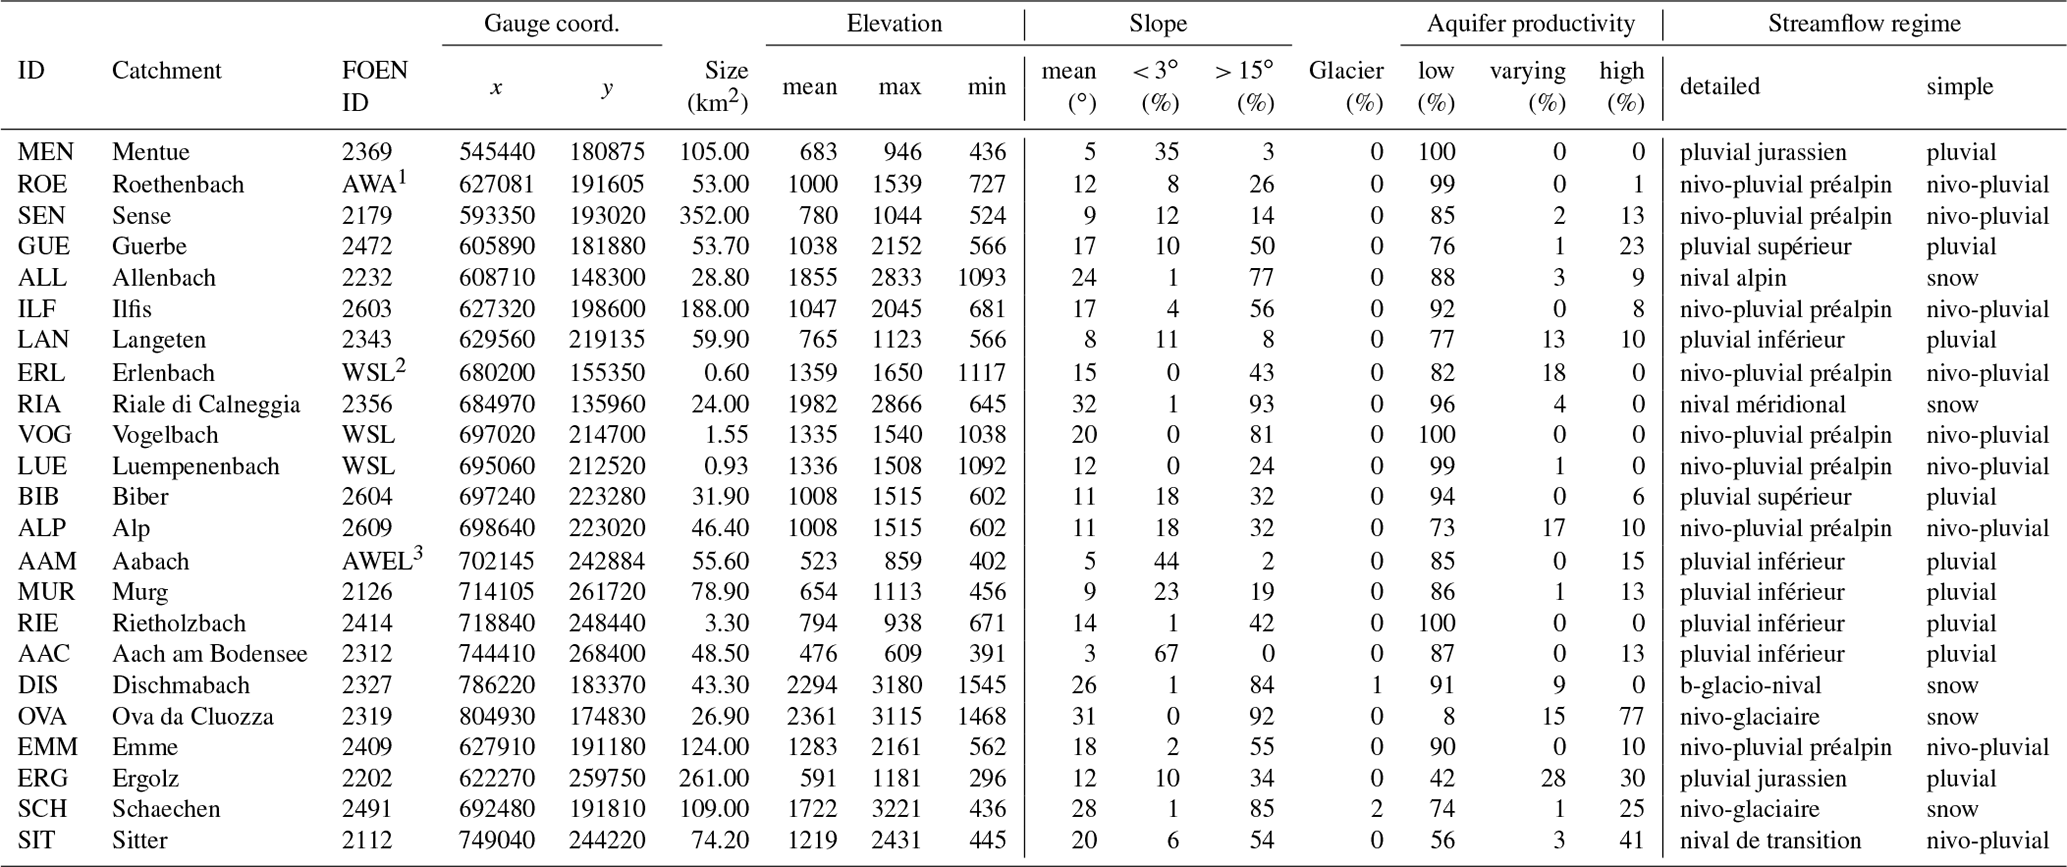
1 Amt für Wasser und Abfall, canton of Bern. 2 https://www.envidat.ch/#/metadata/longterm-hydrological-observatory-alptal-central-switzerland (last access: 14 October 2020). 3 Amt für Abfall, Wasser, Energie und Luft, canton of Zürich.
Five catchments belong to the Alptal long-term hydrological research catchments (Alp, Biber, Erlenbach, Luempenenbach and Vogelbach). Here, grab samples were collected fortnightly until December 2014 and have been collected weekly since January 2015.
Additional isotope data were collected within other research projects in the Alptal catchments (Fig. 1, zoomed-in inset) during events with higher temporal resolution over a short period or in snapshot campaigns with higher spatial coverage. Fischer et al. (2016) performed isotopic hydrograph separations for several events in five small headwater catchments in the Alptal and found that the event water fraction depended much more on the event size than on catchment characteristics. These findings contributed to the emerging conceptual understanding of runoff generation in the Alptal (van Meerveld et al., 2018). A general observation for isotopes in the Alptal is the large spatial variation which was found for both rainfall (Fischer et al., 2017) and groundwater (Kiewiet et al., 2020). Rücker et al. (2019) measured the isotopic composition of snowpack outflow to study runoff generation during rain-on-snow events. Furthermore, in the Alptal a field lab was installed that provides isotope data at high temporal resolution at the outlet of the Erlenbach catchment (von Freyberg et al., 2018a). The data collected in these studies are not part of the CH-IRP data set but could be useful for specific research questions.
All samples were taken as grab samples using 100 mL high-density polyethylene (HD-PE) bottles. The sampling personnel was instructed to flush the bottle with stream water before taking the sample and to ensure the tight closure of the bottle to minimize exchange with the atmosphere and thus to avoid fractionation of the samples.
2.1.2 Lab analysis
All liquid water samples were analyzed at the Chair of Hydrology at the University of Freiburg, Germany. The laboratory regularly participates successfully in IAEA Water Isotope Inter-Comparison (WICO) (Wassenaar et al., 2018). The samples were analyzed using cavity ring-down laser spectrometers (either Picarro L2120-i or L2130-i, Picarro Inc., Santa Clara, CA, USA) in “high-precision mode”. Samples were filtered via syringe filters (0.45 µm) prior to analysis if they were muddy. Of each sample, 1 mL was filled into autosampler vials. According to the manufacturer handbook, six injections per vial were analyzed with the isotope analyzer, and raw data from the first three injections were discarded to keep memory effects from one sample to the next at a minimum. The mean and standard deviation (SD) of the last three injections were calculated. In cases when there was still a memory effect and the SD was larger than 0.08 ‰ (in the case of δ18O) or larger than 0.30 ‰ (in the case of δ2H), the fourth injection was also discarded and only the last two injections were averaged.
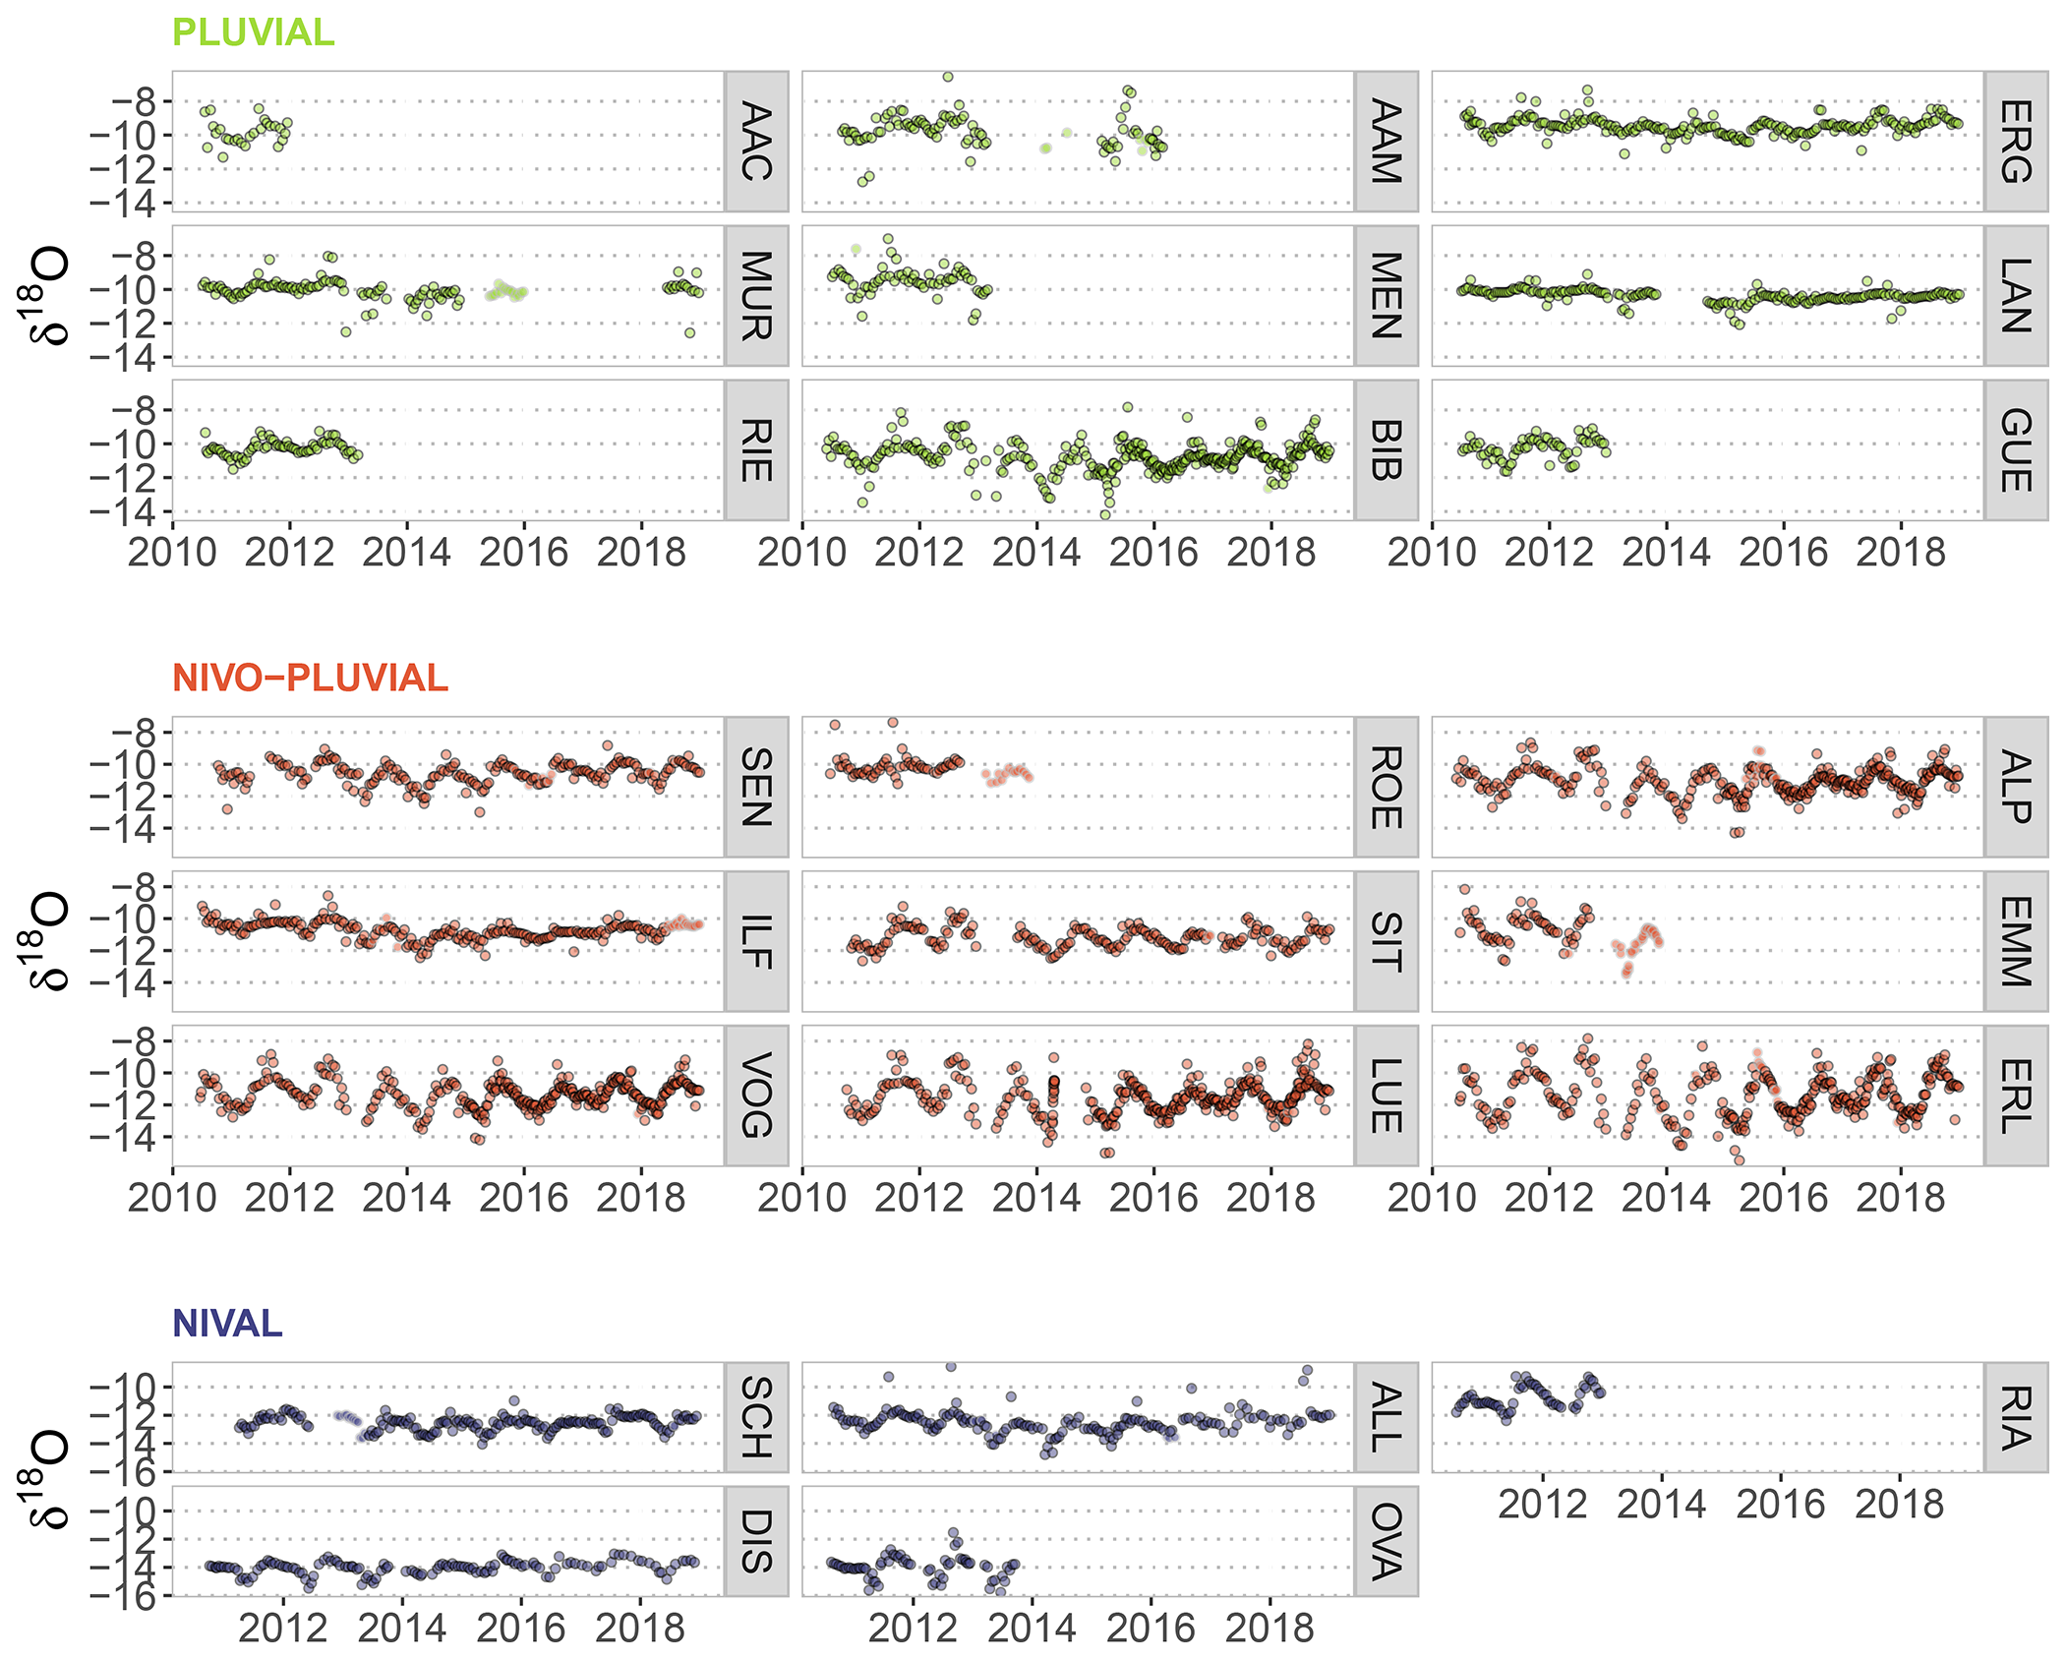
Figure 2Fortnightly time series of δ2H. The colours indicate the regime type to which the catchments can be assigned. Samples that have a comment in the data are plotted as symbols without border.

Figure 3Fortnightly time series of δ18O. The colours indicate the regime type to which the catchments can be assigned. Note the different y-axis scaling for the nival catchments. Samples that are flagged in the data are plotted as symbols without border.
Calibration of the raw data was then conducted using three in-house standards with distinct isotopic compositions: ‰, −9.47 ‰ and 0.30 ‰ for δ18O, and −107.96 ‰, −66.07 ‰ and 1.53 ‰ for δ2H, referenced to the international VSMOW-SLAP scale (Craig, 1961). The standards were analyzed in triplicates each and averaged. The light and the heavy standards – embracing the samples – were used for a 2-point calibration; the third standard was used for validation. Long-term post-calibration accuracy of the validation standard was ±0.05 ‰ for δ18O and ±0.35 ‰ for δ2H. Typically, the nine standards were evenly distributed between 40 samples and thereby additionally used to check for instrument drift. Besides the calibration of the measurements to an international system, a comparison to the standard is useful because it allows an implicit consideration of all corrections for instrumental effects and interferences. Furthermore, most of the influences are cancelled out since they affect both the sample and the reference standard equally (Gourcy et al., 2005).
All isotope data are expressed in δ notation calculated following Eq. (1) (after Gonfiantini, 1981):
where VSMOW is Vienna Standard Mean Ocean Water and R is the isotope ratio (18O ∕ 16O or 2H ∕ 1H).
During times when there was enough lab capacity, double measurements were performed and the arithmetic average was calculated (for ∼ 50 % of the samples).
2.1.3 Summary statistics
The sampling periods for streamflow were about 8 years for 14 catchments, about 3 years for 7 catchments, and 5 years and 1.5 years for the remaining 2 catchments. There is an overlap of 3 years with data for almost all catchments (∼ 90 %), and for the 14 stations that are still being sampled more than 8 years of overlapping data are available (Table 2). Since the stations were sampled fortnightly, the number of samples was between 26 and 224 per station, while for the Alptal catchments the samples were taken weekly from 2015 on, and these catchments have a total number of 318 samples each.
We performed a statistical outlier analysis based on z scores (from a visual inspection of the data sets using q–q plots we assume the data are normally distributed). There were in total 47 outliers according to the z score in either δ2H and δ18O or both with an absolute value larger than 3, indicating that the value deviates by more than 3 standard deviations from the mean.
Isotopic compositions can strongly deviate during high-flow conditions compared to mean or baseflow conditions because of a larger proportion of events from more recent precipitation, as was found for instance in the high-resolution data set of the Plynlimon catchment, Wales (Knapp et al., 2019). The time series of δ2H in Fig. 2 and of δ18O in Fig. 3 give an overview of the seasonal changes for each catchment in the isotope composition. The relationship of δ2H and δ18O does not deviate for any of the catchments from the global meteoric water line (GMWL; δ2H = 8.0, δ18O + 10 ‰) (Fig. 4).
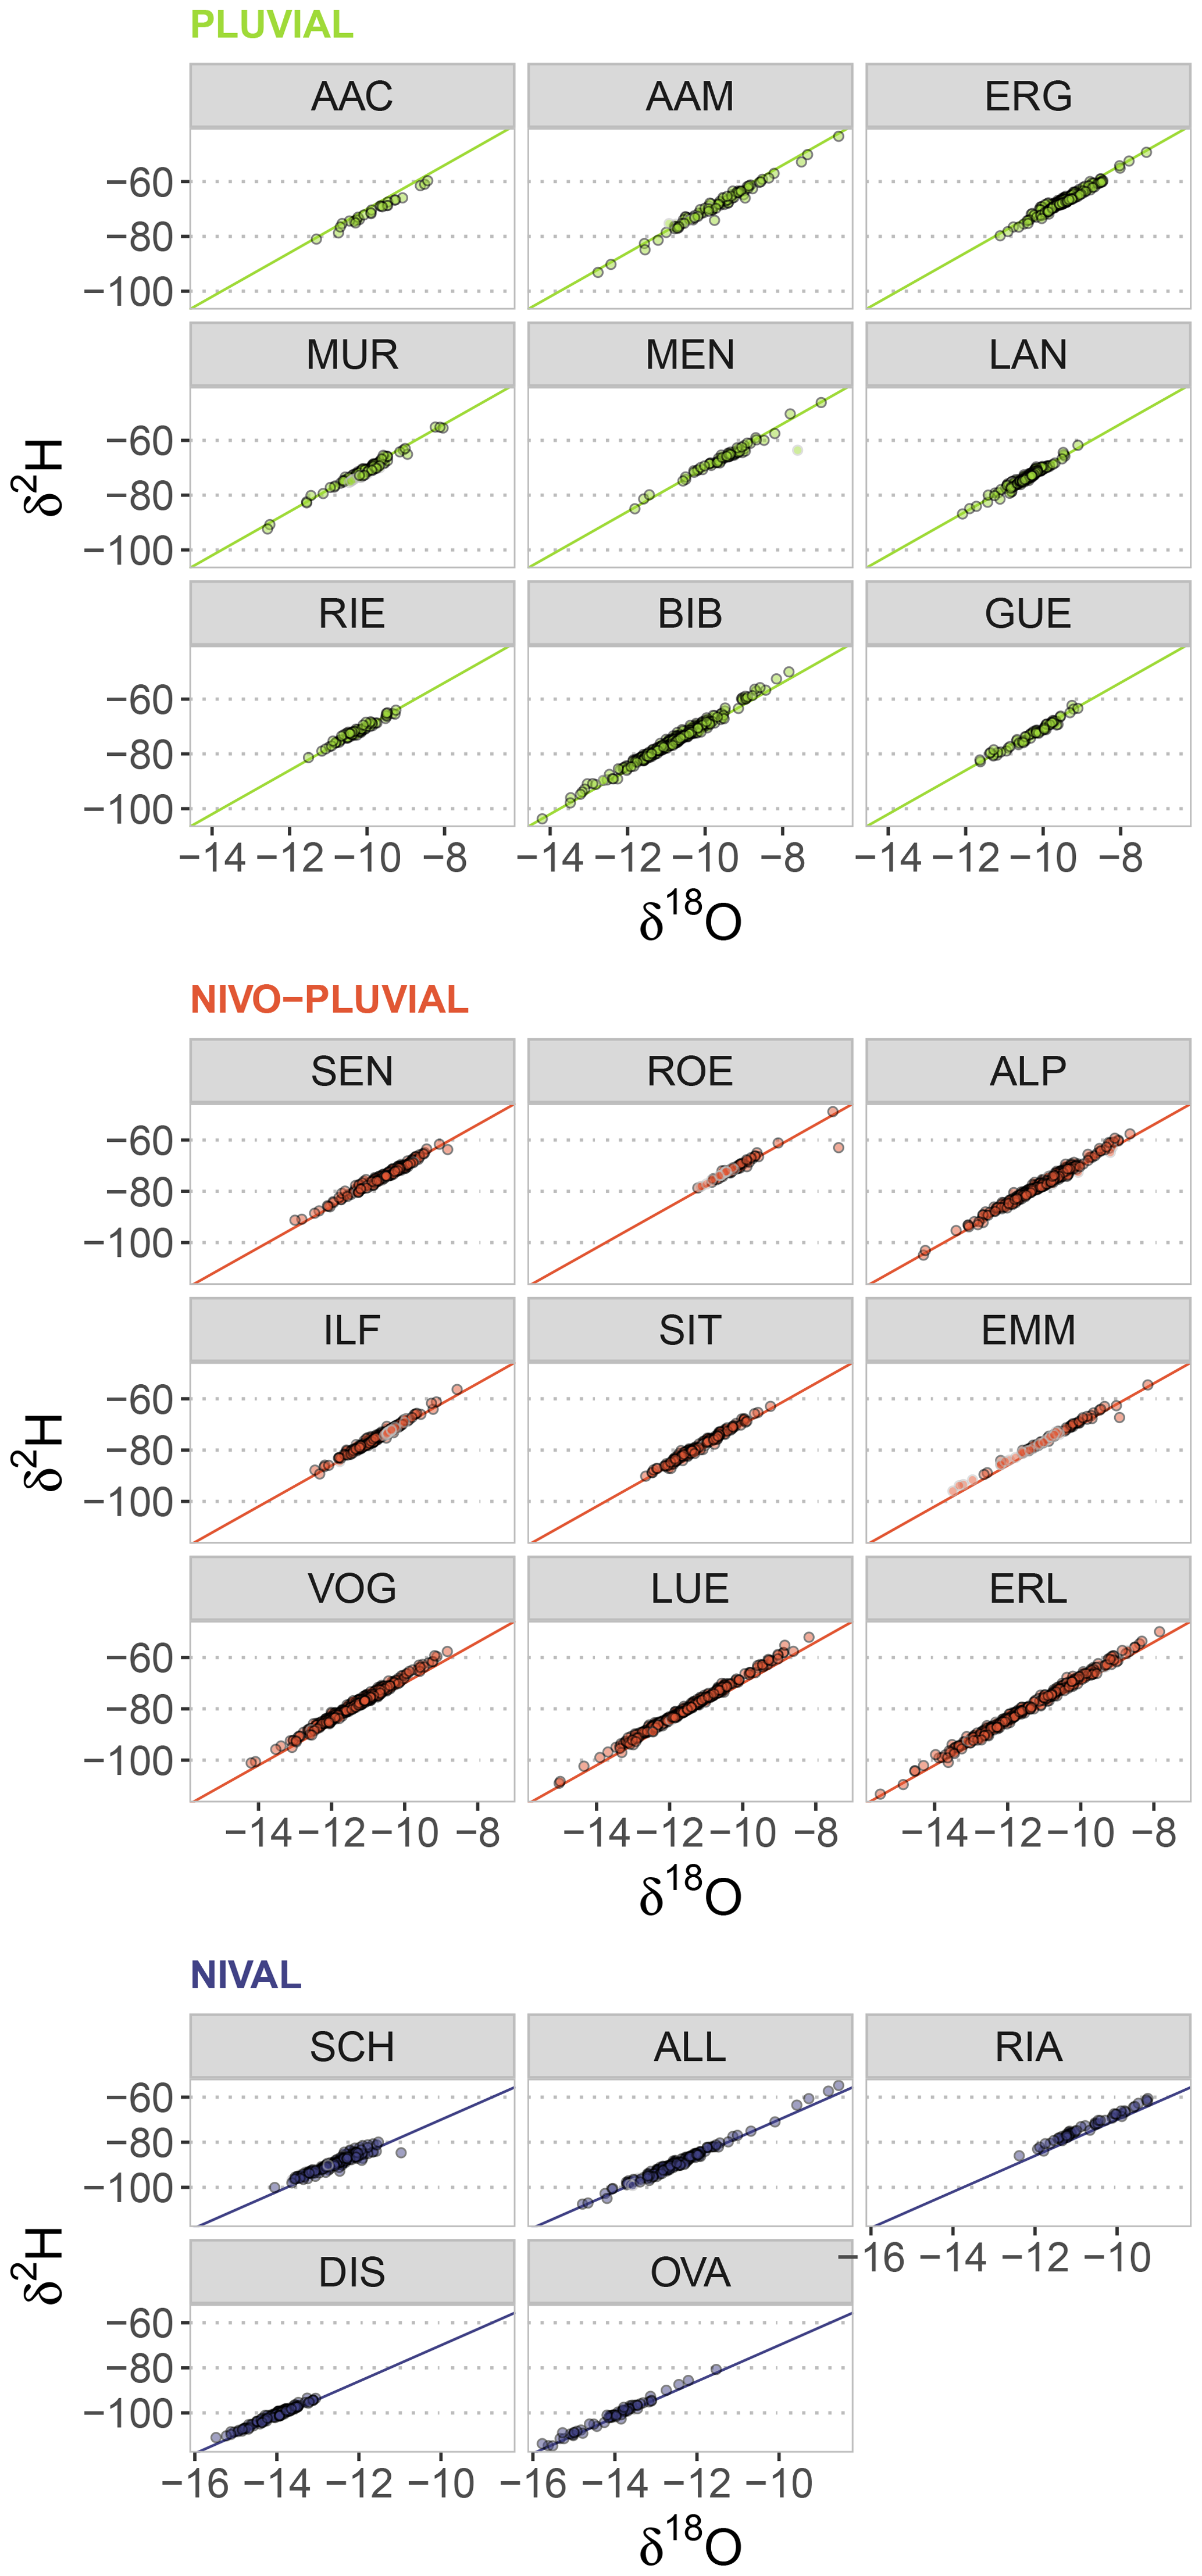
Figure 4Comparison of the relation between δ18O and δ2H to the global meteoric water line (GMWL). The colours indicate the regime type to which the catchments were assigned. Note the different x-axis scaling for the nival catchments.
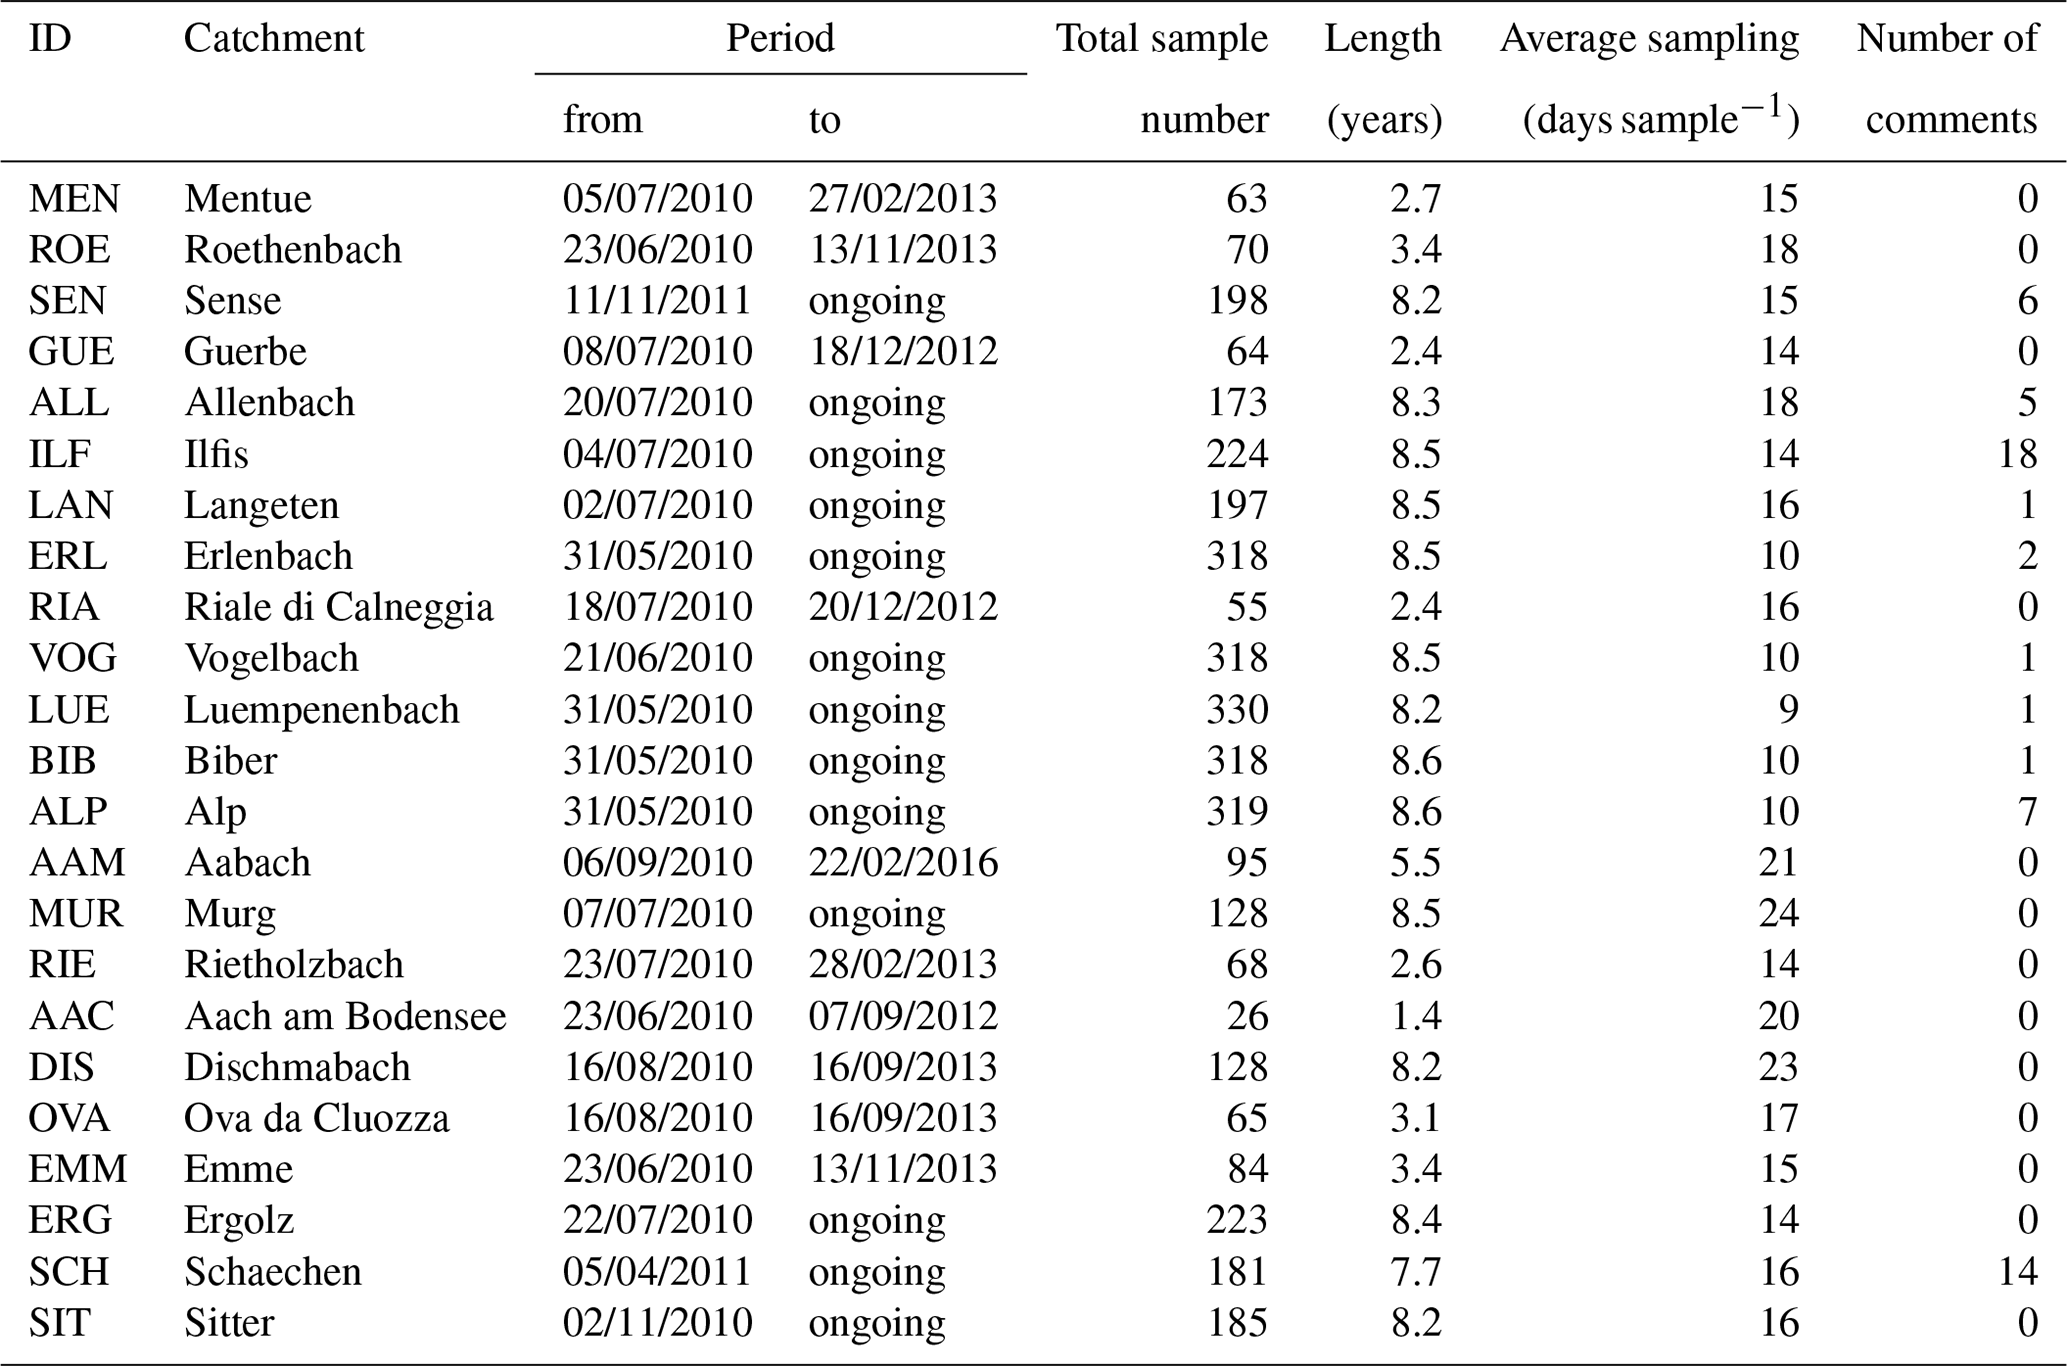
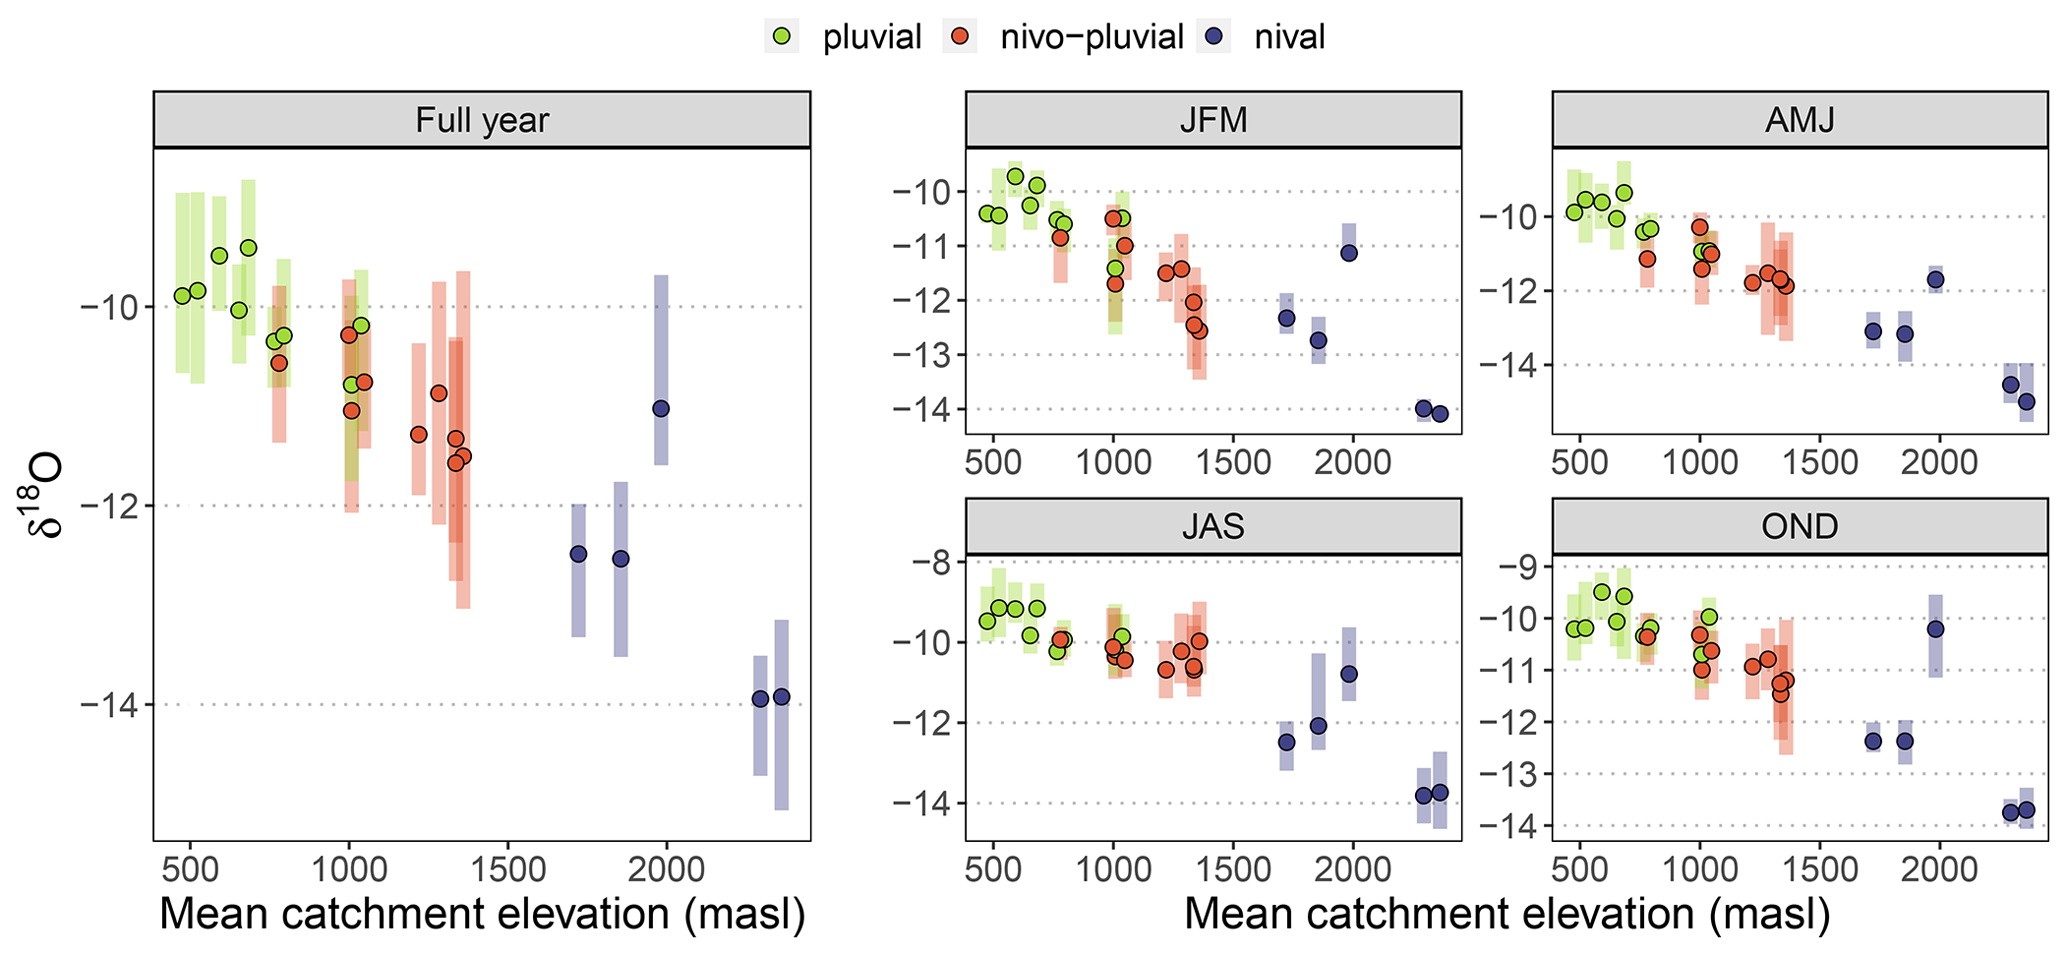
Figure 5Median and ranges (10th and 90th percentile) of δ2H for the full sampling period (left) and separately for the seasons (right) of the samples for each catchment against the mean catchment elevation. The colours indicate the regime type to which the catchments were assigned.
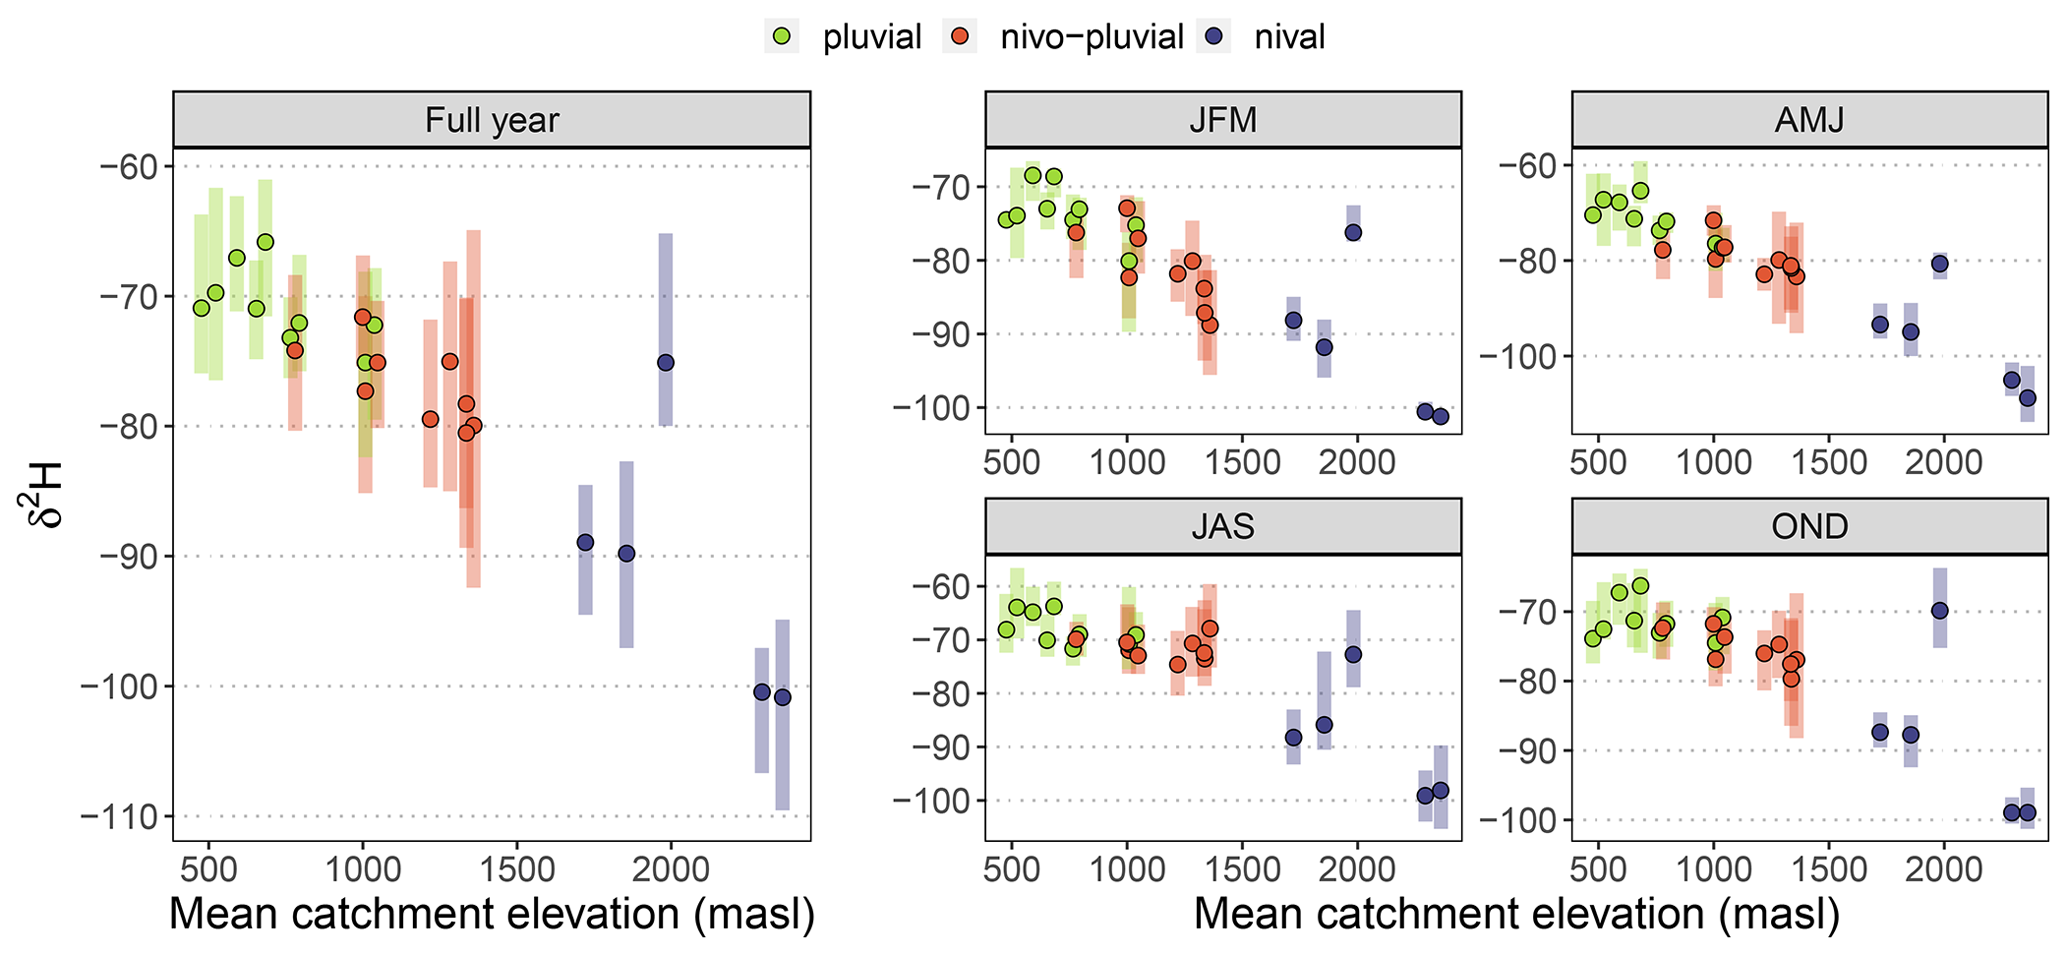
Figure 6Median and ranges (10th and 90th percentile) of δ18O for the full sampling period (left) and separately for the seasons (right) of the samples for each catchment against the mean catchment elevation. The colours indicate the regime type to which the catchments were assigned.
2.1.4 Streamflow conditions during sampling
In addition to the values of δ2H and δ18O and deuterium excess we provide an index of sampling conditions regarding streamflow (sampling Q index). This index was calculated from the sum of the streamflow volume on the day of sampling and the previous 2 d divided by the sum of the long-term mean streamflow over the same days of the year. An index larger than 1 indicates wetter conditions from the long-term mean; an index smaller than 1 indicates drier conditions than the long-term mean. This information can also be assembled to analyze the frequency of samples taken under certain streamflow conditions as given by the index (Fig. 7).
Furthermore, we calculated the flow exceedance probabilities on the flow duration curve during the sampling to get an idea if the samples were taken during baseflow, average or high-flow conditions. An exceedance probability of 0.95, for instance, would be exceeded 95 % of the time during the year and indicates very low streamflow conditions. The exceedance probabilities were calculated empirically based on the last 20 years of the available record of streamflow (1999–2018); note that this period contained some pronounced low-flow periods (2003, 2011, 2015 and 2018). These computations demonstrated that the percentiles for the sampling times in each catchment span the full range of percentiles, which indicates that samples were taken during baseflow, mean-flow and high-flow conditions. Most samples were taken during mean-flow conditions.
Comparing the mean catchment elevation shows that the isotope values follow the elevation gradient (Figs. 5 and 6) as expected (Dansgaard, 1964). The Riale di Calneggia catchment shows an exception to this general gradient. This catchment in the canton of Ticino in the southern Alps receives precipitation from the Mediterranean Sea and thus shows a less depleted isotopic signal. The elevational gradient that is visible in the long-term mean values of the time series is also visible in specific seasons (JFM, AMJ, JAS or OND) and is very similar for δ2H and δ18O.
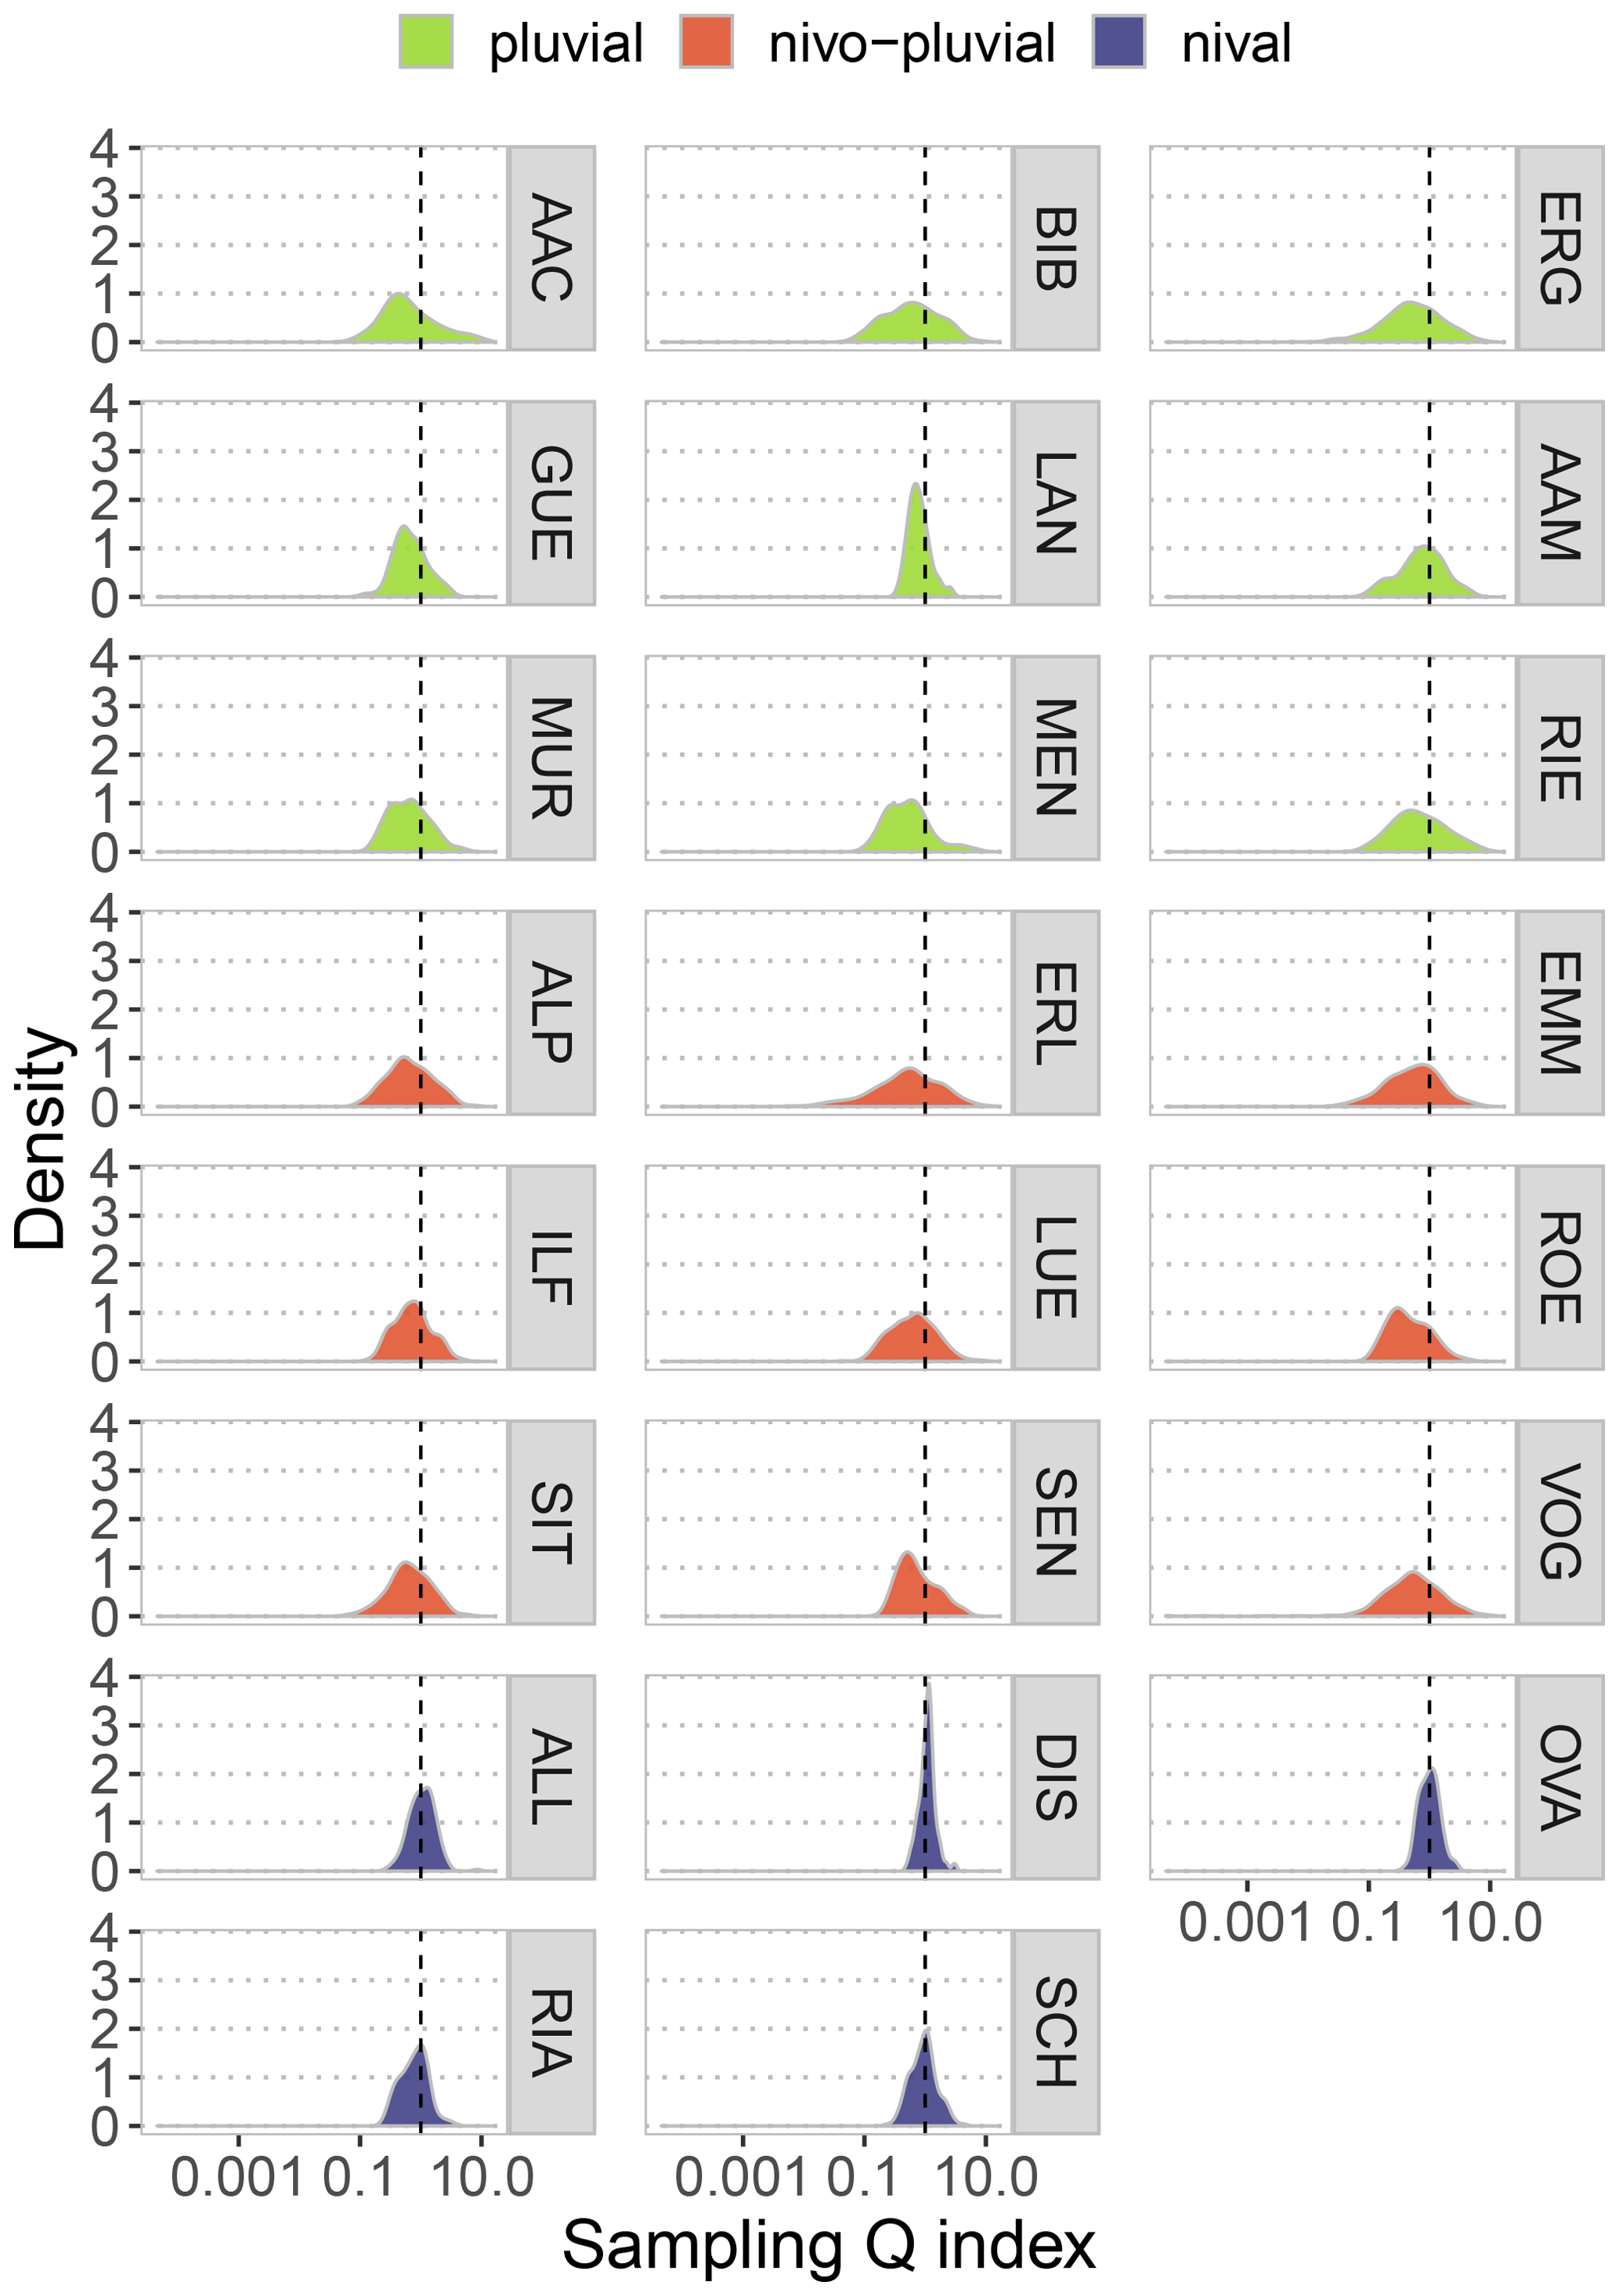
Figure 7Sampling condition distribution expressed as the sampling Q index. The dashed line shows the long-term streamflow conditions of the day of sampling. Values of the index larger than 1 indicate wetter conditions than the observed long-term condition, whereas values smaller than 1 indicate conditions drier than the long-term condition on this day of the year (sum of 3 consecutive days). For the Roethenbach catchment (ROE) simulated streamflow was used. Note that the x axis is log-scaled to visualize the percentual difference more intuitively.
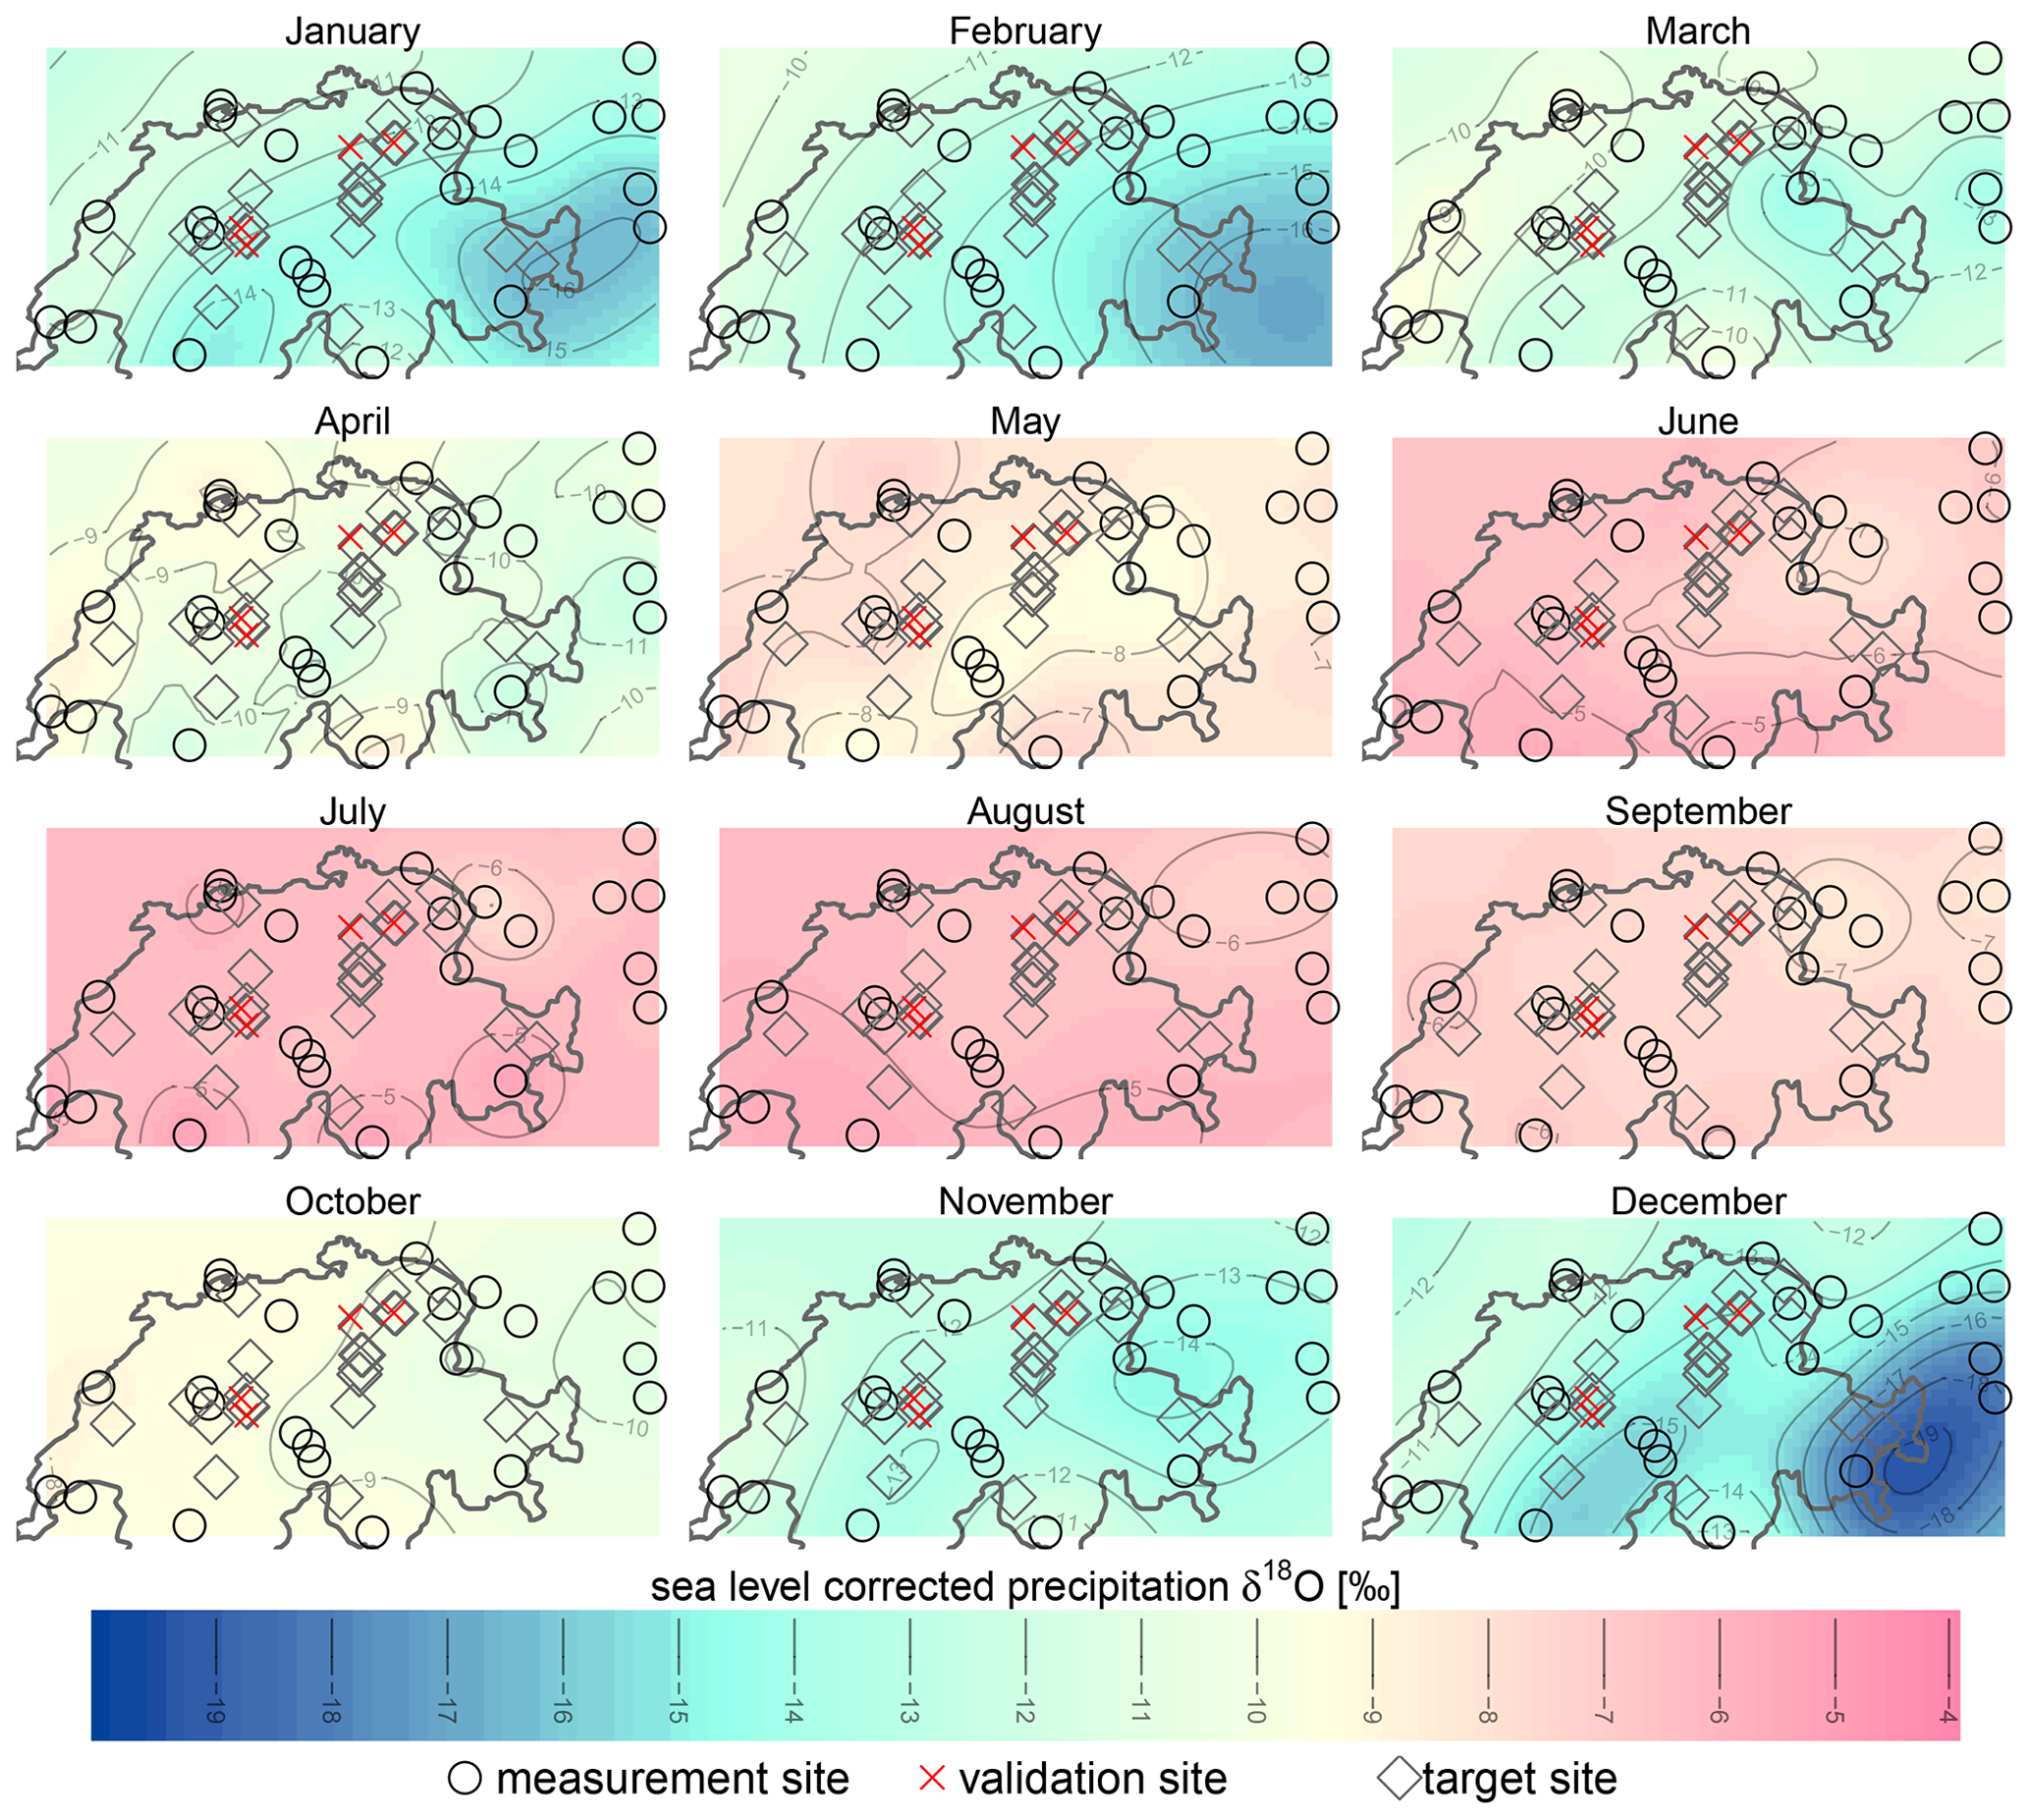
Figure 8Monthly maps of sea-level-corrected δ18O in precipitation.
2.2 δ2H and δ18O for precipitation
For isotopes in precipitation, data from the National Network for the Observation of Isotopes in the Water Cycle (ISOT; see Schotterer, 2010) were used to predict precipitation isotopes for the selected catchments. For the catchments close to the Swiss border, data from the Austrian network (ANIP) as well as the global network (GNIP) were also used to allow for a better interpolation. Average gradients for each month were calculated from a representative gradient based on three ISOT stations (Fig. 1). Monthly δ18O and δ2H values corrected to sea level elevation were computed for every measurement site of the original network by multiplying the respective average gradient for the month with the elevation of the respective ISOT station and adding it to the isotopic signal measured at this site. The corrected average monthly δ18O and δ2H values were interpolated in space by Kriging (Delhomme, 1978; implemented for R in the gstat package by Pebesma, 2004), resulting in continuous monthly maps (example for δ18O in Fig. 8). In order to obtain an estimate of precipitation isotopic signature for any desired location, the deviation of the closest available measurement site from its long-term average value of the respective month was combined with the interpolated map of corrected average values for the respective month. A more detailed description of the interpolation method can be found in Seeger and Weiler (2014).
Due to limited availability of precipitation isotope data time series with an appropriate length, the data were only validated qualitatively (Seeger and Weiler, 2014), by comparing the predicted isotope values to limited time series of sites situated in northeastern and central Switzerland. The comparison between the interpolated data and validation data suggested good agreement. However, explorative simulations by Seeger and Weiler (2014) also showed a bias of up to 2 ‰ for δ18O between the interpolated precipitation values and the measured discharge values. This suggests that the interpolated values are well suited to predict the amplitudes of the temporal variations of the precipitation isotopes, while the steep topography of the Swiss Alps might lead to regional inhomogeneities that are not fully captured by the data underlying the interpolation procedure.
2.3 Data file format
δ2H and δ18O in streamflow are provided as one ASCII.txt file for each station. Additionally to these time series each of the files contains the deuterium excess, the streamflow conditions preceding the sampling (Q sampling index and streamflow percentiles) and the z scores indicating if a sample might be a statistical outlier, assuming the data are normally distributed. All files contain further information for each sample regarding whether double measurement was performed in the lab, indicating for instance special sampling conditions (e.g., ice) or storage-related issues that could alter the isotopic composition due to fractionation (e.g., sample bottle not closed tightly).
For each data file for streamflow data there is a corresponding ASCII.txt file for catchment precipitation. These contain the interpolated δ2H and δ18O in precipitation for the catchment as well as the source data that were used to derive the interpolated values.
2.4 Associated data
The data set is complemented by daily precipitation and air temperature for each catchment as well as the shapefiles for the topographical catchment boundaries. The underlaying data for the areal precipitation sums and the areal air temperature averages were extracted from the gridded data products “Rhires” and “Tabs” from MeteoSwiss, respectively. The gridded data were masked with the shapefile of the catchment, and the arithmetic mean of each grid cell value for each day was calculated to obtain mean areal air temperature and precipitation. For grid cells that were only partially within the catchment boundaries their value was included in the mean, assigning a weight according to the percentage intersecting the mask. These data are provided together with the isotopic data as separate ASCII.txt files. The shapefiles of the catchment boundaries are also provided. These were extracted from a data set comprising the topographic catchment boundaries of gauged federal stations (FOEN, https://data.geo.admin.ch/ch.bafu.hydrologie-hydromessstationen/ch.bafu.hydrologie-hydromessstationen_einzugsgebiete.zip, last access: 14 October 2020).
This data set with isotope data from precipitation and streamflow allows the estimation of mean transit times. With these, catchment water storage (mobile storage) can be estimated and may be related to the sensitivity to droughts (Staudinger et al., 2017). From this data set, young water fractions can also be calculated; for instance, using the data presented here, Von Freyberg et al. (2018b) assessed how sensitive the young water fraction is to both hydro-climatic forcing and catchment properties. Using the δ18O values in precipitation and streamflow for 12 catchments of the presented data set, Allen et al. (2019) assessed whether summer or winter precipitation is overrepresented in streamflow, relative to its proportion of total precipitation. Parts of this data set (composition of isotopes in precipitation) were also used to re-investigate the relationship between transit times and catchment topography (Seeger and Weiler, 2014).
In 2019 we were still collecting data for 14 sites, and it is planned to continue these observations. A long-term sampling will allow for more robust estimations of storages and young water, and hence for a more robust reassessment of the mentioned studies. The growing data set will also provide opportunities for a closer look at catchment transit times and storages. The data set will, for instance, allow us to compare different conditions such as dry or wet years or the effects of extreme events.
Additional data that may be useful for potential applications are time series of streamflow and shapefiles of the catchments, which are both provided by the Swiss FOEN; meteorological time series, which are provided by MeteoSwiss; and a digital elevation model of Switzerland, which is provided by Swisstopo.
The data set can be downloaded from the data repository Zenodo at https://doi.org/10.5281/zenodo.4057967 (Staudinger et al., 2020). Associated streamflow data can be obtained for most of the stations from the Swiss Federal Office of the Environment (FOEN) by email (hydrologie@bafu.admin.ch) or online form (https://www.bafu.admin.ch/bafu/en/home/topics/water/state/data/obtaining-monitoring-data-on-the-topic-of-water/hydrological-data-service-for-watercourses-and-lakes.html, last access: 14 October 2020); for the small Alptal catchments (ERL, LUE and VOG) from the Swiss Federal Institute for Forest, Snow and Landscape Research (WSL, https://www.envidat.ch/#/metadata/longterm-hydrological-observatory-alptal-central-switzerland, last access: 14 October 2020); for Roethenbach (ROE) from the canton of Bern (AWA) by email (info.awa@be.ch); and for the Aabach (AAM) from the canton of Zürich (AWEL) by email (hydrometrie@bd.zh.ch).
MS, JS, KS and MW designed the sampling net; BH and MS did the lab analysis and maintained the data bank. SS interpolated the isotopes in precipitation. MS wrote the first draft of the manuscript. All authors contributed to the discussion and revised the submitted manuscript.
The authors declare that they have no conflict of interest.
We thank all the people who went out to take samples, many of them starting in 2010 and continuing until today. We want to explicitly mention Martin Altermatt, Tiefbauamt Basel-Land, Heinz Aschwanden and Roland Gamma (Tiefbauamt Kanton Uri) and Kari Steiner (WSL). Financial support for this long-term sampling campaign came from the Swiss National Science Foundation (NFP61 “Drought-CH”, 2010–2016), the Swiss Federal Office for the Environment (FOEN) (project “Auswirkungen der Klimaveränderung auf das Grundwasser und Niedrigwasser, November 2013–December 2016, contract 13.0055.PJ/M372-1682) and the University of Zurich. The basic data for the interpolation of isotopic compositions in precipitation came from ISOT provided by FOEN, the National Groundwater Monitoring (NAQUA) from GNIP provided by IAEA and ANIP from the Environment Agency Austria. The streamflow data were provided by FOEN and the Office of Waste, Water, Energy and Air, WWEA, Kanton Zürich.
We further thank the two anonymous reviewers for their valuable comments on the manuscript and the data set.
This research has been supported by the Swiss National Science Foundation (grant no. 406140_125925).
This paper was edited by David Carlson and reviewed by two anonymous referees.
Allen, S. T., Von Freyberg, J., and Kirchner, J. W.: The Seasonal Origins of Streamwater in Switzerland Geophysical Research Letters, 46, 425–434, https://doi.org/10.1029/2019GL084552, 2019.
Bitterli, T., George, M., Matousek, F., Christe, R., Aviolat, P., Fracheboud, S., Brändli, R., and Frey, D.: Grundwasservorkommen, Hydrologischer Atlas der Schweiz, Tafel 8.4, Bern, 2004.
Christophersen, N., Neal, C., Hooper, R. P., Vogt, R. D., and Andersen, S.: Modelling streamwater chemistry as a mixture of soilwater end-members – A step towards second-generation acidification models, J. Hydrol., 116, 307–320, https://doi.org/10.1016/0022-1694(90)90130-P, 1990.
Craig, H.: Isotopic Variations in Meteoric Waters, Science, 133, 1702–1703, https://doi.org/10.1126/science.133.3465.1702, 1961.
Dansgaard, W.: The Abundance of O18 in Atmospheric Water and Water Vapour, Tellus, 5, 461–469, 1953.
Dansgaard, W.: Stable isotopes in precipitation, Tellus, 16, 436–468, https://doi.org/10.3402/tellusa.v16i4.8993, 1964.
Delhomme, J. P.: Kriging in the hydrosciences, Adv. Water Resour., 1, 251–266, https://doi.org/10.1016/0309-1708(78)90039-8, 1978.
Epstein, S.: Variations of the 18O/16 O Ratios of Freshwater and Ice. Report No. 19, 1956.
Fischer, B. M. C., Stahli, M., and Seibert, J.: Pre-event water contributions to runoff events of different magnitude in pre-alpine headwaters, Hydrol. Res., 48, 28–47, https://doi.org/10.2166/nh.2016.176, 2016.
Fischer, B. M. C., van Meerveld, H. J., and Seibert, J.: Spatial variability in the isotopic composition of rainfall in a small headwater catchment and its effect on hydrograph separation, J. Hydrol., 547, 755–769, https://doi.org/10.1016/j.jhydrol.2017.01.045, 2017.
Friedman, I.: Deuterium content of natural waters and other substances, Geochim. Cosmochim., 4, 89–103, 1953.
Gilfillan, E. S.: The Isotopic Composition of Sea Water, J. Am. Chem. Soc., 56, 406–408, https://doi.org/10.1021/ja01317a037, 1934.
Gonfiantini, R.: The d-notation and the mass-spectrometric measurement techniques, in: Stable Isotope Hydrology, Deuterium and Oxygen-18 in the Water Cycle, edited by: Gat, J. R. and Gonfiantini, R., Technical Reports Series No. 210, IAEA, 35–84, Vienna, 1981.
Gourcy, L. L., Groening, M., and Aggarwal, P. K.: Stable Oxygen and Hydrogen Isotopes in Precipitation, in: Isotopes in the Water Cycle, Springer-Verlag, Berlin/Heidelberg, 39–51, 2005.
Kiewiet, L., van Meerveld, I., and Seibert, J.: Effects of spatial variability in the groundwater isotopic composition on hydrograph separation results for a pre‐alpine headwater catchment, Water Resour. Res., 56, e2019WR026855, https://doi.org/10.1029/2019WR026855, 2020.
Klaus, J. and McDonnell, J. J.: Hydrograph separation using stable isotopes: Review and evaluation, J. Hydrol., 505, 47–64, https://doi.org/10.1016/j.jhydrol.2013.09.006, 2013.
Knapp, J. L. A., Neal, C., Schlumpf, A., Neal, M., and Kirchner, J. W.: New water fractions and transit time distributions at Plynlimon, Wales, estimated from stable water isotopes in precipitation and streamflow, Hydrol. Earth Syst. Sci., 23, 4367–4388, https://doi.org/10.5194/hess-23-4367-2019, 2019.
Lyon, S. W., Laudon, H., Seibert, J., Mörth, M., Tetzlaff, D., and Bishop, K. H.: Controls on snowmelt water mean transit times in northern boreal catchments, Hydrol. Process., 24, 1672–1684, https://doi.org/10.1002/hyp.7577, 2010.
Marti, P. and Kan, C.: NQStat: Vergleich der Trockenjahre 1947 und 2003 – ein Anwendungsbeispiel der Niedrigwasser-Datenbank NQStat, Wasser Energ. Luft 95, 333–336, 2003.
McGuire, K. J. and McDonnell, J. J.: A review and evaluation of catchment transit time modeling, J. Hydrol., 330, 543–563, https://doi.org/10.1016/j.jhydrol.2006.04.020, 2006.
McGuire, K. J., McDonnell, J. J., Weiler, M., Kendall, C., McGlynn, B. L., Welker, J. M., and Seibert, J.: The role of topography on catchment-scale water residence time, Water Resour. Res., 41, W05002, https://doi.org/10.1029/2004WR003657, 2005.
Pebesma, E. J.: Multivariable geostatistics in S: the gstat package, Comput. Geosci., 30, 683–691, https://doi.org/10.1016/J.CAGEO.2004.03.012, 2004.
Rücker, A., Boss, S., Kirchner, J. W., and von Freyberg, J.: Monitoring snowpack outflow volumes and their isotopic composition to better understand streamflow generation during rain-on-snow events, Hydrol. Earth Syst. Sci., 23, 2983–3005, https://doi.org/10.5194/hess-23-2983-2019, 2019.
Schotterer, U.: Wasserisotope in der Schweiz – Neue Ergebnisse und Erfahrungen aus dem nationalen Messnetz ISOT, Wasser – EAUX, 12, 1073–1081, 2010.
Seeger, S. and Weiler, M.: Reevaluation of transit time distributions, mean transit times and their relation to catchment topography, Hydrol. Earth Syst. Sci., 18, 4751–4771, https://doi.org/10.5194/hess-18-4751-2014, 2014.
Seneviratne, S. I., Orth, R., Jörg-hess, S., Kruse, S., Seidl, I., Stähli, M., Zappa, M., Seibert, J., Staudinger, M., Stahl, K., and Weiler, M.: Trockenheit in der Schweiz, Aqua Gas, 9, 38–47, 2013.
Staudinger, M., Stoelzle, M., Seeger, S., Seibert, J., Weiler, M., and Stahl, K.: Catchment water storage variation with elevation, Hydrol. Process., 31, 2000–2015, https://doi.org/10.1002/hyp.11158, 2017.
Staudinger, M., Seeger, S., Herbstritt, B., Stoelzle, M., Seibert, J., Stahl, K., and Weiler, M., The CH-IRP data set: fortnightly data of δ2H and δ18O in streamflow and precipitation in Switzerland (Version Version 1) [Data set], Zenodo, https://doi.org/10.5281/zenodo.4057967, 2020.
Sprenger, M., Stumpp, C., Weiler, M., Aeschbach, W., Allen, S. T., Benettin, P., Dubbert, M., Hartmann, A., Hrachowitz, M., Kirchner, J. W., McDonnell, J. J., Orlowski, N., Penna, D., Pfahl, S., Rinderer, M., Rodriguez, N., Schmidt, M., and Werner, C.: The Demographics of Water: A Review of Water Ages in the Critical Zone, Rev. Geophys., 57, 800–834, https://doi.org/10.1029/2018RG000633, 2019.
Tetzlaff, D., Seibert, J., McGuire, K. J., Laudon, H., Burns, D. A., Dunn, S. M., and Soulsby, C.: How does landscape structure influence catchment transit time across different geomorphic provinces, Hydrol. Process., 23, 945–953, 2009.
van Meerveld, H. J., Fischer, B. M. C., Rinderer, M., Stähli, M., and Seibert, J.: Runoff generation in a pre-alpine catchment: A discussion between a tracer and a shallow groundwater hydrologist, Geogr. Res. Lett., 44, 429–452, https://doi.org/10.18172/cig.3349, 2018.
von Freyberg, J., Studer, B., Rinderer, M., and Kirchner, J. W.: Studying catchment storm response using event- and pre-event-water volumes as fractions of precipitation rather than discharge, Hydrol. Earth Syst. Sci., 22, 5847–5865, https://doi.org/10.5194/hess-22-5847-2018, 2018a.
von Freyberg, J., Allen, S. T., Seeger, S., Weiler, M., and Kirchner, J. W.: Sensitivity of young water fractions to hydro-climatic forcing and landscape properties across 22 Swiss catchments, Hydrol. Earth Syst. Sci., 22, 3841–3861, https://doi.org/10.5194/hess-22-3841-2018, 2018b.
Wassenaar, L. I., Terzer-Wassmuth, S., Douence, C., Araguas-Araguas, L., Aggarwal, P. K., and Coplen, T. B.: Seeking excellence: An evaluation of 235 international laboratories conducting water isotope analyses by isotope-ratio and laser-absorption spectrometry, Rapid Commun. Mass Spectrom., 32, 393–406, https://doi.org/10.1002/rcm.8052, 2018.