the Creative Commons Attribution 4.0 License.
the Creative Commons Attribution 4.0 License.
 | 23 Nov 2020
Key landscapes for conservation land cover and change monitoring, thematic and validation datasets for sub-Saharan Africa
Zoltan Szantoi
Andreas Brink
Andrea Lupi
Claudio Mammone
Gabriel Jaffrain
Mounting social and economic demands on natural resources increasingly threaten key areas for conservation in Africa. Threats to biodiversity pose an enormous challenge to these vulnerable areas. Effective protection of sites with strategic conservation importance requires timely and highly detailed geospatial monitoring. Larger ecological zones and wildlife corridors warrant monitoring as well, as these areas have an even higher degree of pressure and habitat loss. To address this, a satellite-imagery-based monitoring workflow to cover at-risk areas at various details was developed. During the program's first phase, a total of 560 442 km2 area in sub-Saharan Africa was covered, from which 153 665 km2 was mapped with eight land cover classes while 406 776 km2 was mapped with up to 32 classes. Satellite imagery was used to generate dense time series data from which thematic land cover maps were derived. Each map and change map were fully verified and validated by an independent team to achieve our strict data quality requirements. The independent validation datasets for each key landscape for conservation (KLC) are also described and presented here (full and teaser datasets are available at https://doi.org/10.1594/PANGAEA.914261, Szantoi et al., 2020a).
- Article
(7633 KB) - Full-text XML
- Version 2021
-
Supplement
(217 KB) - BibTeX
- EndNote


Key landscapes for conservation (MacKinnon et al., 2015) (KLCs) are defined as areas vast enough to sustain large wild animals (e.g., “big-five” game) within functioning biomes that face pressure from various external factors such as poaching, agriculture expansion, and urbanization. Land use changes cause loss in both flora and fauna by altering wild animal movements that can lead to decreases in population size over time (Di Minin et al., 2016; van der Meer, 2018). The livelihood of people and wildlife in Africa that depend on natural resources faces increasing pressure from resource consumption by the continent's growing population, set to reach 2 billion by 2040 (MacKinnon et al., 2015, Di Minin et al., 2016). The representative location types, often transboundary, of the KLCs uniquely positions them as benchmarks for their natural resource management to generate steady income for the local residents while protecting their wildlife (MacKinnon et al., 2015). Benchmarking activities of this kind require highly accurate thematic land cover change (LCC) map products. Although LCC maps exist for many areas within Africa, the majority of products only cover protected areas with some buffer zones (Szantoi et al., 2016). However, continental and global mapping efforts reported thematic accuracies for such land cover maps between 67 % and 81 %, with lower class accuracies reported in many cases (Mora et al., 2014). Differences in legends and unstandardized methods make these cases difficult to use for monitoring, modeling, or change detection studies. In order to use various land cover (LC) and LCC products together (i.e., modeling, policy making), land cover class definitions should be standardized to avoid discrepancies in thematic class understanding. Not all users (international organizations, national governments, civil societies, researchers) have the capabilities to readjust such maps (Saah et al., 2020). To accommodate diverse user profiles, a common processing scheme is employed. The resulting datasets can be utilized through various platforms and systems.
This work adopts the Land Cover Classification Scheme of the Food and Agriculture Organization (FAO LCCS; Di Gregorio, 2005), an internationally approved ISO standard approach. The presented datasets in this paper are produced within the Copernicus High-Resolution Hot Spot Monitoring (C-HSM) activity of the Copernicus Global Land Service. All C-HSM products feature the same thematic land cover legend and geometric accuracy and were processed and validated following the same methodology. All products, including the C-HSM data, are free and open to any user with guaranteed long-term maintenance and availability under the Copernicus license.
Copernicus serves as an operational program where data production takes place on a continuous basis. This paper presents 12 KLC land cover (change) datasets that cover up to 560 442 km2 of terrestrial land area in sub-Saharan Africa (SSA) mapped under the first phase (phase 1) of the C-HSM activity. The datasets are based on freely available medium-spatial-resolution data. Each of the KLCs were individually validated for both present (∼ 2016) and change (∼ 2000) dates. The developed processing chain always consists of preliminary data assessment for availability, pre- and postprocessing, and fully independent quality verification and validation steps. For the latter, a second dataset called validation data is presented.
Several recent studies call for the sharing of product validation datasets (Fritz et al., 2017; Tsendbazar et al., 2018), especially if a collection received financial support from government grants (Szantoi et al., 2020b). Accordingly, the validation datasets (LC–LCC) associated with each of the KLCs are also shared.
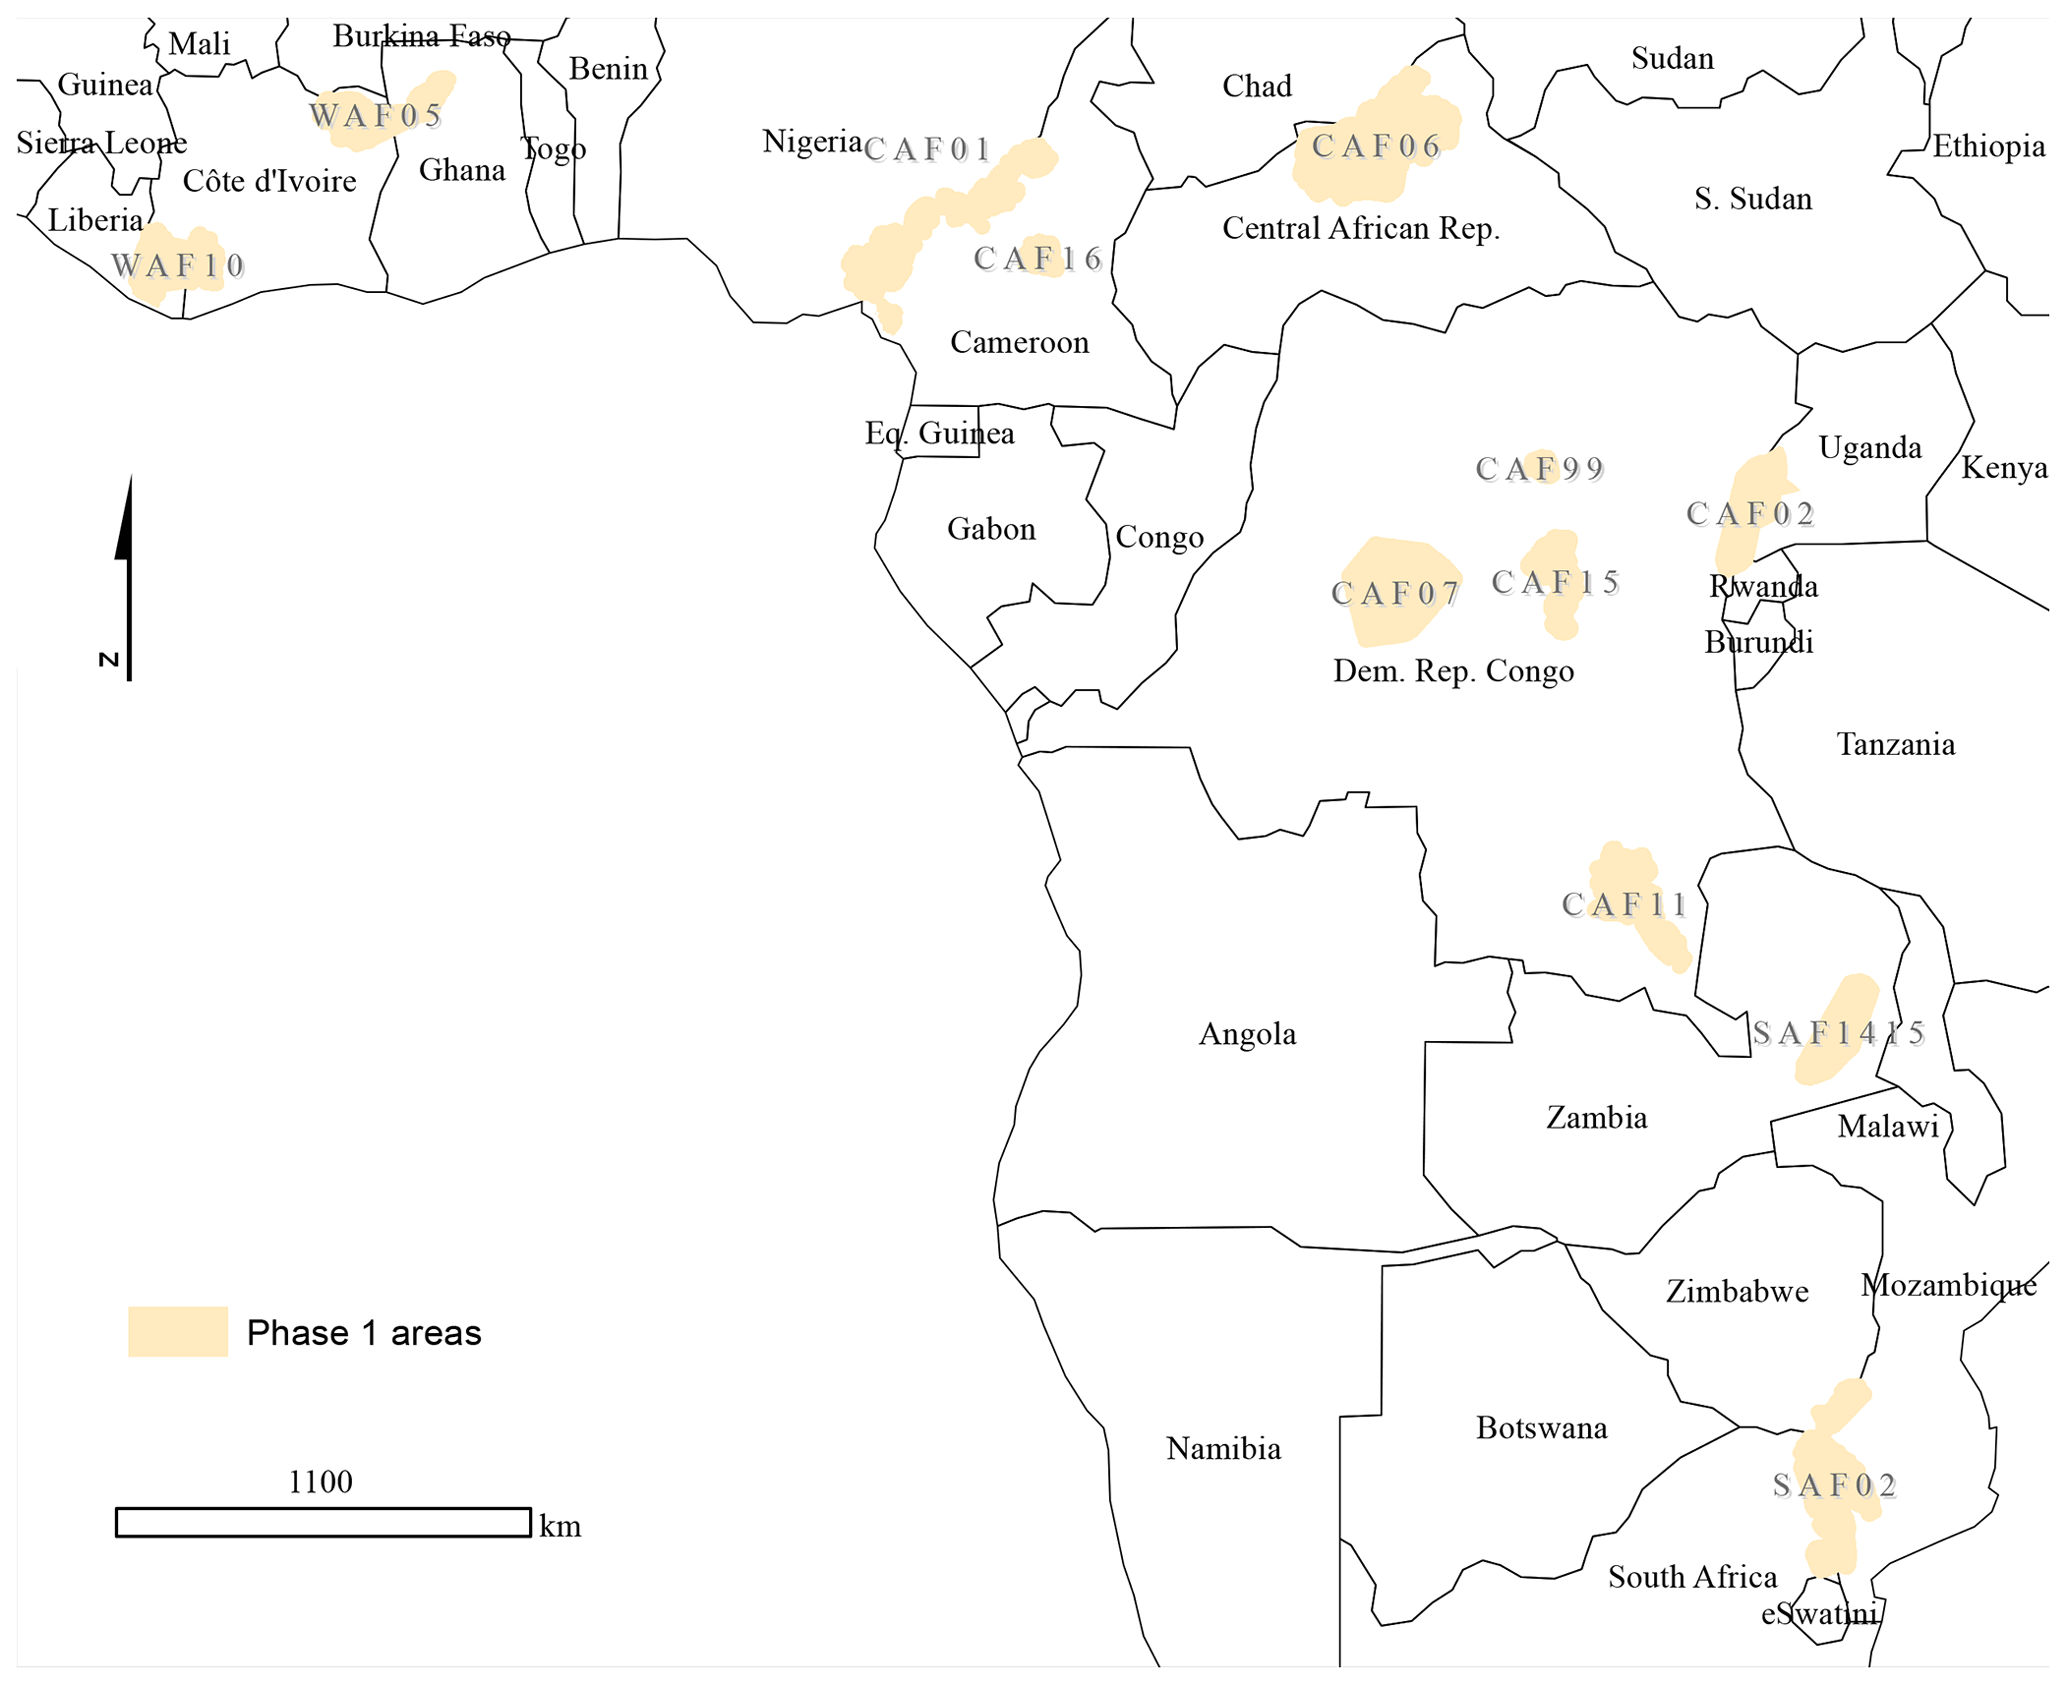
Figure 1Spatial distribution of the key landscapes for conservation phase 1 areas.
The provided thematic datasets concentrate on sub-Saharan Africa. This region is on the frontline of natural and human-induced changes. The selection of areas was conducted based on present and future pressures envisioned and predicted (MacKinnon et al., 2015). In this first phase (phase 1), 12 large areas totalling 560 442 km2 in SSA were selected, mapped, and validated (Fig. 1). These areas cover various ecosystems and generally reside in transboundary regions (Table 1, Fig. 1).
3.1 Thematic dataset production
The production workflow for the entire process is shown in Fig. 2. Each stage is explained in detail in the below sections.
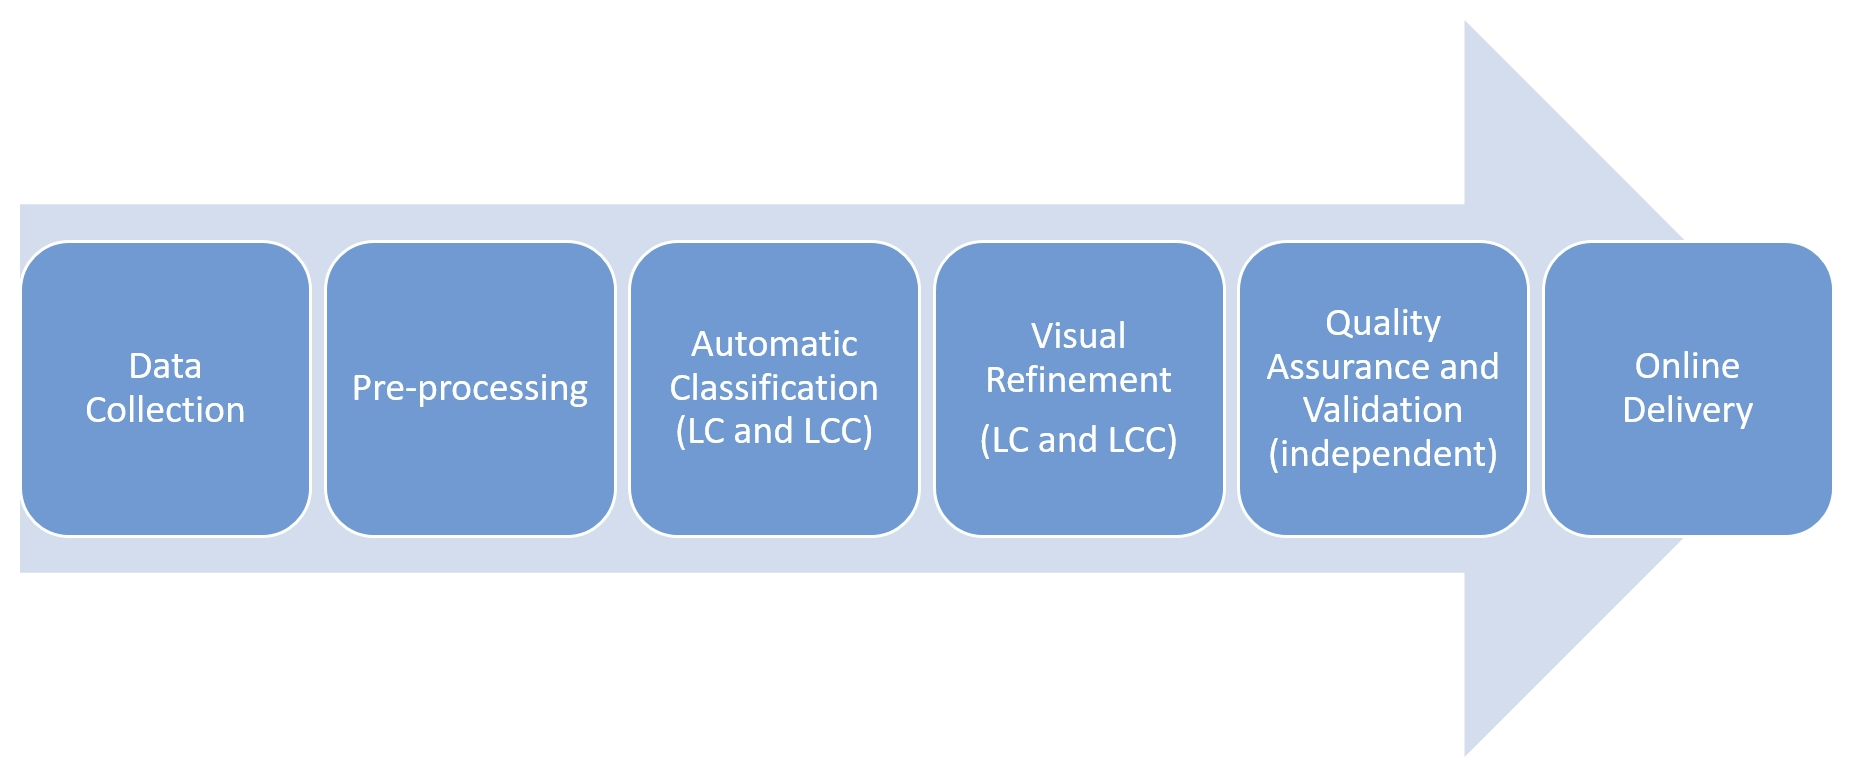
Figure 2Overall production workflow.
3.1.1 Data collection and mapping guidelines
Landsat TM, ETM+, and OLI imagery at the Level1TP processing level was used in the production of the phase 1 land cover and change maps. The Level1TP data were further corrected for atmospheric conditions to produce surface reflectance products for the classification phase. The atmospheric correction module was implemented based on the 6S as a direct radiative transfer model (Masek et al., 2006). The Shuttle Radar Topography Mission (30 or 90 m) digital elevation model was used to estimate the target height and slope as well as correct the surface sun incidence angles to perform an optional topographic correction. The aerosol optical thickness (AOT) was estimated directly from either Landsat or Sentinel-2 data (Hagolle et al., 2015). Based on the area's meteo-climatic conditions (climate profile and precipitation patterns), season-specific satellite image data were selected for each KLC (Table 1). Due to data scarcity for many areas, especially for the change maps (year 2000), imagery was collected for a target year ± 3 years. In extreme cases, (±) 5 years were allowed, or until four cloud-free observations per pixel for the specified date were reached. The cloud and shadow masking procedure was based on the Fmask algorithm (Zhu et al., 2015).
Table 1Mapped key landscapes for conservation (KLCs) within phase 1. Mapping detail refers to the employed classification scheme – Dichotomous (D) and Modular (M); see it in the Data collection and mapping guidelines section.
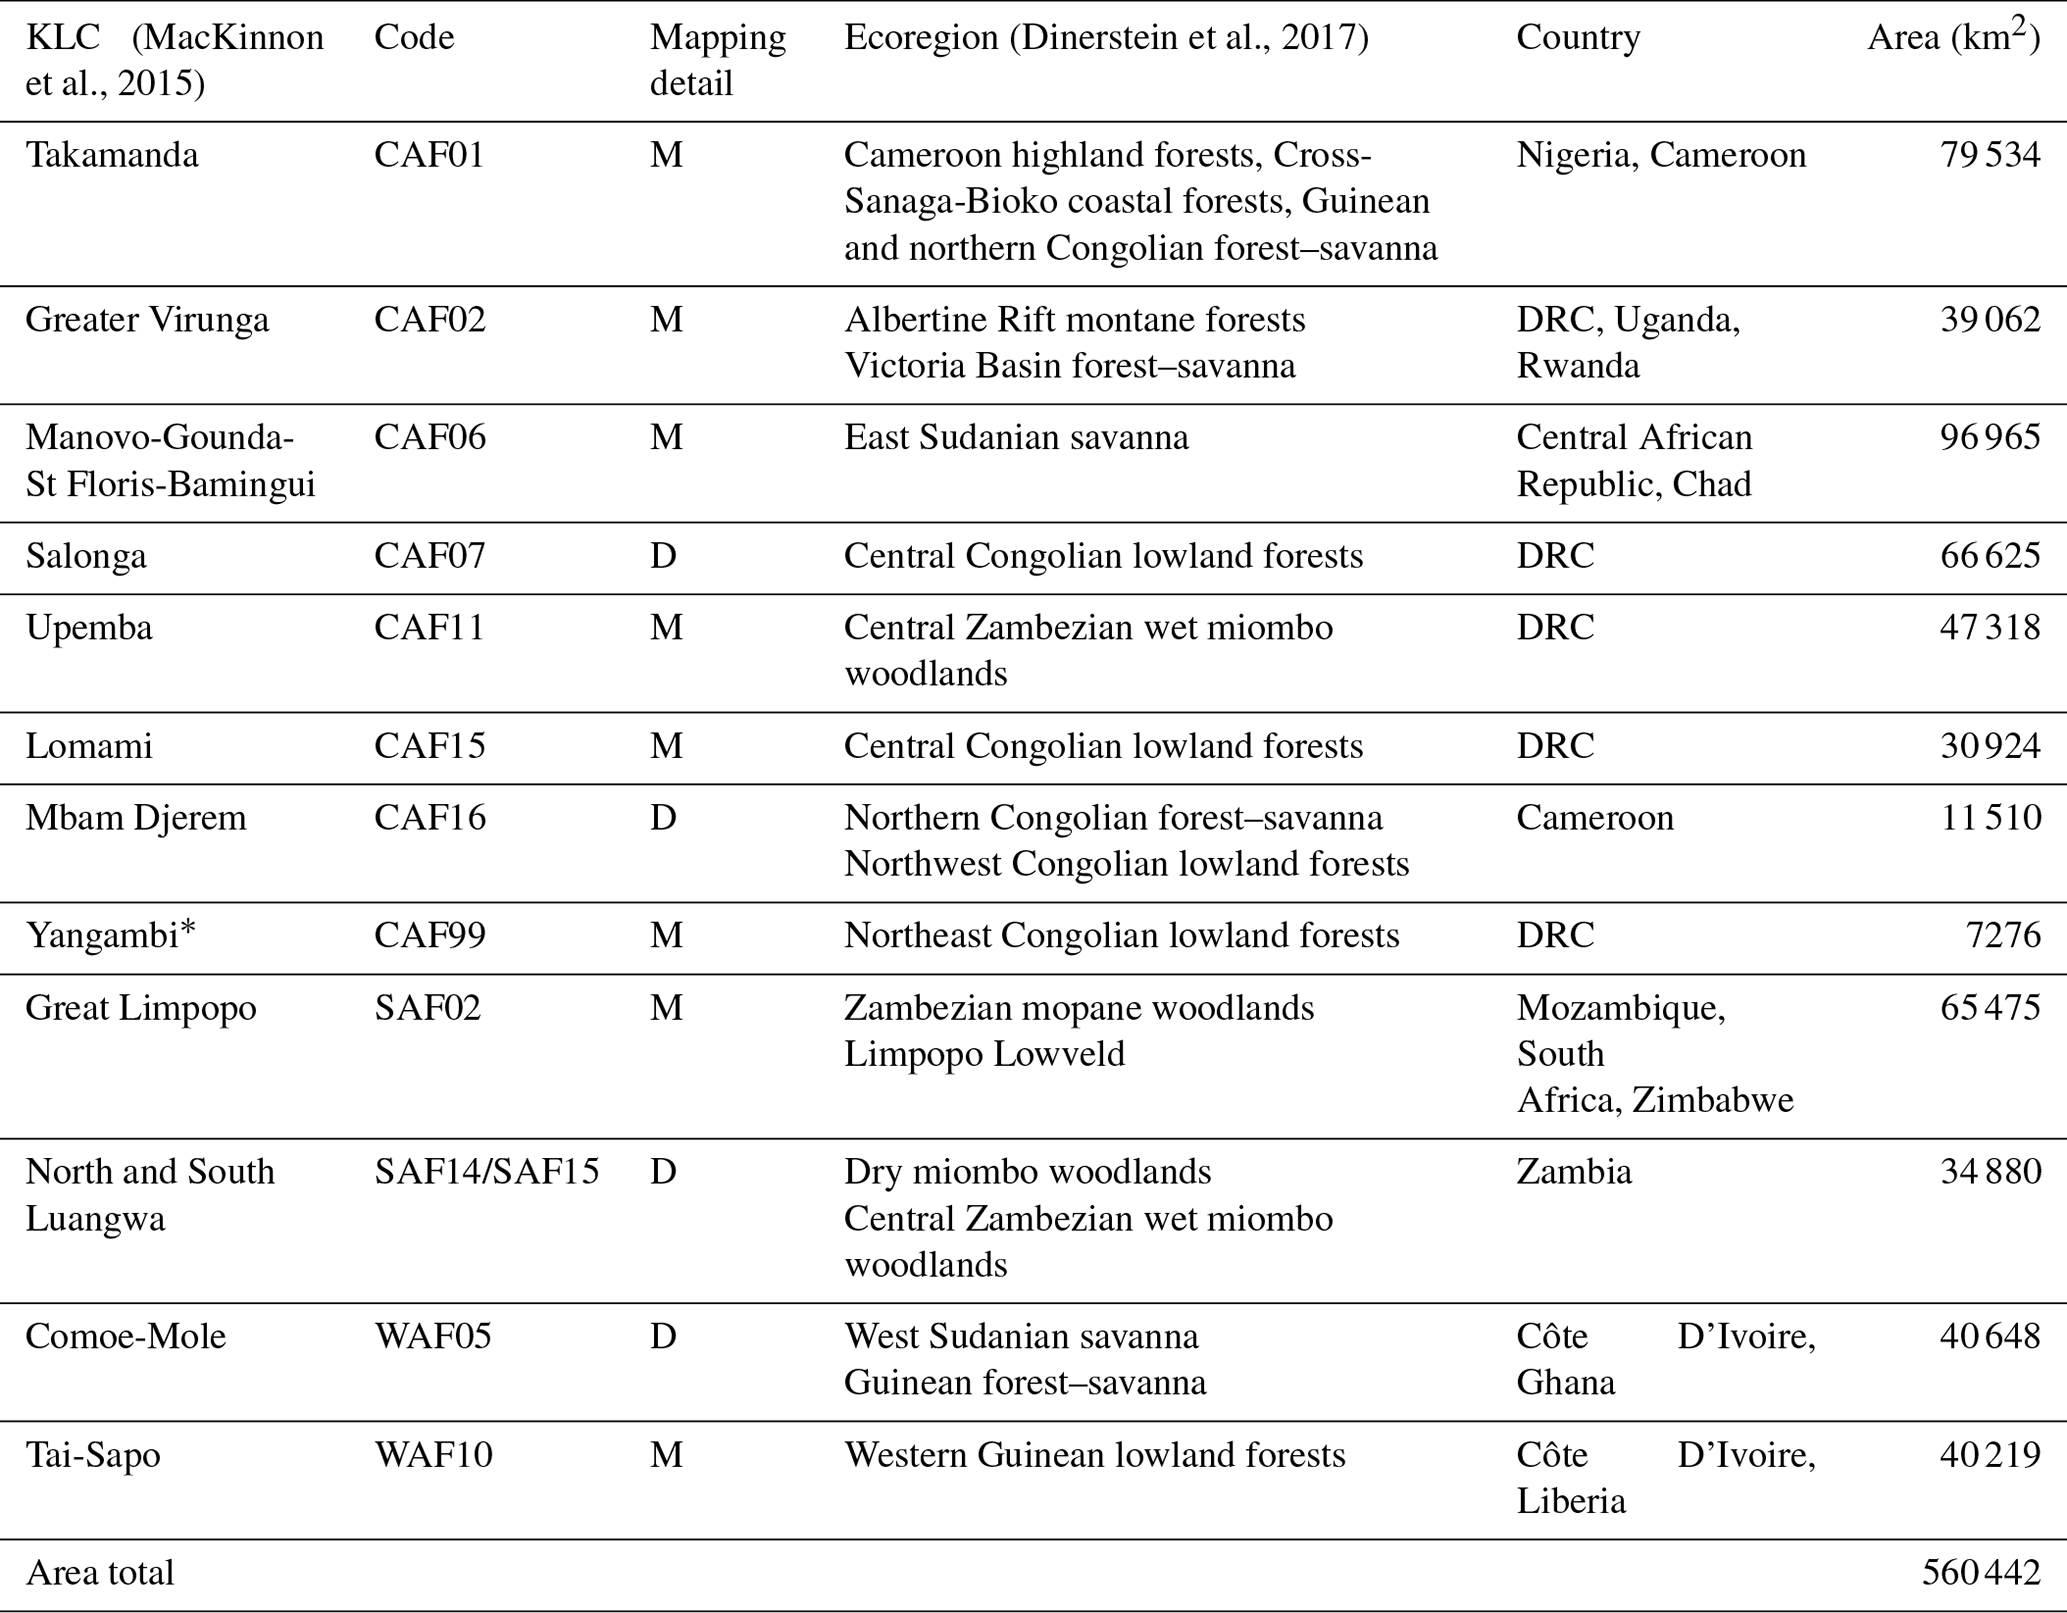
* Not included in the MacKinnon et al. (2015) list.
DRC: Democratic Republic of the Congo.
Table 2Dichotomous and Modular thematic land cover and land use classes.

3.1.2 Land cover classification system
All thematic maps were produced either at Dichotomous or at both Dichotomous and Modular levels within the Land Cover Classification System (LCCS) developed by the Food and Agriculture Organization of the United Nations and the United Nations Environment Programme (Di Gregorio, 2005). The LCCS (ISO 19144-2) is a comprehensive hierarchical classification system that enables comparison of land cover classes regardless of geographic location or mapping date and scale (Di Gregorio, 2005). At the Dichotomous level, the system distinguishes eight major LC classes. At the Modular level, 32 LC classes were used (Table 2).
3.1.3 Automatic classification
Based on the preselected imagery data, vegetation indices based on dense multitemporal time series (DMT) were generated to reduce data dimensionality and enhance the signal of the surface target. The DMT for each KLC were based on the preprocessed and geometrically coregistered data, forming a geospatial data cube (Strobl et al., 2017). In addition, three vegetation indices were calculated to aid the separation of terrestrial vs. aquatic (NDFI), vegetated vs. barren (SAVI), and evergreen vs. deciduous vegetation areas (NBR).
The indices are (per Landsat spectral bands)
All the preprocessed data (spectral bands and the DMT-based indices) were fed into the support vector machine supervised classification model. The support vector machine classifier can handle data with high dimensionality and performs well with mapping heterogeneous areas, including vegetation community types (Szantoi et al., 2013). To produce the thematic maps, the minimum mapping unit concept used by Szantoi et al. (2016) was employed. Individual pixels (with corresponding land cover class information) were assigned into objects, where the minimum size of an object was set at 0.5–5 ha, as a compromise between technical feasibility (pixel size) and the general size of the observable features (various land cover classes). Still, classification errors (omission and commission of various classes) and false alarms (for land cover change) arose due to the data availability (cloud cover, no data) and the seasonal behavior of the land cover (e.g., rapid foliage change). To correct these errors, expert human image interpretation skills and knowledge that improved the outputs from the automated process were employed.
3.1.4 Land cover change detection
Land cover change was interpreted as a categorical change in which a particular land cover was replaced by another land cover. As an example of conversion, the change of cultivated and managed terrestrial areas (A11) into natural and seminatural terrestrial vegetation (A12) or cultivated and managed terrestrial areas (A11) into artificial surfaces and associated areas (B15) can be mentioned. The basic condition for LC change identification was the detection of changes in spectral reflectance within specific image bands of the employed satellite imagery, but such changes were further evidenced by other interpretation parameters such as shape and texture patterns. In regards to our methodology, images acquired in two or more different timeframes were used in the identification process. Furthermore, land cover changes were characterized by those changes that have longer than yearly and/or seasonal periodicity (dry–wet seasons). Urban sprawl, tree plantations (large or small) to replace herbaceous crops (large or small), tree covers (closed or open), or the creation of a new water reservoir undergo long-term changes that are classified as actual LCCs. In our workflow, the LCC process followed the same image preprocessing steps as the LC method, and an independent classification (similarly to the LC procedure) of the past date was performed. Finally, the LC and the LCC products were compared and change polygons were extracted. As with the LC product, the visual refinement was an important step to produce accurate LCC polygons.
3.2 Validation dataset production
The validation datasets (Table 3, Fig. 3) were individually created for each KLC. The validation datasets (points) were generated using a stratified random-sampling procedure. This assured a sufficient estimation for all land cover and land cover change classes according to their frequency of occurrence. The following formula (Gallaun et al., 2015) was used to determine the minimum number of validation points (per class per KLC):
where nc is the number of sampling units for class c, pc the estimated error rate for class c, σc the accepted standard error of the error of commission for class c, and L the number of classes.

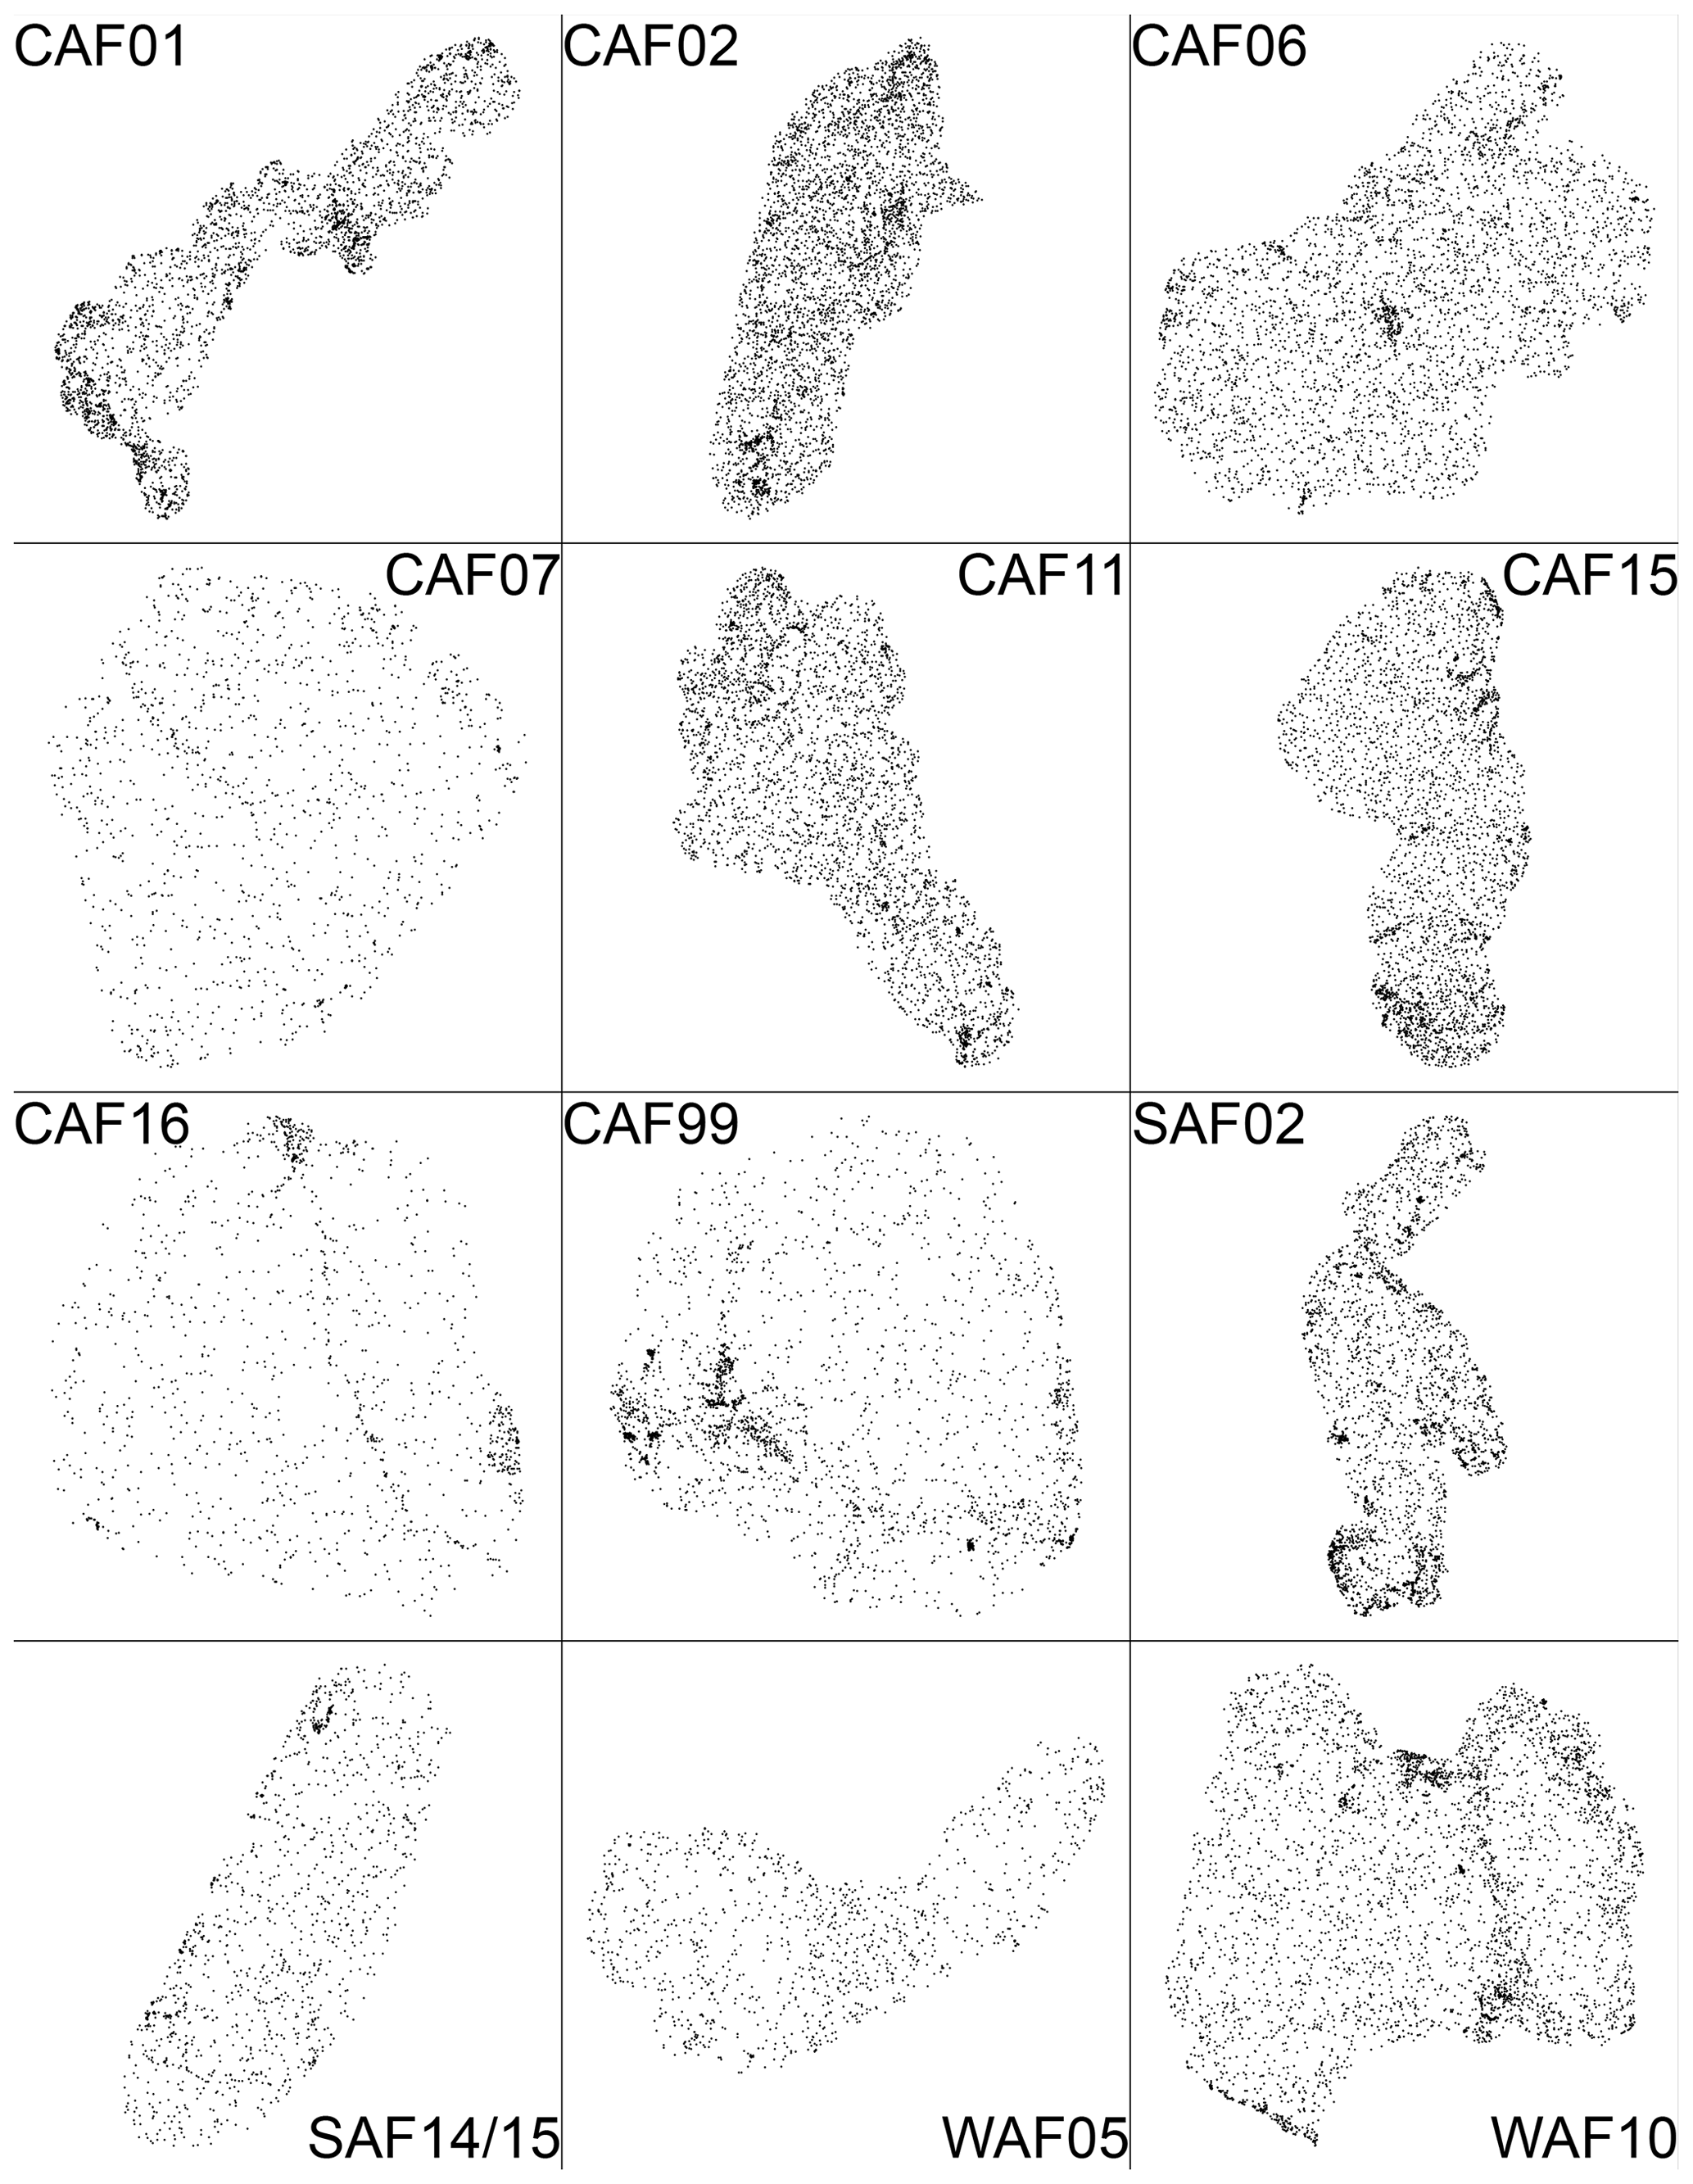
Figure 3Spatial distribution of the validation datasets within each key landscape for conservation area.
In cases where classes covered smaller areas in total, additional sampling units were allocated according to the Neyman optimal allocation in order to minimize the variance of the estimator of the overall accuracy for the total sample size (n) (Gallaun et al., 2015; Stehman, 2012):
where nc is the sample size for class c, Nc the population size for class c, σc the estimated error rate for class c, L the number of classes, Nk the population size for class k, and σk the estimated error rate for class k. At least two independent data analysts (blind and plausibility interpretation process) evaluated all accuracy points. Some points were excluded from the accuracy statistics due to an error/disagreement during the evaluation procedure (Table 3 – “Number of points LC–LCC”). The blind process attempt to interpret all validation points was based on available ancillary data (i.e., higher-resolution imagery), without direct comparison to the generated LC–LCC maps. The plausibility process reviewed every point for which the blind interpretation did not match the corresponding LC–LCC value (disagreement between the LC–LCC data and the blind interpretation). After this review, the final validation reference is established.
Technical validation
Spatial, temporal, and logical consistency was assessed by an independent procedure from the producer to determine the products' positional accuracy, the validity of data with respect to time (seasonality), and the logical consistency of the data (topology, attribution, and logical relationships). A qualitative systematic accuracy assessment was also performed wall to wall through a systematic visual examination for (a) global thematic assessment, (b) expected size of polygons (minimum mapping unit, MMU), (c) seasonal effects, and (d) spatial patterns (i.e., following correct edges).
Table 4Achieved overall accuracies for land cover mapping (%).
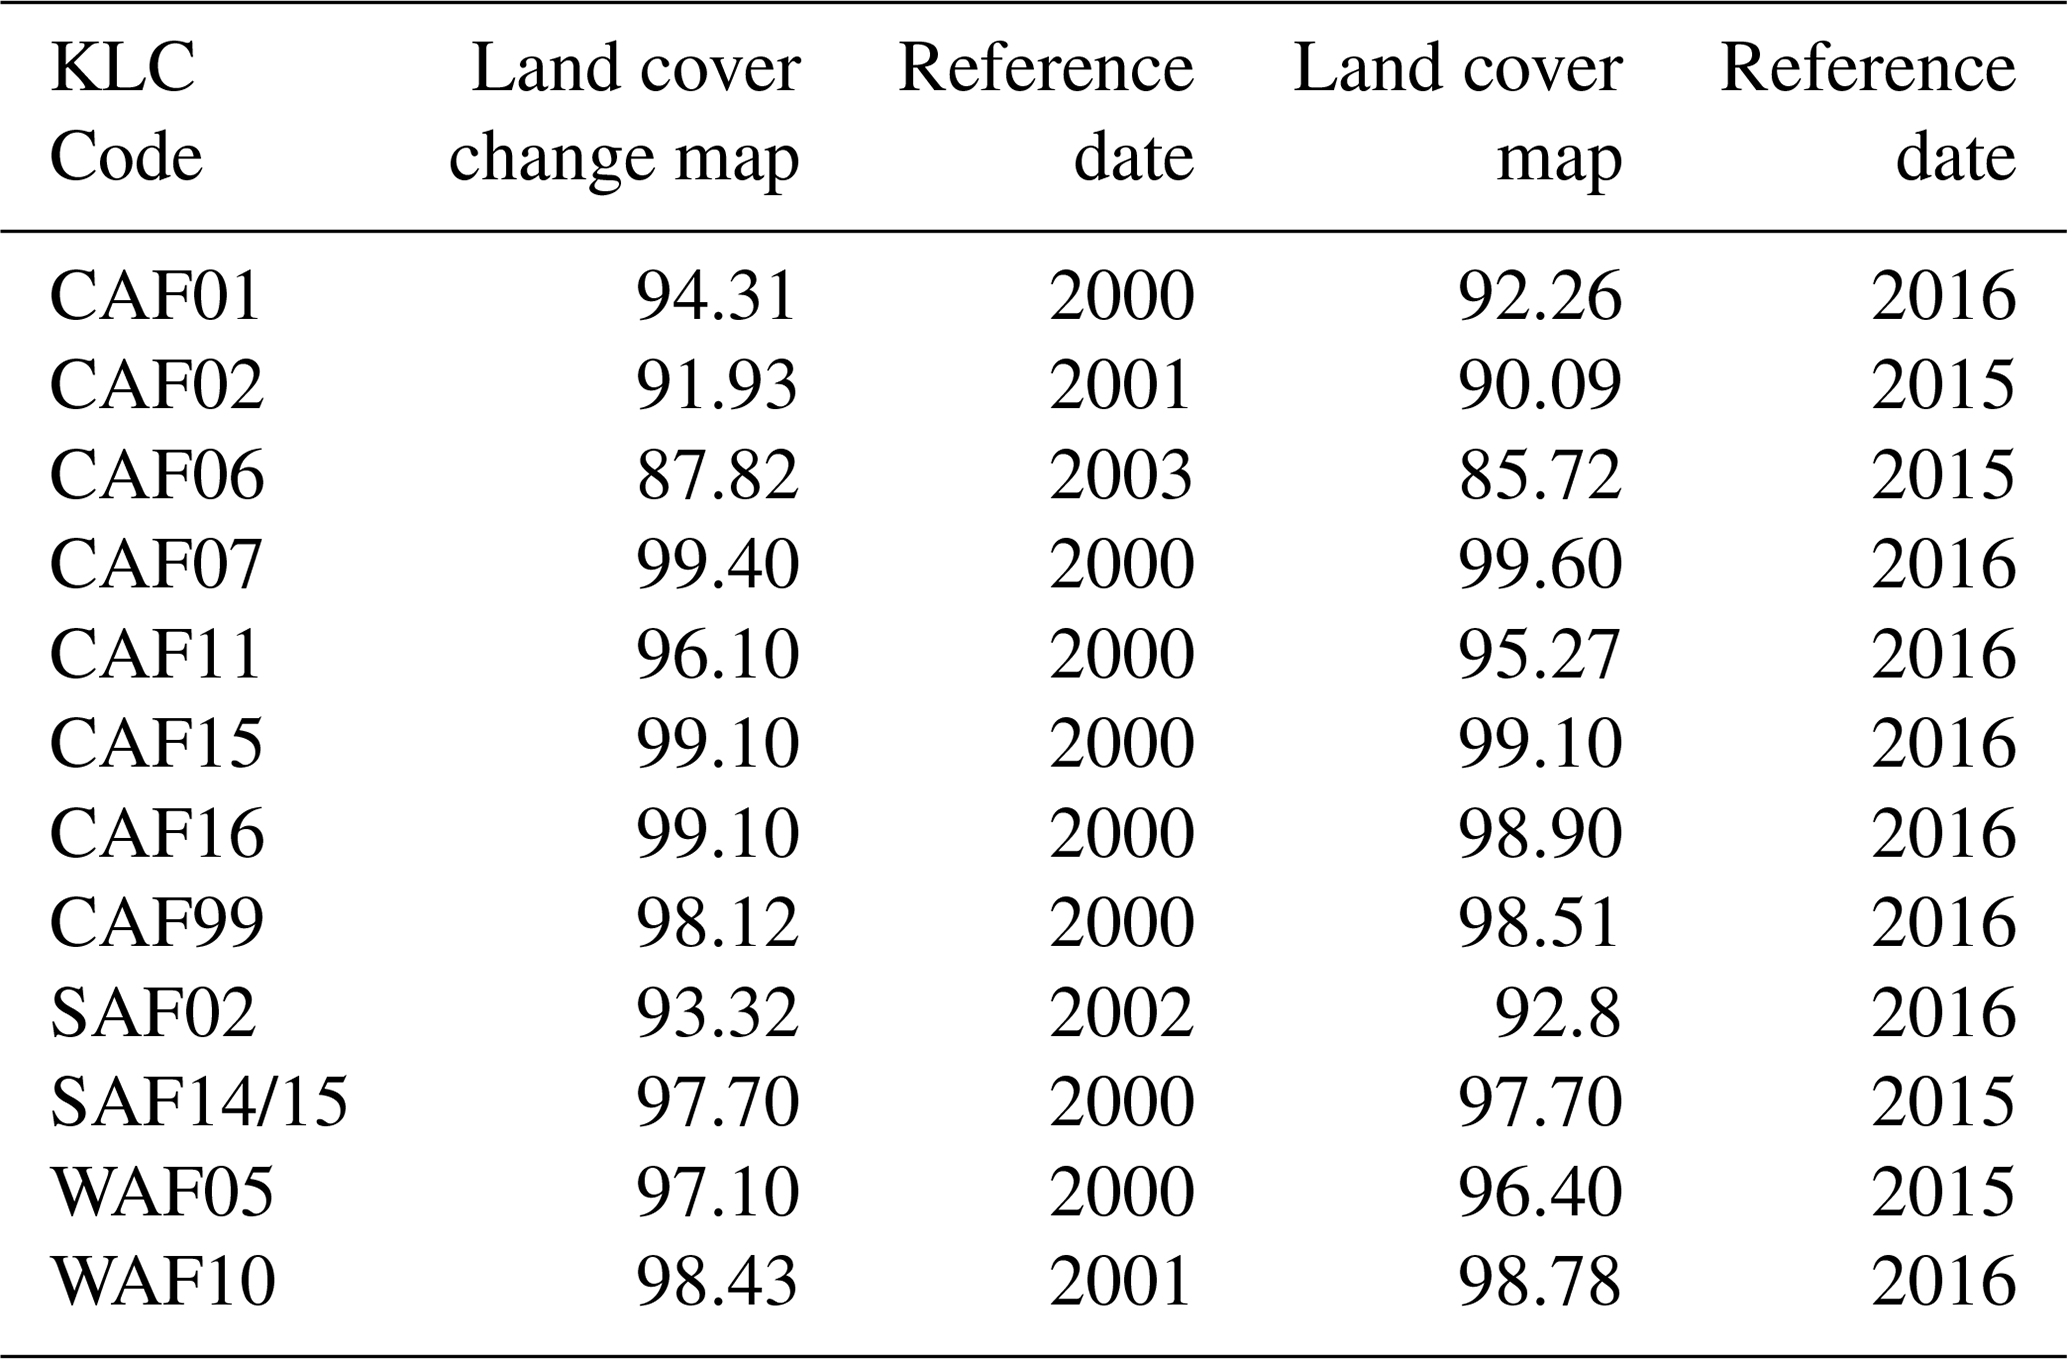
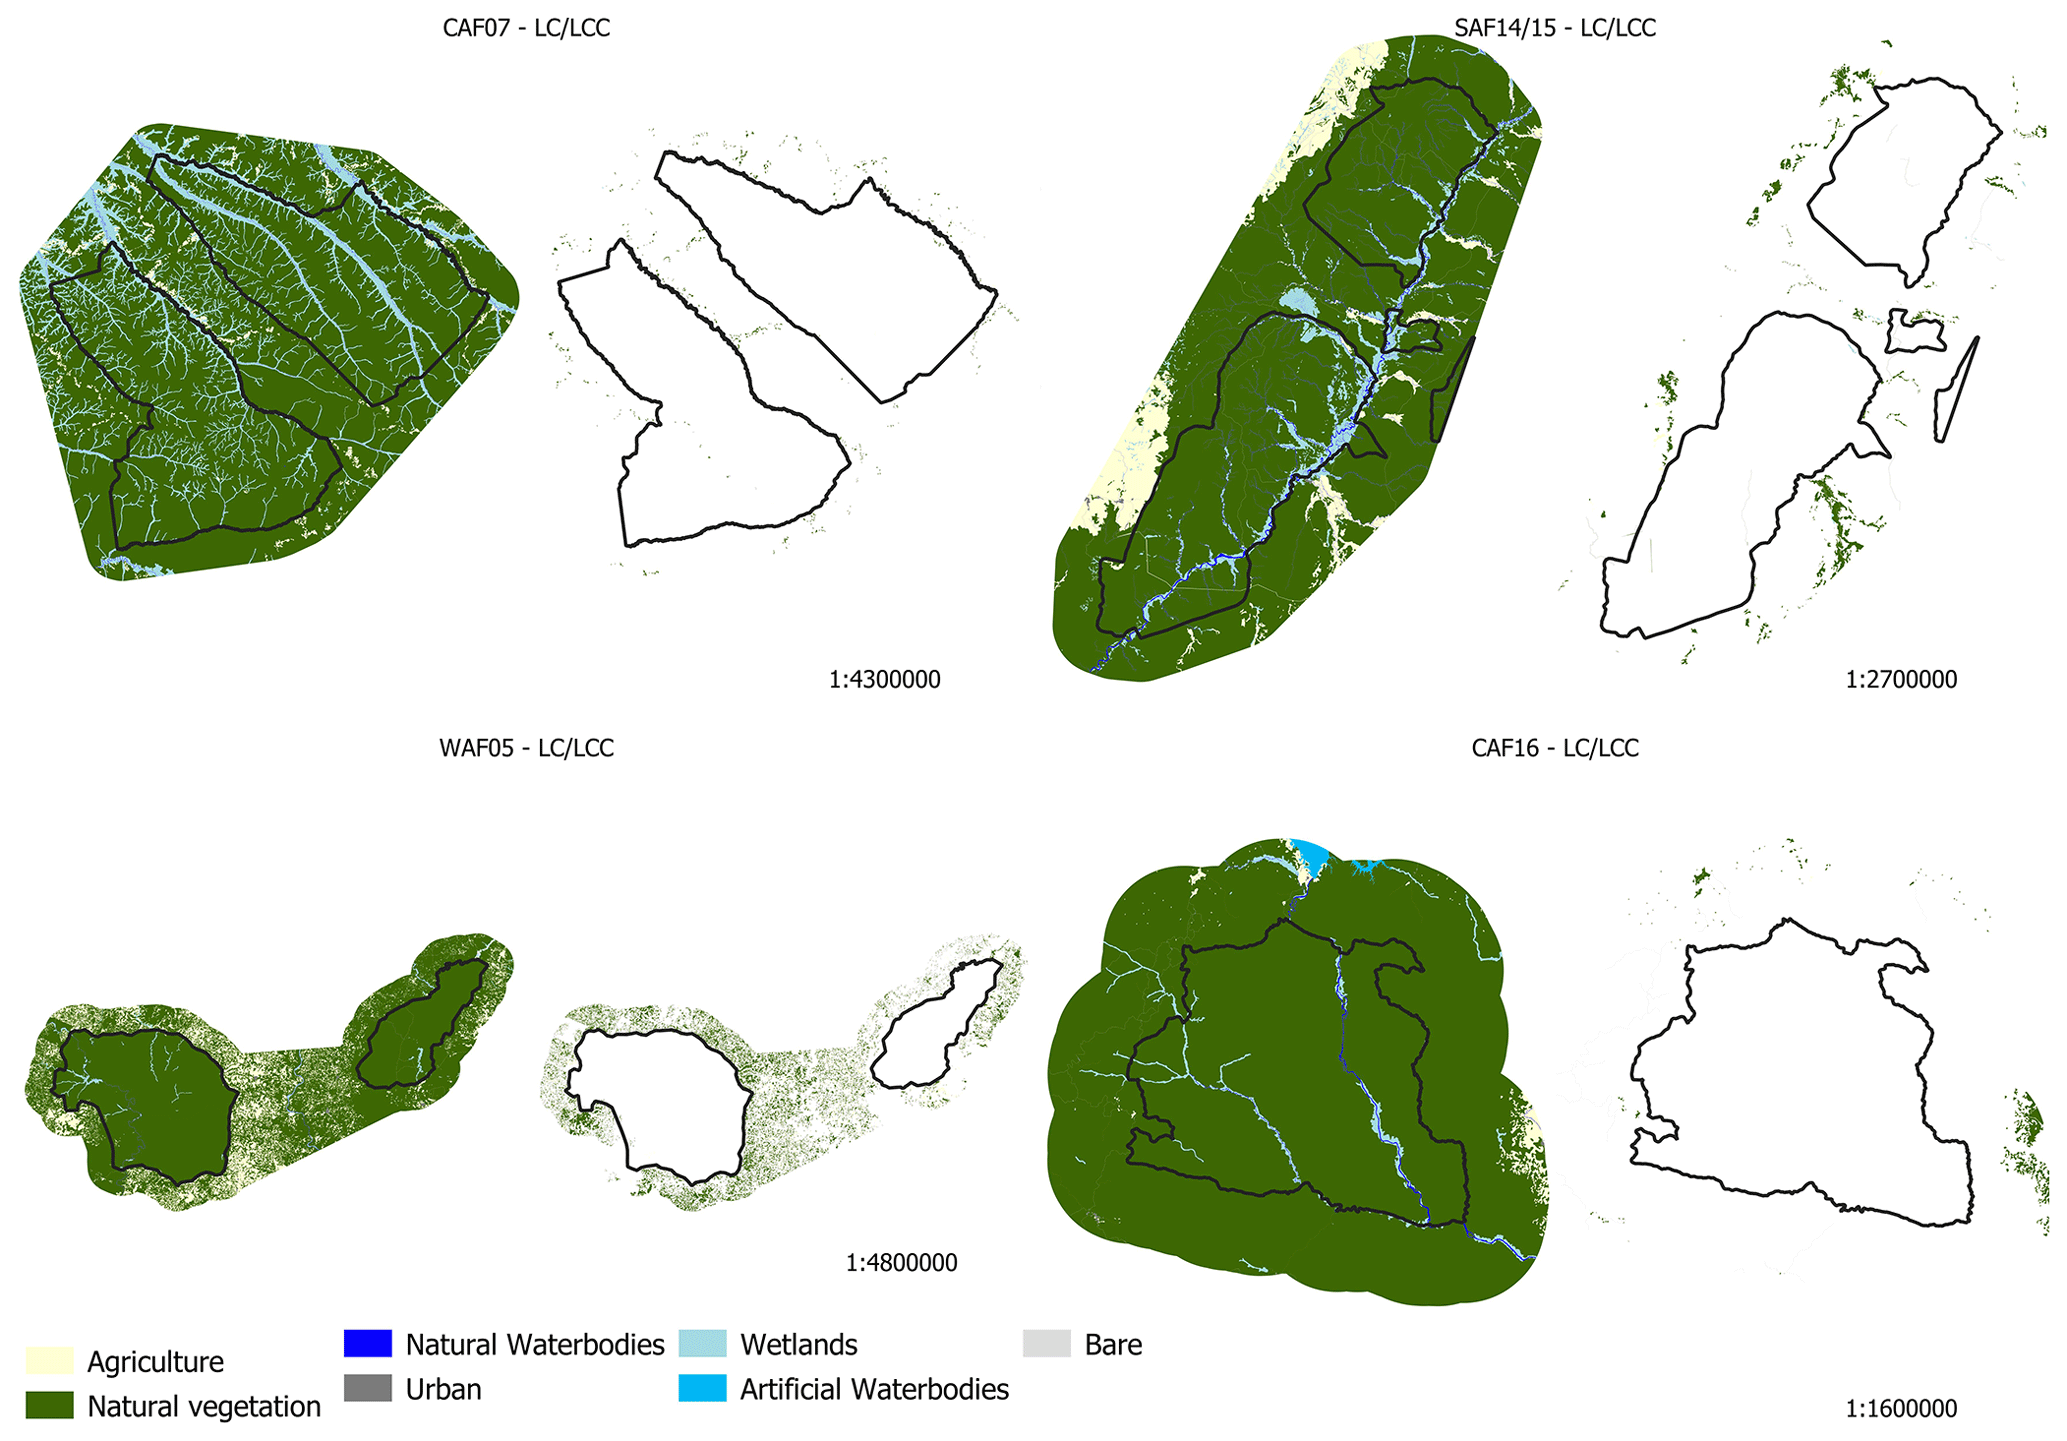
Figure 4Key landscapes for conservation – Dichotomous classification level. The boundaries (black polygons) represent protected areas (IUCN categories I–IV) within the KLCs. Both land cover and land cover change are presented for each KLC.
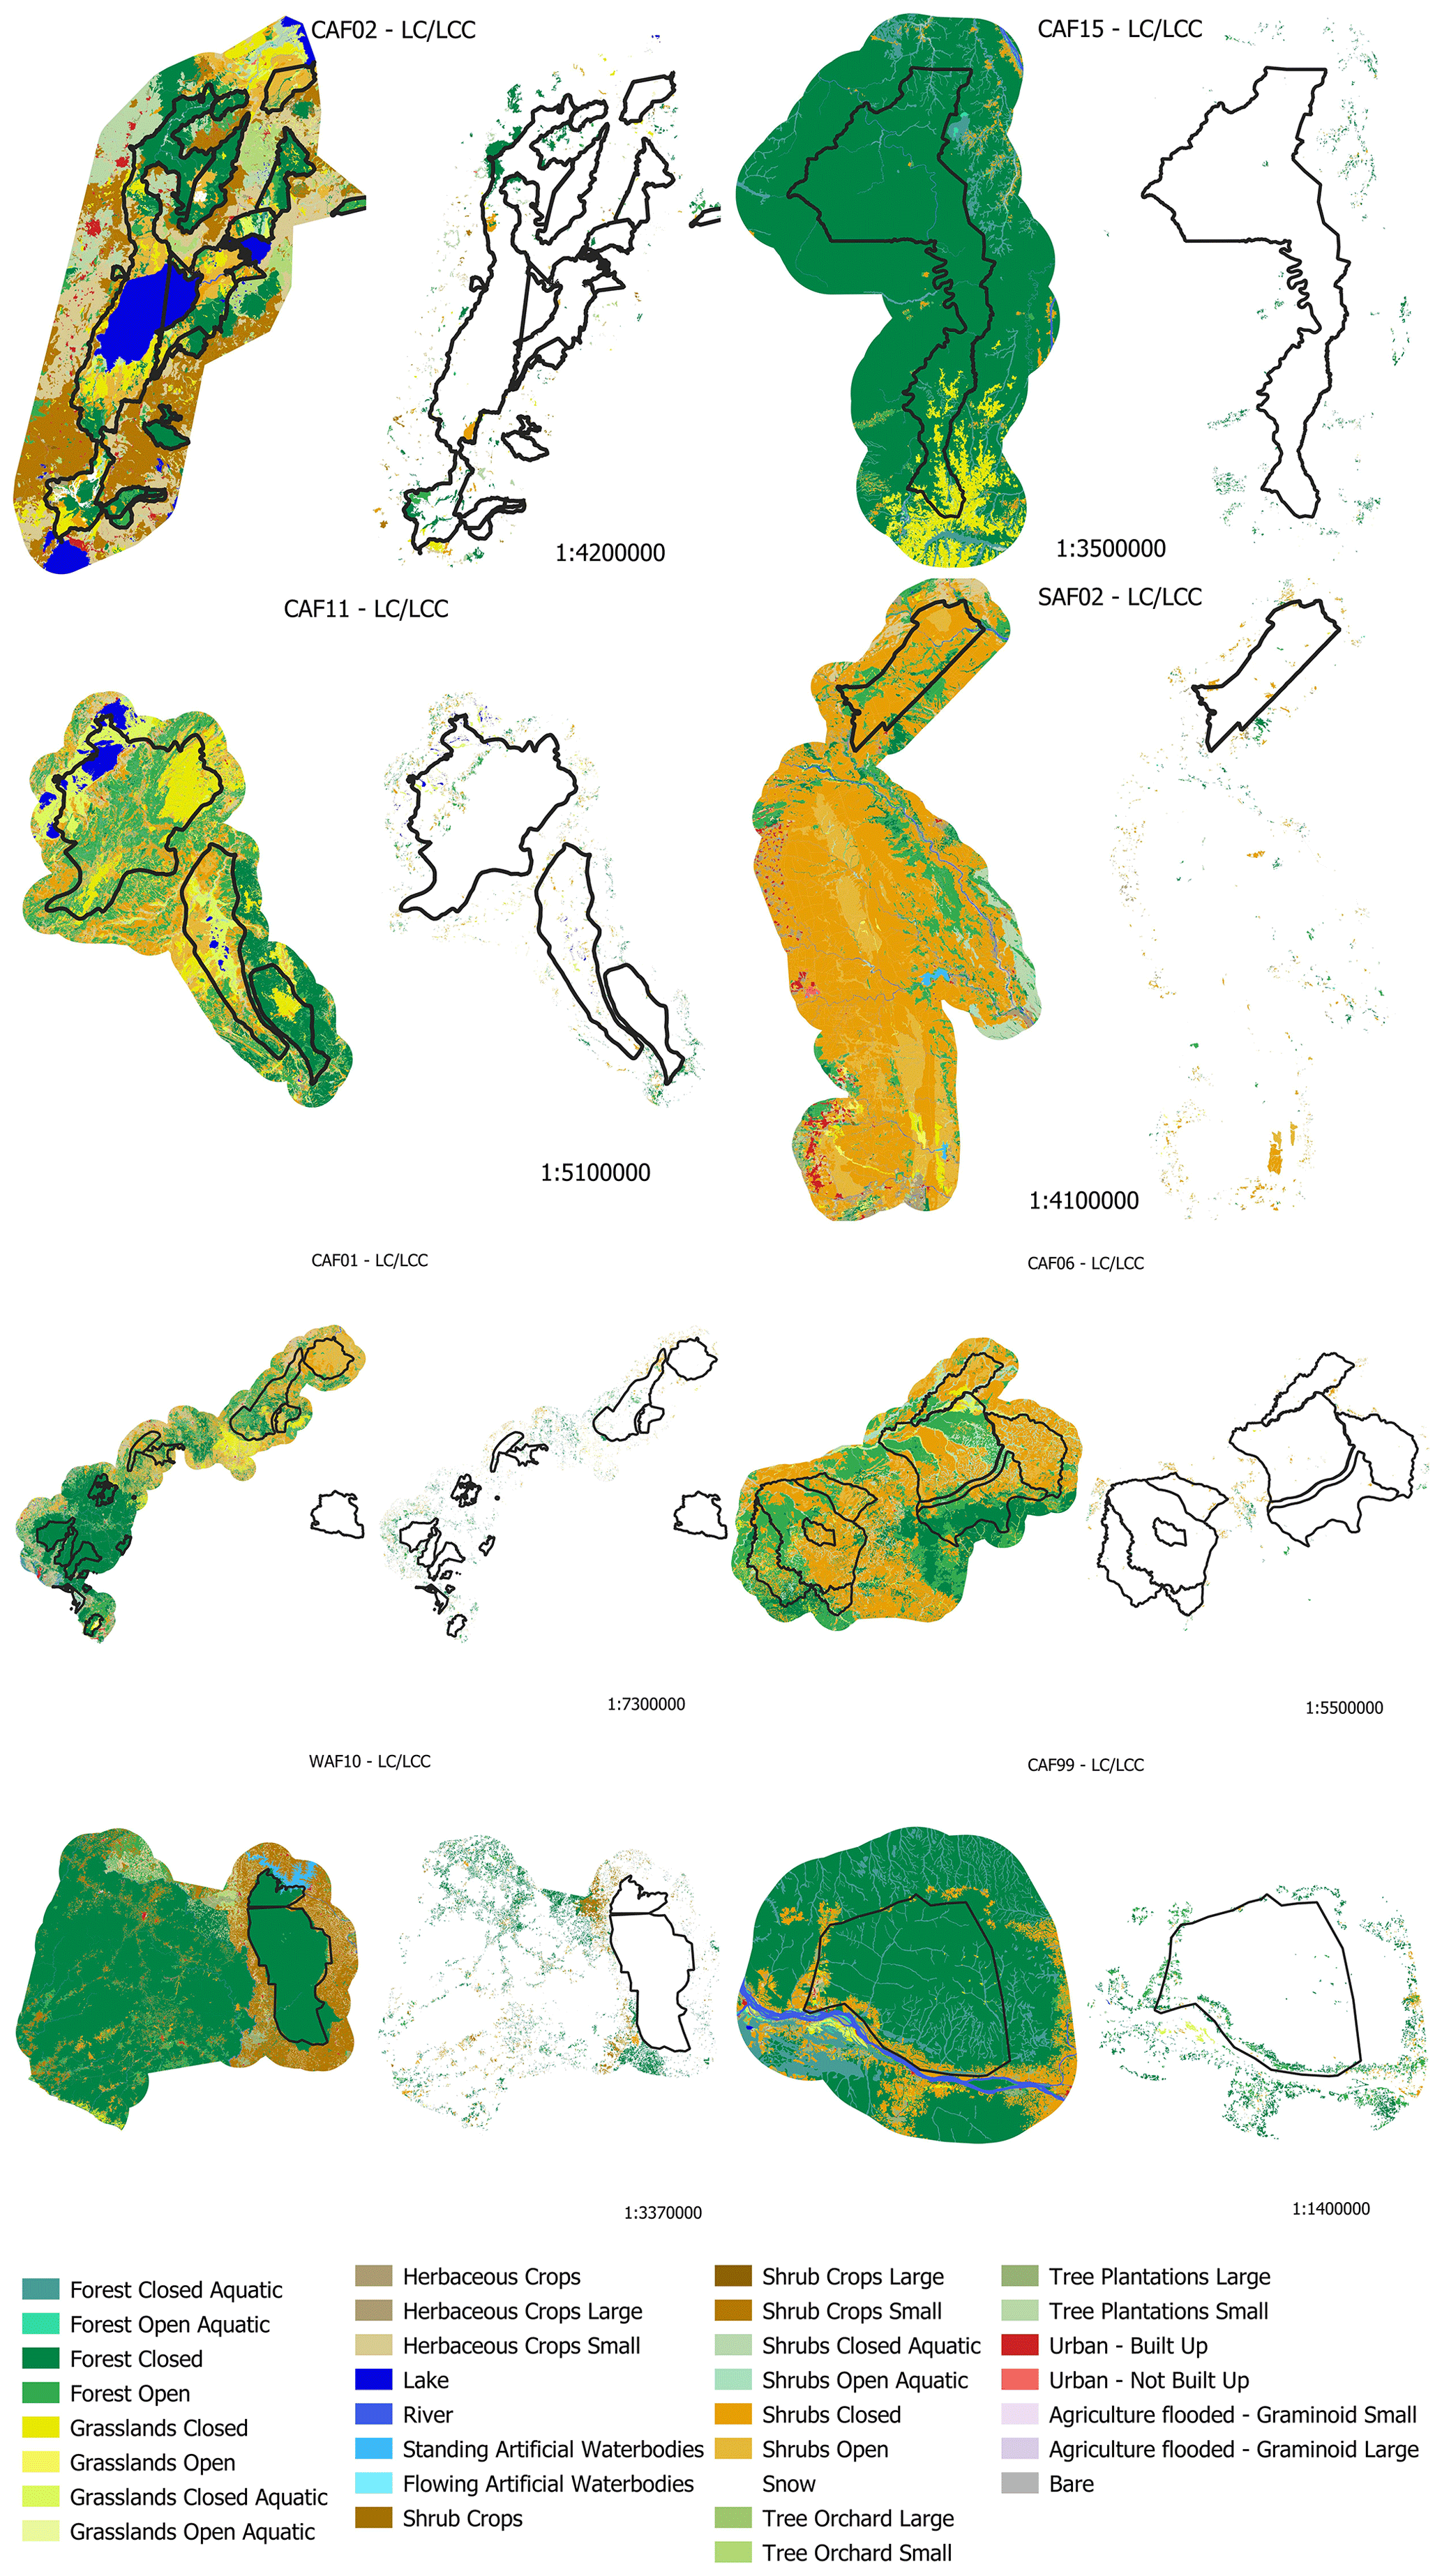
Figure 5Key landscapes for conservation – Modular classification level. The boundaries (black polygons) represent protected areas (IUCN categories I–IV) within the KLCs. Both land cover and land cover change are presented for each KLC.
The quantitative accuracy assessment (i.e., validation) results are shown in Table 4 (overall accuracies) and in the Appendix (thematic class accuracies per KLC, Appendix A). Generally, the program aimed at a minimum of 85 % overall accuracy for each product (KLC) and a minimum of 75 % thematic accuracy (producer's and user's) for each class within each KLC. The land cover change (LCC) accuracy should be >72 %. In exceptional cases, the thematic accuracies might be lower than the threshold due to the difficulty to discriminate a particular class in a certain KLC. Figure 4 shows the final LC and LCC products classified at the dichotomous LCCS level while Fig. 5 shows the final LC and LCC products classified at the modular LCCS level.
There is a direct relationship between population growth, agricultural expansion, energy demand, and pressure on land. With the current state of development, population increase, and economic growth, a large portion of the sub-Saharan population depends on the remaining natural resources to meet their food and energy needs (Brink et al., 2012). The demands of social and economic growth require additional land, typically at the expense of previously untouched areas. Areas under protection (i.e., national parks) that remain well-preserved (see Figs. 4 and 5) often have regions in close proximity under tremendous pressure. Such areas (many times transboundary ones) need very accurate monitoring and base maps, which are provided through this work, especially as areas shared between and/or among countries are frequently not mapped with a common legend, if mapped at all. The presented KLC datasets can be used for continuous land cover and land use monitoring, evaluation of management practices and effectiveness, endowment for scientific counsel, habitat modeling, information dissemination, and capacity building in their corresponding countries and to manage natural resources such as forests, soil, biodiversity, ecosystem services, and agriculture (Tolessa et al., 2017). Furthermore, regional climate change, biogeochemical, and hydrologic models are currently capable of using high-resolution LC data for predictions in general (Nissan et al., 2019) and spatially focused (i.e., Africa) (Sylla et al., 2016; Vondou and Haensler, 2017).
The validation datasets are independently collected and verified through a robust procedure. Validation datasets can then be used for additional land cover mapping, creating spectral libraries, and the validation of other local, regional, and global datasets. It is important that various land cover products can be used or compared against one another regardless of their geographic origins. Here, 12 land cover maps for different areas in sub-Saharan Africa where quality land cover products are missing (Marshall et al., 2017) were introduced. These products come with land cover change information as well, generally dating back to the year 2000 (± 3 years). All data were produced using the unified Land Cover Classification System. The LCCS's modular level can be applied to local scales through its very detailed classes (here 32).
5.1 Drivers of change
Geist and Lambin (2002) describe the driving human forces of land cover changes as an interlinking of three key variables: expansion of agriculture, extraction of wood, and development of infrastructure. The main land cover dynamic in sub-Saharan Africa can be explained by the first two variables, where agriculture expansion is further subdivided into shifting cultivation, permanent cultivation, and cattle ranching, and wood extraction is subdivided into commercial wood extraction (clear-cutting, selective harvesting), fuelwood extraction, pole wood extraction, and charcoal production. Although the driving force behind the clearing of natural vegetation has traditionally been predominantly attributed to the expansion of new agricultural land areas (including investments in large-scale commercial agriculture) (Brink and Eva, 2009), firewood extraction and charcoal production are also key factors in forest, woodland, and shrubland degradation throughout the region. This land cover dynamic is not just a by-product of greater forces such as logging for timber and agricultural expansion but stems from a specific need to satisfy energy demand (European Commission, 2018); in fact, in sub-Saharan Africa, the main use of extracted wood is for energy production (Kebede et al., 2010). Although the region possesses a huge diversity of energy sources such as oil, gas, coal, uranium, and hydropower, the local infrastructure and use of these commercial energy sources are very limited. Traditional sources of energy in the form of firewood and charcoal account for over 75 % of the total energy use in the region (Kebede et al., 2010). Efforts to meet the population and economic demands in sub-Saharan Africa while preserving biodiversity and ecosystem functioning require informed decision-making. The global component of the Copernicus Land Service (Copernicus Global Land), in particular the High-Resolution Hot Spot Monitoring component, presents a unique opportunity for such information gathering.
5.2 Sources of errors
As the applied LCCS allows very detailed hierarchical classification, some classes can be difficult to distinguish from each other. This is especially true in Africa's vast and very heterogeneous landscapes where agricultural land use is mainly smallholder based (i.e., very small plots), while shifting cultivation is mostly due to the lack of fertilizers and weak soil, leading to land abandonment. Landscapes are generally not composed of clearly fragmented and well-identifiable cover formation. In this region, landscapes usually form a continuum of various cover (vegetation) formations that might include different layers of tree, shrub, and herbaceous vegetation. These variations combined with differences in vegetation density (open vs. closed) and heights makes class assignments challenging. Moreover, some specific agriculture classes distinguish even the cultivation type, e.g., differentiating between fruit tree plantations and tree plantations for timber. Thus, the discrimination of such classes is very difficult and might introduce classification errors. Apart from the land cover classification, errors could also be introduced due to climate-induced variability, such as leaf phenology where deciduous vegetation might appear bare during a dry period (season).
At a more general level, difficulties in identifying between aquatic or regularly flooded surfaces and terrestrial areas have been observed in certain KLCs, especially when flooded periods are short.
5.3 Current and future use of datasets
The C-HSM datasets have been widely used by policy makers (African and European partners) to help identify areas prone to change due to human activities. For example, COFED (Support Unit for the (DRC) National Authorizing Officer of the European Development Fund), the EEAS (European External Action Service) of the DRC, manages an envelope of EUR 120 million, allocated for five protected areas in the DRC (Virunga, Garamba, Salonga, Upemba, and the Yangambi biosphere), where they use the C-HSM products for planning and for investment strategies (i.e., hydropower). Another example comes from West Africa, where nongovernmental organizations (NGOs, e.g., Wild Chimpanzee Foundation), public-benefit enterprises (i.e., German Society for International Cooperation – GIZ), and national authorities (i.e., l'Office Ivoirien des Parcs et Réserves – OIPR) use the data to identify areas under pressure for agriculture (cocoa, oil palm, rubber, coconut) and human–wildlife conflicts in Cote d'Ivoire, Ghana, and Liberia.
The data are provided in a shapefile (*.shp) format, polygon geometry for the land cover and change datasets and point geometry for the validation datasets. The presented data are in the World Geodetic System 1984 geographic coordinate system (GCS) (EPSG:4326) and its datum (EPSG:6326). The validation data, besides using the same GCS, also have the Africa Albers equal-area conic (EPSG:102022) projection coordinate system.
Each of the 12 KLCs is described by two vector layers: a land cover (LC) layer and a land cover change (LCC) layer. The LC layer is a wall-to-wall map, covering the entire area of interest (AOI). The LC temporal reference for the project is the year 2016, although for each area the actual “mapping year” is noted in the file name (i.e., CAF01_2016) and generally refers to the year in which the largest number of satellite images were used for the classification. The LCC layer provides a partial coverage of the AOI, as it contains only the areas (polygons) where thematic change occurred compared to the LC layer. The LCC temporal reference is the year 2000 (± 3 years), noted in the file name (i.e., CAF01_2000).
Each LC and LCC shapefile comes with its corresponding attribute table, where two or three attributes are present: [mapcode_A] – dichotomous class, [mapcode_B] – modular class, [name_A] – corresponding dichotomous class names (KLCs classified only at the dichotomous level), and [name_B] – corresponding modular class name.
Validation point dataset
Each of the 12 areas has been quantitatively validated using a spatially specific point dataset. These datasets were generated through the method described in point 3.2, and each point was used to verify the correctness of the LC–LCC maps. The corresponding data in the attribute table are LC – [plaus201X] and LCC – [plaus200X]. Both [plaus201X] and [plaus200X] attributes refer to the most detailed classification level attributes (mapcode_A or mapcode_B) present in the LC and LCC datasets (shapefiles). The plaus201X and plaus200X attributes refer to the year the validation sets represent, as these can be different among KLCs; the exact year is always noted in the columns' names (e.g., plaus2000, plaus2016).
The naming of all attributes follows the same structure in all data. Please see the details in the Appendix and Supplement.
The complete package (all datasets) is available for download at https://doi.org/10.1594/PANGAEA.914261 (Szantoi et al., 2020a), or individually as source datasets (each KLC, or teasers of less than 20 Mb size).
Besides archiving the datasets at PANGAEA (https://www.pangea.eu, last access: 18 November 2020) with corresponding digital object identifiers, the Copernicus High-Resolution Hot Spot Monitoring (C-HSM) website (https://land.copernicus.eu/global/hsm, last access: 18 November 2020) provides open access to all the land cover and land cover change and validation data presented in this article as well as technical reports and on-the-fly statistics.
The C-HSM service component is part of Copernicus Global Land, which produces near-real-time biophysical variables at medium scale, globally. In contrast, the C-HSM activity is an on-demand component that addresses specific user requests in the field of sustainable management of natural resources. The products presented here provide the first set of standardized land cover and land cover change datasets for 12 KLCs with their corresponding validation datasets in sub-Saharan Africa. The geographic distribution covers the tropical and subtropical regions of west, central, and southeastern Africa. The next release will also include countries in the Caribbean and Pacific areas of the ACP region (Organisation of African, Caribbean and Pacific States, http://www.acp.int, last access: 18 November 2020); some areas beyond these regions may be mapped depending on user demands. The most recent land cover change will be reassessed for selected already-mapped KLCs in order to generate longer-term time series land cover dynamics information. While this is not done systematically, but on specific customer requests, the C-HSM service encourages stakeholder cooperation and provides capacity building workshops around the globe. In-person training events provide an opportunity for new and existing users to learn how to use and interpret data, operate the web information system, and easily assess recent land cover change data using Sentinel-2 image mosaics. Here, we provide very-high-quality products, which can be used directly as base maps and for policy decisions, as well as for comparison and/or evaluation of other land cover products or the implementation of validation datasets for training and validation purposes.
Finally, the service has a high degree of confidence that the data presented here (and the next phase) are of the highest quality, regularly reaching above 90 % overall accuracy. This is guaranteed by a rigorous and independent production and validation mechanism and feedback loop, which does not stop until the required overall and per-class accuracy levels are reached.
Following the general European Commission's Copernicus Programme open-access policy, the data are distributed free to any user through a dedicated website (https://land.copernicus.eu/global/hsm, last access: 18 November 2020). This interactive online information system allows access to browse, analyze, and download the data, including the accuracy assessment information.
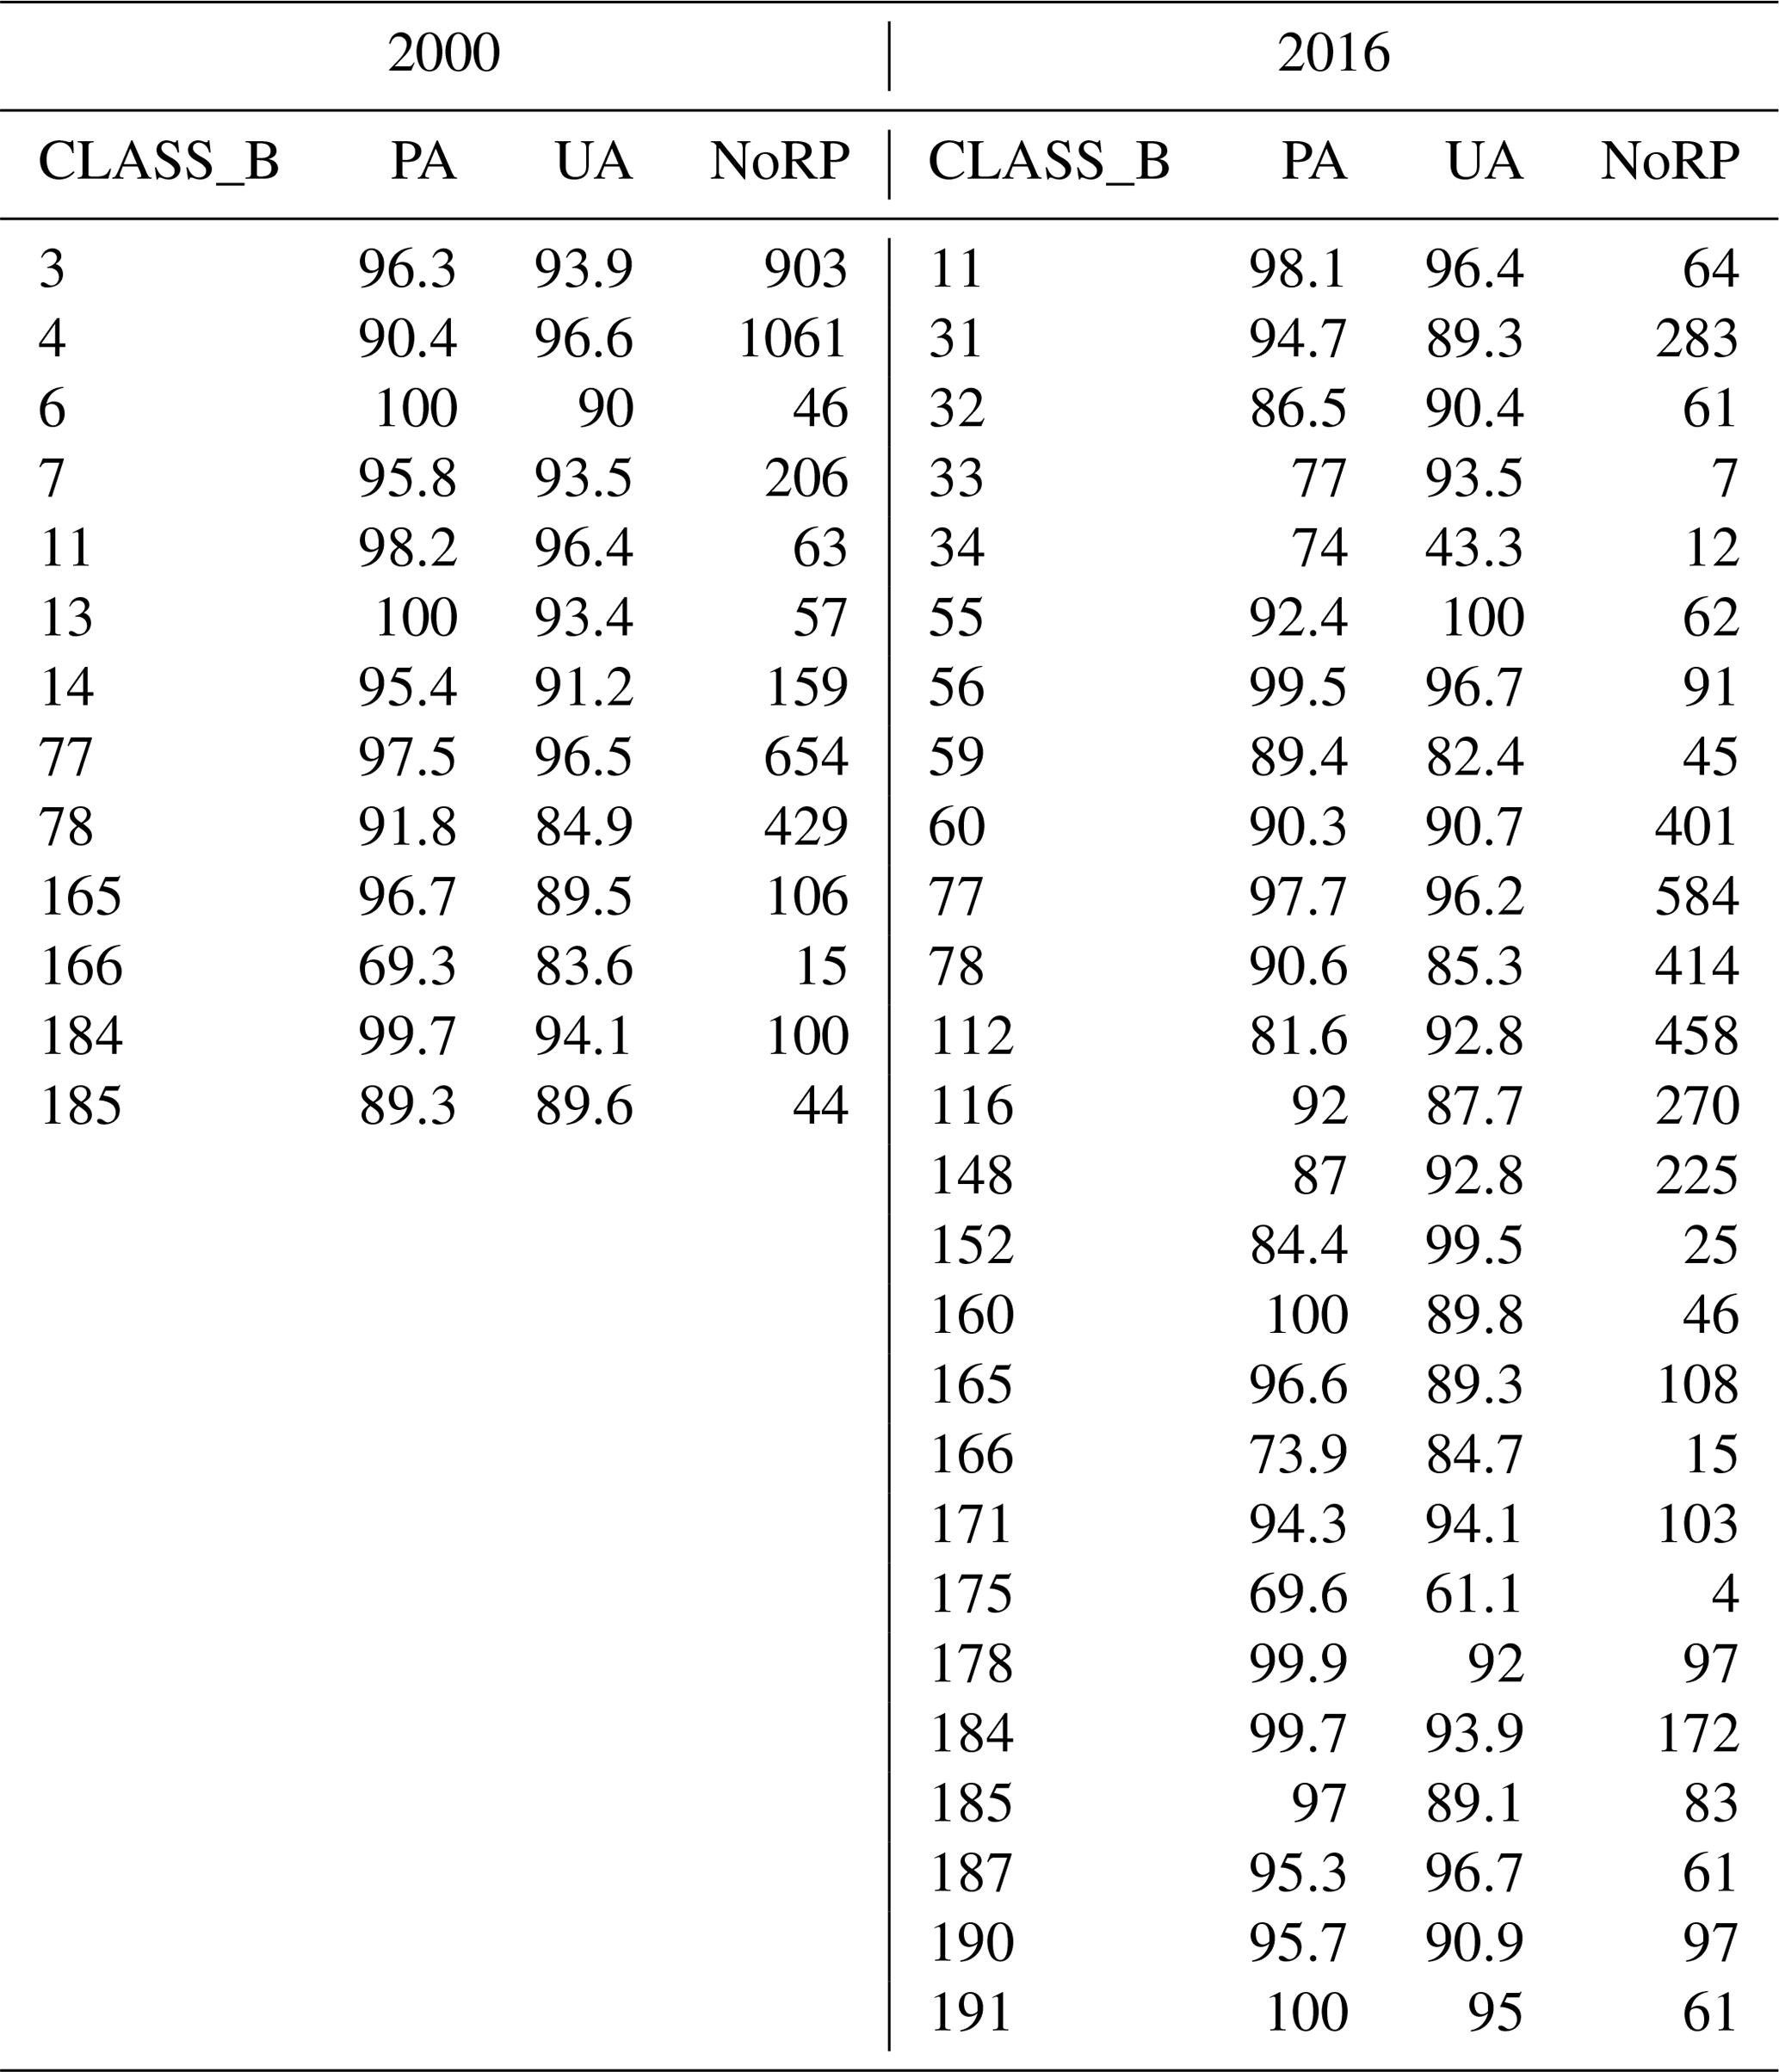
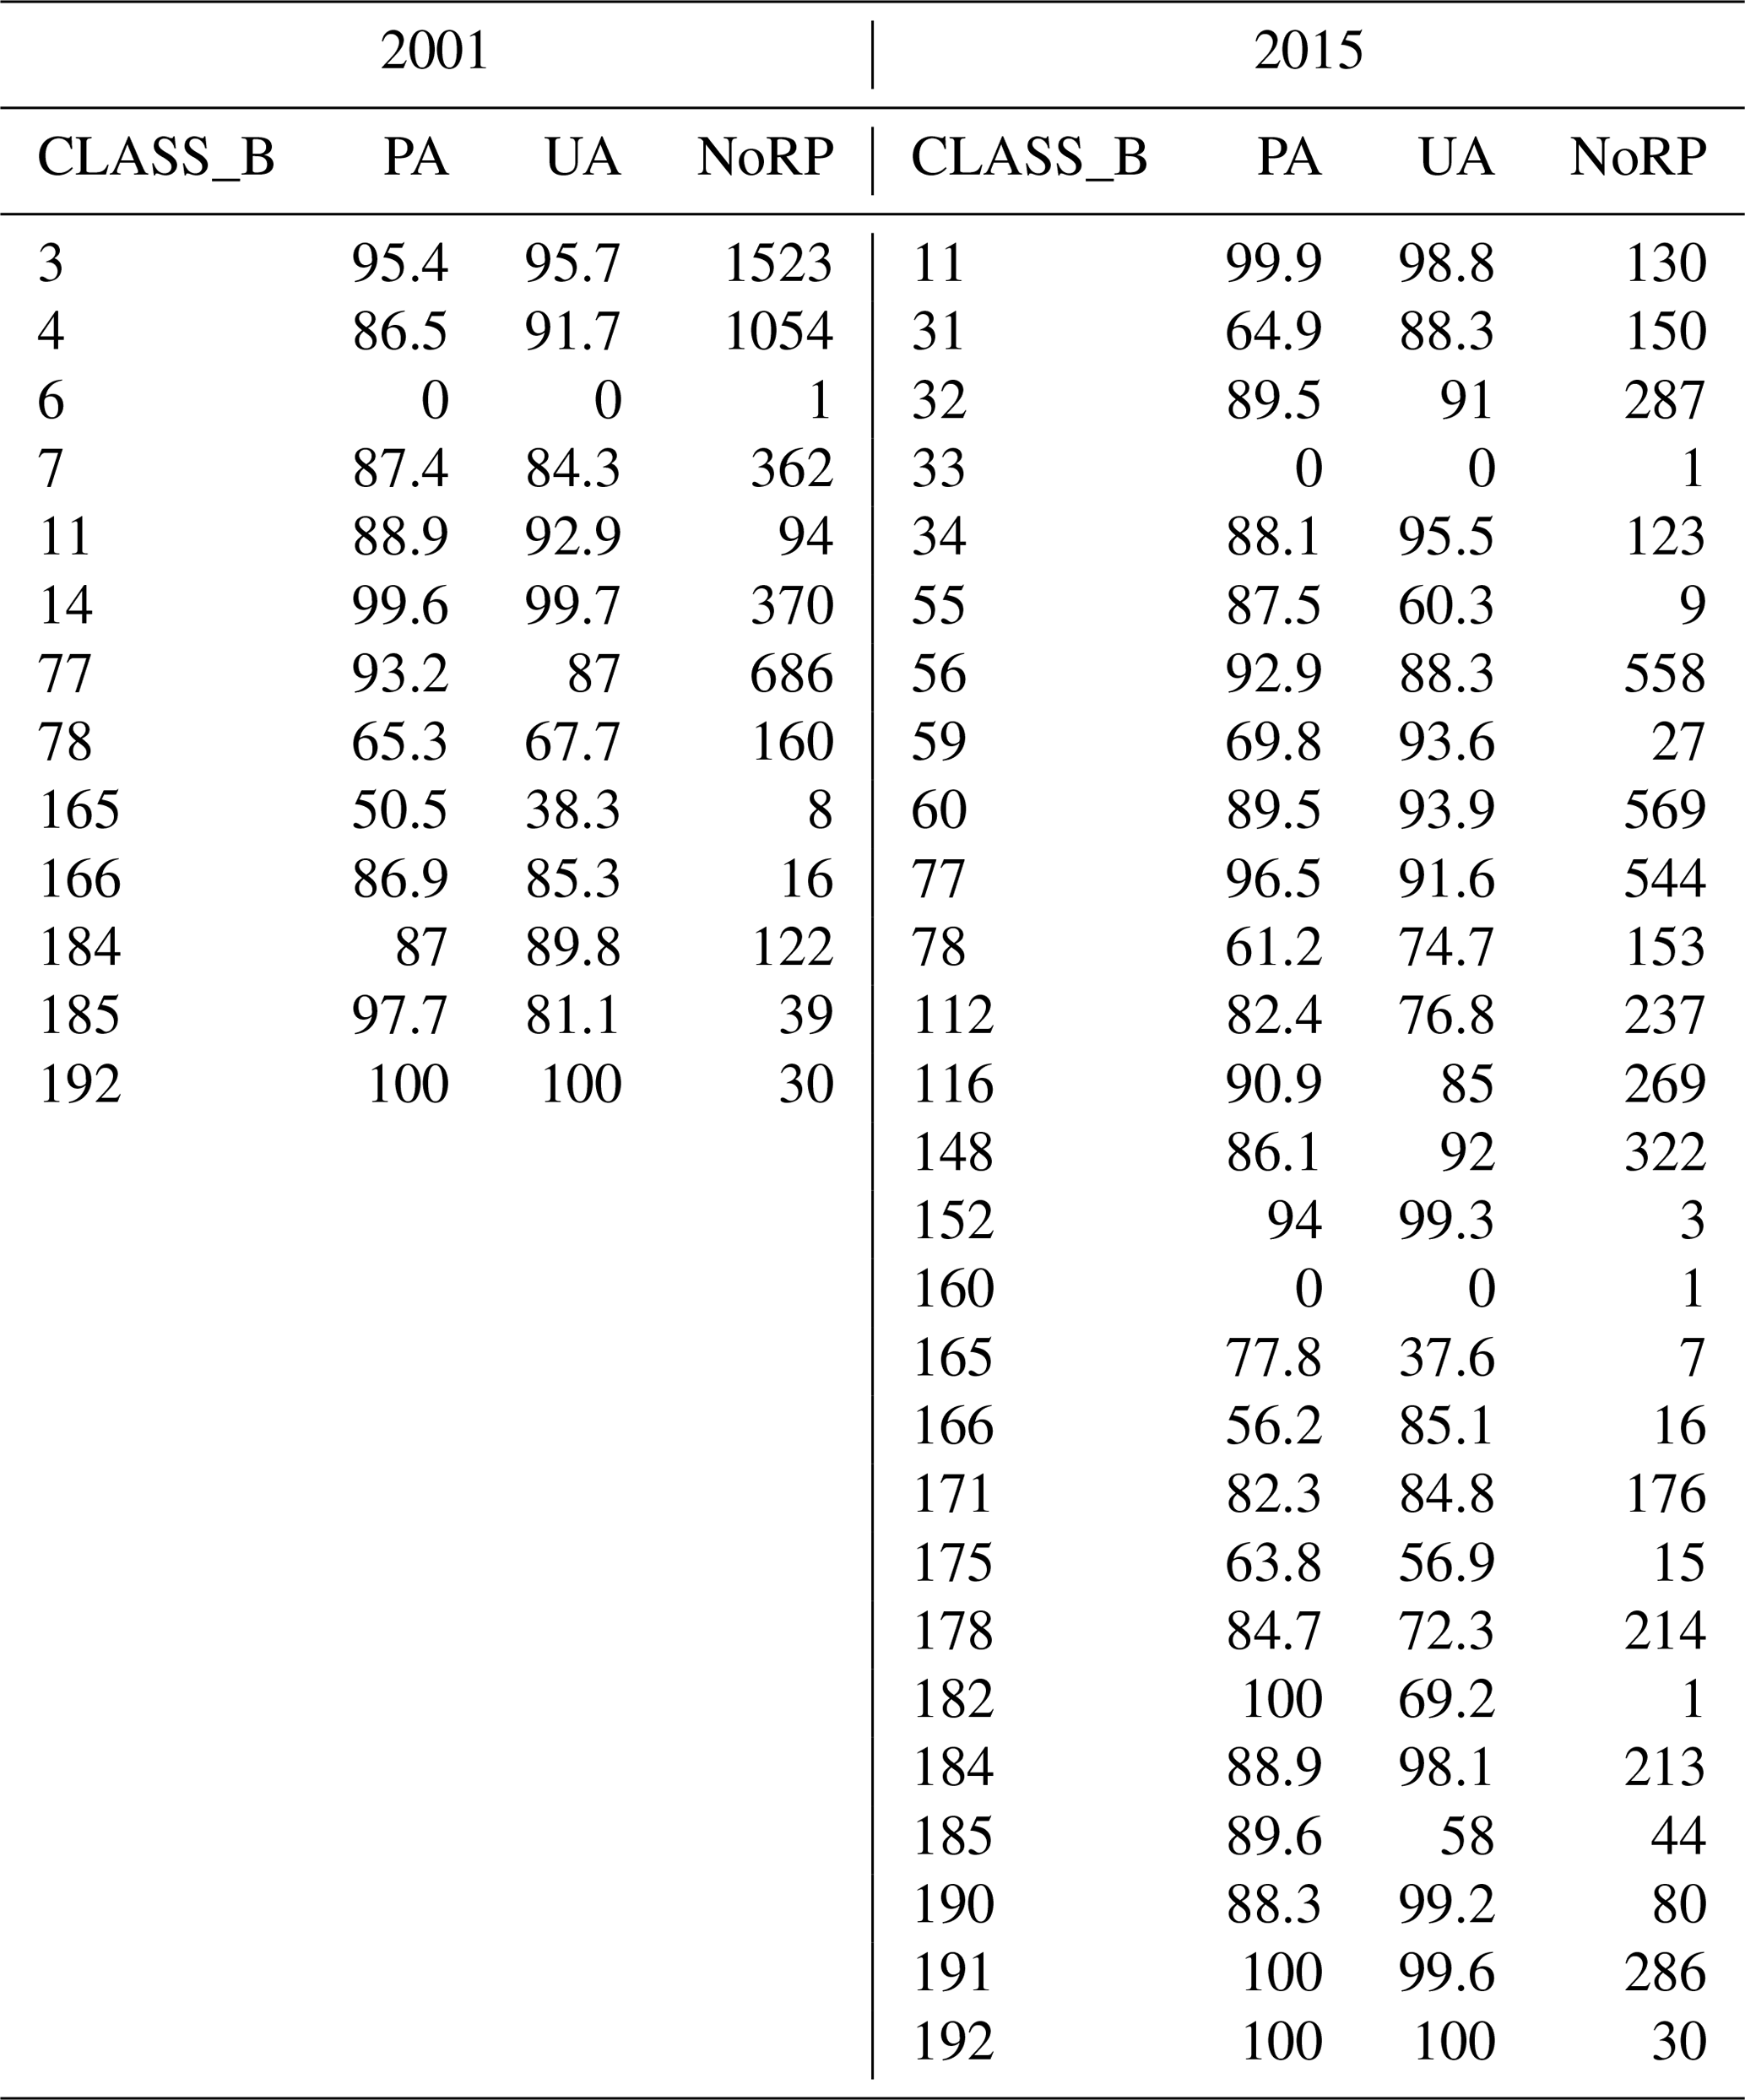
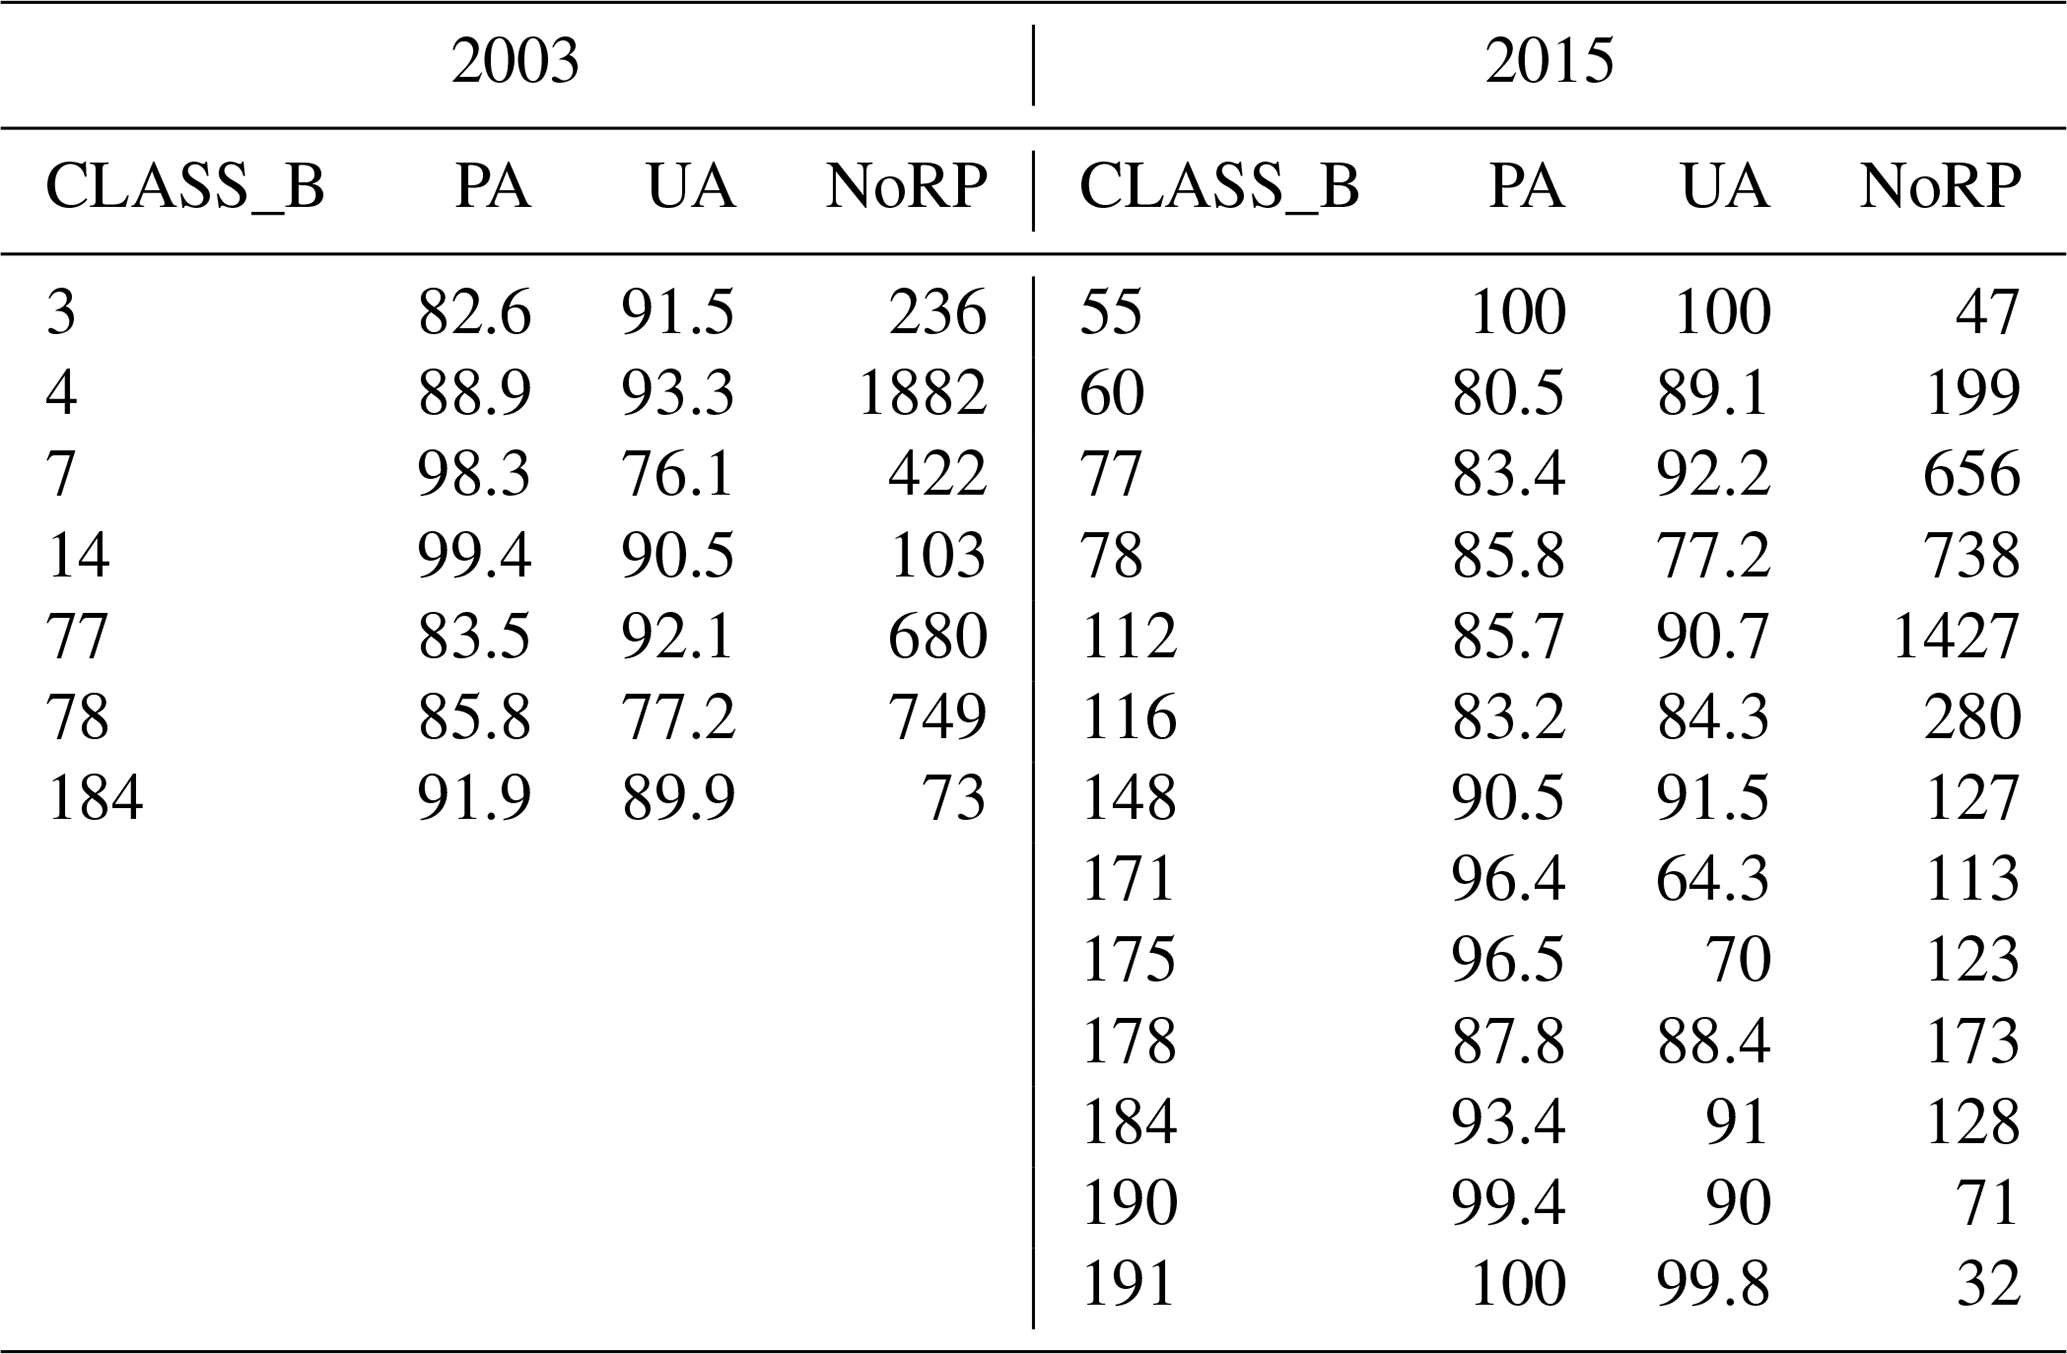
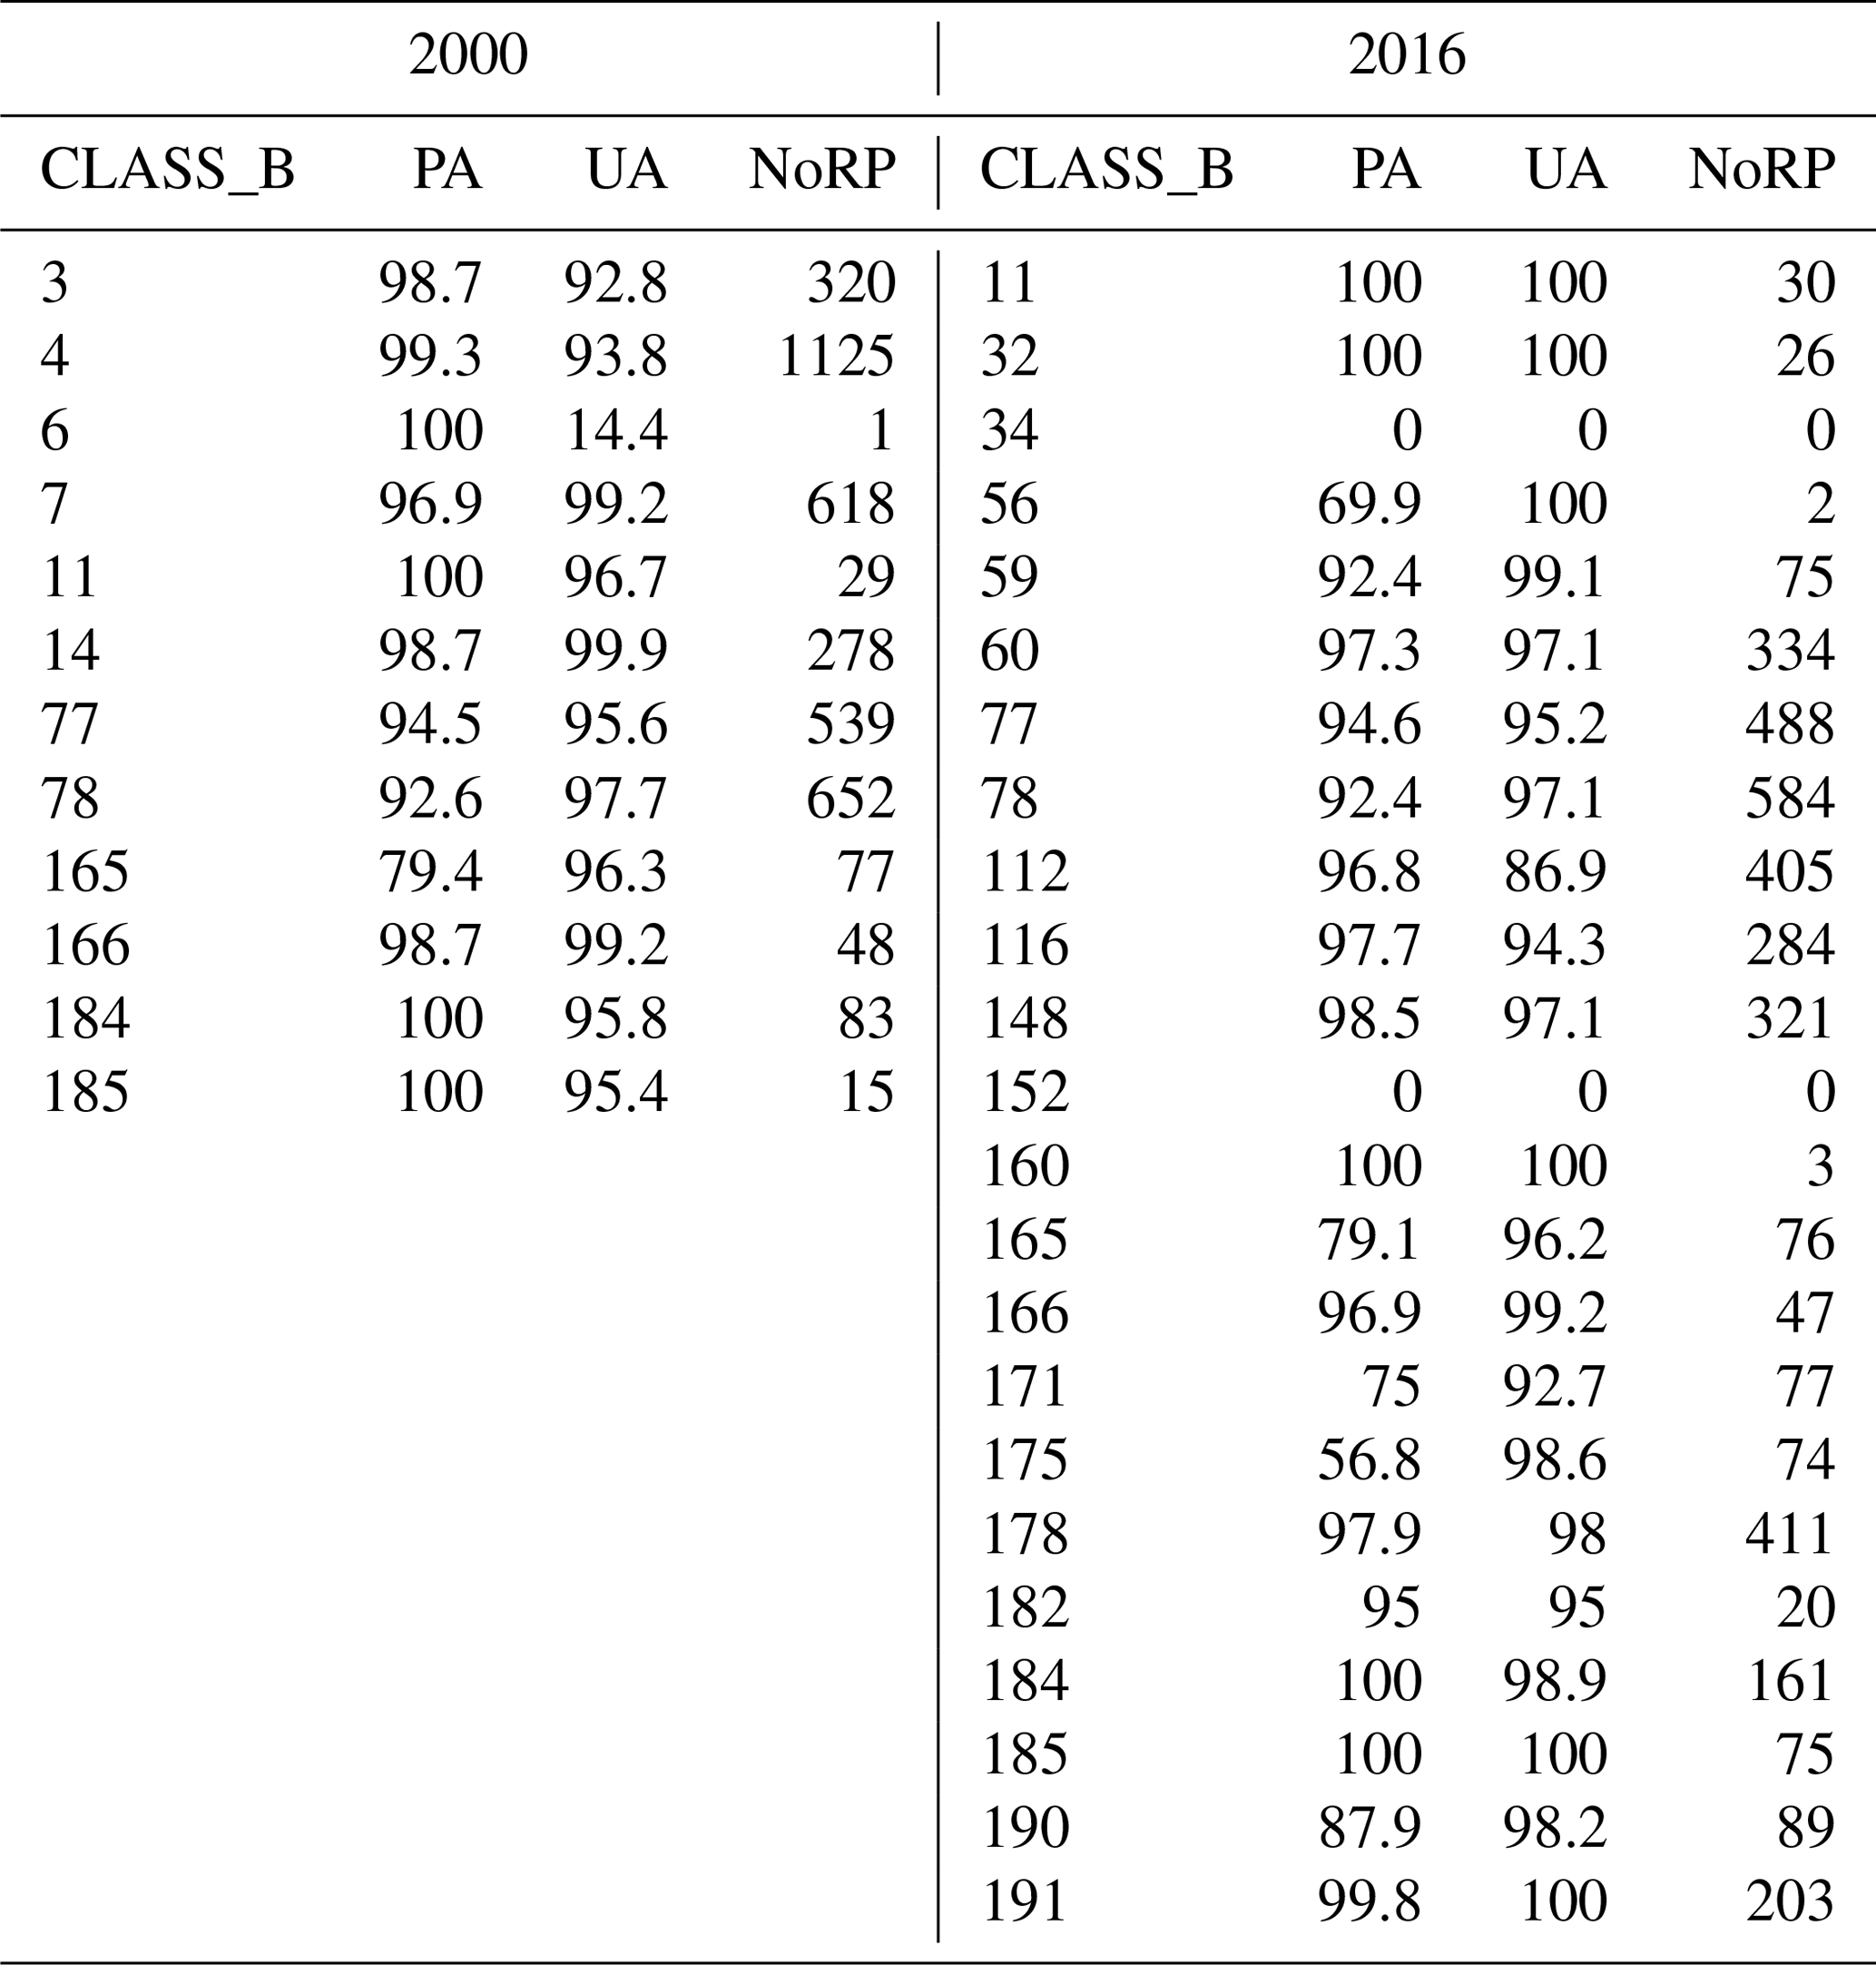
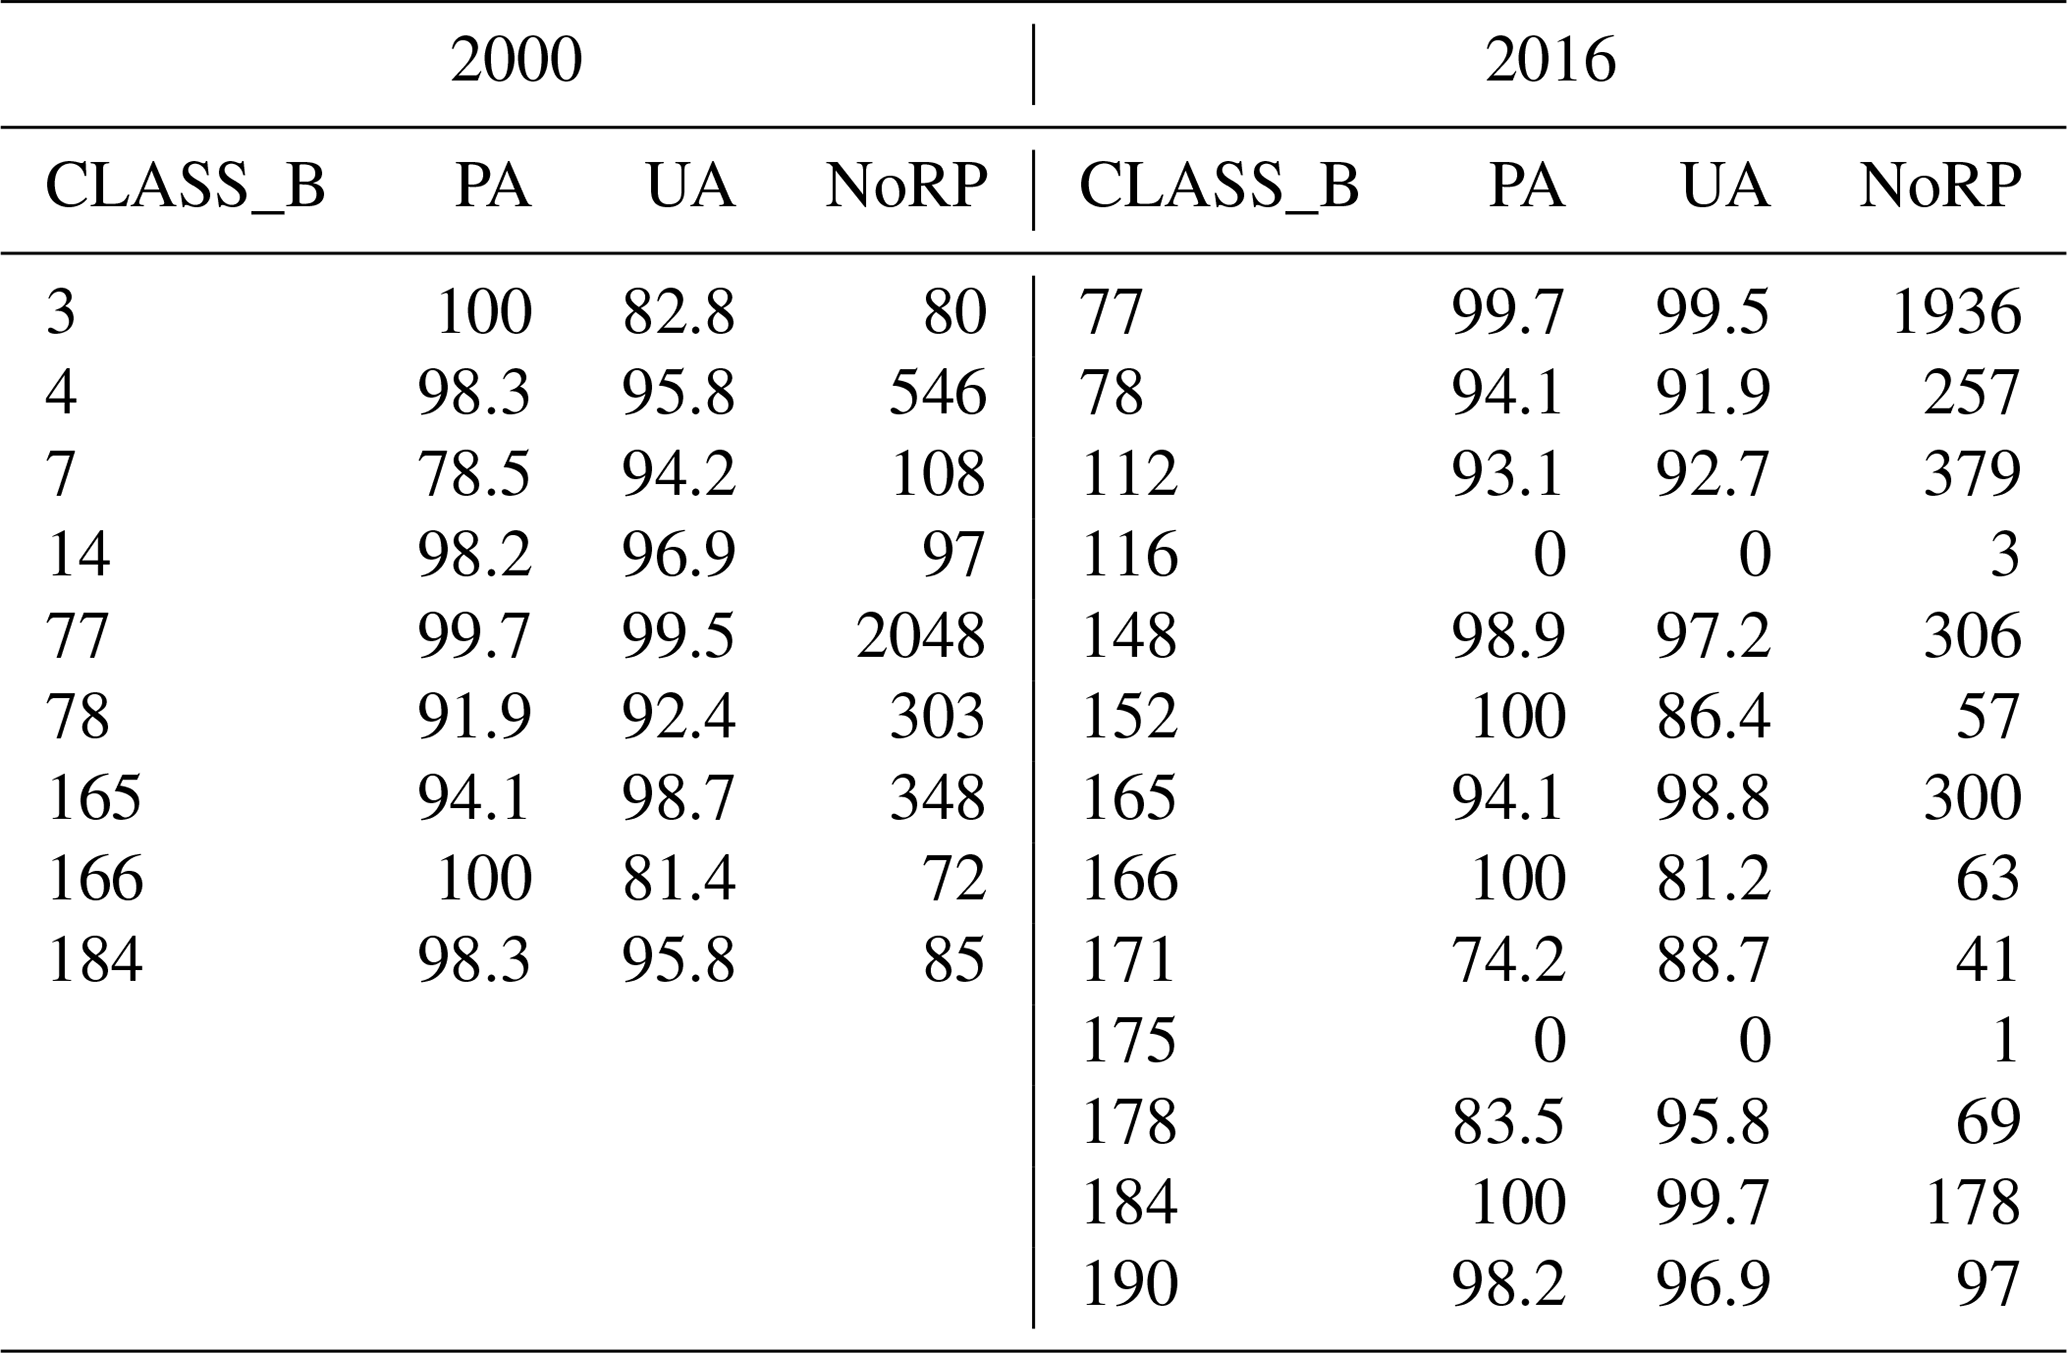
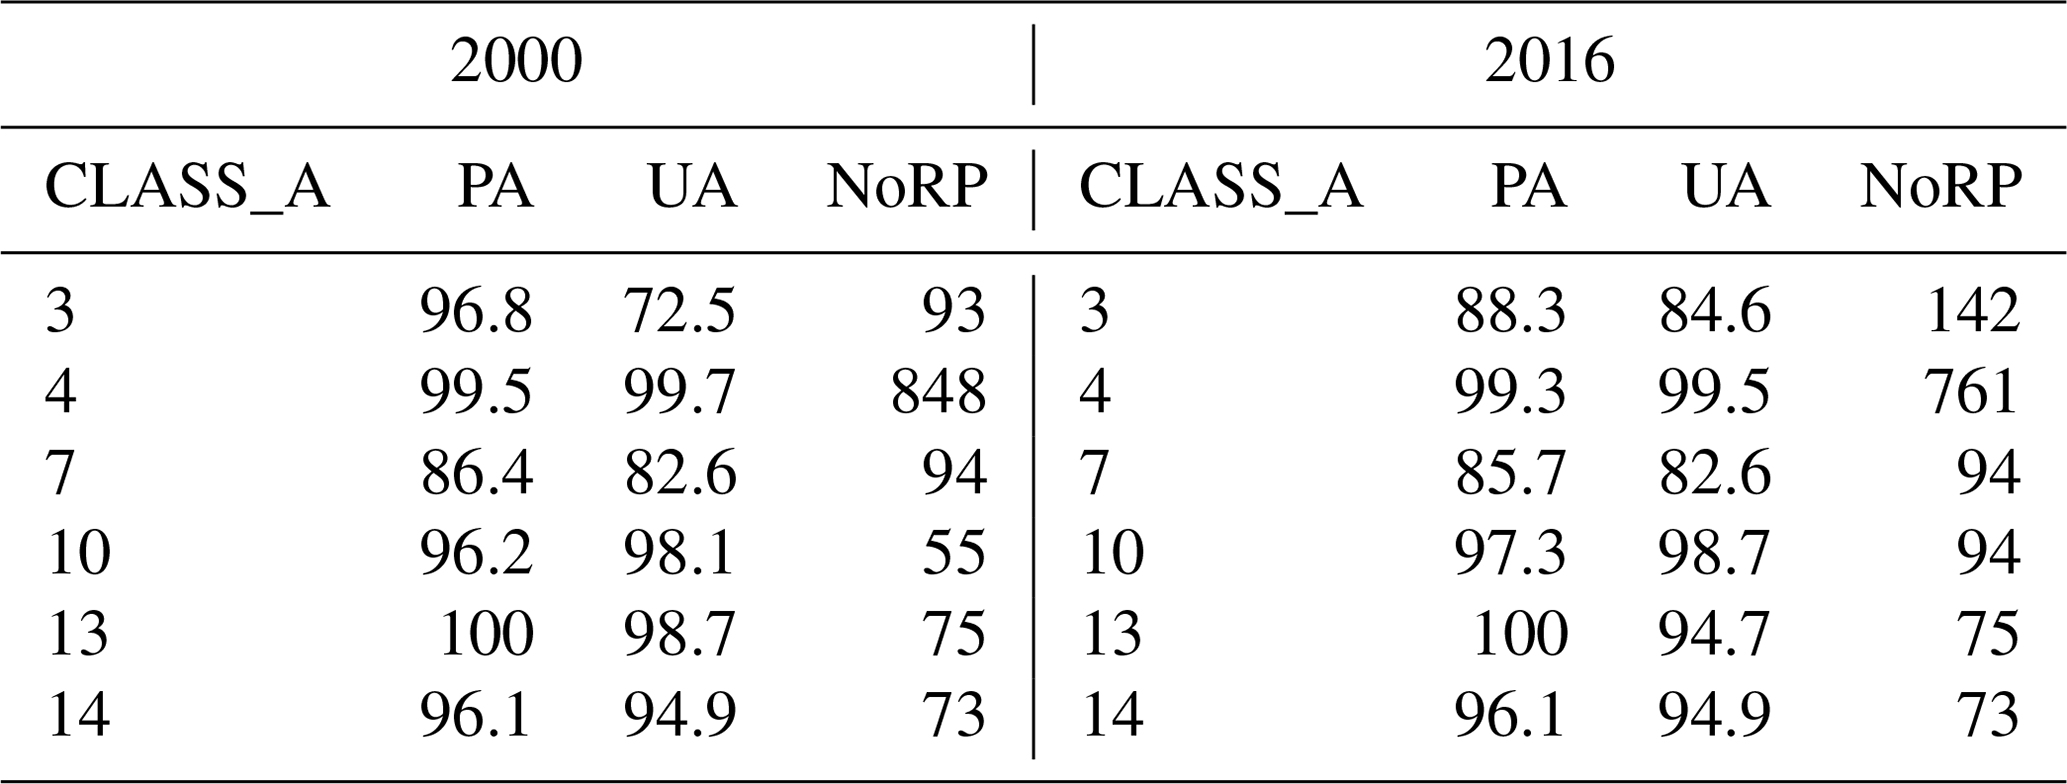
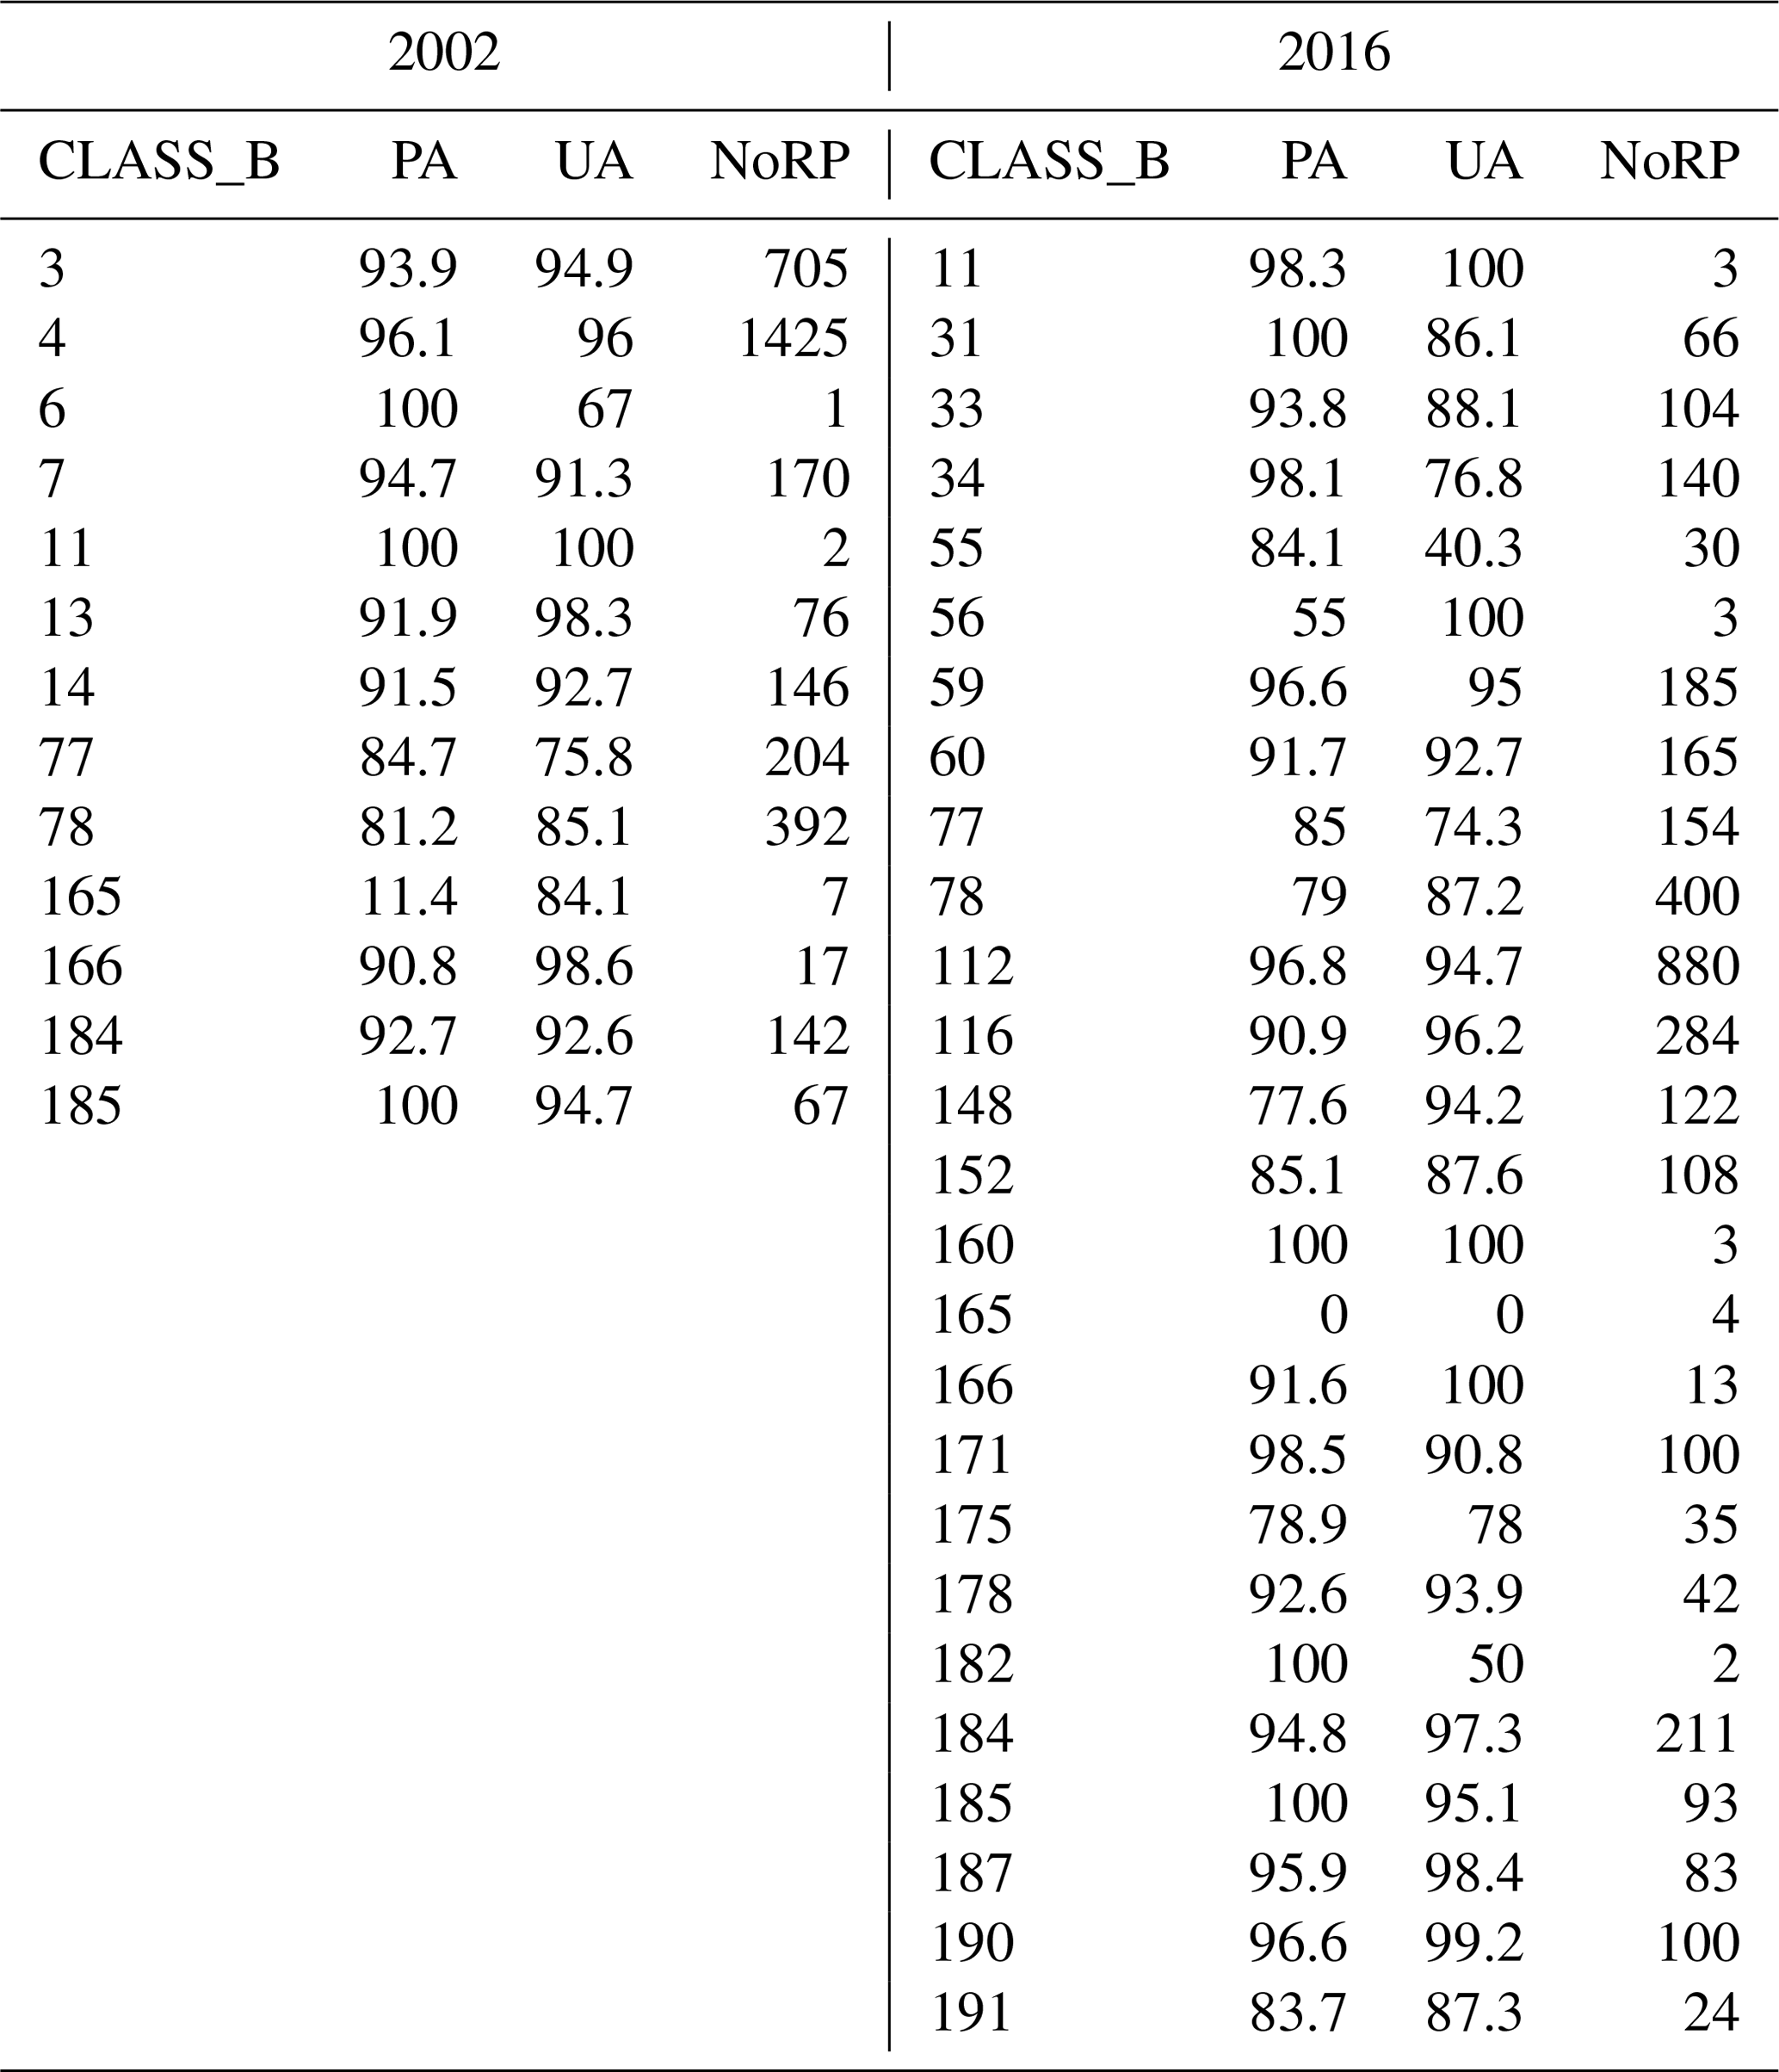
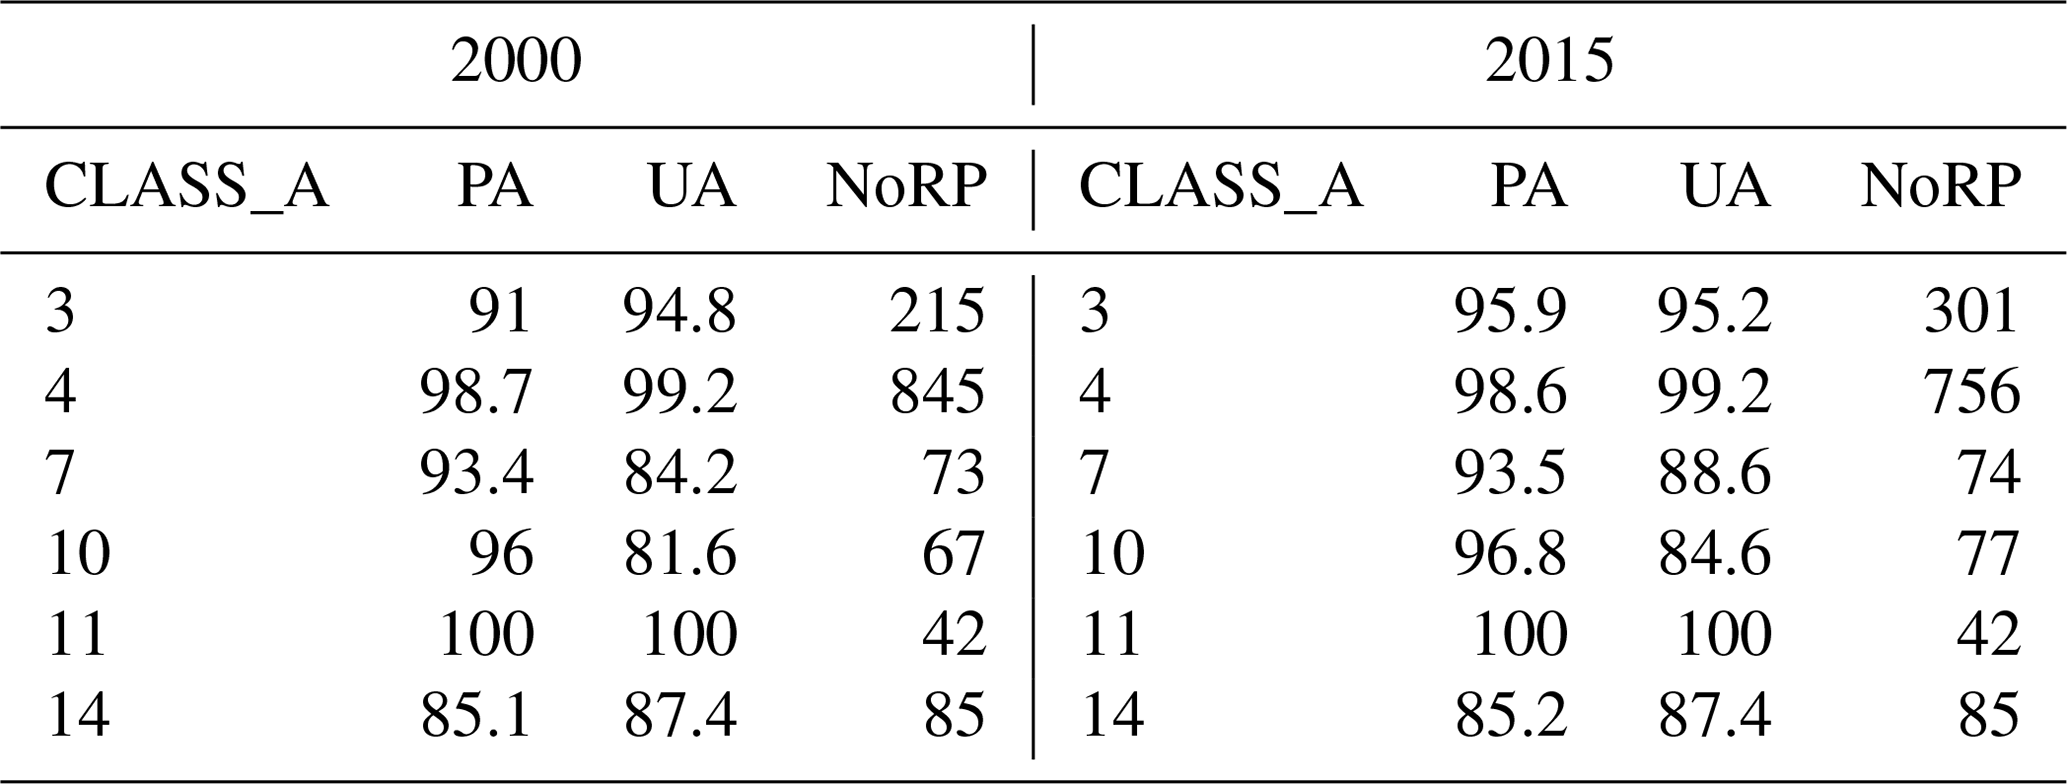
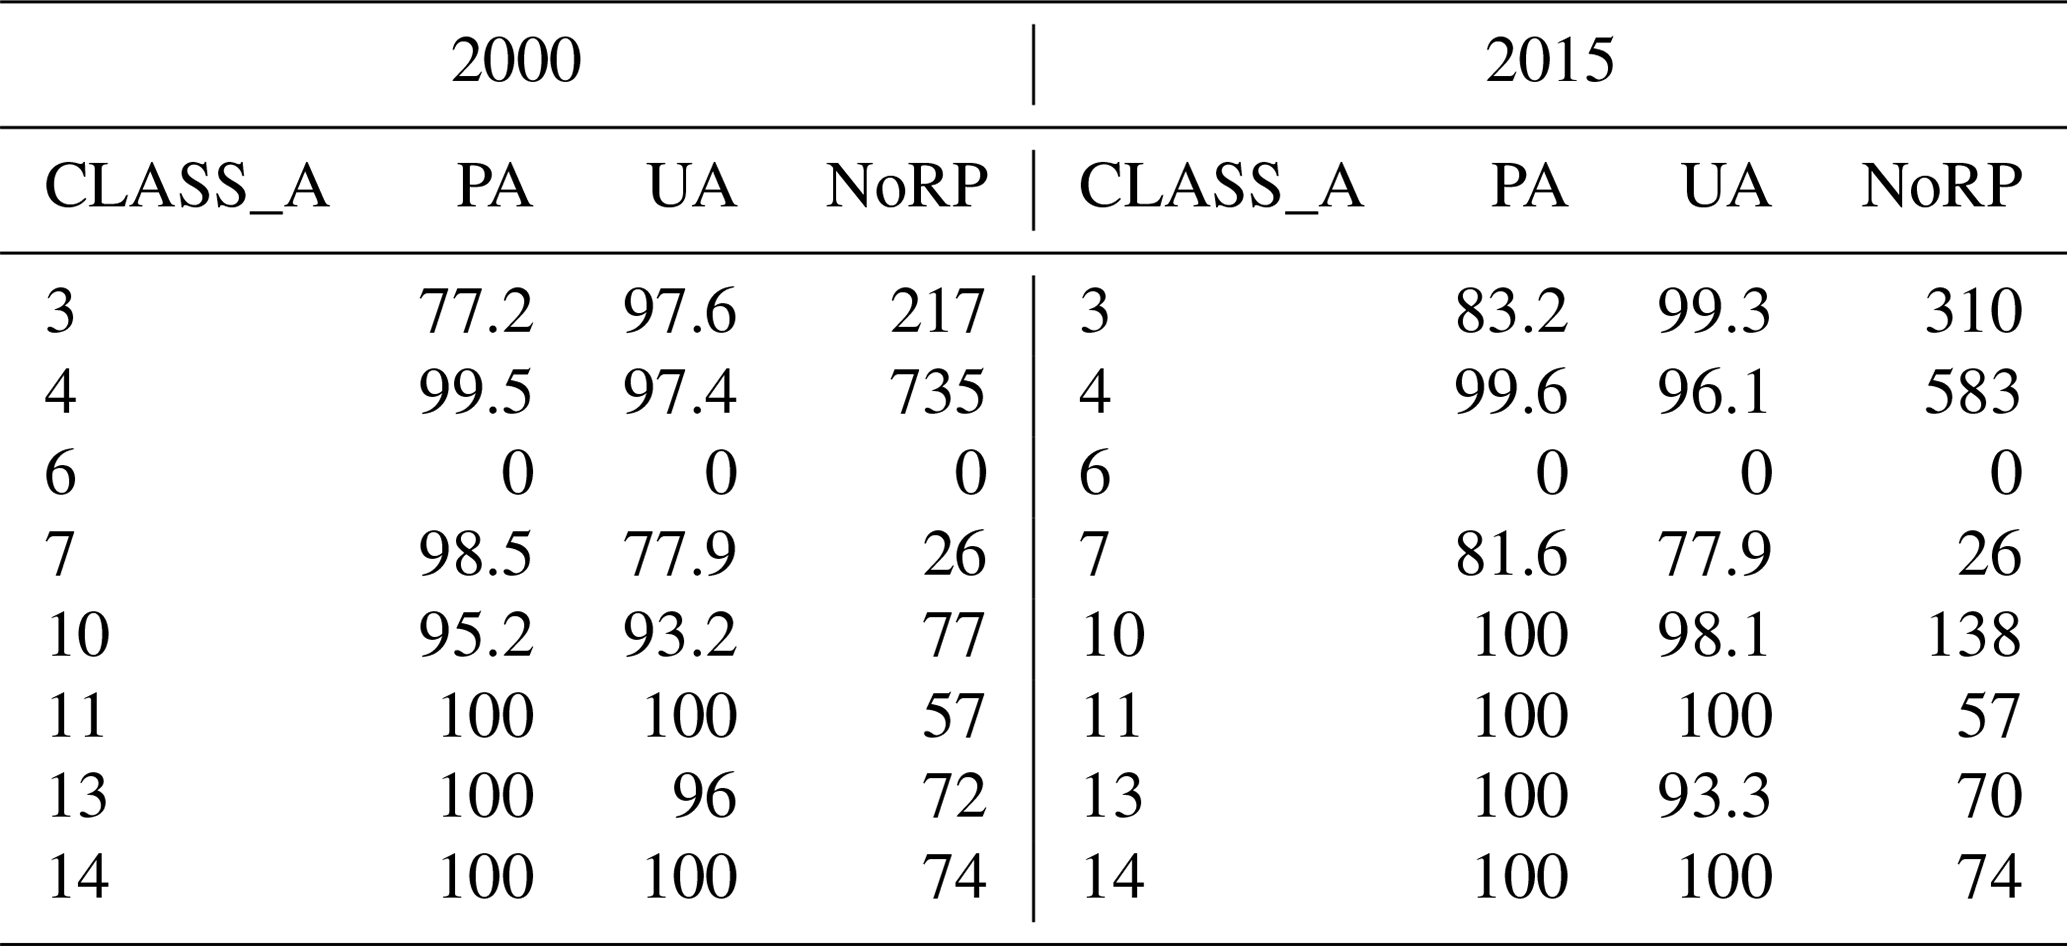
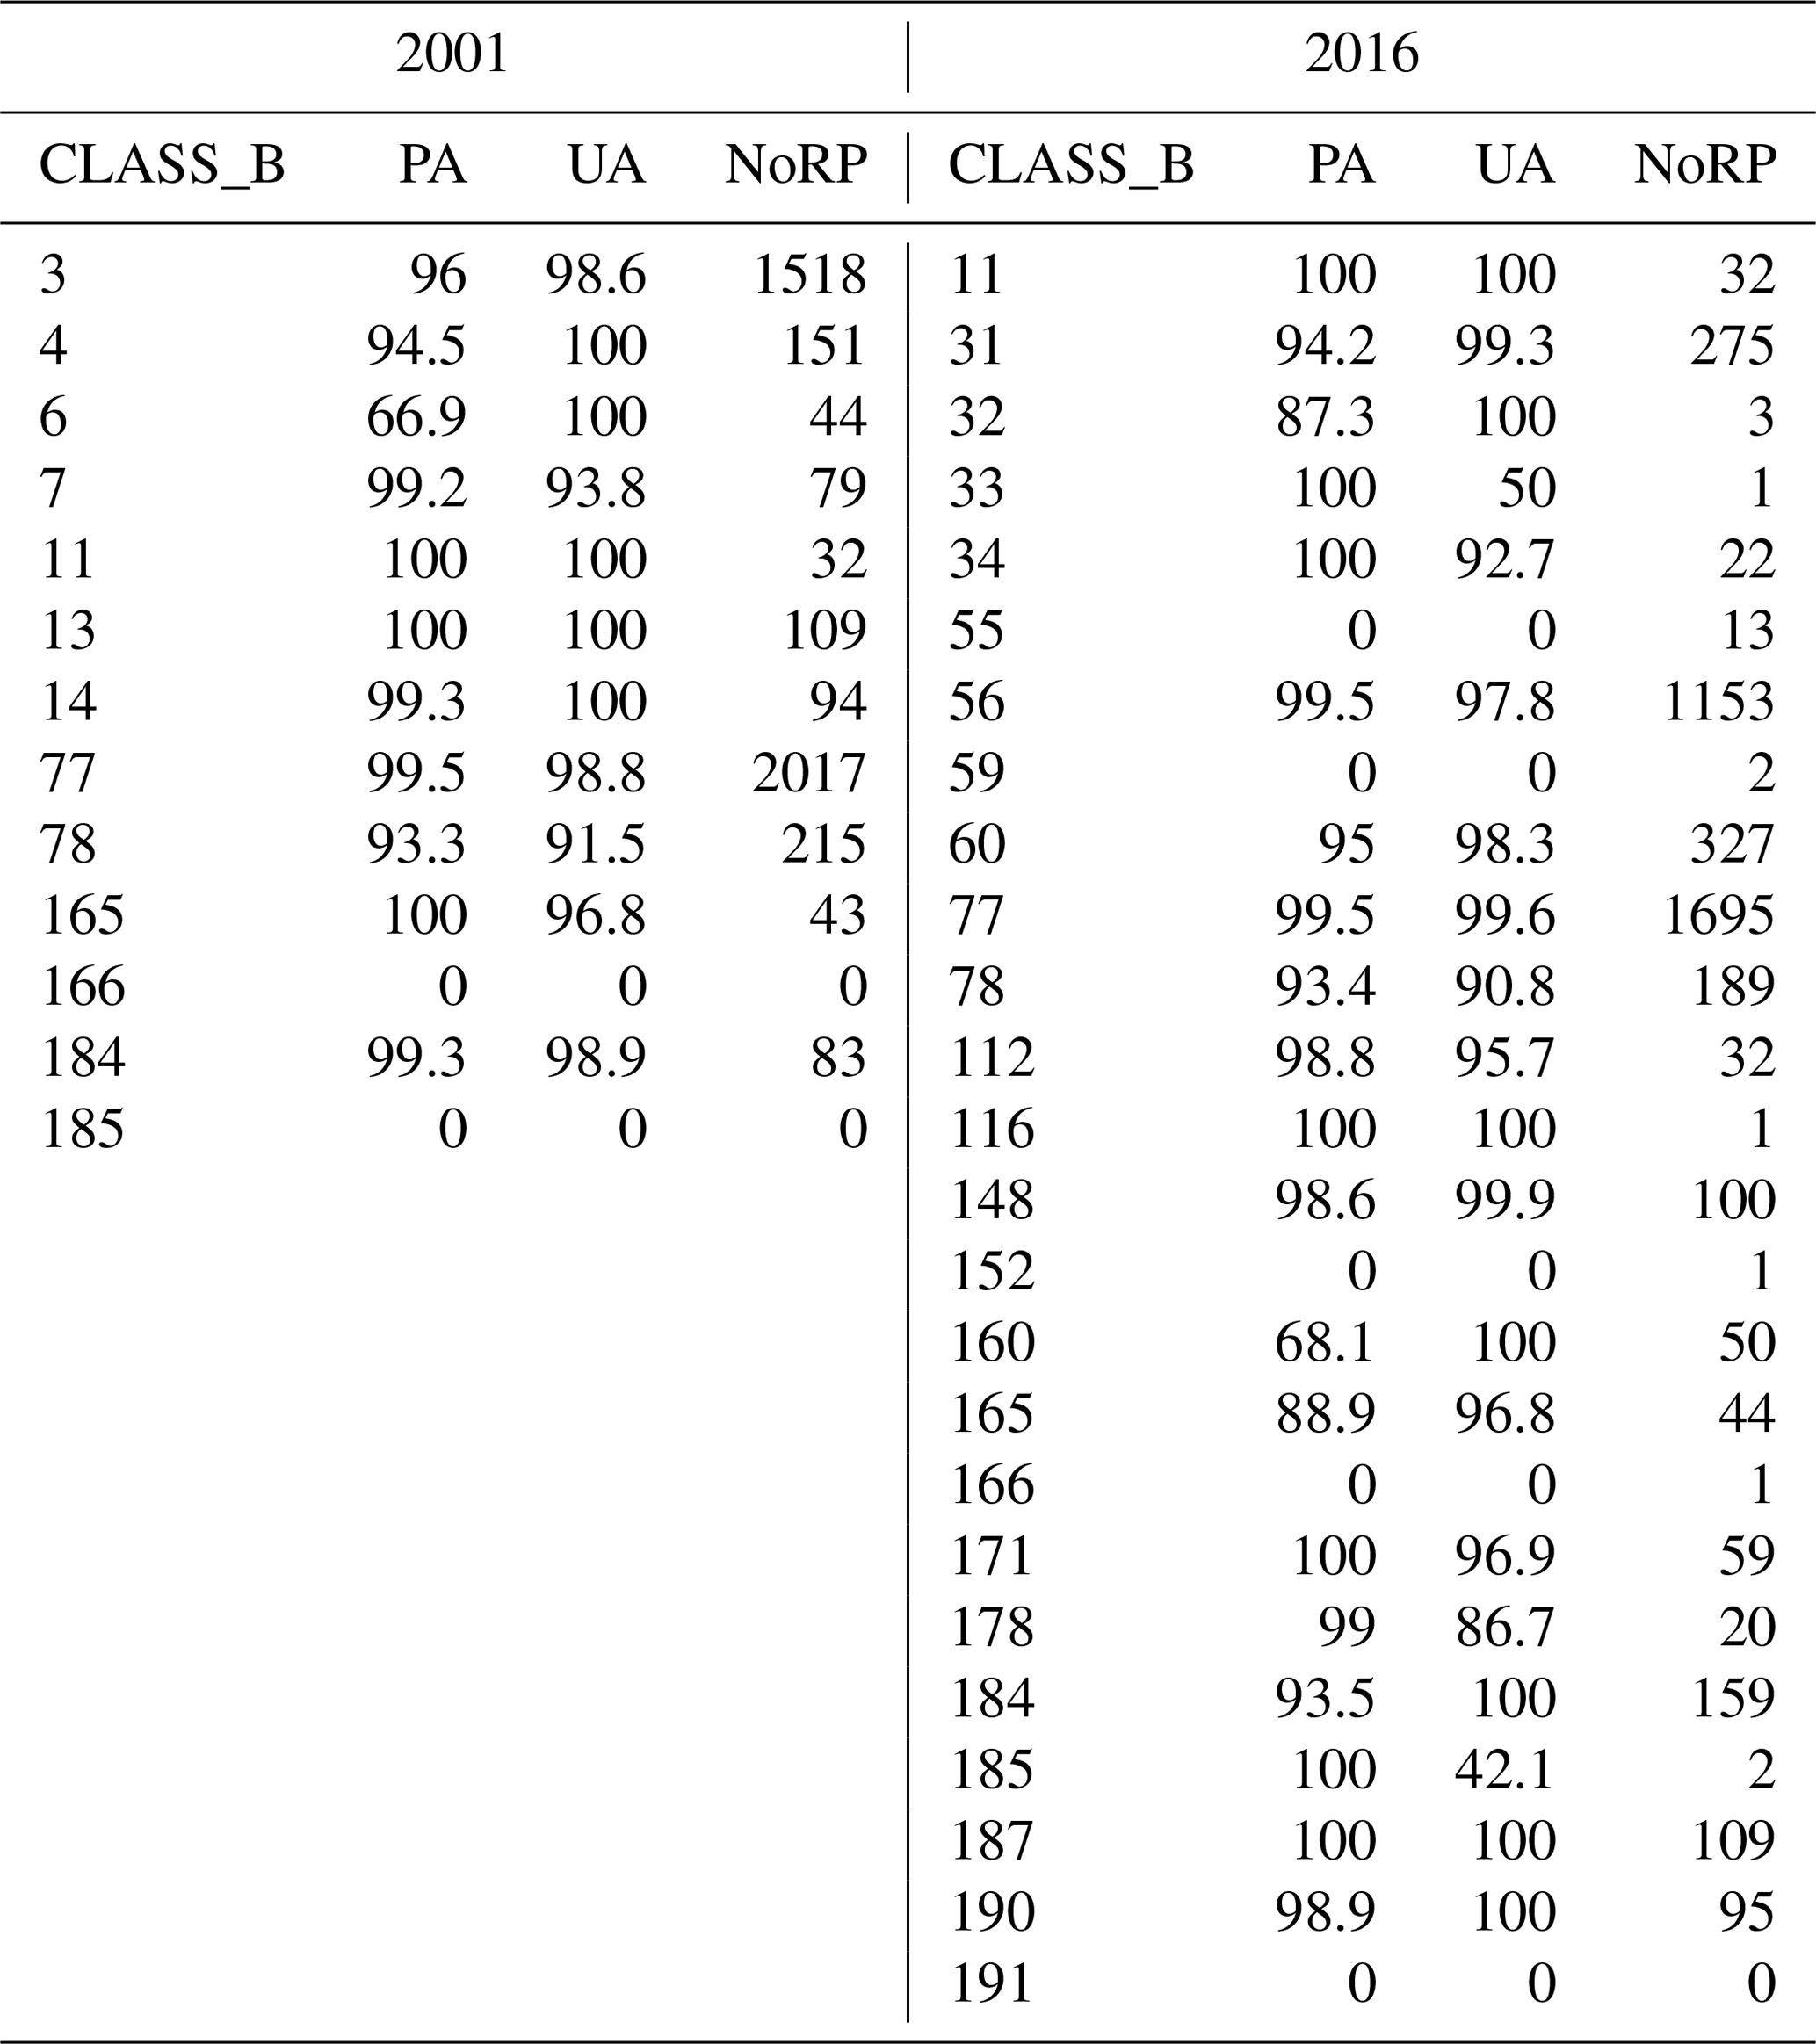
Appendix A contains the thematic class accuracies for each KLC and both land cover and land cover change maps. Accuracy parameters are in percent, classes with less than 15 samples were not included in the overall accuracy calculation.
-
CLASS_A – corresponding class (see Table 2 “Dichotomous map code”) – OR
-
CLASS_B – corresponding class (see Table 2 “Modular map code”)
-
PA – producer's accuracy
-
UA – user's accuracy
-
NoRP – number of reference points


The supplement related to this article is available online at: https://doi.org/10.5194/essd-12-3001-2020-supplement.
ZSZ and ABB designed the work. CM and GJ implemented the workflows. ZSZ and ABB wrote the paper. ZSZ, ABB, AL, and GJ revised the paper.
The authors declare that they have no conflict of interest.
All features and data are provided “as is” with no warranties of any kind.
The development of the thematic maps has been made possible thanks to the effort of eGEOS – an Italian Space Agency (ASI)/Telespazio Company, ITHACA (Information Technology for Humanitarian Assistance, Cooperation and Action) and Telespazio – a Leonardo and Thales company; their quality evaluations were made possible by IGNFI (France), Joanneum Research (Austria), EOXPLORE (Germany), GISBOX (Romania), Space4environment (Luxembourg), ONFI (France), and LuxSpace (Luxembourg). The authors also thank Mr. Aaron McKinnon (EC/JRC) for proofreading a previous version of the paper. This work was produced under the European Commission Copernicus program, Global Land Service, High Resolution Hot-Spot Monitoring component.
This paper was edited by David Carlson and reviewed by three anonymous referees.
Brink, A. B. and Eva, H. D.: Monitoring 25 years of land cover change dynamics in Africa: A sample based remote sensing approach, Appl. Geogr., 29, 501–512, https://doi.org/10.1016/j.apgeog.2008.10.0, 2009.
Brink, A., Eva, H., and Bodart, C.: Is Africa Losing Its Natural Vegetation? Monitoring Trajectories of Land-Cover Change Using Landsat Imagery, in: Remote Sensing of Land Use and Land Cover, Principles and Applications, edited by: Giri, C., vol. 20120991, 369–376, CRC Press, Boca Raton, FL., 2012.
Di Gregorio, A.: Land cover classification system: classification concepts and user manual: LCCS, Software version 2, Food and Agriculture Organization of the United Nations, Rome, 2005.
Di Minin, E., Slotow, R., Hunter, L. T. B., Montesino Pouzols, F., Toivonen, T., Verburg, P. H., Leader-Williams, N., Petracca, L., and Moilanen, A.: Global priorities for national carnivore conservation under land use change, Sci. Rep.-UK, 6, 23814, https://doi.org/10.1038/srep23814, 2016.
Dinerstein, E., Olson, D., Joshi, A., Vynne, C., Burgess, N. D., Wikramanayake, E., Hahn, N., Palminteri, S., Hedao, P., Noss, R., Hansen, M., Locke, H., Ellis, E. C., Jones, B., Barber, C. V., Hayes, R., Kormos, C., Martin, V., Crist, E., Sechrest, W., Price, L., Baillie, J. E. M., Weeden, D., Suckling, K., Davis, C., Sizer, N., Moore, R., Thau, D., Birch, T., Potapov, P., Turubanova, S., Tyukavina, A., de Souza, N., Pintea, L., Brito, J. C., Llewellyn, O. A., Miller, A. G., Patzelt, A., Ghazanfar, S. A., Timberlake, J., Klöser, H., Shennan-Farpón, Y., Kindt, R., Lillesø, J.-P. B., van Breugel, P., Graudal, L., Voge, M., Al-Shammari, K. F., and Saleem, M.: An Ecoregion-Based Approach to Protecting Half the Terrestrial Realm, BioScience, 67, 534–545, https://doi.org/10.1093/biosci/bix014, 2017.
European Commission: Science for the AU-EU Partnership building knowledge for sustainable development, Joint Research Centre, Publications Office of the European Union, Luxembourg, ISBN 978-92-79-86961-7, JRC107753, https://doi.org/10.2760/360029, 2018.
Fritz, S., See, L., Perger, C., McCallum, I., Schill, C., Schepaschenko, D., Duerauer, M., Karner, M., Dresel, C., Laso-Bayas, J.-C., Lesiv, M., Moorthy, I., Salk, C. F., Danylo, O., Sturn, T., Albrecht, F., You, L., Kraxner, F. and Obersteiner, M.: A global dataset of crowdsourced land cover and land use reference data, Sci. Data, 4, 1–8, https://doi.org/10.1038/sdata.2017.75, 2017.
Gallaun, H., Steinegger, M., Wack, R., Schardt, M., Kornberger, B., and Schmitt, U.: Remote Sensing Based Two-Stage Sampling for Accuracy Assessment and Area Estimation of Land Cover Changes, Remote Sensing, 7, 11992–12008, https://doi.org/10.3390/rs70911992, 2015.
Geist, H. J. and Lambin, E. F.: Proximate Causes and Underlying Driving Forces of Tropical Deforestation, BioScience, 52, 143, https://doi.org/10.1641/0006-3568(2002)052[0143:PCAUDF]2.0.CO;2, 2002.
Hagolle, O., Huc, M., Villa Pascual, D., and Dedieu, G.: A Multi-Temporal and Multi-Spectral Method to Estimate Aerosol Optical Thickness over Land, for the Atmospheric Correction of FormoSat-2, LandSat, VENμS and Sentinel-2 Images, Remote Sensing, 7, 2668–2691, https://doi.org/10.3390/rs70302668, 2015.
Kebede, E., Kagochi, J., and Jolly, C. M.: Energy consumption and economic development in Sub-Sahara Africa, Energ. Econ., 32, 532–537, https://doi.org/10.1016/j.eneco.2010.02.003, 2010.
MacKinnon, J., Aveling, C., Olivier, R., Murray, M., Paolini, C., and European Commission and Directorate-General for International Cooperation and Development: Larger than elephants: inputs for an EU strategic approach to wildlife conservation in Africa: synthesis, available at: http://dx.publications.europa.eu/10.2841/909032 (last access: 24 April 2018), 2015.
Marshall, M., Norton-Griffiths, M., Herr, H., Lamprey, R., Sheffield, J., Vagen, T., and Okotto-Okotto, J.: Continuous and consistent land use/cover change estimates using socio-ecological data, Earth Syst. Dynam., 8, 55–73, https://doi.org/10.5194/esd-8-55-2017, 2017.
Masek, J. G., Vermote, E. F., Saleous, N. E., Wolfe, R., Hall, F. G., Huemmrich, K. F., Gao, F., Kutler, J., and Lim, T.-K.: A Landsat Surface Reflectance Dataset for North America, 1990–2000, IEEE Geosci. Remote S., 3, 68–72, https://doi.org/10.1109/LGRS.2005.857030, 2006.
Mora, B., Tsendbazar, N.-E., Herold, M., and Arino, O.: Global Land Cover Mapping: Current Status and Future Trends, in: Land Use and Land Cover Mapping in Europe, vol. 18, edited by: Manakos, I. and Braun, M., Springer Netherlands, Dordrecht, 11–30, 2014.
Nissan, H., Goddard, L., de Perez, E. C., Furlow, J., Baethgen, W., Thomson, M. C., and Mason, S. J.: On the use and misuse of climate change projections in international development, WIREs Clim. Change, 10, e579, https://doi.org/10.1002/wcc.579, 2019.
Saah, D., Tenneson, K., Poortinga, A., Nguyen, Q., Chishtie, F., Aung, K. S., Markert, K. N., Clinton, N., Anderson, E. R., Cutter, P., Goldstein, J., Housman, I. W., Bhandari, B., Potapov, P. V., Matin, M., Uddin, K., Pham, H. N., Khanal, N., Maharjan, S., Ellenberg, W. L., Bajracharya, B., Bhargava, R., Maus, P., Patterson, M., Flores-Anderson, A. I., Silverman, J., Sovann, C., Do, P. M., Nguyen, G. V., Bounthabandit, S., Aryal, R. R., Myat, S. M., Sato, K., Lindquist, E., Kono, M., Broadhead, J., Towashiraporn, P., and Ganz, D.: Primitives as building blocks for constructing land cover maps, Int. J. Appl. Earth Obs., 85, 101979, https://doi.org/10.1016/j.jag.2019.101979, 2020.
Stehman, S. V.: Impact of sample size allocation when using stratified random sampling to estimate accuracy and area of land-cover change, Remote Sens. Lett., 3, 111–120, https://doi.org/10.1080/01431161.2010.541950, 2012.
Strobl, P., Baumann, P., Lewis, A., Szantoi, Z., Killough, B., Purss, M. B. J., Craglia, M., Nativi, S., Held, A., and Dhu, T.: The six faces of the data cube, in Proc. of the 2017 conference on Big Data from Space (BiDS'17), Toulouse, France, 28–30 November 2017, Luxembourg, Publications Office of the European Union, 32–35, https://doi.org/10.2760/383579, 2017.
Sylla, M. B., Pal, J. S., Wang, G. L., and Lawrence, P. J.: Impact of land cover characterization on regional climate modeling over West Africa, Clim. Dynam., 46, 637–650, https://doi.org/10.1007/s00382-015-2603-4, 2016.
Szantoi, Z., Escobedo, F., Abd-Elrahman, A., Smith, S., and Pearlstine, L.: Analyzing fine-scale wetland composition using high resolution imagery and texture features, Int. J. Appl. Earth Obs., 23, 204–212, https://doi.org/10/gdnfvd, 2013.
Szantoi, Z., Brink, A., Buchanan, G., Bastin, L., Lupi, A., Simonetti, D., Mayaux, P., Peedell, S., and Davy, J.: A simple remote sensing based information system for monitoring sites of conservation importance, Remote Sens. Ecol. Conserv., 2, 16–24, https://doi.org/10.1002/rse2.14, 2016.
Szantoi, Z., Brink, A., Lupi, A., Mannone, C., and Jaffrain, G.: Land cover and change thematic and validation datasets for Sub-Saharan Africa, PANGAEA, https://doi.org/10.1594/PANGAEA.914261, 2020a.
Szantoi, Z., Geller, G. N, Tsendbazar, N.-E., See, L., Griffiths, P., Fritz, S., Gong, P., Herold, M., Mora, B., and Obregon, A.: Addressing the Need for Improved Land Cover Map Products for Policy Support, Environ. Sci. Policy, 112, 28–35, https://doi.org/10.1016/j.envsci.2020.04.005, 2020b.
Tolessa, T., Senbeta, F., and Kidane, M.: The impact of land use/land cover change on ecosystem services in the central highlands of Ethiopia, Ecosyst. Serv., 23, 47–54, https://doi.org/10.1016/j.ecoser.2016.11.010, 2017.
Tsendbazar, N.-E., Herold, M., de Bruin, S., Lesiv, M., Fritz, S., Van De Kerchove, R., Buchhorn, M., Duerauer, M., Szantoi, Z., and Pekel, J.-F.: Developing and applying a multi-purpose land cover validation dataset for Africa, Remote Sens. Environ., 219, 298–309, https://doi.org/10.1016/j.rse.2018.10.025, 2018.
van der Meer, E.: Carnivore conservation under land use change: the status of Zimbabwe's cheetah population after land reform, Biodivers. Conserv., 27, 647–663, https://doi.org/10.1007/s10531-017-1455-0, 2018.
Vondou, D. A. and Haensler, A.: Evaluation of simulations with the regional climate model REMO over Central Africa and the effect of increased spatial resolution: Evaluation of Remo Resolution Over Central Africa, Int. J. Climatol., 37, 741–760, https://doi.org/10.1002/joc.5035, 2017.
Zhu, Z., Wang, S., and Woodcock, C. E.: Improvement and expansion of the Fmask algorithm: cloud, cloud shadow, and snow detection for Landsats 4–7, 8, and Sentinel 2 images, Remote Sens. Environ., 159, 269–277, https://doi.org/10.1016/j.rse.2014.12.014, 2015.