the Creative Commons Attribution 4.0 License.
the Creative Commons Attribution 4.0 License.
 | 17 Jun 2020
Vegetation, ground cover, soil, rainfall simulation, and overland-flow experiments before and after tree removal in woodland-encroached sagebrush steppe: the hydrology component of the Sagebrush Steppe Treatment Evaluation Project (SageSTEP)
C. Jason Williams
Frederick B. Pierson
Patrick R. Kormos
Osama Z. Al-Hamdan
Justin C. Johnson
Rainfall simulation and overland-flow experiments enhance understanding of surface hydrology and erosion processes, quantify runoff and erosion rates, and provide valuable data for developing and testing predictive models. We present a unique dataset (1021 experimental plots) of rainfall simulation (1300 plot runs) and overland-flow (838 plot runs) experimental plot data paired with measures of vegetation, ground cover, and surface soil physical properties spanning point to hillslope scales. The experimental data were collected at three sloping sagebrush (Artemisia spp.) sites in the Great Basin, USA, each subjected to woodland encroachment and with conditions representative of intact wooded shrublands and 1–9 years following wildfire, prescribed fire, and/or tree cutting and shredding tree-removal treatments. The methodologies applied in data collection and the cross-scale experimental design uniquely provide scale-dependent, separate measures of interrill (rain splash and sheet flow processes, 0.5 m2 plots) and concentrated overland-flow runoff and erosion rates (∼9 m2 plots), along with collective rates for these same processes combined over the patch scale (13 m2 plots). The dataset provides a valuable source for developing, assessing, and calibrating/validating runoff and erosion models applicable to diverse plant community dynamics with varying vegetation, ground cover, and surface soil conditions. The experimental data advance understanding and quantification of surface hydrologic and erosion processes for the research domain and potentially for other patchy-vegetated rangeland landscapes elsewhere. Lastly, the unique nature of repeated measures spanning numerous treatments and timescales delivers a valuable dataset for examining long-term landscape vegetation, soil, hydrology, and erosion responses to various management actions, land use, and natural disturbances. The dataset is available from the US Department of Agriculture National Agricultural Library at https://data.nal.usda.gov/search/type/dataset (last access: 7 May 2020) (doi: https://doi.org/10.15482/USDA.ADC/1504518; Pierson et al., 2019).
- Article
(19703 KB) - Full-text XML
- BibTeX
- EndNote


Rangelands are one of the most common occurring sparsely vegetated wildland landscapes around the world. These lands cover about half of the world's land surface and about 31 % (>300 million ha) of the land surface in the US (Havstad et al., 2009). The patchy vegetation structure typical to these water-limited landscapes regulates connectivity of runoff and erosion sources and processes and thus controls hillslope-scale runoff and sediment transport (Pierson et al., 1994; Wainwright et al., 2000; Wilcox et al., 2003; Ludwig et al., 2005). Runoff and erosion in isolated bare patches on well-vegetated rangelands occur as splash–sheet (rain splash and sheet flow) processes. Sediment entrained by raindrops and shallow sheet flow in bare patches typically moves a limited distance downslope before deposition immediately upslope of and within vegetated areas (Emmett, 1970; Reid et al., 1999; Puigdefábregas, 2005; Pierson and Williams, 2016). Disturbances such as intensive land use, plant community transitions, and wildfire can alter this resource-conserving vegetation structure and thereby facilitate increases in runoff and soil loss through enhanced connectivity of overland-flow and sediment sources during rainfall events (Davenport et al., 1998; Wilcox et al., 2003; Pierson et al., 2011; Williams et al., 2014a, 2014b, 2018). The negative ramifications of woody plant encroachment and wildfire have been extensively studied on rangelands around the world, and this work has advanced understanding of runoff and erosion processes for these commonly occurring ecosystems (Schlesinger et al., 1990; Wainwright et al., 2000; Shakesby and Doerr, 2006; Shakesby, 2011; Pierson and Williams, 2016). Recent widespread plant community transitions and trends in wildfire activity and associated amplified runoff and erosion rates spanning rangelands to dry forests throughout the western US (Williams et al., 2014b) and elsewhere (Shakesby, 2011) underpin a need for compiling data sources that further contribute to process understanding and improved parametrization of rangeland hydrology and erosion predictive technologies.
Sagebrush rangelands in the western US are an extensive (∼300 000 km2) and important vegetation type that have undergone substantial degradation associated with encroachment by pinyon (Pinus spp.) and juniper (Juniperus spp.) woodlands, invasions of fire-prone annual cheatgrass (Bromus tectorum L.), and altered fire regimes (Davies et al., 2011; Miller et al., 2011, 2019). Pinyon and juniper woodland encroachment of sagebrush vegetation can have negative hydrologic impacts (Miller et al., 2005; Petersen and Stringham, 2008; Pierson et al., 2007, 2010; Petersen et al., 2009; Williams et al., 2014a, 2018). Encroaching trees outcompete understory sagebrush and herbaceous vegetation over time and thereby increase bare ground and connectivity of runoff and sediment sources (Miller et al., 2000; Bates et al., 2000, 2005; Petersen et al., 2009; Pierson et al., 2010; Roundy et al., 2017). Extensive well-connected bare patches in the later stages of woodland encroachment propagate broadscale runoff generation and soil loss during storms events. Runoff from splash–sheet processes during these events combines along hillslopes to form concentrated overland flow with high sediment detachment rates and ample transport capacity (Pierson et al., 2010; Williams et al., 2014a, 2016c). Amplified soil loss over time perpetuates a woodland ecological state and long-term site degradation (Petersen et al., 2009). Land managers commonly employ various mechanical treatments and prescribed and natural fires to reduce tree cover and reestablish sagebrush vegetation and associated resource-conserving hydrologic function (Bates et al., 2000, 2005, 2014, 2017; Pierson et al., 2007; Miller et al., 2014; Roundy et al., 2014; Williams et al., 2018). However, managers are challenged with predicting potential vegetation and ecohydrologic effects of tree removal across diverse woodland landscapes and with determining the appropriate type and timing of available treatment options. Invasions of fire-prone cheatgrass following prescribed and natural fires are particularly problematic. This annual grass commonly invades open patches on woodlands at lower elevations or on warmer sites, subsequently increases wildfire frequency, and potentially promotes long-term loss of surface soil and nutrients associated with recurrent burning and fire-induced runoff events (Pierson et al., 2011; Wilcox et al., 2012; Williams et al., 2014b).
Land managers around the world need improved understanding of runoff and erosion processes for the various disturbances common to rangelands and need improved tools for predicting responses to and making decisions on a host of management alternatives. Managers rely on local understanding and conceptual and quantitative science-based models to aid management decisions. Local knowledge is often variable, and data necessary to populate conceptual and science-based models are likewise limited given vast rangeland domain. Vegetation and ground cover inventories and field-based experiments are primary resources for informing conceptual models (Petersen et al., 2009; Chambers et al., 2014, 2017; Williams et al., 2016a). Rainfall simulation and overland-flow experiments likewise provide data for developing, evaluating, and enhancing quantitative hydrology and erosion predictive technologies (Flanagan and Nearing, 1995; Robichaud et al., 2007; Wei et al., 2009; Nearing et al., 2011; Al-Hamdan et al., 2012a, 2012b, 2013, 2015, 2017; Hernandez et al., 2017). To address this need, we present an ecohydrologic dataset containing 1021 experimental plots. The dataset consists of rainfall simulation (1300 plot runs, 0.5 to 13 m2 scales) and overland-flow (838 plot runs, ∼9 m2 scale) experimental data with paired measures of vegetation, ground cover, and surface soil physical properties spanning point to hillslope scales (Pierson et al., 2019). The experimental data were collected at multiple sagebrush rangelands in the Great Basin, USA, each with woodland encroachment, sampled in untreated conditions, and following fire and mechanical tree-removal treatments over a 10-year period. The dataset therefore represents diverse vegetation, ground cover, and surface soil conditions common to undisturbed and disturbed rangelands in the western US and elsewhere. The resulting dataset contributes to both process-based knowledge and provision of data for populating, evaluating, and improving conceptual and quantitative hydrology and erosion models.
A series of vegetation, soils, rainfall simulation (Figs. 1 and 2a–c), and overland-flow experiments (Fig. 2d–e) were completed at three pinyon and juniper woodlands historically vegetated as sagebrush shrublands. The study sites were selected from a network of sites as part of a larger study on the ecological impacts of invasive species and woodland encroachment into sagebrush ecosystems and the effects of sagebrush restoration practices, the Sagebrush Steppe Treatment Evaluation Project (SageSTEP, http://www.sagestep.org/, last access: 7 May 2020). Study site climate, physical, and vegetation attributes are provided in Table 1. All data were collected in summer months in years 2006–2015, with sampling years varying by site and by treatment area within each site (see Table 2). Vegetation and ground cover were patchy and sparse at the sites when the study began in 2006 (Table 1). Tree-removal treatments (prescribed fire, tree cutting, tree shredding (bullhog)) were applied at the Marking Corral and Onaqui sites in 2006 (late summer and autumn) to evaluate effectiveness of pinyon and juniper removal in reestablishing sagebrush vegetation and ground cover, improving hydrologic function, and reducing erosion rates. The Castlehead site burned by wildfire in summer 2007 before tree-removal treatments could be applied, and wildfire was assessed as a prescribed natural-fire tree-removal treatment for that site. At all three sites, a cut tree (downed tree) treatment was placed across a subset of large rainfall and overland-flow plot bases (Fig. 2e) within various treatments to measure effects of downed trees on surface hydrology and erosion processes. This additional treatment was applied in 2007 and 2015 to some plots in cut treatment areas at Marking Corral and Onaqui and in 2008 and 2009 in unburned areas at Castlehead. Treatment applications and descriptions and the study experimental design are explained in earlier papers by Pierson et al. (2010, 2013, 2014, 2015) and by Williams et al. (2014a, 2019a, 2020), and all treatments for each site each year are provided in Table 2.
Table 1Topography, climate, soil, tree cover, and understory vegetation at the Castlehead, Marking Corral, and Onaqui sites prior to treatments. Data are from Pierson et al. (2010, 2015) or Williams et al. (2014a) except where indicated by footnote.
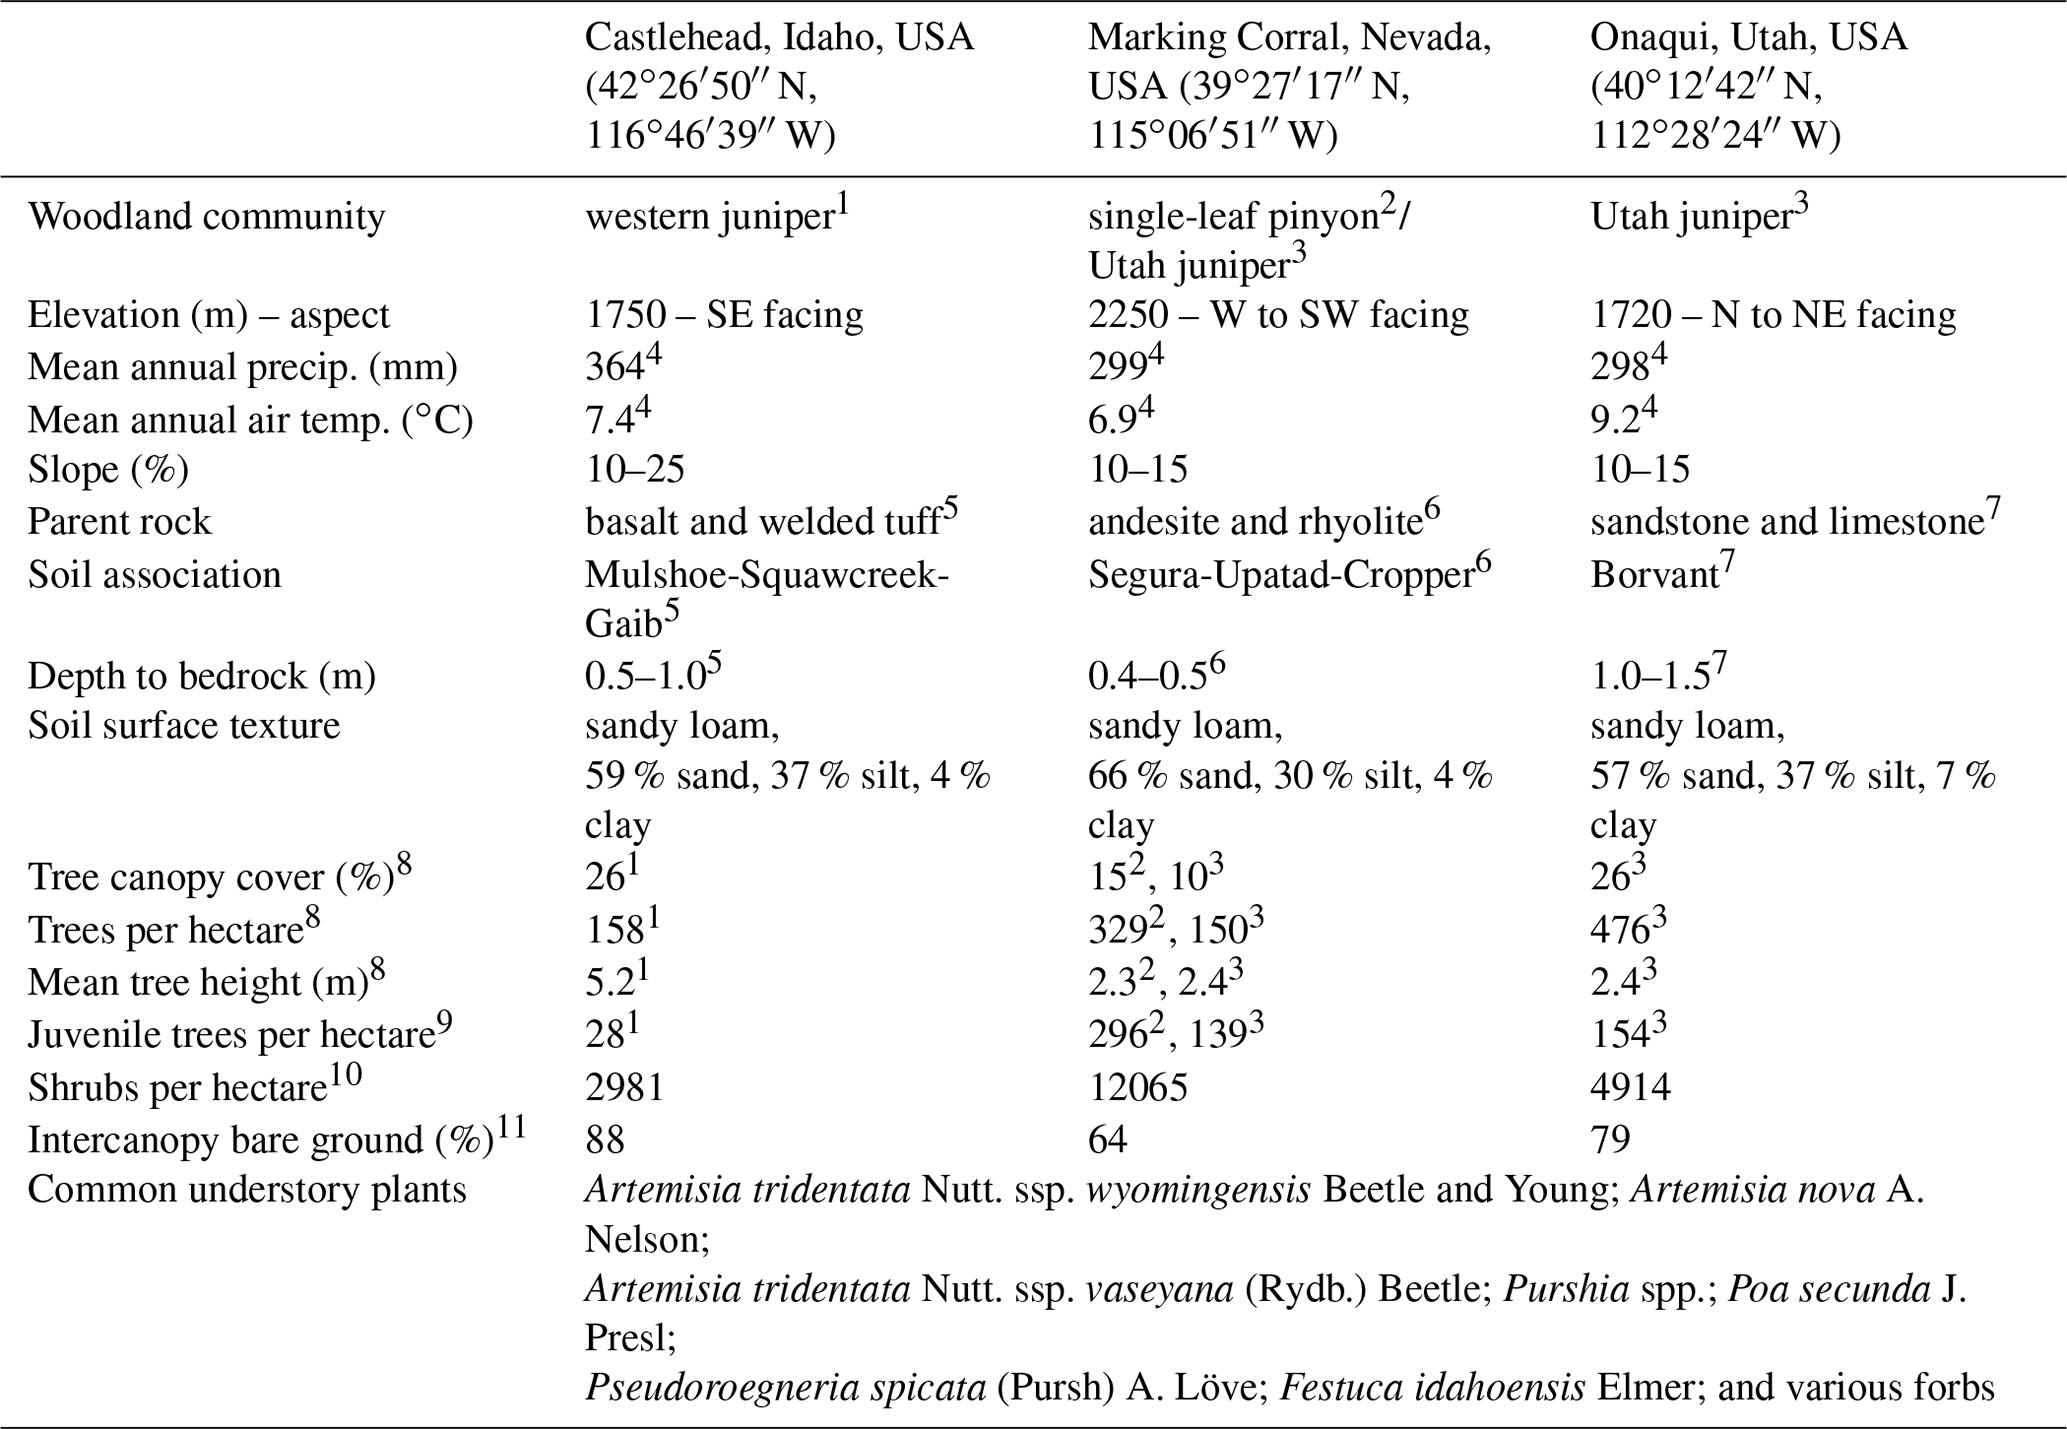
1 Juniperus occidentalis Hook. 2 Pinus monophylla Torr. and Frém. 3 Juniperus osteosperma [Torr.] Little. 4 Estimated from a 4 km grid for years 1989–2018 from Prism Climate Group (2019). 5 Natural Resources Conservation Service (NRCS) (2003). 6 NRCS (2007). 7 NRCS (2006). 8 Trees >50 cm height: values for Castlehead include data from Williams et al. (2014a) and one additional year. 9 Trees 5 to 50 cm height: for Castlehead mean based on data from Williams et al. (2014a) and one additional year. 10 Shrubs ≥ 5 cm height: for Castlehead mean based on data from Williams et al. (2014a) and one additional year. 11 Intercanopy refers to the area between tree canopies consisting of shrubs, grasses, and interspaces between plants (shrub–interspace zone).
Table 2Number of plots sampled by plot type (site characterization vegetation plots and small-plot rainfall, large-plot rainfall, and overland-flow simulation plots) at each study site (Castlehead, Marking Corral, and Onaqui) by treatment and microsite (small plots – tree coppice, shrub coppice, and interspace; large plots and overland flow – tree zone and shrub–interspace zone (intercanopy)) combination each year of the study. Control refers to untreated areas at Marking Corral and Onaqui sites. Unburned refers to areas immediately adjacent to, but outside of, the wildfire area (burned treatment) at the Castlehead site. Downed tree subtreatments (cut–downed tree and unburned–downed tree) refer to plots with a single downed tree across each respective plot within the specified associated treatment (cut or unburned). Tree and shrub coppice microsites are areas underneath or previously (prior to treatment) underneath tree and shrub canopy, respectively. Interspace microsites are areas between tree and shrub coppice microsites. Tree zone microsites are areas underneath, or previously underneath, and immediately adjacent (just outside canopy drip line) to a tree canopy. Shrub–interspace zones are the areas between tree canopies, collectively inclusive of shrub coppice and interspace microsites (the intercanopy).
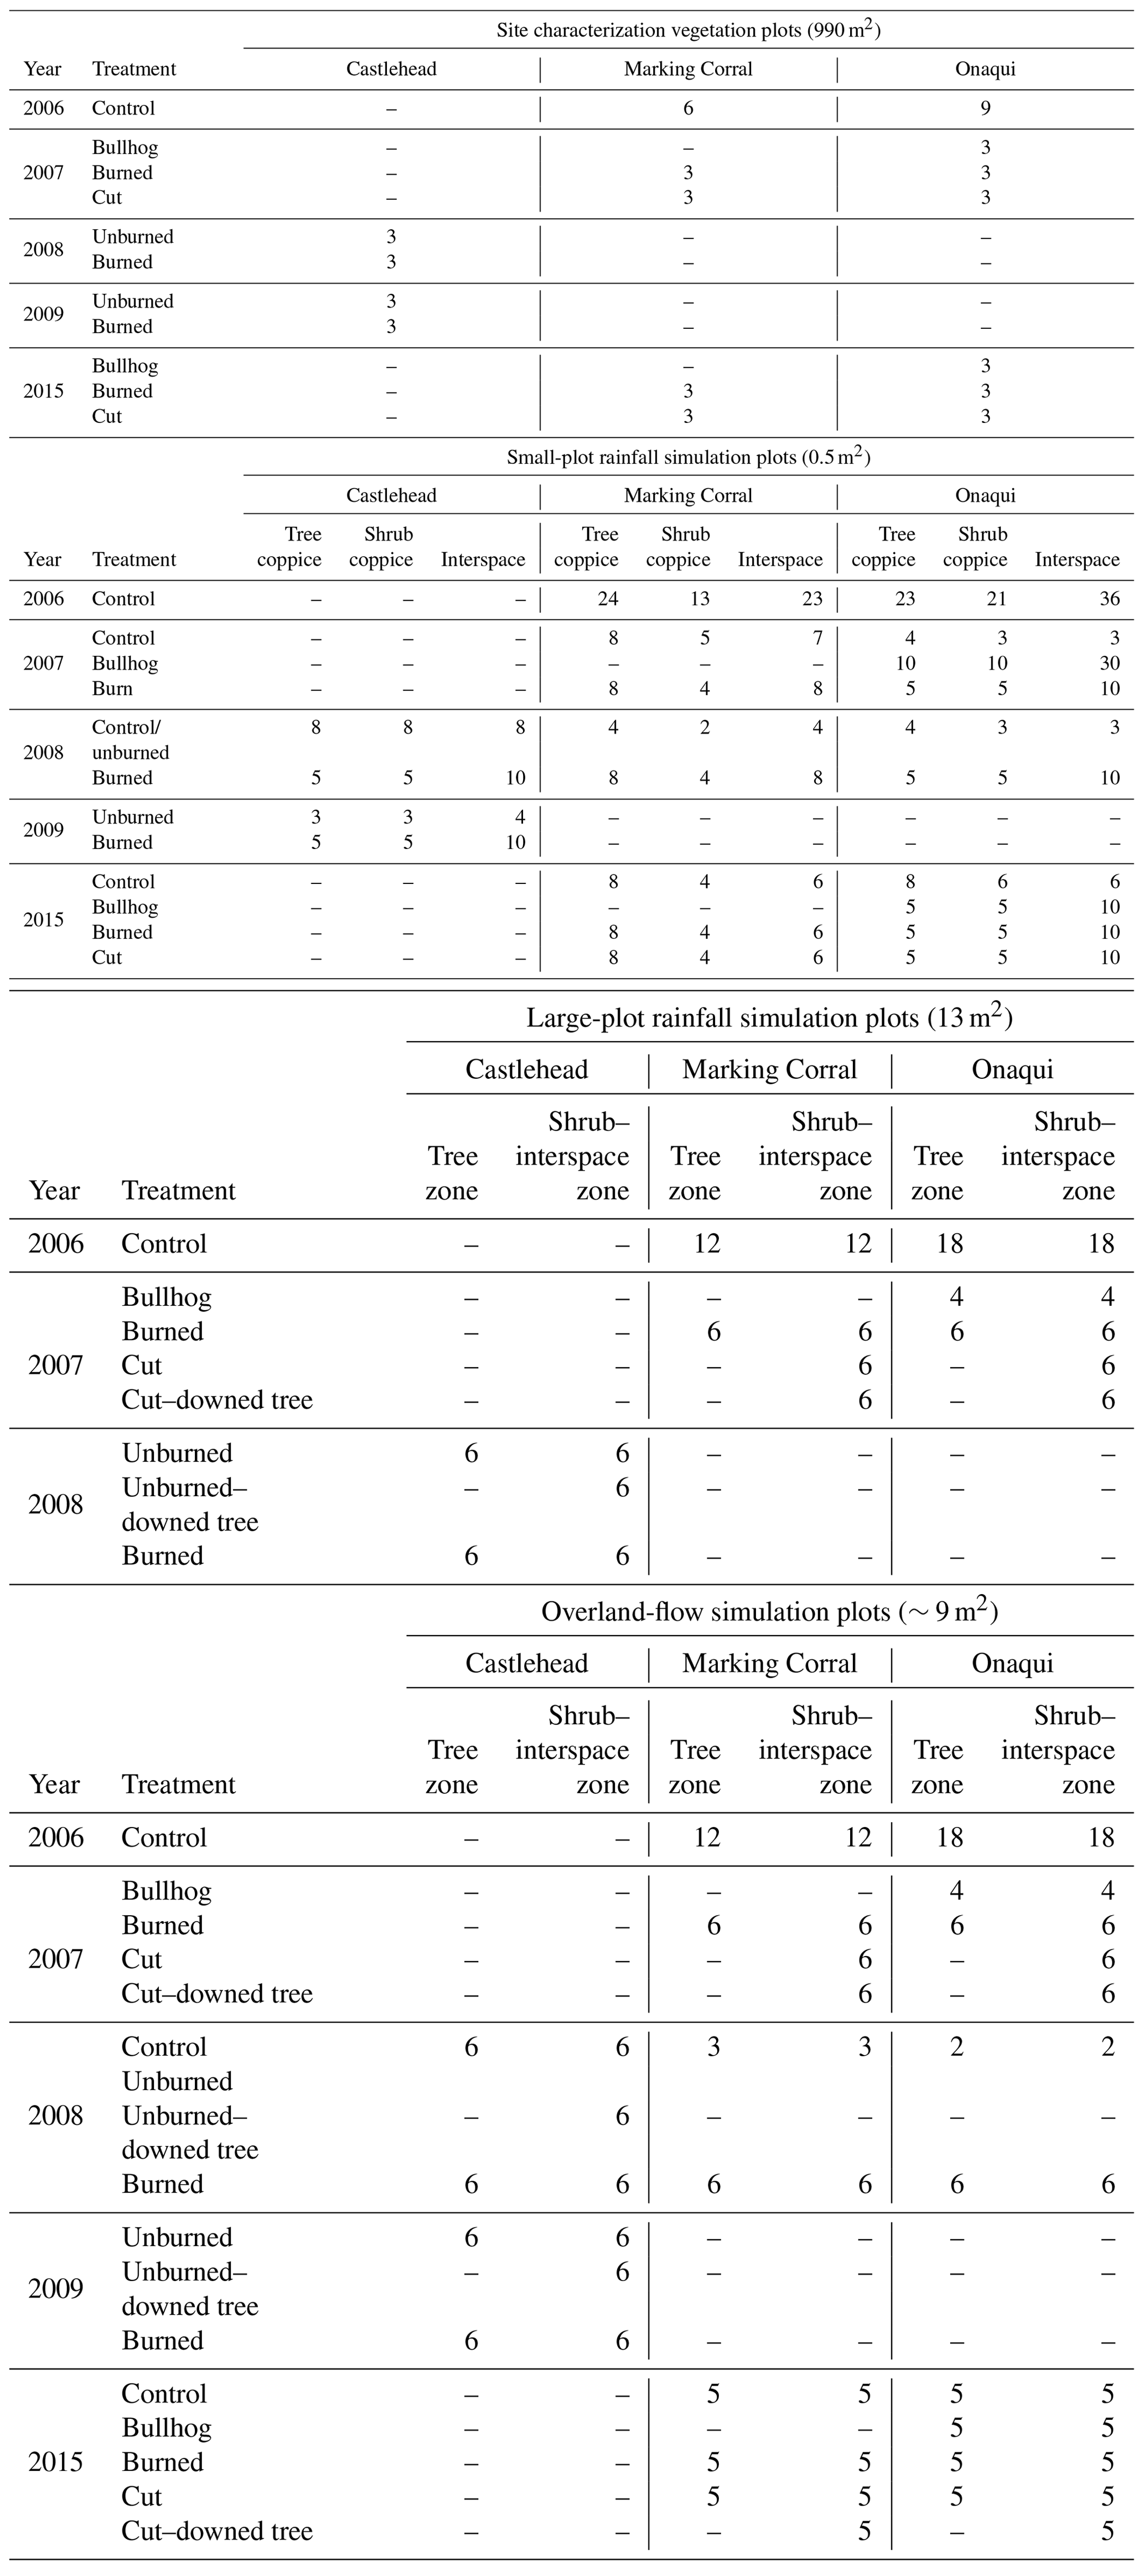
– Indicates not applicable, no plots.
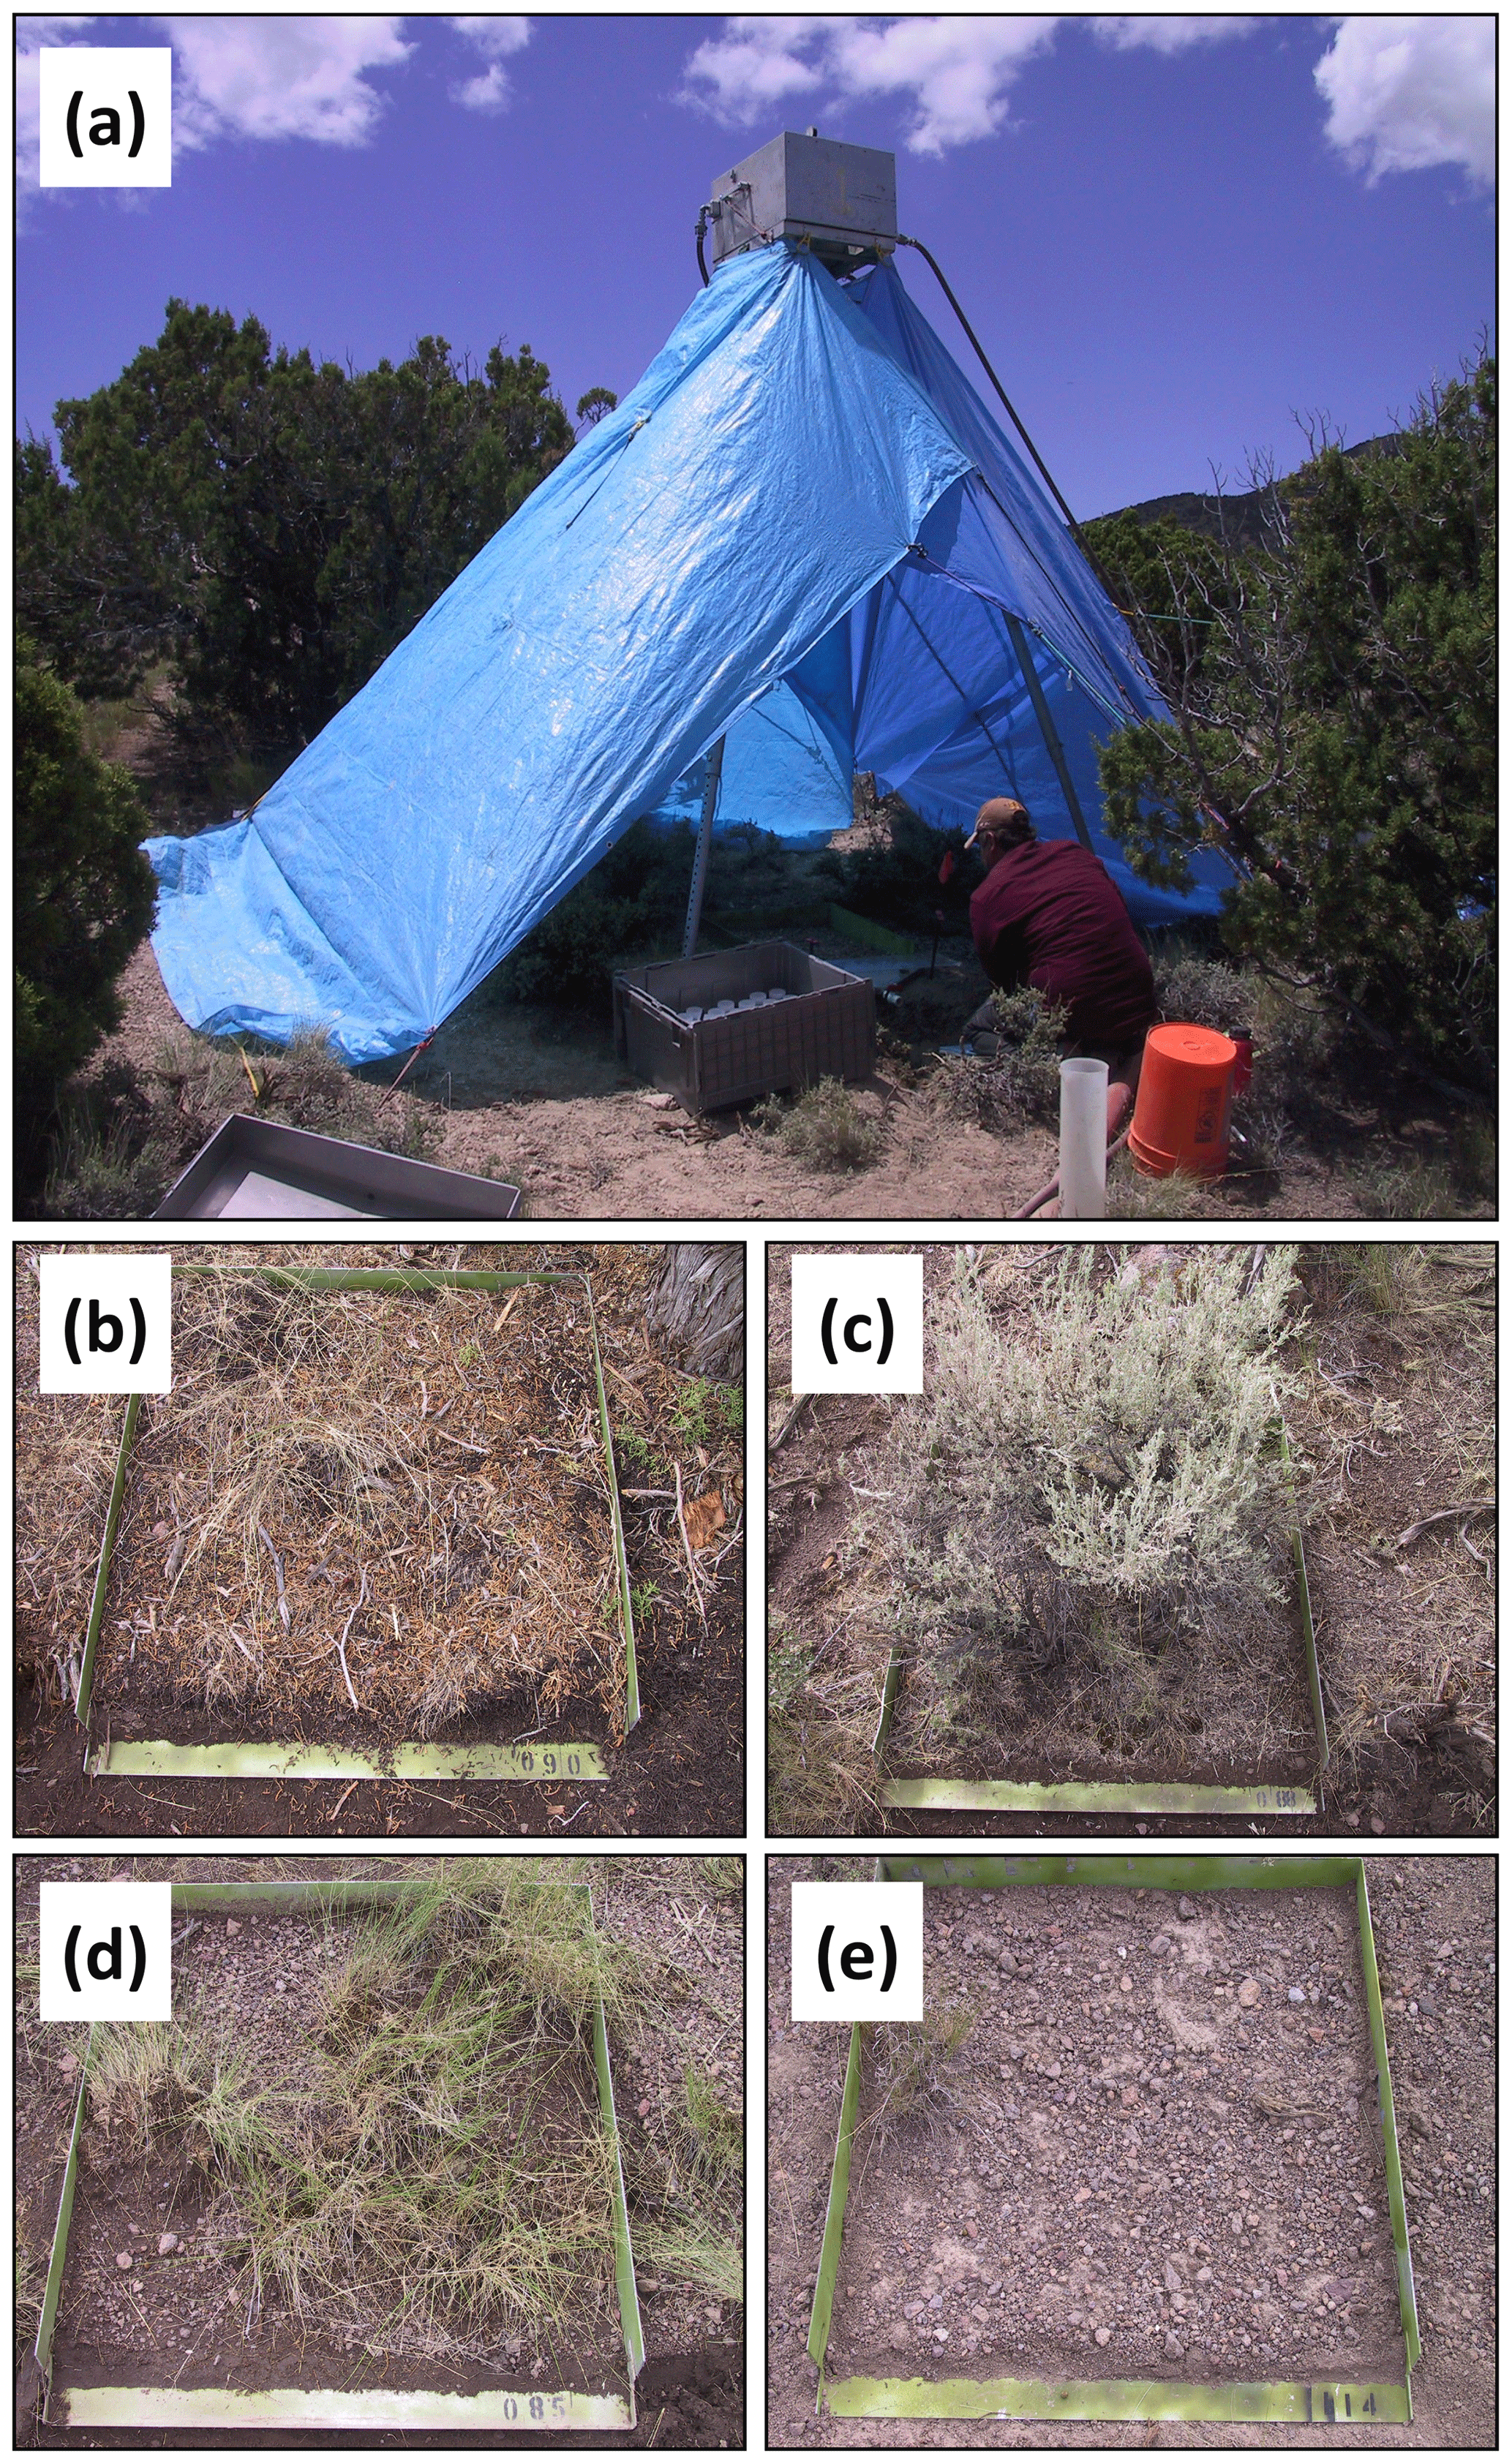
Figure 1Photographs of small-plot rainfall simulator (a) and example small rainfall plots on tree coppice (b), shrub coppice (c), and interspace (d, e) microsites as applied in this study.
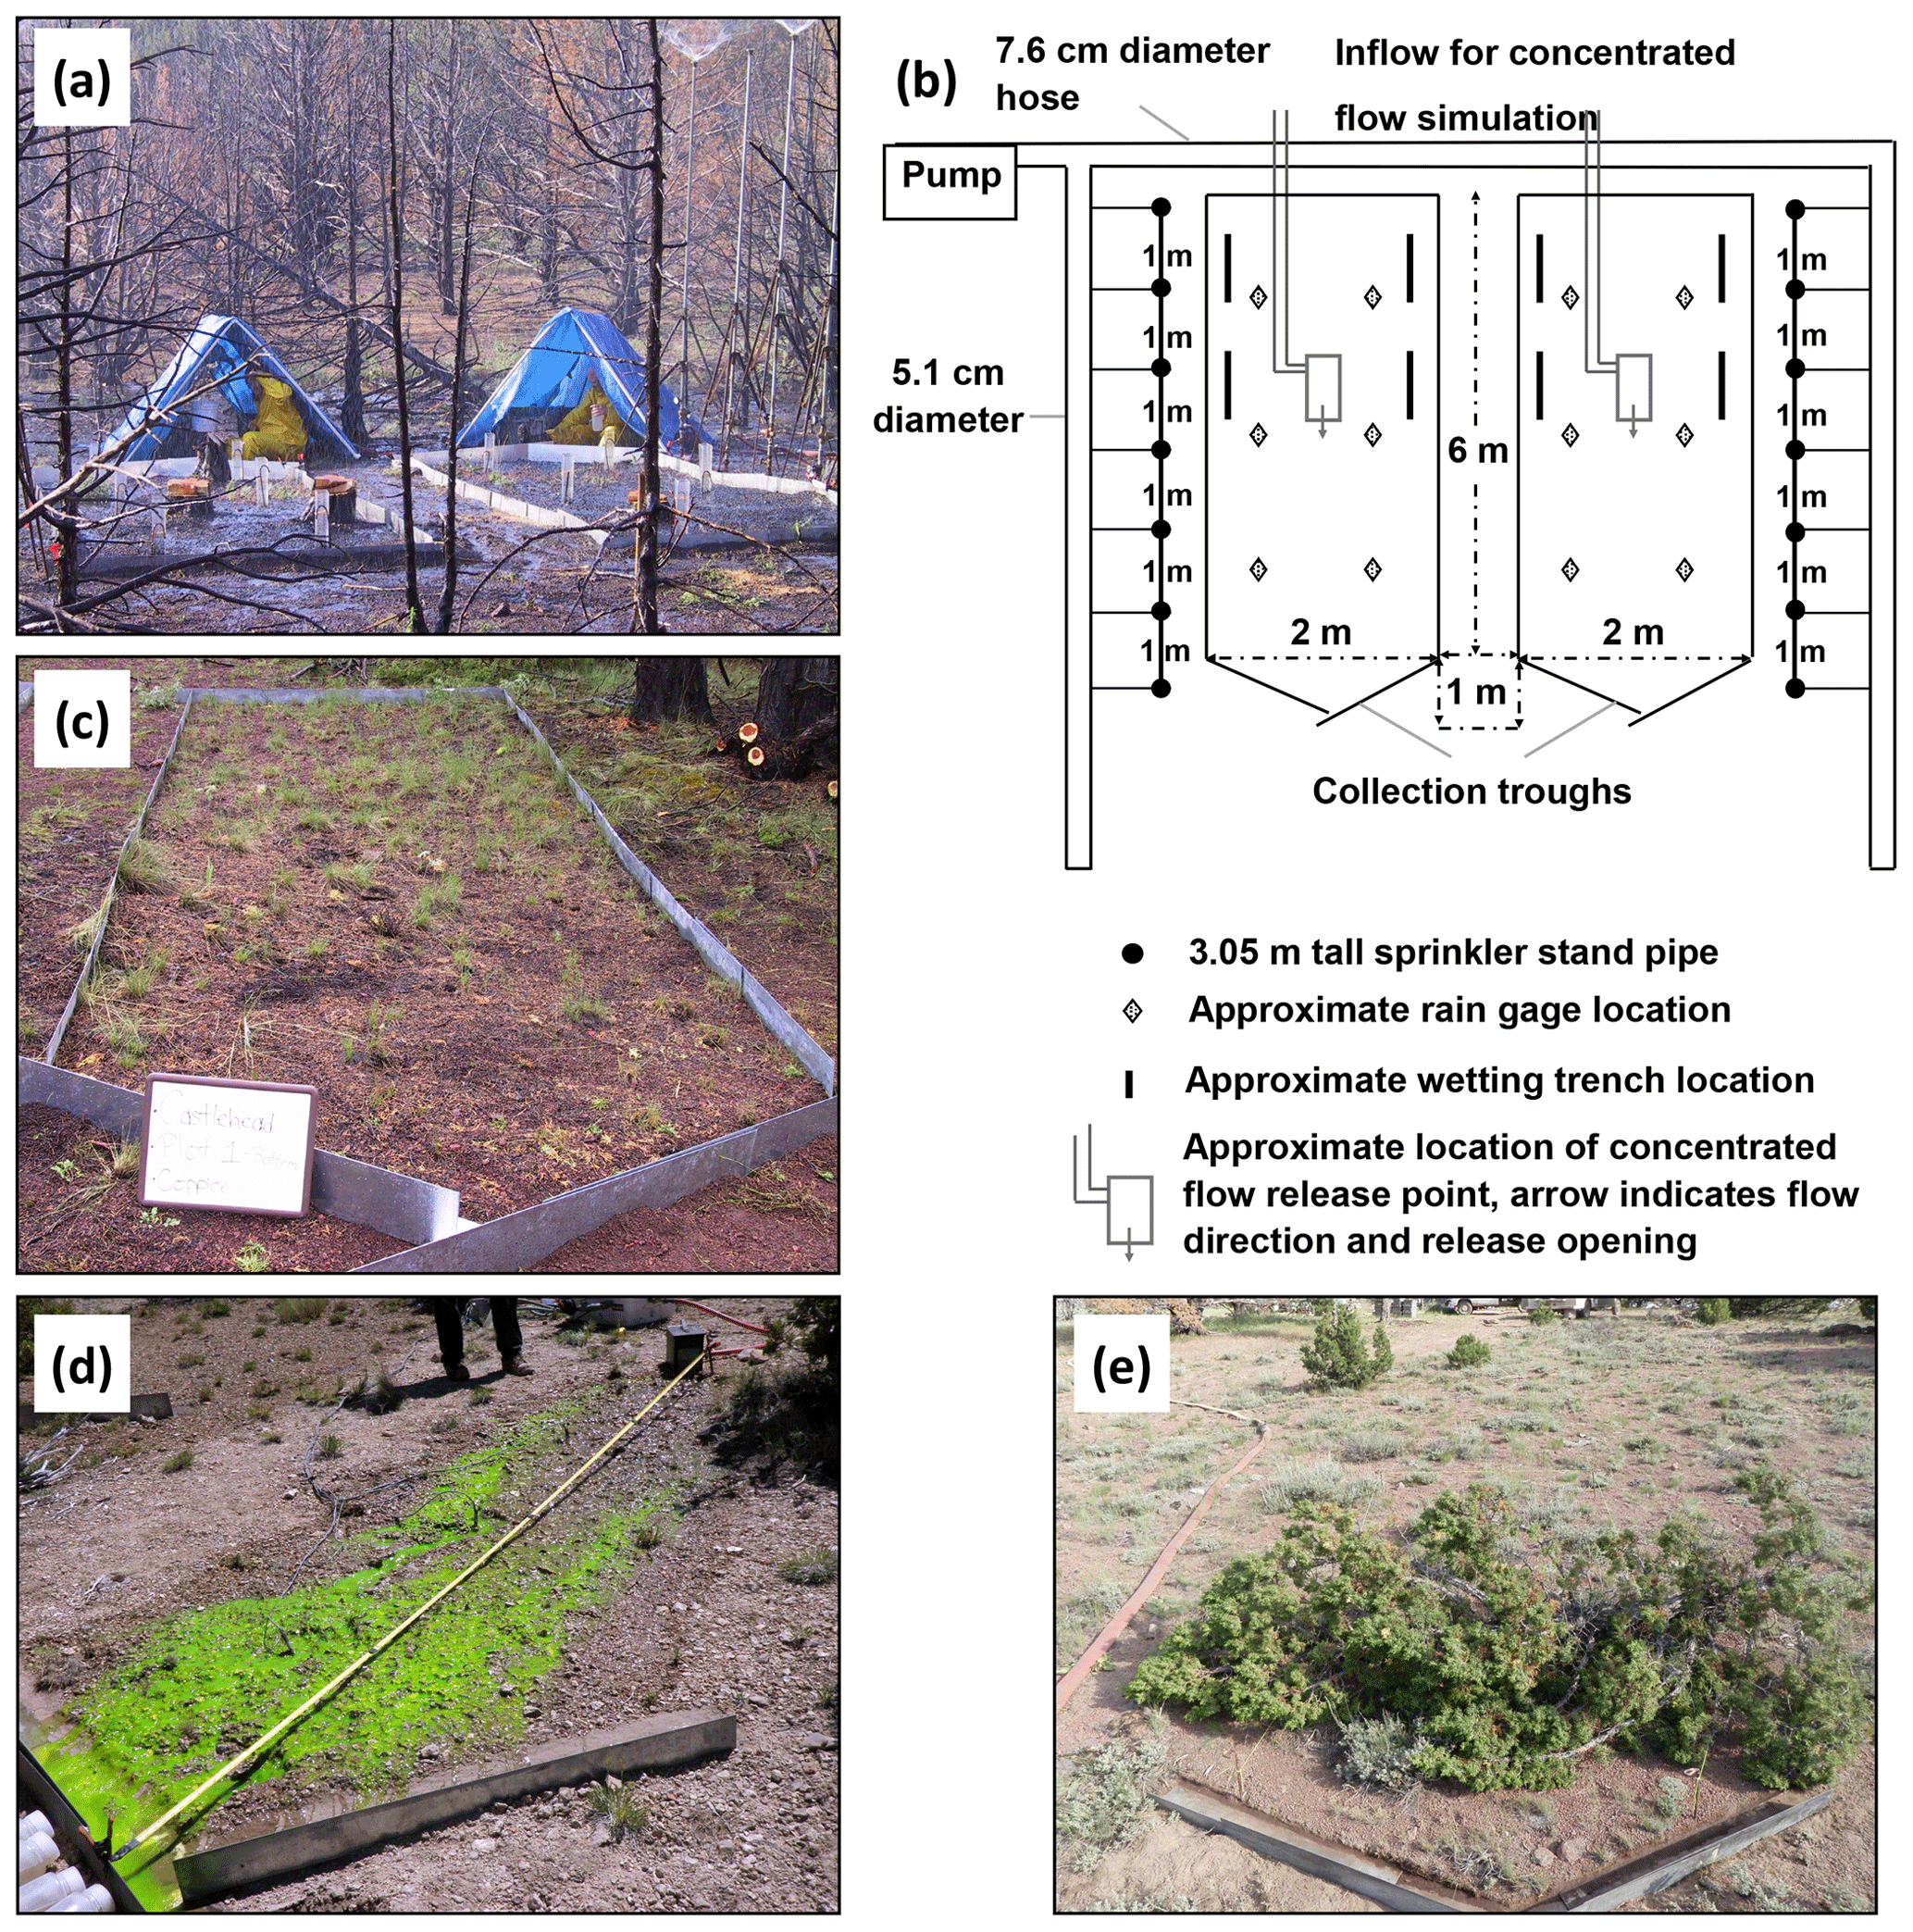
Figure 2Images showing paired large rainfall plots during rainfall simulations (a), experimental setup of paired large rainfall plot simulation experiments (b), a fully bordered large rainfall simulation plot on a tree coppice microsite (c), a borderless overland-flow simulation plot and experiment on an intercanopy (shrub–interspace) microsite (d), and a borderless overland-flow simulation plot with a cut, downed tree on an intercanopy microsite (e), all as respective examples as applied in this study.
A suite of biological and physical attributes at each site were measured at point, small rainfall plot (0.5 m2), overland-flow plot (∼9 m2), large rainfall plot (13 m2), and hillslope plot (990 m2) scales. Soil bulk density of the near surface (0–5 cm depth) was sampled as a point measure in interspace microsites between plants, shrub coppice microsites underneath shrub canopies, and tree coppice microsites underneath tree canopies. The bulk density sampling was conducted by the compliant cavity method within all treatment areas 1–2 years after respective treatments. Surface soil texture was quantified as a point measure using grab samples (0–2 cm depth) from interspace, shrub coppice, and tree coppice microsites within all treatment areas at Marking and Onaqui in 2006 prior to treatments and within unburned and burned treatment areas at Castlehead in 2008. Vegetation and ground cover were measured at small rainfall, large rainfall, and overland-flow plot scales and at the hillslope-scale pre- and posttreatment in all treatment areas at Marking Corral and Onaqui as well as in unburned and burned treatment areas at Castlehead. Vegetation and ground cover measures on rainfall simulation and overland-flow plots were used to evaluate resisting and driving forces on surface hydrology and erosion processes and to quantify treatment effects on cover components at those plot scales. Sampling of vegetation and ground cover on rainfall simulation and overland-flow plots in untreated areas (control and unburned) and treated areas varied by site and year as described in Table 2. Vegetation and ground cover measures at the hillslope scale (site characterization plots) were conducted to describe site level cover conditions prior to and over time after treatment. Site characterization plots were installed and sampled prior to treatment (2006) in all treatment areas at Marking Corral and Onaqui and were resampled 1 year (2007) and 9 years (2015) after treatment. Castlehead site characterization plots were installed and sampled in unburned and burned areas 1 year after the fire (2008) and were resampled the second year postfire (2009).
Rainfall simulations and overland-flow experiments were employed at the different plot scales to quantify specific scale-dependent runoff and erosion processes (Pierson et al., 2010; Williams et al., 2014a). Small-plot rainfall simulations (Fig. 1) were applied to quantify runoff and erosion by splash–sheet processes. Each small rainfall plot was installed, as described by Pierson et al. (2010) and Williams et al. (2014a), to occur on either a tree coppice, shrub coppice, or interspace microsite (Fig. 1b–e). Small plots at Marking Corral and Onaqui were installed and sampled in control and all other treatment areas in 2006 before application of the tree-removal treatments and were left in place for subsequent sampling 1 year (2007), 2 years (2008), and 9 years (2015) after treatment. Small plots at Castlehead were installed and sampled in unburned and burned areas 1 year after the fire (2008) and left in place for subsequent sampling the second year after fire (2009). Large-plot rainfall simulations (Fig. 2a–b) were used to quantify runoff and erosion from combined splash–sheet and concentrated overland-flow processes. Each plot was installed, as described by Pierson et al. (2010) and Williams et al. (2014a), on either a tree zone (tree coppice and area just outside tree canopy drip line) or a shrub–interspace zone (intercanopy area between tree canopies) inclusive of shrub coppice and interspace microsites (Fig. 2). Large plots at Marking Corral and Onaqui were installed and sampled in all treatment areas in 2006 immediately before treatment application (controls) and were extracted following sampling. New plots were installed and sampled in treatment areas at Marking Corral and Onaqui in 2007, 1 year posttreatment, and were then extracted. Large rainfall plots at Castlehead were installed and sampled in unburned and burned areas in 2008, 1 year after the fire, and were then extracted. Overland-flow simulations (Fig. 2d–e) were conducted on large rainfall plots (Fig. 2a–c) at Marking Corral and Onaqui in 2006 and 2007 immediately following respective rainfall simulations. Overland-flow simulations were conducted in control and treated areas at those sites in 2008 and 2015, but those plots were not subjected to rainfall simulation. Castlehead overland-flow simulations in 2008, 1 year postfire, were run on large rainfall simulation plots following rainfall simulations and, in 2009, 2 years postfire, were run on newly installed plots without rainfall simulations. Overland-flow experiments conducted on large rainfall simulation plots had borders on all sides and contained a collection trough for runoff measurement at the plot base (Fig. 2c; Pierson et al., 2010, 2013, 2015; Williams et al., 2014a). Overland-flow simulations run independent of rainfall-simulation experiments were conducted on borderless plots but contained a runoff collection trough at the downslope plot base (Fig. 2d–e; Pierson et al., 2013, 2015; Williams et al., 2014a, 2019a, 2020).
Table 3Select foliar cover and ground cover measures on hillslope-scale site characterization plots (990 m2) in cut and burned treatment areas at the Marking Corral and Onaqui sites 1 year prior to tree removal (2006) and 1 year (2007) and 9 years (2015) after tree-removal treatments.
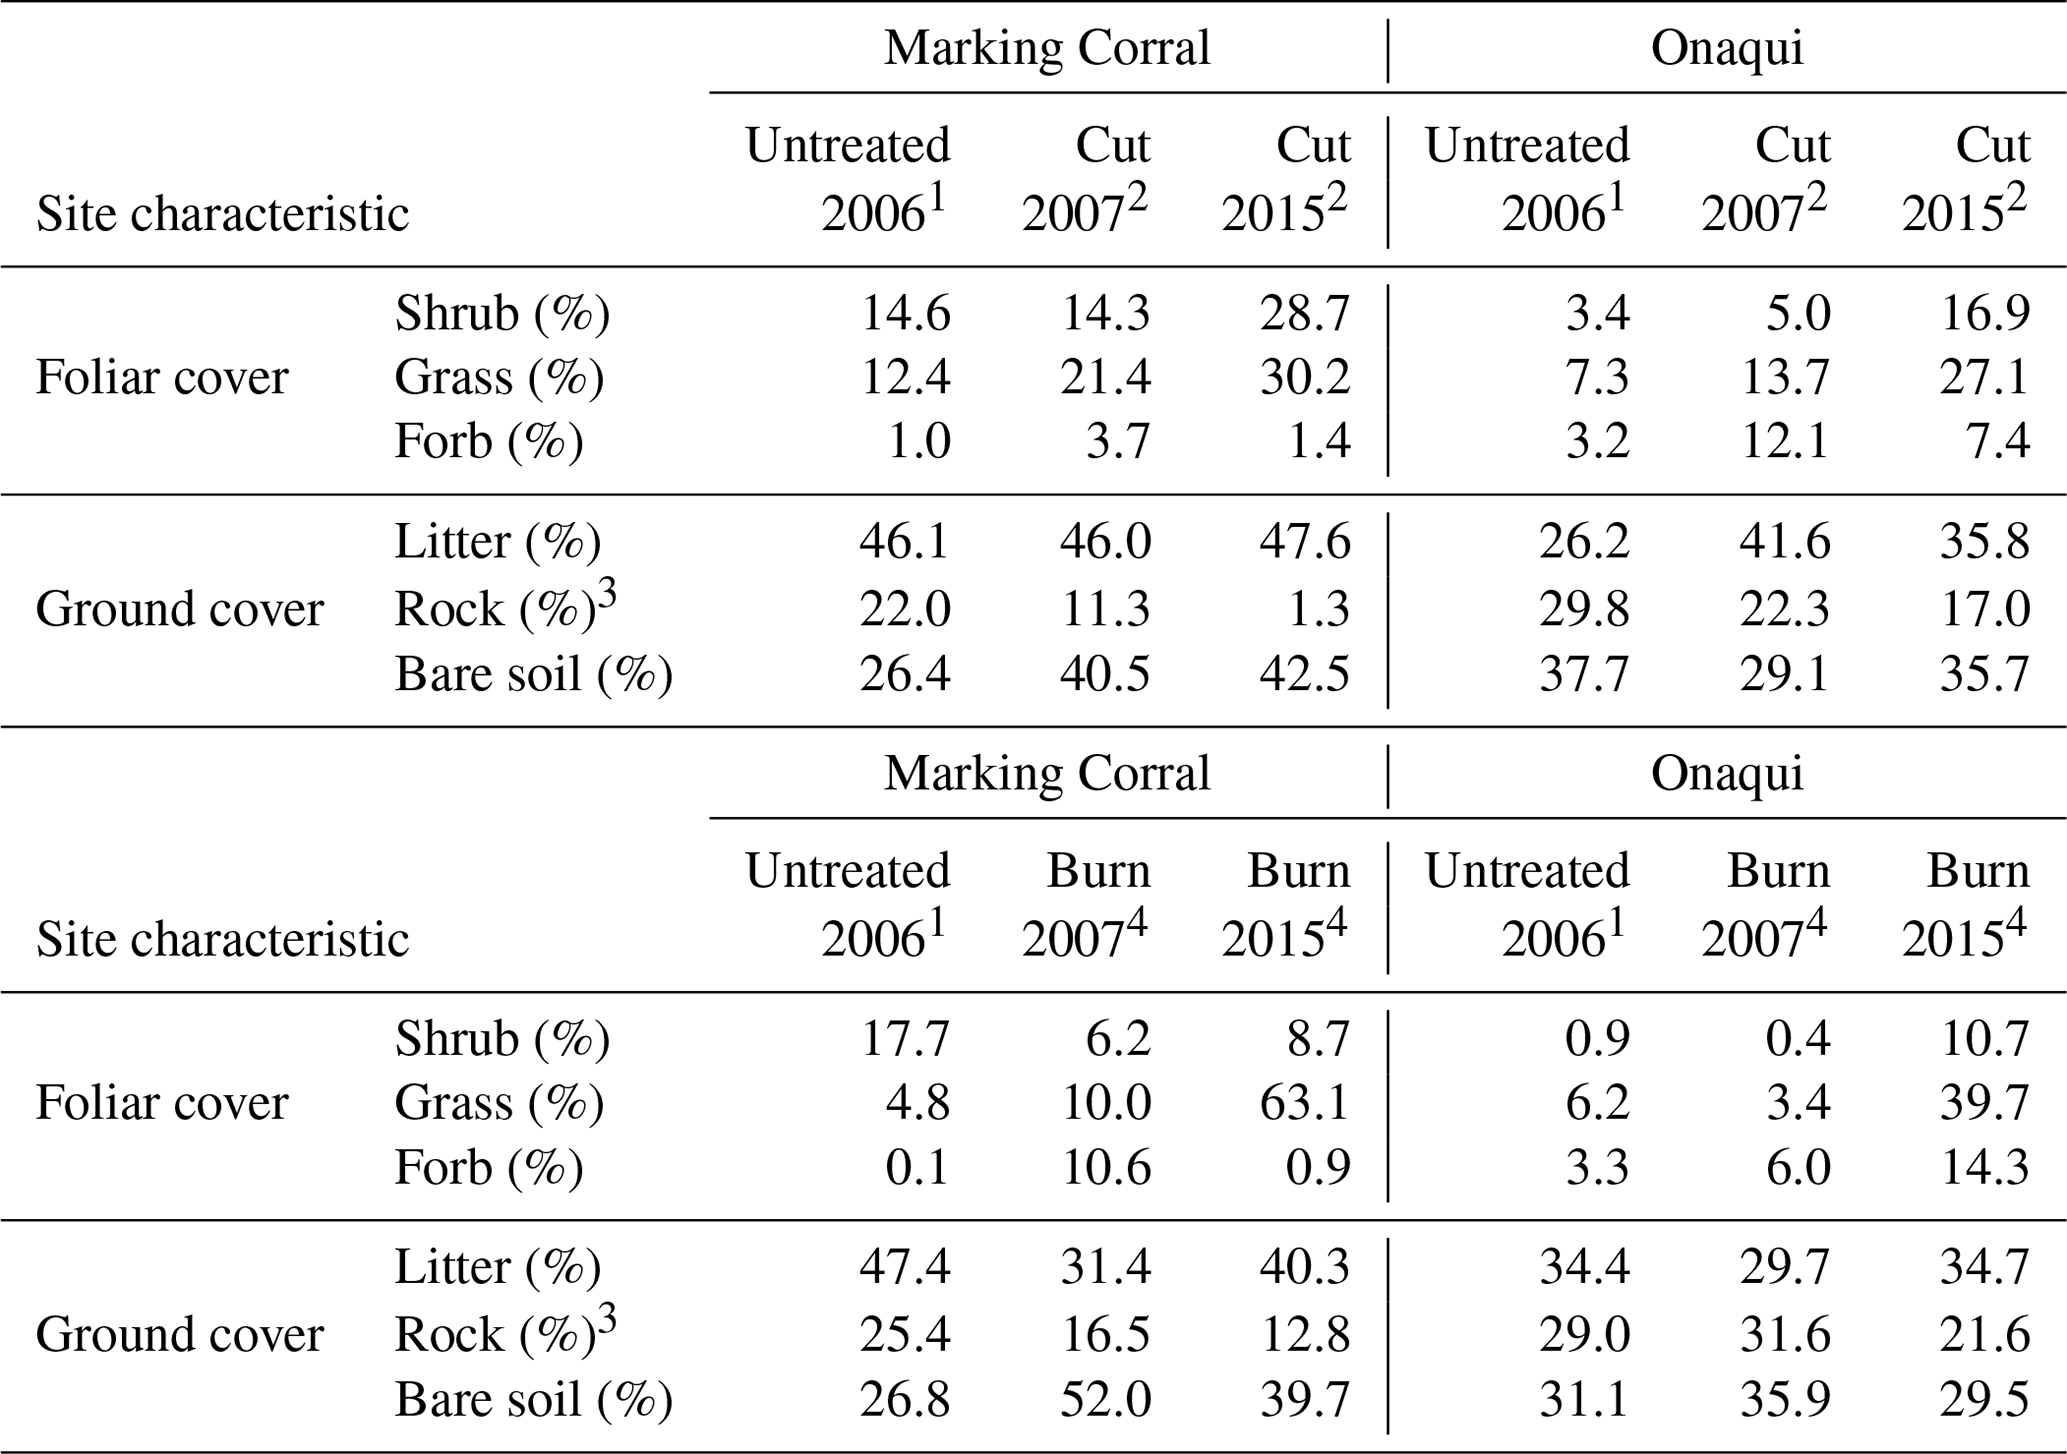
1 Data from Pierson et al. (2010) but restricted to plots in areas subsequently cut or burned at the respective site × treatment combination. 2 Data from Williams et al. (2019a). 3 Rock fragments >5 mm in diameter. 4 Data from Williams et al. (2020).
3.1 Hillslope-scale site characterization plots
Understory vegetation and ground cover and overstory tree cover at the hillslope scale at each site were sampled on 30 m×33 m site characterization plots using a suite of line–point and belt transect methods and various tree measures (see Pierson et al., 2010; Williams et al., 2014a). Foliar and ground cover on each site characterization plot were recorded for 60 points (50 cm spacing) along each of five line–point transects (30 m in length; spaced 5–8 m apart) for a total of 300 sample points per plot. Percent cover by each sampled cover type was derived for each plot as the number of respective cover-type hits divided by the total number of points sampled. Multiple canopy layers were possible, and therefore the total foliar cover across all sampled cover types potentially exceeded 100 %. The number of live tree seedlings of 5–50 cm height and shrubs exceeding 5 cm height were quantified along three belt transects on each plot. Each of the three belt transects on each plot were centered along a foliar/ground cover line–point transect, sized 2 m wide × 30 m long and spaced 6 m apart. Shrub and tree seedling densities were calculated for each plot as the total number of respective individuals tallied along the three belt transects divided by total belt transect area (180 m2). The number of live trees >0.5 m in height was quantified for each plot, and tree height and minimum and maximum crown diameters were measured for each live tree. A crown radius for each live tree was derived as one-half the average of measured minimum and maximum crown diameters. Individual tree crown area (tree cover) was calculated as equivalent to the area of a circle, derived with the respective crown radius. Total tree cover for each plot was quantified as the sum of measured tree cover values on the plot.
3.2 Small rainfall simulation plots and experiments
Foliar cover, ground cover, and ground surface roughness on all small rainfall plots were quantified using point frame methods explained in Pierson et al. (2010). Foliar and ground cover on each plot were sampled at 15 points spaced 5 cm apart along each of seven transects spaced 10 cm apart and oriented parallel to hillslope contour (105 sample points per plot). Percent cover for each cover type sampled on each plot was derived from the frequency of respective cover-type hits divided by the total number of points sampled. Multiple canopy layers were allowed, and therefore total foliar cover across all cover types potentially exceeded 100 %. A relative ground surface height at each sample point on each plot was determined by a metal ruler as the distance between the ground surface and a level line (top of point frame). Ground surface roughness for each plot was then derived as the mean of standard deviations of ground surface heights for each of the transects sampled on the respective plot. Litter depth on each plot was measured along the outside edge of the two plot borders located perpendicular to the hillslope contour. Measurements were made to the nearest 1 mm using a metal ruler at four evenly spaced points (15 cm apart) along the two plot borders. An average litter depth was derived for each plot as the average of the eight litter depth measures.
Soil water repellency of the mineral soil surface and at depths near the mineral soil surface (0–5 cm depths) was measured immediately adjacent (∼50 cm away) to each small rainfall plot immediately before rainfall simulation using the water drop penetration time (WDPT) method (see Pierson et al., 2010). Litter and ash cover were carefully removed from the mineral soil surface prior to application of the WDPT. Eight water drops (∼3 cm spacing) were then placed on the mineral soil surface, and the time required for infiltration of each drop was recorded up to a 300 s maximum. The WDPT was then repeated at 1 cm soil depth increments until 5 cm soil depth was reached. For each sampled depth, 1 cm of soil was excavated immediately underneath the previously sampled area, and the WDPT procedure was repeated with eight drops. A mean WDPT for each sampled soil depth on each plot was recorded as the average of the eight WDPT (s) samples at the respective depth. Soils were classified as wettable where mean WDPT <5 s, slightly water repellent where mean WDPT ranged from 5 to 60 s, and strongly water repellent where mean WDPT>60 s.
Surface soil moisture and aggregate stability were also sampled for each small rainfall plot prior to rainfall simulations. Soil samples were collected at 0–5 cm depth immediately adjacent to each small rainfall plot and were subsequently analyzed in the laboratory for gravimetric soil water content. Some samples were excluded from the dataset due to poor sealing of soil cans in the field. Aggregate stability of the surface soil on each plot was determined using a modified sieve test on six soil peds approximately 2–3 mm thick and 6–8 mm in diameter (see Pierson et al., 2010). Each soil ped sampled on each plot was assigned to one of the following classes, as defined by Herrick et al. (2005): (1) <10 % stable aggregates, 50 % structural integrity lost within 5 s; (2) <10 % stable aggregates, 50 % structural integrity lost within 5–30 s; (3) <10 % stable aggregates, 50 % structural integrity lost within 30–300 s; (4) 10 %–25 % stable aggregates; (5) 25 %–75 % stable aggregates; or (6) 75 %–100 % stable aggregates. An average aggregate stability was derived for each plot as the arithmetic mean of the classes assigned to the six aggregate samples for the respective plot.
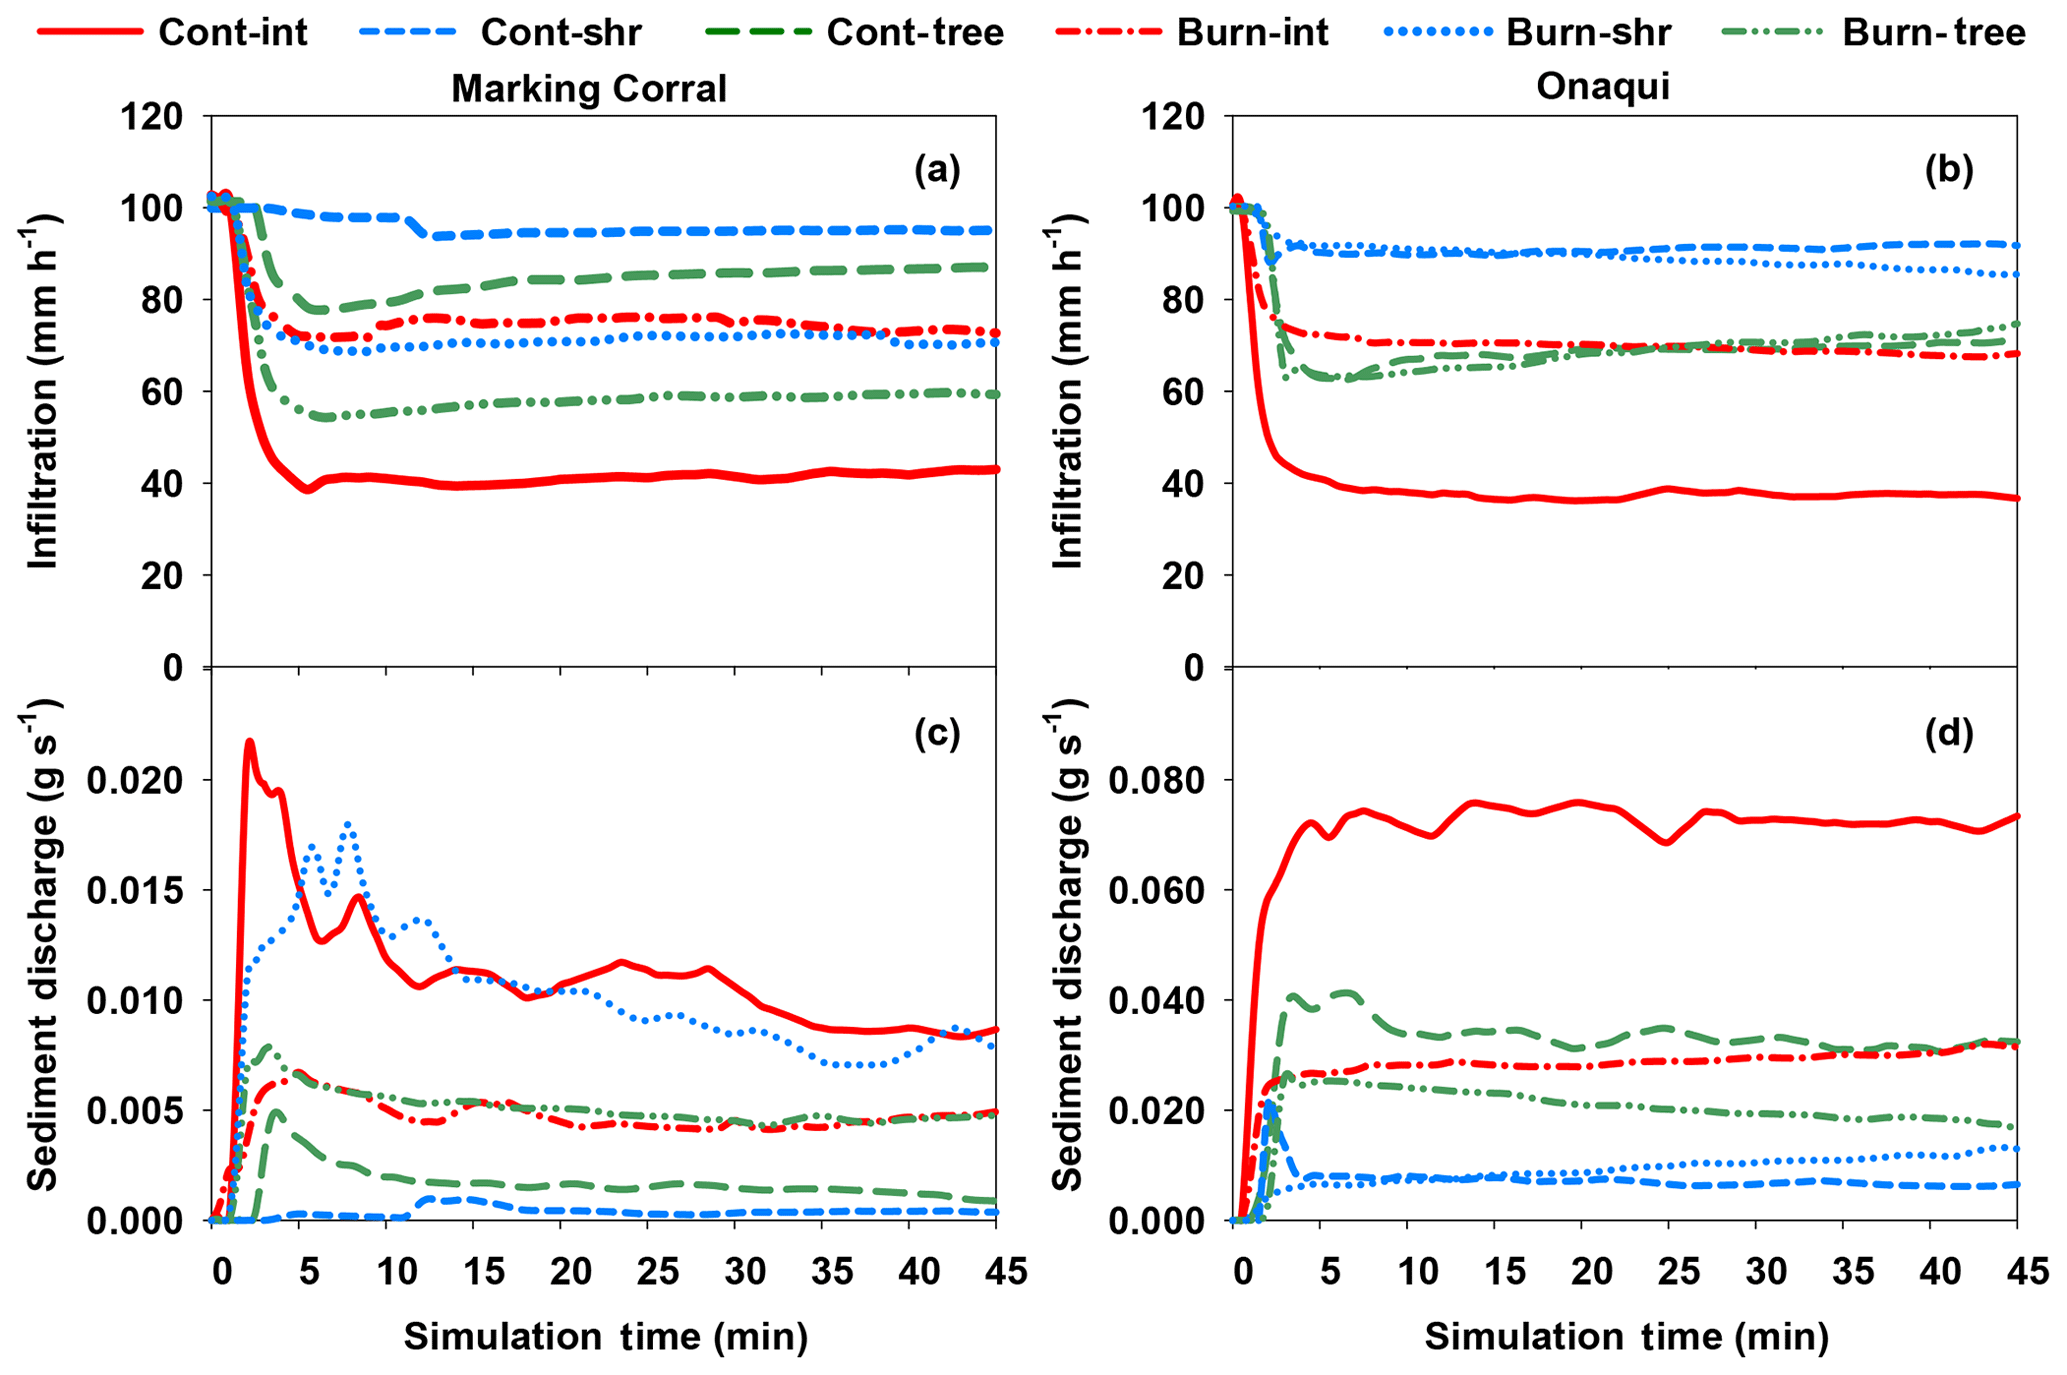
Figure 3Example infiltration (a: Marking Corral; b: Onaqui), calculated as applied rainfall minus measured runoff, and sediment discharge (c: Marking Corral; d: Onaqui) time series data generated from a subset of the small-plot rainfall simulation dataset. Example subdataset is from wet-run rainfall simulations in untreated (cont) and burned (burn) interspace (int), shrub coppice (shr), and tree coppice (tree) microsites at the Marking Corral and Onaqui study sites 9 years following prescribed fire. The data illustrate the long-term impacts of burning and associated changes in surface conditions on infiltration and sediment discharge. Figure modified from Williams et al. (2020).
Rainfall was applied to small rainfall plots at approximate intensities of 64 mm h−1 (dry run) and 102 mm h−1 (wet run) for 45 min as explained in Pierson et al. (2010). The dry run was applied to dry antecedent soil conditions, and the wet run was applied to wet soil conditions, ∼30 min after the dry run. Rainfall was applied to small rainfall plots by a Meyer and Harmon-type portable oscillating-arm rainfall simulator fitted with 80–100 Veejet nozzles (Fig. 1a; Meyer and Harmon, 1979; Pierson et al. 2010, 2013, 2014; Williams et al., 2014a, 2019a, 2020). The applied rainfall kinetic energy (200 kJ ha−1 mm−1) and raindrop size (2 mm) were within approximately 70 kJ ha−1 mm−1 and 1 mm respectively of values reported for natural convective rainfall (Meyer and Harmon, 1979). Rainfall amount applied to each plot during rainfall simulation was estimated by integrating a pan catch of a 5 min calibration run prior to each rainfall simulation plot run. Total rainfall amount was estimated on plots where debris and/or vegetation prevented placement of calibration pans. In such cases, the estimated rainfall amount was derived as the average of all calibration runs for the respective simulation date. Timed plot runoff samples were collected at 1–3 min intervals throughout each 45 min rainfall simulation and were subsequently analyzed in the laboratory for runoff volume and sediment concentration. Cumulative runoff and sediment amounts were obtained for each runoff sample by weighing the sample before and after drying at 105 ∘C (Pierson et al., 2010). Runoff samples were not filtered at any stage of laboratory processing. A mean runoff rate (mm h−1 and L min−1) was derived for each sample interval as the interval runoff divided by the interval time. Sediment discharge (g s−1) for each sample interval was calculated as the cumulative sediment for the sample interval divided by the interval time. Sediment concentration for each sample interval was obtained by dividing cumulative sediment by cumulative runoff (g L−1). Some field samples were discarded from the final dataset because of laboratory errors or various issues noted on field data sheets (e.g., spillage and bottle overrun).
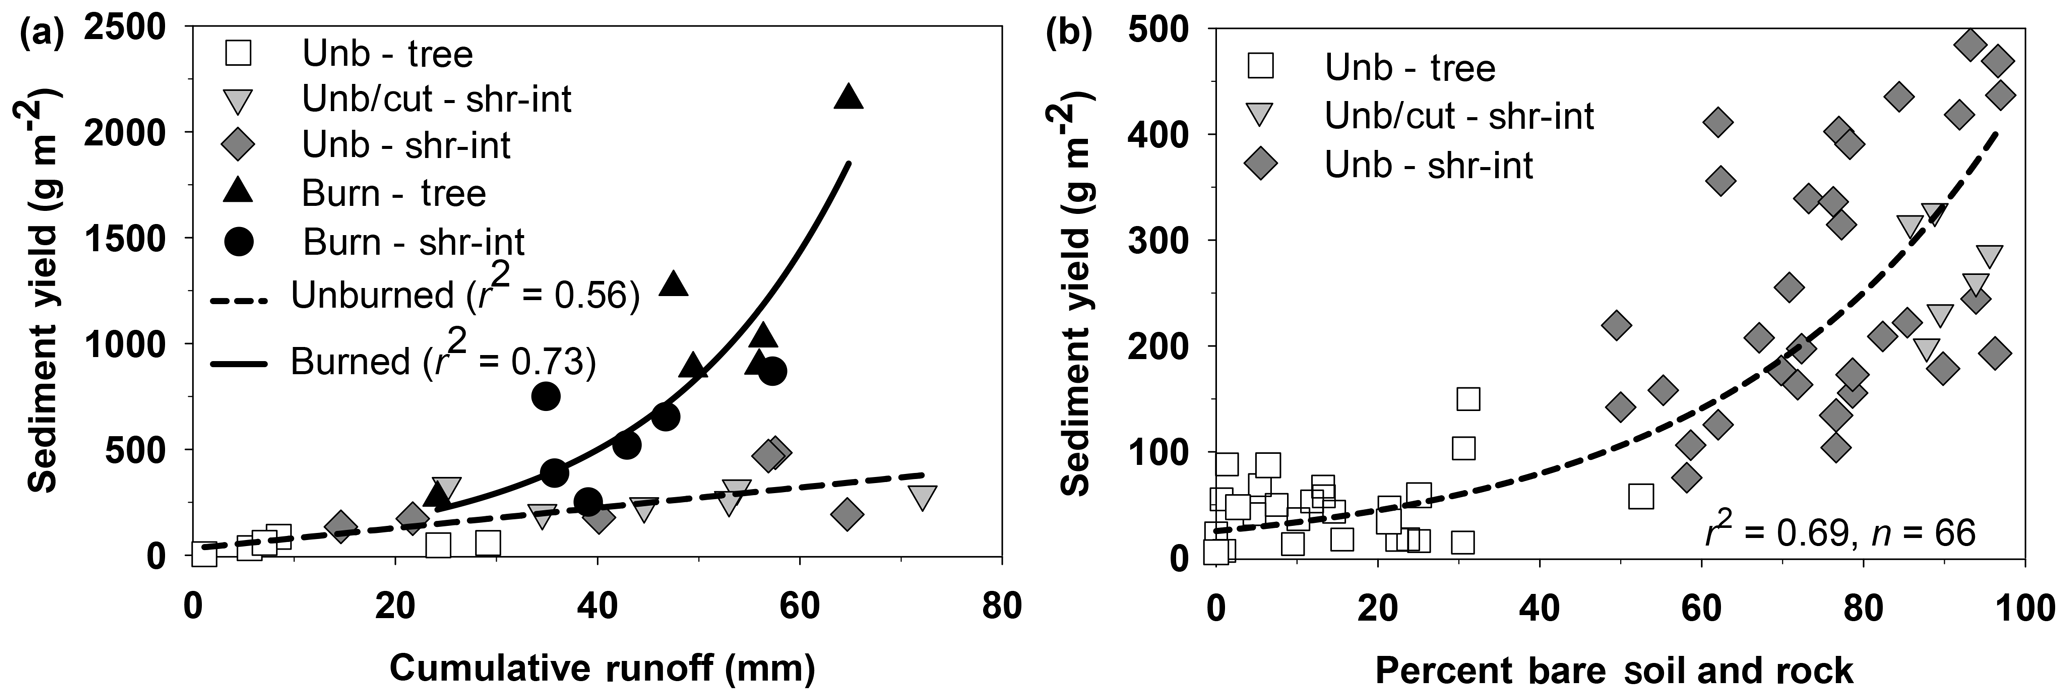
Figure 4Example relationships/correlations in large rainfall plot cumulative runoff and sediment yield for unburned (untreated (unb) and cut (cut) treatments) and burned (burn) tree (tree) and intercanopy (shrub–interspace, shr-int) plots at the Castlehead site (a) and bare ground (bare soil plus rock cover) and sediment yield for unburned (unb) and cut treatment (cut) tree and intercanopy plots across all study sites (Castlehead, Marking Corral, and Onaqui) (b). The relationship in runoff and sediment yield (a) demonstrates the initial (1 year) impact of burning on sediment availability and elevated sediment delivery (for tree coppices in this study) as commonly reported in fire studies (Pierson and Williams, 2016). The relationship in bare ground and sediment yield (b) shows the typical increase in sediment yield where bare ground exceeds 50 %–60 % as commonly reported for rangelands (Pierson et al., 2008, 2009; Williams et al., 2014b). Figures modified from Pierson et al. (2013) and Williams et al. (2014a).
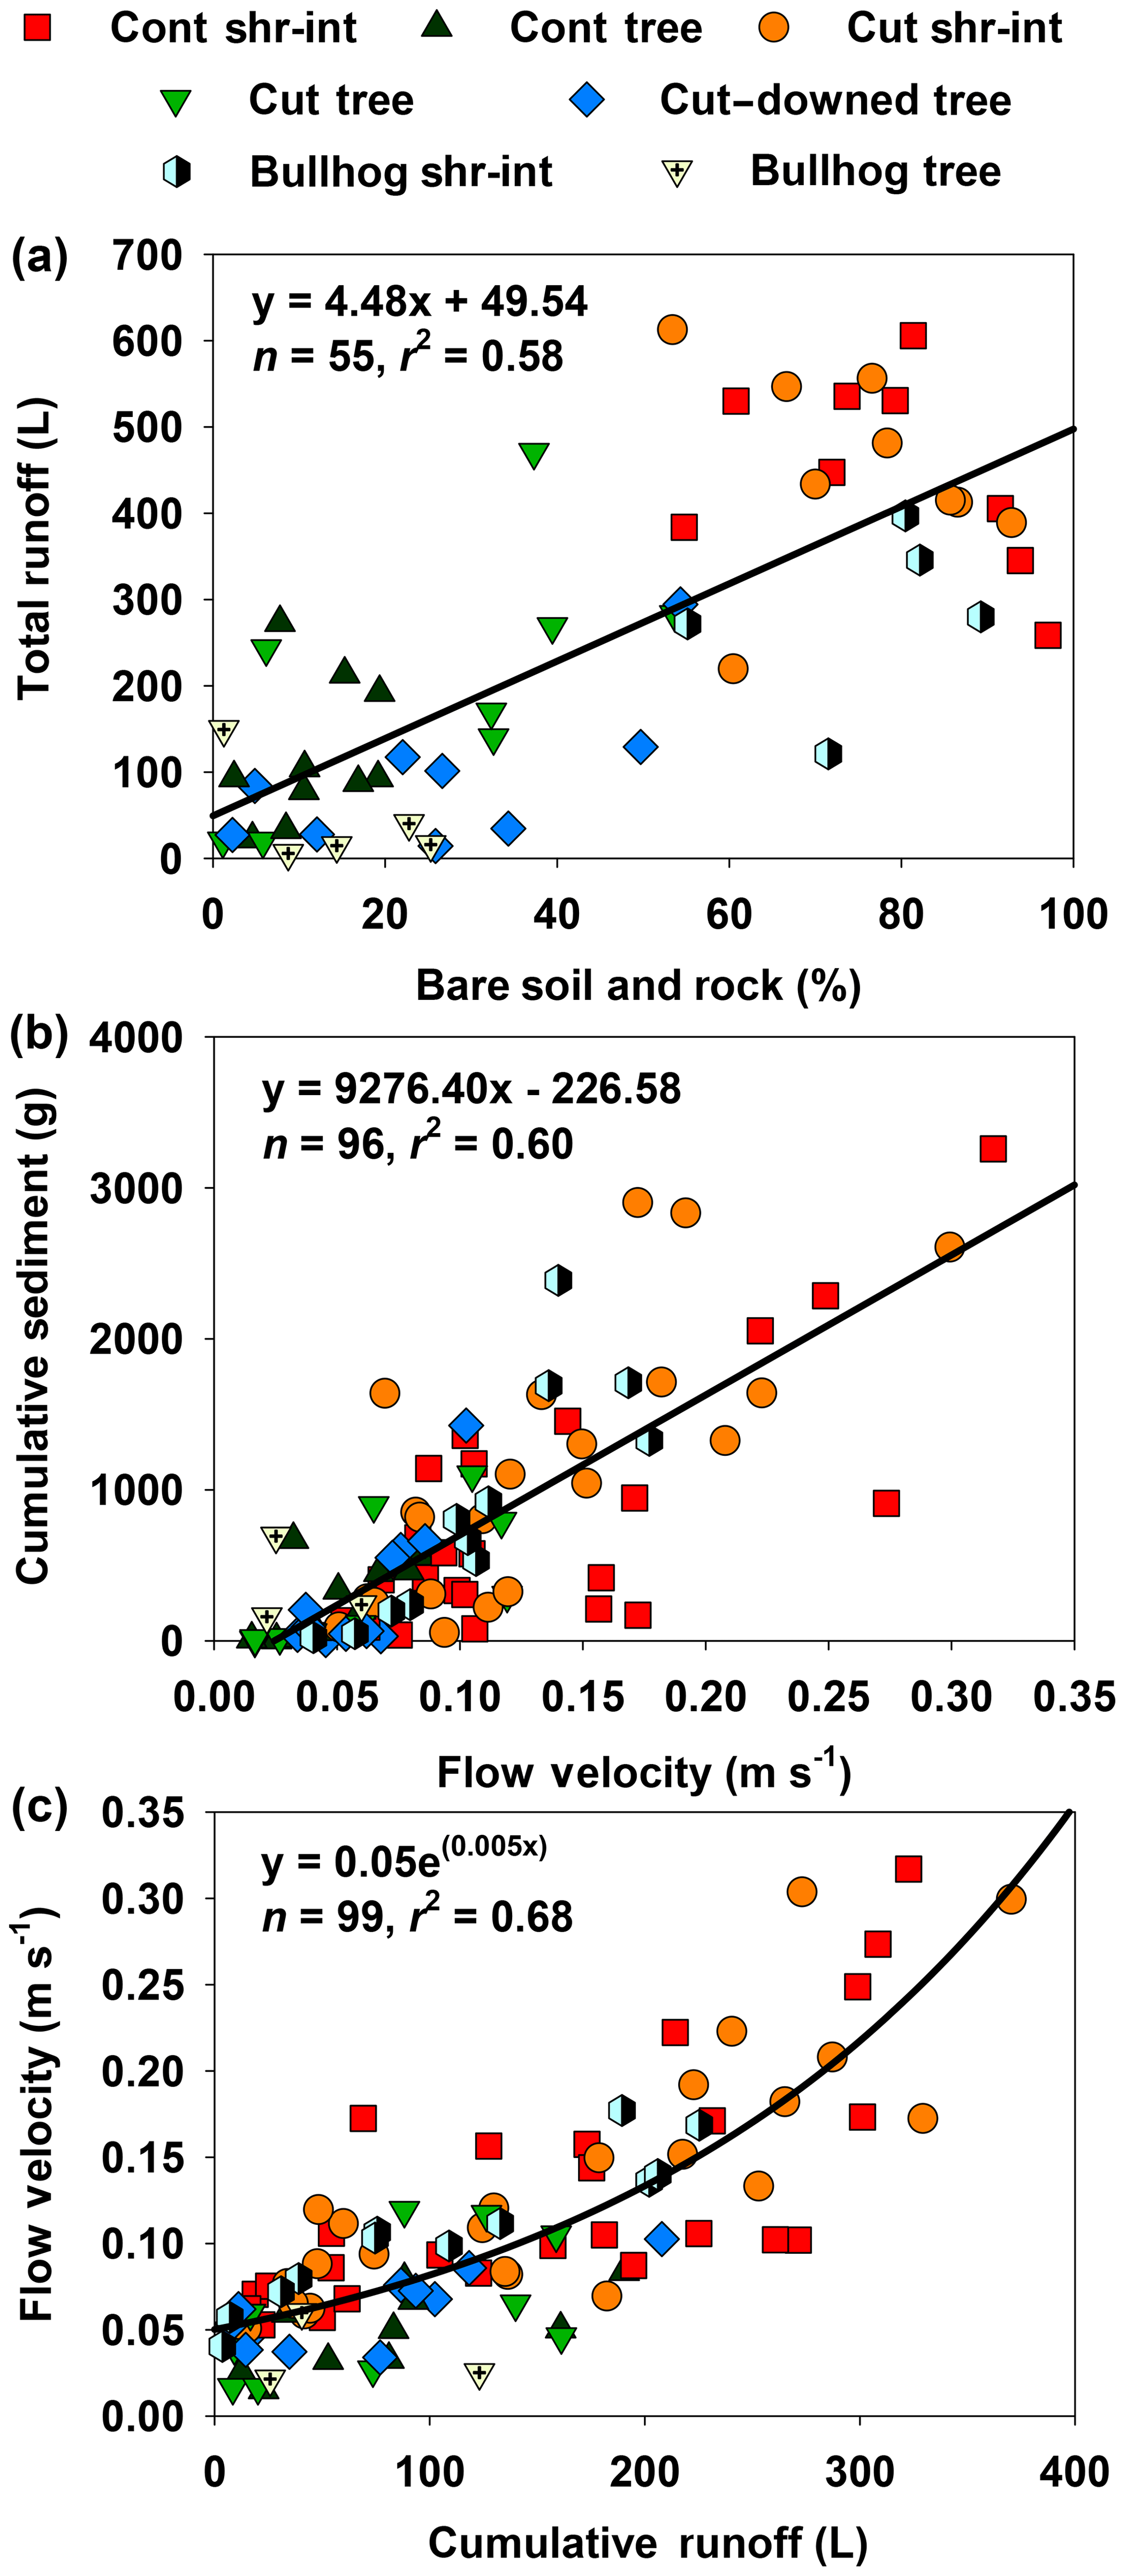
Figure 5Example relationships/correlations in runoff and bare ground (bare soil plus rock cover) (a), cumulative sediment and overland-flow velocity (b), and overland-flow velocity and runoff (c) derived from a subset of the overland-flow dataset for the Marking Corral and Onaqui sites, as presented in Williams et al. (2019a). Data from overland-flow simulations on untreated/control (cont) plots, cut treatment (cut) plots without and with a cut, downed tree (cut–downed tree), and bullhog plots (bullhog, Onaqui site only) in tree (tree) and intercanopy (shrub–interspace, shr-int) microsites 9 years after respective tree-removal treatments. The data demonstrate that, for the studied conditions, runoff is largely regulated by bare ground, sediment delivery is controlled by flow velocity, and flow velocity is strongly correlated with the amount or runoff.
3.3 Large rainfall simulation plots and experiments
Vegetation and ground cover were measured on large rainfall simulation plots using line–point methods as described by Pierson et al. (2010) and Williams et al. (2014a). Foliar cover and ground cover on large rainfall plots were recorded for 59 points with 10 cm spacing along each of five transects (6 m long, spaced 40 cm apart) oriented perpendicular to the hillslope contour, with 295 sample points per plot. The percentage cover by each sampled cover type for each plot was derived as the number of point contacts or hits for each respective life-form divided by the total number of points sampled on the respective plot. Multiple canopy layers were allowed, and therefore total foliar cover across all sampled cover types potentially exceeded 100 %. Cut trees placed on a subset of rainfall simulation plots (see experimental design above) were excluded from foliar and ground cover measurements. However, various attributes of downed trees (e.g., length (height) and crown width) were measured and are reported. Ground surface roughness for each plot was calculated as the average of the standard deviations of ground surface heights measured across the line–point cover transects. The relative ground surface height at each sample point was calculated as the distance between a survey transit level line above the point and the ground surface. Distances in excess of 20 cm between plant canopies (canopy gaps) and plant bases (basal gaps) were measured along each of the line–point transects on each plot. Average canopy and basal gap sizes were calculated for each plot as the mean of all respective gaps measured in excess of 20 cm. Additionally, maximum canopy and basal gap sizes were calculated for each plot as the maximum of all respective gaps measured in excess of 20 cm. Percentages of canopy gaps and basal gaps representing 50 cm incremental gap classes (i.e., 51–100, 101–150 cm, etc.) were derived for each transect and averaged across the transects on each plot to determine gap-class plot means.
Rainfall was applied to pairs of large rainfall plots (Fig. 2a–b) at the same dry-run and wet-run target rates and sequence and durations as described above for small rainfall plots (Pierson et al., 2010; Williams et al., 2014a). Each paired rainfall simulation was run with a Colorado State University (CSU)-type rainfall simulator (Fig. 2a–b; Holland, 1969). The CSU-type design delivers rainfall energy at approximately 70 % of that for a natural convective rainfall event and produces rainfall drop diameters within approximately 1 mm of natural rainfall (Holland, 1969; Neff, 1979). The applied simulator design consists of seven stationary sprinklers evenly spaced along each of the outermost borders of the respective rainfall plot pair, with each sprinkler elevated 3.05 m above the ground surface. Total rainfall applied to large rainfall plots was quantified from the average of six plastic rainfall depth gages organized in a uniform grid within each plot. Runoff from direct rainfall on the large-plot collection troughs (trough catch, Fig. 2b) was quantified by sampling collection trough runoff before plot-generated runoff occurred. Once plot runoff occurred, timed samples of runoff were collected at 1–3 min intervals throughout each 45 min simulation run and were subsequently analyzed in the laboratory for runoff volume and sediment concentration as with small-plot rainfall simulation runoff samples. Sample weights were adjusted to appropriately account for trough catch, as described by Pierson et al. (2010). Some field samples were discarded from the final dataset because of laboratory errors or various issues noted on field data sheets (e.g., spillage and bottle overrun). Runoff and erosion rates were determined consistent with methods for small-plot rainfall simulations.
Table 4Soil texture and bulk density variables and data structure for those measures for all study sites. Abbreviations in the table example are as follows: juniper_cop refers to juniper coppice microsites, shrub_cop refers to shrub coppice microsites, and pinyon_cop refers to pinyon coppice microsites.
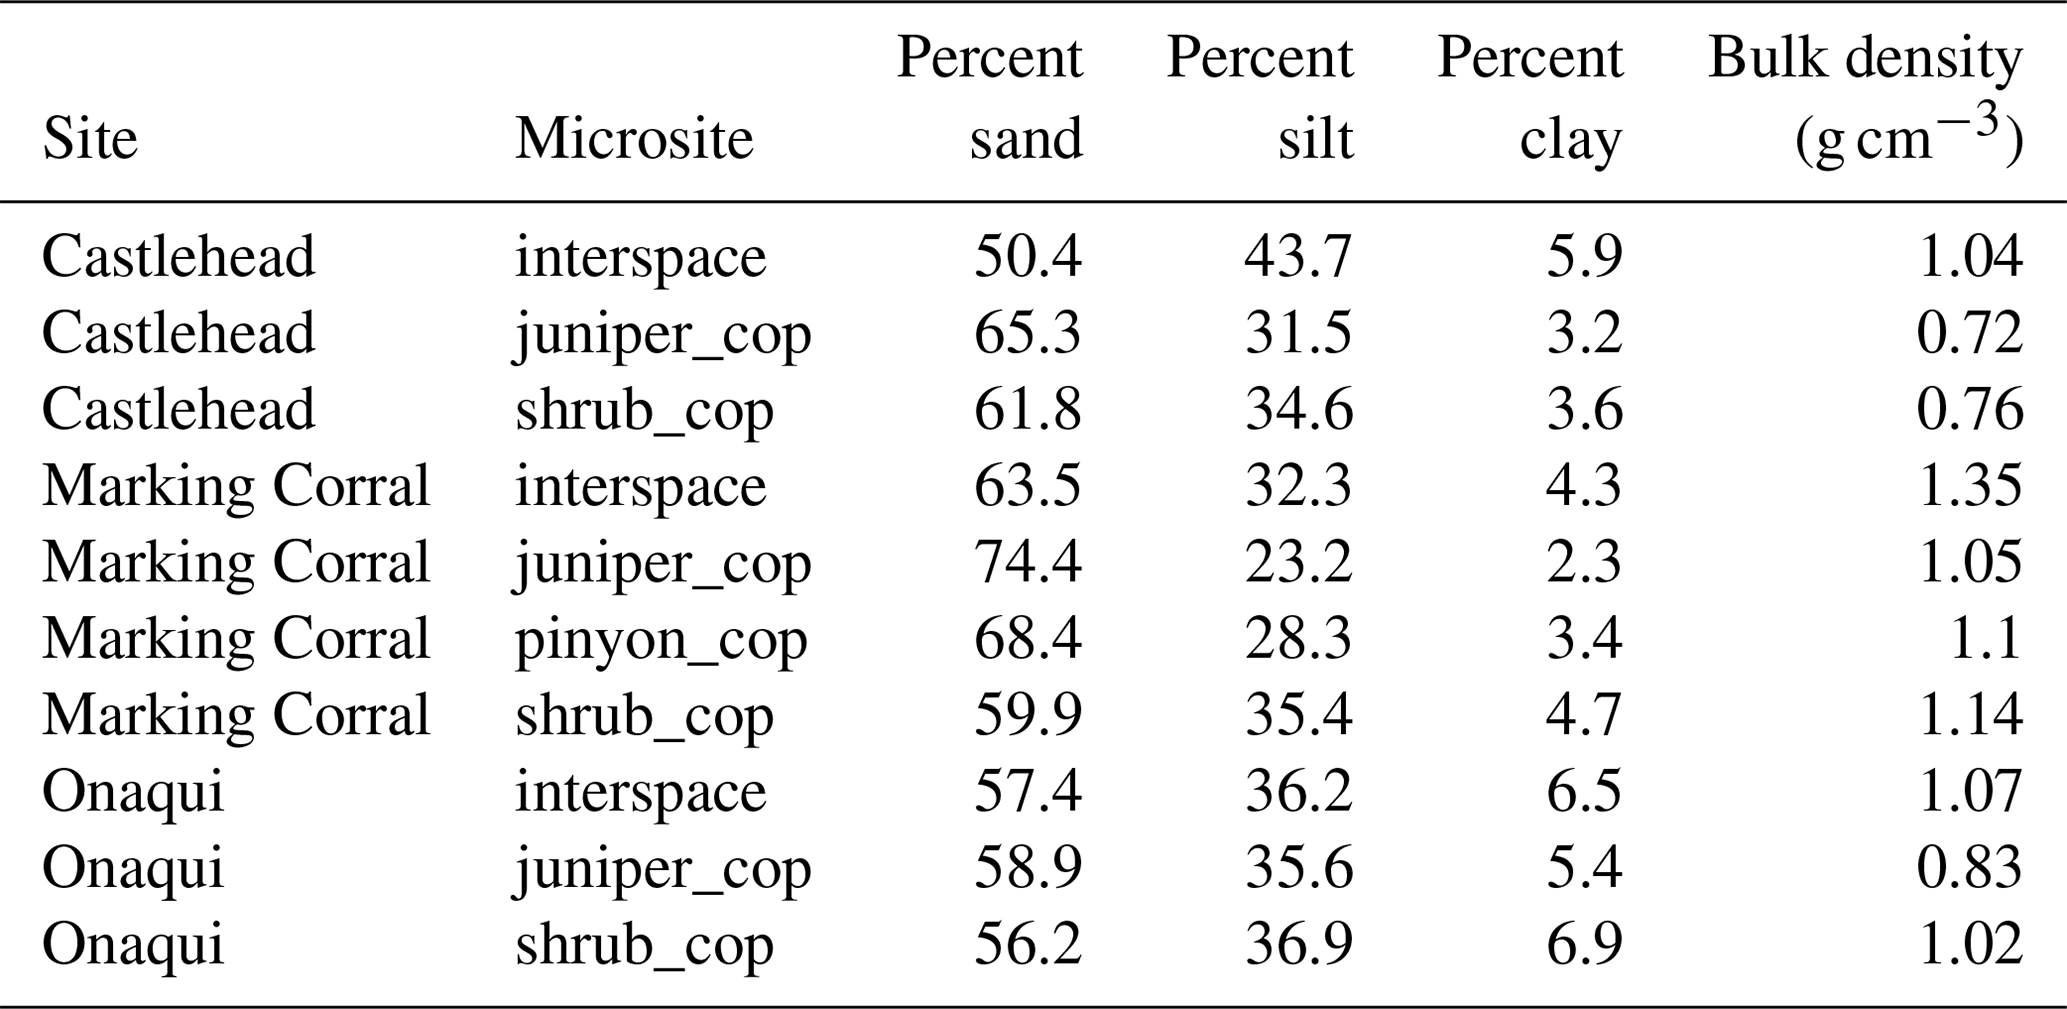
Table 5Example (subset) of vegetation and ground cover variables and data structure for measures on hillslope-scale site characterization plots (990 m2) at the study sites. Abbreviations in the table example are as follows: Fol. Cvr. refers to foliar cover, and JUOC refers to western juniper (Juniperus occidentalis Hook.).
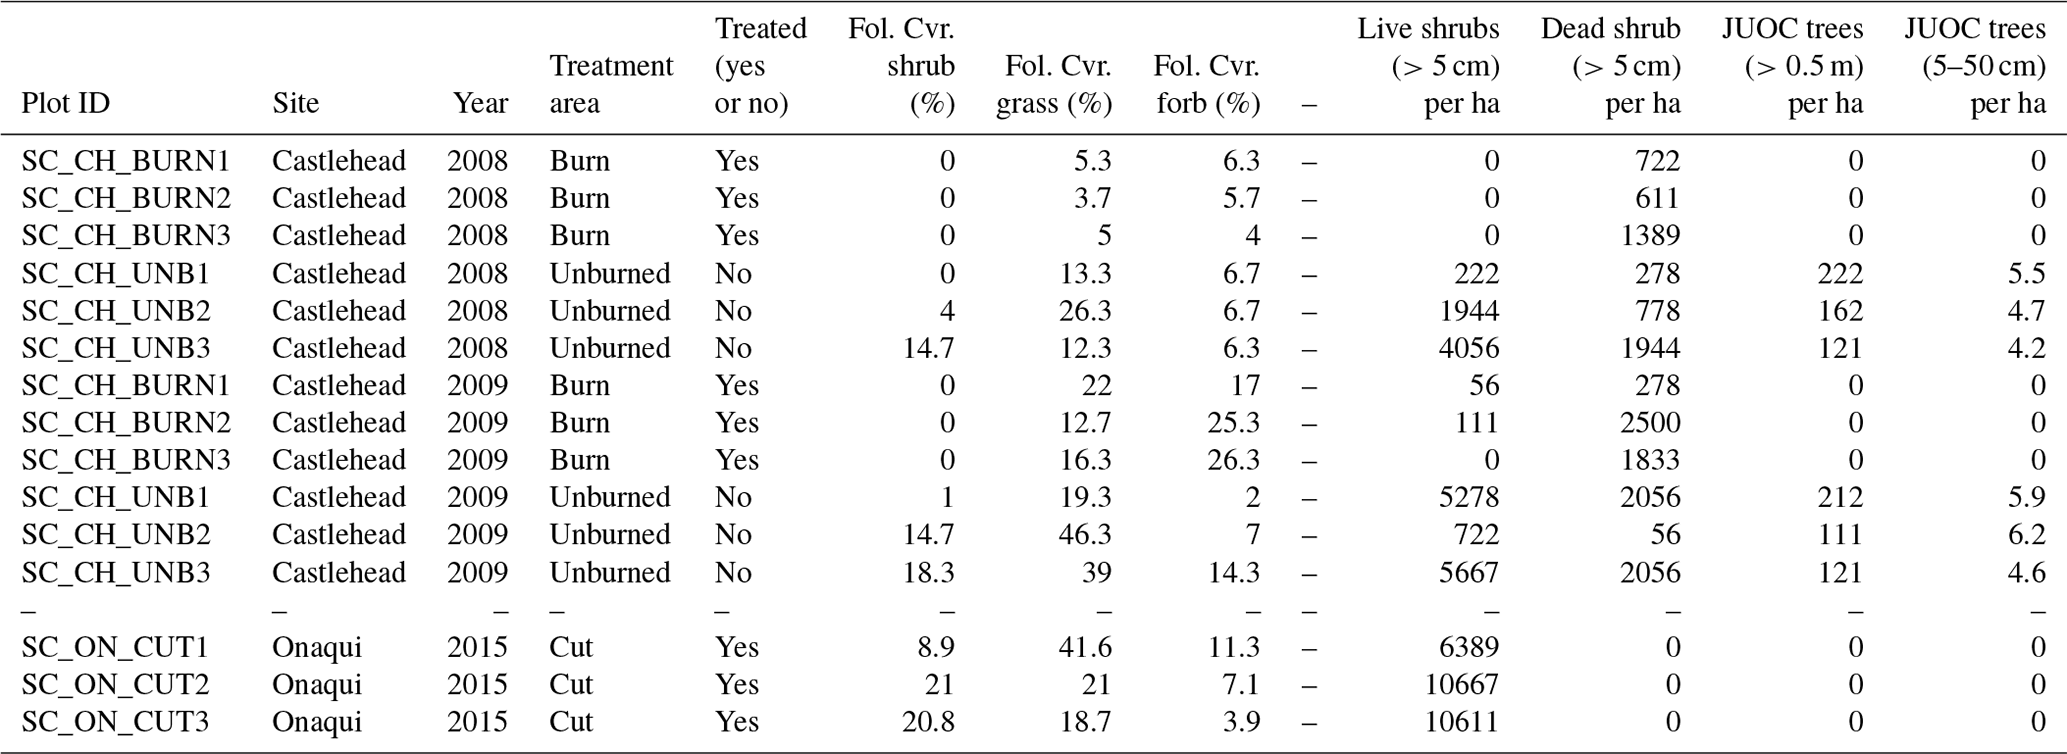
Table 6Example (subset) of rainfall simulation, vegetation, ground cover, and soil variables and data structure for measures on small rainfall simulation plots (0.5 m2) at the study sites. Abbreviations in the table example are as follows: Fol. Cvr. refers to foliar cover, Grd. Cvr. refers to ground cover, WDPT refers to water drop penetration time, shrub_cop refers to shrub coppice microsites, pinyon_cop refers to pinyon coppice microsites, and juniper_cop refers to juniper coppice microsites.
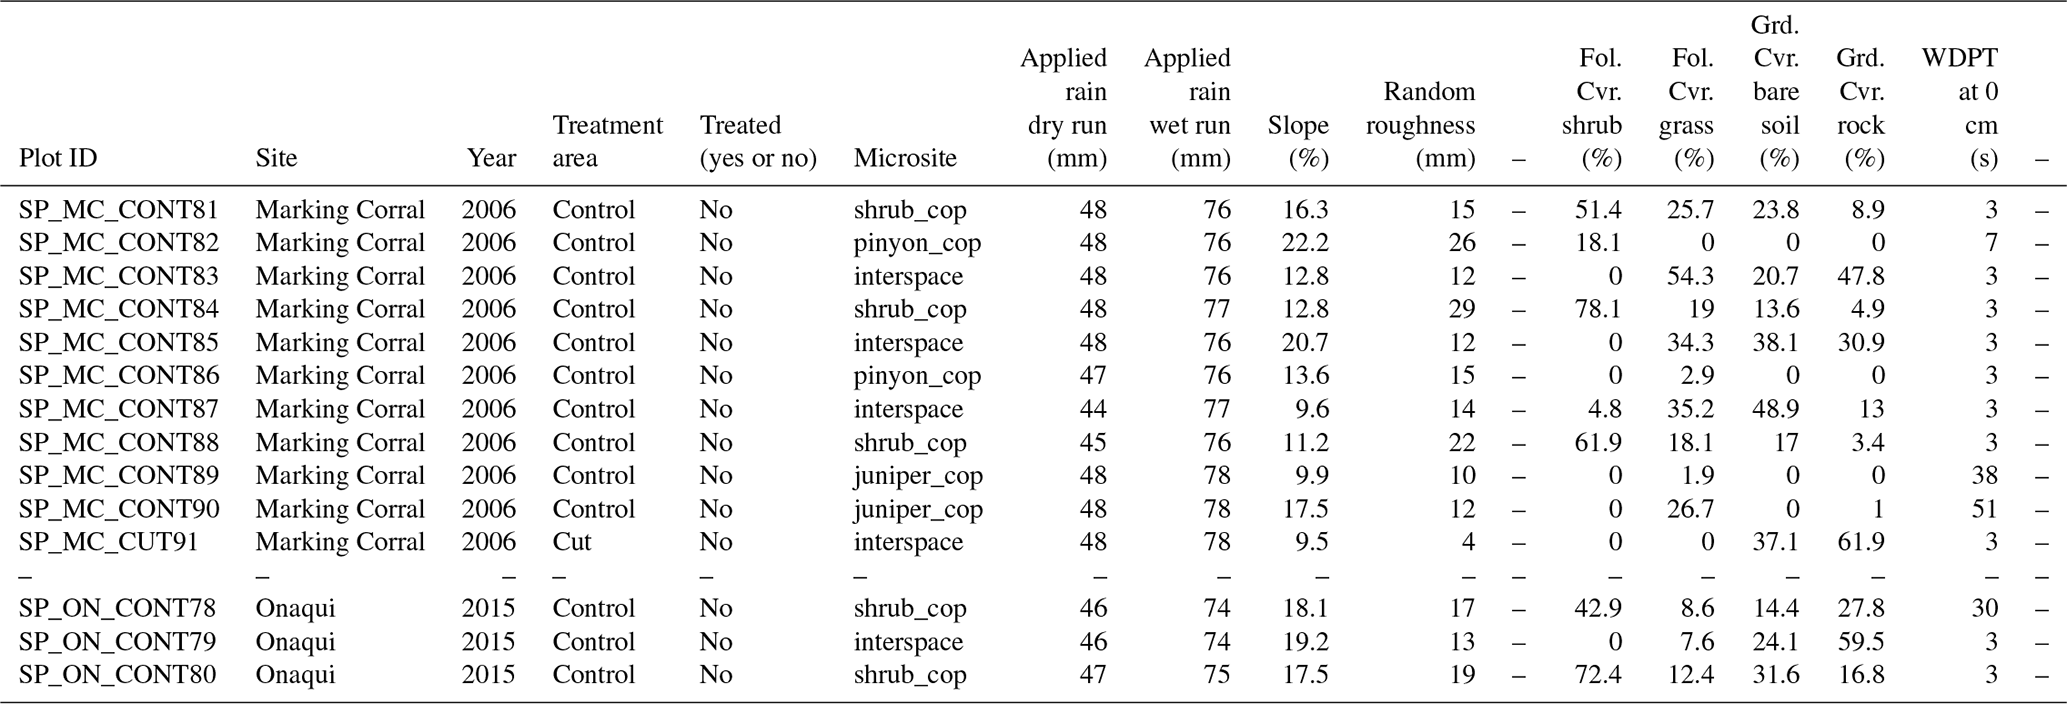
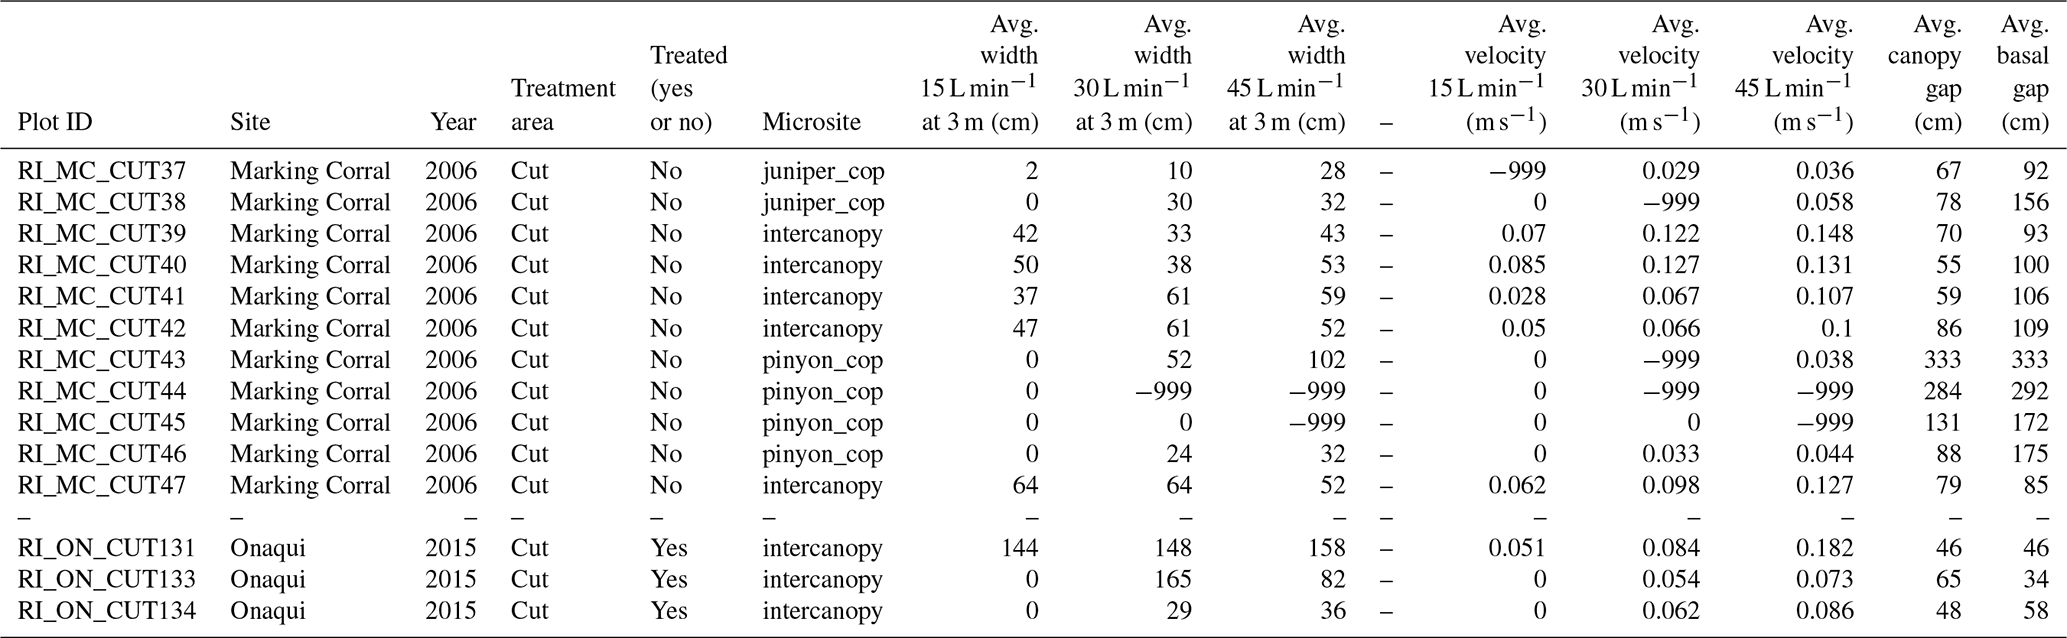
Table 7Example (subset) of rainfall simulation, vegetation, ground cover, and soil variables and data structure for measures on large rainfall simulation plots (13 m2) at the study sites. Abbreviations in the table example are as follows: Fol. Cvr. refers to foliar cover, Grd. Cvr. refers to ground cover, Avg. refers to average, juniper_cop refers to juniper coppice microsites, and pinyon_cop refers to pinyon coppice microsites.

Table 8Example (subset) of overland-flow, vegetation, and ground cover variables and data structure for measures on overland-flow simulation plots (∼9 m2) at the study sites. Abbreviations in the table example are as follows: Avg. refers to average, juniper_cop refers to juniper coppice microsites, and pinyon_cop refers to pinyon coppice microsites.
3.4 Overland-flow simulation plots and experiments
Vegetation and ground cover on overland-flow plots were measured using methods consistent with those on large rainfall simulation plots. For overland-flow plots that underwent rainfall simulation, foliar and ground cover measures were derived from the large rainfall plot line–point transect data but were restricted to the lower 4 m of the respective plots. Foliar and ground cover on overland-flow plots not subjected to rainfall simulations were recorded at 24 points with 20 cm spacing, along each of nine line–point transects (4.6 m in length, spaced 20 cm apart) oriented perpendicular to the hillslope contour, for a total of 216 points per plot. Percentage cover for each cover type sampled on each plot was derived from the number of point contacts or hits for each respective cover type divided by the total number of points sampled within the plot. As on large rainfall plots, total foliar cover across all cover types potentially exceeded 100 % given multiple canopy layers were allowed. Cut trees placed on a subset of overland-flow plots (see experimental design above) were excluded from foliar and ground cover measurements. However, various attributes of downed trees (e.g., length (height) and crown width) were measured and are reported. The ground surface roughness for each overland-flow plot was calculated as the average of the standard deviations of the ground surface heights across the foliar/ground cover line–point transects. The relative ground surface height at each cover sample point was calculated as the distance between a survey transit level line above the respective sample point and the ground surface. Canopy and basal gaps exceeding 20 cm on overland-flow plots were recorded along each line–point transect. Average and maximum canopy and basal gaps were derived consistent with methods for large rainfall simulation plots. Percentages of canopy and basal gaps representing 50 cm incremental gap classes (i.e., 51–100, 101–150 cm, etc.) were derived for each transect and averaged across the transects on each plot to determine gap-class plot means, similar to large rainfall plots.
Datalogger-controlled flow regulators (see Pierson et al., 2010, 2013, 2015; Williams et al., 2014a, 2019a, 2020) were used to apply concentrated flow release rates of 15, 30, and 45 L min−1 to each overland-flow plot. Flow was routed into and through a metal box filled with Styrofoam pellets and was released through a 10 cm wide mesh-screened opening at the box base (Fig. 2d; see Pierson et al., 2010). Each flow release on each plot was applied for 12 min from a single release point located 4 m upslope of the collection trough apex. Flow release rate progression on each plot was consecutive from 15 to 30 to 45 L min−1. Flow samples were collected at various time intervals (usually 1 to 2 min) for each 12 min simulation at each release rate. As with rainfall simulation samples, runoff samples were taken to the laboratory, weighed, oven-dried at 105 ∘C, and then reweighed to determine the runoff rate and sediment concentration. Also as noted above for rainfall simulation runoff samples, a small number of runoff samples were discarded because of laboratory errors or various issues noted on field data sheets (e.g., spillage and bottle overrun). Runoff and sediment variables for each flow release rate were calculated for an 8 min time period starting at runoff initiation. The resulting 8 min runoff and sediment variables were derived as explained for the 45 min rainfall simulations. The velocity of overland flow was measured using a concentrated salt tracer applied into the flow and electrical conductivity probes to track the mean transit time of the tracer over a set flow path length (usually 2 m; Pierson et al., 2010, 2013, 2015; Williams et al., 2014a, 2019a, 2020). The width, depth, and a total rill area width (TRAW) of overland flow were measured along flow cross sections 1, 2, and 3 m downslope from the flow release point (Pierson et al., 2010). The TRAW variable represents the total width between the outermost edges of the outermost flow paths at the respective cross section (see Pierson et al., 2008). Overland-flow simulations conducted on large rainfall simulation plots at Marking Corral and Onaqui in 2006 and 2007 and at Castlehead in 2008 were run approximately 2 h after respective rainfall simulations. Overland-flow simulations on plots not subjected to rainfall simulation at Marking Corral and Onaqui in 2008 and 2015 and at Castlehead in 2008 were conducted on soils prewet with a gently misting sprinkler (see Pierson et al., 2013, 2015; Williams et al., 2014a, 2019a, 2020).
Table 9Example (subset) of time series runoff and sediment data from small-plot rainfall simulations (0.5 m2) at the study sites. Abbreviations in the table example are as follows: Conc. refers to concentration, and shrub_cop refers to shrub coppice microsites.
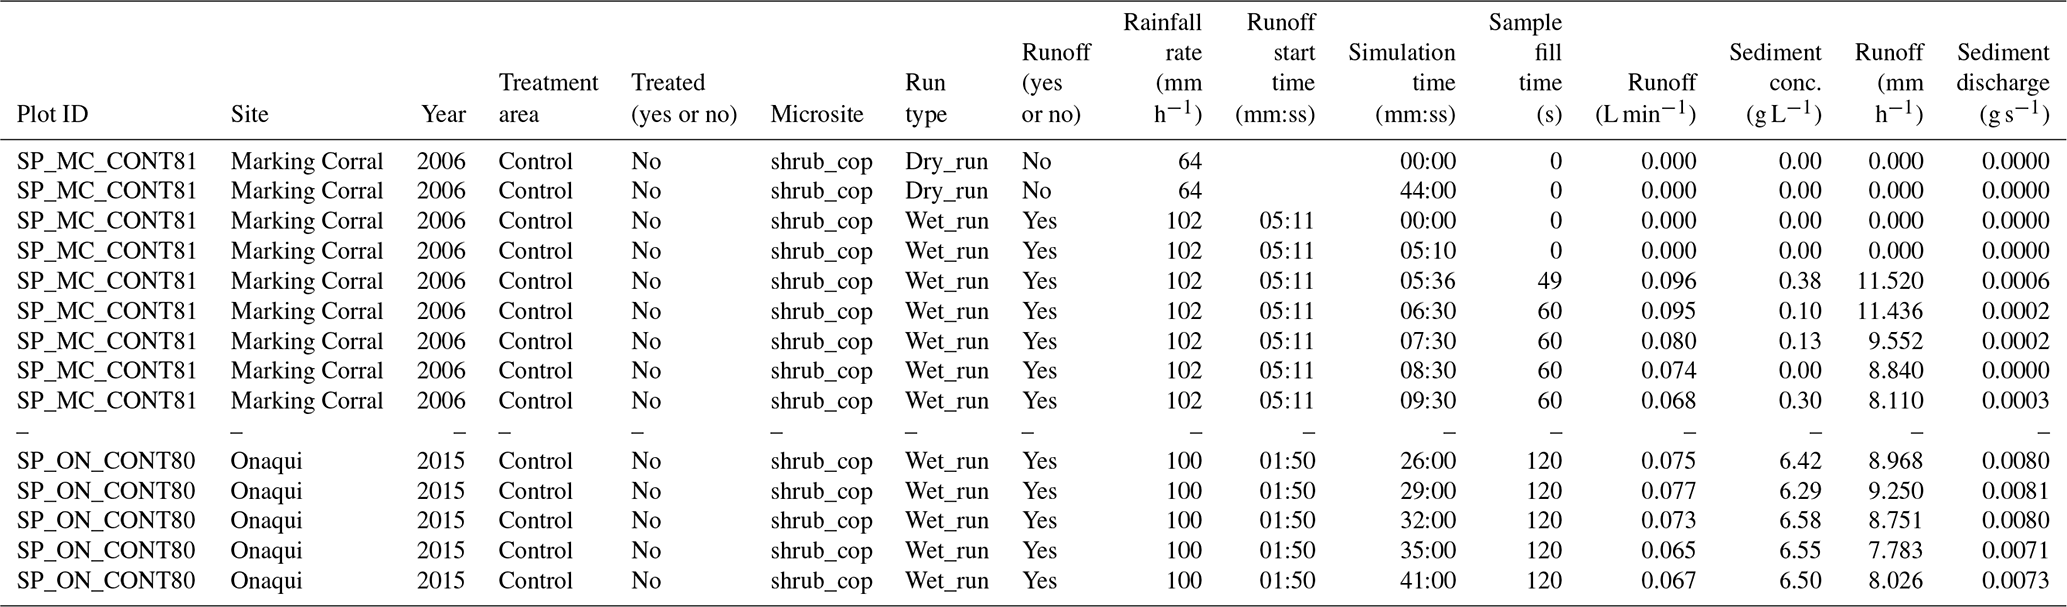
Table 10Example (subset) of time series runoff and sediment data from large-plot rainfall simulations (13 m2) at the study sites. Abbreviations in the table example are as follows: Conc. refers to concentration, and juniper_cop refers to juniper coppice microsites.
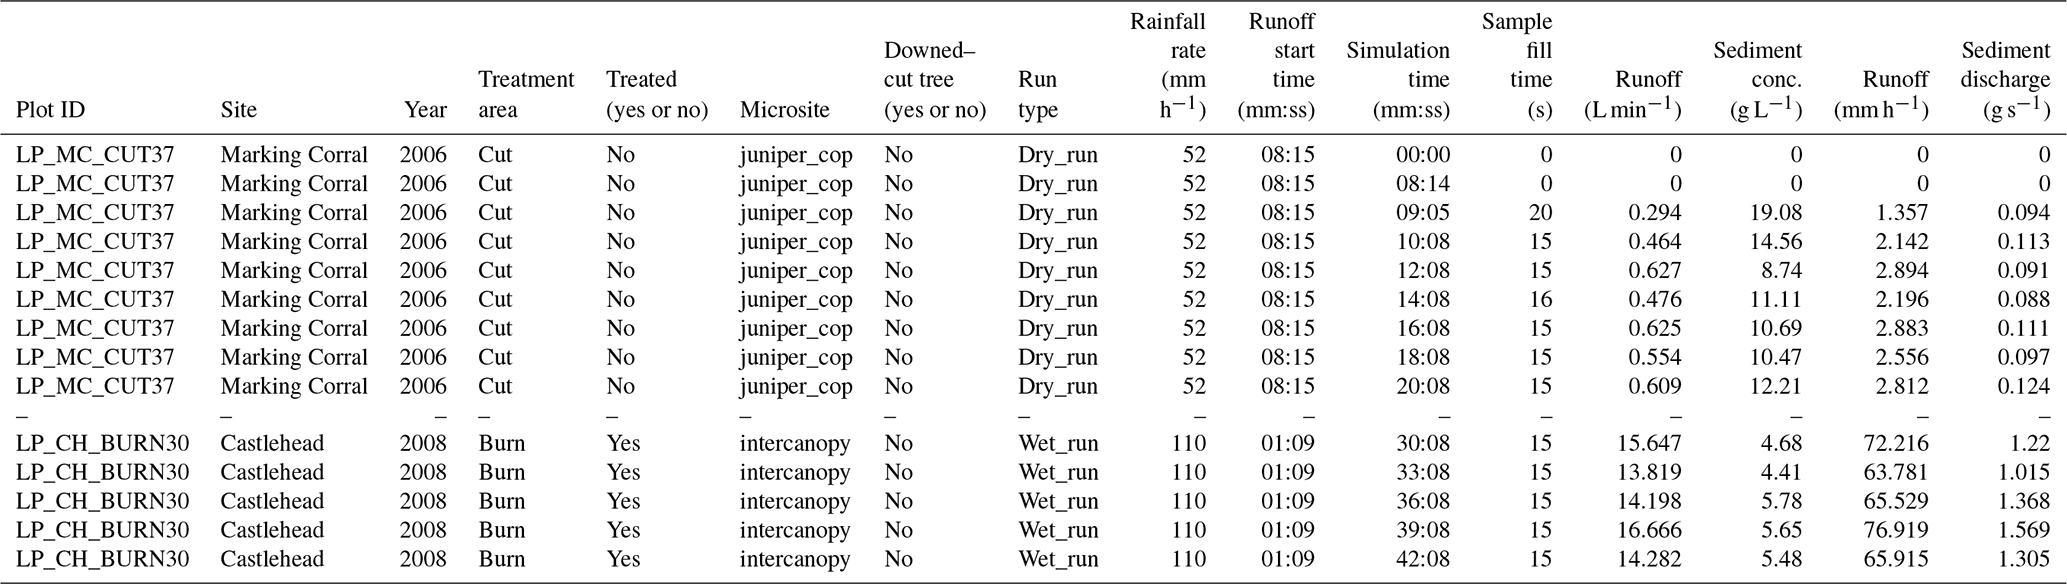
Table 11Example (subset) of time series runoff and sediment data from overland-flow simulations (∼9 m2) at the study sites. Abbreviations in the table example are as follows: Conc. refers to concentration, and juniper_cop refers to juniper coppice microsites.

Subsets of the dataset have been used to improve understanding of rangeland hydrologic and erosion processes, assess the ecohydrologic impacts of wildland fire and management practices on sagebrush rangelands, and improve and enhance rangeland hydrology and erosion models. Examples of data use for such applications are presented in Figs. 3–5. Pierson et al. (2010) applied pretreatment data across all plot scales and experiment types from Marking Corral and Onaqui to evaluate the ecohydrologic impacts of woodland encroachment on sagebrush rangelands. Studies by Pierson et al. (2014, 2015) assessed the initial (first and second year) effects of prescribed fire and mechanical tree-removal treatments on vegetation, ground cover, and hydrology and erosion processes at Marking Corral and Onaqui. Williams et al. (2014a) applied vegetation, ground cover, rainfall simulation, and overland-flow experiments from unburned and burned areas at Castlehead to evaluate the utility of fire to reverse the negative ecohydrologic impacts of juniper encroachment on rangelands and to frame conceptual concepts on process connectivity for burned and degraded rangelands (Fig. 4). Pierson et al. (2013, 2015) evaluated the immediate effects of cut–downed trees on runoff and erosion processes on woodlands. Williams et al. (2019a, 2019b, 2020) applied data from all experimental plot scales and methods in untreated and treated areas at Marking Corral and Onaqui to evaluate the long-term ecohydrologic impacts of prescribed fire and mechanical tree-removal treatments on woodland-encroached sagebrush steppe (Table 3, Fig. 5). Al-Hamdan et al. (2012a, 2012b, 2013, 2015, 2017) applied subsets of the data to develop, test, and enhance various parameter estimation equations for flow hydraulics and erodibility parameters in the Rangeland Hydrology and Erosion Model (RHEM). Collectively, these studies have improved understanding of rangeland hydrology and erosion processes and informed both conceptual and quantitative models applicable to assessment and management of diverse rangelands (McIver et al., 2014; Pierson and Williams, 2016; Williams et al., 2016a, 2016b, 2016c, 2018; Hernandez et al., 2017).
The full dataset is available from the US Department of Agriculture National Agricultural Library website at https://data.nal.usda.gov/search/type/dataset (last access: 7 May 2020) (doi: https://doi.org/10.15482/USDA.ADC/1504518; Pierson et al., 2019). The suite of files therein includes an abbreviated description and field methods; a data dictionary; geographic information for study sites; photographs of the study sites, field experiments, and experimental plots; and data files for vegetation, ground cover, soils, and hydrology and erosion time series measures spanning the associated plots scales. Subset examples of the data files are shown in Tables 4 (site level soil particle size and bulk density), 5 (site characterization plots), 6 (small rainfall plot attributes), 7 (large rainfall plot attributes), 8 (overland-flow plot attributes), 9 (small-plot rainfall simulation time series), 10 (large-plot rainfall simulation time series), and 11 (overland-flow simulation time series). Time series runoff and sediment data provided for rainfall simulations and overland-flow experiments do not account for carryover effects from one plot run to the next on a given plot in a given year (i.e., dry-run effects on wet-run simulations; effects of 15 L min−1 overland flow releases on subsequent 30–45 L min−1 overland flow releases). Data users should consider whether carryover effects impact respective applications and make applicable adjustments to acquired data.
Rangelands are uniquely managed using ecological principles. As such, our functional understanding of regulating ecohydrologic processes, such as soil conservation and runoff moderation, is limited by our ability to track these processes in the context of interdependent land management decisions. Pinyon–juniper encroachment into sagebrush shrublands and the resulting management actions provide a model system for observing hydrologic processes under disturbances and interventions typical of extensively managed rangelands. To provide detailed understanding of ecohydrologic processes under realistic management conditions, we collected long-term data at multiple sites, spatial scales, and treatments. The combined dataset includes 1021 experimental plots and contains vegetation, ground cover, soils, hydrology, and erosion data spanning multiple spatial scales and diverse vegetation, ground cover, and surface soil conditions from three study sites and five different study years. The dataset includes 57 hillslope-scale vegetation plots (site characterization), 528 small rainfall simulation plots, 146 large rainfall simulation plots, and 290 overland-flow simulation plots. The hydrology and erosion experiments provide time series data for small rainfall plot, large rainfall plot, and overland-flow plot simulations. After excluding some time series rainfall and overland-flow simulation data due to various lab and equipment failures, the final time series dataset contains 1020 small rainfall, 280 large rainfall, and 838 overland-flow plot-run hydrographs and sedigraphs if plots without runoff are retained. Retaining only plots that generated runoff results in a time series dataset of 749 small rainfall, 251 large rainfall, and 719 overland-flow plot simulation hydrographs and sedigraphs. Overall, the hydrology and erosion time series dataset totals to 2138 hydrographs/sedigraphs including plots with no runoff and 1719 hydrographs/sedigraphs for plots that generated runoff. The methodology employed and resulting experimental data improve understanding of and provide quantification of separate scale-dependent (e.g., rain splash and sheet flow) and combined (e.g., interrill and concentrated flow/rill) surface hydrology and erosion processes for sagebrush rangelands and pinyon and juniper woodlands in the Great Basin before and after tree removal and for sparsely vegetated sites elsewhere. This separate and combined experimental approach yields a valuable data source for testing and improving isolated process parameterizations in quantitative hydrology and erosion models. The long-term nature of the dataset is unique and provides a substantial database for populating conceptual ecological models of changes in vegetation, ground cover conditions, and surface soils resulting from management practices and disturbances. Likewise, the combined data on short-term and long-term ecohydrologic impacts of management practices and fire provide valuable insight on trends in ecohydrologic recovery of rangeland ecosystems.
FBP, CJW, PRK, and OZA-H participated in the experimental design, data collection and reduction, and compilation of the dataset and manuscript. JCJ contributed to data reduction and compilation of the dataset and manuscript. All authors contributed to revisions of the submitted manuscript.
The authors declare that they have no conflict of interest.
This paper is contribution number 135 of the Sagebrush Steppe Treatment Evaluation Project (SageSTEP, http://www.sagestep.org/, last access: 7 May 2020), funded by the US Joint Fire Science Program, US Department of Interior (USDI) Bureau of Land Management, and US National Interagency Fire Center. The authors thank the USDI Bureau of Land Management and the US Department of Agriculture (USDA) Forest Service for implementation of the land management treatments and site access in collaboration with the SageSTEP study. We are also grateful for land access and infrastructural support provided by Mike and Jeannie Stanford during our field experiments at the Castlehead site. We thank Barry Caldwell and Zane Cram of the USDA Agricultural Research Service (ARS) Northwest Watershed Research Center, Boise, ID, USA, for field support throughout the study. We likewise thank Steve Van Vactor of the USDA ARS Northwest Watershed Research Center for database support. We are grateful for field supervision of data collection and laboratory work provided by Jaime Calderon, Matthew Frisby, Kyle Lindsay, and Samantha Vega over various years of the research study. We thank Ben Rau and the Desert Research Institute, Reno, Nevada, USA, for assistance with processing soil samples. The USDA is an equal opportunity provider and employer. Mention of a proprietary product does not constitute endorsement by USDA and does not imply its approval to the exclusion of the other products that may also be suitable.
This research has been supported by the US Joint Fire Science Program; the US Department of Interior, Bureau of Land Management; the US National Interagency Fire Center; and the US Department of Agriculture, Agricultural Research Service.
This paper was edited by Alexander Gelfan and reviewed by three anonymous referees.
Al-Hamdan, O. Z., Pierson, F. B., Nearing, M. A., Stone, J. J., Williams, C. J., Moffet, C. A., Kormos, P. R., Boll, J., and Weltz, M. A.: Characteristics of concentrated flow hydraulics for rangeland ecosystems: Implications for hydrologic modeling, Earth Surf. Process. Landf., 37, 157–168, 2012a.
Al-Hamdan, O. Z., Pierson, F. B., Nearing, M. A., Williams, C. J., Stone, J. J., Kormos, P. R., Boll, J., and Weltz, M. A.: Concentrated flow erodibility for physically based erosion models: Temporal variability in disturbed and undisturbed rangelands, Water Resour. Res., 48, W07504, https://doi.org/10.1029/2011WR011464, 2012b.
Al-Hamdan, O. Z., Pierson, F. B., Nearing, M. A., Williams, C. J., Stone, J. J., Kormos, P. R., Boll, J., and Weltz, M. A.: Risk assessment of erosion from concentrated flow on rangelands using overland flow distribution and shear stress partitioning, Trans. ASABE, 56, 539–548, 2013.
Al-Hamdan, O. Z., Hernandez, M., Pierson, F. B., Nearing, M. A., Williams, C. J., Stone, J. J., Boll, J., and Weltz, M. A.: Rangeland Hydrology and Erosion Model (RHEM) enhancements for applications on disturbed rangelands, Hydrol. Process., 29, 445–457, 2015.
Al-Hamdan, O. Z., Pierson, F. B., Nearing, M. A., Williams, C. J., Hernandez, H., Boll, J., Nouwakpo, S. K., Weltz, M. A., and Spaeth, K. E.: Developing a parameterization approach for soil erodibility for the Rangeland Hydrology and Erosion Model (RHEM), Trans. Am. Soc. Agr. Biol. Eng., 60, 85–94, 2017.
Bates, J. D., Miller, R. F., and Svejcar, T. J.: Understory dynamics in cut and uncut western juniper woodlands, J. Range Manage., 53, 119–126, 2000.
Bates, J. D., Miller, R. F., and Svejcar, T.: Long-term successional trends following western juniper cutting, Range. Ecol. Manage., 58, 533–541, 2005.
Bates, J. D., Sharp, R. N., and Davies, K. W.: Sagebrush steppe recovery after fire varies by development phase of Juniperus occidentalis woodland, Int. J. Wildl. Fire, 23, 117–130, 2014.
Bates, J. D., Svejcar, T., Miller, R., and Davies, K. W.: Plant community dynamics 25 years after juniper control, Range. Ecol. Manage., 70, 356–362, 2017.
Chambers, J. C., Miller, R. F., Board, D. I., Pyke, D. A., Roundy, B. A., Grace, J. B., Schupp, E. W., and Tausch, R. J.: Resilience and resistance of sagebrush ecosystems: implications for state and transition models and management treatments, Range. Ecol. Manage., 67, 440–454, 2014.
Chambers, J. C., Maestas, J. D., Pyke, D. A., Boyd, C. S., Pellant, M., and Wuenschel, A.: Using resilience and resistance concepts to manage persistent threats to sagebrush ecosystems and greater sage-grouse, Range. Ecol. Manage., 70, 149–164, 2017.
Davenport, D. W., Breshears, D. D., Wilcox, B. P., and Allen, C. D.: Viewpoint: Sustainability of pinon-juniper ecosystems – A unifying perspective of soil erosion thresholds, J. Range Manage., 51, 231–240, 1998.
Davies, K. W., Boyd, C. S., Beck, J. L., Bates, J. D., Svejcar, T. J., and Gregg, M. A.: Saving the sagebrush sea: An ecosystem conservation plan for big sagebrush plant communities, Biol. Conserv., 144, 2573–2584, 2011.
Emmett, W. W.: The hydraulics of overland flow on hillslopes, US Government Printing Office, Washington, D.C., 69 pp., 1970.
Flanagan, D. C. and Nearing, M. A. USDA-Water Erosion Prediction Project (WEPP) hillslope profile and watershed model documentation, NSERL Report No. 10, National Soil Erosion Research Laboratory, USDA-Agricultural Research Service, West Lafayette, IN, USA, 298 pp., 1995.
Havstad, K. M., Peters, D. C., Allen-Diaz, B., Bartolome, J., Betelmeyer, B. T., Briske, D., Brown, J., Brunsun, M., Herrick, J. E., Huntsinger, L., Johnson, P., Joyce, L., Pieper, R., Svejcar, A. J., and Yao, J.: The western United Sates rangelands, a major resource, in: Grassland: Quietness and Strength for a New American Agriculture, edited by: Wedin, W. F. and Fales, S. L., American Society of Agronomy Inc., Crop Science Society of America Inc., and Soil Science Society of America, Inc., Madison, WI, USA, 75–93, 2009.
Hernandez, M., Nearing, M. A., Al-Hamdan, O. Z., Pierson, F. B., Armendariz, G., Weltz, M. A., Spaeth, K. E., Williams, C. J., Nouwakpo, S. J., Goodrich, D. C., Unkrich, C.L., Nichols, M. H., and Holifield Collins, C. D.: The Rangeland Hydrology and Erosion Model: A dynamic approach for predicting soil loss on rangelands, Water Resour. Res., 53, 9368–9391, https://doi.org/10.1002/2017WR020651, 2017.
Herrick, J. E., Van Zee, J. W., Havstad, K. M., Burkett, L. M., and Whitford, W. G.: Monitoring manual for grassland, shrubland, and savanna ecosystems, Volume 1: Quick Start, USDA-Agricutural Research Service, Las Cruces, NM, USA, 36 pp., 2005.
Holland, M. E.: Colorado State University experimental rainfall-runoff facility, design and testing of a rainfall system, Technical Report CER 69-70 MEH, Fort Collins, CO, USA, Colorado State University, Colorado State University Experimental Station, 21 p., 1969.
Ludwig, J. A., Wilcox, B. P., Breshears, D. D., Tongway, D. J., and Imeson, A. C.: Vegetation patches and runoff-erosion as interacting ecohydrological processes in semiarid landscapes, Ecology, 86, 288–297, 2005.
McIver, J., Brunson, M., Bunting, S., Chambers, J., Doescher, P., Grace, J., Hulet, A., Johnson, D., Knick, S., Miller, R., Pellant, M., Pierson, F., Pyke, D., Rau, B., Rollins, K., Roundy, B., Schupp, E., Tausch, R., and Williams, J.: A synopsis of short-term response to alternative restoration treatments in sagebrush-steppe: The SageSTEP Project, Range. Ecol. Manage., 67, 584–598, 2014.
Meyer, L. D. and Harmon, W. C.: Multiple-intensity rainfall simulator for erosion research on row sideslopes, Trans. ASAE, 22, 100–103, 1979.
Miller, R. F., Svejcar, T. J., and Rose, J. A.: Impacts of western juniper on plant community composition and structure, J. Range Manage., 53, 574–585, 2000.
Miller, R. F., Bates, J. D., Svejcar, T. J., Pierson, F. B., and Eddleman, L. E.: Biology, ecology, and management of western juniper, Oregon State University Agricultural Experiment Station Technical Bulletin 152, Oregon State University, Oregon State University Agricultural Experiment Station, Corvallis, OR, USA, 82 pp., 2005.
Miller, R. F., Knick, S. T., Pyke, D. A., Meinke, C. W., Hanser, S. E., Wisdom, M. J., and Hild, A. L.: Characteristics of sagebrush habitats and limitations to long-term conservation, in: Greater Sage-grouse: Ecology and Conservation of a Landscape Species and Its Habitats. Studies in Avian Biology, Vol. 38, edited by: Knick, S. T. and Connelly, J. W., University of California Press, Berkeley, CA, USA, 145–184, 2011.
Miller, R. F., Ratchford, J., Roundy, B. A., Tausch, R. J., Hulet, A., and Chambers, J.: Response of conifer-encroached shrublands in the Great Basin to prescribed fire and mechanical treatments, Range. Ecol. Manage., 67, 468–481, 2014.
Miller, R. F., Chambers, J. C., Evers, L., Williams, C. J., Snyder, K. A., Roundy, B. A., and Pierson, F. B.: The ecology, history, ecohydrology, and management of pinyon and juniper woodlands in the Great Basin and Northern Colorado Plateau of the western United States, General Technical Report RMRS-GTR-403, US Department of Agriculture, Forest Service, Rocky Mountain Research Station, Fort Collins, CO, USA, 2019.
Nearing, M. A., Wei, H., Stone, J. J., Pierson, F. B., Spaeth, K. E., Weltz, M. A., Flanagan, D. C., and Hernandez, M.: A rangeland hydrology and erosion model, Trans. ASABE, 54, 901–908, 2011.
Neff, E. L.: Performance characteristics and field operation of two rainfall simulators, Washington D.C., USA, US Department of Agriculture, Agricultural Research Service, 42 p., 1979.
NRCS (Natural Resources Conservation Service), Soil survey of Owyhee County area, Idaho, US Department of Agriculture, Natural Resources Conservation Service, Washington, DC, USA, 2003.
NRCS (Natural Resources Conservation Service), Soil Survey Geographic (SSURGO) database for Tooele Area, Utah – Tooele County and Parts of Box Elder, Davis, and Juab Counties, Utah, White Pine and Elko Counties, Nevada, US Department of Agriculture, Natural Resources Conservation Service, Fort Worth, TX, USA, 2006.
NRCS (Natural Resources Conservation Service), Soil Survey Geographic (SSURGO) database for Western White Pine County Area, Nevada, Parts of White Pine and Eureka Counties, US Department of Agriculture, Natural Resources Conservation Service, Fort Worth, TX., USA, 2007.
Petersen, S. L. and Stringham, T. K.: Infiltration, runoff, and sediment yield in response to western juniper encroachment in southeast Oregon, Range. Ecol. Manage., 61, 74–81, 2008.
Petersen, S. L., Stringham, T. K., and Roundy, B. A.: A process-based application of state-and-transition models: A case study of western juniper (Juniperus occidentalis) encroachment, Range. Ecol. Manage., 62, 186–192, 2009.
Pierson, F. B. and Williams, C. J.: Ecohydrologic impacts of rangeland fire on runoff and erosion: A literature synthesis, General Technical Report RMRS-GTR-351, US Department of Agriculture, Forest Service, 110 pp., 2016.
Pierson Jr., F. B., Van Vactor, S. S., Blackburn, W. H., and Wood, J. C.: Incorporating small scale spatial variability into predictions of hydrologic response on sagebrush rangelands, in: Variability in rangeland water erosion processes (Soil Science Soceity of America Special Publication 38), edited by: Blackburn, W. H., Pierson, F. B., Schuman, G. E., and Zartman, R., Soil Science Society of America, Madison, WI, USA, 23-34, 1994.
Pierson, F. B., Bates, J. D., Svejcar, T. J., and Hardegree, S. P.: Runoff and erosion after cutting western juniper, Range. Ecol. Manage., 60, 285–292, 2007.
Pierson, F. B., Robichaud, P. R., Moffet, C. A., Spaeth, K. E., Hardegree, S. P., Clark, P. E., and Williams, C. J.: Fire effects on rangeland hydrology and erosion in a steep sagebrush-dominated landscape, Hydrol. Process., 22, 2916–2929, 2008.
Pierson, F. B., Moffet, C. A., Williams, C. J., Hardegree, S. P., and Clark, P. E.: Prescribed-fire effects on rill and interrill runoff and erosion in a mountainous sagebrush landscape, Earth Surf. Process. Landf., 34, 193–203, 2009.
Pierson, F. B., Williams, C. J., Kormos, P. R., Hardegree, S. P., Clark, P. E., and Rau, B. M.: Hydrologic vulnerability of sagebrush steppe following pinyon and juniper encroachment, Range. Ecol. Manage., 63, 614–629, https://doi.org/10.2111/REM-D-09-00148.1, 2010.
Pierson, F. B., Williams, C. J., Hardegree, S. P., Weltz, M. A., Stone, J. J., and Clark, P. E.: Fire, plant invasions, and erosion events on western rangelands, Range. Ecol. Manage., 64, 439–449, 2011.
Pierson, F. B., Williams, C. J., Hardegree, S. P., Clark, P. E., Kormos, P. R., and Al-Hamdan, O. Z.: Hydrologic and erosion responses of sagebrush steppe following juniper encroachment, wildfire, and tree cutting, Range. Ecol. Manage., 66, 274–289, https://doi.org/10.2111/REM-D-12-00104.1, 2013.
Pierson, F. B., Williams, C. J., Kormos, P. R., and Al-Hamdan, O. Z.: Short-term effects of tree removal on infiltration, runoff, and erosion in woodland-encroached sagebrush steppe, Range. Ecol. Manage., 67, 522–538, https://doi.org/10.2111/REM-D-13-00033.1, 2014.
Pierson, F. B., Williams, C. J., Kormos, P. R., Al-Hamdan, O. Z., Hardegree, S. P., and Clark, P. E.: Short-term impacts of tree removal on runoff and erosion from pinyon- and juniper-dominated sagebrush hillslopes, Range. Ecol. Manage., 68, 408–422, https://doi.org/10.1016/j.rama.2015.07.004, 2015.
Pierson, F. B., Williams, C. J., Kormos, P. R., Al-Hamdan, O. Z., and Johnson, J. C.: Vegetation, rainfall simulation, and overland flow experiments before and after tree removal in woodland-encroached sagebrush steppe: the SageSTEP hydrology study, Ag Data Commons, https://doi.org/10.15482/USDA.ADC/1504518, 2019.
Prism Climate Group: Oregon State University, Prism Climate Group, available at: http://www.prism.oregonstate.edu, last access: 20 September 2019.
Puigdefábregas, J.: The role of vegetation patterns in structuring runoff and sediment fluxes in drylands, Earth Surf. Process. Landf., 30, 133–147, 2005.
Reid, K. D., Wilcox, B. P., Breshears, D. D., and MacDonald, L.: Runoff and erosion in a pinon-juniper woodland: Influence of vegetation patches, Soil Sci. Soc. Am. J., 63, 1869–1879, 1999.
Robichaud, P. R., Elliot, W. J., Pierson, F. B., Hall, D. E., and Moffet, C. A.: Predicting postfire erosion and mitigation effectiveness with a web-based probabilistic erosion model, Catena, 71, 229–241, 2007.
Roundy, B. A., Young, K., Cline, N., Hulet, A., Miller, R. F., Tausch, R. J., Chambers, J. C., and Rau, B.: Piñon-juniper reduction increases soil water availability of the resource growth pool, Range. Ecol. Manage., 67, 495–505, 2014.
Roundy, B. A., Farmer, M., Olson, J., Petersen, S., Nelson, D. R., Davis, J., and Vernon, J.: Runoff and sediment response to tree control and seeding on a high soil erosion potential site in Utah: evidence for reversal of an abiotic threshold, Ecohydrology, 10, e1775, https://doi.org/10.1002/eco.1775, 2017.
Schlesinger, W. H., Reynolds, J. F., Cunningham, G. L., Huenneke, L. F., Jarrell, W. M., Virginia, R. A., and Whitford, W. G.: Biological feedbacks in global desertification, Science, 247, 1043–1048, 1990.
Shakesby, R. A.: Post-wildfire soil erosion in the Mediterranean: Review and future research directions, Earth-Sci. Rev., 105, 71–100, 2011.
Shakesby, R. A. and Doerr, S. H.: Wildfire as a hydrological and geomorphological agent, Earth-Sci. Rev., 74, 269–307, 2006.
Wainwright, J., Parsons, A. J., and Abrahams, A. D.: Plot-scale studies of vegetation, overland flow and erosion interactions: Case studies from Arizona and New Mexico, Hydrol. Process., 14, 2921–2943, 2000.
Wei, H., Nearing, M. A., Stone, J. J., Guertin, D. P., Spaeth, K. E., Pierson, F. B., Nichols, M. H., and Moffett, C. A.: A new splash and sheet erosion equation for rangelands, Soil Sci. Soc. Am. J., 73, 1386–1392, 2009.
Wilcox, B. P., Breshears, D. D., and Allen, C. D.: Ecohydrology of a resource-conserving semiarid woodland: Effects of scale and disturbance, Ecol. Monogr., 73, 223–239, 2003.
Wilcox, B. P., Turnbull, L., Young, M. H., Williams, C. J., Ravi, S., Seyfried, M. S., Bowling, D. R., Scott, R. L., Germino, M. J., Caldwell, T. G., and Wainwright, J.: Invasion of shrublands by exotic grasses: Ecohydrological consequences in cold versus warm deserts, Ecohydrology, 5, 160–173, 2012.
Williams, C. J., Pierson, F. B., Al-Hamdan, O. Z., Kormos, P. R., Hardegree, S. P., and Clark, P. E.: Can wildfire serve as an ecohydrologic threshold-reversal mechanism on juniper-encroached shrublands, Ecohydrology, 7, 453–477, https://doi.org/10.1002/eco.1364, 2014a.
Williams, C. J., Pierson, F. B., Robichaud, P. R., and Boll, J.: Hydrologic and erosion responses to wildfire along the rangeland-xeric forest continuum in the western US: A review and model of hydrologic vulnerability, Int. J. Wildland Fire, 23, 155–172, 2014b.
Williams, C. J., Pierson, F. B., Spaeth, K. E., Brown, J. R., Al-Hamdan, O. Z., Weltz, M. A., Nearing, M. A., Herrick, J. E., Boll, J., Robichaud, P. R., Goodrich, D. C., Heilman, P., Guertin, D. P., Hernandez, M., Wei, H., Hardegree, S. P., Strand, E. K., Bates, J. D., Metz, L. J., and Nichols, M. H.: Incorporating hydrologic data and ecohydrologic relationships into Ecological Site Descriptions, Range. Ecol. Manage., 69, 4–19, 2016a.
Williams, C. J., Pierson, F. B., Spaeth, K. E., Brown, J. R., Al-Hamdan, O. Z., Weltz, M. A., Nearing, M. A., Herrick, J. E., Boll, J., Robichaud, P. R., Goodrich, D. C., Heilman, P., Guertin, D. P., Hernandez, M., Wei, H., Polyakov, V. O., Armendariz, G., Nouwakpo, S. K., Hardegree, S. P., Clark, P. E., Strand, E. K., Bates, J. D., Metz, L. J., and Nichols, M. H.: Application of ecological site information to transformative changes on Great Basin sagebrush rangelands, Rangelands, 38, 379–388, 2016b.
Williams, C. J., Pierson, F. B., Robichaud, P. R., Al-Hamdan, O. Z., Boll, J., and Strand, E. K.: Structural and functional connectivity as a driver of hillslope erosion following disturbance, Int. J. Wildland Fire, 25, 306–321, 2016c.
Williams, C. J., Snyder, K. A, and Pierson, F. B.: Spatial and temporal variability of the impacts of pinyon and juniper reduction on hydrologic and erosion processes across climatic gradients in the western US: A regional synthesis, Water, 10, 1607, https://doi.org/10.3390/w10111607, 2018.
Williams, C. J., Pierson, F. B., Kormos, P. R., Al-Hamdan, O. Z., Nouwakpo, S. K., and Weltz, M. A.: Vegetation, hydrologic, and erosion responses of sagebrush steppe 9 years following mechanical tree removal, Range. Ecol. Manage., 72, 47–68, https://doi.org/10.1016/j.rama.2018.07.004, 2019a.
Williams, C. J., Pierson, F. B., Nouwakpo, S. K., Kormos, P. R., Al-Hamdan, O. Z., and Weltz, M. A.: Long-term evidence for fire as an ecohydrologic threshold-reversal mechanism on woodland-encroached sagebrush shrublands, Ecohydrology, 12, e2086, https://doi.org/10.1002/eco.2086, 2019b.
Williams, C. J., Pierson, F. B., Nouwakpo, S. K., Al-Hamdan, O. Z., Kormos, P. R., and Weltz, M. A.: Effectiveness of prescribed fire to re-establish sagebrush steppe vegetation and ecohydrologic function on woodland-encroached sagebrush rangelands, Great Basin, USA: Part I: Vegetation, hydrology, and erosion responses, Catena, 185, 103477, https://doi.org/10.1016/j.catena.2018.02.027, 2020.