the Creative Commons Attribution 4.0 License.
the Creative Commons Attribution 4.0 License.
 | 24 Aug 2018
Present-day surface deformation of the Alpine region inferred from geodetic techniques
Christof Völksen
Alexandr Sokolov
Herbert Arenz
Florian Seitz
We provide a present-day surface-kinematics model for the Alpine region and surroundings based on a high-level data analysis of about 300 geodetic stations continuously operating over more than 12 years. This model includes a deformation model, a continuous surface-kinematic (velocity) field, and a strain field consistently assessed for the entire Alpine mountain belt. Special care is given to the use of the newest Global Navigation Satellite Systems (GNSS) processing standards to determine high-precision 3-D station coordinates. The coordinate solution refers to the reference frame IGb08, epoch 2010.0. The mean precision of the station positions at the reference epoch is ±1.1 mm in N and E and ±2.3 mm in height. The mean precision of the station velocities is ±0.2 mm a−1 in N and E and ±0.4 mm a−1 in height. The deformation model is derived from the point-wise station velocities using a geodetic least-squares collocation (LSC) approach with empirically determined covariance functions. According to our results, no significant horizontal deformation is detected in the Western Alps, while across the Southern and Eastern Alps the deformation vectors describe a progressive eastward rotation towards Pannonia. This kinematic pattern also makes evident an increasing magnitude of the deformation from 0.1 mm a−1 in the western part of Switzerland up to about 1.3 mm a−1 in the Austrian Alps. The largest shortening is observed along the southern front of the Eastern Alps (in the northern area of the Venetian-Friuli Basin) and in the northern part of the Apennine Peninsula, where rates reach 2 and 3 mm a−1, respectively. The average accuracy of the horizontal deformation model is ±0.2 mm a−1. Regarding the vertical kinematics, our results clearly show an ongoing average uplift rate of 1.8 mm a−1 of the entire mountain chain, with the exception of the southern part of the Western Alps, where no significant uplift (less than 0.5 mm a−1) is detected. The fastest uplift rates (more than 2 mm a−1) occur in the central area of the Western Alps, in the Swiss Alps, and in the Southern Alps in the boundary region between Switzerland, Austria, and Italy. The general uplift observed across the Alpine mountain chain decreases towards the outer regions to stable values between 0.0 and 0.5 mm a−1 and, in some cases, to subsidence like in the Liguro-Provençal and Vienna basins, where vertical rates of −0.8 and −0.3 mm a−1 are observed, respectively. In the surrounding region, three regional subsidence regimes are identified: the Rhône-Bresse Graben with −0.8 mm a−1, the Rhine Graben with −1.3 mm a−1, and the Venetian-Friuli Basin with −1.5 mm a−1. The estimated uncertainty of our vertical motion model across the Alpine mountain belt is about ±0.3 mm a−1. The strain field inferred from the deformation model shows two main contrasting strain regimes: (i) shortening across the south-eastern front of the Alps and the northern part of the Dinarides and (ii) extension in the Apennines. The pattern of the principal strain axes indicates that the compression directions are more or less perpendicular to the thrust belt fronts, reaching maximum values of a−1 in the Venetian-Friuli and Po basins. Across the Alpine mountain belt, we observe a slight dilatation regime in the Western Alps, which smoothly changes to a contraction regime in western Austria and southern Germany, reaching maximum shortening values of a−1 in north-eastern Austria. The numerical results of this study are available at https://doi.pangaea.de/10.1594/PANGAEA.886889.
- Article
(7975 KB) - Full-text XML
- BibTeX
- EndNote


The Alpine orogeny is the result of the continental collision of the African and European plates, more precisely of the push of the African Plate through the Adriatic promontory (also called the Adria or Apulian microplate; Channell et al., 1979) against Central Europe. A wide range of multidisciplinary studies based on geologic, geophysical, and geodetic data have demonstrated that the Alpine orogeny has been active from the Jurassic until the present (e.g.; Dewey et al., 1973, 1989; Channell and Horváth, 1976; Dercourt et al., 1986; Le Pichon et al., 1988; Mueller and Kahle, 1993; Ustaszewski et al., 2008; Handy et al., 2010, 2015). The tectonic evolution and present geodynamic framework have been primarily deduced from seismotectonic syntheses, and it is clear that the Alpine area and, in a more extended sense, the Mediterranean represent a variety of lithosphere blocks of different age, thickness, and rheology, leading to complex kinematic processes, including subduction, back-arc spreading, rifting and thrust, reverse and strike-slip faulting. These processes are superimposed on those phenomena associated with any orogeny; i.e. uplift, deformation, erosion, metamorphism, and foredeep basin changes. During the last three decades, the Global Navigation Satellite Systems (GNSS), like GPS (Global Positioning System) and GLONASS (GLObalnaja NAwigazionnaja Sputnikowaja Sistema), became a fundamental tool to observe, model, and understand present-day kinematic processes, as they provide precise geodetic constraints with a high spatial resolution allowing the improvement of geodynamic models, especially at diffuse plate boundaries like the African–Eurasian boundary.
The use of GPS to detect tectonic surface deformations in Europe started already in the 1990s (e.g. Fejes et al., 1993; Kahle et al., 1994; Chéry et al., 1995; Kaniuth et al., 1995, 1999; van Mierlo et al., 1996; Calais et al., 1998, 2000; Ferhat et al., 1998; Calais, 1999; Grenerczy et al., 2000; Sue et al., 2000). Given the complexity of the deformation zone in the southern part of the continent, scientists concentrated on selected areas to deploy observing stations and to develop local deformation models. Recent studies can be classified following the geographic subdivision of the Alps into the Western, Central, Eastern, and Southern Alps (Fig. 1):
-
The Western Alps in south-eastern France, with the boundary region France–Italy and south-western Switzerland; e.g. Tesauro et al. (2006), Delacou et al. (2008), Larroque et al. (2009), Nguyen et al. (2016), and Nocquet et al. (2016).
-
The Central and Eastern Alps in Austria and the adjacent regions of Switzerland, Liechtenstein, Germany, Italy, and Slovenia; e.g. Haslinger et al. (2006), Weber et al. (2006), Gosar et al. (2007), Sue et al. (2007), Brückl et al. (2010), and Brockmann et al. (2012).
-
The junction zone of the Eastern Alps, the Dinarides, and the Pannonian Basin; e.g. Bada et al. (2007), Bus et al. (2009), Caporali et al. (2009), and Möller et al. (2011).
-
the Southern Alps in northern Italy (also considered as a boundary zone for the computation of deformation models in the Adriatic region); e.g. Grenerczy et al. (2005), Grenerczy and Kenyeres (2006), D'Agostino et al. (2005, 2011), Devoti et al. (2008, 2011), Serpelloni et al. (2005, 2013), Cuffaro et al. (2010), and Métois et al. (2015).
These studies describe in general deformation models of regional scope and cover isolated segments of the Alpine mountain chain and its forelands. The objective of this work is the consistent determination of a continuous horizontal and vertical surface-kinematic field of the Alpine area that provides an integral picture of the ongoing deformation processes in the entire region. A network of about 300 continuously operating GNSS (CO-GNSS) stations with observations collected over 12.4 years is used for the precise determination of station positions and velocities. Based on these results, a continuous kinematic field is derived using a geodetic least-squares collocation (LSC) approach with empirically determined covariance functions. Main results are a deformation model, a continuous surface-kinematic (velocity) field, and a strain field consistently assessed for the entire Alpine mountain belt. The core contribution of this work is the homogeneous analysis of a large number of freely available data from CO-GNSS stations located in the Alpine region, using unified processing standards and a common reference frame for the complete time span covered by the observations. Special care is given to the application of the newest GNSS processing standards like absolute corrections to the GNSS antenna phase centre variations, troposphere delay estimation based on numerical weather models, and atmospheric and oceanic tide loading effects. To ensure consistency, we also use reprocessed GNSS satellite orbits referring to the IGS08/IGb08 reference frame (Rebischung et al., 2012) and including the most recent models adopted by the International GNSS Service (IGS) for orbit determination, such as the albedo model of Rodríguez-Solano et al. (2012), the satellite antenna thrust effect, and the a priori solar radiation pressure model switch-off (Steigenberger et al., 2014). The IGS08/IGb08 reference frame corresponds to a subset of GNSS stations of the ITRF2008 (International Terrestrial Reference Frame 2008; Altamimi et al., 2011), which are used by the IGS as fiducial points for the computation of the satellite ephemeris and the Earth orientation parameters (EOPs).
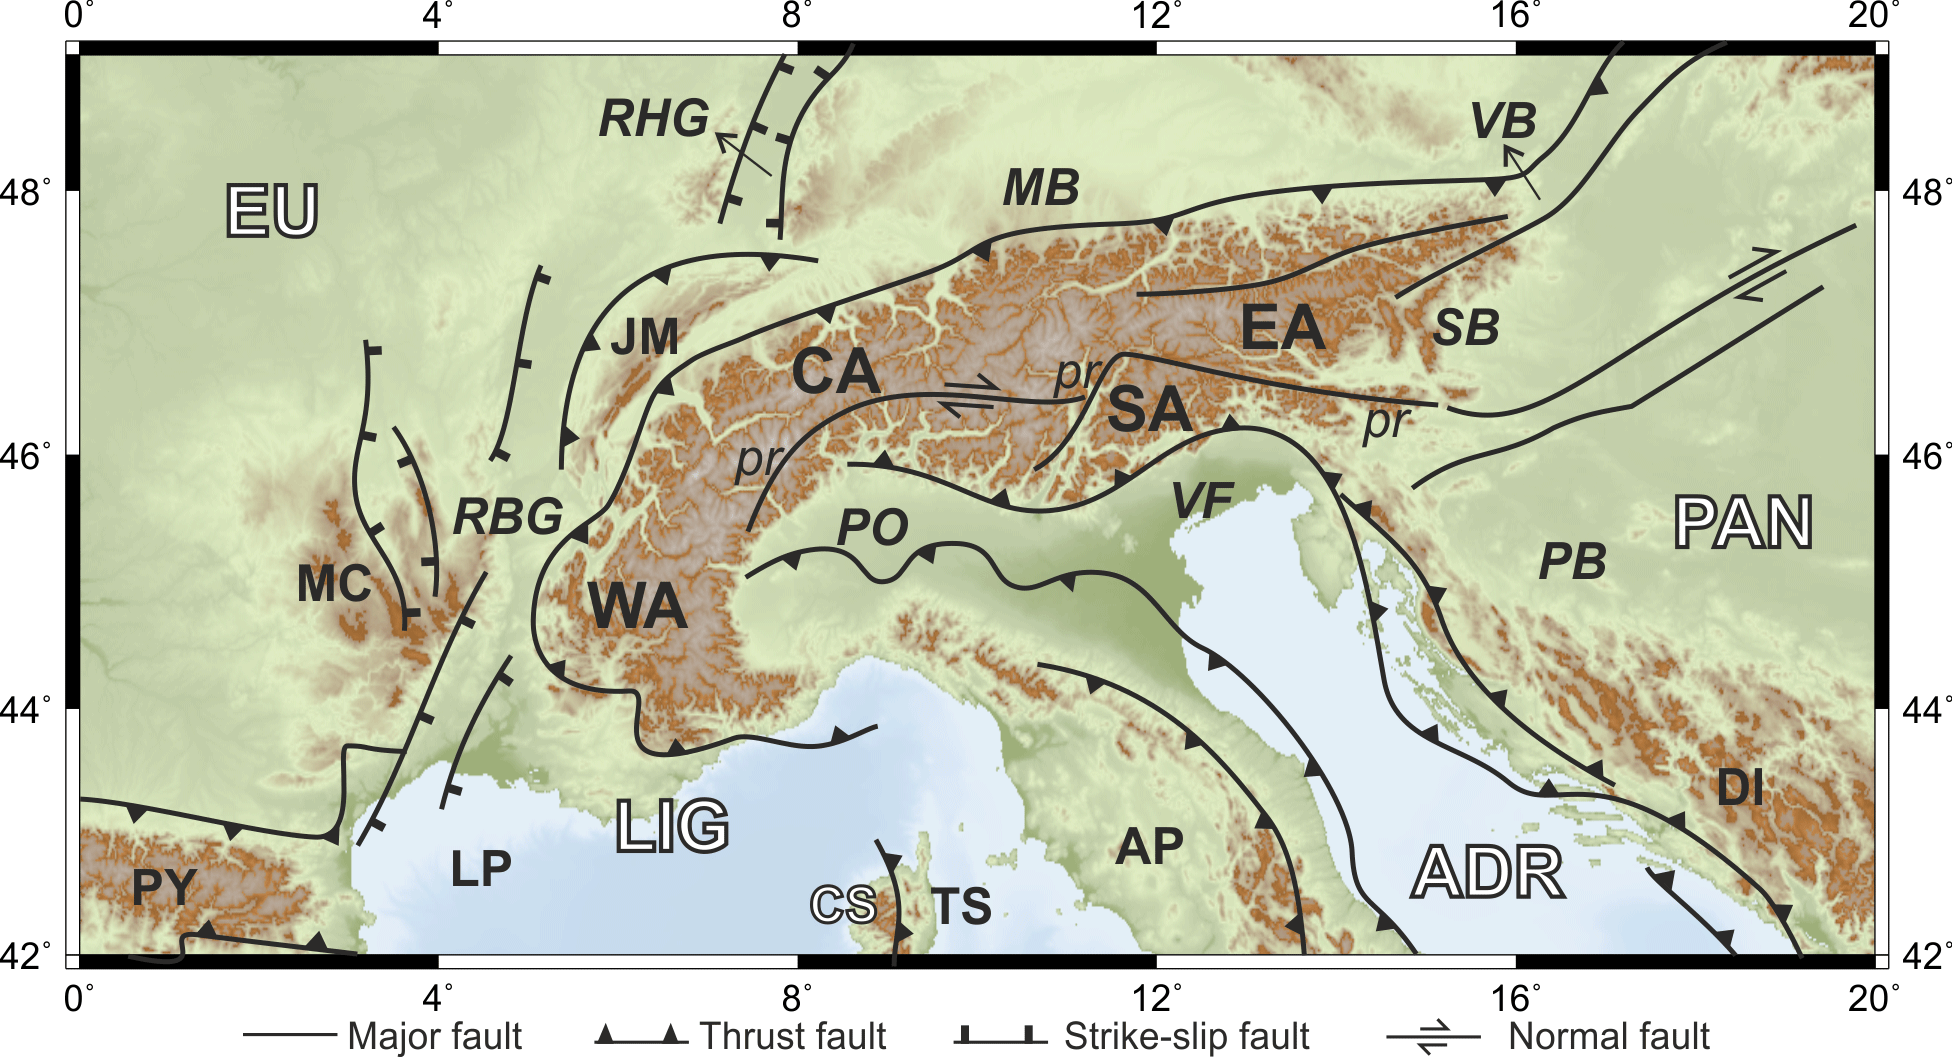
Figure 1Simplified tectonic map of the Alps and surrounding areas showing the major tectonic features and faults, modified from Schmid et al. (2004) and Bousquet et al. (2012). Geographic subdivision of the Alps: WA – Western Alps, CA – Central Alps, EA – Eastern Alps, SA – Southern Alps. Tectonic plates/blocks: EU – Eurasia, ADR – Adria, LIG – Liguria, PAN – Pannonia, CS – Corso-Sardinia. Basins: LP – Liguro-Provençal, TS – Tyrrhenian, PO – Po, VF – Venetian-Friuli, MB – Molasse, PB – Pannonian, SB – Styrian, VB – Vienna. Graben: RBG – Rhône-Bresse, RHG – Rhine. Mountains and mountain belts: AP – Apennines, PY – Pyrenees, DI – Dinarides–Hellenides, JM – Jura, MC – Massif Central. Label pr identifies the Periadriatic Line. Topography and bathymetry after the ETOPO1 model (Amante and Eakins, 2009).
In this context, after a brief description of the geological and tectonic framework of the Alpine region, the third section of this paper provides details about the geographical distribution of the GNSS stations, the availability of the GNSS observations, and the data sources. Afterwards, we present in Sect. 4 the GNSS data processing strategy, the geodetic datum realisation, the analysis of the position time series, and the computation of a cumulative (multi-year) solution for the estimation of precise station positions and velocities. Section 5 concentrates on the computation of the kinematic model: correlations between the station velocities and the tectonic settings are analysed, the modelling methodology is presented, and the vertical and horizontal deformation models are briefly described. Finally, the strain field computation is summarised in Sect. 6. The reliability of the results obtained in this study is validated by contrasting them with the deformation patterns and the displacement rates published in the existing literature. With this work, we are providing a present-day surface-kinematic model for the Alpine region based on a high-level GNSS data processing.
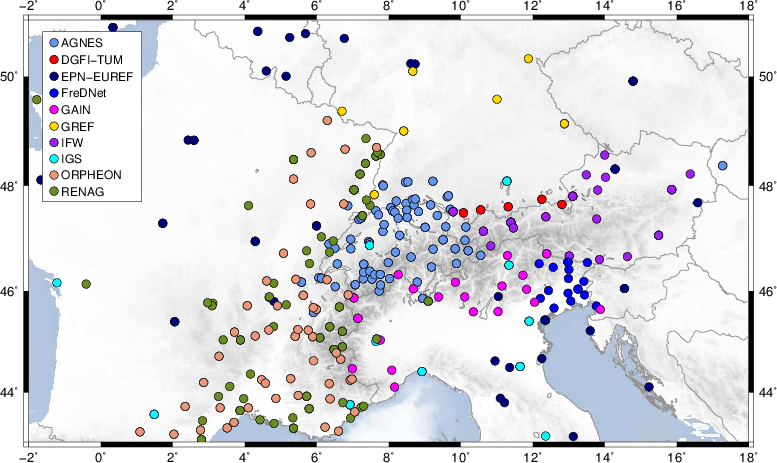
Figure 2CO-GNSS stations processed for the estimation of the surface kinematics in the Alps. The stations of the contributing CO-GNSS arrays are colour coded. Topography and bathymetry after the ETOPO1 model (Amante and Eakins, 2009).
We focus on the estimation of the present-day kinematics in the Alps and surrounding areas based on GNSS measurements gained during the last decade. Previous processes associated with the tectonic evolution and their effects are usually deduced from geophysical modelling, but they are beyond the scope of this work. The main tectonic blocks underlying the Alps and their forelands are the Eurasian Plate in the north and the west, the Adriatic and Ligurian microplates in the south, and the Pannonian fragment in the east (Fig. 1). The boundaries between these units are mainly inferred from (natural and controlled) seismic data and tomographic inversions; see details in Pfiffner et al. (1990), Waldhauser et al. (1998), Doglioni and Carminati (2002), Lippitsch et al. (2003), Kissling et al. (2006), and Brückl et al. (2007). The push of the African Plate against the Eurasian Plate causes an underthrusting motion beneath the Southern Alps as indicated, for instance, by the seismicity in the Friuli area. In addition, the Adriatic promontory rotates anticlockwise, indenting the Eastern Alps and Dinarides in the north (e.g. Nocquet and Calais, 2004; Handy et al., 2015) and subducting beneath the Hellenides in the south (Grenerczy et al., 2005; Bennett et al., 2008). The polarity of subduction changes from one area to the other: while the European lithosphere is subducted beneath the Alps, the African lithosphere is subducted beneath the Apennines and the Dinarides–Hellenides (Argnani, 2009). In this way, Alps, Apennines, and Dinarides–Hellenides are still active orogens, although at different rates (D'Agostino et al., 2005; Devoti et al., 2008; Cuffaro et al., 2010; Cheloni et al., 2014). Each subduction is associated with the usual vertical motions; i.e. subsidence in the foreland basin and uplift in the mountain belt. The continuous curved orogenic belt built by the Alps together with the Carpathians and the Dinarides–Hellenides bifurcates and encircles the Pannonian Basin system (Doglioni, 1987; Royden, 1993; Doglioni and Carminate, 2002; Horváth et al., 2006). South of the Alps are the Po and the Venetian-Friuli basins. As mentioned, these three basins – the Pannonian, Po, and Venetian-Friuli basins – are still active foreland basins; i.e. they continue subsiding and receiving sediments (e.g. Cuffaro et al., 2010; Serpelloni et al., 2006, 2013). The Po Basin is also part of the northern foreland basin of the Apennines (e.g. Laubscher, 1988; Argnani, 2009). In the west of the Apennines and south of the Western Alps, we find the Liguro-Provençal and the Tyrrhenian basins. They are separated by the Corso-Sardinia block (Serpelloni et al., 2006, 2013). The northern foreland basin of the Alps is the Molasse Basin (Ziegler, 1990; Kuhlemann and Kempf, 2002). It runs between the Jura Mountains and the Alps in the north-western part of Switzerland and continues along the Bavarian and Austrian Alps up to Vienna. In contrast to the Pannonian and Po basins, it is not active as a foreland basin; on the contrary, large parts of it are being uplifted and eroded (Becker, 1999). On the west, the Alps are boarded by the Rhône-Bresse Graben. In general, it can be stated that the deformation in the Alpine region is dominated by the anticlockwise motion of the Adria microplate, causing compression in the Eastern Alps, dextral shear in the Central Alps and a very slow deformation in the Western Alps.
The determination of the surface kinematics in the Alpine region is based on the observations collected at 306 CO-GNSS stations (Fig. 2). Stations located at distances up to some thousand kilometres from the Alps are included to improve the geometry of the network and to ensure a reliable geodetic datum realisation. Several sites are part of the global IGS network (Dow et al., 2009), the EUREF Permanent Network (EPN) (Bruyninx et al., 2012, 2013), and the Integriertes Geodätisches Referenznetz Deutschlands (GREF). EUREF stands for the Reference Frame Sub-Commission for Europe of the International Association of Geodesy (IAG). The CO-GNSS station distribution along the Alpine mountain belt is densified with more than 30 GAIN (Geodetic Alpine Integrated Network) stations. Five of these stations were installed and are maintained by DGFI-TUM (Seitz et al., 2014). The GAIN network was established in the frame of the ALPS-GPSQUAKENET project, which was funded by the European Union under the INTERREG IIIB Alpine Space Programme from 2004 to 2007 (Aoudia et al., 2007). Additional data from CO-GNSS sites in Austria were provided by the Space Research Institute (Institut für Weltraumforschung, Graz) of the Austrian Academy of Sciences (Haslinger and Strangle, 2006). Another valuable source of data for this study is the Friuli Regional Deformation Network (FreDNet) established in 2002 (Zuliani et al., 2002; Rossi et al., 2013). While FreDNet densifies the station distribution in the Eastern Alps, the Western Alps are very well covered by CO-GNSS sites of the RENAG (Réseau National GPS, France, Nocquet et al., 2016) and Orpheon networks. Orpheon is a geodetic network providing real time and augmentation services in France. The CO-GNSS network processed in this study does not include stations in Switzerland. However, to get a homogeneous data coverage in the Central Alps, we use IGb08-based station velocities of the Automated GNSS Network for Switzerland (AGNES) provided by Brockmann et al. (2012). Figure 2 shows the station distribution according to the data sources.
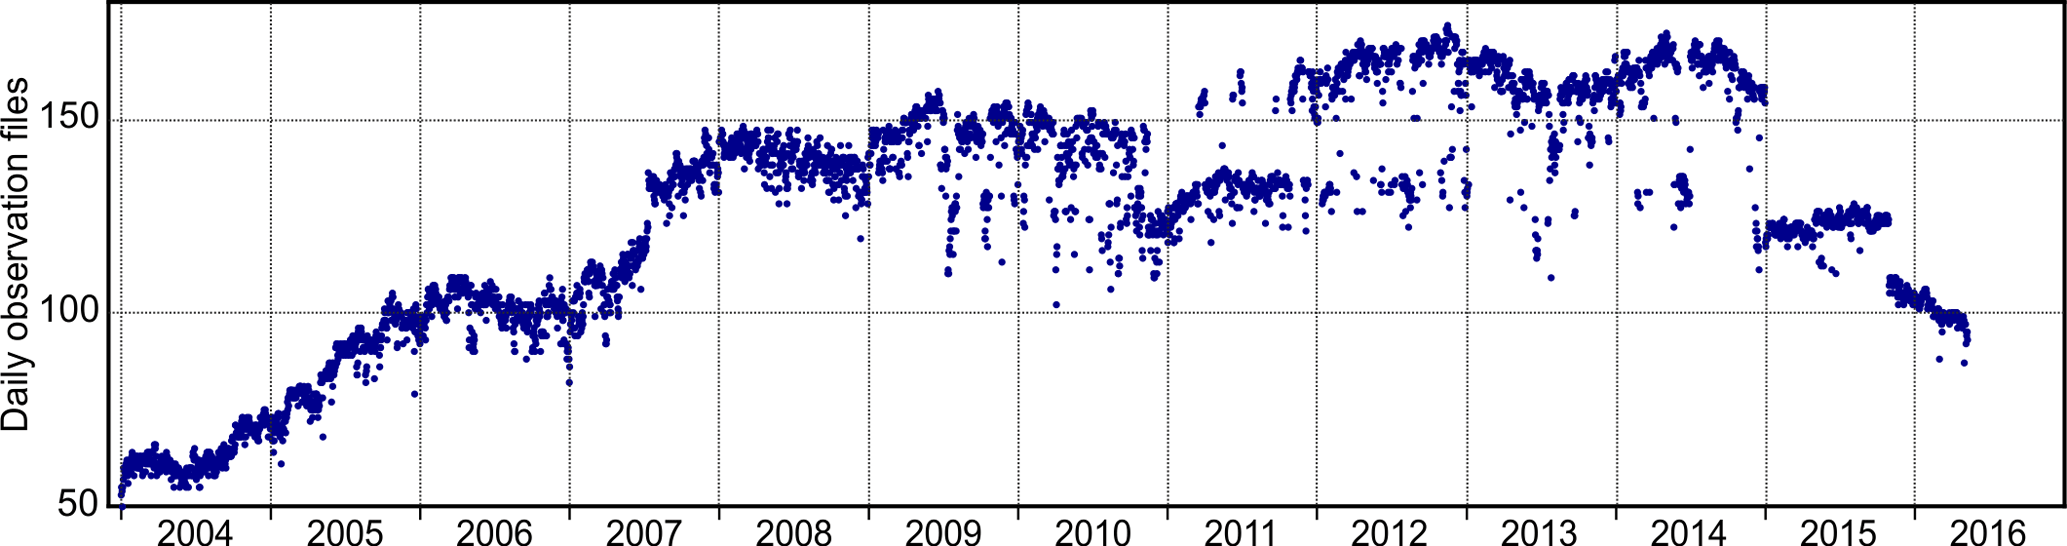
The GNSS data cover the time span from 1 January 2004 to 30 May 2016. However, the amount of the available GNSS observations varies over the years (Fig. 3). The period with the maximum number of active stations within the network is between 2012 and 2015, reaching nearly 180 CO-GNSS stations every day. The total number of the daily observation files processed in this study is about 0.57 million.
Effects of ongoing geodynamic processes may be inferred from crustal movements detected by the analysis of repeated (or continuous) geodetic observations. The basic idea is to determine (and compare) the geometry of the network formed by the geodetic stations at certain epochs. The changes in the network geometry over large time spans (e.g. years) are interpreted as a deformation of the network caused by geodynamic processes underlying the studied area. To ensure a high reliability in the determination of the network geometry, the geodetic measurements must be processed over the entire time span following strict standards and procedures. In this study, we therefore apply the same analysis strategy usually applied for the establishment of GNSS-based regional geodetic reference frames like SIRGAS (Sistema de Referencia Geocéntrico para las Américas, e.g. Sánchez et al., 2013; Sánchez and Drewes, 2016) or the EUREF Permanent Network (EPN) as a realisation of the European Terrestrial Reference System (ETRS); e.g. Völksen et al. (2009a, b). The data analysis is based on the conventions outlined by the International Earth Rotation and Reference Systems Service (IERS) for the determination of the ITRF (Petit and Luzum, 2010) and the GNSS-specific guidelines defined by the IGS for the precise processing of the global GNSS network (IGS, 2014).
In a first processing step, free weekly normal equations (NEQ) are computed. “Free” means in this context that the geometry of the GNSS network is fully consistent with the GNSS orbits, but the network's origin and orientation are not constrained yet. They will be constrained in an a posterior processing step, when the geodetic datum for the GNSS network is introduced. The free weekly NEQ covering the complete time span from January 2004 to May 2016 are combined to a multi-year solution with constant velocity for each station. This includes an iterative time series analysis to detect outliers and discontinuities in the weekly station positions. In the multi-year solution, the geodetic datum is realised with respect to the coordinates (positions and velocities) of selected reference stations. The station velocities represent the mean displacement per year of the CO-GNSS stations and they are the primary input data to model the surface kinematics. The following sections describe the key aspects of the GNSS data analysis performed in this study.
4.1 GNSS network weekly solutions
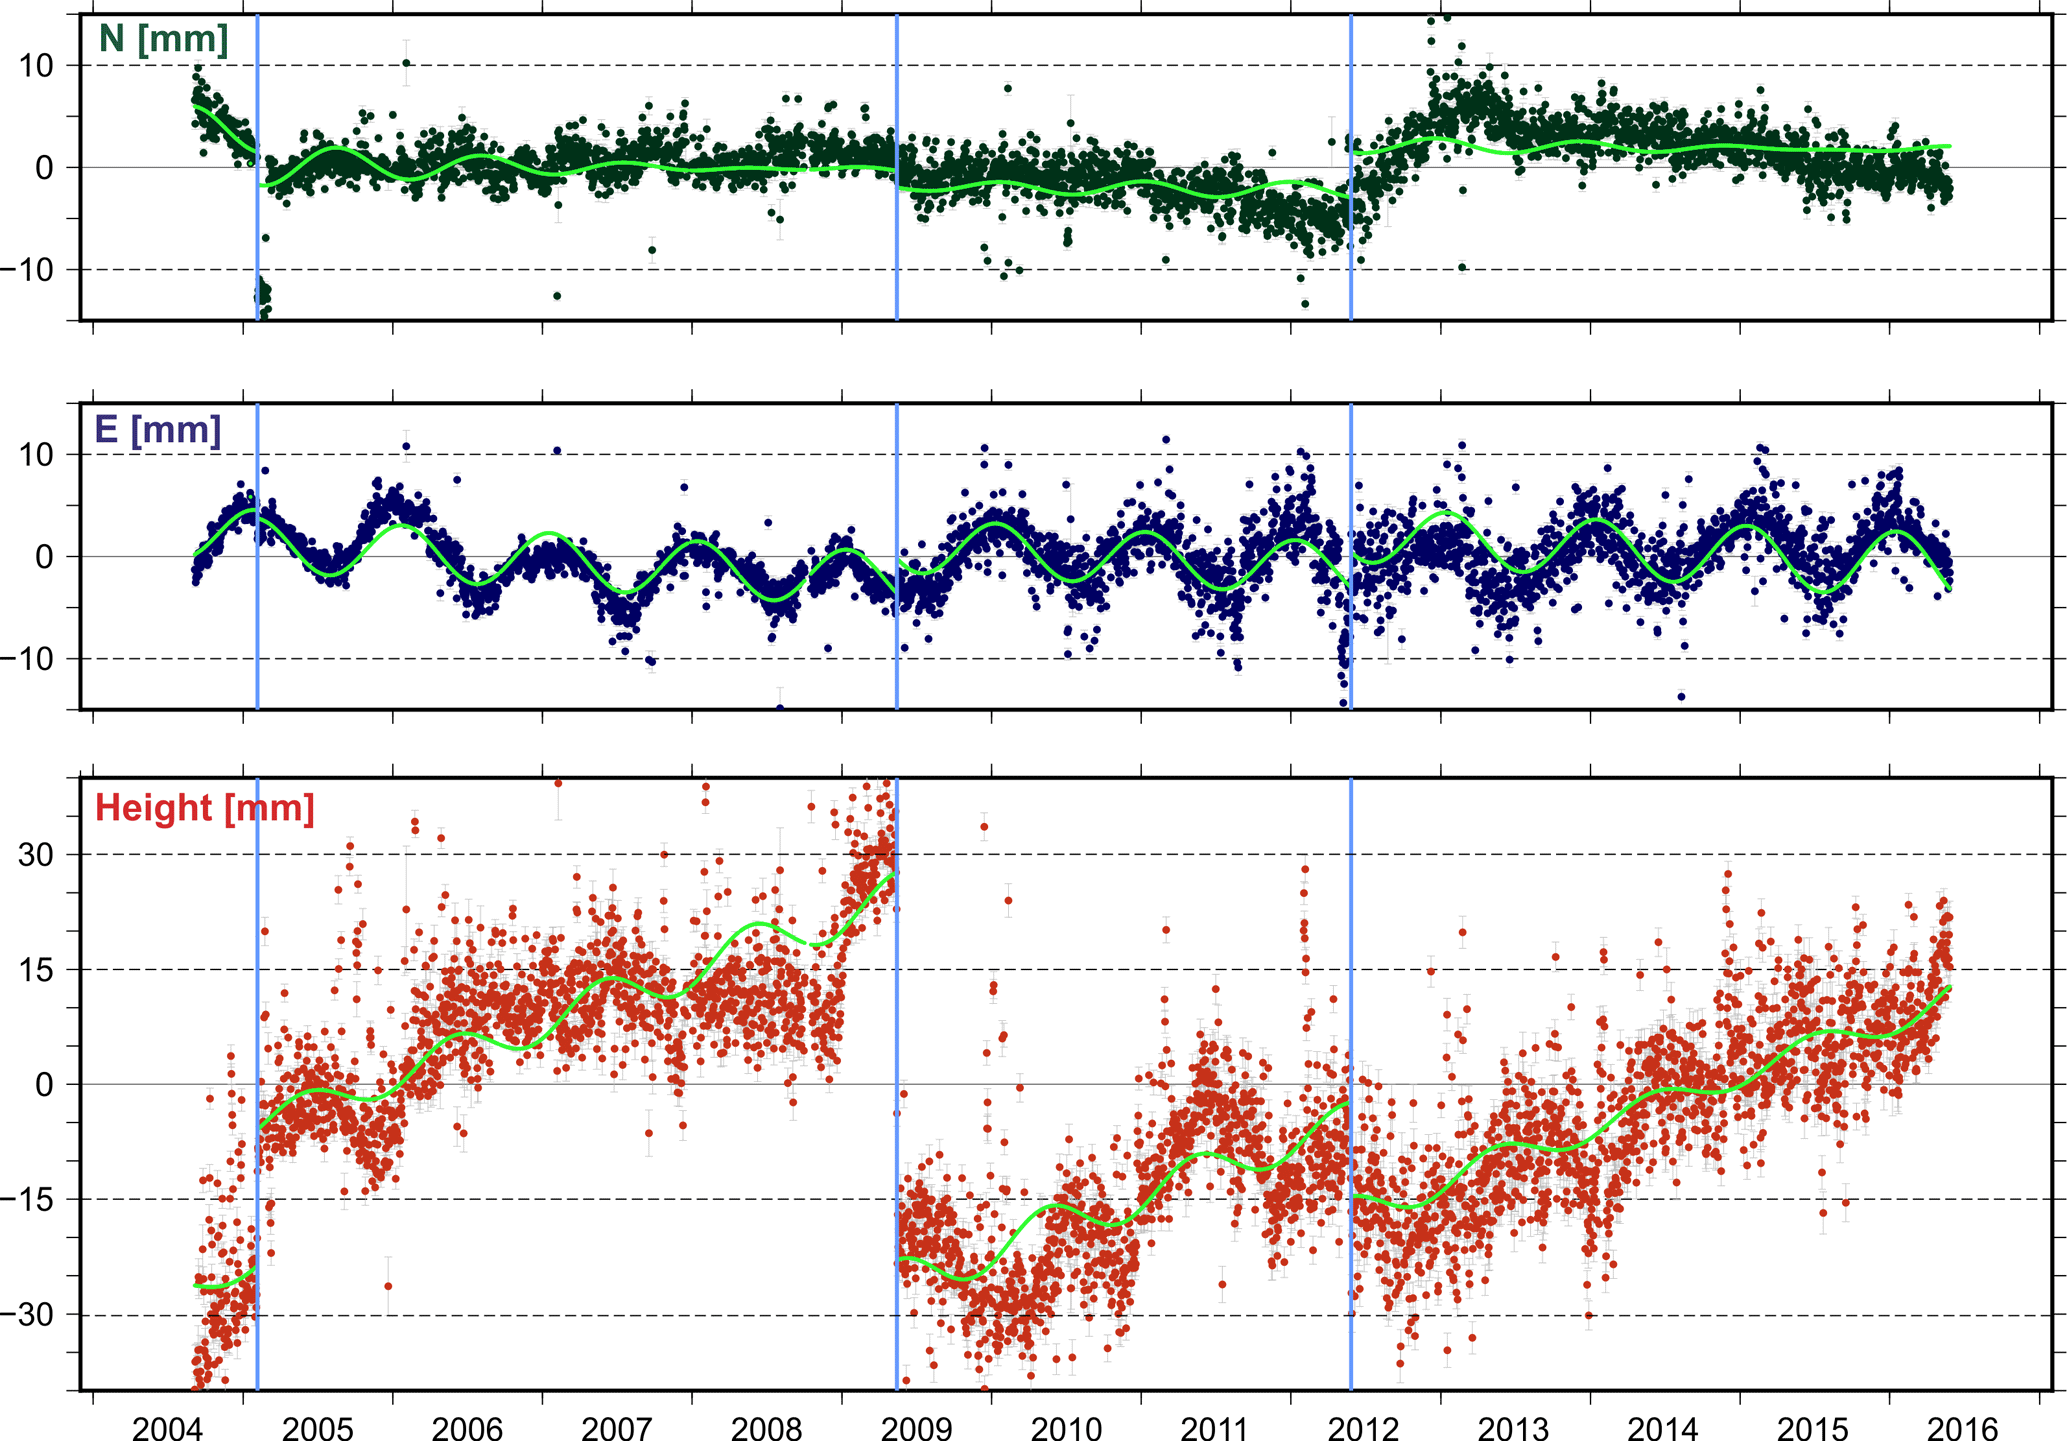
Figure 4Position time series of the station BOLG located in Bologna, Italy. Discontinuities in 2005 and 2009 (indicated by blue vertical lines) are caused by the poor monument construction of the site. Freezing water in the outer tube incorporating an inner tube carrying the antenna raised the inner tube like a piston. In 2009 the inner tube was put in its original place (Bruni et al., 2014). The blue line in 2012 represents the discontinuity caused by seismic events that occurred on 20 May (Mw 6.0) and 29 May (Mw 5.8) 2012 in northern Italy (11.230∘ E, 44.890∘ N and 11.086∘ E, 44.851∘ N, respectively). Piecewise sinusoidal lines in light green represent a functional model approximating the seasonal motions detected at the station.
The processing of the daily GNSS observations is accomplished using the double-difference baseline approach and the least-squares adjustment implemented in the Bernese GNSS Software V5.2 (Dach et al., 2015). The main processing characteristics are as follows:
-
GPS and GLONASS observations at a 30 s sampling rate are considered.
-
The basic observation is the L3 ionosphere-free linear combination.
-
The satellite orbits, satellite clock offsets and EOPs are fixed to the values generated by the IGS processing centre CODE (Center for Orbit Determination in Europe, Dach et al., 2017; Steigenberger et al., 2014; http://www.aiub.unibe.ch/download/REPRO_2013, last access: 20 August 2018). To ensure consistency, reprocessed (2004–2013) and final CODE (2014–1016) products based on the reference frame IGS08/IGb08 are used for the analysis.
-
The antenna phase centre offsets and direction-dependent phase centre corrections for both satellite transmitting and ground receiving antennas are taken from the model igs08.atx (Schmid et al., 2016; ftp://www.igs.org/pub/station/general/pcv_archive/, last access: 20 August 2018).
-
The tropospheric zenith delay is modelled using the global mapping function (GMF, Böhm et al., 2006). Here, the a priori zenith hydrostatic delay (ZPD) values are derived from gridded coefficients based on the global pressure temperature (GPT) model (Böhm et al., 2006) and are refined by computing zenith wet delays (ZWD) in a 1 h interval (also using GMF). In addition to model azimuthal asymmetries, horizontal gradient parameters are estimated using the model described by Chen and Herring (1997).
-
Corrections for the solid Earth tide, permanent tide, and solid Earth pole tide are applied as described in Petit and Luzum (2010). The ocean tide loading is estimated with the FES2004 model (Letellier, 2004) and the atmospheric tide loading caused by the semidiurnal constituents S1 and S2 is estimated following the model of van Dam and Ray (2010). The coefficients for the ocean tide loading are provided by Machiel Simon Bos and Hans-Georg Scherneck at http://holt.oso.chalmers.se/loading/ (last access: 20 August 2018). The coefficients for the atmospheric tide loading are provided by Tonie van Dam at http://geophy.uni.lu/ggfc-atmosphere/tide-loading-calculator.html (last access: 20 August 2018).
-
Non-tidal loadings such as atmospheric pressure, ocean bottom pressure, or surface hydrology are not reduced.
-
The seven daily free normal equations corresponding to a week are combined to generate a free normal equation per week. In this combination, stations with large residuals in any daily normal equation (more than ±10 mm in the horizontal or more than ±15 mm in the vertical) are removed from the corresponding daily equation and the weekly combination is recomputed.
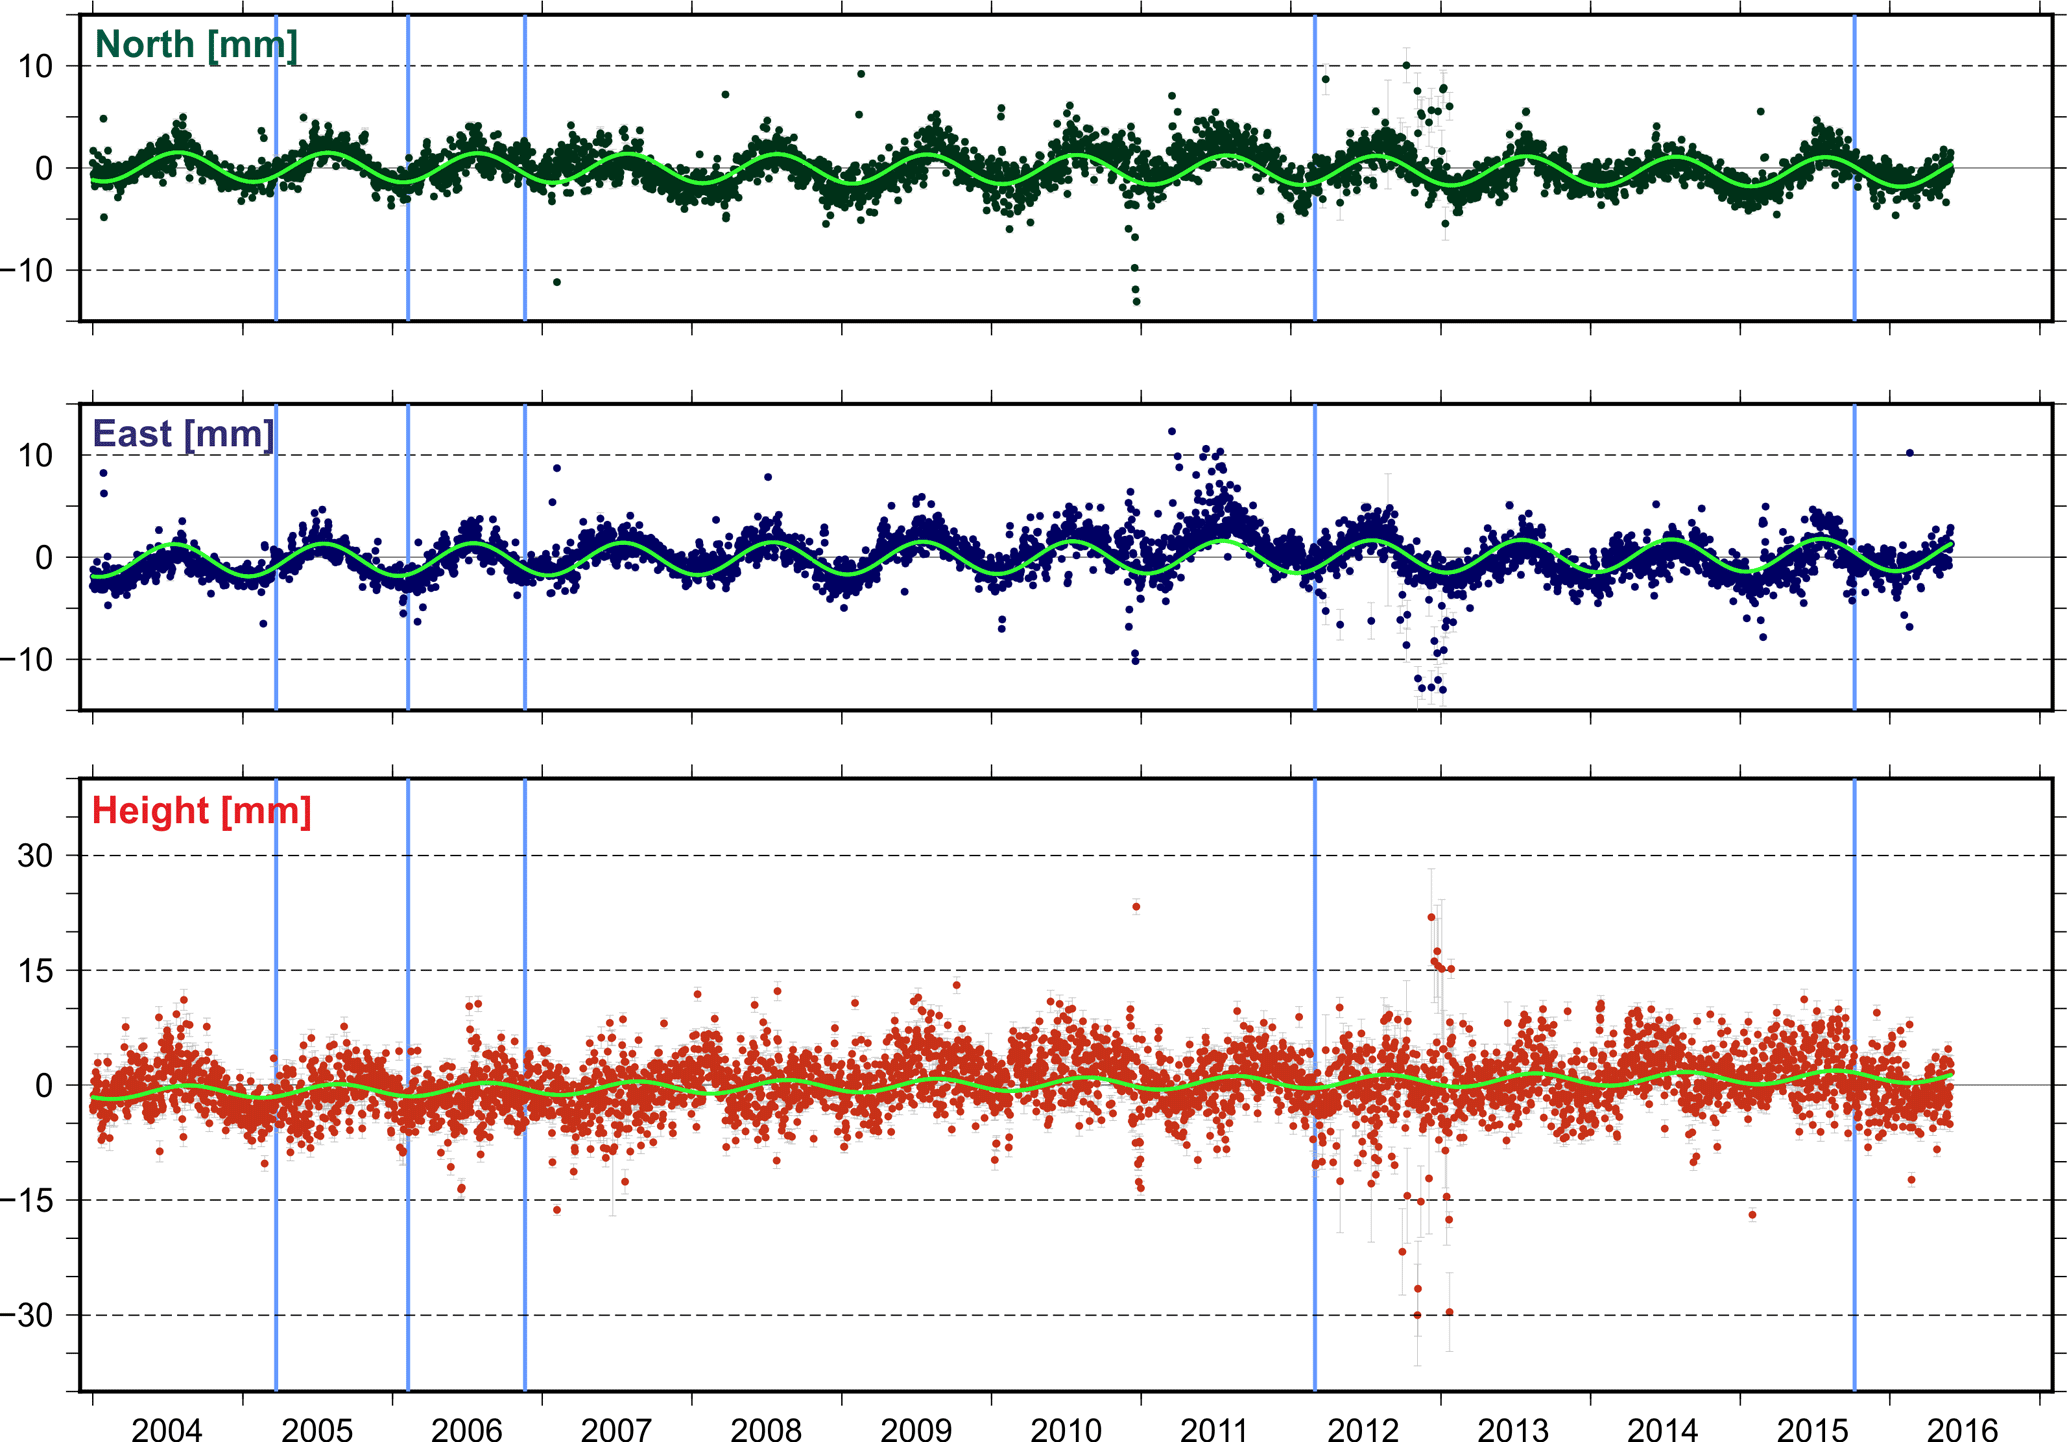
Figure 5Position time series of the station KARL located in Karlsruhe, Germany. Annual signals are well observed in the north and east components. Equipment changes (indicated by the blue vertical lines) do not seem to affect the time series.
4.2 Determination of precise station positions and velocities
The determination of the station coordinates is performed within a multi-year solution. In a first step, all free weekly NEQ available from January 2004 to May 2016 are combined and solved using the programme ADDNEQ2 of the Bernese GNSS Software V5.2 (Dach et al., 2015). Based on this preliminary solution, in a second step, residual time series for each station are generated to identify outliers or discontinuities that may mislead the computation of the station velocities. In this study, we use as thresholds ±10 mm for the north and east components and ±20 mm for height (about 4-fold the mean RMS). Sporadically occurring outliers are removed from the respective weekly NEQ. If outliers reflect a discontinuity (i.e. they appear in successive NEQ), a new position is estimated for this station. Most of these discontinuities are caused by the replacement of antennas and receivers, either because of defects or to modernise the equipment. In some cases, the discontinuities are caused by local (poor construction of the monument) or seismic effects and they may be followed by changes in the linear movement of the station; thus, new position and velocity values must be estimated for the affected stations (see an example in Fig. 4). Once outliers are removed and discontinuities are identified, a new multi-year solution is computed, new residual time series are generated, and the time series analysis is repeated to identify remaining outliers or discontinuities. This process is iteratively performed until no more outliers or discontinuities remain. The geodetic datum is realised by imposing two minimum constraint conditions with respect to the IGb08 coordinates of the reference stations. The no-net-translation (NNT) condition ensures that the origin [] of our network coincides with the origin of the network built by the reference stations. The no-net-rotation (NNR) condition aligns the orientation of our network to the orientation defined by the network built by the reference stations. In this study, we selected six IGb08 sites (WTZR, ZIMM, GRAS, GRAZ, MEDI, LROC; Fig. 7) as reference stations (see Rebischung et al., 2012; ftp://igs-rf.ign.fr/pub/IGb08/IGb08.snx, last access: 20 August 2018). The main selection criteria is based on the homogenous distribution of the reference stations across the CO-GNSS network, rare incidents of equipment changes, and a nearly complete coverage of the time series from January 2004 to May 2016.
In general, the station position time series describe clear seasonal motions (Fig. 5), which are assumed to be a consequence of non-modelled geophysical loading or local effects superimposed with GNSS inherent systematic errors (e.g. Blewitt et al., 2001; Collilieux et al., 2010, 2012; Drewes et al., 2013; King et al., 2008; Ray et al., 2008). Therefore, to increase the reliability of the constant velocities required for modelling the surface kinematics, stations with time series shorter than 2 years are excluded from further computations. The station position time series of the entire network present an averaged RMS value of about ±1 mm in the horizontal component and ±2.5 mm in the height component (Fig. 6). The final multi-year solution for the CO-GNSS network covering the Alpine region refers to the IGb08, epoch 2010.0. While the averaged RMS precision for the station positions at the reference epoch is ±1.1 mm in N and E and ±2.3 mm in height, the averaged RMS precision for the station velocities is ±0.2 mm a−1 in N and E and ±0.4 mm a−1 in height. Figures 7 and 8 show the horizontal station velocities (after removing the Eurasian Plate motion) and the vertical station velocities, respectively.
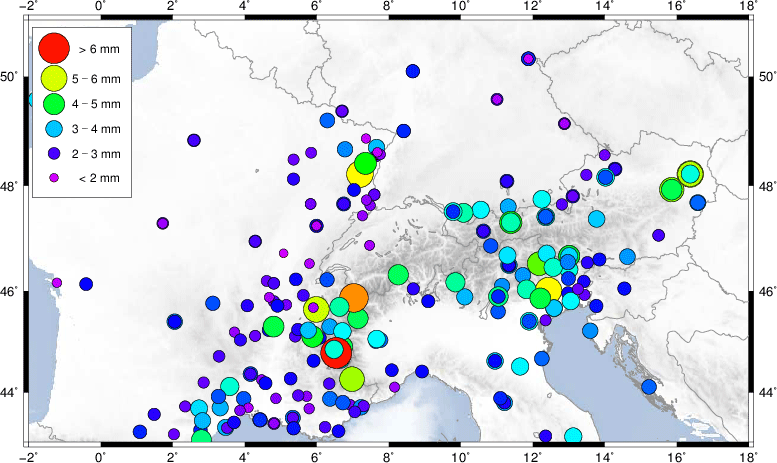
Figure 6Mean RMS values of the station position time series for the period January 2004 to May 2016.

Figure 7Horizontal station velocities relative to the Eurasian Plate with 95 % error ellipses. Labels identify the reference stations used for the geodetic datum definition: GRAS (Caussols, France), GRAZ (Graz, Austria), LROC (La Rochelle, France), MEDI (Medicina, Italy), WTZR (Bad Kötzting, Germany), and ZIMM (Zimmerwald, Switzerland). Topography and bathymetry after the ETOPO1 model (Amante and Eakins, 2009).
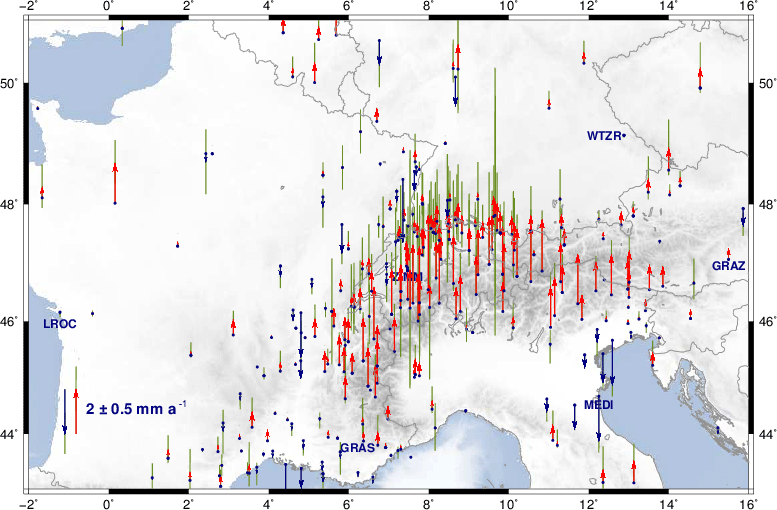
Figure 8Vertical station velocities: red arrows indicate uplift, blue arrows represent subsidence, and green bars show 95 % confidence. Labels identify the reference stations used for the geodetic datum definition: GRAS (Caussols, France), GRAZ (Graz, Austria), LROC (La Rochelle, France), MEDI (Medicina, Italy), WTZR (Bad Kötzting, Germany), and ZIMM (Zimmerwald, Switzerland). Topography and bathymetry after the ETOPO1 model (Amante and Eakins, 2009).
4.3 Velocity solution
According to the results presented in Fig. 7, we observe in the Alps–Pannonian–Dinarides junction zone horizontal velocities in the range 1–4 mm a−1 relative to the stable part of the Eurasian Plate. These large relative velocities are controlled by the north-eastward motion of the Adria microplate towards the Southern and Central Alps and the Dinarides. Based on our few CO-GNSS sites in the Apennines, we see apparently an extension of 2–4 mm a−1 across these mountains and a 0.5–2 mm a−1 shortening across the southern front of the Eastern Alps. These findings are in agreement with the conclusions presented by Devoti et al. (2017) in a recent study. They infer a crustal extension rate of about 3 mm a−1 across the Apennine belt and a compression of about 2 mm a−1 towards the Adriatic foreland (see Devoti et al., 2017, Fig. 9, profiles A–B and C–D). A progressive eastward rotation of the velocities towards the Pannonian Basin is also detected. The relative velocities of the stations located in the Western Alps and surrounding areas like the Po Basin, the Rhône-Bresse Graben, and southern France are very small (0.1–0.4 mm a−1), allowing us to infer a very slow horizontal deformation in this region. Nocquet et al. (2016) call this a “virtually zero horizontal velocity”. As expected, stations situated in the stable part of the Eurasian Plate show velocities around zero; some exceptions reflect mostly local effects.
While the motion of the Eurasian Plate dominates the horizontal velocities, the vertical velocities (Fig. 8) mirror in general the orogenic processes in the Alpine region: uplift of the mountain chains and subsidence of the active foreland basins. A wide area of the Western Alps presents an uplift rate of approximately 2.2 mm a−1 decreasing westwards. In fact, stations located west of the Alpine foreland show zero vertical rates. The southern part of the Eastern Alps shows a slower vertical uplift rate of about 1.0–1.5 mm a−1, which decreases towards the north. The CO-GNSS stations located in the northern margin of the Alps in Germany and Austria present uplift rates of less than 0.6 mm a−1 decreasing eastwards. Subsidence rates of about 1 mm a−1 are observed in the Rhine and Rhône-Bresse Grabens as well as in the Venetian-Friuli Basin. They increase southwards and reach up to 2 mm a−1 at the coasts in Marseille and Venice, respectively.
In general, it can be stated that the vertical velocities shown in Fig. 8 are a result of the combination of three main mechanisms: (i) uplift caused by the ongoing convergence of Eurasia and Africa; (ii) orogenic gravitational movement due to erosion, collapse, and associated isostatic compensation; and (iii) isostatic rebound caused by the melting of the Alpine ice shields since the last glacial maximum 22 000 years ago, i.e. glacial isostatic adjustment (GIA). The orogenic gravitational movement is much slower than the GIA; however, it is clear that the eroded rock masses are redistributed to the surroundings with lower elevation (delta valleys and sedimentary basins). This may cause a bedrock uplift and surface height lowering in the mountains as well as a bedrock subsidence and a regional surface height increase in the foreland basins. According to Persaud and Pfiffner (2004), Barletta et al. (2006), and Stocchi et al. (2005), the crustal uplift caused by GIA in the Alpine region varies from 0.06 to 0.20 mm a−1. This assessment suggests that the first two mechanisms (plate convergence and orogenic gravitational movement) are the main contributors to the vertical rates obtained in this study.
Based on the precise station velocities estimated previously, the objective of this section is to describe the surface-kinematic modelling performed within this study. We distinguish three main components: a deformation model, a continuous velocity field, and a strain field. A common trend motion is removed from the CO-GNSS station velocities to obtain the so-called residual velocities. The common trend motion represents a large-scale variation, while the residual velocities represent short-scale variations. The common trend motion in the horizontal component is usually well represented by the motion of the tectonic plate underlying the area of study, in this case the Eurasian Plate (see Sect. 5.1). The common trend motion in the vertical component may be assumed to be the average vertical movement of the area of study. In this work, we infer this mean vertical movement from the station velocities directly (see Sect. 5.2 and Appendix A). Once the trend motion is removed from the horizontal and vertical station velocities, the point-wise residual velocities are correlated with the existing tectonic structures (Fig. 1) and then they are interpolated to a regular grid. The interpolation of the residual velocities provides us with the deformation model (Sect. 5.2 and 5.3), which is the basis for the computation of the strain field (Sect. 6). The common trend motion (i.e. the Eurasian Plate motion and the average vertical motion) removed from the initial station velocities is restored to the deformation model to get a continuous velocity field (Sect. 5.4). Various geodetic and geophysical methods based on mathematical interpolation approaches or physical crust models may be applied to represent the continuous surface deformation from point-wise velocities. A frequently used interpolation method is the least-squares collocation (e.g. Moritz, 1973; Drewes, 1978); to include the physical properties of the deforming body, the finite element method is an appropriate tool (e.g. Meissl, 1981; Heidbach and Drewes, 2003). It has been demonstrated that for the sole representation of the Earth surface deformation, the results of both methods are nearly identical (e.g. Drewes and Heidbach, 2005). Therefore, we use here the least-squares collocation method.
5.1 Least-squares collocation (LSC) approach
The primary principle of LSC is the correlation of physical parameters (in this case, station velocities) between adjacent points. The observations are divided into a systematic linearised part (or trend) and two independent random parts: the signal and the observation error (or noise). The parameters describing the systematic component and the stochastically correlated signals are estimated by minimising the noise. The estimated parameters and signals together with a given spatial correlation allow the prediction (interpolation) of “fictitious measurements” at regions where no observations exist. In spatial applications, the correlation function is usually considered as a function dependent on the distance. The so-called correlation distance d should be in agreement with the spacing of the stations and the wavelength of the expected signal. If d is smaller than the mean station spacing, artefacts may appear in the interpolation. If d is too large, a smoothing similar to a filtering effect may occur. According to the station distribution in our network (Fig. 2), the initial maximum distance was set to 100 km for selecting the points of a collocation domain. If not enough points were found, the distance was enlarged until the necessary number of at least four points was available. The grid size for the interpolation was set to 25 km × 25 km. This grid size is chosen as appropriate since it corresponds to the mean station spacing in the most densely covered region within the network (i.e. the French and Swiss Alps). A larger grid size would average out the results and this filtering should be avoided. Appendix A provides a detailed description of the LSC formulation applied in this study.
According to the tectonic plate boundary model PB2002 (Bird, 2003), we assume that the Adria, Pannonia, and Liguria blocks constitute a deformation zone along the southern Eurasian Plate boundary. We do not consider small lithospheric blocks rotating with independent Euler vectors, but a continuous and viscous lithosphere deforming under certain kinematic boundary conditions as suggested, for instance, by Flesch et al. (2000); Vergnolle et al. (2007); or Copley (2008). However, as horizontal and vertical station motions are dominated by different mechanisms (see Sect. 4.3), the LSC procedure is applied separately: as a vector prediction for the horizontal component and as a scalar prediction for the height component. In the empirical procedure, the geocentric Cartesian station positions and velocities obtained within the multi-year solution (Sect. 4.2) are transformed together with their precision values into ellipsoidal coordinates and . The Eurasian Plate motion is removed from horizontal velocities (vϕ,vλ) of the stations. The corresponding rotation vector Ω ( E, N, 0.2598±0.0011∘ Ma−1) is inferred from our CO-GNSS stations located on the stable part of the plate following the approach presented by Drewes (1982, 2009). Our values are very similar to the rotation vector derived from the ITRF2008 Ω ( E, N, Ma−1) (see Altamimi et al., 2012). The small differences are a consequence of the different station distribution (stations used for the estimation of Ω in this study and in the ITRF2008 are not the same) and the different time span considered for the station velocity estimation (our study includes observations up to May 2016, while the ITRF2008 includes observations up to May 2009; Altamimi et al., 2011).
After removing the Eurasian Plate motion from the station horizontal velocities, the LSC interpolation is applied following the formulation described in Appendix A. In this procedure, outliers with discrepancies larger than 0.5 mm a−1 with respect to the velocities of the surrounding stations are considered to be affected by local effects and they are not included in the collocation.
5.2 Horizontal deformation model

Figure 9 GNSS-inferred horizontal deformation model of the Alpine region. Red arrows represent the predicted surface deformation. Blue arrows represent the input residual velocities. Green dots show the CO-GNSS station distribution. Uncertainty ellipses are separately shown in Fig. 10. Topography and bathymetry after the ETOPO1 model (Amante and Eakins, 2009).
The deformation model presented in Fig. 9 describes the surface kinematics of the Alpine region with respect to the Eurasian Plate. Two distinct kinematic patterns can clearly be seen: the Western Alps as well as the western and northern surrounding areas (Liguro-Provençal Basin, Massif Central mountains, Rhône-Bresse Graben, Jura Mountains, and Molasse Basin) show a small and statistically insignificant motion, indicating that these regions move north-eastward with the Eurasian Plate. This stationary pattern contrasts with the pronounced N- and NE-oriented movement predicted in the Southern and Eastern Alps as well as in the Apennine Peninsula, the Venetian-Friuli Basin, and the northern part of the Dinarides. It is also evident that the magnitude of deformation increases from 0.1 mm a−1 in the western part of Switzerland to the south and to the east, reaching 3.0 mm a−1 in the northern part of the Apennine Peninsula and about 1.5 mm a−1 in the Austrian Alps, respectively. The two kinematic patterns are apparently separated by the so-called Periadriatic Line, a fault system in EW direction along the boundary between the Southern Alps and the Adriatic region (around latitude 46∘ N, see Fig. 1). The magnitude of the deformation vectors across the westernmost part of the Po Basin and the south of the Western Alps is less than 0.2 mm a−1. The average residual motion with respect to the Western Alps is not larger than 0.1 mm a−1, indicating that presently there is no shortening in this region. These findings are confirmed by Nocquet et al. (2016), who suggest an upper bound of 0.3 mm a−1 (with 95 % confidence) for possible right-lateral strike slip motion in the western Alpine area.
Unlike the Western Alps, where the deformation vectors indicate a very small (insignificant) internal surface deformation, the Central Alps present an increasing north-oriented deformation from 0.2 mm a−1 at the longitude 6∘ E to 0.6 mm a−1 close to longitude 11∘ E. This deformation pattern continues over the Southern Alps up to longitude 13∘ E, where the deformation vectors describe a progressive eastward rotation towards the Pannonian segment, reaching magnitudes up to 1.3 mm a−1 and an orientation of about N20∘ E near longitude 16∘ E. These vectors also make evident a shortening of about 2 mm a−1 across the southern front of the Eastern Alps, in the northern area of the Venetian-Friuli Basin. This is in agreement with the results published by Devoti et al. (2017), Métois et al. (2015), and Cheloni et al. (2014). Although our CO-GNSS network presents a sparse station distribution in the northern Apennines and the Dinarides, our prediction supports the conclusions of D'Agostino et al. (2014) and Nocquet (2012) in those regions. In the former case, we identify a motion roughly oriented to the north-east with the largest magnitudes (∼ 3 mm a−1) across the highest topographic features of the Apennines towards the Adriatic Sea. In the opposite direction, towards the Tyrrhenian Sea, the deformation magnitudes decrease to 1.5 mm a−1. According to Mantovani et al. (2015), this may be evidence of a faster motion of the outer Apennine belt with respect to the inner one. In the case of the Dinarides, a shortening of about 3.0 mm a−1 across the Adriatic coastline is found. This magnitude decreases towards the Pannonian Basin to 0.5 mm a−1. In the southern front of the Alps, the orientation of the deformation vectors presents a slightly progressive westward rotation from the area of Venice towards the Po Basin. These findings are quantitatively equivalent to the results presented by Möller et al. (2011) and Devoti et al. (2011, 2017). However, it should be kept in mind that, due to the low number of GNSS stations we processed in the Po Basin, our results are highly influenced by the linear gradient imposed by the LSC approach to the deformation model. To increase the reliability of our model in this particular zone, a major number of GNSS stations covering the Italian Alpine forelands should be considered. Figure 10 shows the uncertainty (95 % confidence) of the horizontal surface deformation model. The largest values (from ±0.5 to ±1.5 mm a−1) occur at those regions with poor station coverage (mainly the Apennines, Dinarides, and easternmost part of the Austrian Alps). In general, the mean accuracy of the model is ±0.2 mm a−1.
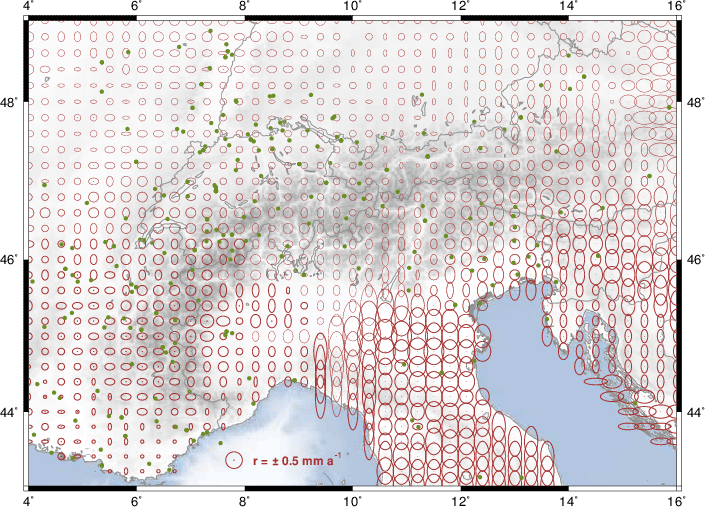
Figure 10Estimated uncertainty (95 % confidence) of the GNSS-based horizontal deformation model of the Alpine region. Green dots show the CO-GNSS station distribution. Topography and bathymetry after the ETOPO1 model (Amante and Eakins, 2009).
5.3 Vertical deformation model
The present-day vertical motion of the Alps and their surrounding areas is displayed in Fig. 11. Our results clearly show an ongoing average uplift of 1.8 mm a−1 of the entire mountain chain, with the exception of the southern part of the Western Alps (6.5∘ E, 44∘ N), where no significant uplift (less than 0.5 mm a−1) is detected. The largest uplift rates (more than 2 mm a−1) occur in the central area of the Western Alps (7∘ E, 45∘ N), in the Swiss Alps (8∘ E, 46.5∘ N), and in the Southern Alps in the boundary region between Switzerland, Austria, and Italy (11∘ E, 46.6∘ N). The uplift kinematics we present here for the Western Alps are consistent with the vertical motion patterns identified by Nguyen et al. (2016) and Nocquet et al. (2016). Our vertical rates in the Swiss Alps also agree qualitatively with similar results inferred by Brockmann et al. (2012) using not only GNSS observations, but also levelling data.
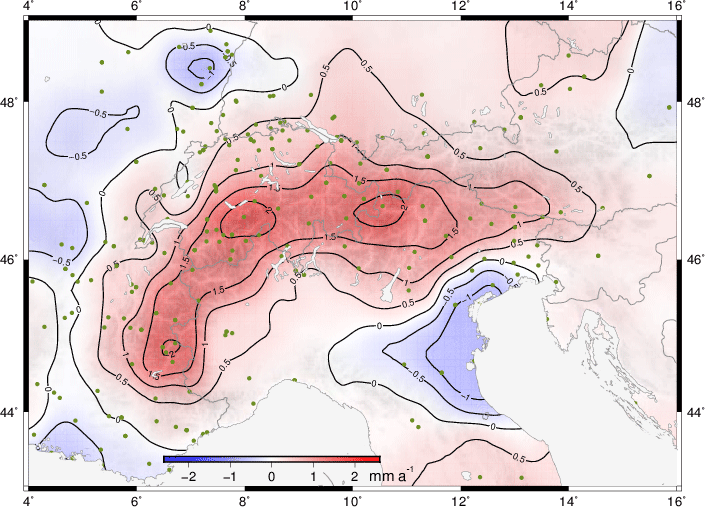
Figure 11GNSS-inferred vertical deformation model of the Alpine region. Green dots show the CO-GNSS station distribution. Topography after the ETOPO1 model (Amante and Eakins, 2009).
In the north-west area, across the Rhône-Bresse and Rhine Grabens, a well-defined regional subsidence pattern with varying rates is observed. Apparently, the largest subsidence of around −1.3 mm a−1 happens in the Rhine Graben (7∘ E, 48.5∘ N), while in the Rhône-Bresse Graben (5∘ E, 46–48∘ N) the largest rate reaches −0.8 mm a−1. In the complete studied area, the largest subsidence rates are close to −1.5 mm a−1 and are located west of the Venetian-Friuli Basin. We do not detect a significant subsidence in the western part of the Po Basin; this may be a consequence of the poor distribution of our CO-GNSS stations in that region. Actually, Devoti et al. (2017) inferred a mean subsidence rate of about −0.8 mm a−1 in the Po Basin. The maximum (−3 mm a−1) and minimum (−0.5 mm a−1) magnitudes occur near Venice and in the eastern margin of the Western Alps, respectively (see Devoti et al., 2017, Fig. 6). Results of previous studies like Cuffaro et al. (2010) or Serpelloni et al. (2013) suggest subsidence rates up to −11 mm a−1 near Modena, Italy (11∘ E, 44.6∘ N). However, we do not detect these extreme vales. This may be explained by the fact that we eliminate stations with strong local effects before the computation of the vertical-kinematics model, while the two studies mentioned base their conclusions on point-wise station velocities. It is well known that GNSS systematic errors and non-modelled local effects accumulate mainly in the estimation of the vertical coordinates. Therefore, we gave special care to identify and to remove those stations reflecting local effects (like water extraction, tunnel construction, and landslides) that may mislead the estimation of vertical motions mirroring mountain building or subsidence processes in the Alpine region.
The general uplift observed across the Alpine mountain chain decreases towards the outer regions to stable values between 0.0 and 0.5 mm a−1 and in some cases to subsidence like in the Liguro-Provençal (5∘ E, 43.6∘ N) and Vienna (15.5∘ E, 48.5∘) basins, where vertical rates of −0.8 and −0.3 mm a−1 are detected, respectively. Figure 12 displays the estimated uncertainty of the predicted uplift and subsidence rates. The largest values (from ±0.6 to ±0.8 mm a−1) occur in those areas with poor station coverage, mainly in the Apennine Peninsula and the Po Basin. The mean precision of the vertical motion model computed in this study for the Alpine mountain belt is about ±0.3 mm a−1.
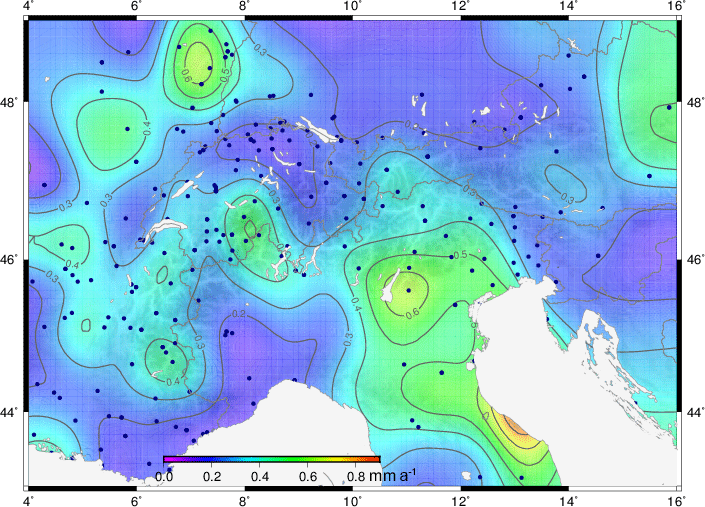
Figure 12Estimated uncertainty (95 % confidence) of the GNSS-based vertical deformation model of the Alpine region. Dark blue dots show the CO-GNSS station distribution. Topography after the ETOPO1 model (Amante and Eakins, 2009).

Figure 13 Velocity profiles in the Western Alps (cross section along longitude 6.5∘ E, a) and in the Eastern Alps (cross section along longitude 13∘ E, b). Blue dots with error bars represent the observed station velocities (with 68 % confidence). Red lines represent the north (Vn) and the vertical (Vu) components of the deformation model with their uncertainty (light red stripe). Green line shows the average topography in the profile swath, with light and dark grey shadows showing the maximum and minimum elevations, respectively.
Figure 13 shows two velocity profiles crossing the Alps along longitudes 6.5 and 13∘ E, respectively. In both cases, the vertical component (Vu) of the surface deformation presents a high correlation with the local topography. The profile in the Western Alps clearly shows the light subsidence (−0.6 mm a−1) close the Liguro-Provençal Basin (near latitude 43∘ N); the large uplift rates (more than 1.5 mm a−1) in the border area between France and Switzerland (around latitude 45.5∘ N); and a decreasing uplift rate towards the north up to the Rhine Basin (latitude 48∘ N), where subsidence is observed. In the Eastern Alps, the gradient of the vertical velocity is stronger in the southern part than in northern area. South of latitude 46∘ N, the subsidence (up to −1 mm a−1) detected in the Venetian-Friuli Basin can be well observed. North of latitude 46∘ N, we find uplift rates up to 1.2 mm a−1 in the border area between Italy and Austria (latitude 45∘ N). These rates diminish up to 0.3 mm a−1 in the border area between Austria and Germany (latitude 48∘ N). The north component (Vn) of the deformation model along longitude 6.5∘ suggests a very small (not significant) surface deformation in the Western Alps, while along longitude 13∘ E it captures the plate boundary region where the Adria microplate collides with the Eurasian Plate. The quite strong velocity gradient of nearly 2 mm a−1 over about 80 km (between latitudes 46 and 47∘ N) makes evident the NS compression occurring in the southern front of the Southern Alps.
5.4 Continuous velocity field
GNSS techniques are currently the primary tool for precise positioning. In applications of high reliability (accuracy at the 1 cm level or better), the GNSS data processing requires the reference station coordinates to be in the same reference frame and at the same observation epoch as the GNSS satellite orbits. In active seismic regions, strong earthquakes cause large changes in the station positions and velocities of the geodetic reference stations, disabling the use of previous coordinates (see for instance co-seismic and post-seismic effects of the El Maule earthquake in the Latin American reference frame presented by Sánchez and Drewes, 2016). To ensure the long-term stability of geodetic reference frames, the transformation of station positions between different epochs requires the computation of reliable continuous surface deformation (or velocity) models. Based on this kind of models, geodesists monitor the kinematics of reference frames, infer appropriate transformation parameters between pre-seismic and post-seismic (deformed) coordinates (specially in official matters like legal borders, cadastre, and land management), and interpolate surface motions arising from plate tectonics or crustal deformations in areas where no geodetic stations are established. Consequently, after computing the deformation model (Sect. 5.2), the Eurasian Plate motion removed from the CO-GNSS station velocities is restored to the deformation vectors to get a continuous velocity field referred to the ITRF. As shown in Fig. 14, the velocity field mirrors the present-day surface kinematics as a combination of deformation patterns and the Eurasian Plate tectonic motion, which is the dominant kinematic regime in Europe.
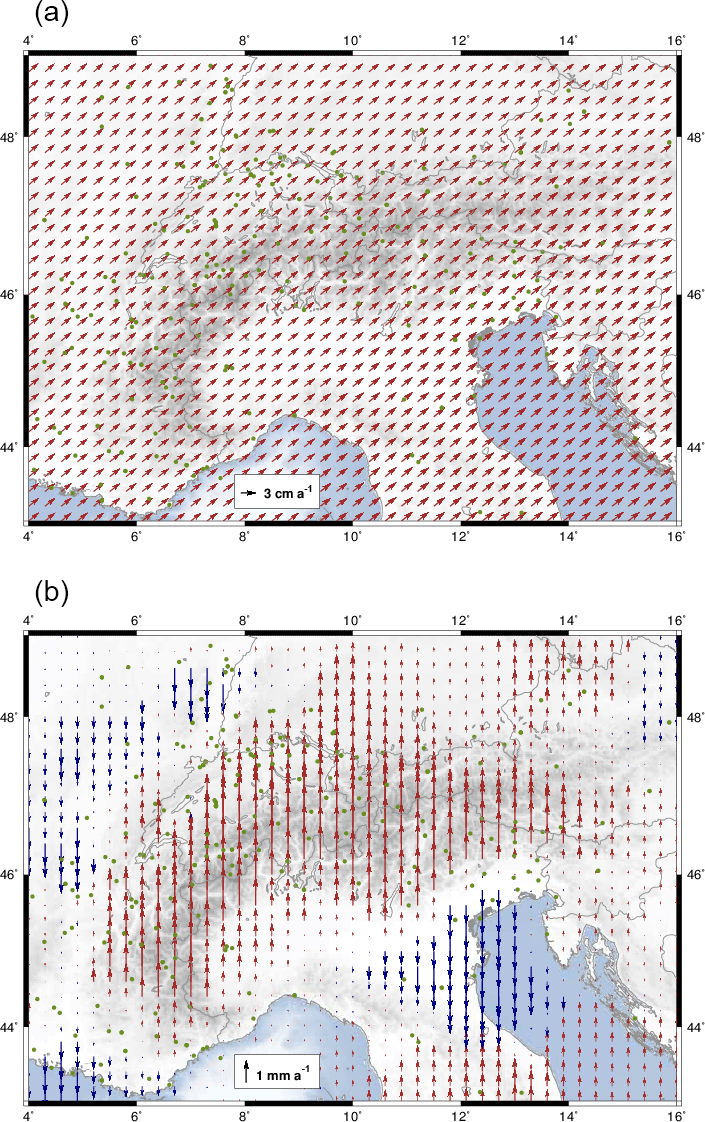
Figure 14Continuous velocity field for the Alpine region referring to the ITRF2008 (a: horizontal velocity field, b: vertical velocity field). Topography and bathymetry after the ETOPO1 model (Amante and Eakins, 2009).
The strain field represents the zones with compression, extension (or dilatation), and shear strain on the Earth's surface. In this study, the strain rates are computed from the deformation model (Fig. 9) as it provides a better (smoothed) surface coverage than the residual station velocities (Fig. 7). This strategy reduces random errors occurring at individual stations and enhances the major trends on strain patterns. Our computations are based on the infinitesimal strain theory, assuming that the deformation is much smaller (indeed, infinitesimally smaller) than any relevant dimension of the body, in this case the Alpine region. It means very small deformation changes (at the mm a−1 level) over large distances (at the km level) between grid points are presumed. In the empirical procedure, the deformation vectors computed at the grid points are used for the estimation of deformation gradients, and these gradients are used for the computation of the strain components following the equations described by Lambeck (1988, pp. 194–196). Even though the deformation field is available in three components, we concentrate only on the horizontal components. Thus, the obtained strain field is a horizontal projection of the surface deformation. The core contribution of a strain field is the possibility of distinguishing large-scale features (e.g. surface deformation and mountain building) from areas with large strain rates, which are often seismically active.
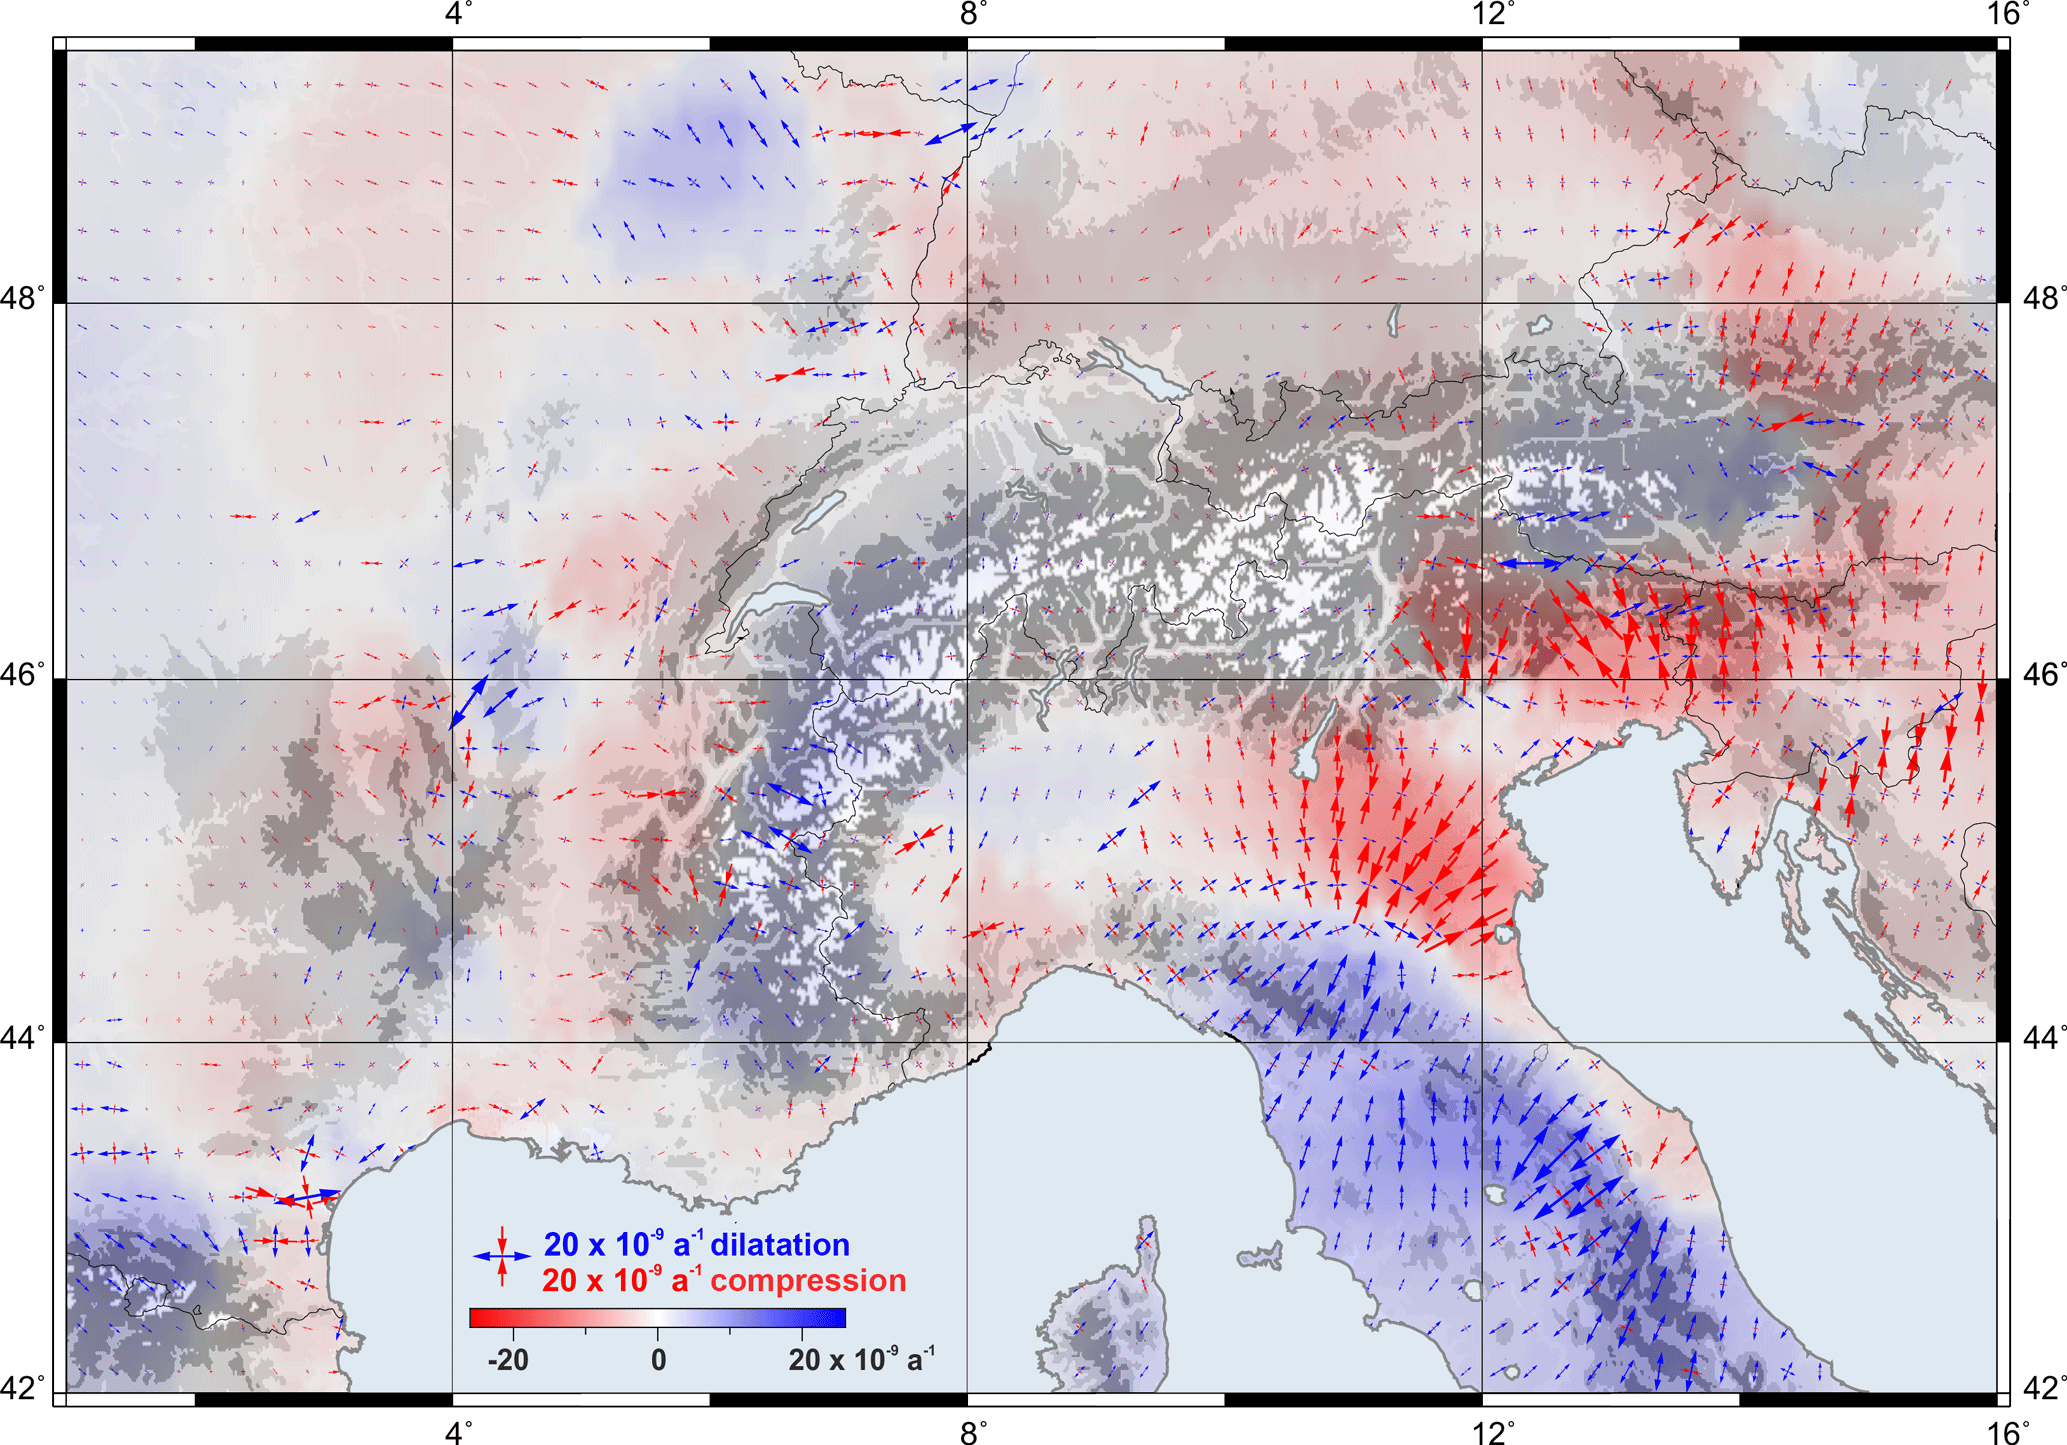
Figure 15Strain distribution in the Alpine region. Blue shades represent dilatation; red shades represent compression. Topography after the ETOPO1 model (Amante and Eakins, 2009).
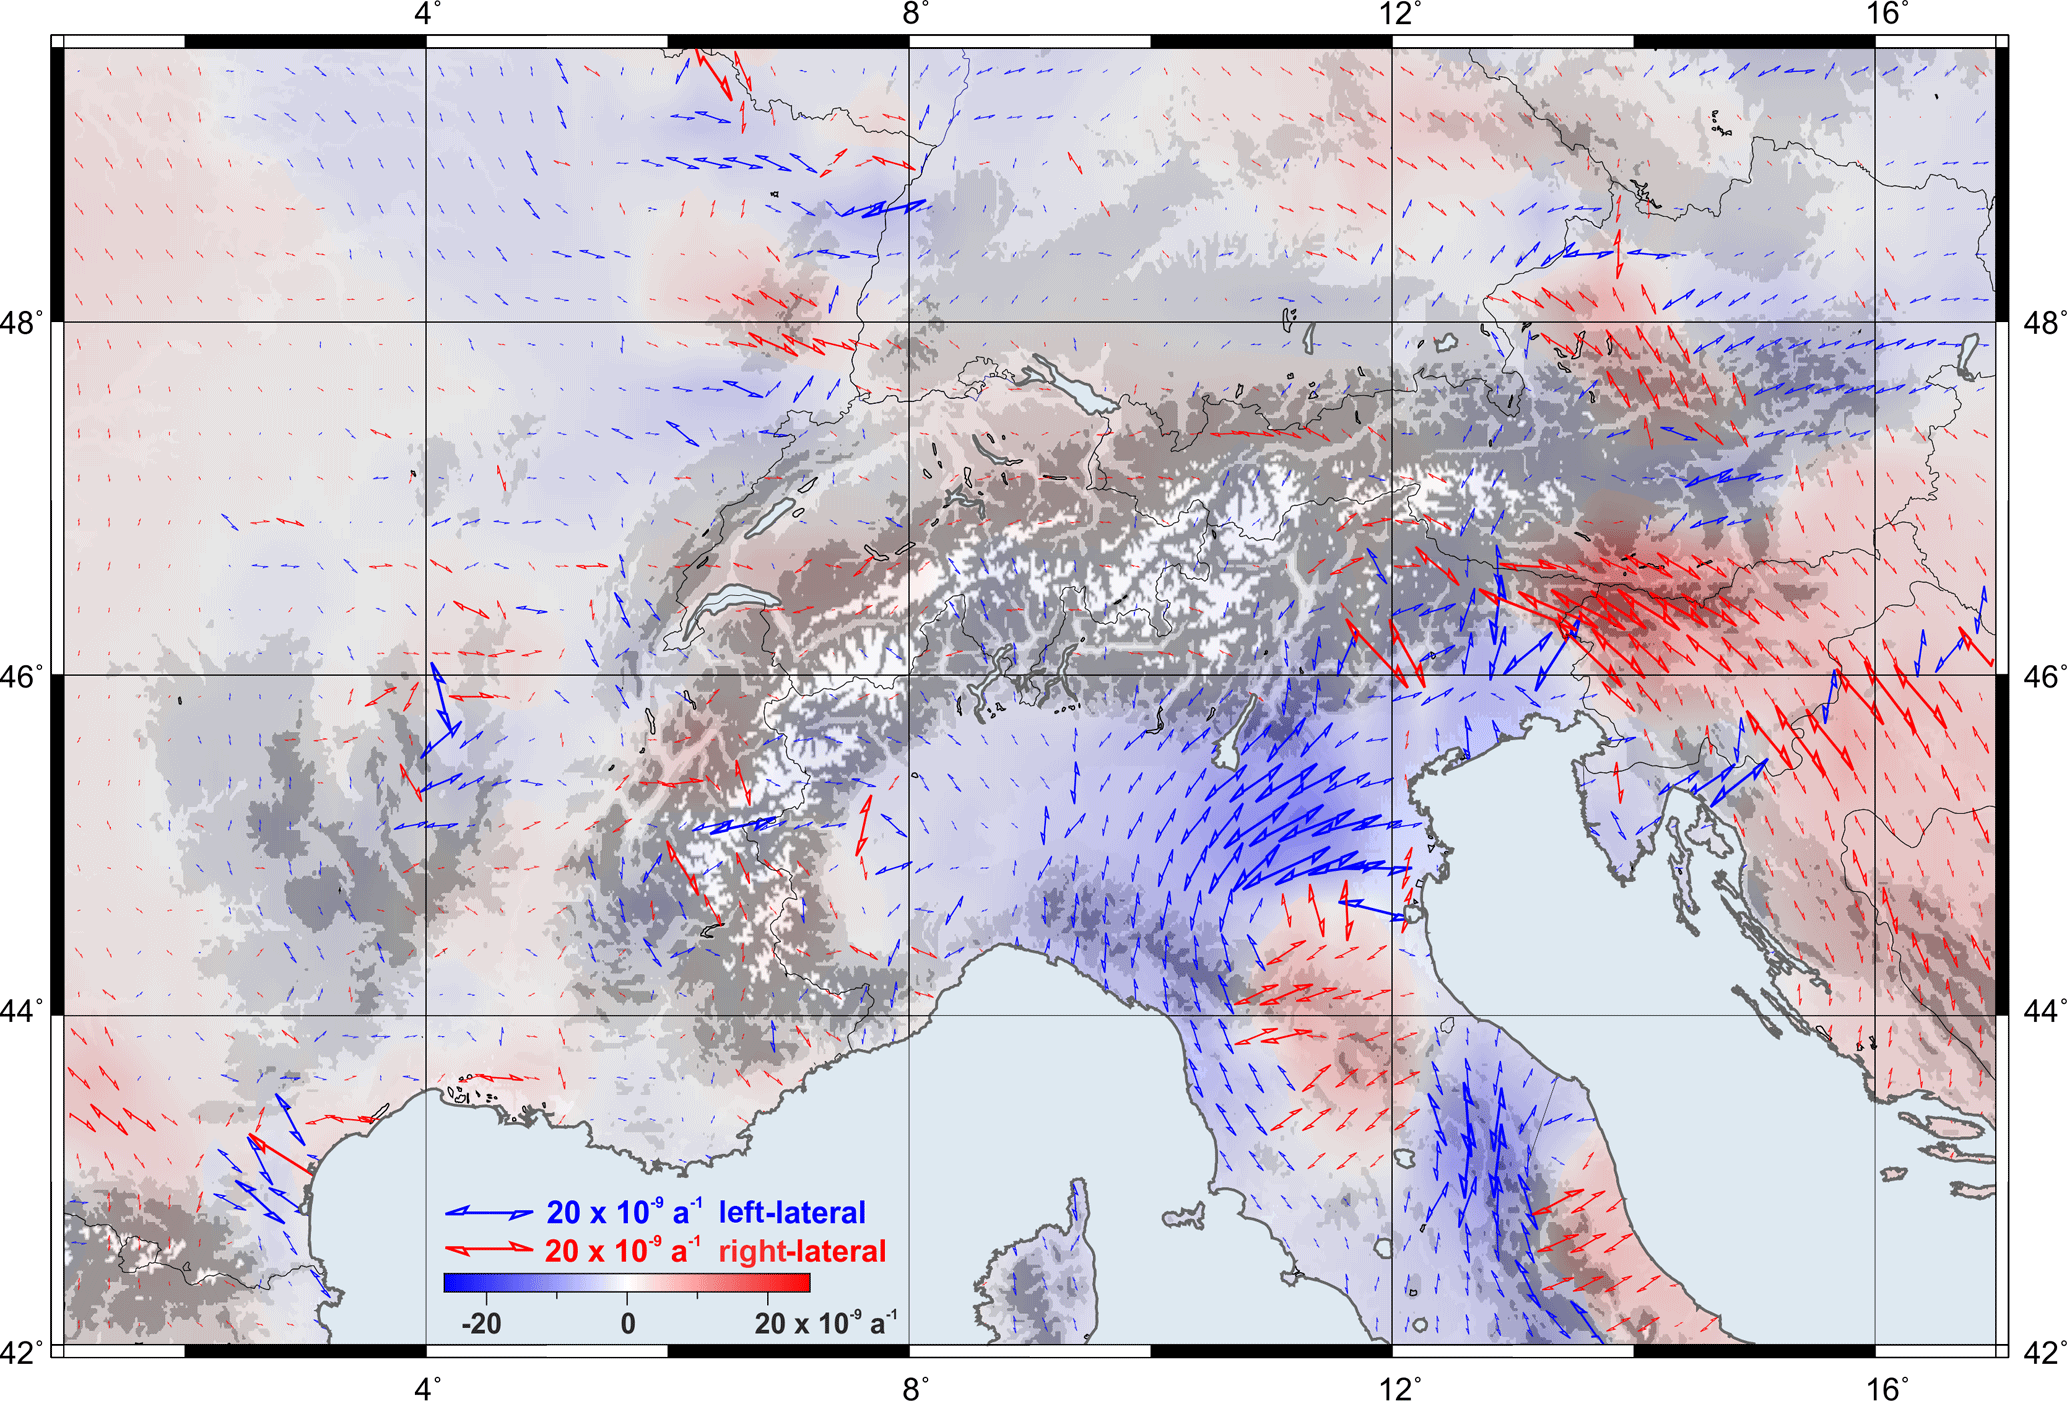
Figure 16Shear strain distribution in the Alpine region. Blue and red shades represent the left-lateral and right-lateral shear, respectively. For illustration purposes, the left-lateral shear is considered as negative and the right-lateral shear as positive. Topography after the ETOPO1 model (Amante and Eakins, 2009).
Figure 15 shows the principal strain components (compression and dilation) and the first strain invariant (sum of strain components) obtained in this study. Two main contrasting strain regimes are noticed: (i) shortening across the south-eastern front of the Alps and the northern part of the Dinarides and (ii) extension in the Apennines. The pattern of the strain principal axes indicates that the compression directions are more or less perpendicular to the thrust belt fronts (see Fig. 1). This compression presents maximum strain-rate values of about a−1 in the Venetian-Friuli and Po basins. These findings are in agreement with previous works published by Serpelloni et al. (2005, 2006), Caporali et al. (2009), Bennett et al. (2012), and Cheloni et al. (2014); in particular, the continuous compression regime we inferred along the Adriatic coastline fits very well with the strain model presented by Carafa and Bird (2016). Nevertheless, the lack of data in the eastern margin of the Adriatic Sea does not permit us to conclude if this regime continues with similar magnitudes to the southern Dinarides. As already stated by D'Agostino et al. (2014), dilatation is dominant in the north-western part of the Apennine Peninsula. Apparently, this dilatation continues to the west across the Po Basin, although at minor rates. However, poor station coverage in this area precludes any definitive conclusions from these observations.
Across the Alpine mountain belt, we observe a slight dilatation regime in the Western Alps, which smoothly changes to a contraction regime in western Austria and southern Germany, reaching maximum shortening values of a−1 in the north-eastern part of Austria (eastern margin of the Molasse Basin). The strain rates obtained for the French and Swiss Alps are in the same order of uncertainty of our results; however, they are in agreement with results presented in previous studies like Calais et al. (2002) and Delacou et al. (2008). The magnitude and orientation of the principal strain axes we observe in the boundary region between Switzerland, Austria, and Germany are very similar to the strain-rate patterns described by Tesauro et al. (2006).
The largest shear strain of about a−1 is detected in the south-eastern part of the Alps (Fig. 16). The sharp boundaries between the left-lateral and right-lateral shear zones and a quiet area reveal the triple junction between the Eurasian, Adriatic, and Pannonian plates (Möller et al., 2011). According to Brückl and Hammer (2014), the approximate location of the triple junction is 13.7∘ E, 46.6∘ N, which is well correlated with the strain model computed in this study. The Western Alps and surroundings do not reveal any specific pattern of the shear strain while the Dinarides show a compressional strain with a right-lateral shear of about 10 to a−1. The resulting principal and shear strain fields show that the main tectonic activity is ongoing on the plate boundaries.
Station positions and velocities as well as velocity and deformation fields computed in the frame of this study are available through the PANGAEA (Data Publisher for Earth and Environmental Science) platform at https://doi.pangaea.de/10.1594/PANGAEA.886889. The dataset collection is composed of the following.
-
ALPS2017.SNX: multi-year solution for geocentric Cartesian station positions and velocities referring to the IGb08, epoch 2010.0, in SINEX, the Solution (Software/technique) INdependent EXchange format.
-
ALPS2017_XYZ.CRD: geocentric Cartesian station positions.
-
ALPS2017_XYZ.VEL: geocentric Cartesian station velocities.
-
ALPS2017_NEH.CRD: ellipsoidal station positions.
-
ALPS2017_NEH.VEL: ellipsoidal station velocities.
-
ALPS2017_EPR.VEL: station velocities relative to the Eurasian Plate.
-
ALPS2017_DEF_HZ.GRD: surface deformation model of the Alpine region.
-
ALPS2017_DEF_VT.GRD: vertical deformation model of the Alpine region.
-
ALPS2017_STR.GRD: strain field of the Alpine region.
-
ALPS2017_VEL.GRD: continuous velocity field of the Alpine region.
In this study, we provide a present-day surface-kinematics model homogeneously assessed for the whole Alpine mountain chain. It is based on a high-level GNSS data analysis covering 12.4 years of continuous geodetic observations. Together with a coordinate solution for more than 300 CO-GNSS stations, our results comprise a deformation model, a continuous velocity field, and a strain field covering the area between 4–16∘ E and 43–50∘ N at a spatial interval of 25 km × 25 km. The average uncertainty of our model is ±0.2 mm a−1 in the horizontal component and ±0.3 mm a−1 in the height component. Although the station coverage is heterogeneous, our model describes coherent patterns of ongoing uplift processes and horizontal deformations with respect to the Eurasian Plate. The determination of the constant velocities, which form the basis for the deformation model and strain field, was particularly complex, because each little discontinuity had to be revealed, analysed, and taken into account in determining the constant velocity of each site. Because the geodetic network consists of many permanently operating GNSS stations, which have to fulfil different purposes, the analysis was difficult and required a lot of manual intervention. Some sites fulfil geodetic services requiring frequent updates in the set-up, which in turn cause inconsistencies in the time series that had to be recovered. Not all of these changes were well documented. The GNSS data processed in this study are unique as they cover the entire Alpine range and the associated foreland. The comparison of our derived deformation patterns with the results of other studies, whose research areas were mostly limited to smaller regions of the Alps, has proven the high reliability of our model. With this data set, a deformation model of the Alps derived from a uniform analysis is now available.
The basic least-squares collocation formula is given by (e.g. Moritz, 1973; Drewes, 1978)
vobs contains the velocities observed at the geodetic stations (Figs. 7 and 8). vpred contains the velocities to be predicted at the continuous grid of 25 km × 25 km (Figs. 9 and 11). Cobs is the correlation matrix between observed velocities. Cnew is the correlation matrix between predicted and observed velocities. Cnn is the noise covariance matrix; i.e. it contains the uncertainty of the station velocities obtained within the multi-year solution (error ellipses and error bars in Figs. 7 and 8).
The empiric correlation between the observed velocities may be written as
where E is the expectation; i,k represent the geodetic stations; and (di,k) is the distance between the station i and k. The Cobs values are classified in Δj class intervals with j=1…10. The cross-covariance Cobs(Δj) and auto-covariance are determined for each interval Δj:
where n stands for the number of stations available at the domain defined by d, while nj represents the number of stations available at each class interval Δj. After estimating the discrete empirical covariances with Eq. (A3), they are approximated by a continuous function C(dik): in this case, the exponential function
The function parameters a and b are estimated by a least-squares adjustment. Cobs is symmetrical and its main diagonal (i=k) contains the values C0. The elements of Cnew are computed using the same Eq. (A4) as a function of the distance between the grid node to be interpolated and the geodetic stations. The precision of the predicted values is assessed with (Moritz, 1973)
To fulfil the statistical condition of stationarity, the correlation function Eq. (A4) has to be identical for all points located in the d region; i.e. the exponential function must be homogeneous over the entire domain of known and predicted points. A consequence of the isotropy and stationarity conditions is that any trend (e.g. plate tectonics) in the given set of point parameters has to be removed before starting the collocation procedure. As horizontal and vertical station motions are dominated by different mechanisms (see Sect. 4.3), it is necessary to apply the LSC procedure separately. For the horizontal model, the north-east movement of the Eurasian Plate defines the trend motion to be removed from the station velocities. For the vertical model, the trend motion is given by the mean value of the vertical station velocities available at each d region.
As mentioned in Sect. 5, the deformation model is computed at a regular grid of 25 km spacing interval. This grid size is chosen as appropriate since it corresponds to the mean station spacing (about 20 to 30 km) in the most densely covered region within the network (the French and Swiss Alps, see Fig. 2). For the horizontal component of the deformation model, the minimum correlation distance d is defined to be 100 km. This radius provides an overlap between adjacent grid points and allows a certain degree of smoothing. For areas with poor station coverage, the correlation distance is extended until at least four stations are available for the LSC. For the vertical component, a larger correlation distance (up to 300 km) is needed as the number of rejected outliers is higher for the vertical station velocities than for the horizontal ones.
LS contributed to the GNSS data analysis strategy, computed the deformation model and the strain field, interpreted the station velocities with respect to the tectonic features, and wrote the paper. CV collected and compiled the GNSS observation data, defined the GNSS data analysis strategy, and took part in and supervised the GNSS data processing. AS performed the GNSS data analysis and contributed to the strain field. HA installed and maintains the GNSS stations operated by DGFI-TUM in the German Alps. FS initiated and coordinated the work. All authors contributed to the scientific discussion of the results, the editing, and revision of the paper.
The authors declare that they have no conflict of interest.
This study has been possible thanks to the support of different organisations
providing us with the observational data of their CO-GNSS stations. We thank
the International GNSS Service (IGS); the Reference Frame Sub-Commission for
Europe of the International Association of Geodesy (EUREF); the Federal
Agency for Cartography and Geodesy of Germany (BKG); the Space Research
Institute of the Austrian Academy of Sciences; the Geodetic Alpine Integrated
Network (GAIN); the Centro Ricerche Sismologiche (CRS) of the Istituto
Nazionale di Oceanografia e di Geofisica Sperimentale (OGS); the Réseau
National GPS, France; and the Orpheon network. We are also grateful to our
colleague Elmar Brockmann from the Swiss Federal Office of Topography
(swisstopo) for providing us with the coordinate solution of the AGNES
(Automated GNSS Network for Switzerland) network. Jeff Freymueller and
Roberto Devoti are gratefully thanked for their careful and constructive
reviews that have greatly improved the quality of the paper. Figures in this
paper were compiled using the GMT (Generic Mapping Tools) software package
(Wessel et al., 2013).
Edited by: David Carlson
Reviewed by: Jeff Freymueller and Roberto Devoti
Altamimi, Z., Collilieux, X., and Métivier, L.: ITRF2008: an improved solution of the international terrestrial reference frame, J. Geodesy, 85, 457–473, https://doi.org/10.1007/s00190-011-0444-4, 2011.
Altamimi, Z., Métivier, L., and Collilieux, X.: ITRF2008 plate motion model, J. Geophys. Res., 117, B07402, https://doi.org/10.1029/2011JB008930, 2012.
Amante, C. and Eakins, B. W.: ETOPO1 Global Relief Model converted to PanMap layer format. NOAA-National Geophysical Data Center, PANGAEA, https://doi.org/10.1594/PANGAEA.769615, 2009.
Aoudia, A., Amodio, A., Troisi, C., Manzino, A., Luchetta, A., Völksen, C., Drewes, H., Zivcic, M., Van der Voerd, J., Fosson, J. P., Carraro, C., Zampedri, G., Walpersdorf, A., Laffi, R., Fioroni, M., Barzaghi, R., Sabadini, R., Pasetti, L., and Sguero, D.: ALPS GPSQUAKENET. Alpine Integrated GPS Network: Real-Time Monitoring and Master Model for Continental Deformation and Earthquake Hazard, Intergared III B Project – Alpine Space, available at: http://www.alpine-space.org/2000-2006/uploads/media/ALPS-GPS_QUAKENET_Project_booklet.pdf (last access: 20 August 2018), 2007.
Argnani, A.: Plate Tectonics and the Boundary between Alps and Apennines, Ital. J. Geosci., 128, 317–330, https://doi.org/10.3301/IJG.2009.128.2.317, 2009.
Bada, G., Horváth, F., Dövényi, P., Szafián, P., Windhoffer, G. and Cloetingh, S.: Present-day stress field and tectonic inversion in the Pannonian basin, Glob. Planet. Change, 58, 165–180, https://doi.org/10.1016/j.gloplacha.2007.01.007, 2007.
Barletta, V. R., Ferrari, C., Diolaiuti, G., Carnielli, T., Sabadini, R., and Smiraglia, C.: Glacier shrinkage and modeled uplift of the Alps, Geophys. Res. Lett., 33, L14307, https://doi.org/10.1029/2006GL026490, 2006.
Becker, A.: In situ stress data from the Jura Mountains – new results and interpretation, Terra Nova, 11, 9–15, https://doi.org/10.1046/j.1365-3121.1999.00215.x, 1999.
Bennett, R. A., Hreinsdóttir, S., Buble, G., Bašić, T., Bašić, Ž, Marjanović, M., Casale, G., Gendaszek, A., and Cowan, D.: Eocene to present subduction of southern Adria mantle lithosphere beneath the Dinarides, Geology, 36, 3–6, https://doi.org/10.1130/G24136A.1, 2008.
Bennett, R. A., Serpelloni, E., Hreinsdóttir, S., Brandon, M. T., Buble, G., Basic, T., Casale, G., Cavaliere, A., Anzidei, M., Marjonovic, M., Minelli, G., Molli, G., and Montanari, A.: Syn-convergent extension observed using the RETREAT GPS network, northern Apennines, Italy, J. Geophys. Res., 117, B04408, https://doi.org/10.1029/2011JB008744, 2012.
Bird, P.: An updated digital model for plate boundaries, Geochem. Geophys. Geosyst., 4, 1027, https://doi.org/10.1029/2001GC000252, 2003.
Blewitt, G., Lavallée, D., Clarke, P., and Nurudinov, K.: A new global model of Earth deformation: Seasonal cycle detected, Science, 294, 2342–2345, https://doi.org/10.1126/science.1065328, 2001.
Böhm, J., Niell, A., Tregoning, P., and Schuh, H.: Global mapping function (GMF): a new empirical mapping function based on numerical weather model data, Geophys. Res. Lett., 33, L07304, https://doi.org/10.1029/2005GL025546, 2006.
Bousquet, R., Schmid, S. M., Zeilinger, G., Oberhänsli, R., Rosenberg, C., Molli, G., Robert, C., Wiederkehr, M., and Rossi, Ph.: Tectonic framework of the Alps, CCGM/CGMW, available at: http://www.geodynalps.org (last access: 20 August 2018), 2012.
Brockmann, E., Ineichen, D., Marti, U., Schaer, S., Schlatter, A., and Villiger, A.: Determination of Tectonic Movements in the Swiss Alps using GNSS and Levelling, in: Geodesy for Planet Earth, edited by: Kenyon S., Pacino M., Marti, U., IAG Symposia, 136, 689–695, https://doi.org/10.1007/978-3-642-20338-1_85, 2012.
Brückl, E. and Hammer, C.: Eduard Suess' conception of the Alpine orogeny related to geophysical data and models, Austrian J. Earth Sc., 107, 94–114, 2014.
Brückl, E., Bleibinhaus, F., Gosar, A., Grad, M., Guterch, A., Hrubcová, P., Keller, R., Majdański, M., Šumanovac, F., Tiira, T., Yliniemi, J., Hegedüs, E., and Thybo, H.: Crustal structure due to collisional and escape tectonics in the Eastern Alps region based on profiles Alp01 and Alp02 from the ALP 2002 seismic experiment, J. Geophys. Res., 112, B06308, https://doi.org/10.1029/2006JB004687, 2007.
Brückl, E., Behm, M., Decker, K., Grad, M., Guterch, A., Keller, G., and Thybo, H.: Crustal structure and active tectonics in the eastern Alps, Tectonics, 29, TC2011, https://doi.org/10.1029/2009TC002491, 2010.
Bruni, S., Zerbini, S., Raicich, F., Errico, M., and Santi, E.: Detecting discontinuities in GNSS coordinate time series with STARS: case study, the Bologna and Medicina GPS sites, J. Geodesy, 88, 1203–1214, https://doi.org/10.1007/s00190-014-0754-4, 2014.
Bruyninx, C., Habrich, H., Söhne, W., Kenyeres, A., Stangl, G., and Völksen, C.: Enhancement of the EUREF permanent network services and products, IAG Symposia, 138, 27–34, https://doi.org/10.1007/978-3-642-20338-1_4, 2012.
Bruyninx, C., Habrich, H., Kenyeres, A., Söhne, W., Stangl, G., and Völksen, C.: EUREF Permanent Network. International GNSS Service 2012 Technical Report, edited by: Dach, R. and Jean, Y., Astronomical Institute University of Bern, 101–107, https://doi.org/10.7892/boris.80303, 2013.
Bus, Z., Grenerczy, G., Tóth, L., and Mónus, P.: Active crustal deformation in two seismogenic zones of the Pannonian region – GPS versus seismological observations, Tectonophysics, 474, 343–352, https://doi.org/10.1016/j.tecto.2009.02.045, 2009.
Calais, E.: Continuous GPS measurements across the Western Alps, 1998–1998, Geophys. J. Int., 38, 221–230, https://doi.org/10.1046/j.1365-246x.1999.00862.x, 1999.
Calais, E., Barlier, F., Bayer, R., Boucher, C., Chéry, J., Cotton, F., Gariel, J. C., Jouanne, F., Martinod, J., and Vigny, C.: A permanent GPS network for monitoring crustal deformation in the Western Alps, Ann. Geophys. 6, Suppl. 1, C393, 1998.
Calais, E., Galisson, L., Stéphan, J.-F., Delteil, J., Deverchère, J., Larroque, C., Mercier de Lépinay, B., Popoff, M., and Sosson, M.: Crustal strain in the Southern Alps, 1948–1998, Tectonophysics, 319, 1–17, https://doi.org/10.1016/S0040-1951(00)00029-9, 2000.
Calais, E., Nocquet, J. M., Jouanne, F., and Tardy, M.: Current strain regime in the Western Alps from continuous Global Positioning System measurements, 1996–2001, Geology, 30, 651–654, https://doi.org/10.1130/0091-7613(2002)030<0651:CSRITW>2.0.CO;2, 2002.
Caporali, A., Aichhorn, C., Barlik, M., Becker, M., Fejes, I., Gerhatova, L., Ghitau, D., Grenerczy, G., Hefty, J., Krauss, S., Medak, D., Milev, G., Mojzes, M., Mulic, M., Nardo, A., Pesec, P., Rus, T., Simek, J., Sledzinski, J., Solaric, M., Stangl, G., Stopar, B., Vespe, F., and Virag, G.: Surface kinematics in the Alpine-Carpathian-Dinaric and Balkan region inferred from a new multi-network GPS combination solution, Tectonophysics, 474, 295–321, https://doi.org/10.1016/j.tecto.2009.04.035, 2009.
Carafa, M. M. C. and Bird, P.: Improving deformation models by discounting transient signals in geodetic data: 2. Geodetic data, stress directions, and long term strain rates in Italy, J. Geophys. Res.-Sol. Ea., 121, 5557–5575, https://doi.org/10.1002/2016JB013038, 2016.
Channell, J. E. T. and Horváth, F.: The African/Adriatic promontory as a paleogeographical premise for Alpine orogeny and plate movements in the Carpathó-Balkan region, Tectonophysics, 35, 71–101, https://doi.org/10.1016/0040-1951(76)90030-5, 1976.
Channell, J. E. T., D'Argenio, B., and Horvárth, F.: Adria, the African promontory, in mesozoic Mediterranean palaeogeography, Earth-Sci. Rev., 15, 213–292, https://doi.org/10.1016/0012-8252(79)90083-7, 1979.
Cheloni, D., D'Agostino, N., and Selvaggi, G.: Interseismic coupling, seismic potential and earthquake recurrence on the southern front of the Eastern Alps (NE Italy), J. Geophys. Res.-Sol. Ea., 119, 4448–4468, https://doi.org/10.1002/2014JB010954, 2014.
Chen, G. and Herring, T. A.: Effects of atmospheric azimuthal asymmetry on the analysis of space geodetic data, J. Geophys. Res., 102, 20489–20502, https://doi.org/10.1029/97JB01739, 1997.
Chéry, J., Vigny, C., Meyer, B., Ferhat, G., Anzidei, M., Bayer, R., Boloh, L., Briole, P., Deschamps, A., Feigl, K., Gamond, J. F., Geiger, A., Jouanne, F., Kasser, M., Le Pape, M., Martinod, J., Ménard, G., Ruegg, J. C., Scheubel, J. M., and Walsh, J. J.: Global Positioning System network monitors the Western Alps, EOS Trans. Am. Geophys. Union August, 27, 489–489, https://doi.org/10.1029/95EO00299, 1995.
Collilieux, X., Altamimi, Z., Coulot, D., van Dam, T., and Ray, J.: Impact of loading effects on determination of the International Terrestrial Reference Frame, Adv. Space Res., 45, 144–154, https://doi.org/10.1016/j.asr.2009.08.024, 2010.
Collilieux, X., van Dam, T., Ray, J., Coulot, D., Métivier, L., and Altamimi, Z.: Strategies to mitigate aliasing of loading signals while estimating GPS frame parameters, J. Geodyesy, 86, 1–14, https://doi.org/10.1007/s00190-011-0487-6, 2012.
Copley, A.: Kinematics and dynamics of the southeastern margin of the Tibetan Plateau, Geophys. J. Int., 174, 1081–1100, https://doi.org/10.1111/j.1365-246X.2008.03853.x, 2008.
Cuffaro, M., Riguzzi, F., Scrocca, D., Antonioli, F., Carminati, E., Livani, M., and Doglioni, C.: On the geodynamics of the northern Adriatic plate, Rend. Fis. Acc. Lincei, 21, S253–S279, https://doi.org/10.1007/s12210-010-0098-9, 2010.
Dach, R., Lutz, S., Walser, P., and Fridez, P. (Eds.): Bernese GNSS Software Version 5.2. University of Bern, 2015.
Dach, R., Schaer, S., Arnold, D., Prange, L., Sidorov, D., Sušnik, A., Villiger, A., and Jäggi, A.: CODE final product series for the IGS. Published by Astronomical Institute, University of Bern, available at: http://www.aiub.unibe.ch/download/CODE (last access: 20 August 2018), https://doi.org/10.7892/boris.75876.2, 2017.
D'Agostino, N., Cheloni, D., Mantenuto, S., Selvaggi, G., Michelini, A., and Zuliani, D.: Interseismic strain accumulation in the eastern Southern Alps (NE Italy) and deformation at the eastern boundary of the Adria block observed by CGPS measurements, Geophys. Res. Lett., 32, L19306, https://doi.org/10.1029/2005GL024266, 2005.
D'Agostino, N., Mantenuto, S., D'Anastasio, E., Giuliani, R., Mattone, M., Calcaterra, S., Gambino, P., and Bonci, L.: Evidence for localized active extension in the central Apennines (Italy) from global positioning system observations, Geology, 39, 291–294, https://doi.org/10.1130/G31796.1, 2011.
D'Agostino, N., England, P., Hunstad, I., and Selvaggi, G.: Gravitational potential energy and active deformation in the Apennines, Earth Planet. Sc. Lett., 397, 121–132, https://doi.org/10.1016/j.epsl.2014.04.013, 2014.
Delacou, B., Sue, Ch., Nocquet, J. M., Champagnac, J. D., Allanic, C., and Burkhard, M.: Quantification of strain rate in the Western Alps using geodesy: comparisons with seismotectonics, Swiss J. Geosci., 101, 377–385, https://doi.org/10.1007/s00015-008-1271-3, 2008.
Dercourt, J., Zonenshain, L. P., Ricou, L.-E., Kazmin, V. G., Le Pichon, X., Knipper, A. L., Grandjacquet, C., Sbortshikov, I. M., Geyssant, J., Lepvrier, C., Pechersky, D. H., Boulin, J., Sibuet, J.-C., Savostin, L. A., Sorokhtin, O., Westphal, M., Bazhenov, M. L., Lauer, J. P., and Biju-Duval, B.: Geological evolution of the tethys belt from the atlantic to the pamirs since the LIAS, Tectonophysics, 123, 241–315, https://doi.org/10.1016/0040-1951(86)90199-X, 1986.
Devoti, R., Riguzzi, F., Cuffaro, M., and Doglioni, C.: New GPS constraints on the kinematics of the Apennines subduction, Earth Planet. Sc. Lett., 273, 163–174, https://doi.org/10.1016/j.epsl.2008.06.031, 2008.
Devoti, R., Esposito, A., Pietrantonio, G., Pisani, A. R., and Riguzzi, F.: Evidence of large scale deformation patterns from GPS data in the Italian subduction boundary, Earth Planet. Sc. Lett., 311, 230–241, https://doi.org/10.1016/j.epsl.2011.09.034, 2011.
Devoti, R., D'Agostino, N., Serpelloni, E., Pietrantonio, G., Riguzzi, F., Avallone, A., Cavaliere, A., Cheloni, D., Cecere, G., D'Ambrosio, C., Falco, L., Selvaggi, G., Métois, M., Esposito, A., Sepe, V., Galvani, A., and Anzidei, M.: A combined velocity field of the Mediterranean Region, Ann. Geophys., 60, S0215, https://doi.org/10.4401/ag-7059, 2017.
Dewey, J. F., Pitman III, W. C., Ryan, W. B. F., and Bonnin, J.: Plate Tectonics and the Evolution of the Alpine System, Geol. Soc. Am. Bull., 84, 3137–3180, https://doi.org/10.1130/0016-7606(1973)84<3137:PTATEO>2.0.CO;2, 1973.
Dewey, J. F., Helman, M. L., Knott, S. D., Turco, E., and Hutton, D. H. W.: Kinematics of the western Mediterranean, Geological Society, London, Special Publications, 45, 265–283, https://doi.org/10.1144/GSL.SP.1989.045.01.15, 1989.
Doglioni, C.: Tectonics of the Dolomites (southern alps, northern Italy), J. Struct. Geol., 9, 181–193, https://doi.org/10.1016/0191-8141(87)90024-1, 1987.
Doglioni, C. and Carminati, E.: The effects of four subductions in NE-Italy, Mem. Sci. Geol., 54, 1–4, 2002.
Dow, J. M., Neilan, R. E., and Rizos, C.: The International GNSS Service in a hanging landscape of Global Navigation Satellite Systems, J. Geodesy, 83, 191–198, https://doi.org/10.1007/s00190-008-0300-3, 2009.
Drewes, H.: Experiences with least squares collocation as applied to interpolation of geodetic and geophysical quantities, Proceedings 12th Symposium on Mathematical Geophysics, Caracas, Venezuela, 1978.
Drewes, H.: A geodetic approach for the recovery of global kinematic plate parameters, Bull. Geod., 56, 70–79, https://doi.org/10.1007/BF02525609, 1982.
Drewes, H.: The Actual Plate Kinematic and Crustal Deformation Model APKIM2005 as Basis for a Non-Rotating ITRF, in: Geodetic Reference Frames, edited by: Drewes, H., IAG Symposia, 134, 95–99, https://doi.org/10.1007/978-3-642-00860-3_15, 2009.
Drewes, H. and Heidbach, O.: Deformation of the South American crust estimated from finite element and collocation methods, in: A Window on the Future of Geodesy, edited by: Sansò, F., IAG Symposia, 128, 544–549, https://doi.org/10.1007/3-540-27432-4_92, 2005.
Drewes, H., Angermann, D., and Seitz, M.: Alternative definitions of the terrestrial reference system and its realization in reference frames, in: Reference Frames for Applications in Geosciences, edited by: Altamimi, Z. and Collilieux, X., IAG Symposia, 138, 39–44, https://doi.org/10.1007/978-3-642-32998-2_7, 2013.
Fejes, I., Barlik, M., Busics, I., Packelski, W., Rogowsky, J., Sledzinsky, J., and Zielinsky, J. B.: The Central Europe Regional Geodynamics Project, paper presented at 2nd International Seminar on “GPS in Central Europe”, Hun. Acad. Sci. Penc., Hungary, 27–29 April 1993.
Ferhat, G., Feigl, K. L., Ritz, J. F., and Souriau, A.: Geodetic measurement of tectonic deformation in the Southern Alps and Provence, France, 1947–1994, Earth Planet. Sc. Lett., 159, 35–46, https://doi.org/10.1016/S0012-821X(98)00065-X, 1998.
Flesch, L. M., Holt, W. E., Haines, A. J., and Bingming Shen-Tu, B.: Dynamics of the Pacific-North American Plate Boundary in the Western United States, Science, 287, 834–836, https://doi.org/10.1126/science.287.5454.834, 2000.
Gosar, A., Šebela, S., Košťák, B., and Stemberk, J.: Micro-deformation monitoring of active tectonic structures in W Slovenia, Acta Geodyn. Geomater., 4, 87–98, 2007.
Grenerczy, G. and Kenyeres, A.: Crustal deformation between Adria and the European platform from space geodesy, in: the Adria microplate: GPS geodesy, tectonics and hazards, edited by: Pinter, N., Grenerczy, G., Weber, J., Stein, S., and Medak, D., NATO Sci. S. IV Ear. En., 61, 321–334, 2006.
Grenerczy, G., Kenyeres, A., and Fejes, I.: Present crustal movements and strain distribution in Central Europe inferred from GPS measurements, J. Geophys. Res., 105, 21835–21846, https://doi.org/10.1029/2000JB900127, 2000.
Grenerczy, G., Sella, G., Stein, S., and Kenyeres, A.: Tectonic implications of the GPS velocity field in the northern Adriatic region, Geophys. Res. Lett., 32, L16311, https://doi.org/10.1029/2005GL022947, 2005.
Handy, M. R., Schmid, S. M., Bousquet, R., Kissling, E., and Bernoulli, D.: Reconciling plate-tectonic reconstructions with the geological-geophysical record of spreading and subduction in the Alps, Earth.-Sci. Rev., 102, 121–158, 2010.
Handy, M. R., Ustaszewski, K., and Kissling, E.: Reconstructing the Alps–Carpathians–Dinarides as a key to understanding switches in subduction polarity, slab gaps and surface motion, Int. J. Earth Sci., 104, 1–26, https://doi.org/10.1007/s00531-014-1060-3, 2015.
Haslinger, C. and Stangle, G.: The First Austrian Velocity Field derived from GPS, in: Report on the Symposium of the IAG Sub-commission for Europe (EUREF) held in Riga, Latvia, 14–17 June 2006, available at: http://www.euref.eu/symposia/2006Riga/Symposium2006-Riga.html (last access: 20 August 2018), 2006.
Haslinger, C., Kraus, S., and Stangl, G.: The Intra-Plate Velocities of GPS Permanent Stations of the Eastern Alps, Vermessung & Geoinformation, 2, 66–72, 2006.
Heidbach, O. and Drewes, H.: 3-D finite element model of major tectonic processes in the Eastern Mediterranean, Geol. Soc. Spec. Publ., 212, 261–274, https://doi.org/10.1144/GSL.SP.2003.212.01.17, 2003.
Horváth, F., Bada, G., Szafián, P., Tari, G., Ádám, A., and Cloetingh, S.: Formation and deformation of the Pannonian Basin: Constraints from observational data, Geological Society Mem., 32, 191–206, https://doi.org/10.1144/GSL.MEM.2006.032.01.11, 2006.
IGS: Specifications for the 2nd data reprocessing campaign of the International GNSS Service, available at: http://acc.igs.org/reprocess2.html (20 August 2018), 2014.
Kahle, H. G., Müller, M. V., Mueller, St., Veis, G., Billiris, H., Paradissis, D., Drewes, H., Kaniuth, K., Stuber, K., Tremel, H., Zerbini, S., Pezzoli, L., and Corrado, G.: The convergent African/Eurasian plate boundary and associated crustal movements: GPS investigations in the Calabrian and West Hellenic arcs, Proc. 8th Int. Symp. on Recent Crustal Movements, Kobe/Japan, 333–342, 1994.
Kaniuth, K., Drewes, H., Tremel, H., Stuber, K., Zerbini, S., Pezzoli, L., and Corrado, G.: Crustal deformations in the Calabrian Arc area from five years of GPS measurements, Proc. of ISTANBUL-94, 1st Turkish Internat. Symp. on Deformations, Istanbul, 781–790, 1995.
Kaniuth, K., Drewes, H., Stuber, K., Tremel, H., Kahle, H. G., Peter, Y., Zerbini, S., Tonti, G., and Fagard, H.: Crustal deformations in the central Mediterranean derived from the WHAT A CAT GPS project, in: Proceedings of the 13th Working Meeting on European VLBI for Geodesy and Astrometry, Viechtach, 12–13 February, edited by: Schlüter, W. and Hase, H., 192–197, 1999.
King, M. A., Watson, C. S., Penna, N. T., and Clarke, P. J.: Subdaily signals in GPS observations and their effect at semiannual and annual periods, Geophys. Res. Lett., 35, L03302, https://doi.org/10.1029/2007GL032252, 2008.
Kissling, E., Schmid, S. M., Lippitsch, R., Ansorge, J., and Fügenschuh, B.: Lithosphere structure and tectonic evolution of the Alpine arc: new evidence from high-resolution teleseismic tomography, Geological Society, London, Memoirs, 32, 129–145, https://doi.org/10.1144/GSL.MEM.2006.032.01.08, 2006.
Kuhlemann, J. and Kempf, O.: Post-Eocene evolution of the North Alpine Foreland Basin and its response to Alpine tectonics, Sediment. Geol., 152, 45–78, https://doi.org/10.1016/S0037-0738(01)00285-8, 2002.
Lambeck, K.: Geophysical Geodesy: The slow deformations of the Earth, Oxford University Press, New York, 1988.
Larroque, C., Delouis, B., Godel, B., and Nocquet, J. M.: Active deformation at the southwestern Alps-Ligurian basin junction (France-Italy boundary): Evidence for recent change from compression to extension in the Argentera massif, Tectonophysics, 467, 22–34, https://doi.org/10.1016/j.tecto.2008.12.013 , 2009.
Laubscher, H. P.: The arcs of the Western Alps and the Northern Apennines: an updated view, Tectonophysics, 146, 67–78, https://doi.org/10.1016/0040-1951(88)90082-0, 1988.
Le Pichon, X., Bergerat, F., and Roulet, M. J.: Plate kinematics and tectonics leading to the Alpine belt formation, A new analysis, in: Processes in Continental Lithospheric Deformation, edited by: Clark Jr., S. P., Clark, Burchfiel, B., and Suppe, J., Geological Society of America, special paper 2018, 111–131, 1988.
Letellier, T.: Etude des ondes de marée sur les plateux continentaux. Thèse doctorale, Université de Toulouse III, Ecole Doctorale des Sciences de l'Univers, de l'Environnement et de l'Espace, 237 pp., 2004.
Lippitsch, R., Kissling, E., and Ansorge, J.: Upper mantle structure beneath the Alpine orogen from high-resolution teleseismic tomography, J. Geophys. Res., 108, 2376, https://doi.org/10.1029/2002JB002016, 2003.
Mantovani, E., Viti, M., Cenni, N., Babbucci, D., and Tamburelli, C.: Present Velocity Field in the Italian Region by GPS Data: Geodynamic/Tectonic Implications, Int. J. Geosci., 6, 1285–1316, https://doi.org/10.4236/ijg.2015.612103, 2015.
Meissl, P.: The use of finite elements in physical geodesy, Rep. Dep. Geod. Sci. and Surv., The Ohio State Univ., Columbus, No. 313, 1981.
Métois, M., D'Agostino, N., Avallone, A., Chamot-Rooke, N., Rabaute, A., Duni, L., Kuka, N., Koci, R., and Georgiev, I.: Insights on continental collisional processes from GPS data: Dynamics of the peri-Adriatic belts, J. Geophys. Res.-Sol. Ea., 120, 8701–8719, https://doi.org/10.1002/2015JB012023, 2015.
Möller, G., Brückl, E., and Weber, R.: Active tectonic deformation at the transition from the European and Pannonian domain monitored by a local GNSS network, Vermessung & Geoinformation, 2, 138–148, 2011.
Moritz, H.: Least squares collocation, Dt. Geod. Komm., Nr. A 75, Munich, ISBN 3 7696 8162 2, 1973.
Mueller, S. and Kahle, H.-G: Crust-Mantle Evolution, Structure and Dynamics of the Mediterranean-Alpine Region, in: Contributions of Space Geodesy to Geodynamics: Crustal Dynamics, edited by: Smith, D. E. and Turcotte, D. L., American Geophysical Union, Washington, DC, https://doi.org/10.1029/GD023p0249, 1993.
Nguyen, H. N., Vernant, P., Mazzotti, S., Khazaradze, G., and Asensio, E.: 3-D GPS velocity field and its implications on the present-day post-orogenic deformation of the Western Alps and Pyrenees, Solid Earth, 7, 1349–1363, https://doi.org/10.5194/se-7-1349-2016, 2016.
Nocquet, J. M.: Present-day kinematics of the Mediterranean: A comprehensive overview of GPS results, Tectonophysics, 579, 220–242, https://doi.org/10.1016/j.tecto.2012.03.037, 2012.
Nocquet, J. M. and Calais, E.: Geodetic measurements of crustal deformation in the Western Mediterranean and Europe, Pure Appl. Geophys., 161, 661–681, https://doi.org/10.1007/s00024-003-2468-z, 2004.
Nocquet, J. M., Sue, C., Walpersdorf, A., Tran, T., Lenôtre, N., Vernant, P., Cushing, M., Jouanne, F., Masson, F., Baize, S., Chéry, J., and van der Beek, V. A.: Present-day uplift of the western Alps, Nature, Sci. Rep.-UK, 6, 28404, https://doi.org/10.1038/srep28404, 2016.
Persaud, M. and Pfiffner, O. A.: Active Deformation in the Eastern Swiss Alps: Post-Glacial Faults, Seismicity and Surface Uplift, Tectonophysics, 385, 59–84, https://doi.org/10.1016/j.tecto.2004.04.020, 2004.
Petit, G. and Luzum, B. (Eds.): IERS Conventions 2010. IERS Technical Note 36, Verlag des Bundesamtes für Kartographie und Geodäsie, Frankfurt a.M., 2010.
Pfiffner, O. A., Frei, W., Valasek, P., Stäuble, M., Levato, L., DuBois, L., Schmid, S. M., and Smithson, S. B.: Crustal shortening in the Alpine Orogen: Results from deep seismic reflection profiling in the eastern Swiss Alps, Line NFP 20-east, Tectonics, 9, 1327–1355, https://doi.org/10.1029/TC009i006p01327, 1990.
Ray, J., Altamimi, Z., Collilieux, X., and van Dam, T. M.: Anomalous harmonics in the spectra of GPS position estimates, GPS Solutions, 12, 55–64, https://doi.org/10.1007/s10291-007-0067-7, 2008.
Rebischung, P., Griffiths, J., Ray, J., Schmid, R., Collilieux, X., and Garayt, B.: IGS08: the IGS realization of ITRF2008, GPS Solutions, 16, 483–494, https://doi.org/10.1007/s10291-011-0248-2, 2012.
Rodríguez-Solano, C. J., Hugentobler, U., Steigenberger, P., and Lutz, S.: Impact of Earth radiation pressure on GPS position estimates, J. Geodesy, 86, 309–317, https://doi.org/10.1007/s00190-011-0517-4, 2012.
Rossi, G., Fabris, P., and Zuliani, D.: Slow transients recorded by the cGPS network FreDNet at the northern Adria microplate boundary (NE-Italy), Gephys. Res. Abstr., EGU General Assembly, Vienna, Austria, 15, 8417, 2013.
Royden, L. H.: Evolution of retreating subduction boundaries formed during continental collision, Tectonics, 12, 629–638, https://doi.org/10.1029/92TC02641, 1993.
Sánchez, L. and Drewes, H.: Crustal deformation and surface kinematics after the 2010 earthquakes in Latin America, J. Geodyn., 102, 1–23, https://doi.org/10.1016/j.jog.2016.06.005, 2016.
Sánchez, L., Seemüller, W., Drewes, H., Mateo, L., González, G., Silva, A., Pampillón, J., Martinez, W., Cioce, V., Cisneros, D., and Cimbaro, S.: Long-term stability of the SIRGAS reference frame and episodic station movements caused by the seismic activity in the SIRGAS region, IAG Symposia, 138, 153–161, https://doi.org/10.1007/978-3-642-32998-2_24, 2013.
Schmid, R., Dach, R., Collilieux, X., Jäggi, A., Schmitz, M., and Dilssner, F.: Absolute IGS antenna phase center model igs08.atx: status and potential improvements, J. Geodesy, 90, 343–364, https://doi.org/10.1007/s00190-015-0876-3, 2016.
Schmid, S. M., Fügenschuh, B., Kissling, E., and Schuster, R.: Tectonic map and overall architecture of the Alpine orogeny, Eclogae Geol. Helv., 97, 93–117, https://doi.org/10.1007/s00015-004-1113-x, 2004.
Seitz, F., Arenz, H., and Leismüller, F.: Position measurements at five permanent GPS stations in the Bavarian Alps as part of the Geodetic Alpine Integrated Network (GAIN) of the ALPS-GPSQUAKENET project, Deutsches Geodätisches Forschungsinstitut, Munich, https://doi.org/10.1594/PANGAEA.834193, 2014.
Serpelloni, E., Anzidei, M., Baldi, P., Casula, G., and Galvani, A.: Crustal velocity and strain-rate fields in Italy and surrounding regions: New results from the analysis of permanent and non-permanent GPS networks, Geophys. J. Int., 161, 861–880, https://doi.org/10.1111/j.1365-246X.2005.02618.x, 2005.
Serpelloni, E., Adziei, M., Baldi, P., Casula, G., and Galvani, A.: GPS measurement of active strains across the Apennines, Ann. Geophys., Supplement to Vol. 49, https://doi.org/10.4401/ag-5756, 2006.
Serpelloni, E., Faccenna, C., Spada, G., Dong, D., and Williams, S. D.: Vertical GPS ground motion rates in the Euro-Mediterranean region: New evidence of velocity gradients at different spatial scales along the Nubia-Eurasia plate boundary, J. Geophys. Res.-Sol. Ea., 118, 6003–6024, https://doi.org/10.1002/2013JB010102, 2013.
Steigenberger, P., Lutz, S., Dach, R., Schaer, S., and Jäggi, A.: CODE repro2 product series for the IGS. Published by Astronomical Institute, University of Bern, available at: http://www.aiub.unibe.ch/download/REPRO_2013 (last access: 20 August 2018), https://doi.org/10.7892/boris.75680, 2014.
Stocchi, P., Spada, G., and Cianetti, S.: Isostatic rebound following the Alpine deglaciation: impact on the sea level variations and vertical movements in the Mediterranean region, Geophys. J. Int., 162, 137–147, https://doi.org/10.1111/j.1365-246X.2005.02653.x, 2005.
Sue, C., Martinod, J., Tricart, P., Thouvenot, F., Gamond, J. F., Frechet, J., Marinier, D., Glot, J. P., and Grasso, J. R.: Active deformation in the inner western Alps inferred from comparison between 1972-classical and 1996-GPS geodetic surveys, Tectonophysics, 320, 17–29, https://doi.org/10.1016/S0040-1951(00)00024-X, 2000.
Sue, Ch., Delacou, B., Champagnac, J. D., Allanic, C., and Burkhard, M.: Aseismic deformation in the Alps: GPS vs. seismic strain quantification, Terra Nova, 19, 182–188, 2007.
Tesauro, M., Hollenstein, Ch., Egli, R., Geiger, A., and Kahle, H.-G.: Analysis of central western Europe deformation using GPS and seismic data, J. Geodyn., 42, 194–209, https://doi.org/10.1016/j.jog.2006.08.001, 2006.
Ustaszewski, K., Schmid, S. M., Fügenschuh, B., Tischler, M., Kissling, E., and Spakman, W.: A map-view restoration of the Alpine-Carpathian-Dinaridic system for the Early Miocene, Swiss J. Geosci., 101, 273–294, https://doi.org/10.1007/s00015-008-1288-7, 2008.
van Dam, T. and Ray, R.: S1 and S2 atmospheric tide loading effects for geodetic applications, available at: http://geophy.uni.lu/ggfc-atmosphere/tide-loading-calculator.html (last access: 20 August 2018), 2010.
van Mierlo, J., Oppen, S., and Vogel, M.: Monitoring of recent crustal movements in the Eastern Alps with the Global Positioning System (GPS), Tectonophysics, 275, 273–283, https://doi.org/10.1016/S0040-1951(97)00032-2, 1996.
Vergnolle, M., Calais, E., and Dong, L.: Dynamics of continental deformation in Asia, J. Geophys. Res., 112, B11403, https://doi.org/10.1029/2006JB004807, 2007.
Völksen, C., Walpersdorf, A., Aoudia, A., Barzaghi, R., Borghi, A., and Cannizzaro, L.: The ALPS GPSQUAKENET project – A permanent GPS network in the Alps, in: Bollettino di Geodesia e Science Affini, Journal of Istituto Geografico Militare, Vol. LXVIII, 1, 1–17, 2009a.
Völksen, C., Árnadóttir, T., Geirsson, H., and Valsson, G.: Present day geodynamics in Iceland monitored by a permanent network of continuous GPS stations, J. Geodyn., 48, 279–283, https://doi.org/10.1016/j.jog.2009.09.033, 2009b.
Waldhauser, F., Kissling, E., Ansorge, J., and Mueller, St.: Three dimensional interface modelling with two-dimensional seismic data: the Alpine crust-mantle boundary, Geophys. J. Int., 135, 264–278, https://doi.org/10.1046/j.1365-246X.1998.00647.x, 1998.
Weber, J., Vrabec, M., Stopar, B., Pavlovčič Prešeren, P., and Dixon, T.: The PIVO-2003 experiment: a GPS study of Istria peninsula and Adria microplate motion, and active tectonics in Slovenia, in: The Adria Microplate: GPS Geodesy, Tectonics, and Hazards, edited by: Pinter, N., Gyula, G., Weber, J., Stein, S., and Medak, D., 305–320, Springer, 2006.
Wessel, P., Smith, W. H. F., Scharroo, R., Luis, J. F., and Wobbe, F.: Generic Mapping Tools: Improved version released, EOS Trans. AGU, 94, 409–410, 2013.
Ziegler, P. A.: Geological Atlas of Western and Central Europe Shell, Int. Petrol. Maatschap. Geol. Soc., London, 239 pp., 1990.
Zuliani, D., Battaglia, M., Murray, M. H., Michellini, A., Burgmann, R., and Marson, I.: FREDNET: A continuous GPS geodetic network monitoring crustal deformation in NE Italy, AGU Fall Meeting, Poster presentation, 2002.
- Abstract
- Introduction
- Geological and tectonic framework
- Distribution of the CO-GNSS stations
- Analysis of GNSS data and determination of precise station positions and velocities
- Surface-kinematic modelling based on CO-GNSS network solutions
- Strain field
- Data availability
- Conclusions
- Appendix A: Least-squares collocation equations
- Author contributions
- Competing interests
- Acknowledgements
- References