the Creative Commons Attribution 4.0 License.
the Creative Commons Attribution 4.0 License.
 | 15 Jun 2018
The GEWEX Water Vapor Assessment archive of water vapour products from satellite observations and reanalyses
Maarit Lockhoff
Frank Fell
John Forsythe
Tim Trent
Ralf Bennartz
Eva Borbas
Michael G. Bosilovich
Elisa Castelli
Hans Hersbach
Misako Kachi
Shinya Kobayashi
E. Robert Kursinski
Diego Loyola
Carl Mears
Rene Preusker
William B. Rossow
Suranjana Saha
The Global Energy and Water cycle Exchanges (GEWEX) Data and Assessments Panel (GDAP) initiated the GEWEX Water Vapor Assessment (G-VAP), which has the main objectives to quantify the current state of the art in water vapour products being constructed for climate applications and to support the selection process of suitable water vapour products by GDAP for its production of globally consistent water and energy cycle products. During the construction of the G-VAP data archive, freely available and mature satellite and reanalysis data records with a minimum temporal coverage of 10 years were considered. The archive contains total column water vapour (TCWV) as well as specific humidity and temperature at four pressure levels (1000, 700, 500, 300 hPa) from 22 different data records. All data records were remapped to a regular longitude–latitude grid of 2∘ × 2∘. The archive consists of four different folders: 22 TCWV data records covering the period 2003–2008, 11 TCWV data records covering the period 1988–2008, as well as 7 specific humidity and 7 temperature data records covering the period 1988–2009. The G-VAP data archive is referenced under the following digital object identifier (doi): https://doi.org/10.5676/EUM_SAF_CM/GVAP/V001. Within G-VAP, the characterization of water vapour products is, among other ways, achieved through intercomparisons of the considered data records, as a whole and grouped into three classes of predominant retrieval condition: clear-sky, cloudy-sky and all-sky. Associated results are shown using the 22 TCWV data records. The standard deviations among the 22 TCWV data records have been analysed and exhibit distinct maxima over central Africa and the tropical warm pool (in absolute terms) as well as over the poles and mountain regions (in relative terms). The variability in TCWV within each class can be large and prohibits conclusions about systematic differences in TCWV between the classes.
- Article
(15083 KB) - Full-text XML
- BibTeX
- EndNote


Water vapour is the most important natural greenhouse gas and the dominant source of infrared opacity in the clear-sky atmosphere (Trenberth et al., 2007). In addition, fast acting water vapour feedbacks constitute a strong amplification mechanism for anthropogenic climate change (e.g. Held and Soden, 2000), thus also making water vapour a key parameter for the energy budget of the Earth and consequently also for climate change analysis. Furthermore, the interactions of water vapour with other components of the climate system such as clouds and precipitation are still not fully understood. Analysing recent decades of global water vapour distribution and variability is expected to help extend our understanding of how the climate system responds to increasing greenhouse gas concentrations. Due to global coverage and observing periods approaching 40 years, satellite-based water vapour data records are adequate sources of information to address the above-mentioned challenges and to analyse the Earth's climate.
To date, a large variety of satellite-based water vapour data records are available. Information on such records is provided by the ECV (see Table A1 in the Appendix for a list of abbreviations) inventory (http://climatemonitoring.info/ecvinventory, last access: 12 June 2018), the Climate Data Guide (https://climatedataguide.ucar.edu/, last access: 12 June 2018), and the Advancing Reanalysis web portal at http://reanalyses.org/ (last access: 12 June 2018). Without proper background information and understanding of the limitations of available data records, these data may be utilized incorrectly or misinterpreted. The need for quality assessments of ECV CDRs is part of the GCOS guidelines for the generation of data products. Assessments in general provide an overview of available data records and enable users to judge the quality and fitness for purpose of CDRs by informing them about the strengths and weaknesses of existing and readily available records. With this in mind, GDAP initiated G-VAP whose major purpose is to quantify the current state of the art in water vapour products being constructed for climate applications and to support the selection process by GDAP. Within G-VAP, efforts started with an inventory of freely available water vapour data records. Overview tables for satellite, reanalyses, in situ and ground-based data records are provided at http://gewex-vap.org/?page_id=13 (last access: 12 June 2018). Satellite and reanalyses products with a minimum length of 10 years are basic elements of the G-VAP data archive. This archive forms the basis for scientific analysis in the characterization effort of satellite and reanalysis data records and results from such analysis have already been published (Schröder et al., 2016, 2017a). The G-VAP data archive complements the archive produced by the Global Energy and Water cycle Exchanges (GEWEX) Cloud Assessment (Stubenrauch et al., 2012). The Cloud Assessment data archive contains multi-decadal information on a large number of cloud properties from multiple platforms and is available from http://climserv.ipsl.polytechnique.fr/gewexca/index-2.html (last access: 12 June 2018).
In Sect. 2, an overview of previous and currently available satellite sensors together with a brief outlook on upcoming missions relevant for the retrieval of water vapour is presented. The focus of Sect. 3 is a summary of existing satellite and reanalysis data records. The G-VAP data archive is introduced in Sect. 4, which is based on a subset of data records introduced in Sect. 3. Section 4 starts with a brief introduction of all data records included in the archive. Then, the processing of the data records and the archive structure are explained. The following section includes exemplary results from the intercomparison of the data records from the G-VAP data archive. Here, TCWV data records with temporal coverage from 2003 to 2008 are considered so that all data records of the archive are included in the intercomparison. Conclusions are given in Sect. 7, and Appendix A provides a list of all abbreviations used.
In this section, background information on the wide variety of sensors that measure atmospheric water vapour is provided. Only sensors that have a greater than 10-year record and that cover (near) global scales are discussed. These are the types of sensors used to create global CDRs of water vapour.
Generally water vapour sensors are deployed on low-Earth orbiting and geostationary satellites. Sensors that provide (near) global coverage typically operate on polar orbiting platforms in a Sun-synchronous orbit. Such sensors provide global coverage with one day-time (at a particular local time) and one night-time overpass (12 h later). Instruments classified as sounders carry several channels distributed about a water vapour absorption line to retrieve the vertical profile of water vapour. Instruments classified as imagers might also have channels clustered about an absorption line, but the primary purpose of an imager is to sense the surface or cloud tops. Imagers are generally restricted to only retrieving TCWV.
The term “profile” usually implies the water vapour amount (mixing ratio) on a given set of pressure levels, such as those measured by radiosondes. Satellite sounding instruments respond to radiation from a great depth of the atmosphere as depicted by the instrument weighting function, so the retrieval of atmospheric layers is the natural unit here. These layers might be interpolated to pressure levels to compare with, for instance, a radiosonde or a model, but users should remain aware of the broad vertical layer over which satellite sounders nominally average.
This section approaches the overview of sensors from the standpoint of where and what they sample, and the pros and cons of each sensor from a user perspective. Chronological listings are readily available, for instance in Kämpfer (2012; Fig. 9.1). A recent overview of sensors is also provided by Wulfmeyer et al. (2015). The information provided here is a snapshot in 2017, but radiance records and sensor intercalibration continue to progress, and algorithm improvements can expand the yield and performance of remote retrievals of water vapour. This list is not meant to be exhaustive, but serves to orient the user to the major sensors supporting the water vapour CDR and their pros and cons. Sensors based on limb sounding techniques that focus on the upper atmosphere are not considered in this report. Information on these techniques and associated data records can be found at the SPARC Water Vapour Assessment 2 web portal: http://www.sparc-climate.org/activities/water-vapour/ (last access: 12 June 2018).
There are a wide variety of water vapour sensors currently operating, and for climate research the sensors change and vary through time. Understanding which sensors were operating at any given time period is a major endeavour. The World Meteorological Organization has created an online tool which makes this task much more feasible. The Observing Systems Capability Analysis and Review Tool is maintained at http://www.wmo-sat.info/oscar/ (last access: 12 June 2018).
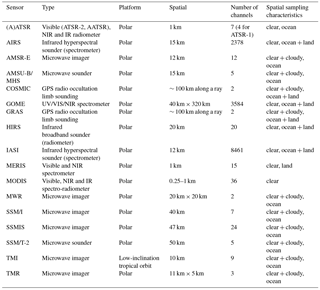
In Table 1, a summary of the main sensors used for global water vapour CDRs is presented.
Table 1Summary of the main satellite instruments used for water vapour climate data records. Spatial resolution is typically given at nadir. The last column provides information on the applicability of typical water vapour retrieval schemes under certain conditions and in certain regions.
2.1 Passive microwave sensors
Passive microwave sensors are typically classified as imagers and sounders. Some instrument names indicate the principal mission of the sensor, e.g. SSM/I, its successor SSMIS or AMSU. Regardless of the classification of the sensor, both imagers and sounders allow water vapour retrievals in clear and cloudy skies, but not in the presence of strong scattering by hydrometeors like during heavy precipitation events.
The passive microwave radiance record, from both imagers and sounders with either a conical or cross-track scan pattern and a few non-scanning, nadir-looking instruments, has exhibited good overlap and continuity since the late 1980s and early 1990s to the present. The primary spectral bands represented in the CDRs are radiances at 19, 22, 37, 50–60, 85–90, and 183 GHz. This record will continue with future sensors such as the Microwave Imager and Microwave Sounder instruments on EPS-SG, which is planned to measure until ∼ 2040. Intercalibration efforts among the sensors (e.g. Sapiano et al., 2013; Fennig et al., 2017) yield fundamental CDRs that can be used to remove time-dependent changes in the radiance record. Intercalibration efforts for the 183 GHz radiance record continue to move forward (e.g. John et al., 2012; Chung et al., 2013).
Conical scanning microwave imagers are typically configured at an Earth incidence angle of about 53∘. They have the advantage of constant spatial resolution across the scan, and constant sensitivity to the atmosphere via the same geometric path length. Microwave surface emissivity over land and ocean is a function of incidence angle, so in principle conical scanners eliminate this variable from atmospheric retrievals. Cross-track scanners have changing spatial resolution which is highest at near-nadir views and grows into larger fields-of-view at the outer edge of the scan. They have a minimal atmospheric path length at nadir.
1987 saw the launch of the first SSM/I instrument, a sensor that, while having no official climate mission, has had a profound impact on global water vapour records. The water vapour absorption line at 22 GHz is a key component of these TCWV retrievals, other window channels compensating for cloud and surface roughness effects.
TCWV from passive microwave imagers has historically only been retrieved over the ice-free oceans, and it is commonly although incorrectly stated that passive microwave retrievals work over ocean only. This is due to complex and variable land surface emissivity that changes on short timescales due to surface wetness, vegetation state, and soil properties. The barrier to passive microwave retrievals over land is beginning to fall, at least for operational weather users, as evidenced for instance by the NOAA Microwave Integrated Retrieval System (Boukabara et al., 2011; Forsythe et al., 2015). Du et al. (2015) demonstrate an AMSR2 algorithm to retrieve TCWV over land. AMSR2 onboard the Global Change Observation Mission – Water is a successor to AMSR-E onboard Aqua, and has the highest spatial resolution among passive microwave imagers on polar orbiting platforms. Land retrievals require further investigation for climate research. For the water vapour climate record the passive microwave TCWV record has not yet been demonstrated over land, but there is some possibility of this advance in the coming years.
2.2 Infrared sensors
Infrared sounding sensors constitute the longest type of satellite record for water vapour profiling. A key distinction between infrared sensors for water vapour retrievals is between radiometers (e.g. HIRS, ATSR) and spectrometers (e.g. AIRS, IASI, CrIS). The broadband observations of radiometers constitute a longer time series (versions of the HIRS instrument extend back to the early 1980s), while the hyperspectral observations of spectrometers enable retrievals with more vertical information and decreased uncertainty. The hyperspectral climate record begins with AIRS in 2002, and is augmented by the IASI instrument onboard the Metop-A and -B spacecrafts launched in 2006 and 2012, respectively. The CrIS instruments onboard the Suomi National Polar-orbiting Partnership spacecraft launched in 2011 and onboard the successor Joint Polar Satellite System spacecraft continue the hyperspectral sounding record. A third IASI instrument is due for launch at the end of 2018 onboard Metop-C, which will extend the IASI mission and the associated sounding products from 2006 to beyond 2023. IASI's successor, IASI-NG, will be onboard the EPS-SG satellite, providing hyperspectral observations until ∼ 2040. Beginning with Metop-C and due to the availability of IASI, HIRS will not be continued. In February 2016 Sentinel 3 was launched which carries the SLSTR instrument, a successor to the ATSR instrument series.
Infrared-only retrievals of TCWV and water vapour profile are retrieved under clear-sky or mostly clear-sky conditions only. The combination with passive microwave sounders improves the range of sky conditions in which retrievals are possible (e.g. Li et al., 2000; Kahn et al., 2014). The intercalibration of the HIRS record is still continuing (e.g. Shi and Bates, 2011). There are intersensor differences in the spectral placement of the 20 channels on HIRS and most impactful is the switch of channel 10 from 8.6 to 12.5 µm on the HIRS 3 and 4 sensors beginning with NOAA-15 in 1998.
While land surface emissivity is much more uniform and less time-varying in the infrared than at microwave wavelengths, infrared land surface emissivity does vary (Seemann et al., 2008) and can be problematic for infrared retrievals, especially over desert surfaces.
2.3 Ultraviolet/visible/near-infrared imagers
A TCWV retrieval using two channels at 0.885 (window) and 0.9 µm (water vapour absorption) has been demonstrated from the MERIS and MODIS instruments (Diedrich et al., 2015; Lindstrot et al., 2014). The retrieval is limited to the daylight portion of the swath, as differential solar reflectance is the signal for this retrieval. These types of retrievals have the benefit of high spatial resolution (∼ 1 km). The MERIS instrument was launched in 2002, while MODIS onboard the Terra spacecraft begins in 1999, and is complemented by the MODIS onboard the Aqua spacecraft which was launched in 2002. In February 2016 Sentinel 3 was launched which carries the OLCI instrument on Sentinel 3, a successor to the MERIS instrument. MERIS stopped operation in April 2012, while the TCWV time series can be extended with data from MODIS and OLCI. Retrievals from MERIS, MODIS and OLCI complement passive microwave TCWV retrievals because they perform best over land and have reduced quality over oceans.
UV/VIS/NIR spectrometers such as GOME, SCIAMACHY, and GOME-2 yield retrievals of TCWV over land and ocean surfaces under daylight and clear-sky conditions (e.g. Grossi et al., 2015). The spatial resolution is between 320 km × 40 km for GOME, 60 km × 30 km for SCIAMACHY, and 80 km × 40 km for GOME-2, with cloud handling being a major challenge.
A recent development in remote sensing of water vapour is the retrieval of TCWV from the NASA Orbiting Carbon Observatory (OCO-2) spacecraft (Nelson et al., 2016). This retrieval uses near-infrared reflected sunlight with the high-quality OCO-2 grating spectrometer.
Future European missions such as Sentinel-5 precursor, EPS-SG, and Sentinel-5 will carry similar UV/VIS/NIR spectrometers with improved spatial resolution (< 10 km), which will further extend the TCWV records from UV/VIS/NIR spectrometers.
2.4 GPS radio occultation
GPS-RO measurements profile atmospheric refractivity with globally distributed, all-weather sampling from which tropospheric water vapour is derived. GPS-RO missions began with the prototype GPS-MET mission from April 1995 to February 1997. The CHAMP mission provided about 250 occultations per day from 2001 to 2010. A significant increase in RO sampling density to 2000–2500 occultation profiles per day began with the launch of the six-satellite COSMIC mission in April 2006. The COSMIC orbits were spread in longitude to provide full sampling of the diurnal cycle. The GRAS GPS-RO instruments, flying onboard Metop-A and Metop-B since 2007 and 2012, respectively, provide occultation swaths centered on 09:30 and 21:30 local time. The CHAMP occultation profiles only penetrate down into the upper to middle troposphere because the GPS receiver on CHAMP was limited to closed-loop tracking. The COSMIC and GRAS GPS-RO receivers use an “open-loop” tracking capability that enables a far higher percentage of the occultation profiles to extend to within 1 km of the surface.
From the GPS-RO receiver phase measurements during each occultation, the bending of the signal path due to its passage through the atmosphere is determined. The bending angle profile is then inverted to a profile of index of refraction which is closely related to the dry gas and water vapour concentrations. The water vapour contribution is typically isolated using one of two approaches. The first is a variational technique used in numerical weather prediction assimilation systems where estimates of the water vapour, temperature and pressure from the forecast and their associated error covariances are combined with the GPS occultation bending angle or refractivity profile and its error covariance to achieve a new, statistically optimal estimate (e.g. Healy and Eyre, 2010). The second approach, referred to as the “Direct” method, estimates the dry part of the refractivity from the analysis temperature that is then subtracted from the GPS-measured total refractivity to obtain the wet part of the refractivity, which is finally scaled to obtain the water vapour. Both methods rely on the analysis temperatures that are a combination of observations and the numerical weather prediction model. The advantage of the Direct method is that it does not rely on estimates of water vapour from models, forecasts or climatologies. Estimates of the systematic and random uncertainties of water vapour derived from COSMIC observations via the Direct method are given in Kursinski and Gebhardt (2014).
GPS-RO has very high vertical resolution for a satellite system (100–200 m) and a relatively coarse horizontal resolution of about 100 km (Kursinski et al., 1997, Eq. 13). The altitude range of GPS-RO individual profiles of water vapour extends from the surface to about the 240 K temperature level in the troposphere.
GPS-RO's ability to routinely penetrate through clouds combined with its insensitivity to surface emissivity eliminates sampling biases that limit other satellite measurement systems. A caveat with present GPS-RO derived water vapour is that in warm conditions typically found at low latitudes, GPS-RO water vapour profiles in the boundary layer can be biased low when a sharp water vapour concentration contrast exists between dry free tropospheric air and moist boundary layer air below, causing the so-called super-refraction (e.g. Xie et al., 2006).
Xie et al. (2006) developed an inversion method that accounts for super-refraction and produces unbiased water vapour profiles in the boundary layer. Because it has been difficult to determine when super-refraction is occurring in the COSMIC profiles, the Xie et al. method has not yet been used much. To overcome this challenge, the new GPS-RO receivers on COSMIC 2 are designed to provide much higher signal-to-noise ratios to enable routine detection of super-refraction.
The COSMIC 2 mission is scheduled to launch six satellites in late 2018 and possibly a second set sometime later. Successors of GRAS will fly on EPS-SG with a sustained operation until ∼ 2040.
2.5 Reanalyses
Reanalysis systems are typically based on advanced operational atmospheric general circulation models and include data assimilation schemes. The data assimilation merges spatially and temporally discontinuous observations with model state fields to reinitialize atmospheric forecasts and produce spatially and temporally continuous state fields. The data assimilation schemes differ by the degree of complexity, by the assimilation strategy (i.e. assimilation of geophysical parameters vs. assimilation of radiances) and by data input. All major reanalyses assimilate a large diversity of data from observing system like radiosondes, ground-based GPS and GPS-RO, diverse satellites, buoys and ships and more. Reanalyses are performed with fixed model and data assimilation systems; however, data input to the reanalysis system changes over the years. Reanalysis products are generated retrospectively, and several reanalysis centres provide near-real-time services. The major purpose is to provide a product which allows the analysis of the weather and climate and how it changes over time. Reanalyses provide global coverage and cover the full troposphere and stratosphere. An advantage is the large diversity of gap-free geophysical parameters. Reanalyses rely on atmospheric numerical models which carry their own systematic biases, which is a disadvantage. Diversity in the assimilated observations in each system, the quality control and the varying number of observations in space and time can affect the reanalysis quality. More information can be found in the references given in Table 2 as well as at http://reanalyses.org (last access: 12 June 2018) and at http://s-rip.ees.hokudai.ac.jp/ (last access: 12 June 2018), the webpage of the SPARC Reanalysis Intercomparison Project.
Table 2Satellite and reanalysis data records. Typically the data record name is given under “Data record”. If not available the owner's name is provided. Last access to all webpages mentioned in this table: 12 June 2018.
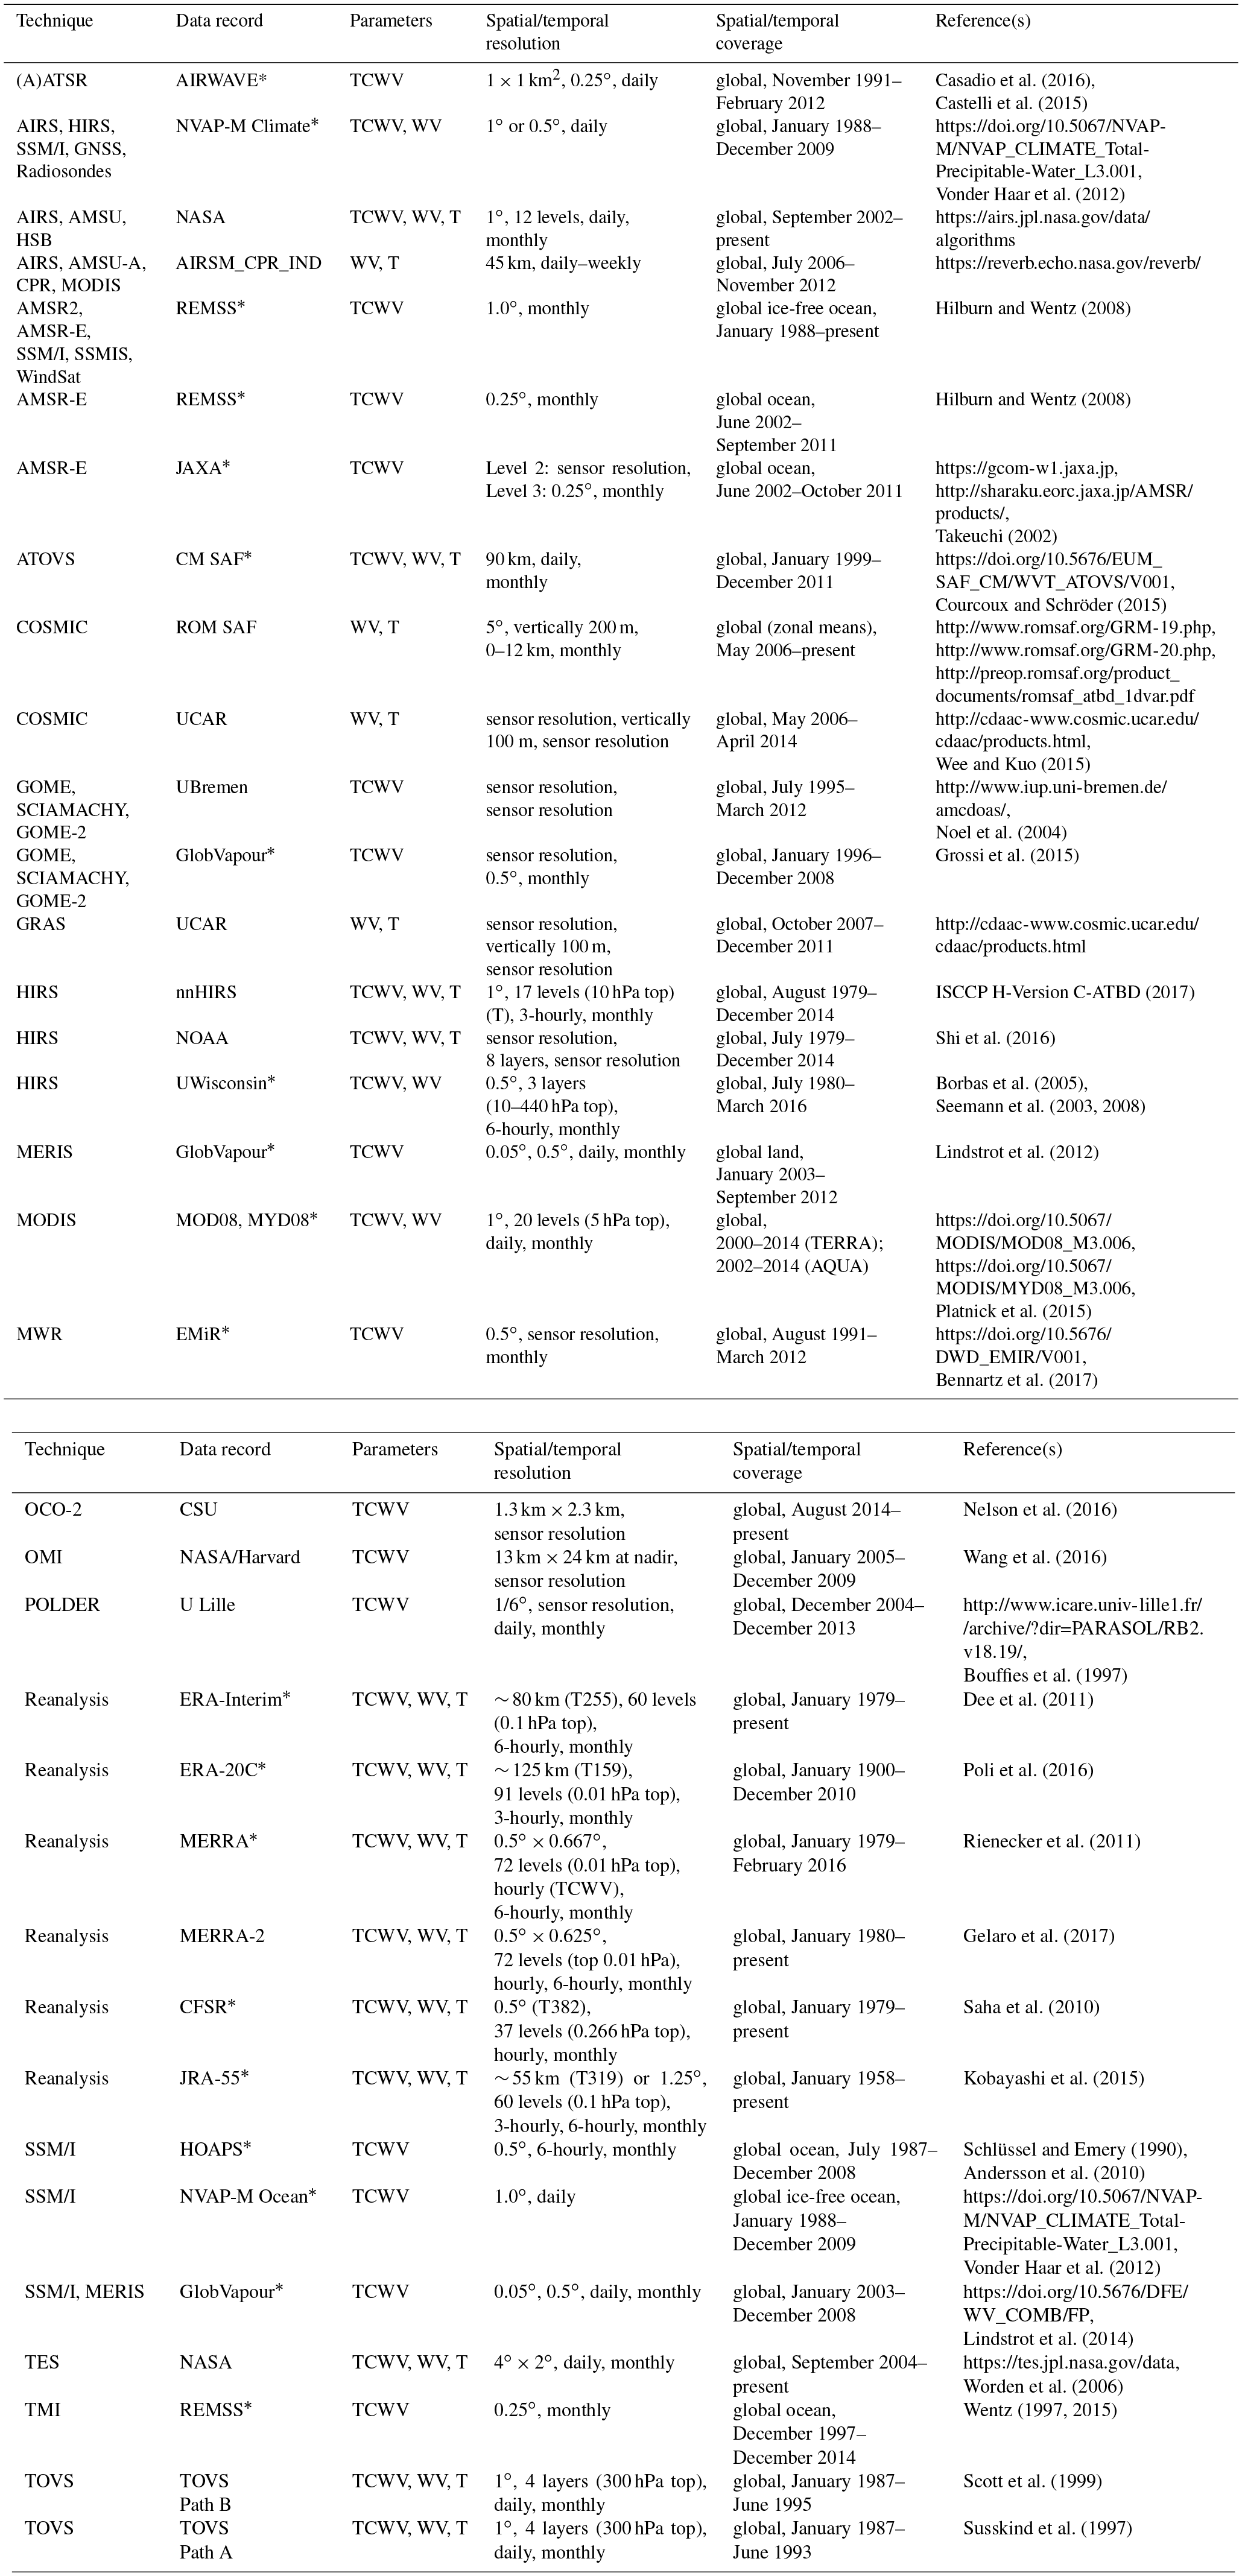
*Element of the G-VAP data archive.
Using observations from satellites and data from reanalyses, as introduced in the previous section, a large variety of (global) long-term and freely available water vapour data records have been developed over the last decades. An overview of such data records from satellite and reanalyses is provided in Table 2. The table is based on the information available on the G-VAP website at http://gewex-vap.org/?page id= 13, where tables for operational satellites as well as in situ and ground-based products are also available. The first column of Table 2 gives the sensor, while the second one contains the data record name. Subsequently this name is used. If not available or unique the data record is named after the utilized sensor and the owner. Besides the covered parameter and key references, the main technical specifications are provided which might allow a first-order decision on the fitness-for-purpose of a particular data record. Other information sources on water vapour data include the ECV inventory (http://climatemonitoring.info/ecvinventory), the Climate Data Guide (https://climatedataguide.ucar.edu/), and the http://reanalyses.org/ website.
Note that in this section a general overview of available data records is provided and that not all data records mentioned in Table 2 are part of the G-VAP data archive. A few more details regarding retrieval scheme and other details are provided in short paragraphs per data record of the G-VAP data archive in Sect. 4.1.
In this section, the G-VAP data archive is introduced which includes an explanation of why the archive consists of a subset of the data records mentioned in Table 2. GDAP has initiated G-VAP, among others, with the purpose of having G-VAP support the process of selecting suitable water vapour products by GDAP for its production of globally consistent water and energy cycle products. The usage of the products within GDAP activities essentially implied studying long-term data records, that is, data records that start around 1980 and cover more than 3 decades. In order to increase the number of available data records, G-VAP considered freely available data records with a temporal coverage of at least 10 years. Thus, the assessment considered data records that may not be used as input for GEWEX water and energy cycle data records but which are important for establishing a deep understanding of atmospheric water vapour observations. After August 2016, the filling and updating of the G-VAP data archive ended in order to allow a timely analysis of the data and provision of results to GDAP. Thus, data records that exceed a temporal coverage of more than 10 years by the end of 2015 are considered and are marked with an asterisk in Table 2.
Next follows a short introduction to the elements of the G-VAP data archive, to the post-processing which mainly transfers the data records onto a common grid and period, and to the archive structure.
4.1 Introduction to individual data records
The elements of the G-VAP data archive are given in Table 2 and are marked with asterisks. In this section abstracts are provided for each element of the archive. These abstracts briefly introduce the input data, the retrieval scheme, and technical specifications, provide basic references to the algorithm and/or the data record, and give access details.
AIRWAVE
The AIRWAVE retrieval scheme exploits the dual view capabilities of the ATSR instrument series by using the two thermal infrared channels, centred at 10.8 and 12 µm. It works above the cloud-free ocean by combining advanced radiative transfer models and a spectral emissivity database. The simultaneous use of ATSR's forward and nadir measurements minimizes the impact of the limited knowledge about the SST and the atmospheric radiation on the quality of the retrieved TCWV. Exploiting only the thermal infrared channels of the instrument, the algorithm enables the estimation of TCWV for both day and night observations and the full exploitation of the ATSR instrument series, spanning from 1991 to 2012 (see Casadio et al., 2016, and Castelli et al., 2015, for details on the retrieval). The AIRWAVE processor is integrated in the ESA Grid Processing on Demand environment for the bulk processing of the three ATSR missions (1991–2012). The product is available in Level 2 (1×1 km2 and 0.25∘ × 0.25∘). Results from comparisons to satellite and radiosonde products can be found in Casadio et al. (2016) and Papandrea et al. (2018). The AIRWAVE version 1 data record was provided as monthly means at a spatial resolution of 1∘ × 1∘ via ftp in June 2015.
AMSR-E JAXA
The AMSR-E standard TCWV algorithm uses AMSR-E brightness temperatures at 18.7, 23.8, and 36.5 GHz channels for V/H polarization, and SST, sea surface wind speed, temperature at 850 hPa given by the Japan Meteorological Agency six-hourly global analysis data as ancillary data (see Takeuchi, 2002 and Takeuchi et al., 2004 for details on the retrieval). The algorithm is applicable to open ocean regions only and its dynamic range is 0–70 kg m−2. The product is available in Level 2 (swath data with about 10 km sampling intervals) and Level 3 (daily, monthly, 0.25∘ × 0.25∘ grid for ascending and descending orbits) from June 2002 to October 2011. The reprocessing of the AMSR-E TCWV product is underway along with other AMSR-E geophysical parameter products by applying the latest AMSR2 algorithm (see Kazumori et al., 2012; Kazumori, 2013) in order to produce consistent AMSR-E/AMSR2 products covering more than 15 years. The accuracy of the product is described in Kazumori et al. (2012). The AMSR-E JAXA version 2 was downloaded as monthly means from https://gcom-w1.jaxa.jp/auth.html in February 2015.
AMSR-E REMSS
The AMSR-E REMSS water vapour algorithm utilizes all AMSR-E channels and is part of a multi-parameter retrieval scheme that simultaneously retrieves TCWV, surface wind speed, SST, and cloud liquid water content and rain rate for ocean scenes. The basic algorithm is described in Wentz (1997), with updated models of the microwave absorption, emission, and scattering by the atmosphere and ocean surface (Meissner and Wentz, 2012; Wentz and Meissner, 2017). The algorithm most strongly depends on the 23.8 GHz, on the upper wing of the water vapour line at 23.235 GHz, with the other AMSR-E channels providing information about surface roughness and atmospheric scattering and absorption from liquid water. The data are available as twice-per-day near-global gridded maps with 0.25∘ × 0.25∘ resolutions from http://www.remss.com/missions/amsr/ (last access: 12 June 2018). The TCWV values have been validated via comparison with similar measurements from TMI (Wentz, 2015) and with TCWV measurements made by ground-based GNSS sensors located on small islands (Mears et al., 2015). Monthly means of AMSR-E REMSS V7 were downloaded in March 2015.
ATOVS CM SAF
The ATOVS data record from CM SAF offers 13 years (1999–2011) of satellite-derived global water vapour and temperature products. Different parameters are generated simultaneously: TCWV, mean temperature and vertically integrated water vapour in five layers, as well as specific humidity and temperature at six levels. Also available are the number of valid observations and an uncertainty estimate. The data record was derived from ATOVS onboard NOAA-15 to -19 and Metop-A. ATOVS is composed of three instruments: HIRS, AMSU-B/MHS and AMSU-A. After application of a kriging routine, the products are available as daily and monthly means on a cylindrical equal area projection at a resolution of 90 km × 90 km. Further details on the retrieval, the data record and validation results can be found in Courcoux and Schröder (2015). Also, the validation report, algorithm theoretical basis document and product user manual can be downloaded from http://www.cmsaf.eu/docs (last access: 12 June 2018). The data record is doi-referenced (https://doi.org/10.5676/EUM_SAF_CM/WVT_ATOVS/V001) and accessible via http://wui.cmsaf.eu (last access: 12 June 2018). Here, ATOVS CM SAF version 1 was utilized, which was downloaded in April 2013.
CFSR
The NCEP CFSR was designed and executed as a global, high-resolution coupled atmosphere–ocean–land surface–sea ice system to provide an estimate of the state of these coupled domains over the period from 1979 to the present, currently being run as an operational, real-time product. The CFSR includes (1) coupling of the atmosphere and ocean during the generation of the 6 h guess field, (2) an interactive sea ice model, and (3) assimilation of satellite radiances by the Gridpoint Statistical Interpolation scheme over the entire period. The CFSR global atmosphere resolution is ∼ 38 km (T382) with 64 levels extending from the surface to 0.26 hPa from 1979 to 2009 and is ∼ 25 km (T574) after that. The CFSR atmospheric model has observed variations in CO2 over the 1979–present period, together with changes in aerosols and other trace gases and solar variations. Most available in situ and satellite observations were included in the CFSR. Satellite observations were used in radiance form, rather than retrieved values, and were bias corrected with “spin-up” runs at full resolution, taking into account variable CO2 concentrations. CFSR output products are available at an hourly time resolution and a horizontal resolution of 0.5∘ × 0.5∘. More details on the methodology and results from evaluation are given in Saha et al. (2010). The CFSR data are distributed by the National Center for Environmental Information and National Center for Atmospheric Research. The temperature as well as TCWV and specific humidity profile data records were accessed via https://rda.ucar.edu/datasets/ds093.2/ in March 2016 and June 2013, respectively.
EMiR
The MWR instrument flown onboard European Remote Sensing satellites 1 and 2 as well as onboard the Environmental Satellite has provided a time series of global microwave observations over a period of nearly 21 years between 1991 and 2012. The EMiR data record builds on the MWR time series by applying a one-dimensional variational approach to provide information on TCWV and wet tropospheric correction in clear- and cloudy-sky conditions. Significant efforts were invested to ensure a good intercalibration of the three MWR instruments. The EMiR data record covers the entire global ice-free ocean from November 1992 to March 2012. It is available for individual orbits at a spatial resolution of typically 20 km as well in a gridded form for monthly mean values at 2∘ × 2∘ and 3∘ × 3∘ spatial resolution. Details on the retrieval, the data record and results from validation are given in Bennartz et al. (2017). The EMiR data record and supporting information can be obtained free of charge from http://dx.doi.org/10.5676/DWD_EMIR/V001. The EMiR data record (version 1) was downloaded in May 2016.
ERA-Interim
The ERA-Interim's atmospheric general circulation model and 4D-Var assimilation system are based on the version of the ECMWF integrated forecast system that was used in the ECMWF operational system between 12 December 2006 and 5 June 2007 (Cy31r2). It is conducted at reduced resolution of about 79 km in the horizontal (T255 in spectral space) and 60 levels in the vertical from the surface to 0.1 hPa. ERA-Interim is the predecessor of the ERA5 reanalysis, which is currently in production (Hersbach and Dee, 2016). ERA-Interim incorporates an improved representation of the hydrological cycle, 4D-Var, the implementation of variational bias control for satellite radiances and the assimilation of TCWV satellite retrievals using the 1D+4D-Var approach (Bauer et al., 2006a, b). Over the global oceans boundary conditions are provided by prescribed estimates for SST and sea-ice cover. ERA-Interim exploits in situ measurements of surface pressure, 2 m temperature, 2 m relative humidity from land stations, ships and drifting buoys and near-surface wind from these latter two, upper-air temperatures, wind, and specific humidity from radiosondes, pilot balloons, aircraft, and wind profilers. The largest amount of data comes from polar-orbiting and geostationary satellite observations, which are mostly assimilated as brightness temperature using suitable observation operators. In addition, satellite-derived atmospheric motion vector winds, information on surface wind from scatterometers, ozone retrievals, measurements from GPS radio occultation and ocean wave height from altimeters are ingested. Between 1992 and 2006 there is an artificial reduction in precipitation of about 0.1 mm day−1 over the global oceans, which can be traced back to a problem in the linearized moist physics in the 1D-Var observation operator in the above-mentioned 1D+4D-Var scheme (Geer et al., 2008). The ERA-Interim reanalysis provides globally complete atmospheric products from 1979 onwards at a mixed 3-hourly/6-hourly output frequency and is continued with updates available at about 3 months behind real time. ERA-Interim and its quality is described in Dee et al. (2011). Monthly means of temperature as well as TCWV and specific humidity with a spatial resolution of 1∘ × 1∘ were downloaded from http://apps.ecmwf.int/datasets/ in November 2012 and June 2016, respectively.
ERA-20C
ERA-20C's atmospheric general circulation model and 4D-Var assimilation system are based on the version of the ECMWF integrated forecast system that was used in the ECMWF operational system between 19 June 2012 and 25 June 2013 (Cy38r1). It was conducted though at a much reduced resolution of about 125 km in the horizontal (T159 in spectral space) and 91 levels in the vertical from the surface to about 80 km height (0.01 hPa). The radiative forcing includes the CMIP5-prescribed (Taylor et al., 2012) evolution of greenhouse gases, tropospheric and stratospheric (volcanic) aerosols and solar forcing, while the ocean surface is constrained by prescribed forcing from the HadISST2 SST and sea-ice product (see Hersbach et al., 2015 for details). ERA-20C only uses observations from surface pressure, mean sea level pressure and marine wind, which were obtained from the International Surface Pressure Databank (Cram et al., 2015) version 3.2.6 and the International Comprehensive Ocean–Atmosphere Data Set (Woodruff et al., 2011) version 2.5.1. No humidity observations are assimilated and the analysis fields for water vapour are provided indirectly from the assimilated pressure and wind observations via the model equations in a physically meaningful way. ERA-20C provides globally complete atmospheric estimates for the period 1900–2010 at a 3-hourly output frequency. ERA-20C and its quality is described in Poli et al. (2016). Monthly means of TCWV, specific humidity and temperature with a spatial resolution of 1∘ × 1∘ were downloaded from http://apps.ecmwf.int/datasets/ in June 2016.
GOME/SCIAMACHY/GOME-2 GlobVapour
The GOME/SCIAMACHY/GOME-2 family of instruments are nadir-looking spectrometers operating in the UV/VIS/NIR wavelength region. A spectral window around the H2O absorption lines near 630 nm is used for the retrieval of TCWV over both ocean and land surfaces under daylight and clear-sky conditions (Wagner et al., 2003). Here, the GOME Data Processor 4.x algorithm (Grossi et al., 2015) is applied to observations from all three sensors. The algorithm has two major steps: the differential optical absorption spectroscopy least-squares fitting for the trace gas slant column, followed by the computation of a suitable air mass factor to make the conversion to the vertical column density. The air mass factor algorithm used is optimized for generating self-consistent long-term climatological data, by minimizing external inputs. Monthly time series of TCWV derived for each instrument are harmonized using GOME as a reference. The product covers the period January 1996 until December 2008 and has a spatial resolution of 0.5∘. Further details on the data record and results from validation can be found at http://globvapour.info/documents.html (last access: 12 June 2018) (see Product User Guide and Product Validation Report). The data record is accessible via http://globvapour.info/products.html\#daftp and version 1 was downloaded in June 2016.
HIRS UWisconsin
The HIRS UWisconsin moisture record retrieves TCWV as well as integrated high, mid, and low layer tropospheric humidity from clear-sky radiances measured by HIRS over land and ocean both day and night. The retrieval is a statistical regression (Seemann et al., 2003, 2008) developed from an atmospheric profile database (SeeBor, Borbas et al., 2005) that consists of geographically and seasonally distributed radiosonde, ozonesonde, and ECMWF reanalysis data. The AVHRR based Pathfinder Atmospheres – Extended cloud mask is used to characterize HIRS sub-pixel cloud cover. The HIRS TCWV and integrated high layer tropospheric humidity products are binned into a global map of 0.5∘ × 0.5∘, for four time periods daily (night before and after midnight and day before and after noon) and compiled into monthly amounts. The HIRS UWisconsin moisture package (version 2.5R2) was provided via ftp and downloaded in May 2016.
HOAPS
The HOAPS data record is a satellite-based climatology of TCWV, near-surface specific humidity, wind speed, precipitation, evaporation, latent heat flux and freshwater budget (evaporation minus precipitation) over the global ice-free oceans. All variables are derived from SSM/I passive microwave radiometers onboard various DMSP platforms, except for SST, which is taken from AVHRR measurements. The data record generation involves multi-satellite averages, inter-sensor calibration, and an efficient sea ice detection procedure. All HOAPS products have global coverage, i.e. within ±180∘ longitude and ±80∘ latitude, and are only defined over the ice-free ocean surface. The products are available as monthly averages and 6-hourly composites on a regular latitude–longitude grid with a spatial resolution of 0.5∘ × 0.5∘. More details on the water vapour retrieval, the data record and results from validation can be found in Schlüssel and Emery (1990), Andersson et al. (2010) and Schröder et al. (2013), respectively. Also, the validation report, algorithm theoretical basis document, and product user manual can be downloaded from http://www.cmsaf.eu/docs. Starting with v3.1 the data are accessible via http://wui.cmsaf.eu. Here, HOAPS v3.2 was utilized, which was downloaded in March 2012.
JRA-55
JRA-55 is a global atmospheric climate dataset covering the period from 1958, when regular radiosonde observations began on a global basis, to the present. JRA-55 has been produced with the TL319 version of the Japan Meteorological Agency operational data assimilation system (as of December 2009), which features among others four-dimensional variational analysis (4D-Var) and variational bias correction for satellite radiances. The products are available as monthly, 6-hourly and 3-hourly (for surface parameters only) temporal resolutions on the TL319 quasi-regular Gaussian grid (approximately 55 km resolution) as well as a regular latitude–longitude grid with a spatial resolution of 1.25∘ × 1.25∘. More details on the input data, methodology and quality of JRA-55 can be found in Kobayashi et al. (2015). Also, the JRA-55 product users' handbook can be downloaded from http://jra.kishou.go.jp/JRA-55/index_en.html (last access: 12 June 2018). Monthly means of temperature as well as TCWV and specific humidity were downloaded from http://jra.kishou.go.jp/ in February 2015 and July 2016, respectively.
Merged Microwave REMSS
The REMSS monthly merged TCWV vapour product is assembled by combining measurements from SSM/I, SSMIS, AMSR-E, WindSat, and AMSR2. The vapour algorithms for each of these instruments are very similar to the AMSR-E REMSS algorithm described above. The data from each satellite are assembled into monthly 1∘ × 1∘ gridded maps with valid TCWV over the ice-free ocean. These maps are quality controlled to exclude grid points that are corrupted by ice or land emission. Then small offsets that are derived from comparisons with TMI (Wentz, 2015) are applied to satellites with significant overlap with TMI. Then the gridded maps were combined into a single data record, using simple averaging for months when two or more satellites were operating. The merged TCWV product is available at http://www.remss.com/measurements/atmospheric-water-vapor (last access: 12 June 2018) as gridded 1∘ × 1∘ gridded maps from January 1988 to the present and is updated on a monthly basis. Validation results can be found in Mears et al. (2015). The TCWV data record (V7) was obtained online from http://www.remss.com/measurements/atmospheric-water-vapor/ in April 2013.
MERIS GlobVapour
The high spatial resolution TCWV data record was derived from ESA's third reprocessing of the MERIS L1 archive. The TCWV retrieval is based on an optimal estimation approach and applied to swath-based, normalized radiances in MERIS bands at 865, 885, and 900 nm, while the cloud screening procedure utilizes the full set of MERIS radiances between 400 and 900 nm. The product also includes information on uncertainties. Further details on the retrieval and results from validation are given in Lindstrot et al. (2012). The data record covers the period January 2003–March 2012 and is available on a global grid at a spatial resolution of 0.05∘ over the coastal ocean, open ocean areas with occurring sun glint, and cloud-free land surfaces. The data record (version 1) was provided via ftp in July 2015.
MERRA/MERRA-2
MERRA is described in Rienecker et al. (2011). While there were some successes in MERRA, the changing observing system, particularly with sensors sensitive to water vapour, lead to spurious jumps in the global TCWV record. In attempting to improve on MERRA, MERRA-2 incorporates a mass conservation constraint on the dry mass and water vapour assimilation that results in the global water vapour analysis increment to be negligibly small, which has the result of a global evaporation and precipitation balance (Takacs et al., 2016; Gelaro et al., 2017). For total column water, this has led to a global time series that is much more stable than that of MERRA (Bosilovich et al., 2017). While the global water analysis increments are essentially zero, they can have a value at any given point or region, and the influence of the changing water vapour observations can also be apparent. In addition, over land surfaces, MERRA-2 uses observation corrected precipitation as the surface source of water, providing another observation constraint in the global water cycle (Reichle et al., 2017). The input data, the methodology and the quality of MERRA2 are described in Gelaro et al. (2017). Monthly means of temperature as well as TCWV and of specific humidity (MERRA) with a spatial resolution of 0.5∘ × 0.66∘ were downloaded from https://goldsmr2.gesdisc.eosdis.nasa.gov/ in November 2012 and March 2013, respectively. MERRA-2 has a spatial resolution of 0.5∘ × 0.625∘ and was downloaded from https://goldsmr5.gesdisc.eosdis.nasa.gov/ in April 2016.
MODIS/Aqua NASA (MYD08_M3)
The MODIS/Aqua TCWV data record from NASA was obtained from the Collection 6 MODIS Near-IR Products (called MOD05). The near-IR TCWV is derived from the attenuation by water vapour of near-IR solar radiation. Techniques (Gao and Kaufman, 2003) employing ratios of water-vapour-absorbing channels 17, 18, and 19 with the atmospheric window channels 2 and 5 are used. The ratios remove partially the effects of variation of surface reflectance with wavelength and result in atmospheric water-vapour transmittances. The solar retrieval algorithm relies on observations of water-vapour attenuation of reflected solar radiation in the near-infrared MODIS channels so that the product is produced only over areas where there is a reflective surface in the near IR, during the daytime, over clear land areas of the globe and above clouds over both land and ocean. Over clear ocean areas, water-vapour estimates are provided over the extended glint area. The Level 2 data are generated at the 1 km spatial resolution of the MODIS instrument. There are three MODIS Level 3 gridded atmosphere products: daily, 8-day, and monthly, where the Level 2 atmosphere products are aggregated to a 1∘ × 1∘ equal-angle global grid (called MOD08, Platnick et al., 2015). The MODIS/Aqua MYD08 monthly mean TCWV data record (MYD08_M3) was downloaded from https://ladsweb.modaps.eosdis.nasa.gov/search/order/2/MYD08_M3–6 in May 2015.
nnHIRS
The nnHIRS global atmospheric temperature–humidity profile data product is one of the products produced by the International Satellite Cloud Climatology Project and is based on new retrievals from re-calibrated HIRS measurements (Shi et al., 2016) with temporal (and some spatial) interpolations to provide global coverage every 3 h over the period 1980–2015. The new retrievals include the following: (1) a cloud detection algorithm is applied to each individual field of view (pixel) and all clear pixels are processed, (2) the retrieval procedure accounts for variations of CO2 abundance over the record, (3) the retrieval procedure accounts explicitly for variations of surface topography and (4) the retrieval obtains values for near-surface air and skin temperatures separately. Because of cloud cover, the typical coverage of the globe on a given day is about 30 %, but only about 10–15 % at a given time of day. This product provides global coverage every 3 h from the new retrieval results by employing time-interpolation procedures, including a specific statistical model of the diurnal variations of temperature in the lower troposphere over land. The humidity profile is extended into the stratosphere by combining the HIRS-based results with those from other satellite measurements of humidity (Davis and Rosenlof, 2016). The near-surface humidity over oceans is adjusted based on a matched analysis of satellite microwave observations to produce the SeaFlux products (Clayson et al., 2012). The near-surface temperatures over land are adjusted based on the global collection of surface weather observations (Smith et al., 2011). Results from comparisons to various other observations are shown in ISCCP H-Version C-ATBD (2017). Monthly means of TCWV and specific humidity from the nnHIRS data record were provided via ftp in October 2015, while monthly means of temperature were provided in August 2016. The data record was provided on a 1∘ equal area grid together with software to map the data onto a regular longitude and latitude grid of 1∘ × 1∘.
NVAP-M Climate/NVAP-M Ocean
The NVAP-M completely replaces the heritage NVAP data set created in the 1990s and was created from polar orbiter satellite data along with radiosondes and surface-based Global Positioning System measurements. It contains three data types oriented towards different users: “Climate” strives for maximum temporal consistency (NVAP-M Climate), “weather” strives for maximum spatial and temporal coverage and “Ocean” is a microwave-only record over the ocean (NVAP-M Ocean). NVAP-M Climate and Ocean have a grid resolution of 1∘ × 1∘, are provided as daily averages and cover the period 1988–2009. Both contain TCWV, while NVAP-M also contains layered precipitable water vapour at four layers. Further details on the retrieval and first results from evaluation can be found in Vonder Haar et al. (2012). The profile data are not part of the G-VAP data archive because they are not a product defined at vertical levels. NVAP-M Climate and Ocean are freely available at https://eosweb.larc.nasa.gov/project/nvap/nvap-m_table (last access: 12 June 2018) and were provided as a beta version in November and December 2012, respectively. The data have not been changed between the provision of the beta version and the doi-referenced release (https://doi.org/10.5067/NVAP-M/NVAP_CLIMATE_Total-Precipitable-Water_L3.001).
SSM/I+MERIS GlobVapour
The combined SSM/I+MERIS TCWV product utilizes SSM/I data onboard DMSP satellites F13 and F14 over the ice-free ocean and MERIS data from ESA's third reprocessing of the MERIS L1 archive over the cloud-free land and coastal ocean. Ocean areas with sun glint, where SSM/I observations are not available, are blended with gridded MERIS data. SSM/I and MERIS data streams are processed independently and combined afterwards, leaving the individual TCWV values and their uncertainties unchanged. To ease utilization, the SSM/I+MERIS product is distributed on a 0.5∘ × 0.5∘ grid, with the MERIS product being averaged to match the lower spatial resolution. Upon request, the product can also be provided in 0.05∘ × 0.05∘ spatial resolution by oversampling the SSM/I product. The product is available as daily composite and monthly mean and covers the period 2003–2008. The retrieval, the data record and results from validation are described in Lindstrot et al. (2014). The data record is doi-referenced (https://doi.org/10.5676/DFE/WV_COMB/FP) and accessible via http://globvapour.info/products.html\#daftp. The SSM/I+MERIS data record (version 1) was downloaded in January 2014.
TMI REMSS
Using a consistent processing scheme and a robust radiative transfer model, the TMI data were intercalibrated with other microwave radiometers, brightness temperatures were computed, and then the ocean measurement products were generated for distribution. This carefully applied intercalibration yields consistent products from all microwave radiometer data processed at RSS. Besides TCWV the data record contains SST, 10 m surface wind speed, 10 m surface wind speed, cloud liquid water, and rain rate. Further details on the retrieval are given in Wentz (1997, 2015) and validation results are given in Wentz (2015). The data record is available at a grid resolution of 0.25∘ × 0.25∘ and covers the period 7 December 1997 to 31 December 2014. The TCWV data record (V7) was obtained online from http://www.remss.com/missions/tmi/ in March 2015.
4.2 Processing
After download of the data records with technical specifications as described in the previous section and prior to further processing fill values, missing values and values that are outside the data record specific validity range were assigned a unique undefined value.
In order to ease joined analyses, the data records are mapped onto a common grid. The data records are provided as monthly means. All data records except NVAP-M Climate and Ocean are available as monthly means. NVAP-M Climate and Ocean contain daily averages and the daily values within a month are arithmetically averaged using all valid observations to compute monthly means. The common grid was defined as the minimum integer multiple applicable to most of the data record grids, which leads to a grid resolution of 2∘ × 2∘ longitude–latitude. In order to remove a shift in the spatial grid between the satellite-based products and the reanalysis products, the reanalysis grids are shifted by half a grid box. Therefore, the CFSR, ERA-Interim, ERA-20C, JRA-55, MERRA and MERRA-2 monthly means are linearly interpolated to a grid with unchanged spatial resolution but changed centre positions. This approach was also applied to AMSR-E JAXA. Then, all data records are arithmetically averaged onto the common grid by considering all valid observations within a grid cell (see also Schröder et al., 2016). Note that the regridding procedure impacts the data record's internal variance and characteristics of extremes.
Some reanalysis products contain valid values below surface pressure. Thus, a common surface pressure mask was applied to all data records. The common surface pressure mask is computed on a monthly basis from MERRA monthly mean surface pressure, and then interpolated onto the common grid. Data below this surface pressure were set to the undefined value. In case information on surface pressure is an integral part of the individual data record, both masks were applied. Data at four standard pressure levels are provided: 300, 500, 700, and 1000 hPa. An interpolation was not required because all profile data records include these four levels. In nnHIRS and some reanalysis products, levels below the surface, e.g. in the presence of mountains, are not present.
All data records are provided as Network Common Data Format files (http://www.unidata.ucar.edu/software/netcdf/, last access: 12 June 2018). The data files conform to the NetCDF Climate and Forecast Metadata Convention version 1.5 (http://cfconventions.org/documents.html, last access: 12 June 2018). In addition to either TCWV (in kg m−2), specific humidity (g kg−1) or temperature (K) data, the longitude and latitude values are part of each file and defined at grid centre. For the profile data records the pressure vector (in hPa) is included as well.
4.3 Archive structure
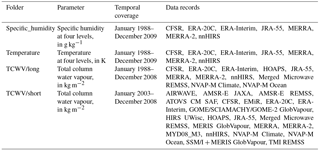
The G-VAP data archive contains TCWV as well as profiles of specific humidity and temperature. In order to allow a joint analysis using all data records from the archive, the maximum common period covered by all data records was identified, which is the period from January 2003 to December 2008. In order to also provide data records that allow an analysis and intercomparison of data records in a climate context, a second set of data records was defined which spans the period January 1988–December 2008 by looking for a maximum in common temporal coverage and a maximum in the number of available number data records. The common period for the water vapour and temperature profile data records goes from January 1988 to December 2009. Thus, the G-VAP data archive consists of four folders: 22 TCWV data records covering the period 2003–2008, 11 TCWV data records covering the period 1988–2008, as well as seven specific humidity and seven temperature data records covering the period 1988–2009. An overview of the folders is given in Table 3. The file names contain information on parameter, key sensor, data record name, data record version, period and G-VAP data archive version (v1.0).
Besides the cautionary note on the impact of regridding on the variability of each data record, the following comments need to be taken into account when working with the G-VAP data archive: the data records have been downloaded between 2012 and 2016. In the meantime new data record versions of the individual elements of the archive might be available. Lastly, individual data records differ in terms of spatial and temporal sampling, coverage, and masks applied.
As G-VAP will be continued the G-VAP data archive will be updated over the next years and released in approximately 2020. The updated release will include newly generated data records, data records which have not been considered yet and new versions of elements of the current G-VAP data archive. It is planned to keep the overall format and technical specifications of the G-VAP data archive, with one important change: In order to keep the gap between last year covered by elements of the archive and release date at minimum and in order to enhance applicability, the data records will not be provided on common period but on individual temporal coverage.
In order to provide an example of the analysis possible with this archive, and to reveal and, in part, explain differences among the data records, results from the intercomparison of TCWV data records over the period January 2003–December 2008, i.e. utilizing data records from the folder TCWV/short, are shown in this section. In this way, all elements of the G-VAP data archive are considered in this intercomparison effort (see Table 3). Intercomparison results for long-term data records and for profile data records are given in Schröder et al. (2016, 2017a, 2018).
The analysis was carried out on the basis of monthly means on a regular latitude–longitude grid with 2∘ resolution. The ensemble mean, the difference and the absolute and relative standard deviations were computed using all valid observations at each grid point and data from all records of the G-VAP data archive. The relative standard deviation was normalized using the ensemble mean.
Figure 1 shows the ensemble mean and respective absolute and relative standard deviations based on the 22 data records. As not all data records provide global coverage, the available number of data records differs regionally. Standard deviations are generally lowest over ocean areas, whereas over land, the values are generally larger. Regional maxima in standard deviation occur over central Africa, the tropical warm pool and South America. The largest relative standard deviations are found in polar and high mountain regions (>25 %).
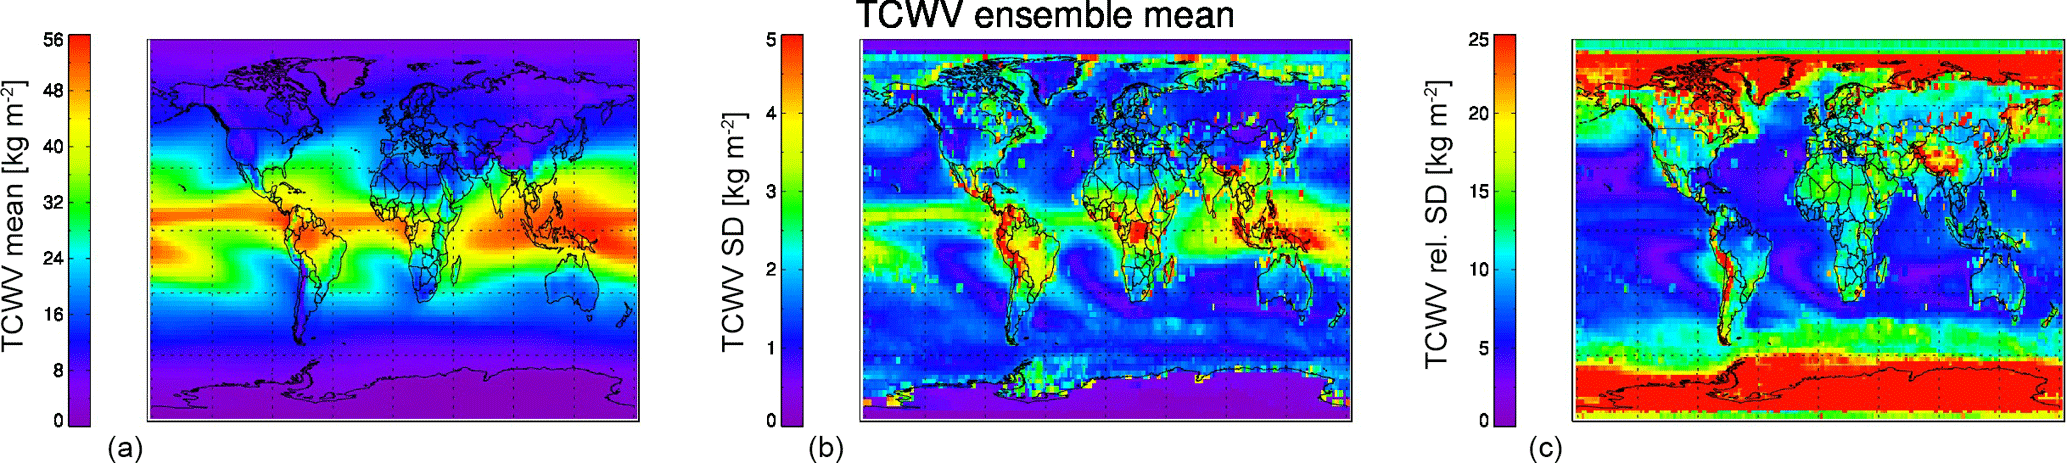
Figure 1Ensemble mean (a), absolute (b) and relative (c) standard deviation calculated based on all elements of the G-VAP data archive. Note that the number of available data records differs regionally.
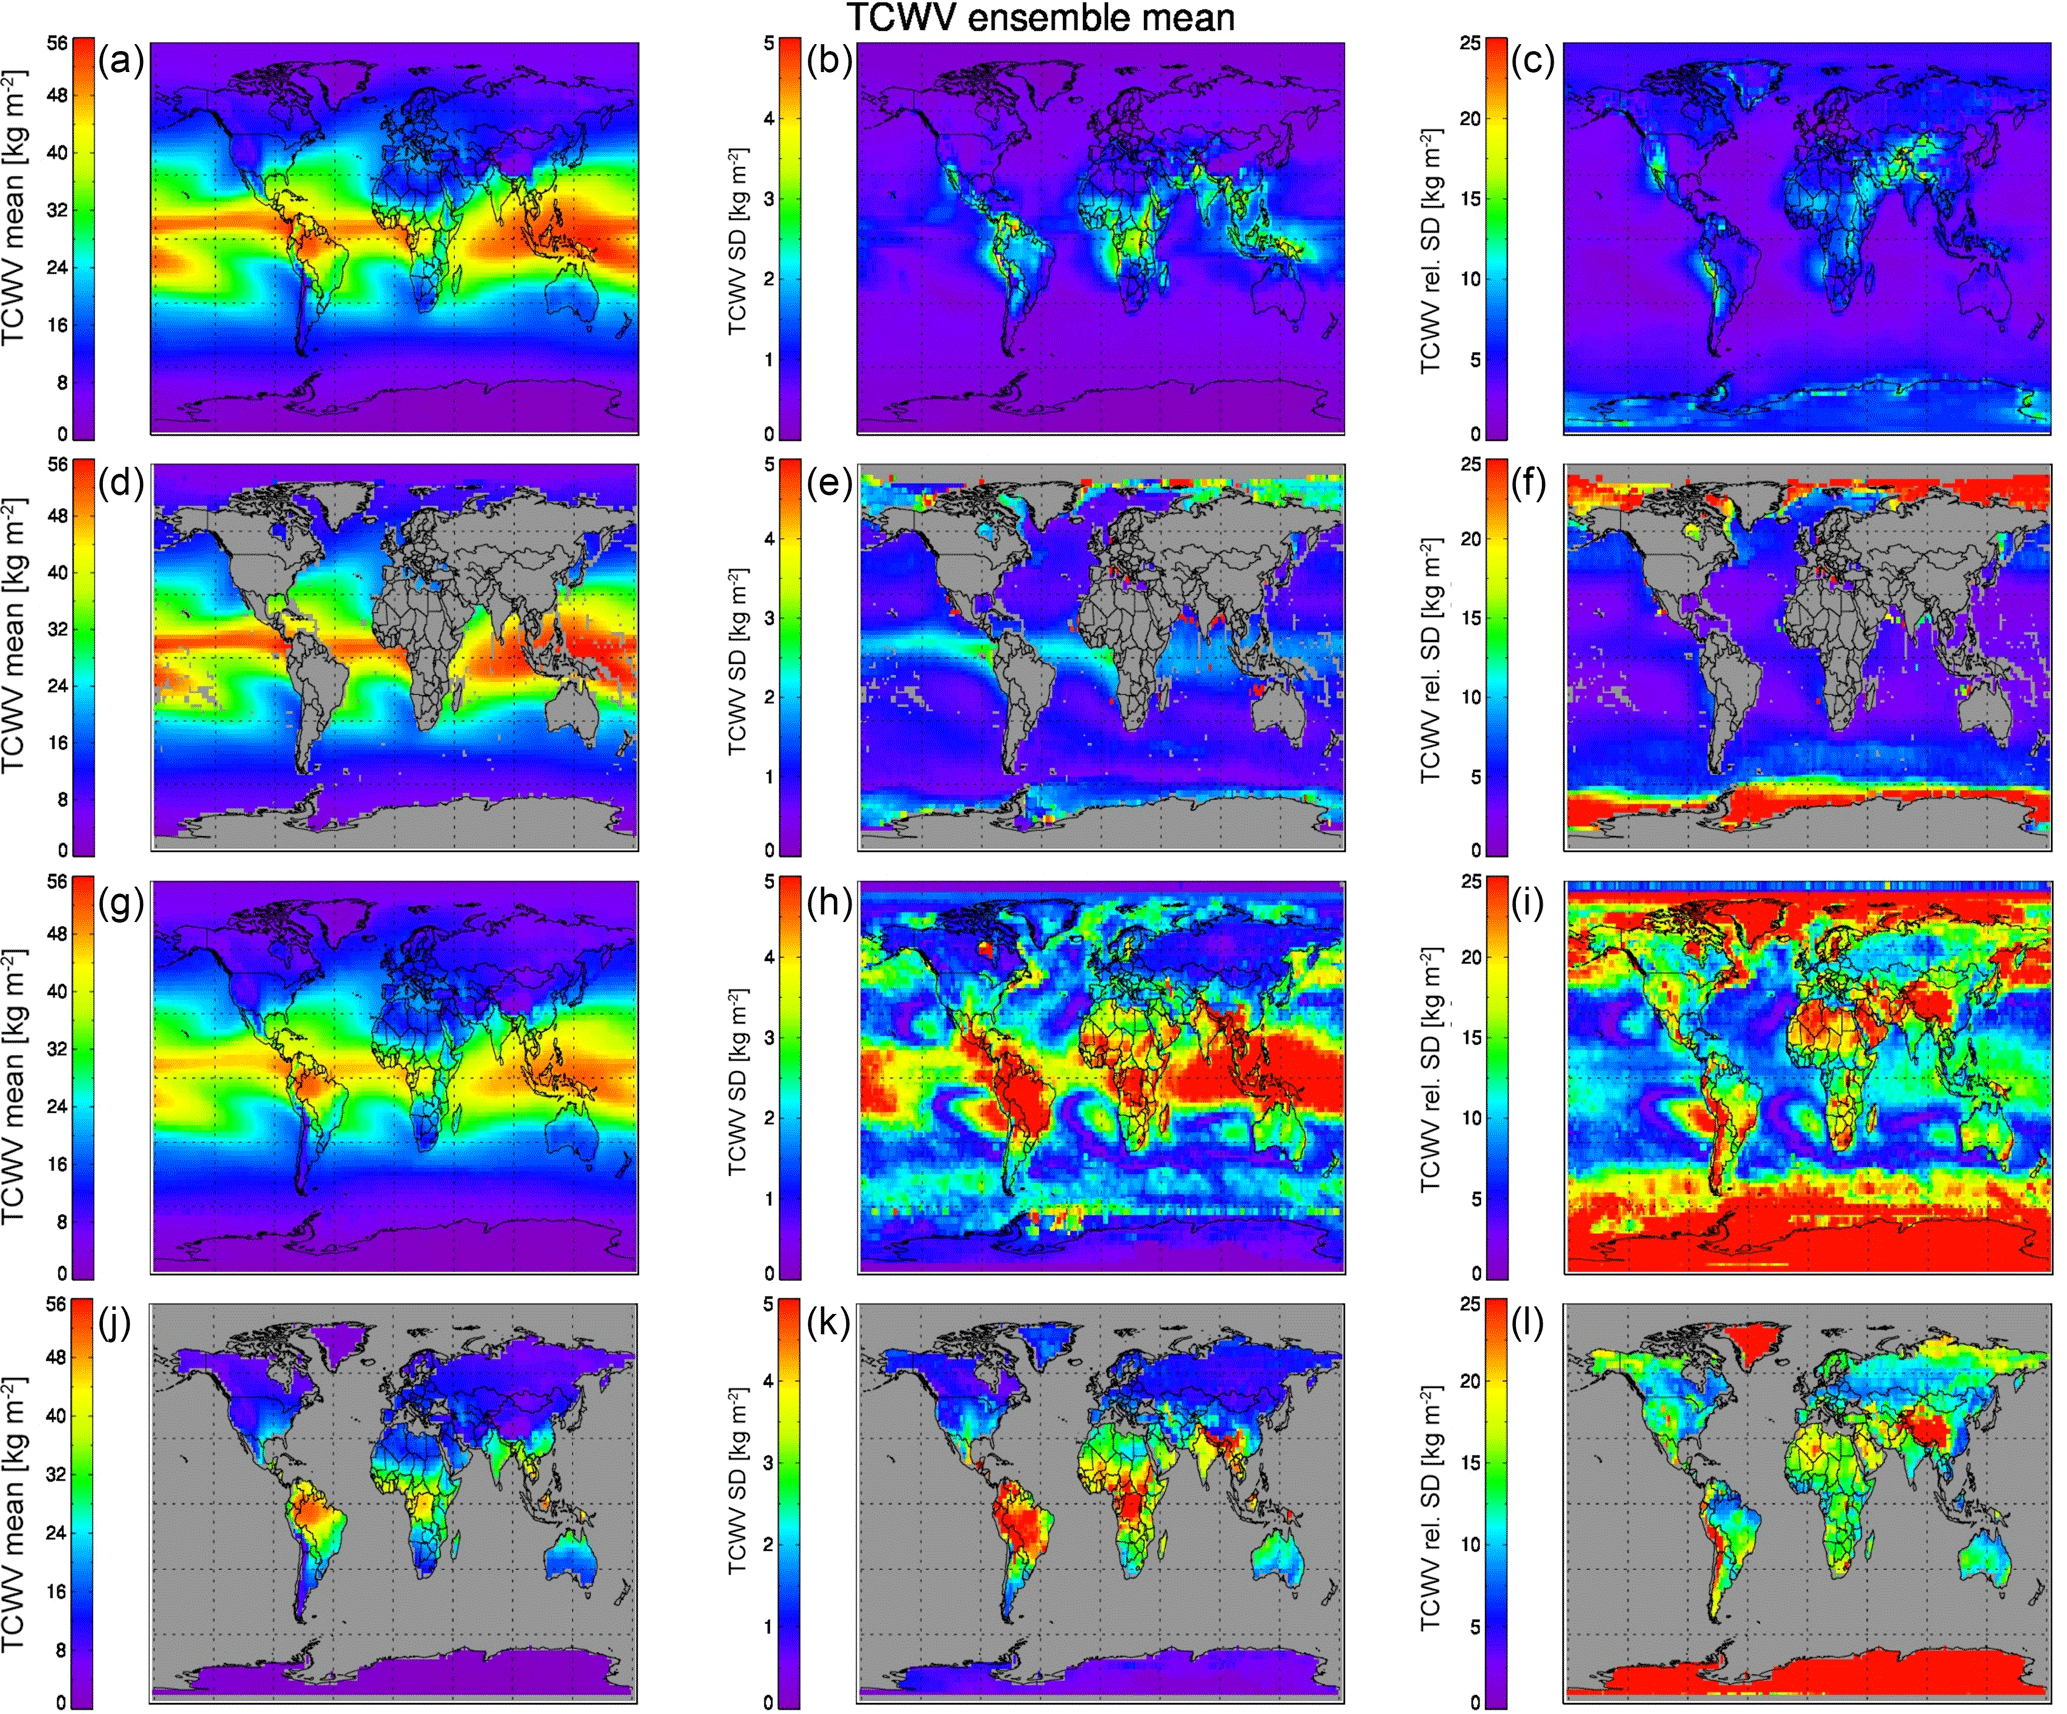
Figure 2TCWV ensemble means (a, d, g, j), absolute (b, e, h, k) and relative (c, f, i, l) standard deviations for the different classes of predominant retrieval condition (from top to bottom): all-sky (a, b, c), cloudy-sky (d, e, f), clear-sky (global) (g, h, i) and clear-sky over land (j, k, l).
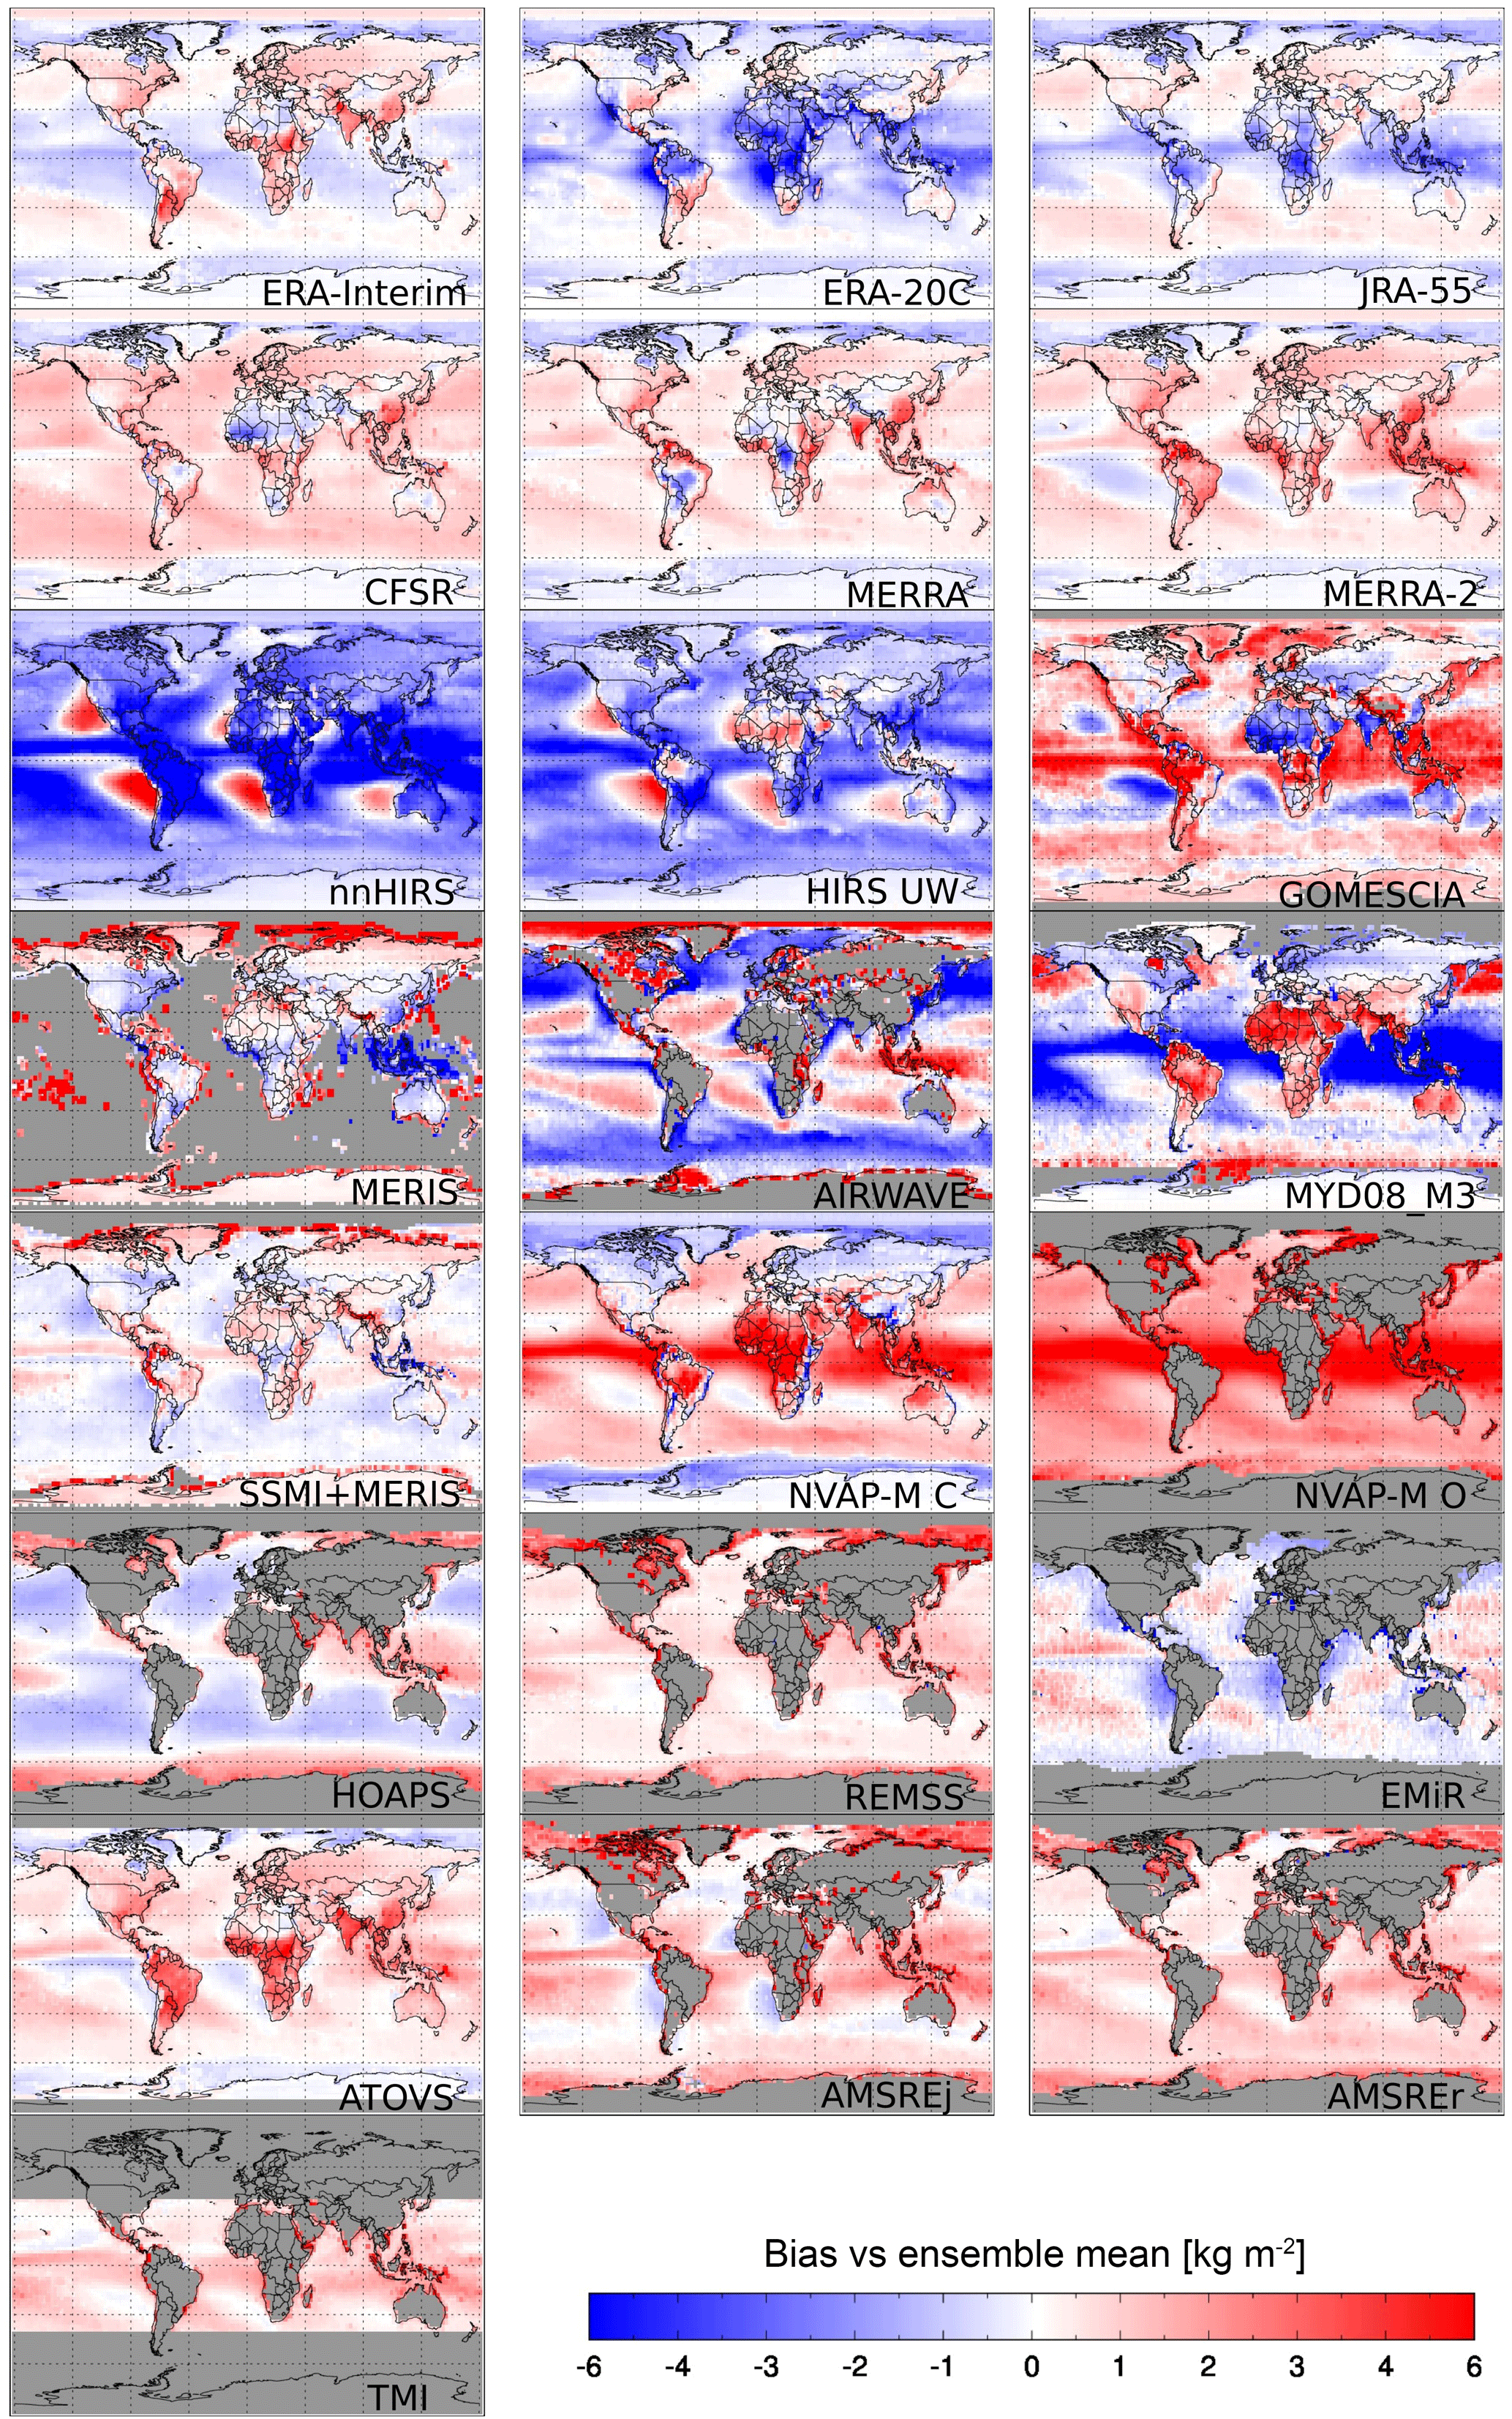
Figure 3TCWV bias relative to the ensemble mean for all elements of the G-VAP data archive. Partly the panels include unambiguous abbreviations of the data record names, with the following exceptions: AMSR-E JAXA (AMSREj), AMSR-E REMSS (AMSREr), Merged Microwave REMSS (REMSS).
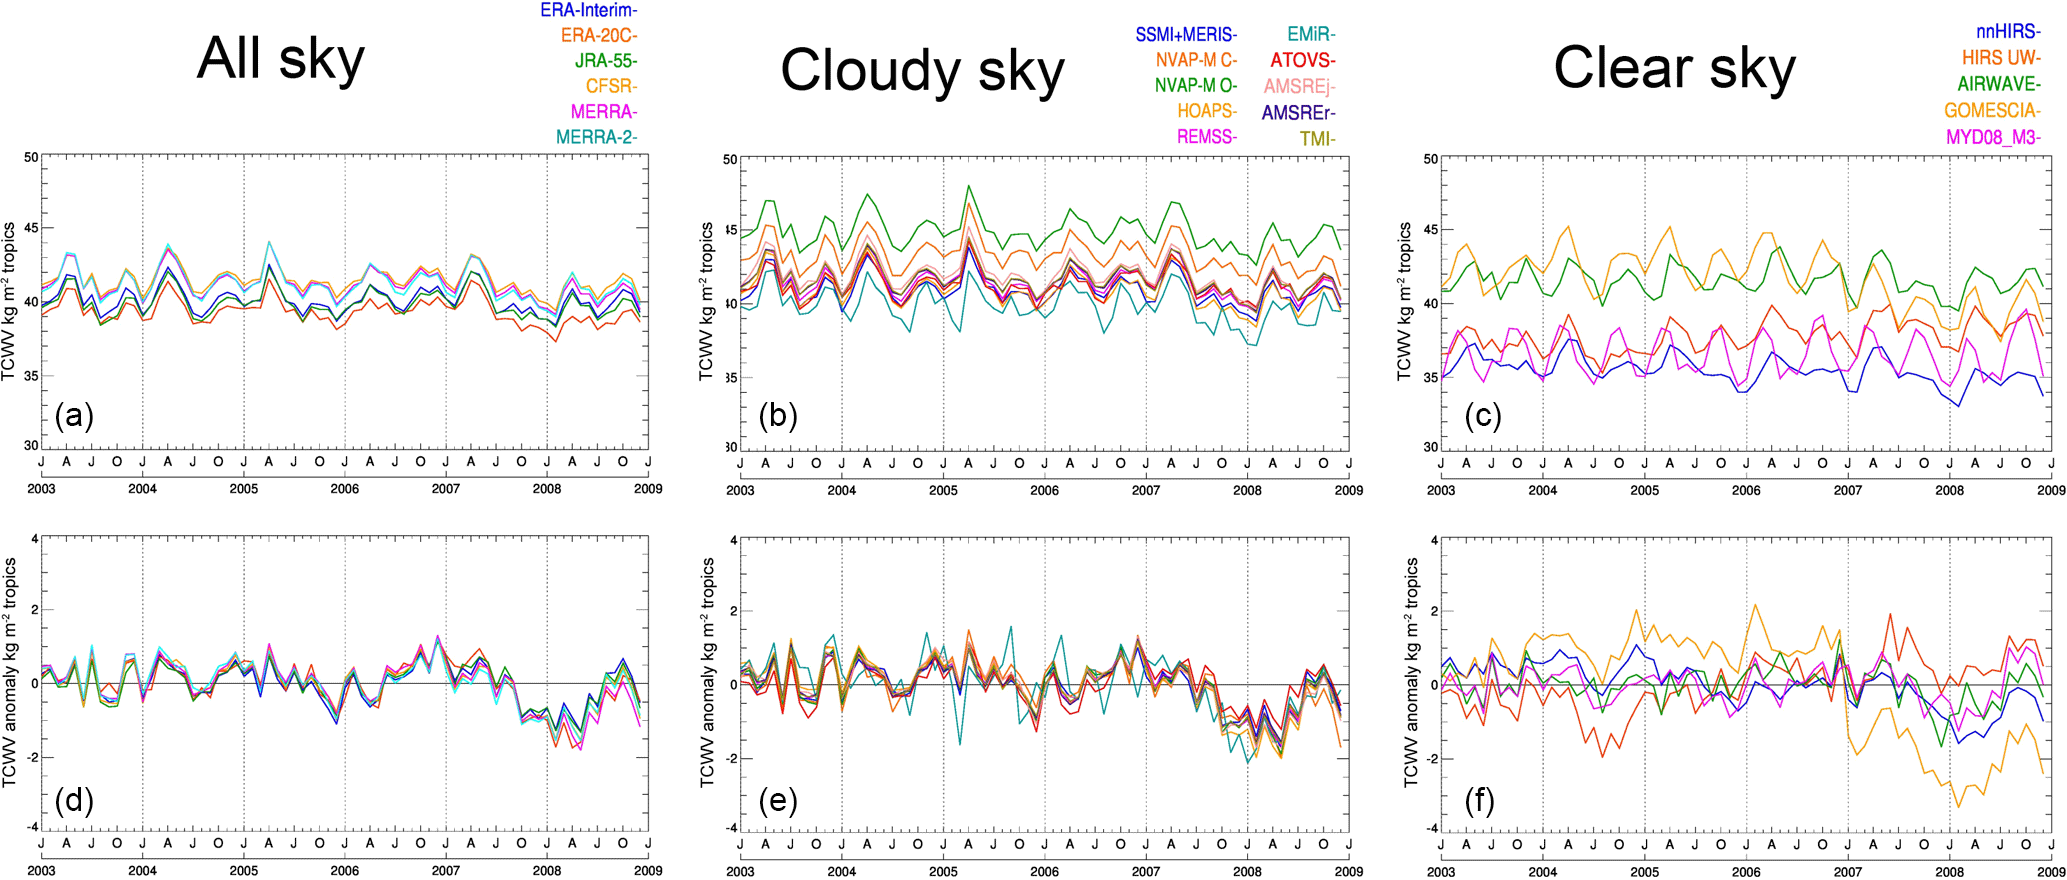
Figure 4Time series (January 2003–December 2008) of TCWV (a, b, c) and TCWV anomalies (d, e, f) for the tropics (±20∘ N/S) over ocean for the predominant retrieval condition classes all-sky (a, d), cloudy-sky (b, e) and clear-sky (c, f). MERIS is not shown because it is not defined over ocean. Partly the legends include unambiguous abbreviations of the data record names, with the following exceptions: AMSR-E JAXA (AMSREj), AMSR-E REMSS (AMSREr), Merged Microwave REMSS (REMSS).
The intercomparison is further refined by dividing the 22 data records into the following three classes: clear-sky, cloudy-sky and all-sky. The assignment of a data record to one of these classes is done according to the predominant condition required for retrieval application. Some data records include observations under predominant clear-sky conditions, while others include observations under predominant clear-sky and cloudy-sky conditions and under all-sky conditions, i.e. additionally in the presence of strong precipitation. The clear-sky class is further divided into data records which allow observations on global scales and above land only. Note that the monthly mean products have been used without any effort to harmonize the cloud and precipitation screening and that the separation of the data records according to the predominant condition of retrieval applicability essentially also separates the data records from different sensor types. For simplicity the terms clear-sky, cloudy-sky and all-sky class are used to indicate the predominant condition of retrieval applicability.
Figure 2 depicts ensemble means and respective standard deviations for the three different classes defined above. The all-sky class includes six data records, of which all are reanalysis products (CFSR, ERA-Interim, ERA-20C, JRA-55, MERRA, and MERRA-2). The differences among them are generally low, with absolute (relative) standard deviation values staying below 3 kg m−2 (15 %). The largest differences are found over land areas, in particular over Africa. The cloudy-sky class includes mainly products based on passive microwave radiometers with retrieval schemes mostly limited to ice-free ocean areas: AMSR-E JAXA, AMSR-E REMSS, ATOVS CM SAF, EMiR, HOAPS, NVAP-M Climate, NVAP-M Ocean, SSMI+MERIS, Merged Microwave REMSS, and TMI REMSS. The data records agree generally well, with relative standard deviation values below 10 % over large parts of the ocean, except for the polar (ocean) regions where standard deviation values larger than 25 % are found. The clear-sky class includes data records based on measurements from ultraviolet/visible/near-infrared imagers that cannot see through clouds and are therefore predominantly limited to clear-sky conditions: AIRWAVE, HIRS UWisconsin, GOME/SCIAMACHY/GOME-2 GlobVapour, MYD08_M3, MERIS GlobVapour, nnHIRS, and SSMI+MERIS. These data records exhibit global coverage, except AIRWAVE (ocean only) and MERIS-related products (land only). HIRS UWisconsin, GOME/SCIAMACHY/GOME-2 GlobVapour, MYD08_M3, and nnHIRS have global coverage. Results are presented separately for all data records with global coverage (third row in Fig. 2) and all data records with coverage over land areas (fourth row in Fig. 2). The results reveal large standard deviations between the data records over both land and ocean. Large relative standard deviations are again found over the polar regions, over both land and ocean. The areas of the ITCZ, deserts (e.g. Sahara) and mountain regions are affected by large differences. Systematic differences might occur in mountain regions due to differences in the original spatial resolution. In addition, the treatment of topography differs between the data records, and over land the ambiguity between surface properties and near-surface atmospheric properties in retrieving humidity at near-surface layers is challenging and differences in its treatment contribute to the observed features over land.
In order to investigate in more detail which data records cause the different areas with increased standard deviation values, the difference relative to the ensemble mean was calculated for each of the 22 data records. The corresponding maps are shown in Fig. 3. All IR-based retrievals (AIRWAVE, HIRS UWisconsin, nnHIRS, MYD08_M3) exhibit large positive differences over subtropical high-pressure zones. GOME/SCIAMACHY/GOME-2 GlobVapour also exhibits a feature in this area but shows negative differences, and thus lower values than the other IR-based retrievals. ATOVS CM SAF and MERRA-2 exhibit positive differences over all continents, while nnHIRS shows generally negative differences over land. On regional scales over land, ERA-20C and nnHIRS show the largest negative differences, whereas ATOVS CM SAF, MYD08_M3 and NVAP-M Climate show the largest positive differences on regional scales over land. These regional scales are mainly located in the tropics, i.e. over central Africa and South America and the Sahara. Here also the reanalysis data records differ, with ERA-20C and JRA-55 showing lower values compared to the other reanalyses. Over the ocean areas, differences are generally small for all microwave-based and reanalysis products, except ERA-20C, JRA-55, and NVAP-O, which show relatively large negative (reanalyses) and positive (NVAP-O) differences in the tropics. The features over South America, central Africa, the Sahara and the tropical warm pool cannot be explained by contributions from a single outlier. Schröder et al. (2016) analysed anomaly differences over the regions of central Africa, the Sahara and South America using a subset of data records. Their Fig. 5 shows that CFSR (Sahara), MERRA (central Africa, Sahara) and NVAP-M Climate (central Africa) exhibit break points in and opposed temporal changes (South America) over the period 2003–2008. Thus, not systematic differences, but break points and opposed temporal changes can at least partially explain the distinct features at regional scales.
Figure 4 shows time series of TCWV and TCWV anomalies over the tropical ocean, with the data records grouped according to the three different classes of predominant retrieval condition. They served to investigate the consistency of the temporal variability as possible source for differences found between the data records and to assess the presence of systematic differences among the three classes. The reanalysis data (all-sky class) show good agreement over time over the tropical ocean area, with a spread of around 2 kg m−2 among the different data records. This is not too surprising as the spatial maps already showed the good agreement among the reanalyses over ocean. For the two other classes, however, we found areas of larger differences in Fig. 2. Accordingly, relatively large spreads among the data records in the order of 5 and 6 kg m−2 for the cloudy-sky and clear-sky classes were found, respectively. Concerning the data records from the cloudy-sky class the spread is mainly caused by NVAP-M Climate and Ocean that both show larger values than the others which actually agree within 2 kg m−2. Despite the offsets between the data records, the anomalies agree well between the data records from the cloudy-sky class. Only the EMiR anomalies exhibit individual months with larger differences (∼ 1 kg m−2) in 2005 and 2006 with respect to the other anomaly time series. For the data records from the clear-sky class, an offset between the individual records and differences with respect to the seasonal cycle and its magnitude were found. GOME/SCIAMACHY/GOME-2 GlobVapour and MYD08_M3 show pronounced biannual cycles with maxima in spring and fall. Reasonable agreement is found between GOME/SCIAMACHY/GOME-2 GlobVapour and AIRWAVE as well as HIRS UWisconsin, MYD08_M3 and nnHIRS until end of 2006. Afterwards this agreement disappears. This is partly due to a small increase in TCWV for HIRS UWisconsin over the period 2003–2008 and to a decrease in TCWV for GOME/SCIAMACHY/GOME-2 GlobVapour occurring in late 2006 and 2007. The latter change coincides with the launch of Metop-A end of 2006 with the GOME-2 instrument onboard.
Frequently observed regional maxima in standard deviation (Figs. 1 and 2) and in absolute difference (Fig. 3) occur in regions with persistent and large mean cloud cover. Sohn and Bennartz (2008) argue that the specific humidity (and with this TCWV) within clouds is generally larger than in surrounding clear-sky areas. This clear-sky bias is in order of 10 % (Sohn and Bennartz, 2008). This is similar to the difference between HIRS UWisconsin, MYD08_M3, and nnHIRS and AMSR-E JAXA, AMSR-E REMSS, ATOVS CM SAF, HOAPS, Merged Microwave REMSS and TMI REMSS (Fig. 4). However, the variability in TCWV within the cloudy-sky and the clear sky class is relatively large (Fig. 4) and prohibits conclusions on systematic differences between the all-sky and cloudy-sky as well as between the cloudy-sky and clear-sky class. As noted previously, the presented results are based on a separation of the data records according to predominant retrieval condition and not according to atmospheric condition.
The G-VAP data archive was generated in April 2017. The data are available in netCDF format and can be accessed via https://doi.org/10.5676/EUM_SAF_CM/GVAP/V001 (Schröder et al., 2017b).
An overview of satellite sensors capable of retrieving quantitative information on atmospheric water vapour and of available water vapour data records based on satellite observations and reanalyses is given. The summary tables on available data records include information on technical specifications such as coverage and resolution in order to enable a first-order decision on utilization by users. Twenty-two data records remain after restricting the temporal coverage to a minimum of 10 years. These data records are described in some more detail on methodology and basic technical specifications and form the basis of the G-VAP data archive. The archive contains profiles of temperature in K (1988–2009) and of specific humidity in g kg−1 (1988–2009), long-term TCWV (1988–2008) and short-term TCWV (2003–2008), both in kg m−2. All data records have been regridded onto a common, regular longitude–latitude grid with 2∘ spatial resolution. The profile data records contain information at four levels: 1000, 700, 500 and 300 hPa. The G-VAP data archive is freely available at https://doi.org/10.5676/EUM_SAF_CM/GVAP/V001 and includes the vast majority of available water vapour data records from satellite and reanalyses with a temporal coverage of at least 10 years. The G-VAP data archive is designed to allow direct intercomparisons using a subset of or the full archive. Except for analysis which requires a high level of stability, the archive can be used in the context of climate analysis, climate model evaluation and the analysis of impacts and dynamics associated with large-scale climate-relevant phenomena such as El Niño.
In order to give an example of the analysis possible with this archive and to showcase differences among the data records, TCWV data records over the period January 2003–December 2008 were intercompared. In this way, all 22 elements of the G-VAP data archive are considered. The intercomparison revealed regions of distinct differences among the data records, namely, central Africa, tropical warm pool, South America, as well as polar and mountain regions. To further refine the analysis, the data records were separated into three classes of predominant condition of retrieval applicability: all-sky, cloudy-sky and clear-sky. The spread of the time series in each class can be large and exceeds the differences between the classes. Also, the separation into the three classes essentially also separates the data records from sensor types. Thus, conclusions on systematic differences between the classes cannot be drawn.
G-VAP will continue to work on the characterization of water vapour data records. In particular, new data records and updated versions of already analysed data records will be implemented in future versions of the G-VAP data archive in order to continue to strive for completeness and describe any changes in quality between the different versions.
This Appendix gives definitions for the abbreviations that are used in this paper.
| AIRS | Atmospheric Infrared Sounder |
| AIRWAVE | Advanced InfraRed Water Vapour Estimator |
| (A)ATSR | (Advanced) Along-Track Scanning Radiometer |
| AVHRR | Advanced Very High Resolution Radiometer |
| AMSR2 | Advanced Microwave Scanning Radiometer 2 |
| AMSR-E | Advanced Microwave Scanning Radiometer for EOS |
| AMSU-A, -B | Advanced Microwave Sounding Unit-A, -B |
| (A)TOVS | (Advanced) TIROS Operational Vertical Sounder |
| ATSR | Along-Track Scanning Radiometer |
| CDR | Climate Data Record |
| CFSR | Climate Forecast System Reanalysis |
| CHAMP | CHAllenging Minisatellite Payload |
| CM SAF | Satellite Application Facility on Climate Monitoring |
| COSMIC | Constellation Observing System for Meteorology, Ionosphere, and Climate |
| CPR | Cloud Profiling Radar |
| CrIS | Cross-track Infrared Sounder |
| DMSP | Defense Meteorological Satellite Program |
| ECMWF | European Centre for Medium-Range Weather Forecasts |
| ECV | Essential Climate Variables |
| EMiR | ERS/Envisat MWR Recalibration and Water Vapour TDR Generation |
| ESA | European Space Agency |
| EUMETSAT | European Organisation for the Exploitation of Meteorological Satellites |
| EPS-SG | EUMETSAT Polar System Second Generation |
| ERA-20C | ECMWF twentieth century reanalysis |
| ERA-Interim | ECMWF Interim Reanalysis |
| EUMETSAT | European Organisation for Exploitation of Meteorological Satellites |
| GCOS | Global Climate Observing System |
| GDAP | GEWEX Data and Assessments Panel |
| GEWEX | Global Energy and Water cycle Exchanges |
| GNSS | Global Navigation Satellite System |
| GOME, GOME-2 | Global Ozone Monitoring Experiment |
| GPS-RO | Global Positioning System Radio Occultation |
| GRAS | Global Navigation Satellite System Receiver for Atmospheric Sounding |
| G-VAP | GEWEX Water Vapor Assessment |
| HIRS | High Resolution Infrared Sounder |
| HOAPS | Hamburg Ocean Atmosphere Parameters and Fluxes from Satellite data |
| HSB | Humidity Sounder for Brazil |
| IASI | Infrared Atmospheric Sounding Interferometer |
| ITCZ | Intertropical Convergence Zone |
| JAXA | Japan Aerospace Exploration Agency |
| JRA-55 | Japanese 55-year Reanalysis |
| MPI-M | Max Planck Institute for Meteorology |
| MERIS | Modern Era Retrospective-Analysis for Research and Applications |
| MERRA, MERRA-2 | Modern-Era Retrospective analysis for Research and Applications (Version 2) |
| Metop | Meteorological Operational Satellite |
| MHS | Microwave Humidity Sounder |
| MODIS | Moderate-resolution Imaging Spectroradiometer |
| MWR | Microwave Radiometer |
| NASA | National Aeronautics and Space Administration |
| NCEP | National Centers for Environmental Prediction |
| (N)IR | (Near) InfraRed |
| NOAA | National Oceanic and Atmospheric Administration |
| NVAP | NASA Water Vapor Project |
| NVAP-M | NVAP – Making Earth Science Data Records for Research Environments |
| OCO-2 | Orbiting Carbon Observatory-2 |
| OLCI | Ocean Land Colour Instrument |
| OMI | Ozone Monitoring Instrument |
| POLDER | POLarization and Directionality of the Earth's Reflectances |
| REMSS | Remote Sensing Systems |
| RMSD | Root Mean Square Difference |
| ROM SAF | Satellite Application Facility on Radio Occultation Meteorology |
| SCIAMACHY | Scanning Imaging Absorption Spectrometer for Atmospheric Chartography |
| SLSTR | Sea and Land Surface Temperature Radiometer |
| SPARC | Stratosphere-troposphere Processes And their Role in Climate |
| SSMIS | Special Sensor Microwave Imager |
| SSM/I | Special Sensor Microwave Imager/Sounder |
| SSM/T-2 | Special Sensor Microwave/Temperature-2 |
| SST | sea surface temperature |
| T | (profiles of) temperature |
| TCWV | Total Column Water Vapour |
| TES | Technology Experiment Satellite |
| TIROS | Television Infrared Observation Satellite |
| TMR | TOPography EXperiment Microwave Radiometer |
| TMI | Tropical Rainfall Measuring Mission's Microwave Imager |
| U | University |
| UCAR | University Corporation for Atmospheric Research |
| UV | ultra violet |
| vis | visible |
| WV | (profiles of) water vapour |
The authors declare that they have no conflict of interest.
The work done by Maarit Lockhoff and Marc Schröder was performed within
the EUMETSAT CM SAF framework. They acknowledge the financial support of the
EUMETSAT member states. Informus GmbH was funded under the ESA's Long-Term
Data Preservation program. Iris Sommerfeld supported the editing process. The
AIRWAVE v1 dataset was developed with the financial support of the ESA's
Long-Term Data Preservation ATSR Long Term Stability Project. ERA-20C was
funded by European Union FP-7 project ERA-CLIM (grant agreement number
265229). MERRA-2 development support is provided by the NASA Modeling,
Analysis and Prediction program.
Edited by: David
Carlson
Reviewed by: two anonymous referees
Andersson, A., Fennig, K., Klepp, C., Bakan, S., Graßl, H., and Schulz, J.: The Hamburg Ocean Atmosphere Parameters and Fluxes from Satellite Data – HOAPS-3, Earth Syst. Sci. Data, 2, 215–234, https://doi.org/10.5194/essd-2-215-2010, 2010.
Bauer, P., Lopez, P., Benedetti, A., Salmond, D., and Moreau, E.: Implementation of 1D+4D-Var assimilation of precipitation-affected microwave radiances at ECMWF. I: 1D-Var, Q. J. Roy. Meteor. Soc., 132, 2277–2306, 2006a.
Bauer, P., Lopez, P., Salmond, D., Benedetti, A., Saarinen, S., and Moreau, E.: Implementation of 1D+4D-Var assimilation of precipitation-affected microwave radiances at ECMWF. II: 4D-Var, Q. J. Roy. Meteor. Soc., 132, 2307–2332, 2006b.
Bennartz, R., Höschen, H., Picard, B., Schröder, M., Stengel, M., Sus, O., Bojkov, B., Casadio, S., Diedrich, H., Eliasson, S., Fell, F., Fischer, J., Hollmann, R., Preusker, R., and Willén, U.: An intercalibrated dataset of total column water vapour and wet tropospheric correction based on MWR on board ERS-1, ERS-2, and Envisat, Atmos. Meas. Tech., 10, 1387–1402, https://doi.org/10.5194/amt-10-1387-2017, 2017.
Borbas, E., Seemann, S. W., Huang, H.-L., Li, J., and Menzel, W. P.: Global profile training database for satellite regression retrievals with estimates of skin temperature and emissivity, Proc. of the Int. ATOVS Study Conference-XIV, Beijing, China, 25–31 May 2005, 763–770 pp., available at: https://cimss.ssec.wisc.edu/itwg/itsc/itsc14/proceedings/B32_Borbas.pdf, 2005.
Bosilovich, M. G., Robertson, F. R., Takacs, L., Molod, A., and Mocko, D.: Atmospheric Water Balance and Variability in the MERRA-2 Reanalysis, J. Climate, 30, 1177–1196, https://doi.org/10.1175/JCLI-D-16-0338.1, 2017.
Bouffies, S., Breon, F. M., Tanre, D., and Dubuisson, P.: Atmospheric water vapor estimate by a differential absorption technique with the polarization and directionality of the Earth reflectances (POLDER) instrument, Geophys. Res. Let., 102, 3831–3841, 1997.
Boukabara, S. A., Garrett, K., Chen, W. C., Iturbide-Sanchez, F., Grassotti, C., Kongoli, C., Chen, R. Y., Liu, Q. H., Yan, B. H., Weng, F. Z., Ferraro, R., Kleespies, T. J., and Meng, H.: MiRS: An All-Weather 1DVAR Satellite Data Assimilation and Retrieval System, IEEE T. Geosci. Remote, 49, 3249–3272, https://doi.org/10.1109/TGRS.2011.2158438, 2011.
Casadio, S., Castelli, E., Papandrea, E., Dinelli, B. M., Pisacane, G., Burini, A., and Bojkov, B. R.: Total column water vapour from along track scanning radiometer series using thermal infrared dual view ocean cloud free measurements: The Advanced Infra-Red WAter Vapour Estimator (AIRWAVE) algorithm, Remote Sens. Environ., 172, 1–14, https://doi.org/10.1016/j.rse.2015.10.037, 2016.
Castelli, E., Casadio, S., Papandrea, E., Dinelli, B. M., Burini, A., and Bojkov, B.: Total Column Water Vapour from Along Track Scanning Radiometer Series: Advanced Infra-Red Water Vapour Estimator (AIRWAVE) algorithm description and applications, S3forScience2015, 2–5 June 2015, Venice, Italy, available at: http://seom.esa.int/S3forScience2015/page_session14.php, 2015.
Chung, E.-S., Soden, B. J., and John, V. O.: Intercalibrating Microwave Satellite Observations for Monitoring Long-Term Variations in Upper- and Midtropospheric Water Vapor, J. Atmos. Ocean. Tech., 30, 2303–2319, https://doi.org/10.1175/JTECH-D-13-00001.1, 2013.
Clayson, C. A., Roberts, J. B., and Bogdanoff, A. S.: The SeaFlux Turbulent Flux dataset version 1.0 documentation, SeaFlux Project, 5 pp., available at: http://seaflux.org/seaflux_data/DOCUMENTATION/SeaFluxDocumentationV12.pdf, 2012.
Courcoux, N. and Schröder, M.: The CM SAF ATOVS data record: overview of methodology and evaluation of total column water and profiles of tropospheric humidity, Earth Syst. Sci. Data, 7, 397–414, https://doi.org/10.5194/essd-7-397-2015, 2015.
Cram, T. A., Compo, G. P., Yin, X., Allan, R. J., McColl, C., Vose, R. S., Whitaker, J. S., Matsui, N., Ashcroft, L., Auchmann, R., Bessemoulin, P., Brandsma, T., Brohan, P., Brunet, M., Comeaux, J., Crouthamel, R., Gleason Jr., B. E., Groisman, P. Y., Hersbach, H., Jones, P. D., Jónsson, T., Jourdain, S., Kelly, G., Knapp, K. R., Kruger, A., Kubota, H., Lentini, G., Lorrey, A., Lott, N., Lubker, S. J., Luterbacher, J., Marshall, G. J., Maugeri, M., Mock, C. J., Mok, H. Y., Nordli, Ø., Rodwell, M., Ross, T. F., Schuster, D., Srnec, L., Valente, M. A., Vizi, Z., Wang, X. L., Westcott, N., Woollen, J. S., and Worley, S. J.: The International Surface Pressure Databank version 2, Geosci. Data J., 2, 31–46, https://doi.org/10.1002/gdj3.25, 2015.
Davis, S. and Rosenlof, K.: NOAA ESRL Stratospheric Water and OzOne Satellite Homogenized (SWOOSH), Version 2, NOAA National Centers for Environmental Information (NCEI), https://doi.org/10.7289/V5TD9VBX, 2016.
Dee, D. P., et al.: The ERA-Interim reanalysis: Configuration and performance of the data assimilation system, Q. J. Roy. Meteor. Soc., 137, 553–597, https://doi.org/10.1002/qj.828, 2011.
Diedrich, H., Preusker, R., Lindstrot, R., and Fischer, J.: Retrieval of daytime total columnar water vapour from MODIS measurements over land surfaces, Atmos. Meas. Tech., 8, 823–836, https://doi.org/10.5194/amt-8-823-2015, 2015.
Du, J., Kimball, J. S., and Jones, L. A.: Satellite microwave retrieval of total precipitable water vapor and surface air temperature over land from AMSR2, IEEE T. Geosci. Remote, 53, 2520–2531, 2015.
Fennig, K., Schröder, M., and Hollmann, R.: Fundamental Climate Data Record of Microwave Imager Radiances, edn. 3, Satellite Application Facility on Climate Monitoring, https://doi.org/10.5676/EUM_SAF_CM/FCDR_MWI/V003, 2017.
Forsythe, J. M., Kidder, S. Q., Fuell, K. K., LeRoy, A., Jedlovec, G. J., and Jones, A. S.: A multisensor, blended, layered water vapor product for weather analysis and forecasting, J. Operational Meteor., 3, 41–58, https://doi.org/10.15191/nwajom.2015.0305, 2015.
Gao, B.-C. and Kaufman, Y. J.: Water vapor retrievals using Moderate Resolution Imaging Spectroradiometer (MODIS) near-infrared channels, J. Geophys. Res.-Atmos., 108, 4389, https://doi.org/10.1117/12.154909, 2003.
Geer, A. J., Bauer, P., and Lopez, P.: Lessons learnt from the operational 1D+4D-Var assimilation of rain- and cloud-affected SSM/I observations at ECMWF, Q. J. Roy. Meteor. Soc., 134, 1513–1525, 2008.
Gelaro, R., McCarty, W., Suárez, M. J., Todling, R., Molod, A., Takacs, L., Randles, C. A., Darmenov, A., Bosilovich, M. G., Reichle, R., Wargan, K., Coy, L., Cullather, R., Draper, C., Akella, S., Buchard, V., Conaty, A., da Silva, A. M., Gu, W., Kim, G., Koster, R., Lucchesi, R., Merkova, D., Nielsen, J. E., Partyka, G., Pawson, S., Putman, W., Rienecker, M., Schubert, S. D., Sienkiewicz, M., and Zhao, B.: The Modern-Era Retrospective Analysis for Research and Applications, Version 2 (MERRA-2), J. Climate, 30, 5419–5454, https://doi.org/10.1175/JCLI-D-16-0758.1, 2017.
Grossi, M., Valks, P., Loyola, D., Aberle, B., Slijkhuis, S., Wagner, T., Beirle, S., and Lang, R.: Total column water vapour measurements from GOME-2 MetOp-A and MetOp-B, Atmos. Meas. Tech., 8, 1111–1133, https://doi.org/10.5194/amt-8-1111-2015, 2015.
Healy, S. B. and Eyre, J. R.: Retrieving temperature, water vapour and surface pressure information from refractive-index profiles derived by radio occultation: A simulation study, Q. J. Roy. Meteor. Soc., 126, 1661–1683. https://doi.org/10.1002/qj.49712656606, 2010.
Held, I. M. and Soden, B. J.: Water vapour feedback and global warming, Annu. Rev. Energ. Env., 25, 441–475, 2000.
Hersbach, H. and Dee, D.: ECMWF Newsletter, 147, p. 7, 2016.
Hersbach, H., Peubey, C., Simmons, A., Berrisford, P., Poli, P., and Dee, D. P.: ERA-20CM: A twentieth century atmospheric model ensemble, Q. J. Roy. Meteor. Soc., 141, 2350–2375, https://doi.org/10.1002/qj.2528, 2015.
Hilburn, K. A. and Wentz, F. J.: Intercalibrated Passive Microwave Rain Products From the Unified Microwave Ocean Retrieval Algorithm (UMORA), J. Appl. Meteor. Clim., 47, 778–794, https://doi.org/10.1175/2007JAMC1635.1, 2008.
ISCCP H-Version C-ATBD: Climate Algorithm Theoretical Basis Document, NOAA Climate Data Record Program (CDRP-ATBD-0.872, Rev 0, available at: https://www1.ncdc.noaa.gov/pub/data/sds/cdr/CDRs/Cloud_Properties-ISCCP/AlgorithmDescription_01B-29.pdf, 2017.
John, V. O., Holl, G., Buehler, S. A., Candy, B., Saunders, R. W., and Parker, D. E.: Understanding intersatellite biases of microwave humidity sounders using global simultaneous nadir overpasses, J. Geophys. Res., 117, D02305, https://doi.org/10.1029/2011JD016349, 2012.
Kahn, B. H., Irion, F. W., Dang, V. T., Manning, E. M., Nasiri, S. L., Naud, C. M., Blaisdell, J. M., Schreier, M. M., Yue, Q., Bowman, K. W., Fetzer, E. J., Hulley, G. C., Liou, K. N., Lubin, D., Ou, S. C., Susskind, J., Takano, Y., Tian, B., and Worden, J. R.: The Atmospheric Infrared Sounder version 6 cloud products, Atmos. Chem. Phys., 14, 399–426, https://doi.org/10.5194/acp-14-399-2014, 2014.
Kämpfer, N. (Ed.): Monitoring Atmospheric Water Vapour: Ground-Based Remote Sensing and In-situ Methods, series: ISSI Scientific Report, edn. 10, Springer New York, 2012.
Kazumori, M.: Description of GCOM-W1 AMSR2 Integrated Water Vapor and Cloud Liquid Water Retrieval Algorithm, Chapter 2 of “Descriptions of GCOM-W1 AMSR2 Level 1R and Level 2 Algorithms”, available at: http://suzaku.eorc.jaxa.jp/GCOM_W/data/doc/NDX-120015A.pdf, 2013.
Kazumori, M., Egawa, T., and Yoshimoto, K.: A retrieval algorithm of atmospheric water vapor and cloud liquid water for AMSR-E, Eur. J. Remote Sens., 45, 63–74. https://doi.org/10.5721/EuJRS20124507, 2012.
Kobayashi, S., Ota, Y., Harada, Y., Ebita, A., Moriya, M., Onoda, H., Onogi, K., Kamahori, H., Kobayashi, C., Endo, H., Miyaoka, K., and Takahashi, K.: The JRA-55 Reanalysis: General Specifications and Basic Characteristics, J. Meteorol. Soc. Jpn., 93, 5–48, https://doi.org/10.2151/jmsj.2015-001, 2015.
Kursinski, E. R. and Gebhardt, T.: A method to deconvolve errors in GPS RO-derived water vapor histograms, J. Atmos. Ocean. Tech., 31, 2606–2628, 2014.
Kursinski, E. R., Hajj, G. A., Schofield, J. T., Linfield, R. P., and Hardy, K. R.: Observing Earth's atmosphere with radio occultation measurements using the Global Positioning System., J. Geophys. Res.-Atmos., 102.D19, 23429–23465, https://doi.org/10.1029/97JD01569, 1997.
Li, J., Wolf, W. W., Menzel, W. P., Zhang, W., Huang, H.-L., and Achtor, T. H.: Global Soundings of the Atmosphere from ATOVS Measurements: The Algorithm and Validation, J. Appl. Meteorol., 39, 1248–1268, 2000.
Lindstrot, R., Preusker, R., Diedrich, H., Doppler, L., Bennartz, R., and Fischer, J.: 1D-Var retrieval of daytime total columnar water vapour from MERIS measurements, Atmos. Meas. Tech., 5, 631–646, https://doi.org/10.5194/amt-5-631-2012, 2012.
Lindstrot, R., Stengel, M., Schröder, M., Fischer, J., Preusker, R., Schneider, N., Steenbergen, T., and Bojkov, B. R.: A global climatology of total columnar water vapour from SSM/I and MERIS, Earth Syst. Sci. Data, 6, 221–233, https://doi.org/10.5194/essd-6-221-2014, 2014.
Mears, C. A., Wang, J., Smith, D., and Wentz, F. J.: Intercomparison of Total Precipitable Water Measurements Made by Satellite-Borne Microwave Radiometers and Ground-Based GPS Instruments, J. Geophys. Res.-Atmos., 120, 2492–2504, https://doi.org/10.1002/2014JD022694, 2015.
Meissner, T. and Wentz, F. J.: The emissivity of the ocean surface between 6–90 GHz over a large range of wind speeds and Earth incidence angles, IEEE T. Geosci. Remote, 50, 3004–3026, 2012.
Nelson, R. R., Crisp, D., Ott, L. E., and O'Dell, C. W.: High-accuracy measurements of total column water vapor from the Orbiting Carbon Observatory-2, Geophys. Res. Lett., 43, 12261–12269, https://doi.org/10.1002/2016GL071200, 2016.
Noël, S., Buchwitz, M., and Burrows, J. P.: First retrieval of global water vapour column amounts from SCIAMACHY measurements, Atmos. Chem. Phys., 4, 111–125, https://doi.org/10.5194/acp-4-111-2004, 2004.
Papandrea, E., Casadio, S., De Grandis, E., Castelli, E., Dinelli, B. M., and Bojkov, B.: Validation of the Advanced Infra-Red Water Vapour Estimator (AIRWAVE) total column water vapour using satellite and radiosonde products, Ann. Geophys., 61, Fast Track 1–8, https://doi.org/10.4401/ag-7524, 2018.
Platnick, S., Hubanks, P., Meyer, K., and King, M. D.: MODIS Atmosphere L3 Monthly Product (08_L3), NASA MODIS Adaptive Processing System, Goddard Space Flight Center, https://doi.org/10.5067/MODIS/MOD08_M3.006 (Terra), https://doi.org/10.5067/MODIS/MYD08_M3.006 (Aqua), 2015.
Poli, P., Hersbach, H., Dee, D., Berrisford, P., Simmons, A., Vitart, F., Laloyaux, P., Tan, D., Peubey, C., Thépaut, J.-N., Trémolet, Y., Holm, E., Bonavita, M., Isaksen, L., and Fisher, M.: ERA-20C: An Atmospheric Reanalysis of the Twentieth Century, J. Climate, 29, 4083–4097, https://doi.org/10.1175/JCLI-D-15-0556.1, 2016.
Reichle, R., Liu, Q., Koster, R., Draper, C., Mahanama, S., and Partyka, G.: Land Surface Precipitation in MERRA-2, J. Climate, https://doi.org/10.1175/JCLI-D-16-0570.1, 2017.
Rienecker, M. M., Suarez, M. J., Gelaro, R., Todling, R., Bacmeister, J., Liu, E., Bosilovich, M. G., Schubert, S. D., Takacs, L., Kim, G.-K., Bloom, S., Chen, J., Collins, D., Conaty, A., da Silva, A., Gu, W., Joiner, J., Koster, R. D., Lucchesi, R., Molod, A., Owens, T., Pawson, S., Pegion, P., Redder, C. R., Reichle, R., Robertson, F. R., Ruddick, A. G., Sienkiewicz, M., and Woollen, J.: MERRA: NASA's Modern-Era Retrospective Analysis for Research and Applications, J. Climate, 24, 3624–3648, https://doi.org/10.1175/JCLI-D-11-00015.1, 2011.
Saha, S., Moorthi, S., Pan, H. L., Wu, X., Wang, J., Nadiga, S., Tripp, P., Kistler, R., Woollen, J., Behringer, D., Liu, H., Stokes, D., Grumbine, R., Gayno, G., Wang, J., Hou, Y. T., Chuang, H.Y., Juang, H. M. H., Sela, J., Iredell, M., Treadon, R., Kleist, D., Van Delst, P., Keyser, D., Derber, J., Ek, M., Meng, J., Wei, H., Yang, R., Lord, S., Van Den Dool, H., Kumar, A., Wang, W., Long, C., Chelliah, M., Xue, Y., Huang, B., Schemm, J. K., Ebisuzaki, W., Lin, R., Xie, P., Chen, M., Zhou, S., Higgins, W., Zou, C. Z., Liu, Q., Chen, Y., Han, Y., Cucurull, L., Reynolds, R. W., Rutledge, G., and Goldberg, M.: The NCEP Climate Forecast System Reanalysis, B. Am. Meteorol. Soc., 91, 1015–1057, https://doi.org/10.1175/2010BAMS3001.1, 2010.
Sapiano, M. R. P., Berg, W. K., McKague, D. S., and Kummerow, C. D.: Towards an intercalibrated fundamental climate data record of the SSM/I sensors, IEEE T. Geosci. Remote, 51, 1492–1503, 2013.
Schlüssel, P. and Emery, W. J.: Atmospheric water vapour over oceans from SSM/I measurements, Int. J. Remote Sens., 11, 753–766, 1990.
Schröder, M., Jonas, M., Lindau, R., Schulz, J., and Fennig, K.: The CM SAF SSM/I-based total column water vapour climate data record: methods and evaluation against re-analyses and satellite, Atmos. Meas. Tech., 6, 765–775, https://doi.org/10.5194/amt-6-765-2013, 2013.
Schröder, M., Lockhoff, M., Forsythe, J., Cronk, H., Vonder Haar, T. H., and Bennartz, R.: The GEWEX water vapor assessment (G-VAP) – results from the trend and homogeneity analysis, J. Appl. Meteorol. Clim., 55, 1633–1649, https://doi.org/10.1175/JAMC-D-15-0304.1, 2016.
Schröder, M., Lockhoff, M., Shi, L., August, T., Bennartz, R., Borbas, E., Brogniez, H., Calbet, X., Crewell, S., Eikenberg, S., Fell, F., Forsythe, J., Gambacorta, A., Graw, K., Ho, S.-P., Höschen, H., Kinzel, J., Kursinski, E. R., Reale, A., Roman, J., Scott, N., Steinke, S., Sun, B., Trent, T., Walther, A., Willen, U., and Yang, Q.: GEWEX water vapor assessment (G-VAP), WCRP Report 16/2017, World Climate Research Programme (WCRP): Geneva, Switzerland, 216 pp., available at: https://www.wcrp-climate.org/resources/wcrp-publications, 2017a.
Schröder, M., Lockhoff, M., Fell, F., Forsythe, J., Trent, T., Bennartz, R., Borbas, E., Bosilovich, M. G., Castelli, E., Hersbach, H., Kachi, M., Kobayashi, S., Loyola, D., Mears, C., Preusker, R., Rossow, W. B., and Saha, S.: The GEWEX Water Vapor Assessment archive of water vapour products from satellite observations and reanalyses, https://doi.org/10.5676/EUM_SAF_CM/GVAP/V001, 2017b.
Schröder, M., Lockhoff, M., Shi, L., August, T., Bennartz, R., Calbet, X., Fell, F., Forsythe, J., Gambacorta, A., Ho, S.-P., Kursinski, E. R., Reale, A., Trent, T., and Yang, Q.: The GEWEX water vapor assessment of global water vapour and temperature data records from satellites and reanalyses, BAMS, in prep., 2018.
Scott, N. A., Chedin, A., Armante, R., Francis, J., Stubenrauch, C., Chaboureau, J.-P., Chevallier, F., Claud, C., and Cheruy, F.: Characteristics of the TOVS Pathfinder Path-B dataset, B. Am. Meteorol. Soc., 80, 2679–2701, https://doi.org/10.1175/1520-0477(1999)080<2679:COTTPP>2.0.CO;2, 1999.
Seemann, S. W., Li, J., Menzel, W. P., and Gumley, L. E.: Operational retrieval of atmospheric temperature, moisture, and ozone from MODIS infrared radiances, J. Appl. Meteorol., 42, 1072–1091, https://doi.org/10.1175/1520-0450(2003)042<1072:OROATM>2.0.CO;2, 2003.
Seemann, S. W., Borbas, E. E., Knuteson, R. O., Stephenson, G. R., and Huang, H.-L.: Development of a global infrared emissivity database for application to clear-sky sounding retrievals from multi-spectral satellite radiances measurements, J. Appl. Meteorol. Clim., 47, 108–123, https://doi.org/10.1175/2007JAMC1590.1, 2008.
Shi, L. and Bates, J. J.: Three decades of intersatellite-calibrated High-Resolution Infrared Radiation Sounder upper tropospheric water vapor, J. Geophys. Res., 116, D04108, https://doi.org/10.1029/2010JD014847, 2011.
Shi, L., Matthews, J., Ho, S.-P., Yang, Q., and Bates, J.: Algorithm Development of Temperature and Humidity Profile Retrievals for Long-Term HIRS Observations, Remote Sens.-Basel, 8, 280, https://doi.org/10.3390/rs8040280, 2016.
Smith, A., Lott, N., and Vose, R.: The Integrated Surface Database: Recent developments and partnerships, B. Am. Meteorol. Soc., 92, 704–708, https://doi.org/10.1175/2011BAMS3015.1, 2011.
Sohn, B. J. and Bennartz, R.: Contribution of water vapor to observational estimates of longwave cloud radiative forcing, J. Geophys. Res., 113, D20107, https://doi.org/10.1029/2008JD010053, 2008.
Stubenrauch, C. J., Rossow, W. B., Kinne, S., Ackerman, S., Cesana, G., Chepfer, H., Di Girolamo, L., Getzewich, B., Guignard, A., Heidinger, A., Maddux, B., Menzel, P., Minnis, P., Pearl, C., Platnick, S., Poulsen, C., Riedi, J., Sun-Mack, S., Walther, A., Winker, D., Zeng, S., and Zhao, G.: Assessment of global cloud datasets from satellites: Project and Database initiated by the GEWEX Radiation Panel, B. Am. Meteorol. Soc., 94, 1031–1049, https://doi.org/10.1175/BAMS-D-12-00117.1, 2012.
Susskind, J., Piraino, P., Rokke, L., Iredell, L., and Mehta, A.: Characteristics of the TOVS Pathfinder Path A dataset, B. Am. Meteorol. Soc., 78, 1449–1472, 1997.
Takacs, L. L., Suarez, M., and Todling, R.: Maintaining atmospheric mass and water balance in reanalyses, Q. J. Roy. Meteor. Soc., 142, 1565–1573, https://doi.org/10.1002/qj.2763, 2016.
Takeuchi, Y.: Algorithm theoretical basis document (ATBD) of the algorithm to derive total water vapor content from ADEOS-II/AMSR. EORC Bulletin/Technical Report, Special Issue on AMSR Retrieval Algorithms, available at: http://sharaku.eorc.jaxa.jp/AMSR/products/pdf/alg_des.pdf, 2002.
Takeuchi, Y., Tauchi, T., Saito, S., Imaoka, K., Kachi, M., and Shibata, A.: A total column precipitable water algorithm for ADEOS-II/AMSR and Aqua/AMSR-E, Ital. J. Remote Sens., 30–31, 143–157, 2004.
Taylor, K., Stouffer, R., and Meehl, G.: An overview of CMIP5 and the experiment design, B. Am. Meteorol. Soc., 93, 485–498, https://doi.org/10.1175/BAMS-D-11-00094.1, 2012.
Trenberth, K. E., Jones, P. D., Ambenje, P., Bojariu, R., Easterling, D., Klein Tank, A., Parker, D., Rahimzadeh, F., Renwick, J. A., Rusticucci, M., Soden, B., and Zhai, P.: Observations: Surface and Atmospheric Climate Change, in: Climate Change 2007: The Physical Science Basis. Contribution of Working Group I to the Fourth Assessment Report of the Intergovernmental Panel on Climate Change, edited by: Solomon, S., Qin, D., Manning, M., Chen, Z., Marquis, M., Averyt, K. B., Tignor, M., and Miller, H. L., Cambridge University Press, Cambridge, UK and New York, NY, USA, 2007.
Vonder Haar, T. H., Bytheway, J. L., and Forsythe, J. M.: Weather and climate analyses using improved global water vapor observations, Geophys. Res. Lett., 39, L15802, https://doi.org/10.1029/2012GL052094, 2012.
Wagner, T., Heland, J., Zöger, M., and Platt, U.: A fast H2O total column density product from GOME – Validation with in-situ aircraft measurements, Atmos. Chem. Phys., 3, 651–663, https://doi.org/10.5194/acp-3-651-2003, 2003.
Wang, H., Gonzalez Abad, G., Liu, X., and Chance, K.: Validation and update of OMI Total Column Water Vapor product, Atmos. Chem. Phys., 16, 11379–11393, https://doi.org/10.5194/acp-16-11379-2016, 2016.
Wee, T.-K. and Kuo, Y.-H.: A perspective on the fundamental quality of GPS radio occultation data, Atmos. Meas. Tech., 8, 4281–4294, https://doi.org/10.5194/amt-8-4281-2015, 2015.
Wentz, F. J.: A well-calibrated ocean algorithm for SSM/I, J. Geophys. Res., 102, 8703–8718, https://doi.org/10.1029/96JC01751, 1997.
Wentz, F. J.: A 17-yr climate record of environmental parameters derived from the Tropical Rainfall Measuring Mission (TRMM) Microwave Imager, J. Climate, 28, 6882–6902, https://doi.org/10.1175/JCLI-D-15-0155.1, 2015.
Wentz, F. J. and Meissner, T.: Atmospheric absorption model for dry air and water vapor at microwave frequencies below 100 GHz derived from spaceborne radiometer observations, Radio Sci., 51, 381–391, https://doi.org/10.1002/2015RS005858, 2017.
Woodruff, S. D., Worley, S. J., Lubker, S. J., Ji, Z., Freeman, J. E., Berry, D. I., Brohan, P., Kent, E. C., Reynolds, R. W., Smith, S. R., and Wilkinson, C.: ICOADS release 2.5: Extensions and enhancements to the surface marine meteorological archive, Int. J. Climatol., 31, 951–967, https://doi.org/10.1002/joc.2103, 2011.
Worden, J., Bowman, K., Noone, D., Beer, R., Clough, S., Eldering, A., Fisher, B., Goldman, A., Gunson, M., Herman, R., Kulawik, S. S., Lampel, M., Luo, M., Osterman, G., Rinsland, C., Rodgers, C., Sander, S., Shephard, M., and Worden, H.: Tropospheric emission spectrometer observations of the tropospheric HDO ∕ H2O ratio: Estimation approach and characterization, J. Geophys. Res., 111, D16309, https://doi.org/10.1029/2005JD006606, 2006.
Wulfmeyer, V., Hardesty, R. M., Turner, D. D., Behrendt, A., Cadeddu, M. P., Di Girolamo, P., Schlüssel, P., Van Baelen, J., and Zus, F.: A review of the remote sending of lower tropospheric thermodynamic profiles and its indispensable role for the understanding and the simulation of water and energy cycles, Rev. Geophys., 53, 819–895, https://doi.org/10.1002/2014RG000476, 2015.
Xie, F., Syndergaard, S., Kursinski, E. R., and Herman, B. M.: An approach for retrieving marine boundary layer refractivity from GPS occultation data in the presence of superrefraction, J. Atmos. Ocean. Tech., 23, 1629–1644, 2006.