the Creative Commons Attribution 4.0 License.
the Creative Commons Attribution 4.0 License.
 | 18 Nov 2026
MacroTraits: a global trait data and information system for marine benthic ecology
Olivier Beauchard

Karline Soetaert
For a long time, biological trait data have been a bottleneck in biodiversity research. Constraints of data unavailability and challenging analytical implementation are still obstacles to the investigation of functional biodiversity patterns. This is especially true in marine zoobenthic ecology where the use of biological traits became common much later than in terrestrial and freshwater ecology. Additionally, most of trait-based marine studies have dominantly been conducted in European waters while large gaps remain in other areas of the world. Therefore, this paper offers a framework to fill this gap by providing the most comprehensive zoobenthic trait data compilation at the global scale. Based on more than 8000 references, 1893 species of marine macro- and megazoobenthos are fully documented for life history, dwelling mode, ecosystem function, habitat and biogeography through 41 traits. Next to this compilation, the paper brings clarifications on research directions by means of these data within the dominant paradigms of modern ecology. In particular, the dichotomous expression that contrasts response and effect traits (i.e. fitness components versus ecosystem function) is emphasised. The database is accessible through an R package in the repository https://doi.org/10.5281/zenodo.24318255 (Beauchard and Soetaert, 2026b) and that facilitates data treatment such as trait selection, cross table construction and label handling.
- Article
(7076 KB) - Full-text XML
-
Supplement
(1644 KB) - BibTeX
- EndNote


The advent of the biodiversity concept has triggered tremendous endeavours to study variations in species richness and taxonomic dissimilarities in the world's biota (Gaston and Spicer, 2004). In the quest to explain numbers of species, species coexistence or exclusion, organism biology has played a central role through the use of biological traits, leading to the “biodiversity revolution” (Cernansky, 2017). This paradigmatic development blossomed from species community ecology, a discipline considered as “the locus of exciting advances” (Simberloff, 2004). Indeed, the use of species traits has given rise to functional species community ecology, nowadays the spearhead of biodiversity research. Functional species community ecology bridges spatio-temporal distributions of species and traits, and ultimately enables the functional characterisation of species communities through synthetic indices (“functional diversity indices”; Mouillot et al., 2013; Ricotta et al., 2023). This field, highly in vogue, is strongly appealing since it can bring mechanistic understanding of complex species assemblages, but, unfortunately, trait data availability and implementation remain obstacles to research advances.
Most of time, a biological trait is simply defined as any feature measurable in an organism (Violle et al., 2007; de Bello et al., 2021a). The phrasing “functional trait”, coined in the early time of functional ecology (Calow, 1987), has been a puzzling concept in the literature (Violle et al., 2007). de Bello et al. (2021a) concisely summarised its historical relevance when trait expression impacts species fitness, what is, altogether, the ultimate goal of a biologist in search for evolutionary causes and effects in living forms. Whether a trait could be considered “functional” or not is subject to debate (Mlambo, 2014; Dawson et al., 2021; Susini et al., 2025). The phrase “functional trait” can be tautological (Dawson et al., 2021), but, more appropriately, a trait can be considered significantly functional when it contributes to a studied pattern (Susini et al., 2025). Depending on the addressed research objectives, different types of traits can be distinguished. A direct impact on fitness is not a necessary condition to define a trait as other measurements, less or not impacting the fitness of the organism on which the trait is measured, can be needed for functional diversity analysis (see Sect. 2). In marine benthic ecology, the growing interest in functional community structure has led to a boosted release of trait databases in the recent years (Faulwetter et al., 2014; Chapman et al., 2019; Degen and Faulwetter, 2019; Clare et al., 2022; Beauchard et al., 2023b; Lam-Gordillo et al., 2023), but still persists a lack of consensus on trait reporting (de Juan et al., 2022) and gaps in data availability in many parts of the world (Tyler et al., 2012; Costello et al., 2015).
In this paper, we present an extensive trait data compilation of the marine macrozoobenthos led over more than one decade (2013–2026). The work started with a local focus on the European northwestern shelf as part of different projects, and was progressively extended to other parts of the world once trait functionalities became discernible as regards needs for ongoing research and data availability became more and more appreciable. A trait classification is firstly introduced in accordance with research directions in order to ensure a relevant scientific use of the data. Then, a terminology of the documented traits provides definitions and accounts of research relevance in uni- or multivariate contexts. Finally, after a description of the trait data structure and quantification, an overview shows the data availability over space and time.
Following a concise definition of a trait (see Sect. 1), a myriad of traits can be generated as far as measurements enable it, but not always with scientific pertinence. Sound scientific research is primarily induced by questions rather than data availability. In modern ecology, the use of biological traits aims to test specific hypotheses related to ongoing paradigms (Lavorel and Garnier, 2002; Oliver et al., 2015; de Bello et al., 2021a). Some dominant paradigms that currently drive functional biodiversity studies require the use of specific types of traits as described in Fig. 1.
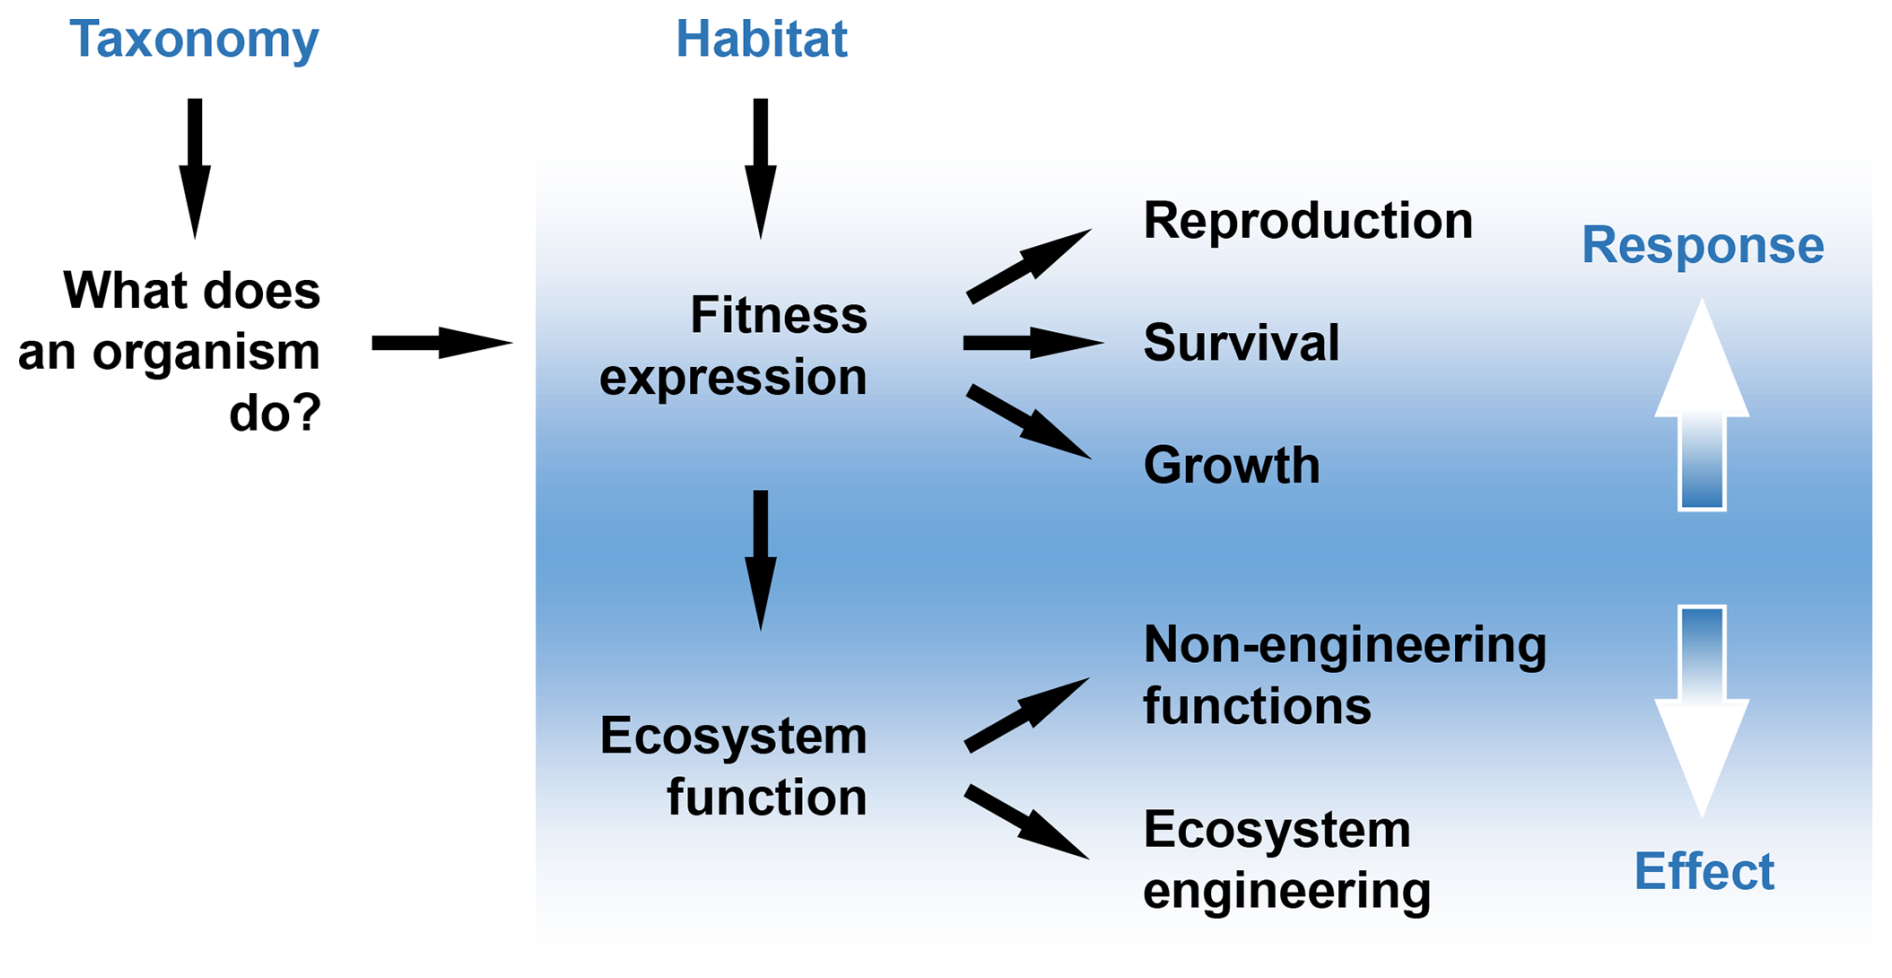
Figure 1Organigram rationalizing the conception of biological traits as measurements on the biota. A taxon (population of individual organisms sharing similar taxonomic trait modalities), under habitat forces (habitat traits), exhibit average specific performances in the three fitness components (response traits), of which the expressions can lead to more or less substantial effects on the ecosystem (effect traits). The vertical colour gradient underlines the possible dual nature of a trait between response and effect. The use of a biological trait is necessarily paradigmatic: its relevance must be based on its ability to express either response or effect (white), and less a mix of both (blue) at the risk of losing functional meaning; see Sect. 3.1 and Table 1.
-
Assembly rules: the assembly of species communities depends on four processes (Vellend, 2010): dispersal, selection, drift and speciation. Every organism undergoes effects of environmental forces, both abiotic (e.g. temperature, hydrology) and biotic (e.g. predation, competition) that constrain their distributions within specific environmental boundaries (niche). These forces directly act on the three components of organisms' fitness (growth, survival and reproduction; Darwin, 1859; Walsh, 1996), so a habitat of specific environmental features only retains species endowed with adapted trait performances (natural selection). Hence, in response to environmental forces, fitness-related traits represent a first type of traits, called “response traits” (Díaz and Cabido, 2001). On the short evolutionary term, response traits lie at the heart of dispersal and selection, the latter also called “environmental filtering” when specifically dealing with abiotic forces (Keddy, 1992b; Resh et al., 1994; Townsend and Hildrew, 1994), and constitute the fundamental basis to explore species assembly. Within the framework of assembly rules, an ultimate goal consists in identifying life-history strategies as evolutionary convergences of traits adapted to specific habitats (e.g. r-, K- and A-strategies as part of the Habitat Templet Concept, or POSE concept; Southwood, 1988; Kindsvater et al., 2016). Also, the inherent specificity of response traits to environmental variability makes them primarily relevant in the development of ecological indicators of species vulnerability to disturbance as human-mediated pressures are also environmental forces that can mimic natural ones, especially in the marine benthos (Beauchard et al., 2017). Multivariate exploration of the relationships between life-history strategies and environmental forces has been mostly investigated in freshwater and terrestrial ecology. Since Bremner et al. (2003) that marked the advent of biological trait analysis in marine benthic ecology, only a handful of studies specifically addressed the evolutionary concepts of selection and life strategy (Sutton et al., 2021; Beauchard et al., 2022; Gusha and McQuaid, 2025; Mendes et al., 2025; Bergagna et al., 2026). As recently stressed, the concept of life strategy has been insufficiently addressed (Stott et al., 2024), and a more flexible conception should be considered beyond the too simplistic r–K continuum.
-
Ecosystem function: through fitness expression, organisms alter the abiotic and biotic components of their environment through “effect traits” (Lavorel and Garnier, 2002). A typical example is a predator controlling the population of a prey and maintaining an equilibrium in the ecosystem, thus contributing to ecosystem functions such as fluxes of energy and materials. In this way, an effect trait participates to processes taking place beyond the life cycle of the organism expressing this trait (e.g. dead shell as a microhabitat). At least two types of ecosystem functions can be distinguished: (1) biomass production and dispersal, and consequent biotic interactions (mutualism, antagonism, commensalism and amensalism) and (2) ecosystem engineering whereby engineering species indirectly alter the fitness of co-occurring species by modifications of the abiotic component of the environment (Jones et al., 1994). The latter is particularly prominent in the marine benthos in both hard and soft bottoms where species communities ensure an extraordinarily high diversity of functions beneficial to the entire ecosystem (e.g. pelagic-benthic coupling, bioturbation, habitat creation; Snelgrove, 1999; Thrush and Dayton, 2002). For that reason, effect traits also indicate where conservation efforts should be prioritised, especially when species ensure important services in the ecosystem (Miatta et al., 2021).
-
Ecophylogenetics: this vast research field, investigating species community assembly based on taxonomic information, has gained growing interest the last 15 years (Cavender-Bares et al., 2009; Mouquet et al., 2012; Cadotte et al., 2019). In this framework, the nested taxonomic levels of a phylogenetic tree can be considered as traits whereby a distance between two taxonomic profiles can express a certain evolutionary difference between two taxa (Pavoine and Ricotta, 2013). By this way, such a distance can be related to the distance induced by non-taxonomic traits; while the two previous research directions imply specifically response or effect traits, ecophylogenetics can proceed with any type of trait. Part of ecophylogenetic applications involve species traits for several purposes such as speciation, species co-evolution, disentangling ecological from evolutionary processes or identifying labile traits.
-
Habitat traits: they represent another type of species descriptors that may not necessarily be specific of research directions. Rather, their use takes place in particular contexts when technical challenges limit research to pure data exploration and theoretical predictions (Statzner et al., 1997; Usseglio-Polatera et al., 2000; Willby et al., 2000; Pavoine et al., 2004). Habitat traits can be useful to mimic unrealistic in-situ contexts such as pristine state or combining different faunal components requiring different sampling designs (e.g. macro- versus megabenthos). Their combinations can produce theoretical versions of real habitats to explore potential response or effect trait distributions (Statzner et al., 1997; Beauchard et al., 2023b). In more applied contexts, especially at the biogeographic scale, habitat traits can be relevant response traits when environmental drivers of community composition are well recognised to induced specific adaptations to physiological stress (e.g. salinity, intertidal elevation; Gusha and McQuaid, 2025).
3.1 Trait relevance in functional biodiversity studies
The use of multiple biological traits in functional biodiversity studies is necessarily paradigmatic since fitness or ecosystem function must be characterised by specific traits (Fig. 1). However, the possible dual nature of traits, in expressing both (Lavorel and Garnier, 2002), may appear disconcerting in this respect, especially in the marine benthos where this duality can be prominent. For instance, the ability of burrowing into sediments can express both response (survival, escaping to epibenthic or demersal predators) and effect (sediment mixing and irrigation as biogeochemical functions). In fact, this duality is variable as exemplified in the concept of fitness: the ultimate goal of an organism in its life time is to achieve reproductive success, not ecosystem function. Translated by traits, the reproductive component of fitness affects only an individual organism and its progeny, over time (age at maturity, reproductive frequency and reproductive life span), through specific modes (fertilisation and offspring release) and environmentally neutral numbers (e.g. fecundity as a pure response trait that only discriminates life strategies). Hence, ecosystem functions are poorly expressed in most reproductive traits that are largely independent on species biomass and dwelling modes in the marine benthos (McHugh and Rouse, 1998). On the contrary, growth and survival, acting in concert to ensure reproductive success, are more at the basis of ecosystem function as a side effect of fitness expression, and can strongly exhibit a dual nature. In the marine benthos, several traits related to growth and survival (body size and dwelling mode) can express ecosystem function, especially ecosystem engineering through bioturbation (sediment mixing and irrigation; Kristensen et al., 2012) and habitat creation (Thrush and Dayton, 2002). While a mix of both specific response and effect traits in a same analysis can be functionally meaningless (Beauchard, 2023), the use of unspecific traits (i.e. dual nature) may make sense, but may also be at the expense of functional precision. Conclusively, when investigating habitat occupancy, reproductive traits represent the key of response traits as they provide a direct mechanism of long-term population persistence in specific environments (Stearns, 1992). Other traits, more related to growth and survival, can provide an important complement to explore short-term or local persistence, and are indispensable to study ecosystem function, including some of them that can be considered fully independent from fitness (e.g. bioturbation; see Sect. 3.2.36 and 3.2.37).
3.2 Trait terminology and affinities for trait types
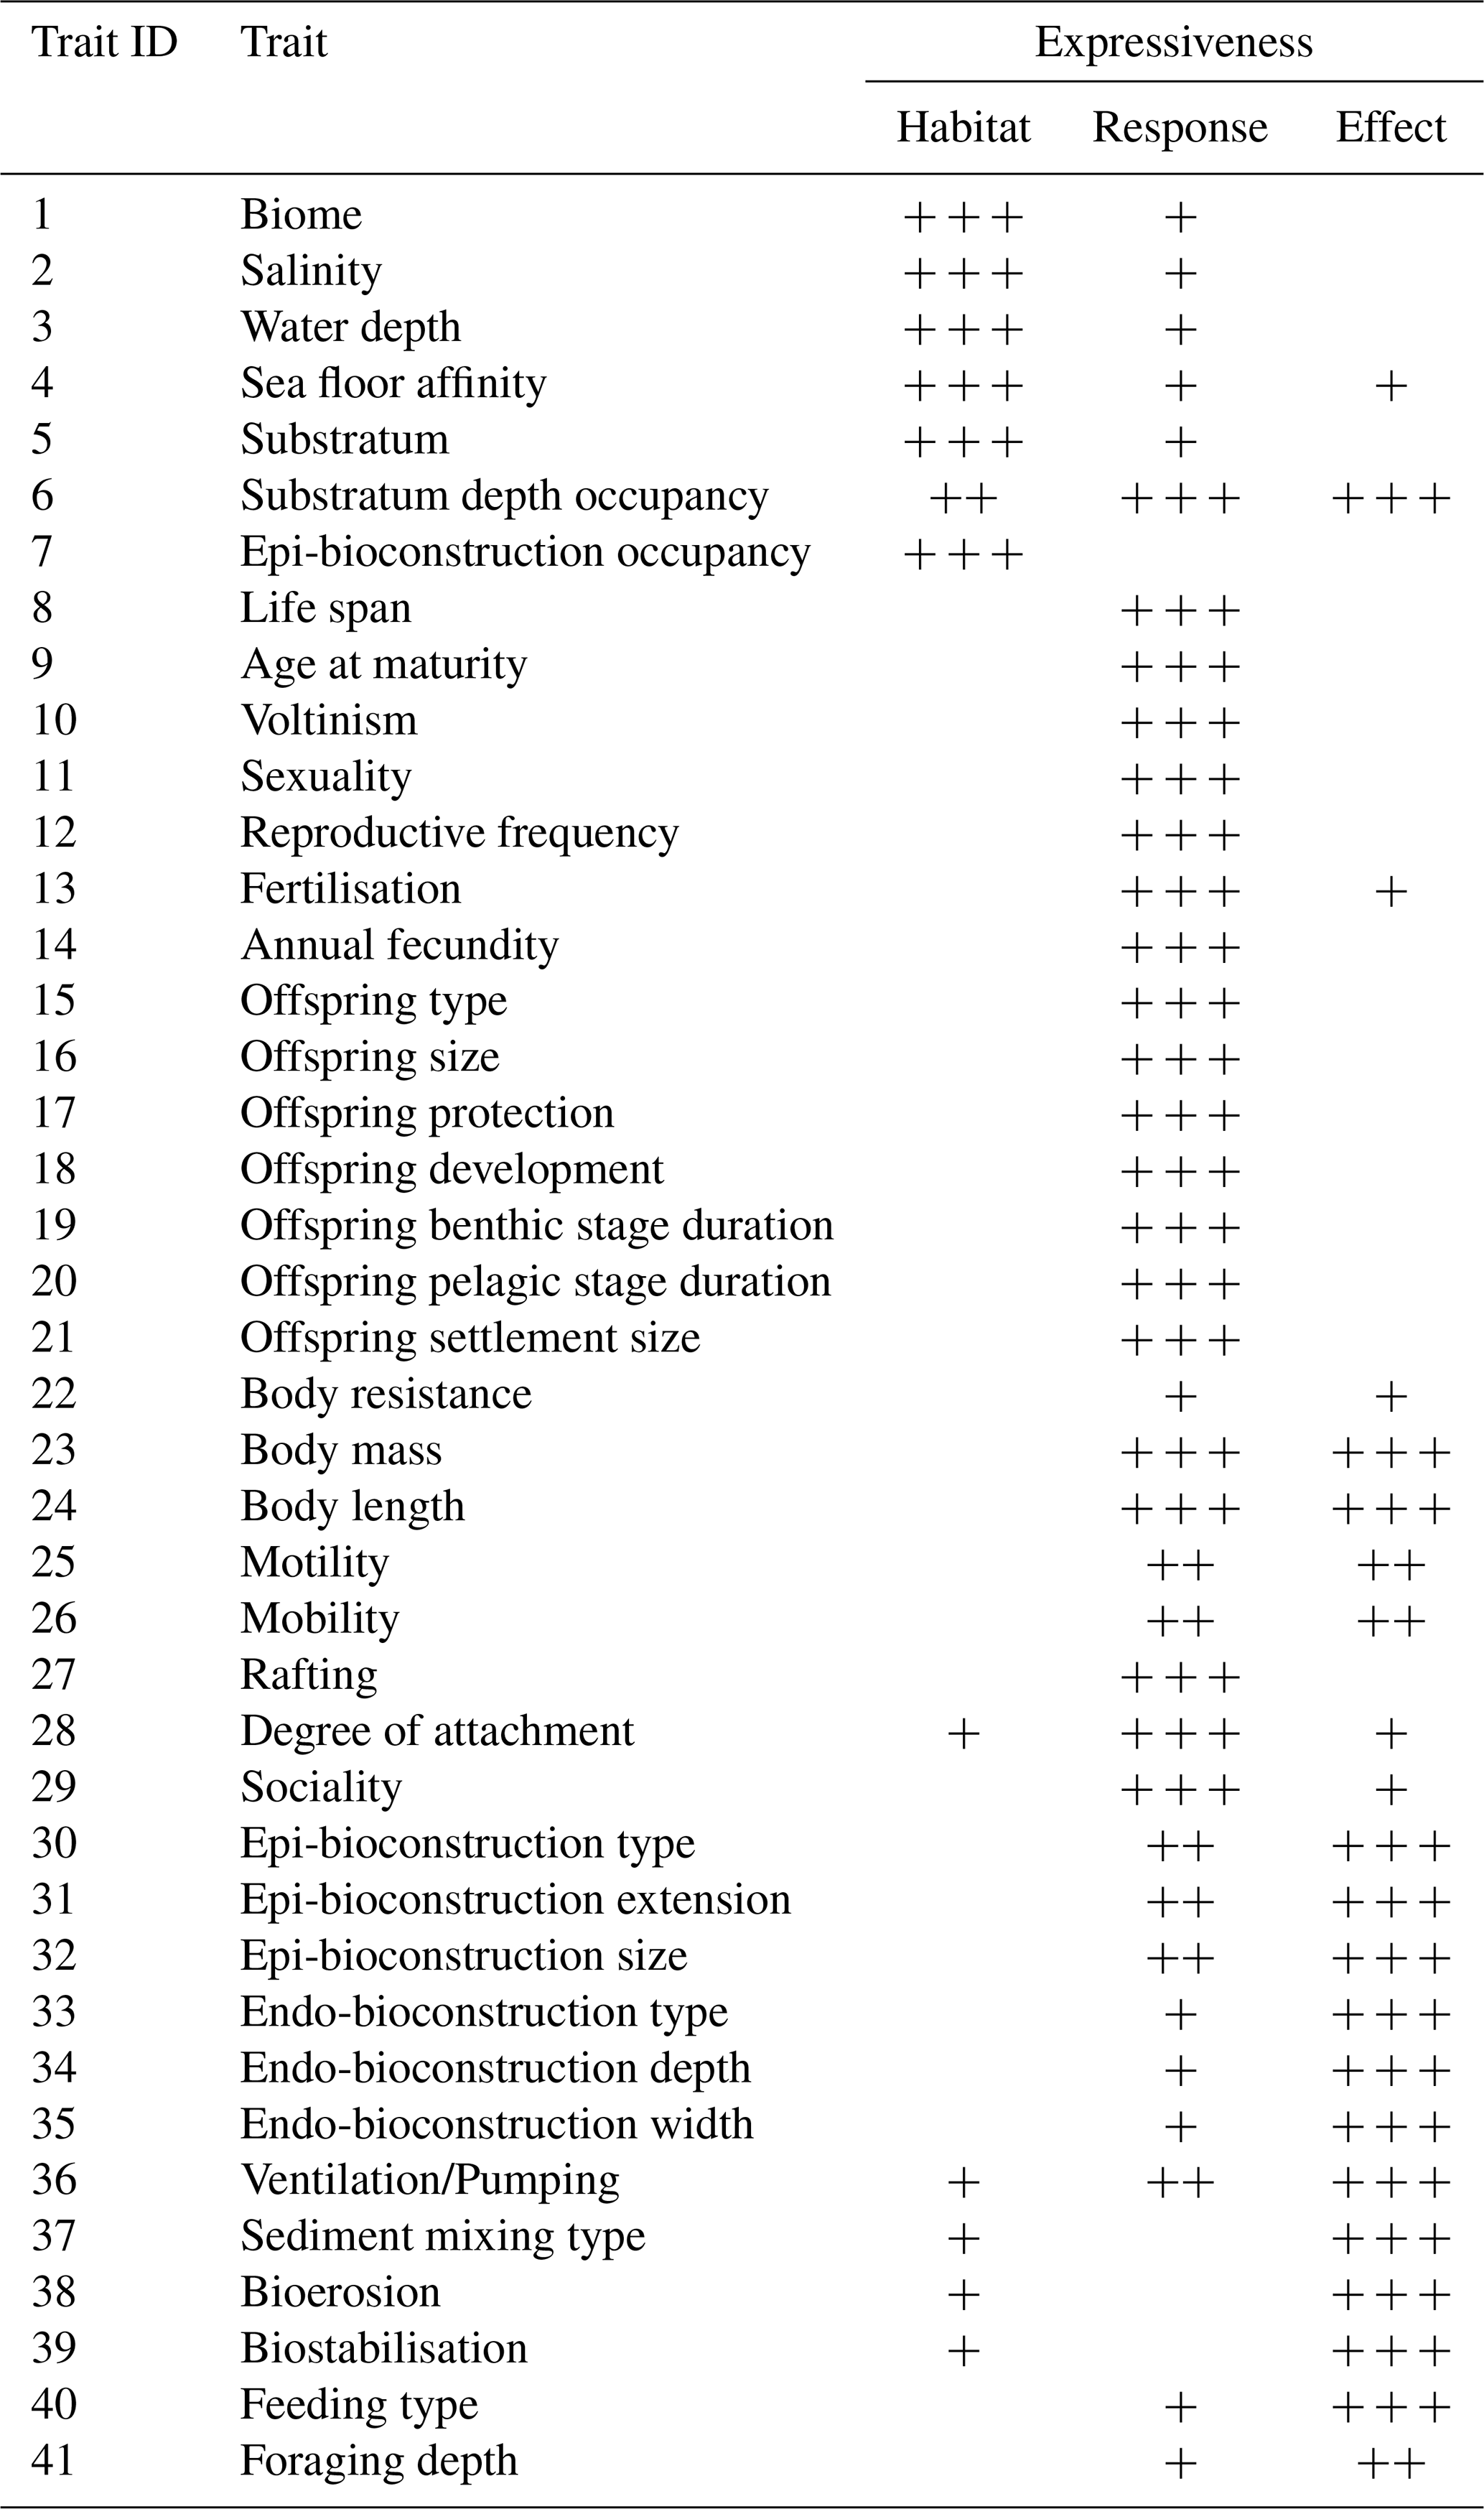
The MacroTraits database includes 7 habitat traits and 34 other traits (Table 1). All traits were selected when direct implication in fitness expression or ecosystem function was well-established in the literature of marine biology as reported below, and when they could be documented for all species. A trait can take different states (modalities) for which a species can differently perform; see Sect. 4 for technical details. So, in this section, the terminology includes a description of each trait and its modalities, including labels. For each trait, arguments were provided regarding its affinities for response and effect, and summarised in Table 1.
Table 1List of the documented traits in the MacroTraits database and their expressiveness from no affinity (empty cell) to low (+) and high affinity (); see text (Sect. 3.2.1 to 3.2.41) and Fig. 7 for degree of specificity. The table provides a summary of trait theoretical relevance to research questions; for instance, degree of attachment is highly specific to response (; e.g. surviving to shear stress in exposed shore habitats) but poorly expressive of effect (+; e.g. can be an advantage in space occupation, without more information). Substratum depth occupancy is an exception as this trait also expresses both response (e.g. burrowing as survival to predation) and effect (e.g. bioturbation). Trait ID: identifier in the database.
3.2.1 Biome
Spalding et al. (2007) defined contours of biogeographic provinces and ecoregions within polar, temperate and tropical realms. These divisions can provide a native thermal niche when the geographic range of a species is known. In general, information on species geographic range was not accurate enough for a delineation at the ecoregion level, so occurrences were inventoried per realm at the province level, resulting in three realm modalities. However, this classification is limited to shelves (<200 m deep) while species distributions can extend deeper, with species being exclusively found on slopes or abyssal plains. Also apart, hydrothermal vents and cold seeps (HVCS), found systematically below shelves, consist in separate systems in terms of temperature and salinity. Therefore, the modalities “Deep” and “HVCS” were added.
Modalities
-
Polar
-
Temperate
-
Tropical
-
Deep
-
HVCS
3.2.2 Salinity
Salinity is the most prominent feature that makes marine habitats distinct from other aquatic environments (Remane, 1934). Similar to freshwater organisms, marine organisms have to cope with osmotic gradients, but in an opposite way: from the external environment (salt water, high ionic concentration) to the internal environment (body, lower ionic concentration) (Podbielski et al., 2022). However, marine organisms can face another physiological constraint in coastal environments where salinity can vary due to freshwater inputs, especially in estuaries (Little et al., 2017). Hence, tolerance to salinity variation (euryhalinity, opposed to stenohalinity) can be a stronger marker of habitat preference than average salinity (Lim et al., 2025). Some migratory species transit seasonally to freshwaters for reproduction (catadromous species) or foraging (amphidromous), which requires a physiological switch (Anger, 2003). Under its presently coded form, salinity slightly expresses response from a stenohaline to a euryhaline profile (affinity from only one to several modalities).
Modalities (in psu)
-
Oligohaline. <5, considered freshwater.
-
Mesohaline. 5–18, estuarine habitats and landlocked seas.
-
Polyhaline. 18–30, estuarine habitats, river mouths and landlocked seas.
-
Euhaline. 30–40, typically marine.
-
Hyperhaline. >40, coastal lagoons, hydrothermal vent and cold seep brines.
3.2.3 Water depth
Water depth is a simple vertical delineation of space, but following prominent zones associated to important environmental determinants of benthic life (Etter and Mullineaux, 2001). Water depth can be strongly correlated to light availability and benthic primary productivity, salinity, temperature and oxygen. Very often, deeper areas undergo seasonal or permanent vertical stratification whereby water masses of different densities modulate the transfer of upper organic matter from planktonic and nektonic sources to the sea floor that sustain a large part of benthic biomass production. Horizontally, hydrological dynamics through tidal velocity and wave energy increases toward coasts (Hall, 1994). In the upper part, along the intertidal gradient, organisms are periodically exposed to air, which represent another type of stress and selective force of adaptation (Peterson, 1991; Tomanek and Helmuth, 2002).
Modalities
-
Extralittoral. Terrestrial environment.
-
Supralittoral. Higher intertidal zone, presence of salt water only through splash and or occasionally during storms.
-
Mediolittoral. Fully intertidal.
-
Shore. 0–20 m deep.
-
Shelf. 20–200 m deep.
-
Slope. 200–4000 m deep.
-
Abyss. >4000 m deep.
Remark: no species documented in the hadal zone (>6000 m).
3.2.4 Sea floor affinity
By definition, the marine zoobenthos includes species that live near the sea floor, on or in the substratum. Sea floor affinity is a soft trait that informs on broad aspects of species dwelling modes at the adult stage. In general, from above the substratum (hyperbenthic) to inside (endobenthic), there is a decline in mobility with many consequences (dispersal, micro-habitat specificity, ecological interactions, ecosystem engineering). Also, a benthic species can perform for different modalities of this trait; for instance, most crabs are mainly epibenthic but bury themselves for short periods (occasionally endobenthic). Hence, this trait can tell whether some ecosystem engineering (e.g. biomixing, bioirrigation) are continuously or intermittently sustained.
Modalities
-
Mainly hyperbenthic
-
Occasionally hyperbenthic
-
Epibenthic
-
Occasionally endobenthic
-
Mainly endobenthic
3.2.5 Substratum
Substratum is a key habitat descriptor on the sea floor as it represents the environmental medium that hosts benthic life (Johnson, 1971; Gray, 1974; Sebens, 1991; Snelgrove and Butman, 1994). A major feature among substrata is the soft-hard gradient that strongly determines organism dwelling modes. On the one hand, hard substrata are typically colonised by firmly anchored species, and rubbles offer shelters to mobile ones. On the other hand, soft substrata are represented by mobile and malleable sediments that enable organisms to quickly bury or burrow. Although many benthic substrata have a geological origin, an important component of sediments is biologically processed (Seibold and Berger, 2017): organic matter (excrements and carrion remains) and hard body parts (carbonate shells and skeletons) are mixed with various mineral components. In any case, in sedimentary environments, grain size is a strong proxy for hydrodynamics (tidal current speed and wave energy) as the higher the hydrodynamic forces, the coarser the sediment grains (Creutzberg et al., 1984; Barmuta, 1990; Hall, 1994; Seibold and Berger, 2017). In general, the stiller the waters, the more organic-rich are the sediments (Wildish, 1977; Wildish and Peer, 1983; Snelgrove and Butman, 1994).
In MacroTraits, the chosen substratum modalities may not provide the most accurate description of sediment compositions due to limited information in the literature and possibly the ample substratum niche in many species, but, nevertheless, their semi-categorical nature follows relatively well the reference gradient proposed by Wentworth (1922).
Modalities
-
Mud – Sandy-mud. Finest and organically richest substratum type.
-
Muddy sand. Less muddy, with a substantial fraction of sand particles.
-
Sand. Dominantly mineral, often representative of surf zone and beach subject to wave action.
-
Mixed gravel
-
Gravel
-
Mixed soft-hard. Combination of any of the previous categories with “Hard”; see below.
-
Hard. Homogeneous composition of hard and relatively immobile elements from pebble-cobble to boulder and uniform bedrock.
3.2.6 Substratum depth occupancy
Vertical position of an organism within the sea floor. Endobenthic occupancy is an evolutionary response to epibenthic and demersal predation (Brett and Walker, 2002), with major effects of bioturbation on ecosystem functioning (Meysman et al., 2006). This trait is complementary to the trait “Sea floor affinity” for endobenthic species (modalities “Occasionally endobenthic” and “Mainly endobenthic”). It is an important trait in benthic ecology as it expresses (micro-) habitat, response (sheltering from predation) and effect (bioturbation). However, this particular and unspecific expression makes this trait not easily relevant to identify the processes to which it contributes (i.e. response or effect) in the absence of other traits.
Modalities
-
0 cm. Epibenthic level.
-
0–5 cm. Occupied by permanently buried species, but also temporarily by many mobile epibenthic species.
-
5–15 cm. Deeper layer than enable the construction of more sustainable burrows.
-
15–30 cm. Characteristic of important bioturbators.
-
>30 cm. Depths of the deepest burrowers, mostly mobile burrowing crustaceans with a few other species that have a bulldozing effect on the sediment matrix.
-
Crevice/Den. Specific to hard and mixed soft-hard substrata, and not necessarily vertical. A den can be dug in a soft substratum below a hard layer (e.g. Hommarus spp.).
3.2.7 Epi-bioconstruction occupancy
Biogenic structures significantly occupied by the species. This trait can discriminate habitat occupancy in shallow areas as most documented structures rarely occur in the deep, except corals and sponges. Its slight expression of response can be expected in some modalities for the hyperbenthos through predation avoidance, and ecosystem effect in grazing specialists.
Modalities
-
None
-
Terrestrial plant/Helophyte
-
Mangrove
-
Wrack
-
Seagrass
-
Kelp
-
Other seaweed
-
Coral/Sponge
-
Maerl
-
Shell
Remark: tube lawn could represent another modality, but given the high frequency of this kind of biogenic structure, it is difficult to know whether a species can avoid it for any reason.
3.2.8 Life span
Duration of the life cycle following settlement on the sea floor. Life span is associated with environmental cycles (Powell and Cummins, 1985; Gage, 1994): the longer the cycle, the longer the life in order to ensure a minimum number of reproductive successes over years during which recruitment conditions are not always suitable (e.g. predation on propagules, limited food resource). So, life span does not express a precise characteristic of the life cycle, but its link with recruitment success frequency makes it a prominent response trait (Grassle and Sanders, 1973; Robertson, 1979; Powell and Cummins, 1985; Beukema, 1989; Montero-Serra et et al., 2018; Beauchard et al., 2022): the longer the life span, the safer the adult longevity.
Modalities
-
<6 months
-
6 months–1 year
-
1–3 years
-
3–10 years
-
10–20 years
-
20–50 years
-
50–100 years
-
>100 years
Remark. Life span and the following traits from Sct. 3.2.9 to 3.2.21 are descriptors of organism's ontogeny and multiplication over time, most typical of life history and revealing how a population can persist in specific environmental conditions (Stearns, 1992). These traits purely express response to environment, without clear effects on the organism's environment (Table 1).
3.2.9 Age at maturity
Time before reproducing. In general, age at maturity is strongly correlated to life span, the relationship being clade-dependent (Charnov, 1993). Increase in life span induces multiple cohorts of which some of the first ones might not be sexually mature. In some species, the onset of reproduction is delayed such that the individual organism be large enough to allocate a sufficient amount of energy into reproduction (offspring size or fecundity). In this respect, age at maturity is inversely proportional to the intrinsic rate of natural increase that accounts for population recovery time following disturbance (Savage et al., 2004). As to life span, age at maturity is a pure response trait expressing an important facet of life strategy. When combined with reproductive allocation, a mechanistic understanding of the implications of life span and age at maturity in life strategies can be found in the concept of pace-of-life syndrome that defines trade-offs between reproductive schedule and success, and determined by environmental conditions (Ricklefs and Wikelski, 2002; Dammhahn et al., 2018).
Modalities (in years)
-
<6 months
-
6 months–1 year
-
1–3 years
-
3–5 years
-
5–7 years
-
>7 years
3.2.10 Voltinism
Except in some tropical contexts, most ecosystem processes are rhythmed by marked seasonal cycles, and most large-bodied and long-lived species are perennial iteroparous that comply with seasonal dynamics to achieve reproductive success. However, many small and short-lived species have found evolutionary solutions to circumvent the problem of periods unfavorable to reproduction. While such periods prevent population growth through reproduction, individual survival and growth remain possible. Hence, multiplying the number of generations at the expense of adult survival during favorable periods is a solution to persist in fluctuating environments and maximize adaptation (San Vincente, 2018). Therefore, in those short-lived species, voltinism, the number of generations per year, is a trait complementary to the understanding of reproductive schedules.
Modalities
-
Semivoltine (life span > 1 year)
-
Univoltine (annual life span)
-
Bivoltine (2 generations per year)
-
Multivoltine (>2 generations per year)
3.2.11 Reproductive frequency
Reproductive schedules are central matters in life history. Traditionally, biologists consider a general dichotomy (“parity”) between semelparity whereby an organism reproduces only once before dying and iteroparity when the reproductive effort is spread over several events. The one or the other strategy is adopted to ensure reproductive success depending on environmental assets and constraints such as population density or abiotic fluctuations (Varpe and Ejsmond, 2018). Therefore, a trait simply consisting of the two modalities could express important parts of fitness. However, this discrete consideration of parity may not be so relevant as more complicated reproductive schedules appear in reality. While strict semelparity is frequent in small crustaceans that achieve life cycle in less than a year (“annual semelparity”) or some cephalopods after a few years (“perennial semelparity”) after releasing offspring at once, others extend the release over successive events before dying (i.e. over a few weeks or months). Since various combinations exist from strict semelparity to pure perennial iteroparity, parity should be viewed as a continuum (Hughes, 2017). In fact, using several traits in concert can implicitly account for parity. The combination of life span and age at sexual maturity provides a first piece of the puzzle. Here, sexual reproductive frequency indicates whether reproductive outputs are released in a relatively restricted period of the year or more continuously.
Asexual reproduction is another way for organisms to multiply, without the involvement of gametes or breeding partners. This can be an advantage to rapidly colonise open environments or to compensate for depletions in individual densities by ensuring genotype persistence in the face of extinction (Williams, 1975). Body fragmentation and parthenogenesis (development of a new individual from an unfertilised oocyte) represent the principal processes. Although the latter is known to occur in various clades (corals, mollusk, annelids, sipunculids, crustaceans, echinoderms; Lively and Johnson, 1994), its documentation may not be exhaustive at the species level. On the contrary, the former is prominent in starfish, polychaetes and cnidarians. Therefore, fragmentation was solely considered as asexual reproduction.
Modalities
-
Sexual seasonal
-
Sexual continuous
-
Asexual seasonal
-
Asexual continuous
Remark. “Sexual seasonal” can be relatively prolonged (e.g. 6 months), the attribution of the modality being determined by minimum annual variations in reproductive activity due to oscillations in external requirements (e.g. temperature, food resources …). In case of more than one generation per year (see “Voltinism”), continuous reproduction can occur during the summer while a period of inactivity takes place during winter with a longer-lived generation that lately reproduces. In that case, both modalities can be attributed.
3.2.12 Sexuality
Type of gametes released by an individual organism. Gonochorism, when a single type is released (sperm or ovum) is the dominant mode. Some species can produce and release both types (“hermaphroditism”), in different ways: homogamy when both types are permanently present and functional (“simultaneous hermaphroditism”), with or without self-fertilisation, and sequential hermaphroditism when individuals born one sex and change to the opposite sex in the course of the life cycle. In this latter, two modes can be distinguished: protandry when individuals are born male and switch to female after additional growth that multiplies ovum production; protogyny is the switch from female to male, for instance when male reproductive success in ensured by large body size that gives advantage in between-male competition.
Modalities
-
Gonochorism
-
Homogamy
-
Protandry
-
Protogyny
3.2.13 Fertilisation
Fertilisation is the union of male and female gametes that can be released in different ways. A key expression of this trait is the proximity of parental organisms on which a successful cross-fertilisation depends. Through broadcasting, the simplest way, gametes are released in the water column where fertilisation takes place. This is the main mode on most sessile or weakly mobile species; individuals can be distant when spawning, at the expense of success. Spermcasting, generally overlooked (Bishop and Pemberton, 2006), is the broadcast of only spermatozoa (allosperm), free or through spermatophores, that must reach the recipient organism where fertilisation is either internal or external and usually followed by embryonic brooding before offspring release. Spermcasting is frequent in sponges, hydroids, ascidians, sessile annelids, less in some corals and bivalves. Other fertilisation modes through direct contact between mating organisms include copulation (internal fertilisation) as encountered in cephalopods, most crustaceans, part of gastropods, and, more rarely, external fertilisation accompagnied by protection (brooding, gel or capsule). Internal or external fertilisation, the necessary direct contact between breeding mates was categorised as “pairing”. This way of coding fertilisation can somehow express mobility, with a slight indirect expression of ecosystem function (Table 1, Fig. 8).
Modalities
-
Broadcasting
-
Spermcasting
-
Pairing
Remarks. Internal fertilisation is regularly found in trait coding; however, as explained above, it is not discriminated between spermcasting and pairing which can be related to contrasting dwelling modes. Self-fertilisation (in simultaneous hermaphrodites) could have been an additional modality but it was omitted due to the lack of information. Also, epitoky, as reproductive transformation in some annelids (Clark, 1961), was not considered as a separate modality to avoid a taxonomic effect as epitoky is specifically encountered within the class Polychaeta. Under epitoky, the reproductive individuals actively swim in the water column and simultaneously shed their gametes to optimise fertilisation success. In MacroTraits, this can be identified by the combination of the modalities swimmer (partly for motility), broadcasting (fertilisation) of pelagic egg/larva (offspring type) and development in the water column (offspring development; albeit not always following epitoky).
3.2.14 Annual fecundity
Annual fecundity was defined as the number of offspring per mother and per year. Fecundity is a trait of central importance in energy allocation trade-offs within the reproductive component of an organism's fitness. In general, fecundity is inextricably associated to offspring type (Sect. 3.2.15) and offspring size (Sect. 3.2.16); see Sect. S2.2 for illustration. While offspring type determines offspring size, fecundity decreases with offspring size (Stearns, 1992). Fecundity was shown to be a strong determinant of bioenergetics and life history strategies in the marine benthos (Ramirez Llodra, 2002).
Modalities (number of offspring per year)
-
<102
-
102–103
-
103–104
-
104–105
-
105–106
-
>106
3.2.15 Offspring type
Among the four assembly rule processes, dispersal can be relevantly investigated by using offspring traits (McEdward, 1997; Pechenik, 1999; Burgess et al., 2015). First of all, offspring type is the development stage of the offspring once released by parent organisms. From gamete to settled juvenile, offspring can be released under different developmental stages. Eggs arise from shed gametes in the water column where fertilisation takes place, while larvae are brooded before being released at a more advanced stage. Juvenile, resulting from internal incubation, consists in the most elaborate form, as an adult miniature. An advanced stage shortens the development before settlement on the sea floor and increases survival (Strathmann, 1990). These three different offspring types may induce similar energetic costs for the parents (Giangrande et al., 1994), yet some variations within egg and larval types must be considered to better account for a complete developmental strategy (see Sect. 3.2.17 and 3.2.18).
Modalities
-
Egg
-
Larva
-
Juvenile
3.2.16 Offspring size
Offspring size is complementary to annual fecundity, especially to determine reproductive investment (Marshall and Keough, 2007). Besides, this trait is substantially variable within each offspring type as size depends on several aspects, including taxonomy, species body size, development type and duration (see Sect. 3.2.18 to 3.2.20).
Modalities (mm)
-
<0.1
-
0.1–0.5
-
0.5–1.5
-
1.5–5.0
-
>5.0
3.2.17 Offspring protection
When released, offspring propagules are generally more vulnerable than adult stage, undergoing physico-chemical stress or predation. Therefore, offspring can be endowed with various types of protections that optimise survival until settlement on the sea floor. The absence of protection is specific to numerous gametes broadcasted in the water column; sometimes, broadcasting is accompanied by gel surrounding the gametes. However, gel is more typical when offspring are released on the bottom, either for completing development in absence of pelagic phase, or temporarily before a pelagic phase. The benthic release of egg capsules is frequent in gastropods, and combination of encapsulated eggs within a jelly matrix is typical of nudibranchs. Burying into the sediment also ensures a matrix protecting against epibenthic and demersal threats (e.g. horseshoe crabs, lugworms). Direct parental cares can be either larval bearing such as in decapods or external egg or larval brooding (tubicolous worms, some snails). Finally, internal development that lead to the release of juvenile represent the most achieved form of protection to ensure optimal offspring survival.
Modalities
-
None
-
Gel
-
Capsule
-
Burying
-
Bearing/Brooding
-
Internal
3.2.18 Offspring development
Offspring development provides a key expression of ontogeny and more consequently life-history strategy (Vance, 1973; Strathmann, 1977; McHugh and Rouse, 1998). In the literature, trait coding usually overlooks this important aspect through simplistic trait coding such as benthic/pelagic or direct/planktotrophic/lecithotrophic. However, early works had already revealed the more complicated reality in the marine benthos (Fauchald, 1983; Jablonski and Lutz, 1983; Bhaud and Duchêne, 1996). An essential fact is the possible combination of benthic and pelagic phases within a same development called “mixed development” (Jablonski and Lutz, 1983). Below, a synthetic description is provided to each modality.
Modalities
-
Planktotrophic. Purely pelagic, feeding on planktonic organisms.
-
Lecithotrophic. Either benthic or pelagic, non-feeding.
-
Mixed planktotrophic. Benthic phase, with parental cares or not, followed by pelagic feeding phase.
-
Mixed lecithotrophic. Benthic phase, with parental cares or not, followed by pelagic non-feeding phase.
-
Internal. Incubated within the adult, necessarily released as juvenile.
Remark. Some species exhibit a developmental polymorphism whereby planktonic or benthic offspring on the one hand, and feeding or non-feeding on the other hand, are produced, likely depending on environmental conditions (“poecilogony”; Chia et al., 1996). In that case, all possible types of development were considered.
3.2.19 Offspring benthic stage duration
In the previous section, the need for separating benthic and pelagic offspring developmental phases naturally leads to phase duration as a complementary trait. Benthic stage duration indicates the developmental time under parental of other protective forms on the sea floor; there is no such a phase in directly broadcasted gametes in the water column (modality “Null”).
Modalities (days)
-
Null
-
<15
-
15–30
-
30–60
-
60–180
-
>180
3.2.20 Offspring pelagic stage duration
This trait, complementary of the previous one, indicates the offspring development time in the water column. While it is quite predictable in some clades such as bivalves (ca. 3–4 weeks), it can be highly variable in some others such as annelids that exhibit various developmental types (McHugh and Fong, 2002), but also in corals, that, although less variable in development with a pelagic phase in most species, can delay metamorphosis and settlement until finding a suitable habitat; this phase is called “larval competence” and can extend from a few hours to several months in a same species (Pechenik, 1990; Gleason and Hofmann, 2011).
Modalities (days)
-
Null
-
<15
-
15–30
-
30–60
-
60–180
-
>180
3.2.21 Offspring settlement size
This trait, generally not encountered in the literature, can be complementary to investigate ontogeny, and especially offspring growth across various pelagic stage durations in broadcasting species.
Modalities (mm)
-
<0.5
-
0.5–1.5
-
1.5–5.0
-
5.0–10.0
-
10.0–20.0
-
>20.0
3.2.22 Body resistance
This is a subjective measurement to approximate resistance to physical damage, as encountered sometimes in the literature. From an evolutionary perspective, body resistance may not be always associated to survival (e.g. sessile and hard shell versus soft-bodied and highly mobile organisms) while stony organisms exhibit systematic habitat opportunity to fouling ones. Therefore, this trait may equally express both response and effect without clear indication.
Modalities
-
Gelatinous (e.g. some oweniid worms, impossible to remove from their tube without damaging them)
-
Brittle (e.g. requiring care to be manipulated such as tellinid bivalves)
-
Intermediate (wide range of organisms, from some degree of softness to relatively firm; e.g. intermediate to large-bodied worms and shrimps)
-
Firm/Hard (can be manipulated without cares such as large crustaceans, cephalopods or relatively thick shellfishes)
-
Stony (necessarily endowed with very hard or thick shell, typically oysters)
3.2.23 Body mass
Body size is the most prominent feature of an organism. Body mass is a first way to quantify it and was documented here in terms of ash-free dry mass (AFDM). This is the best quantification of the amount of living tissues in an organism. Besides, half of AFDM is generally the carbon content of the organism's body (Salonen et al., 1976; Clarke, 2008b). Body size is associated to many biological and ecological aspects, from individual organism to ecosystem. While it cannot be specifically related to life strategies (Strathmann and Strathmann, 1982; Warwick, 1984), implications in population density (White et al., 2007; Yamanaka et al., 2012) and carbon fluxes (Blanchard et al., 2017) are more explicit for this trait. AFDM was recorded when directly available, otherwise, if available as wet or dry mass, conversion into AFDM was done according to Ricciardi and Bourget (1998).
The quantitative information carried by body size makes the use of this trait in concert with others a necessity to relevantly express engineering functions involving biogeochemistry (Beauchard et al., 2023b). Hence, body size, including mass and length (next section), is involved in so many processes that it fully expresses both response and effect. However, possible expression in species community analysis might not be generally clear, especially as regards selection in which growth rate can make more sense (Beauchard et al., 2022).
Modalities (g AFDM)
-
<0.001
-
0.001–0.010
-
0.010–0.100
-
0.100–1.000
-
1.000–10.000
-
>10.000
3.2.24 Body length
Body length, as a second quantification of body size, was considered as the length of the prominent part of the organism's body, avoiding appendices of negligible mass such as palps or antennae and of which the size can exceed the size of the remaining part. Note that the correlation between body length and mass can be limited, which makes length a complementary trait. This is especially the case for biogenic structures such as in corals.
Modalities (cm)
-
<1
-
1–3
-
3–10
-
10–20
-
20–50
-
>50
3.2.25 Motility
Motility is the way of moving at the adult stage, and, with sea floor affinity, substratum depth occupancy and mobility (next section), an important descriptor of dwelling mode. It roughly indicates whether the organism moves or not, and, if motile, an indication on the organism's ecology as its physical relationship with the substratum. Like mobility, motility largely contributes to both fitness components and ecosystem function.
Modalities
-
Sessile. Fixed on or in the substratum (e.g. mussel).
-
Tubicolous. Lives in a biogenic tube, possible moves within the tube (e.g. spionid worms, some amphipods).
-
Crawler. No specialised appendages for moving (e.g. worm, snail, slug).
-
Walker. Moves with appendages (e.g. most crustaceans).
-
Swimmer. Substantial ability to swim (e.g. squid), not exclusively (e.g. lobster).
3.2.26 Mobility
Mobility is closely related to motility, at least in distinguishing sessile-immobile from non-sessile and fast moving species. More than motility, mobility is the most concise way to express adult dispersal ability through foraging, migration or predator avoidance. It is particularly useful for building composite trait indicators of ecosystem functions in which it integrates time within the process of interest (Swift, 1993; Sect. S3.3).
Modalities
-
Immobile (necessarily sessile)
-
Limited (e.g. many bivalves and tubiculous worms)
-
Slow (most crawling organisms)
-
Fast (at least small swimming species)
-
Very fast (large swimming species, but also large walking ones; e.g. crabs)
3.2.27 Rafting
Whatever their motility, benthic organisms can sometimes disperse over very large distances by means of floating objects. This ability, called “rafting”, is an important dispersal mechanism and therefore a clear response trait (Thiel and Gutow, 2005a, 2006). Rafting has been observed in many species, occasionally or frequently (Thiel and Gutow, 2005b). Debris or any substratum of human origin are especially involved in rafting and strongly contribute to non-native species invasions (Rech et al., 2025).
Modalities
-
Not reported
-
Likely/Occasional
-
Frequent
Remark. “Not reported” does not exclude possible rafting ability; this includes either species with no obvious ability (e.g. burrowing fauna) or absence of tangible evidences.
3.2.28 Degree of attachment
Various abiotic and biotic forces constrain the dwelling modes of animal life on the sea floor. Hydrodynamics is a prominent physical constraint with which highly mobile species can easily cope. By contrast, sessile or slowly motile organisms exposed to strong water movements must strongly anchor to the substratum, permanently with cement or temporarily with adhesive film or suckers (Flammang, 1996; Dodou et al., 2011). Except on mobile sand that requires some degree of mobility, soft sediment habitats do not undergo such physical constraints, so most hosted species are freely sessile or motile; some exceptions include anemones that anchor on buried shell or stone (e.g. Cylista troglodytes). Degree of attachment, as a dwelling function, surely contributes to fitness, but is also indicative of microhabitat; besides, the strong attachment through cementation or perforation can have engineering effects on the substratum (e.g. oysters, limpets).
Modalities
-
Null (hyperbenthic or free in soft sediment)
-
Slight (grabbed, not necessarily attached or slightly attached)
-
Strong (generally on hard substrata)
3.2.29 Sociality
Sociality is defined as the propensity to which individual organisms of a same species aggregate (Jacoby et al., 2022). This has important implications in habitat occupancy (Webb et al., 2009) and sea floor biogenic engineering (Sebens, 1991). Sociality is particularly critical to reproduction and dispersal (Mazzei and Rubenstein, 2021), limited by fertilisation success that decreases with individual organism isolation (Levitan, 1995). The adopted coding especially reflects this last point, opposing the modalities “solitary” to “aggregated” while “colonial” refers to individual colonies such as encountered in Cnidaria and composed of different interbreeding genotypes. Therefore, sociality is mainly a response trait, but when sessile and depending on morphology, it can also express ecosystem function (see following sections).
Modalities
-
Solitary
-
Aggregated
-
Colonial
Remark. In colonial species, it is always specified whether individual colonies are solitary or aggregated.
3.2.30 Epi-bioconstruction type
According to Ingrosso et al. (2018), “bioconstruction” refers to tridimensional structures rising above the sea floor. In the present and following sections, we separate epi- from endo-bioconstruction as structures engineered by benthic species above and below the substratum surface, respectively. The traits described in Sect. 3.2.30—3.2.39 were firstly used in Beauchard et al. (2023b) and strongly express ecosystem functions. Epi-bioconstruction types are either biogenic such as in corals and shelly species or engineered based on abiotic elements such as mound or tube from sedimentary materials. This is the only trait that includes morphological aspects for obvious effects of habitat creation (Roberts et al., 2006); however, morphological adaptations to environmental conditions can express response (Darling et al., 2012).
Modalities
-
None
-
Mat
-
Mound
-
Shell
-
Tube/Tubular protrusion
-
Stalk/Feather
-
Protuberance/Lobe
-
Arborescence
3.2.31 Epi-bioconstruction extension
This trait describes how the type of epi-bioconstruction spreads above the substratum. The more complex the bioconstruction, the higher the potential in habitat opportunities for various organisms (Buhl-Mortensen et al., 2010; Kovalenko et al., 2012).
Modalities
-
None
-
Simple. No noticeable 3D-complexity (e.g. tube, or flat or spherical shell).
-
Horizontally flattened. Large coverage, no prominent erected structure (e.g. continuous mat or dense and homogeneous tube lawn).
-
Horizontally erect. Large coverage, with prominent vertical structuration (e.g. oyster or coral reef).
-
Vertically complex. Vertical structuration, basic degree of morphological complexity (e.g. shelly reef).
-
Vertically highly complex. Vertical structuration, high degree of morphological complexity (e.g. arborescent coral structure).
3.2.32 Epi-bioconstruction size
Largest dimension between horizontal and vertical extent. When present, epi-bioconstructions are generally produced by sessile species with variable degrees of aggregations. Therefore, this trait does not always capture the size of the individual organism, but the size of its effect. For instance, in the case of a large aggregation of mussels, the corresponding modality is the extent of the reef rather than the individual shell length (e.g. >50 cm).
Modalities (cm)
-
<1
-
1–3
-
3–10
-
10–20
-
20–50
-
>50
3.2.33 Endo-bioconstruction type
Type of bioconstruction within the substratum matrix. While endo-bioconstructions exist in hard substrata (Bromley, 1978), they are usually more common in soft sediments. Endo-bioconstructions can express different effects such as biogeochemical through bioirrigation (Kristensen et al., 2012) and habitat creation (Woodin, 1978; Lackschewitz and Reise, 1998; Anker et al., 2005; Callaway, 2006; Tseng et al., 2019). Burrows in sedimentary substrata can be permanent or semi-permanent.
Modalities
-
None/Surficial
-
Rugosity/Pit. Exclusively in hard substrata.
-
Chimney/Funnel
-
Tube. Engineered biological or mineral materials.
-
IJ-shaped burrow
-
UY-shaped burrow
-
Branched burrow
-
Anastomosed burrow
Remark. This trait is of upmost importance when investigating bioirrigation. All the listed modalities may not be relevant in that case. The flushing potential of a burrow is increased with more than one opening (otherwise, closed; Kristensen and Kostka, 2005). Changing the listed modalities above enables a relevant way to express it (same order than above): Null/Null/Closed/Closed/Closed/Open/Closed/Open (Sect. S2.1).
3.2.34 Endo-bioconstruction depth
Maximum vertical extent of endo-bioconstruction. While substratum depth occupancy (Sect. 3.2.6) considers the deepest layer where the upper part of the organism can occur, endo-bioconstruction depth takes the entire extent of the bioconstruction, so the two traits can differ.
Modalities (cm)
-
None/Surficial
-
0–5
-
5–15
-
15–30
-
>30
3.2.35 Endo-bioconstruction width
Size of the transversal section of the endo-bioconstruction. It is usually related to inhabitant's body width (Kristensen and Kostka, 2005). Bioirrigation and habitat creation potentials increase with width.
Modalities (mm)
-
None
-
<5
-
5–10
-
>10
3.2.36 Ventilation/pumping
Ability to induce water transports into soft substrata. It is particularly useful to investigate bioirrigation potential. As experimental water flux measurements are available only for a few soft sediment species, this trait expresses solely the presence of ventilation/pumping ability through sea floor affinity and motility, independently of other traits such as body size or burrowing depth. Information is not directly available for all burying species, but modalities can be attributed based on strong assumptions. “Null” was systematically attributed to hard substratum, epi- or hyperbenthic species. Species attributed “High” were generally documented (e.g. lugworms, mudshrimps), especially for deeply buried suspension feeders (Kristensen, 1981; Christensen et al., 2000; Kristensen and Kostka, 2005; Kristensen et al., 2012). “Potential/Low” means either observed or supposed given the necessary oxygen demand when deeply buried (Lindroth, 1941) or induced through local pore water transports when sediment particles are displaced by organism movements, especially near the sediment-water interface (Aller, 1982; Kristensen, 1988; Berg et al., 2001; Volkenborn et al., 2012; Volkenborn et al., 2016). Besides, this is why the term “bioturbation”, often wrongly used, implies that sediment particle reworking is necessarily accompanied by water diffusion (Kristensen et al., 2012). Hence, “Potential/Low” indicates rather passive bioirrigation whereas “High” holds for more active organism movements to generate water fluxes, generally through permanent or semi-permanent burrows.
Modalities
-
Null
-
Potential/Low
-
High
3.2.37 Sediment biomixing type
Specific to soft substratum habitat, sediment biomixing is the reworking of sediment particles through organism movements, ingestion and defecation (Kristensen et al., 2012). It is a clear effect trait closely related to dwelling mode, especially organism motility, sediment depth occupancy and mobility that condition sediment particle local and non-local displacements (François et al., 1997). In general, a meaningful use of this trait makes sense in combination with other traits such as pioneered by Swift (1993) and further developed by others (Solan et al., 2004; Queirós et al., 2013).
Modalities
-
None
-
Diffusion
-
Upward conveying
-
Downward conveying
-
Regeneration
Remark. One biomixing type does not necessarily exclude another one; for instance, a large crab can induce substantial biodiffusion when walking, while regenerating the sediment matrix when burying itself.
3.2.38 Bioerosion
Bioerosion is the alteration of hard substrata by organisms through boring, abrasion or biochemical effects (Trudgill, 1987, 1988). This is a prominent effect trait that enables the construction of refuges such as pits or deep burrows (e.g. rchins, annelids, sipunculids, bivalves), or destruction through firm anchoring (e.g. corals, sponges) (Bromley, 1978).
Modalities
-
None
-
Scraping (e.g. barnacle fixation, snail or limpet grazing)
-
Scarring/Perforating (e.g. limpet home scar, sponge perforations)
-
Boring (e.g. urchin pits, pholadid bivalve burrow)
3.2.39 Biostabilisation
This strait is specific to soft sediments where some species, through morphological or aggregative aspects, can prevent substratum erosion from water hydrodynamics. Typical examples appear through organism aggregations, including shelly structures such as shallow mussel or oyster beds (Meyer et al., 1997; Meadows et al., 1998; Ysebaert et al., 2019) and tube lawns (Young and Rhoads, 1971; Luckenbach, 1986; Friedrichs et al., 2000). Free shells from free species (e.g. bivalves, snails), alive or dead, can also have a stabilizing effect on sediments (Cheng et al., 2021), but it depends on local organism density, which requires field expertise. Therefore, biostabilisation ability was attributed when well documented (modality “High”) or likely (“Low”) when organism aggregation was not systematic.
Modalities
-
Null
-
Low
-
High
3.2.40 Feeding type
Historically, feeding type has been one of the most studied traits given the important role of trophic relations in ecosystem structuring (Walker and Bambach, 1974). Also, in the second part of the twentieth century, human-induced organic disturbances were dominant drivers of benthic community structures and successions, and represented a central research focus in marine coastal waters (Pearson and Rosenberg, 1978; Rhoads et al., 1978; Diaz and Rosenberg, 1995; Levinton and Kelaher, 2004). Effects of organic enrichment on sea floor functioning are now well evidenced, especially their propensity to favour deposit feeding. Hence, feeding type, as a single trait or combined with a few others related to dwelling mode, was considered a trait of upmost importance in benthic ecology. Nowadays, it should be less the case given the multiplicity of research directions that require multiple traits (e.g. evolutionary aspects, life history, functional diversity) and the numerous reasons according to which feeding type, besides organic disturbance, is generally a poor predictor of species persistence in habitats undergoing various regimes of physical disturbance or stress (acting on the plurality of fitness components). Nevertheless, feeding type remains an important effect trait, often indispensable when focusing on ecosystem functions.
Technically, a major issue has been the attribution of specific and meaningful categories to species due to the constraint of omnivory. Indeed, seasonality and spatial heterogeneity limit feeding specialization (Clarke, 1988; Herman et al., 1999; Jumars et al., 2015). A necessary simplification is possible and lies in the close relation between diet and feeding mechanism that can be identified on organism anatomy (Yonge, 1928), which has given rise to influential works on trophic guilds (Fauchald and Jumars, 1979; Gaston, 1987). Here, we considered the most general feeding types encountered in the literature (essentially since Walker and Bambach, 1974; see modalities below). Omnivory, an important aspect in benthic studies, was not considered as a separate modality. In fact, the selected modalities already express a certain degree of omnivory. Deposit feeding consists in ingestion of organic materials in deposited sediments originating from multiple sources and of varying state of decomposition, but also the associated micro-organisms (Lopez and Levinton, 1987; Herman et al., 1999). Suspension-feeders prey upon particles in the water column, which can include phytoplankton, zooplankton, decaying planktonic materials or re-suspended deposit, and whereby particle selection can passively or actively operate to exclude low quality or irrelevant materials (Ward and Shumway, 2004). Carnivory and scavenging are difficult to separate as both consist in consuming live or dead animal materials that can remain alike in the marine environment (Beasley et al., 2012), and have been usually grouped within the same category (Walker and Bambach, 1974; Fauchald and Jumars, 1979; Ambrose, 1984).
To summarise, the first four modalities of feeding type can indicate the origin of food resource (water column or sea floor), the lability of the material (deposit or living) and the trophic level (herbivory or carnivory). Among the two last ones, parasitism (Pa) was represented by a few species, either as exclusive modality (e.g. on anemone or sponge) or complementary of another modality (e.g. temporary ectoparasitism on fish). Lastly, “Sy” indicates obligatory association with endosymbionts; this mainly includes shallow corals and giant clams (zooxanthellae, zoochlorellae), some slugs (chloroplasts in the gut), and hydrothermal vent species and shipworms (bacteria).
Modalities
-
Deposit feeding
-
Suspension feeding
-
Herbivory/Grazing
-
Carnivory/Scavenging
-
Parasitism
-
Symbiont-associated
Remarks. A species can be attributed more than one modality (e.g. very often, deposit and suspension feeding). Considering the modalities as a basis of specialization (at least, one cannot do better), omnivory appears for species that are attributed at least two modalities; then, the total number of attributed modalities can express the degree of omnivory. Also, suspension feeding, combined with body mass, can be used to quantify biodeposition, an important engineering function of the sea floor in pelagic-benthic coupling (Graf and Rosenberg, 1997; Gili and Coma, 1998).
3.2.41 Foraging depth
The vertical position of an organism within the substratum is not always indicative of the origin of food resource (Pearson, 2001). So, complementary to feeding type, foraging depth indicates the spatial origin of food resource and can inform on the transfer of fresh organic materials into the substratum. This regards mainly deposit feeding and carnivory in soft substrata whereby the same food type can be consumed at various sediment depths. Hence, the modality “Deposit feeding” in feeding type can be subdivided into surface (0 cm) and sub-surface (>0 cm) deposit feeding; besides, deep sub-surface deposit feeding may suggest the consumption of organic matter of low quality compared to the high quality of planktonic material freshly deposited on the sediment surface. Also, defecation following sub-surface carnivory provides labile organic inputs (Gontikaki et al., 2011).
Modalities (cm)
-
0
-
0–5
-
5–15
-
>15
In situ trait measurement is always laudable, but it is more idealistic than realistic when working on many species. Therefore, a priori or a posteriori documentation from the literature is generally required. Historically, in marine studies, Swift (1993) pioneered biological trait quantification by attributing discrete scores to species as degrees of affinity. In the meantime, Chevenet et al. (1994) popularised the fuzzy coding technique in freshwater ecology, an improved version of complete disjunctive coding (Tenenhaus and Young, 1985), more elaborate and relevantly designed for multivariate ordinations. In MacroTraits, species were attributed 1 when their affinity for a given trait modality was likely, 0 otherwise. By this way, a fuzzy coding can be implemented; for example, the scoring profile of a suspension-feeding species for feeding type (see Sect. 3.2.42 for modalities) is 0/1/0/0/0/0 and remains as such following fuzzy coding; for a deposit and suspension-feeding species, the profile is 1/1/0/0/0/0 and becomes 0.5/0.5/0.0/0.0/0.0/0.0, and generally, such that scores sum to 1 within any trait profile. Very often, in existing trait data sets, raw scores can vary between 0 and 3, or even 0 and 5. However, the attribution of scores greater than 1 requires a strong background of organism biology and a very detailed literature, conditions rarely met. For instance, some traits are variable over time (e.g. large body length in long wintering generation, small in short summer generations) or space in species distributed over large geographic extents whereby local biogeographic influences can exacerbate variations in population biology (e.g. growth rate: early sexual maturity and short life span in warm waters, later maturity and longer life span in cold ones). Even basic habitat descriptors like sediment type can induce noticeable variations on important traits of dominant species such as substratum depth occupancy (Enderlein, 2004; Gilbert et al., 2021; Wiesebron et al., 2021). In fact, in many data sets providing 0–3 scorings, score distributions are dominated by values 0 and 3, making them similar to 0–1 through fuzzy coding. This underlines the fact that trait data designers do not escape to those constraints inherent to fuzzy coding when attempting to establish precise trait profiles. While the method of Chevenet et al. (1994) truly enables the expression of within-species trait variations (e.g. 0/0/2/5/3/1 for body size), current data availability in the marine benthos is unrealistic for this purpose. Therefore, in MacroTraits, we opted for simplification with a scoring limited to 0–1 as in Chevalier et al. (2025); its reliability is exemplified in Appendix A. Note that complete disjunctive coding, a more restrictive way of coding, was successfully used in Beauchard et al. (2022).
In general, scoring qualitative traits (e.g. offspring type, Egg/Larva/Juvenile) is straightforward while it can be less intuitive for quantitative traits (e.g. body size, life span, fecundity …). As variability is naturally inherent to population biology, the quantification of a trait cannot be fully objective when working on multiple traits and species. The attribution of discrete modality scores has been so far the least bad solution, even though unknown associated uncertainties seem inevitable. Thus, a certain degree of subjectivity, which can vary among trait data designers, is generally accepted for fuzzy traits. In the absence of clear rule, one can advocate for a principle: when studying a species pool, a trait is technically worth to consider if the modalities within the trait are variable enough over the pool. Therefore, trait profiles among species must differ as much as possible. Based on life span, Fig. 2 exemplifies how a parsimonious scoring enables the distinction of different species. Mortality occurs in both juvenile and adult individuals for various and unexpected reasons (e.g. predation, disease, disturbance), unpredictable over space and time, and that can be differently experienced across cohorts. Thus, in absence of unpredictable mortality and by excluding outliers, the last cohort indicates a potential life span beyond age at sexual maturity. By considering maturity within 1–3 years in the four different cases from Fig. 2, score profiles can be unambiguous in some cases (0/0/1/0 or 0/0/0/1; Fig. 2b and d), and multiple score attribution may be more careful in other cases (0/1/1/0 or 0/0/1/1; Fig. 2b and d). When multiple scores are attributed, the flexibility of fuzzy coding ensures an average scoring. In MacroTraits, this way of scoring was applied either to cope with natural uncertainty or under clear evidence of human pressure (Ramón and Richardson, 1992; Fallon et al., 2013). Additionally, as previously stressed, the attribution of several categories within quantitative traits can be due to biogeographic implications; for instance, life span in Macoma balthica varies from 1–3 to 20–50 years depending on the population from temperate to Arctic waters (Gilbert, 1973); hence, for local investigations, the trait profile must be accordingly adjusted. In the current state of knowledge, only a few species are concerned, and as part of a case study, a simple scrutiny of modality counts per trait and per species suffices to detect possible issues.
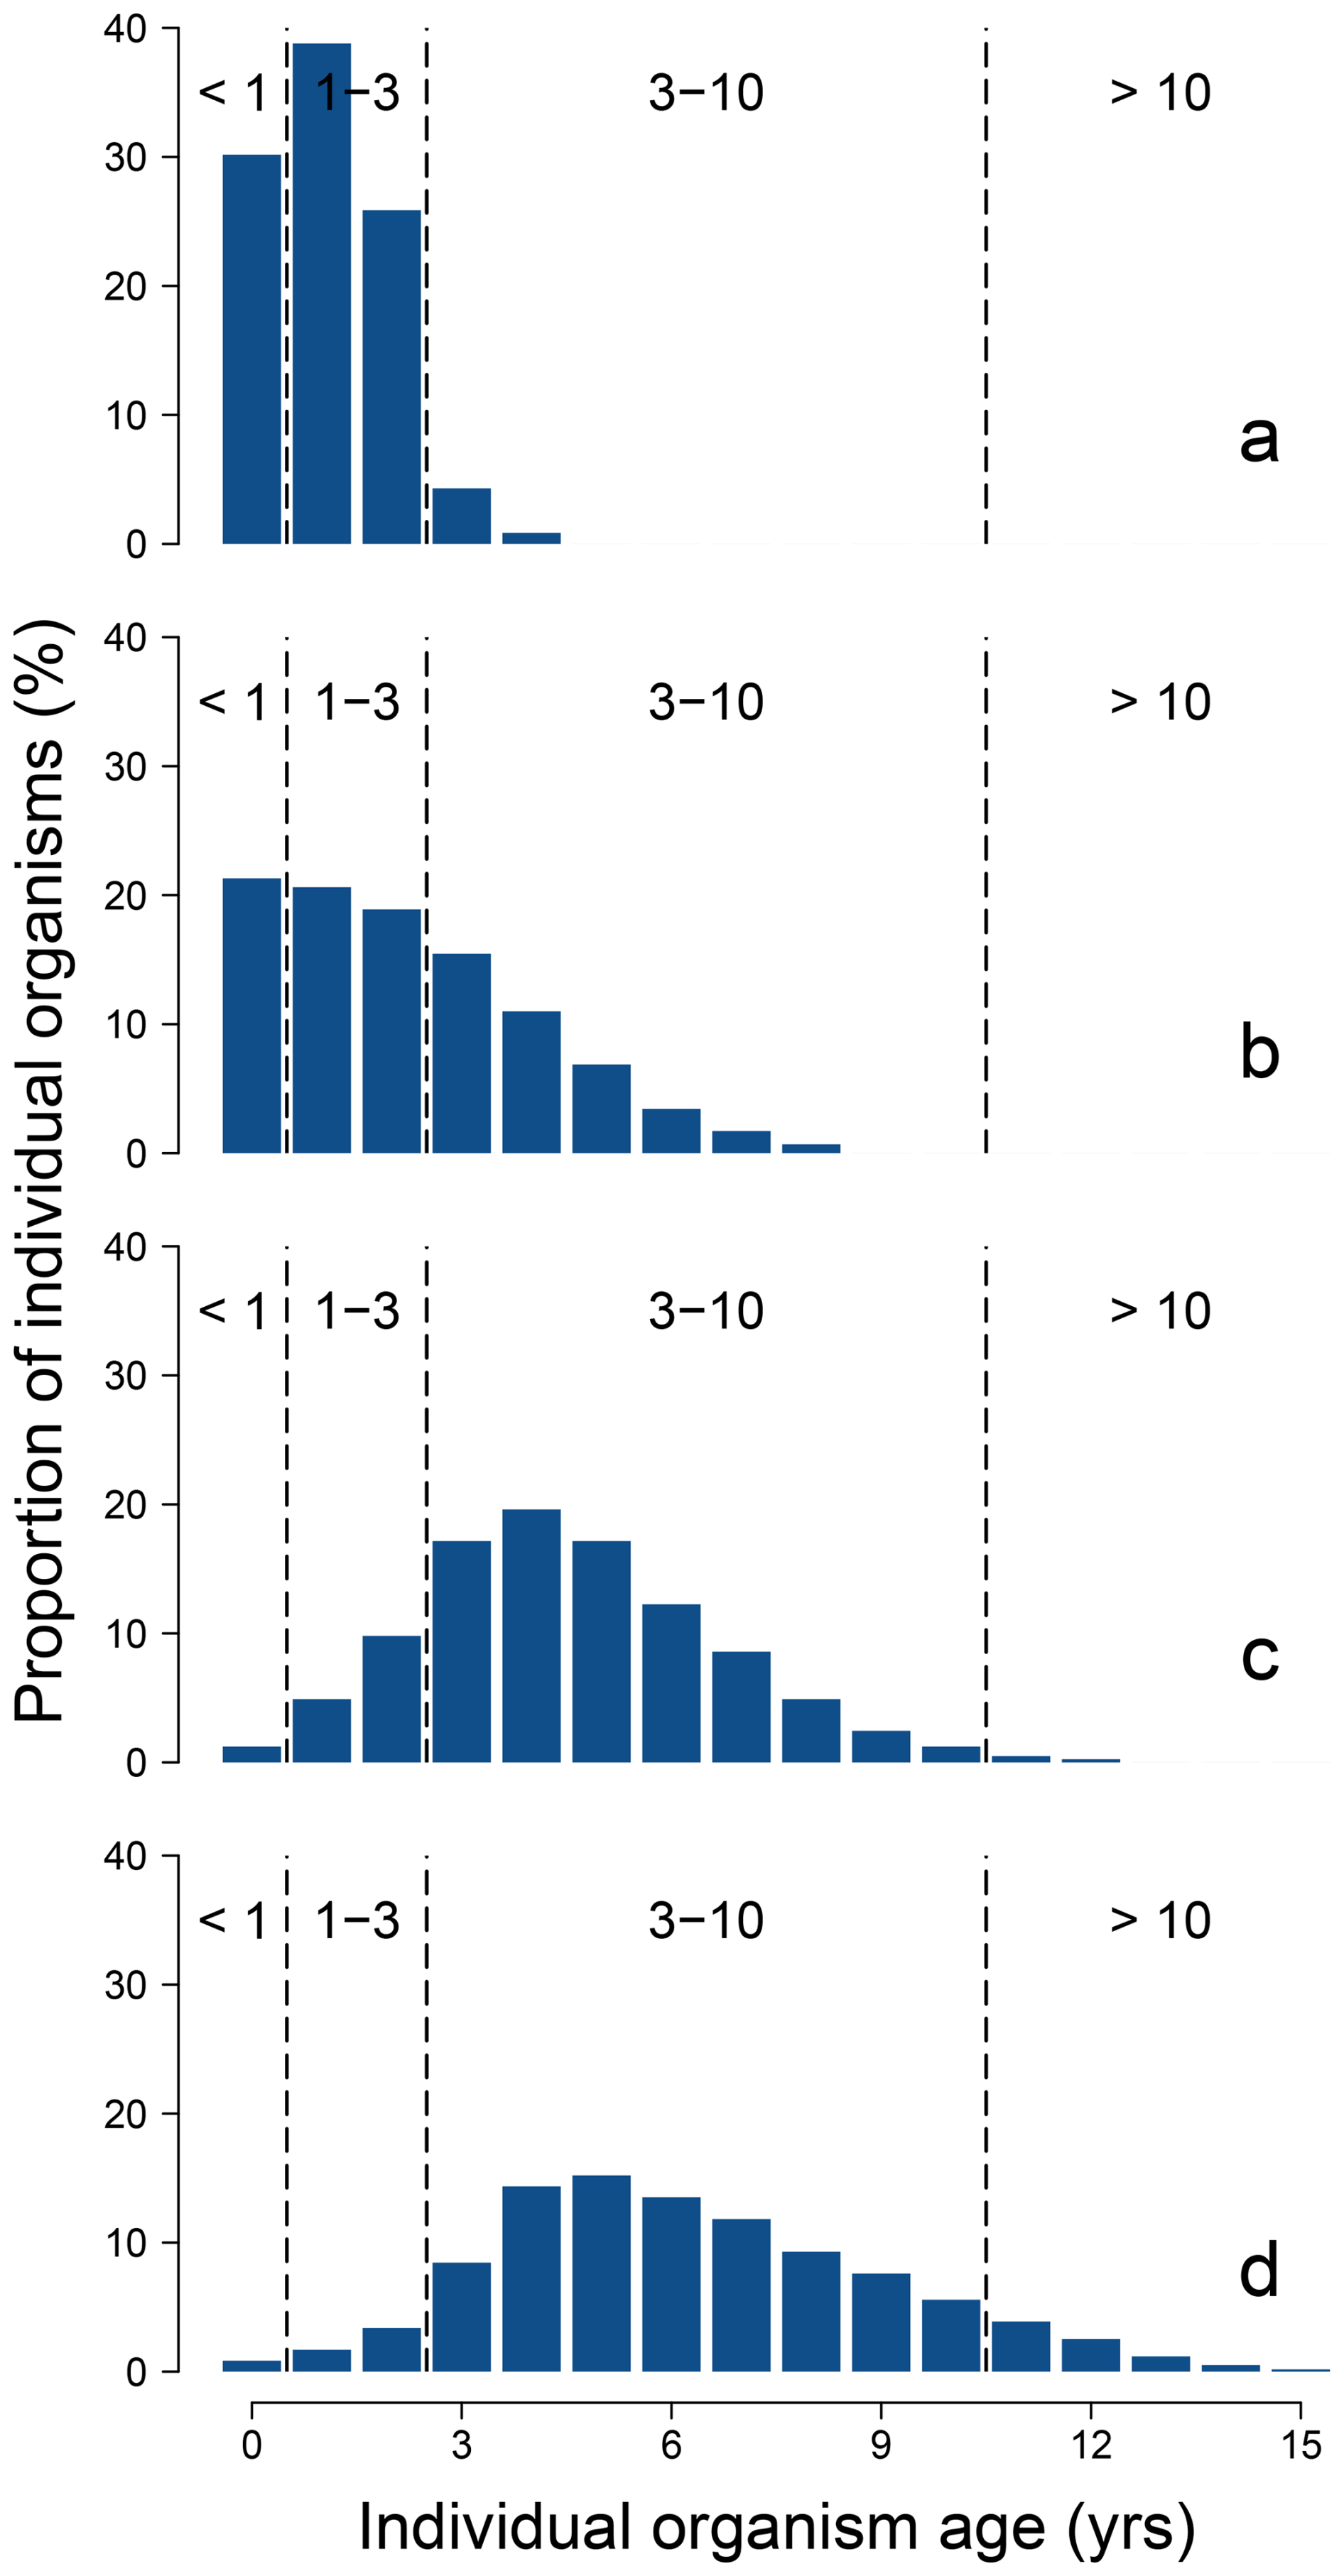
Figure 2Virtual examples of quantitative trait coding. From (a) to (d), distributions of individual organism ages in four populations, all reaching maturity within 1–3 years. The trait is composed of four modalities: <1, 1–3, 3–10 and >10 years. (a) Many individuals reach the third cohort (2–3 years) before massive mortality at 3 years, but some individuals survive until 4 years; a profile of 0/1/1/0 is attributed to the species. (b) As a large part of the population reaches the third modality without reaching the fourth one, a profile of 0/0/1/0 is attributed without ambiguity. (c) 3–10 years also seems to make sense, so 0/0/1/0 can be attributed; however, either the sampling period failed in catching the oldest cohorts or human exploitation or disturbance limits individual growth; therefore, 0/0/1/1 may be more careful. (d) Cohorts older than 10 years are clearly discernable; 0/0/0/1.
Our aim was to document as many species as possible with complete trait information. Starting from a North Sea species pool (Beauchard et al., 2022), the search for additional species was carried out phylum by phylum, and primarily through Google Scholar. Within phylum or other high taxonomic levels (class, order), the search was often finalised with review papers or books documenting either part or complete biology of taxonomically-related species. When no species with substantial amount of information could not be found in the literature, the search was continued within another clade. When detailed distributions of quantitative traits were not available, information was derived from explicitly documented ranges or single values, or estimated according to the data source. In few cases, in short-lived clades, absence of age data was compensated by estimations based on visual analysis of body size distribution. More generally, missing information was dealt with taxonomic proximity, mostly the genus level. In traits highly related to phylogeny such as offspring type or development, and more subjective traits such as body resistance, epi- and endo-bioconstruction types, data were referred to books of general biology when the information was not explicitly provided by specific sources.
Fuzzy data are organised at two levels: numerical scores are attributed to biological modalities, themselves nested within traits. The R package “fuzR” was built to easily handle fuzzy data, and hosts the MacroTraits database (see next section). Trait data are typically used through a species × traits matrix (i.e. autecology × comparative ecology) according to Keddy (1992a). In MacroTraits, since the biological data are provided in a long format table and given the heavy vertical partition of fuzzy data matrices (i.e. trait as blocks of modality-columns), the function “fuz.tab” enables the conversion from long to wide format (Sect. S2.1); it returns a species × trait modalities matrix and a data frame listing the trait and modality labels that enables easy data manipulation.
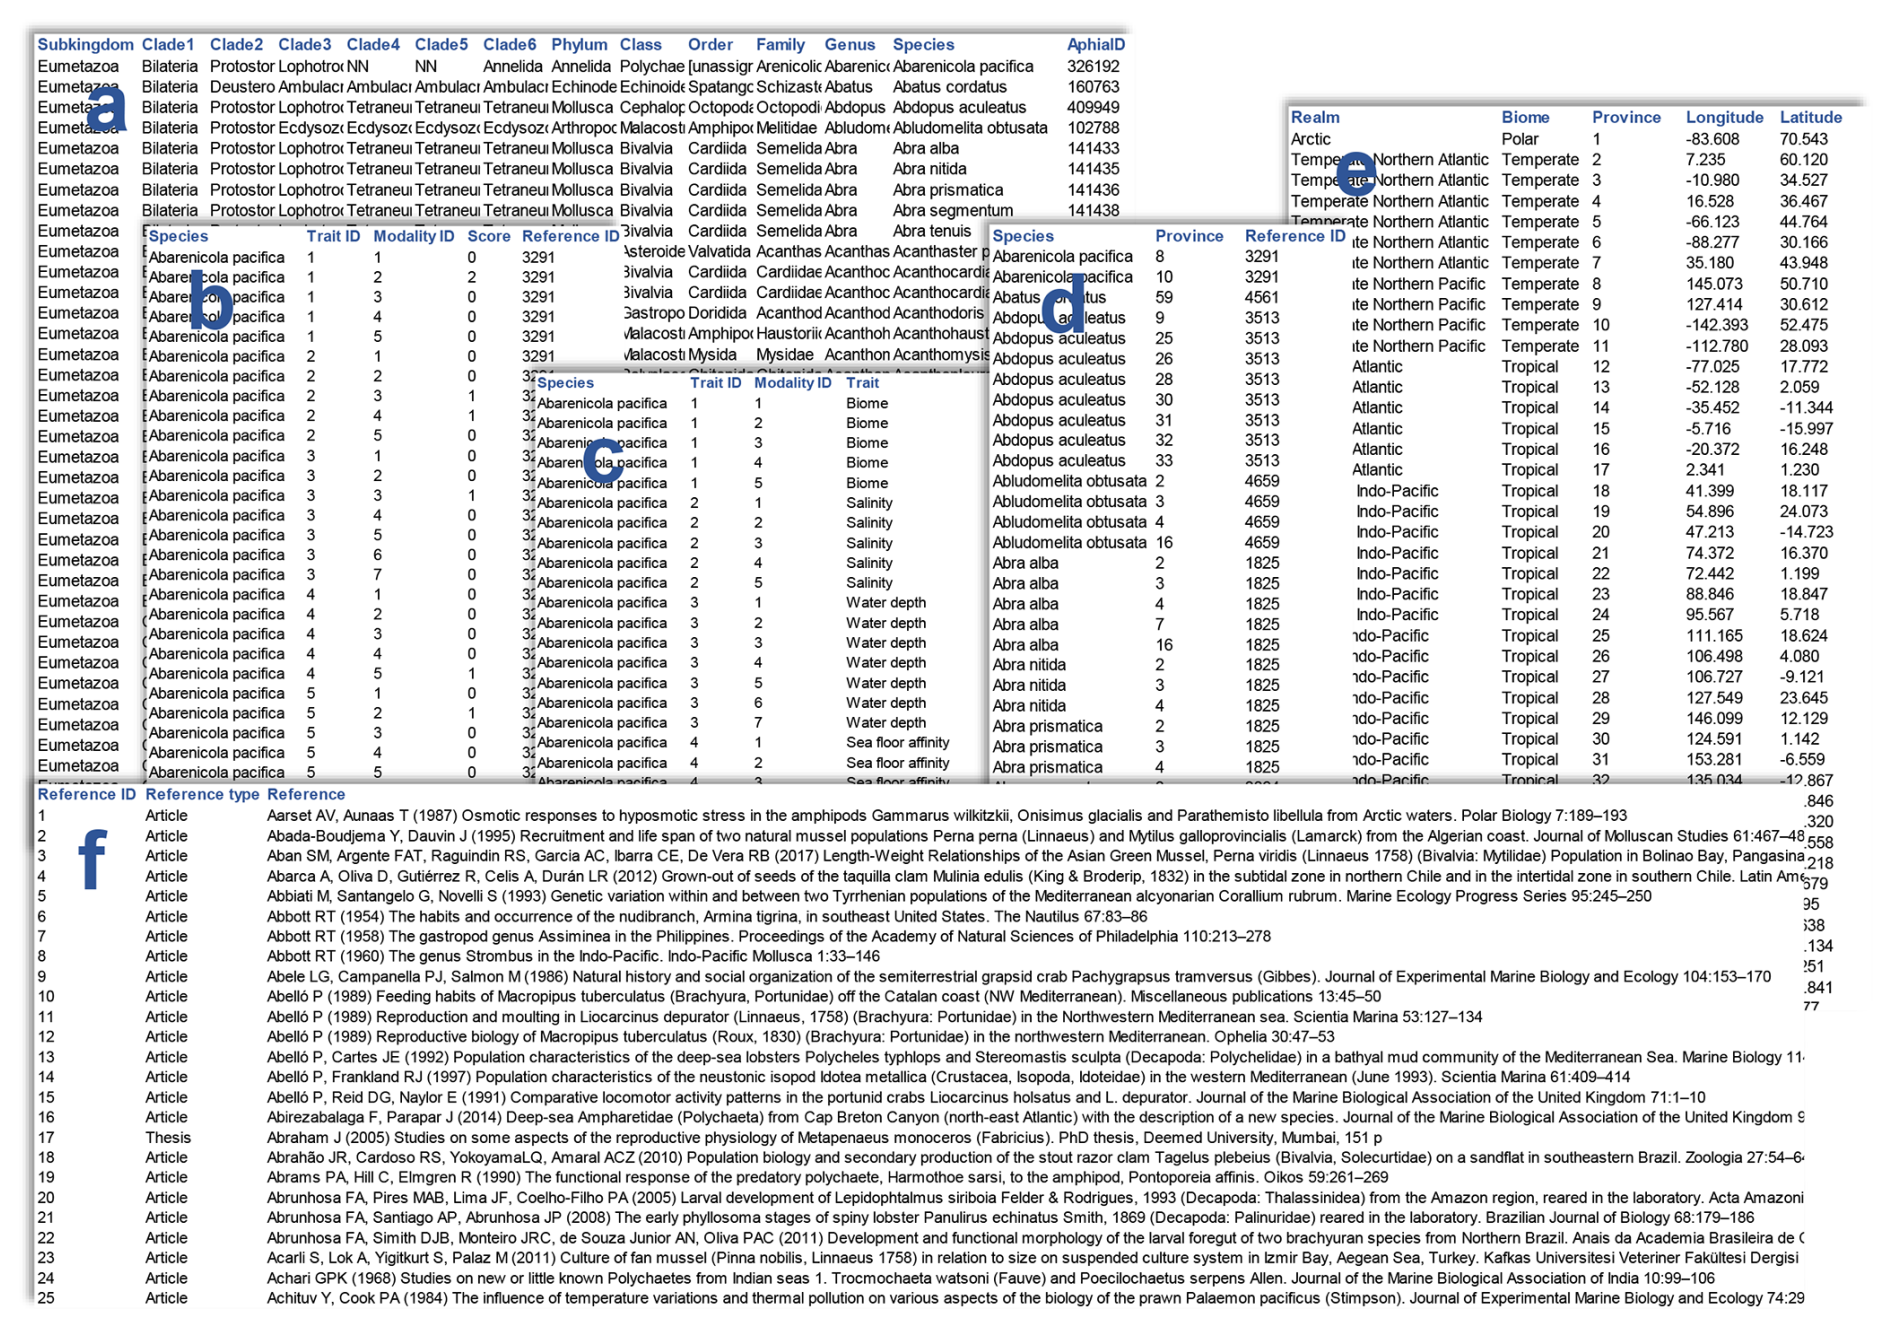
The MacroTraits database is available at https://doi.org/10.5281/zenodo.24318255 (Beauchard and Soetaert, 2026b), and organised in six separate objects (Fig. 3). The first one is a taxonomic table with 1893 species as rows and columns as 13 taxonomic levels, starting from subkingdom (attributing Eumatozoa or Porifera), followed by six successive levels, and continuing from phylum to species (Fig. 3a). The second one is a long-format table with the following fields: species, trait ID, modality ID, score and reference ID (Fig. 3b). The third one is the list of trait and modality labels (Fig. 3c). The fourth one contains the species occurrences among biogeographical units that include realm, biome and province according to Spalding et al. (2007) (Fig. 3d). The characteristics of each biogeographic unit are listed in a fifth object (Fig. 3e). The last one is the list of 8280 references indexed in the second and fourth tables (Fig. 3f). It contains reference ID, the reference itself and the type of reference: peer-reviewed article (7410), proceedings (72), book (196, including book chapter), thesis (366; BSc, MSc or PhD), other academic dissertation (13), report (209) or website (14). For the sake of authenticity and transparency, reference to websites or existing data sets were avoided as much as possible in order to provide original sources. As a result, articles, books, theses and reports represent 98 % of the record documentation (72 %, 16 %, 7 % and 3 %, respectively).
5.1 The documented fauna
The upper phylogeny of the species pool (Fig. 4) was rebuilt according to Love (2009), Giribet (2016) and Bleidorn (2019). From phylum to species, the taxonomy was validated according to the World Register of Marine Species (WoRMS Editorial Board, 2026), with species indexed by their respective Aphia identifier. In general, the more diversified the clade, the larger the number of species documented for traits (Fig. 5). This is especially the case for polychaetes, bivalves, gastropods and malacostracans (from 200 to more than 700 species per class). On average, the documented fauna accounts for 7 % of the known species per class, but only 1.2 % of the total number of species.
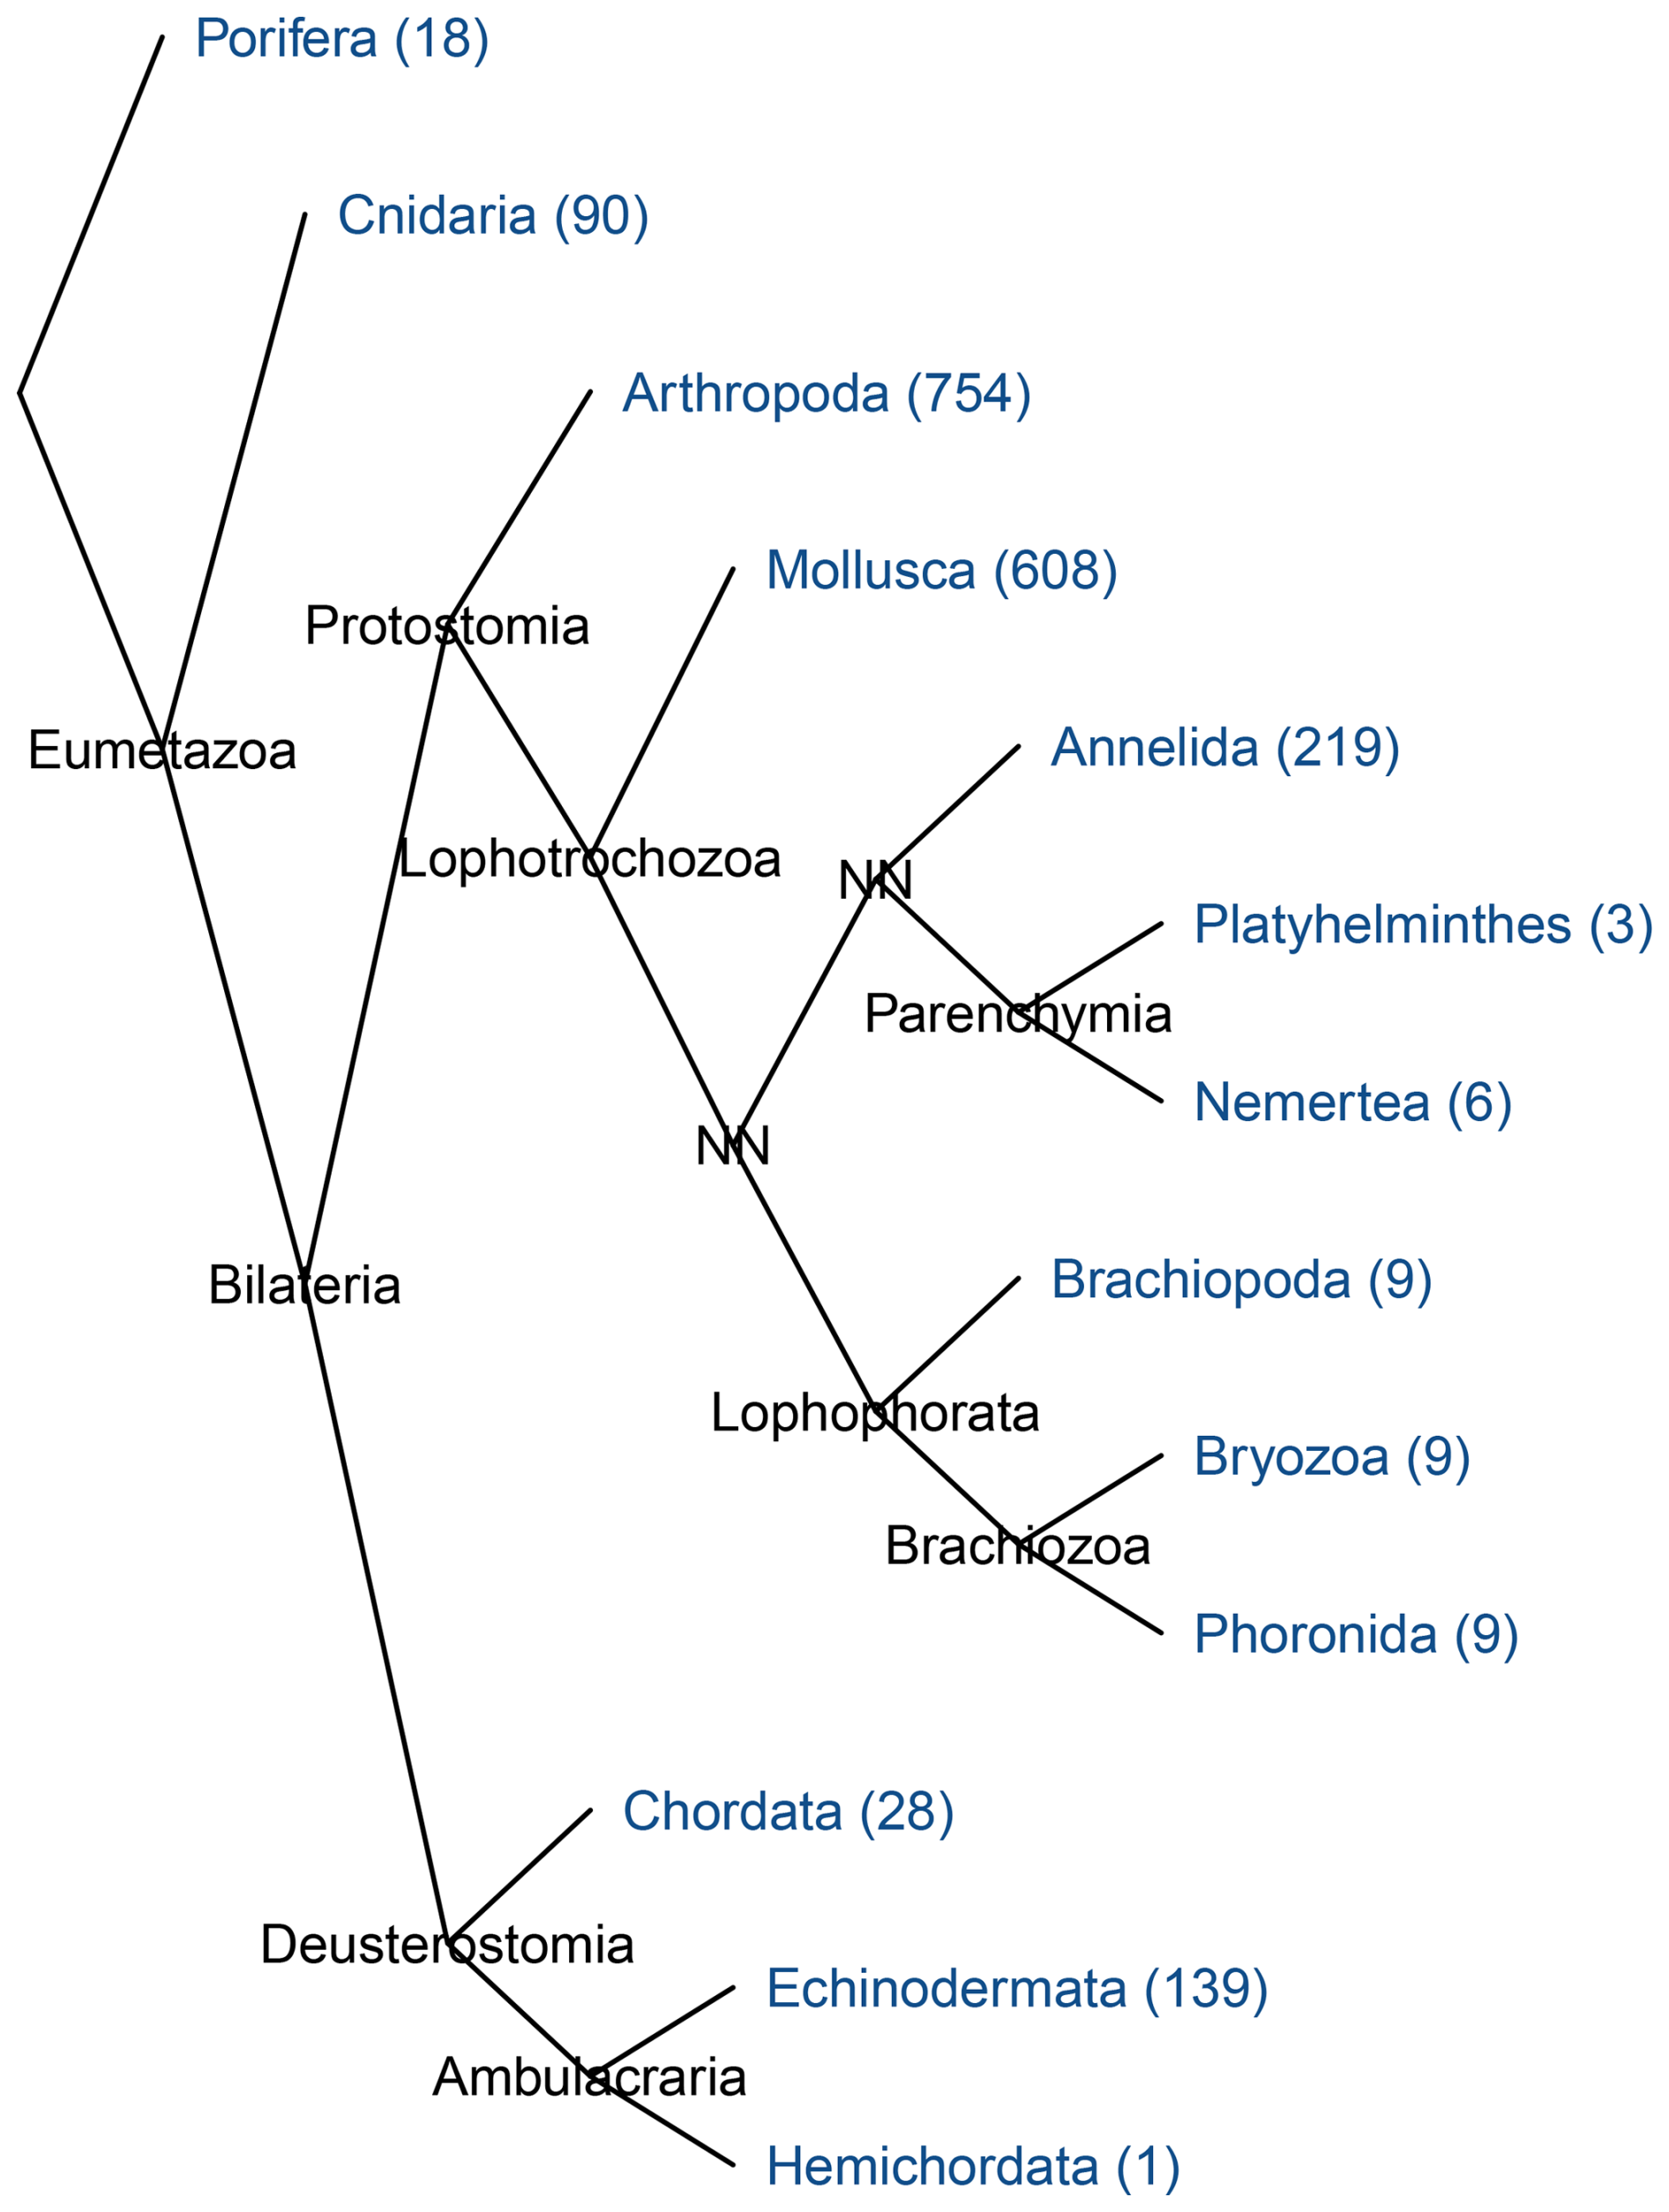
Figure 4Upper phylogenic overview of the documented fauna. NN, no name attributed yet to the clade. In blue, phyla; values within parentheses indicate the numbers of species per phylum documented for traits.
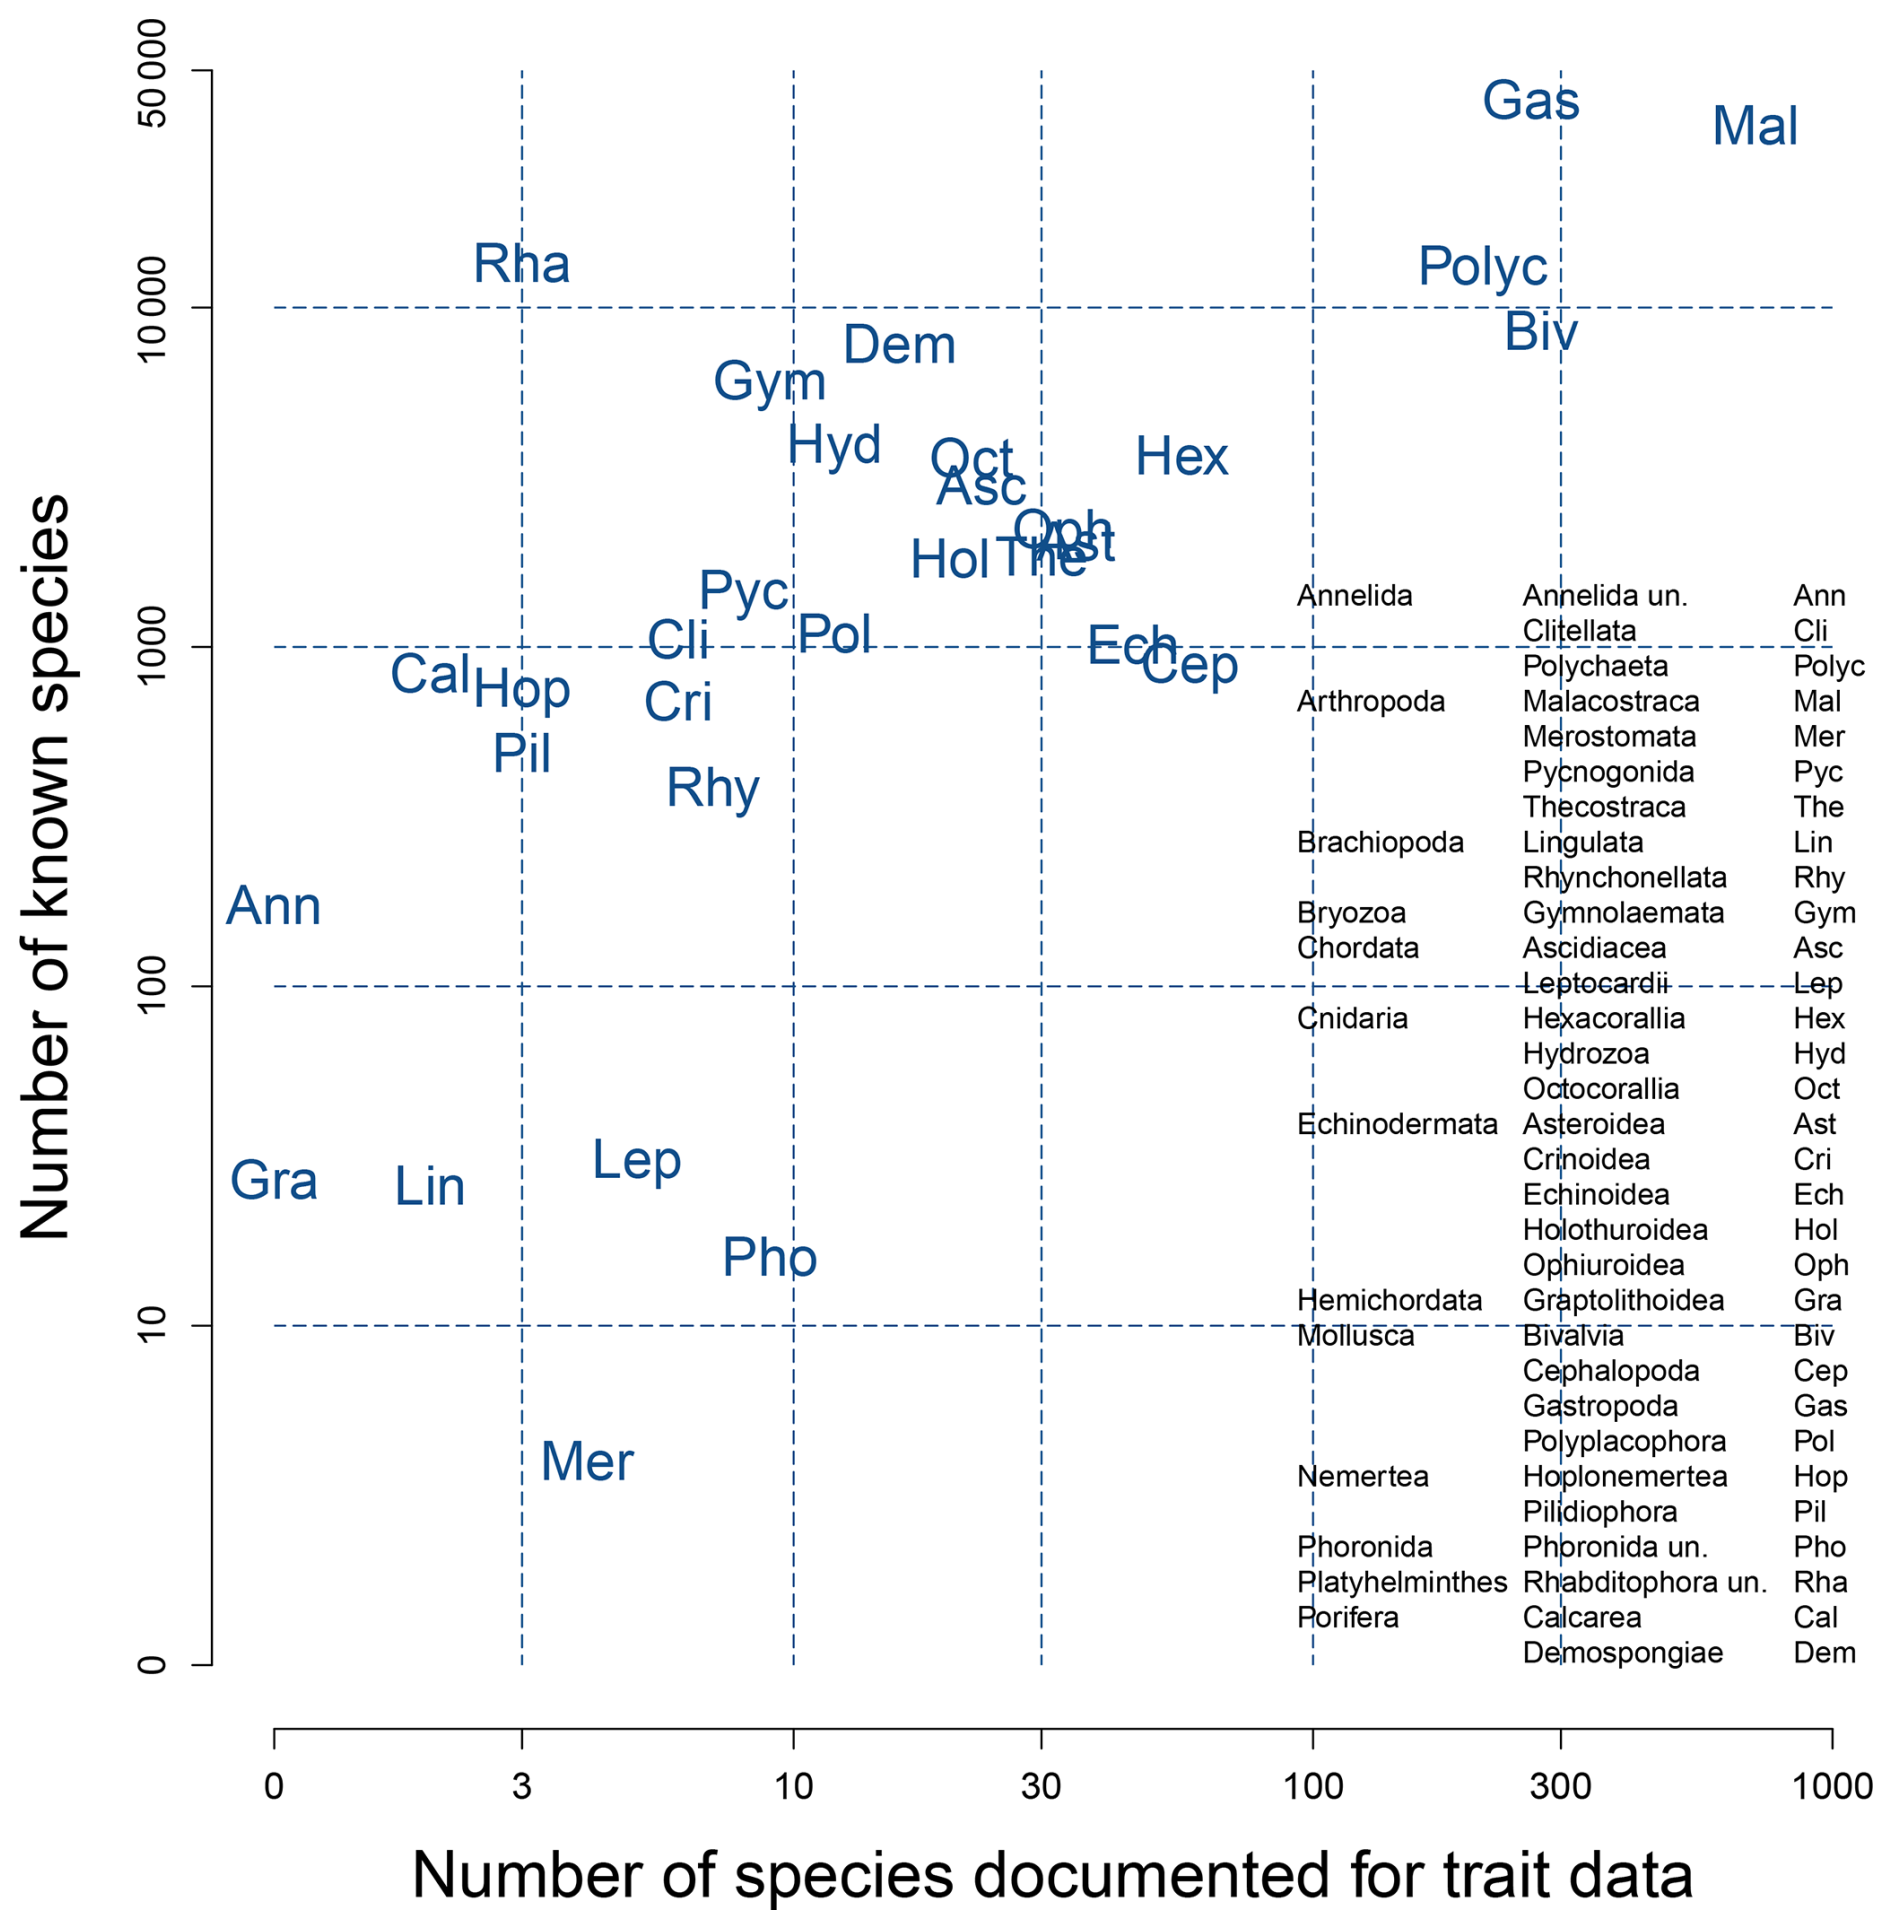
Figure 5Taxonomic representativeness through numbers of species per class level. Y axis, number of species inventoried on the WoRMS platform. Legend, “un.” for “unassigned”.
5.2 Spatial representativeness
9961 species occurrences in biogeographic provinces were recorded. Highest numbers of species documented per province are clearly biased toward regions of the Western World (Fig. 6). This reflects the geography of scientific efforts in the history of marine benthic zoology. European provinces are particularly symptomatic of the strongly uneven data availability among the world regions. To a lesser extent, North American faunas are relatively well documented. Although high numbers of species appear in the Indo-Pacific, many encountered species are distributed over very large extents that overlap. By contrast, scientific deserts occurring in central Pacific and southern regions witness of constraining remoteness. Larger documentation in the Arctic compared to Antarctica may be deceiving: many European and northeast American species distributions range from temperate to polar waters, whereas Antarctic faunas are more biogeographically isolated (Piepenburg, 2005; Clarke, 2008a; Sirenko, 2009).
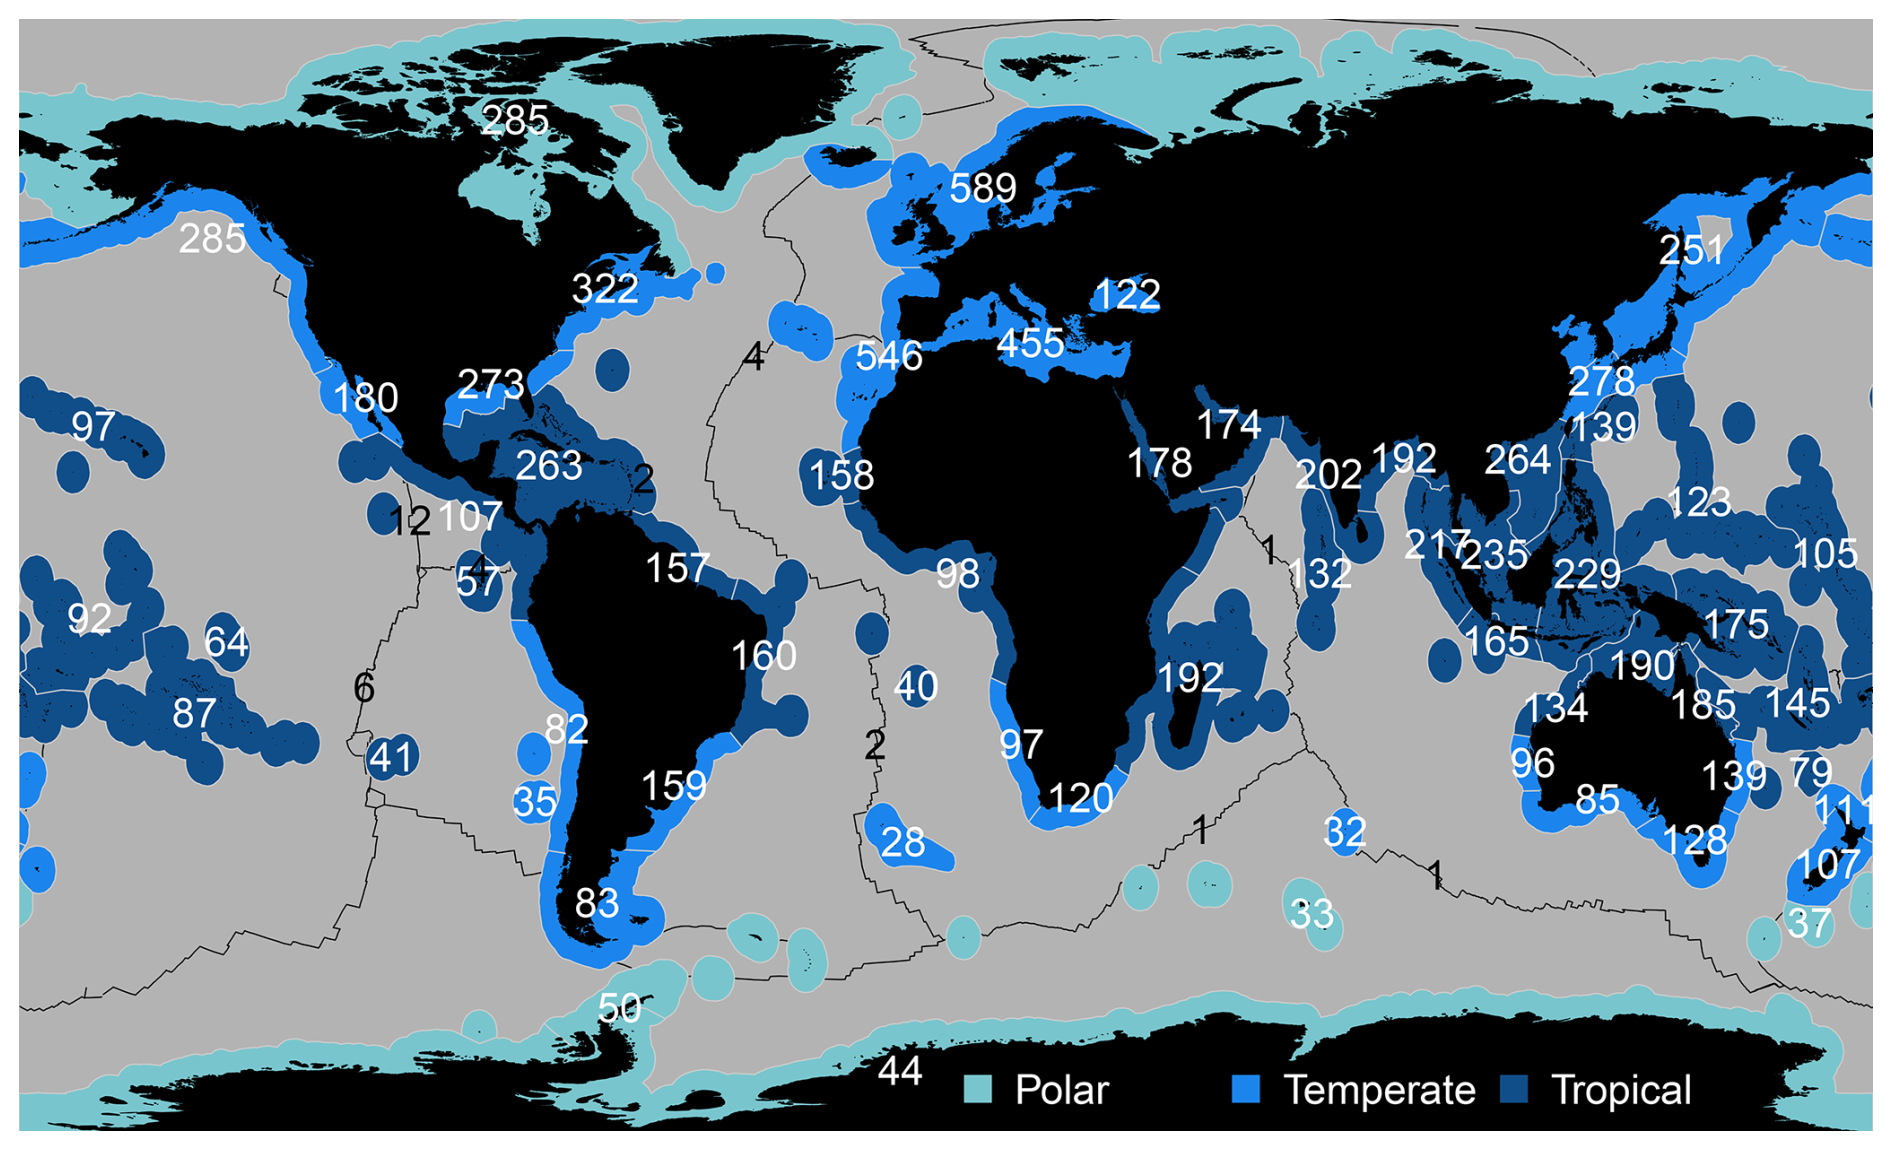
Figure 6Number of documented species per geographic area. Shaded areas (within white delineations), following shelves (<200 m deep) are biogeographic provinces from Spalding et al. (2007). Continuous black lines, tectonic plate boundaries characterised by hydrothermal vents and cold seeps. Species that occur deeper than shelves (>200 m) were attributed the closest provinces. White, numbers of species per province, black, numbers of species along tectonic plate boundaries.
5.3 Historical considerations
A scrutiny of species documentation rate over time can indicate how close the MacroTraits database is to being comprehensive and can appraise further species trait documentation (Fig. 7). Over one and a half century, substantial publishing efforts arose in the 1970s and 1980s, with a peak of information that substantially fueled the database around the year 2000. Then, yearly number of publications spectacularly declined around the year 2010, dropping to almost nil in 2025 (Fig. 7a). Also, much higher number of species in the Western World (i.e. including European and North American provinces) were already documented by the middle of the twentieth century, but the documentation rate decreased around the 1980s everywhere (Fig. 7b and c). This pattern could be expected since publishing the overall material that covers the 41 traits of a species requires a minimum and unshrinkable time. However, highest numbers of publications around the year 2000 enabled full documentation within less than 10 years for many species (Fig. 7d). This large absence of additional species after 2010 could be less expected. Therefore, it seems unlikely that our long-term compilation efforts may have missed a substantial part of the recent literature related to fully documented species if such a literature would have truly existed. Conclusively, while we cannot ascertain that not a single species with complete trait information is missing from MacroTraits, at least these temporal trends suggest that we are nearly close to exhaustiveness.
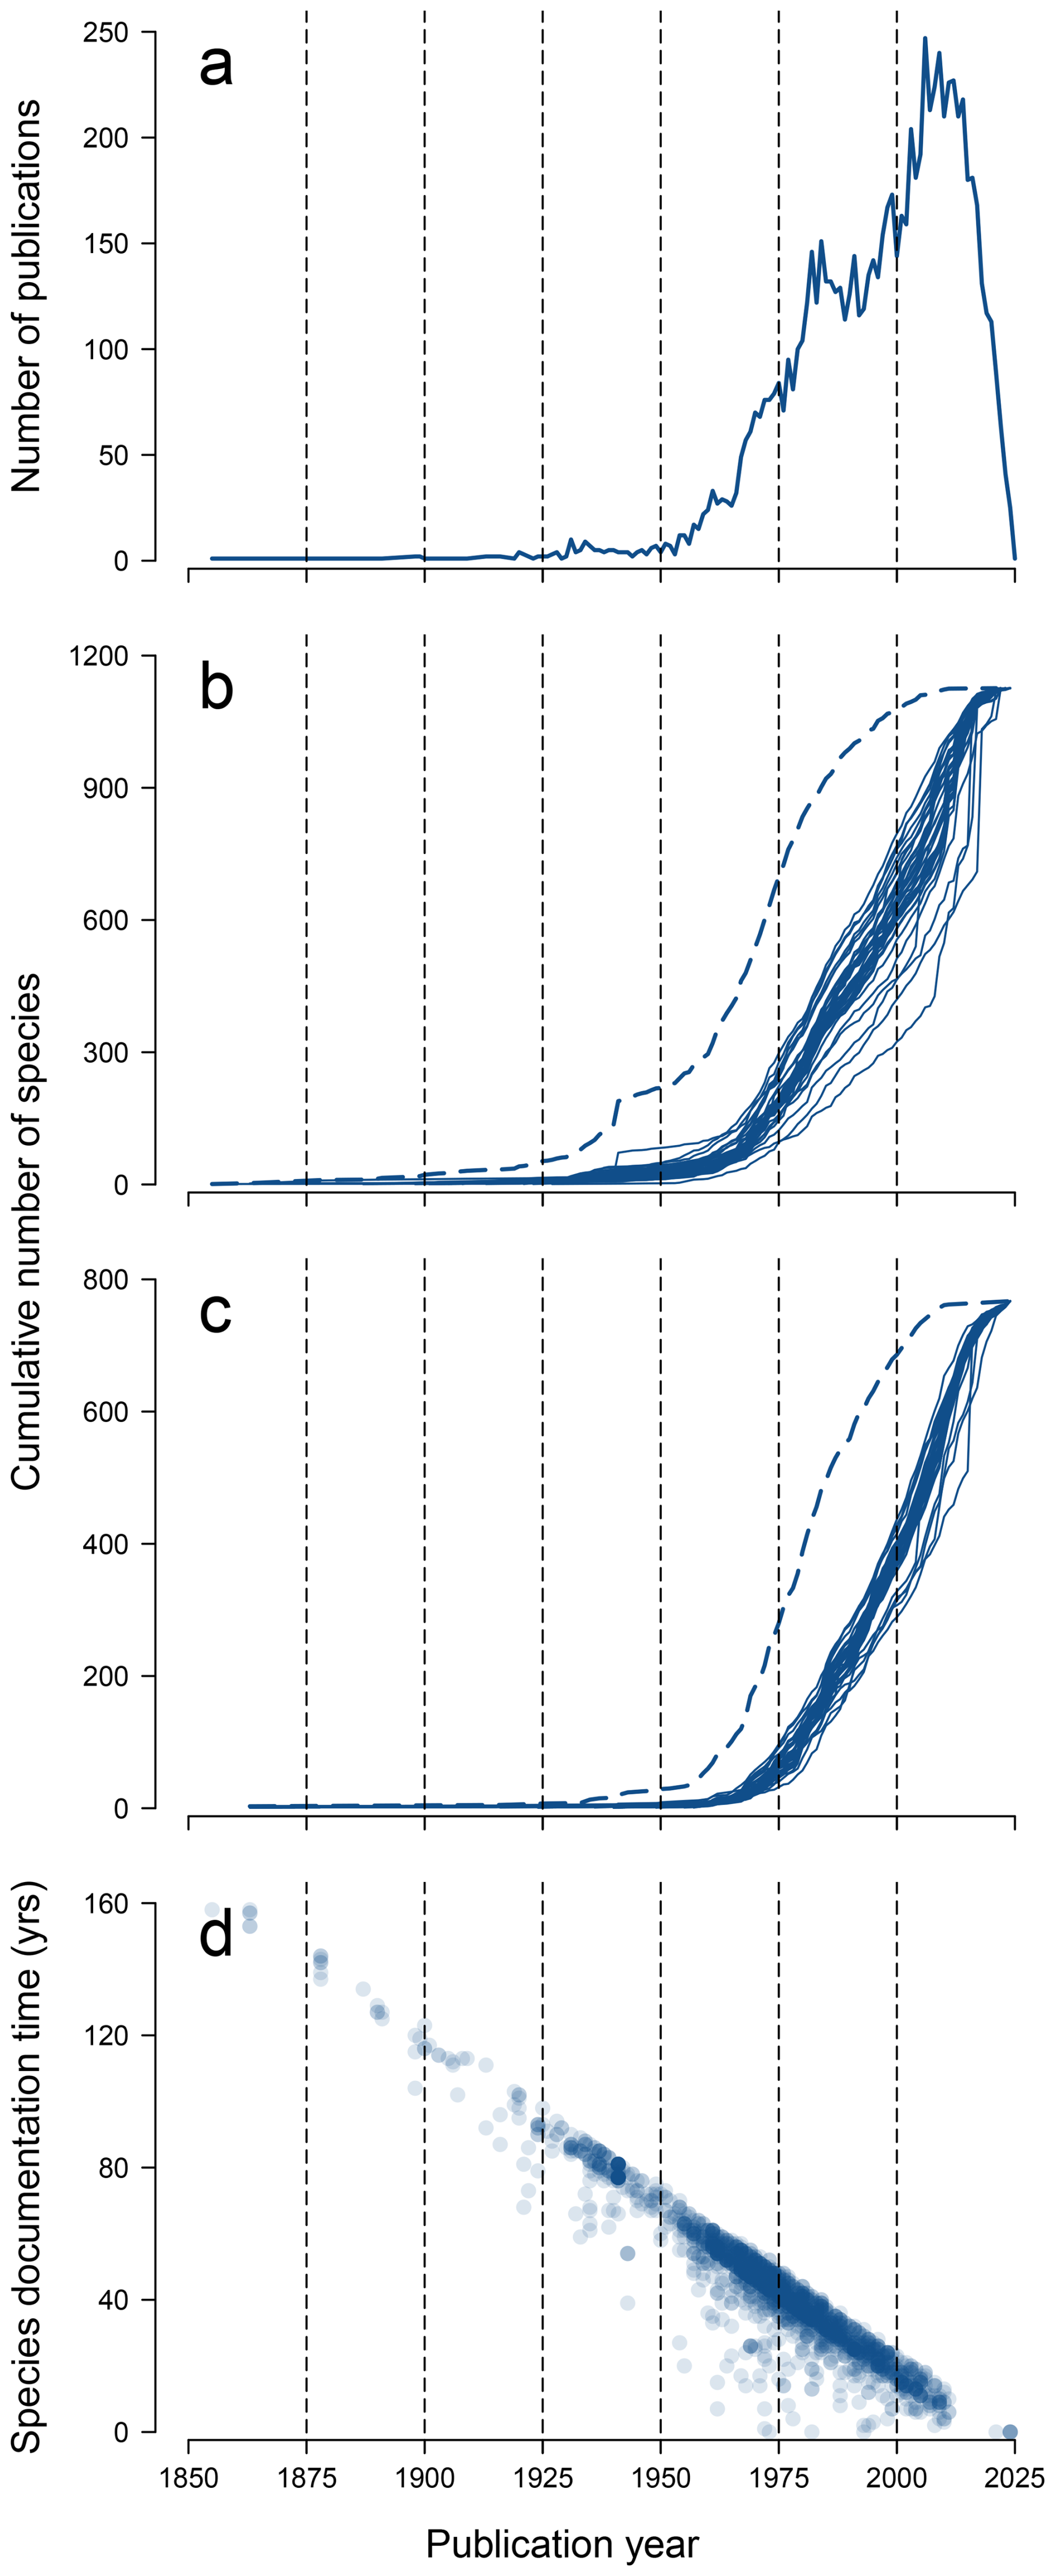
Figure 7Historical publication trends in the field of marine benthic natural history. (a) Annual number of publications that provided a minimum information on biological traits. (b, c) Cumulative number of species documented in the Western World (b) and outside (c); dashed line, earliest year of publication; continuous lines, earliest year per trait. (d) Difference between latest and earliest publication years per species (dot).
5.4 Trait correlation pattern
In order to support the statements in Sect. 3.1 (i.e. degree of specificity for response or effect), the correlation pattern of traits was explored through Principal Component Analysis (PCA; Fig. 8). From each trait, as a species × trait modalities matrix, a species × species Euclidean distance matrix was derived (Gower, 1966) such that species pairs could be correlated following Mantel (1967); this operation converts a trait into a single vector composed of species pair distances. Then, a trait clustering based on Ward's aggregation criterion (Murtagh and Legendre, 2014) was done on trait scores along the most significant PCA axes. The analyses were performed in R 4.5.2 (R Core Team, 2025) with the ade4 package (Chessel et al., 2004; Dray et al., 2007). As a basic rule, multiple expression among habitats, response and effect can be deduced depending on correlation strength. Specific expression (e.g. only response or only effect) can be deduced from the documentation in Sect. 3.2.
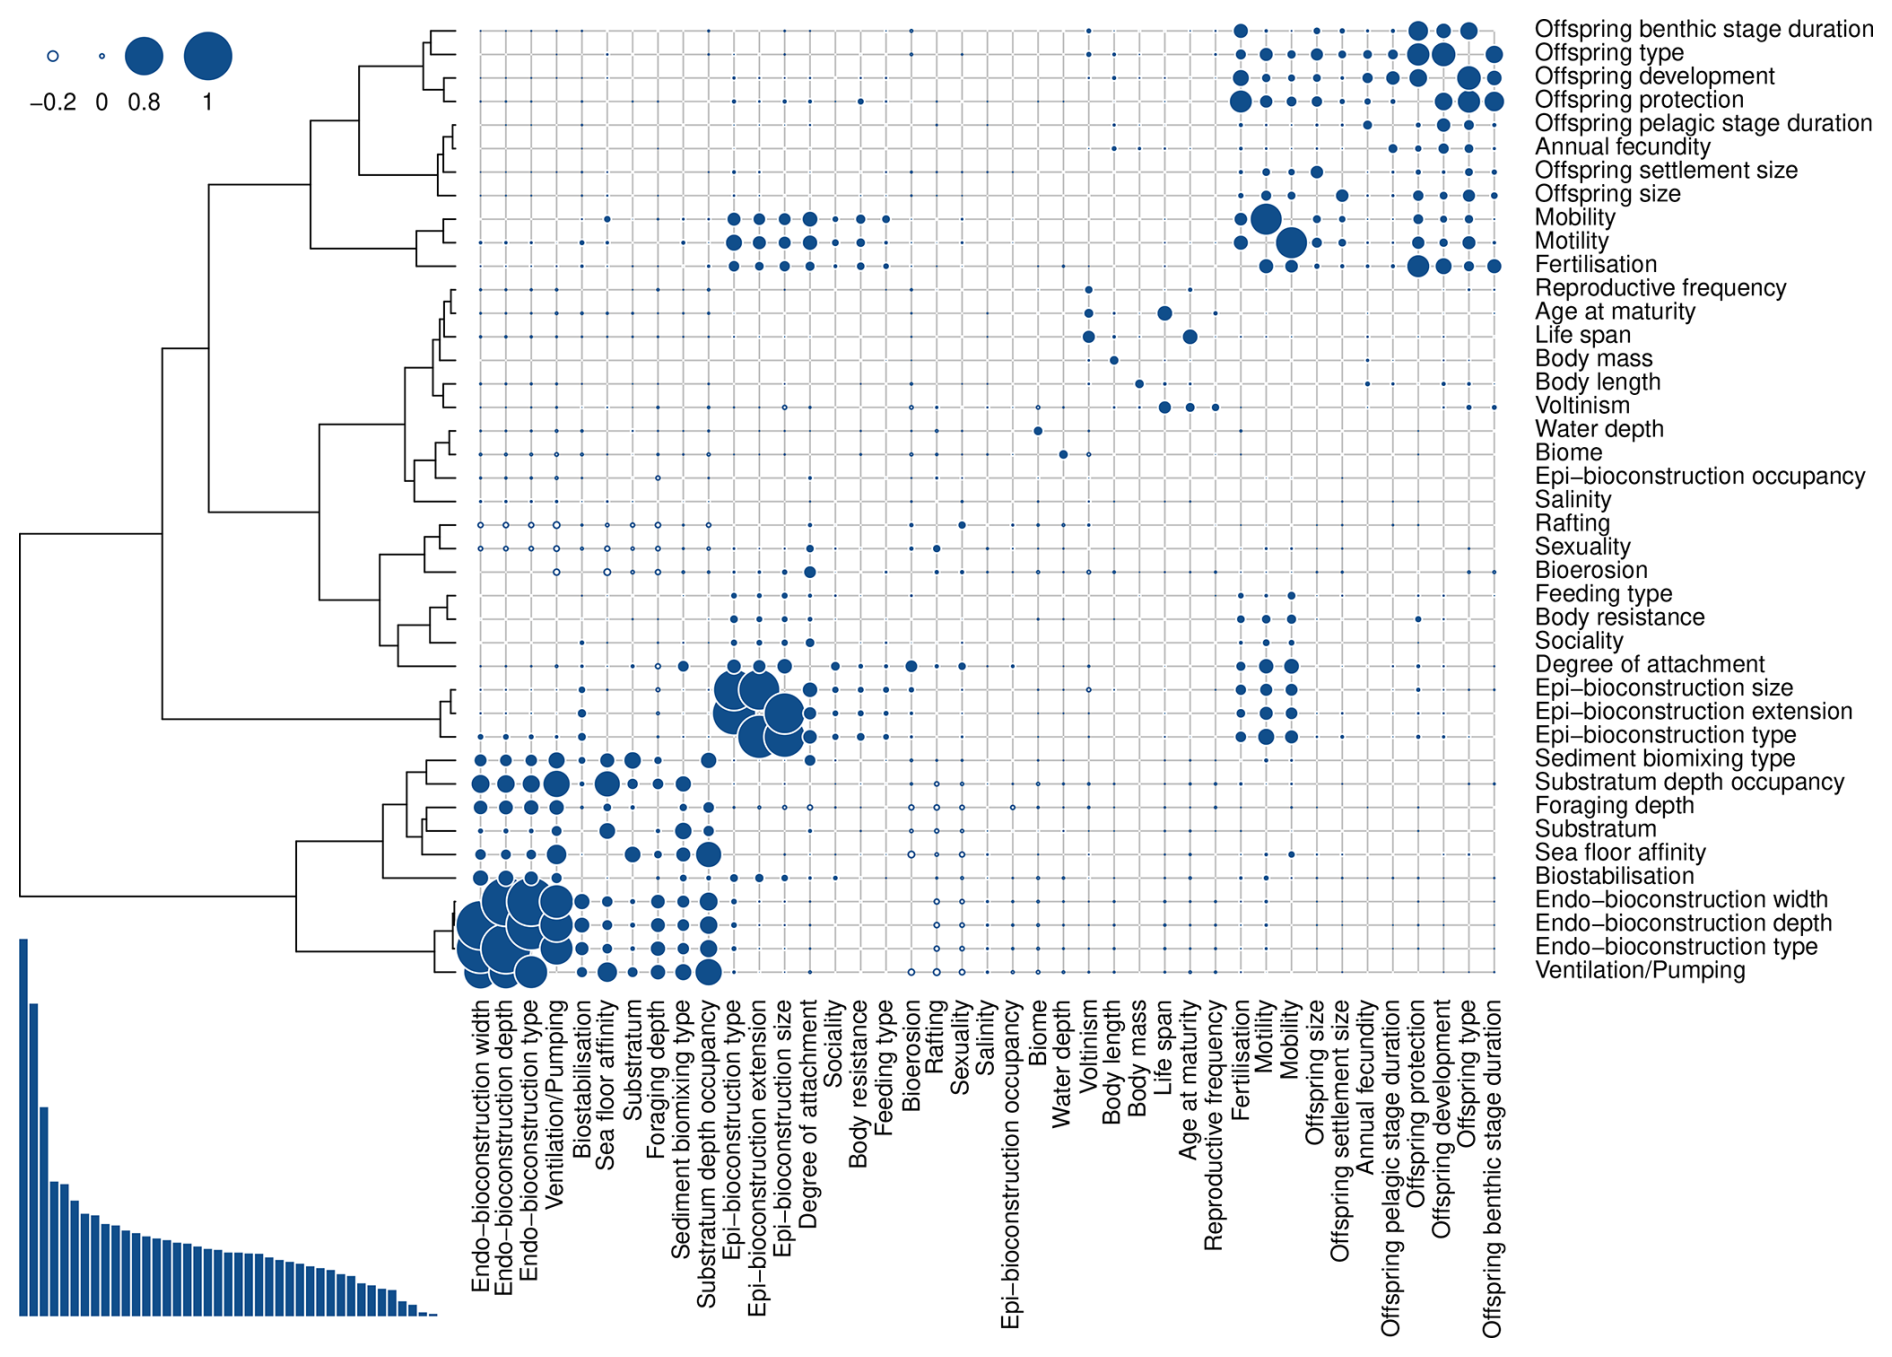
Figure 8Trait pattern according to Principal Component Analysis (PCA) on Mantel's correlation matrix. Trait variables were clustered according their positions along the three first PCA axes that accounted for 12 %, 9 % and 6 % of total inertia, respectively (bottom-left bar diagram). Right, correlation matrix; dot size, proportional to Mantel's correlation coefficient between two traits; see legend in the top-left corner. Low correlations can indicate functional complementarity, but only when trait expression is coherent with research questions (i.e. environmental selection or ecosystem functions; see Sect. 3.1 and Table 1).
On the whole, the correlation matrix displays two main areas of noticeable correlation strengths (Fig. 8). A first one includes bioconstructions, itself split into epibenthic and endobenthic bioconstructions, with traits related to spatial occupancy (sea floor affinity, substratum depth) and sediment engineering (biostabilisation, biomixing). The second cluster relates reproductive and developmental aspects. In between, fertilisation, motility, mobility, body resistance and feeding type are the only traits that exhibit perceptible affinities for both response and effect. This correlation pattern supports most arguments on trait expressiveness in Sect. 3. Besides, absence of correlation within a trait may indicate undetermined expression such as for body mass and body length (i.e. slight involvement in everything); this may also indicate high complementarity within a same expression such as for life span and age at maturity (i.e. within life history, independence of reproductive and developmental modes).
The wide panel of biological traits in the MacroTraits database can foster data analyses in many places and domains of benthic ecology where a sufficient amount of taxa is documented. In case of limited documentation, ecophylogenetic applications provide solutions to trait data gaps. Nowadays, new analytical developments enable users to relate a trait to a phylogeny in order to predict trait modality scores where trait information is missing (Guénard et al., 2013; Goolsby et al., 2017). In any case, MacroTraits data offer a great potential within a wide panel of analytical applications, the data quality being already supported by successful uses of part of the data in response and effect trait pattern analyses (Beauchard et al., 2021, 2022, 2023a, b; Bergagna et al., 2026). Updated or refined version of the present data release can improve the use or development of community disturbance (Beauchard and Soetaert, 2026a) or ecosystem function indices (Queirós et al., 2013; Wrede et al., 2018); see Sect. S3. The unusual consideration of habitat traits could also benefit developments that are currently limited by availability of ecological information at the species level. For instance, in European waters, the EUNIS marine habitat classification (Galparsoro et al., 2012) was built in the absence of species information, except a few iconic ones, which hampers its performance when related to changes in community composition (Cooper et al., 2019). Additionally, the use of habitat traits enables analyses for theoretical predictions when sampling constraints prevent the combination of endo- and epibenthos or in the absence of historical reference due to severe changes induced by human pressures (Beauchard et al., 2023b).
Morphological descriptors were not considered in the database as their expressions regarding fitness components or ecosystem function can be too subjective. Indeed, morphological analogues are rarely functional analogues (Weiss and Courtenay, 2019). Although epibenthic species that form biogenic structures (autogenic engineers) represent an exception (Darling et al., 2012; Fernandez et al., 2020), morphological traits in other groups consist in too soft traits to be significantly helpful in expressing life strategies or precise ecosystem functions. In the marine benthos, there is still no empirical support for using morphological traits as accurate proxies of fitness. In the absence of hard response traits, instead of morphology, anatomical traits are more explicit descriptors of some functional aspects (Mendes et al., 2025).
In marine benthic ecology, several efforts were recently made to classify traits, discern different types of achievements or envision new directions (Costello et al., 2015; Lam-Gordillo et al., 2020a, b; Martini et al., 2021; de Juan et al., 2022; Lam-Gordillo et al., 2023; Morim et al., 2023; Gimenez et al., 2024). According to the terminology from previous works and synthetised here, it is obvious that a trait can have multiple expressions. However, our correlative analysis showed that sets of independent traits can be distinguished (Fig. 8). On the one hand, traits linked to reproduction and ontogeny, typically inter-related through trade-offs, can be distinctly considered as deprived of significant expression of ecosystem function, and probably represent the purest descriptors of population persistence in response to specific environmental variations. On the other hand, traits linked to substratum relations and bioconstructions have clear expressions of sea floor engineering functions. In between, trait correlated to these two extreme clusters, mostly associated to dwelling mode and adult dispersal, seem complementary for relevant trait selections in respect to research questions. Alterations of the highlighted pattern in Fig. 8 are not excluded when focusing on more local species pools, but important deviations are unlikely given strong phylogenetic implications in trait correlations (McHugh and Rouse, 1998). Hence, our analysis provides robust baselines to limit some confusions persisting within the scientific community whereby some traits are said to be of major importance without deepened justification. For instance, body size (i.e. length or mass) can be, on the one hand, considered important as regards its physical prominence and variation among species. On the other hand, its functional expression is diffused in so many processes that this trait poorly discriminates response from effect; as a result, body size is not substantially correlated to any of the other traits. Therefore, a relevant trait selection prior to data analysis should consider two aspects, trait expression that is the functional specificity to response or effect, and trait expressiveness as the degree of functional involvement or significance in the studied process. Many traits documented in MacroTraits are very likely involved in both response and effect, while some of them are highly specific to one of the two processes (Table 1, “”), next to a few ones with lower expressiveness ( or + as a weaker proxy).
These clarifications on the response-effect trait duality do not unconditionally exclude implications of the most specific response traits in ecosystem function, especially non-engineering functions (Fig. 1). While our assessment of trait relevance holds for a direct use of the response traits as they are provided in this database (especially the reproductive ones; see Sect. S5), a combined use of those traits with others can be useful to explore potential ecosystem functions. The notion of effect is particularly related to organism body size, an auxiliary trait needed to express the level of magnitude of environmental effect induced by an individual organism. In this context, effect and quantity should be understood as synergistic. As an example, let us reconsider reproductive traits: while fecundity alone represents a simple number neutral to ecosystem function, its multiplication by offspring size generates a synthetic trait representing a potential amount of food resource for other organisms (e.g. egg dispersal in the water column). Furthermore, multiplying this new trait by pelagic stage duration of the propagule provides a dispersive dimension to potential food resource or organic carbon over space. Similarly, the combinations of body mass, mobility and life span express the same functions in the adult stage. Note that score attribution and standardisation of traits must be done prior to calculation; see Sect. S3 for examples on reproductive and bioturbation traits. Except in the special case of bioturbation (Swift, 1993; Solan et al., 2004), the use of such synthetic traits seems to be absent from current researches, but it could open new avenues for describing benthic patterns in ecosystem functions.
Finally, the phrasings “trait-based ecology”, “trait-based approach” or “biological trait analysis” have emerged with the possibility of integrating species traits in the study of biodiversity (de Bello et al., 2021a). While the scientific community is striving in that direction, it is important to remind that community ecology, the study of species composition in space and time, remains the key ingredient to quantify biodiversity. Community ecology is the mother discipline in which traits represent only a piece of the puzzle that also includes environmental, taxonomic and genetic information. Hence, there is no exclusive “trait science”, species distribution being the observation of central importance. However, in community ecology with functional emphasis, no significant research outcome is possible in the absence of natural history that safeguards competences in taxonomy and species autecology, and that represents the fabric of biological traits. The MacroTraits bibliography is very demonstrative of issues on scientific vision and recruitment policy within universities and public institutes, which are extremely penalising for biodiversity research. Figure 7 materialises earlier warnings from the marine domain (Dayton, 2003; Able, 2016), and more widely from general ecology regarding the dramatic decline of natural history (Gaston and May, 1992; Greene, 2005; Engel et al., 2021; Nanglu et al., 2023). We are now facing an unbelievable paradox whereby concerns on marine benthic biodiversity are accompanied by a loss of the means needed to understand those concerns. As a graphic example, the North Sea sediment macroinvertebrate fauna, within a biogeographic province among the most documented for traits (Fig. 6), encompasses nearly 1000 species (Heip et al., 1992; Künitzer et al., 1992). Nowadays, a complete biological trait documentation can be achieved for less than 300 of those species or genera (Beauchard et al., 2022; Sect. S5); although the most dominant taxa are documented, this example is particularly indicative of data deficiency in areas outside the Western World and in the deep seas. Therefore, a new scientific vision rethinking the importance of community ecology is required to counteract current and future research shortcomings in biodiversity assessments.
The MacroTraits database is accessible within the R package fuzR in the Zenodo repository https://doi.org/10.5281/zenodo.24318255 (Beauchard and Soetaert, 2026b).
Although calls for harmonising marine benthic trait data and terminology have come up (Costello et al., 2015; de Juan et al., 2022; Morim et al., 2023; Susini et al., 2025), there is still a large absence of concrete international initiative to provide and maintain a standard zoobenthic trait data bank, and this may persist without clear research agenda. To this end, the response-effect trait dichotomy, established long ago (Lavorel and Garnier, 2002), remains essential. Such an agenda should prioritise evolutionary aspects, still insufficiently addressed in community ecology of the marine benthos. The identification of response trait combinations from which specific life-history strategies emerge among the different marine environments represent a basic but crucial need to understand faunal responses to natural and human-mediated pressures, including climate change. In parallel, this could enable more relevant vulnerability analyses along gradients of effect trait composition (Oliver et al., 2015; de Bello et al., 2021b). In this paper, we showed what was achievable in terms of trait documentation and that the MacroTraits database paves the way toward such a general framework. Relevant biological trait data must be congruent with a scientific vision as exposed in this paper, and the proposed system and associated terminology strongly fulfill this essential condition.
The document provides analytical support to the simplification of fuzzy coding. Depending on the considered data set, quantitative scores of species affinities for trait modalities exhibit variable ranges. While 0 clearly expresses no affinity, maximum non-null values can be 1, 3, 5 or more. The precision of score attribution certainly depends on the biological background of the data designer or the available literature. Such conditions are not always met to attribute values > 1 with minor subjectivity. However, to our knowledge, the relevance of values > 1 does not seem to have been questioned. Here, fuzzy trait data sets are confronted to their simplified 0–1 versions, and we provide the accompanied R script (R Core Team, 2025).
In community ecology, fuzzy coding of biological trait data was popularised by Chevenet et al. (1994) as part of a special issue of Freshwater Biology (Townsend and Hildrew, 1994) in which several application examples on plants and animals were provided. Such data sets were built by highly experienced biologists from the second half of the twentieth century (Statzner and Bêche, 2010). Therefore, those data sets represent a kind of reference in terms of data quality from an experimental perspective. In that special issue, Chevenet et al. (1994) exemplified the use of fuzzy coding with an ecological trait data set on aquatic Coleoptera (110 species × 32 modalities from 9 traits; Bournaud et al., 1992); trait modality scores range from 0 (no affinity) to 6 (highest performance). The data are available in the ade4 package (Chessel et al., 2004; Dray et al., 2007). In order to assess the relevance of scoring range in multivariate ordination of species and traits, the original data table (0–6 scores) was fuzzy coded as done in Chevenet et al. (1994) before being compared to its 0–1 version.
library(ade4)

data(coleo)
tab1 <- coleo$tab

fuz1 <- prep.fuzzy.var(df = tab1, col.blocks = coleo$col.blocks)
Then, every value greater than one was replaced by one, and the table was fuzzy coded.
tab2 <- data.frame(ifelse(tab1 == 0, 0, 1))

fuz2 <- prep.fuzzy.var(df = tab2, col.blocks = coleo$col.blocks)
As the two fuzzy tables are matched by species, they can be related by the RV coefficient, an index varying between 0 (no multivariate co-structure) and 1 (perfect co-structure), equivalent to Pearson's r coefficient in a multivariate space (Escoufier, 1973). The similarity of the two multivariate structures (“co-structure”) can be tested against the null hypothesis by randomly permuting the rows of one data frame, which breaks the relationship between the two. By this way, a null distribution of 999 simulated RV coefficients was generated to assess the significance of the observed RV value.
RV.rtest(df1 = fuz1, df2 = fuz2, nrepet = 999)
Monte-Carlo test

Call: RV.rtest(df1 = fuz1, df2 = fuz2, nrepet = 999)

Observation: 0.9886374
Based on 999 replicates

Simulated p-value: 0.001

Alternative hypothesis: greater
Std.Obs  Expectation     Variance

7.599942e+01 2.569097e-02 1.605402e-04
The two data frames are almost perfectly similar (RV = 0.99, p<0.001), which means that modality scores > 1 do not significantly change the species trait pattern. This can be graphically illustrated by Co-Inertia Analysis (CoIA; Dray et al., 2003). The two data frames were firstly processed by Fuzzy Correspondence Analysis (FCA; Chevenet et al., 1994), after what the two FCAs were combined into CoIA (Fig. A1).
fca1 <- dudi.fca(df = fuz1, scannf = FALSE)

fca2 <- dudi.fca(df = fuz2, scannf = FALSE)

coia <- coinertia(fca1, fca2, scannf = FALSE)
layout(matrix(c(1, 1, 2, 3), nr = 2), width = c(1, 0.5))

par(bty = "n", cex.lab = 1.5)

s.match(coia$mX, coia$mY, clab = 0, cpoint = 2.5, grid = FALSE,

xlim = c(-1.5, 2.5), ylim = c(-2.5, 2.0),

sub = "a", possub = "topleft", csub = 4)

text(-1.3, 0.15, "Axis 1", cex = 2, font = 3)

text(-0.15, -2.2, "Axis 2", cex = 2, font = 3, srt = 90)

par(mar = c(4.5, 5, 1, 1))

plot(coia$mX[,1], coia$mY[,1], xlim = c(-1.5, 2.5), ylim = c(-1.5, 2.5),

bty = "n", pch = 20, cex = 1.5, xaxt = "n", yaxt = "n",

xlab = "First axis score", ylab = "First axis score")

axis(side = 1, seq(-1.5, 2.5, 1), cex = 0.8)

axis(side = 2, seq(-1.5, 2.5, 1), cex = 0.8)

mtext(side = 3, "b", cex = 2.5, adj = 0.9, line = -17)

plot(coia$mX[,2], coia$mY[,2], xlim = c(-2.5, 2.5), ylim = c(-2.5, 2.5),

bty = "n", pch = 20, cex = 1.5, xaxt = "n", yaxt = "n",

xlab = "Second axis score", ylab = "Second axis score")

axis(side = 1, seq(-2.5, 2.5, 1), cex = 0.8)

axis(side = 2, seq(-2.5, 2.5, 1), cex = 0.8)

mtext(side = 3, "c", cex = 2.5, adj = 0.9, line = -17)
Another example can be drawn from Statzner et al. (1997) that finely covers the reproductive biology of 131 aquatic insect species through the 41 modalities of 10 traits documented by internationally recognised experts. The same methodology was applied, and CoIA revealed a strong co-structure between the original fuzzy-coded data frame (0–3) and the simplified one (0–1); RV = 0.98, p<0.001 (Fig. A2).
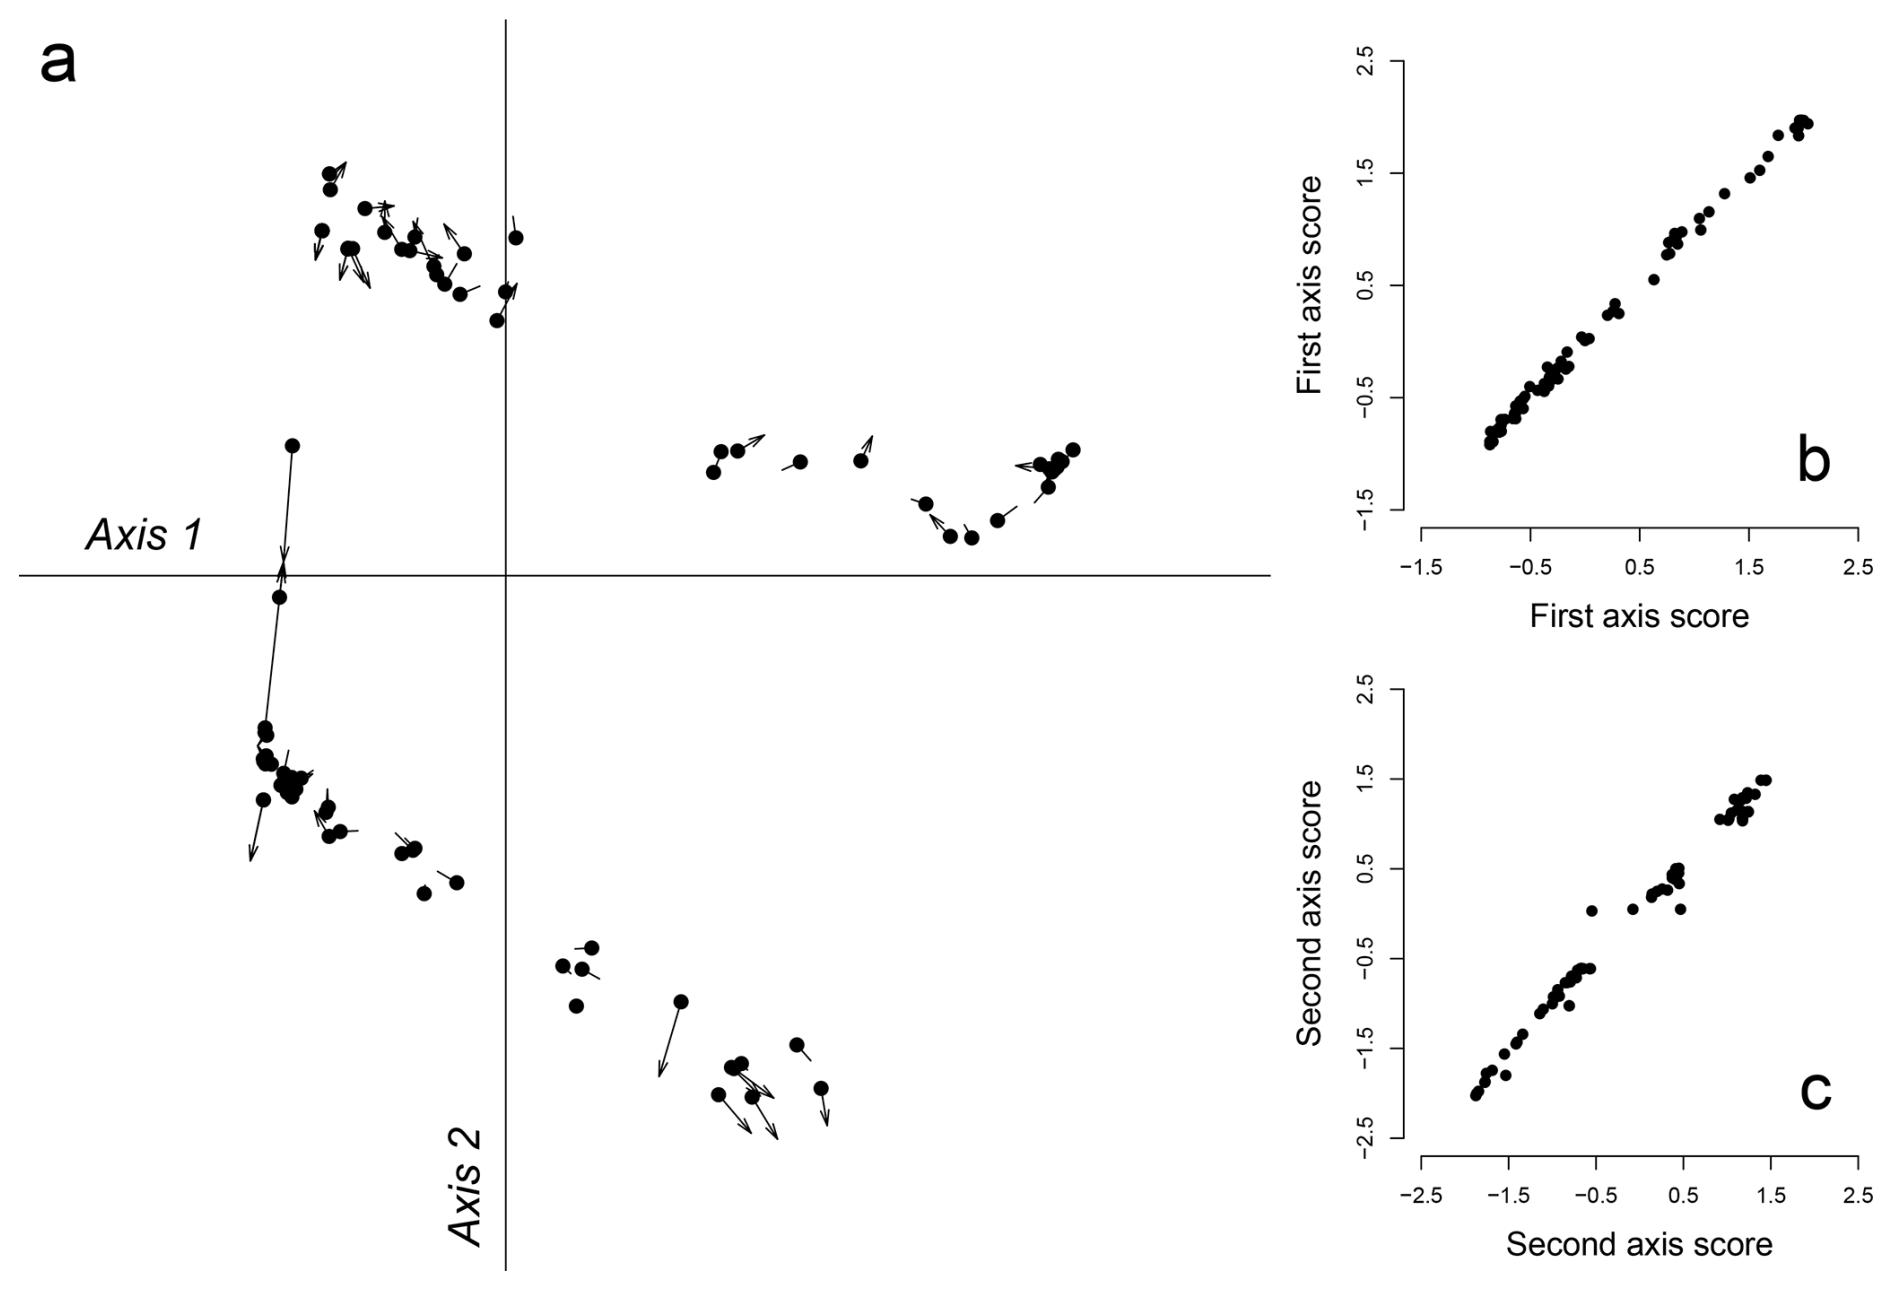
Figure A1Co-Inertia Analysis (CoIA) on ecological trait data from Bournaud et al. (1992). (a) Co-structure between the 110 species ordinated by traits according to 0–6 scoring (black dots) and according to 0–1 scoring (arrow tips). Arrow length indicates discrepancy, i.e. when the 0–1 scoring does not well reproduce the 0–6 scoring. (b) Relationship between dot (x axis) and arrow tip (y axis) scores of the first CoIA axis. (c) Relationship between dot and arrow tip scores of the second CoIA axis. Overall, the two multivariate structures are extremely similar.
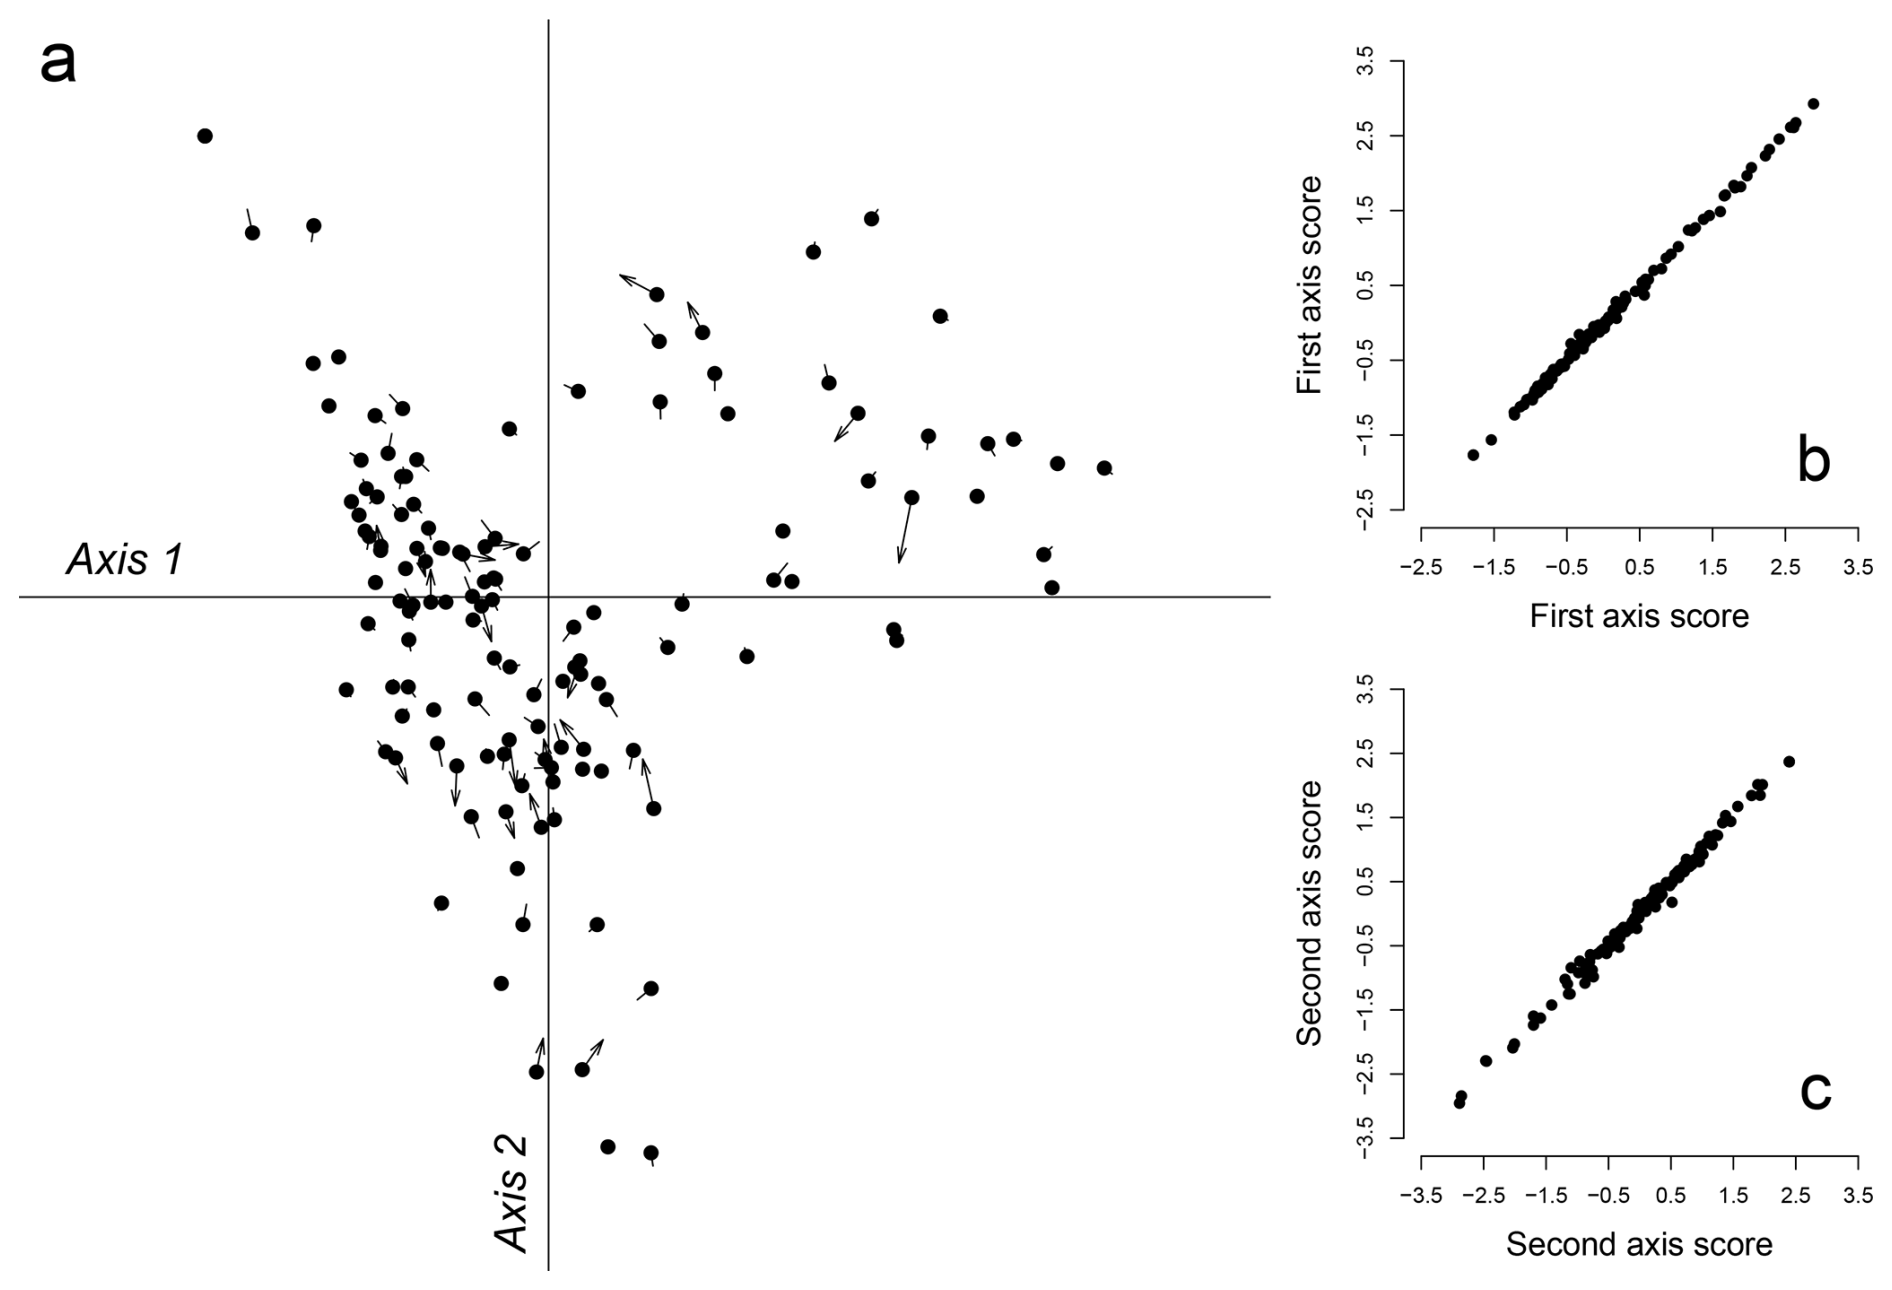
Figure A2Co-Inertia Analysis (CoIA) on reproductive trait data from Statzner et al. (1997). (a) Co-structure between the 131 species ordinated by traits according to 0–3 scoring (black dots) and according to 0–1 scoring (arrow tips). Arrow length indicates discrepancy, i.e. when the 0–1 scoring does not well reproduce the 0–6 scoring. (b) Relationship between dot (x axis) and arrow tip (y axis) scores of the first CoIA axis. (c) Relationship between dot and arrow tip scores of the second CoIA axis. Overall, the two multivariate structures are extremely similar.
In marine benthic ecology, the data from Clare et al. (2022) have been massively used for different purposes. The data frame documents 10 biological and ecological traits (48 modalities) of 899 genera found on the European northwestern shelf. Given the more limited biological information in the marine environment and the attempt to cover a taxonomic pool as large as possible, the authors carefully used a 0–3 scoring to express within-genus uncertainty in species functional affinities. As previously observed, the 0–1 version of the data frame does not differ from the original version, with an RV close to 1.
url <-
"https://raw.githubusercontent.com/obeauchard/Fuzzy-data-sets/main/"

data <- read.csv(paste(url, "FuzzyData_Clare2022_tab.csv", sep = ""),
header = TRUE)

blo <- read.csv(paste(url, "FuzzyData_Clare2022_blo.csv", sep = ""),
header = FALSE)[,1]

data <- data[data$Genus != "",]

tab1 <- data[7:ncol(data)]

rownames(tab1) <- data$Genus

tab2 <- data.frame(ifelse(tab1 == 0, 0, 1))

fuz1 <- prep.fuzzy.var(df = tab1, col.blocks = blo)

fuz2 <- prep.fuzzy.var(df = tab2, col.blocks = blo)

RV.rtest(fuz1, fuz2, nrepet = 999)

Monte-Carlo test

Call: RV.rtest(df1 = fuz1, df2 = fuz2, nrepet = 999)

Observation: 0.9967481
Based on 999 replicates

Simulated p-value: 0.001

Alternative hypothesis: greater
Std.Obs  Expectation     Variance

6.356538e+02 1.318734e-02 2.394203e-06
These recurring outcomes bring us to push forward the falsification of the original data set: does the attribution of random scores lead to a significantly different data set? We replaced the non-null values of the original data set by random scores according to three scorings: 1–3, 1–5 and 1–10. For each scoring, 1000 replicates were simulated, and the 1000 corresponding RV were calculated (p-value test skipped with nrepet = 1).
RV.sim3 <- numeric()

RV.sim5 <- numeric()

RV.sim10 <- numeric()

for(i in 1:1000){

tab.sim3 <- tab1

tab.sim5 <- tab1

tab.sim10 <- tab1

w <- tab1[tab1 > 0]

w3 <- sample(x = 1:3, size = length(w), replace = TRUE)

w5 <- sample(x = 1:5, size = length(w), replace = TRUE)

w10 <- sample(x = 1:10, size = length(w), replace = TRUE)

tab.sim3[tab1 > 0] <- w3

tab.sim5[tab1 > 0] <- w5

tab.sim10[tab1 > 0] <- w10

fuz.sim3 <- prep.fuzzy.var(tab.sim3, col.blocks = blo)

fuz.sim5 <- prep.fuzzy.var(tab.sim5, col.blocks = blo)

fuz.sim10 <- prep.fuzzy.var(tab.sim10, col.blocks = blo)

RV.sim3[i] <- RV.rtest(fuz1, fuz.sim3, nrepet = 1)$obs

RV.sim5[i] <- RV.rtest(fuz1, fuz.sim5, nrepet = 1)$obs

RV.sim10[i] <- RV.rtest(fuz1, fuz.sim10, nrepet = 1)$obs

}
par(mar = c(5, 5, 1, 1))

hist(RV.sim3, nclass = 20, xlim = c(0.980, 0.992), ylim = c(0, 1500),

freq = FALSE, border = FALSE, density = 15, angle = -45, col = 1,

xlab = "", ylab = "", main = "")

hist(RV.sim5, nclass = 20,

freq = FALSE, border = FALSE, density = 15, angle = 45, col = "grey40", add = TRUE)

hist(RV.sim10, nclass = 20,

freq = FALSE, border = FALSE, density = 15, angle = -45, col = "grey70", add = TRUE)

w1 <- density(RV.sim3)

w2 <- density(RV.sim5)

w3 <- density(RV.sim10)

lines(w1, lty = 1)

lines(w2, lty = 1, col = "grey40")

lines(w3, lty = 1, col = "grey70")

mtext(side = 1, "Simulated RV coefficient", line = 3, cex = 1.5)

mtext(side = 2, "Density", line = 3, cex = 1.5)
Figure A3 shows that, in spite of slight differences among the three series of simulations, the RV coefficients remain close to one in any case. This means that the attribution of scores > 1 does not significantly differ from the attribution of random scores, even with an unrealistic 1–10 scoring.
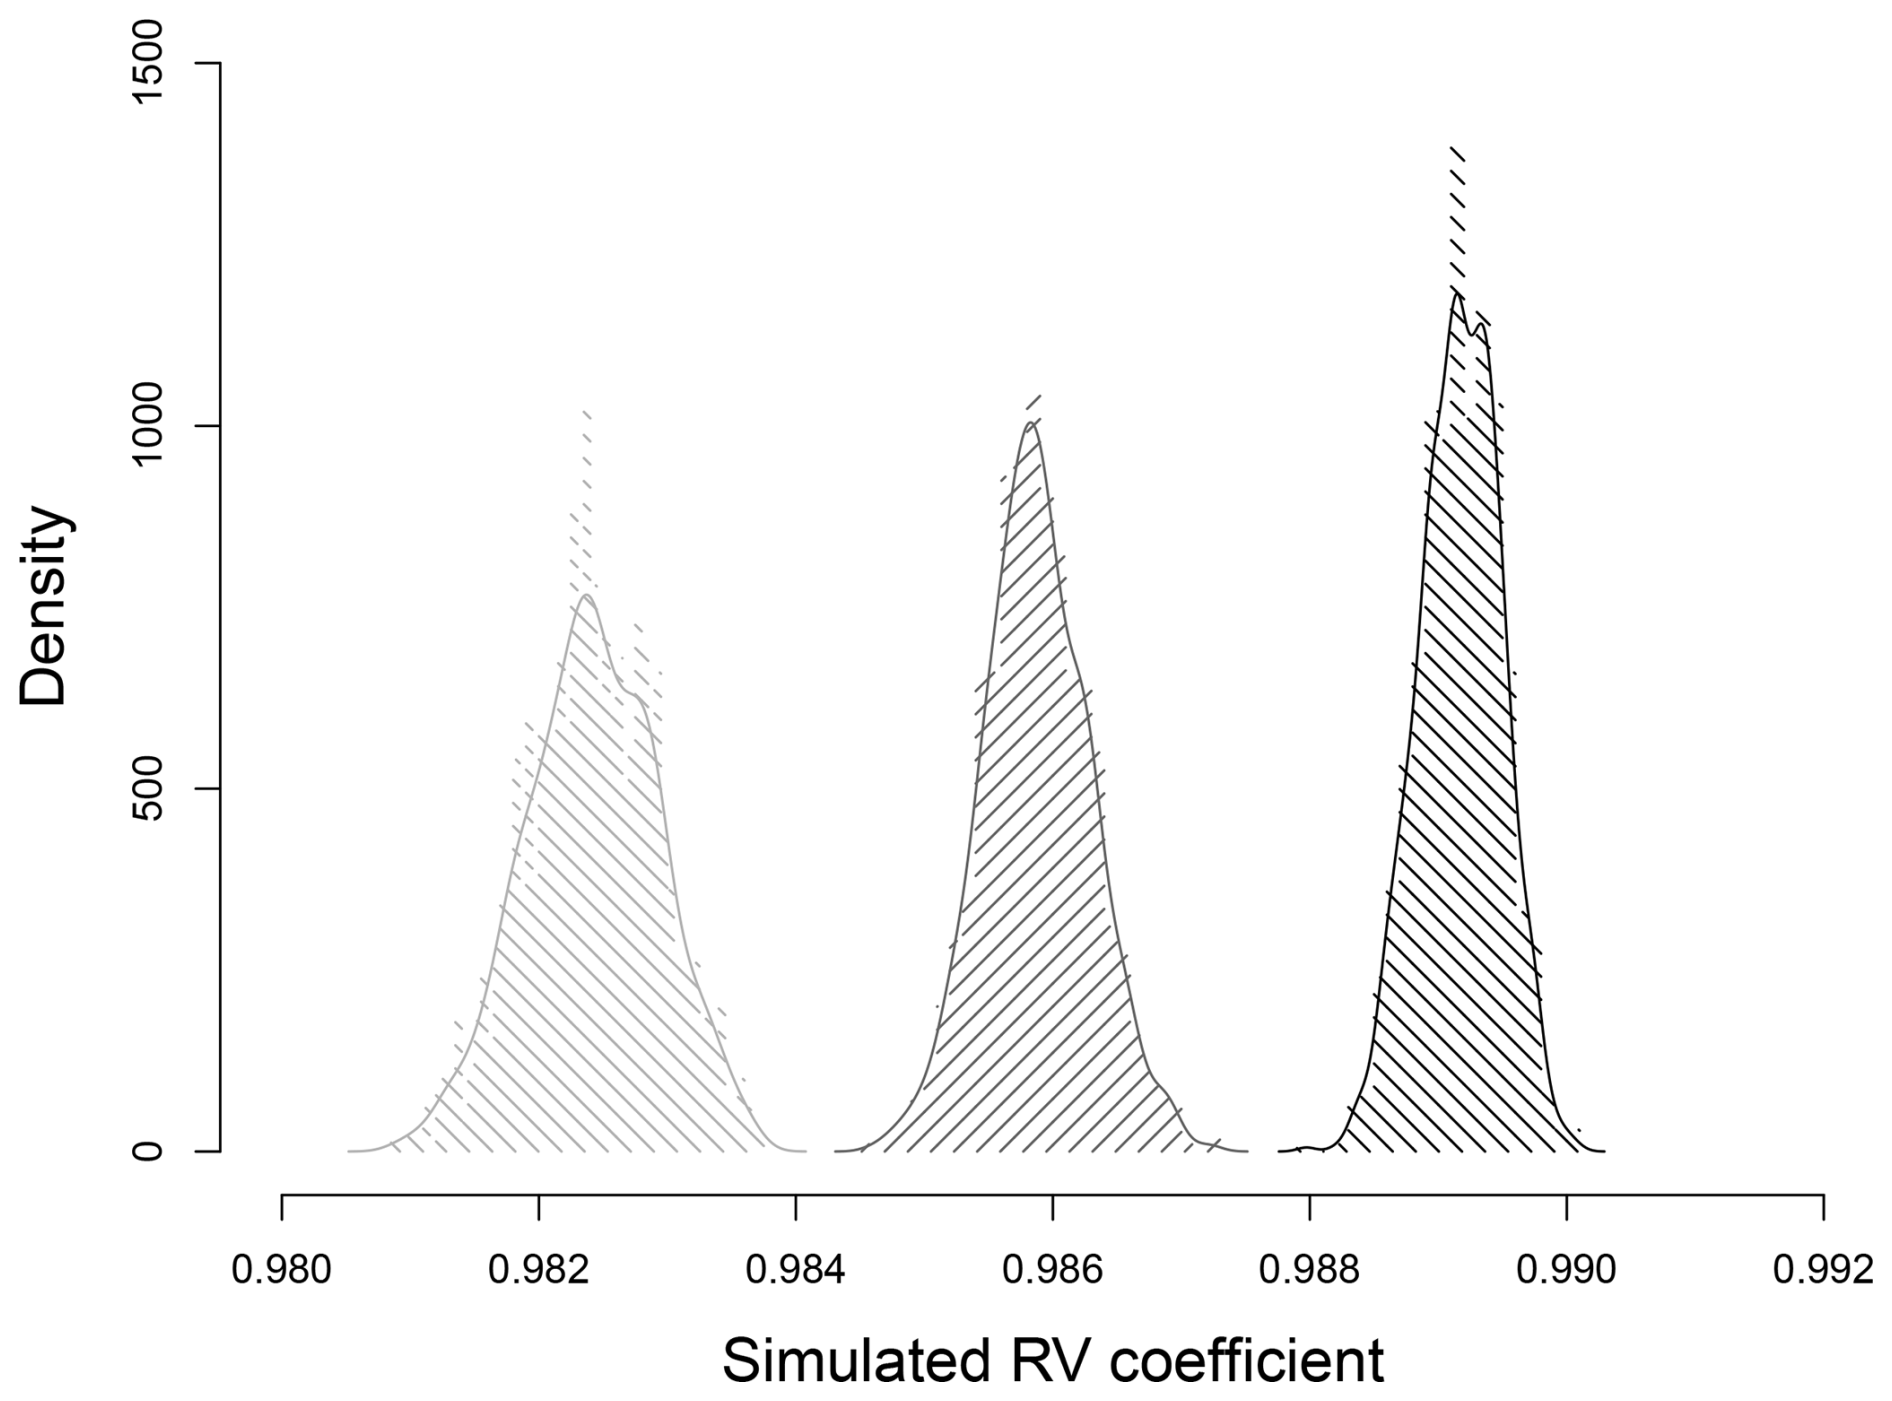
Figure A3Simulated distributions of RV coefficients between the original trait data set from Clare et al. (2022) and the same data set in which non-null trait modality scores were replaced by random scores between 1 and 3 (right, black), 1 and 5 (middle, grey) and 1 and 10 (left, light grey).
The particularity of biological trait data sets is the species-specific biology, even at the genus level as shown in the previous example. This is necessarily the case in data sets composed of a dominant number of qualitative traits for which a single non-null score can be attributed (e.g. offspring type). In general, species dot not have many non-null affinities within a same trait, except, to a lesser extent, omnivores for feeding type. As a result, fuzzy-coded data sets contain a large dominance of zeros.
nval <- nrow(tab1) * ncol(tab1)

length(tab1[tab1 == 0]) / nval
0.7293752
Here, the data frame is composed of 73 % of zeros. This probably influences correlations between trait modality columns whereby strong relationships may not be determined by the differences between the non-null scores, but between 0 and everything else. Below, the column-modalities of the first trait (body length) from the original data frame are selected and correlated:
indic <- rep(1:length(blo), blo)

as.dist(round(cor(fuz1[indic == 1]), 2))
sr_Less_than_10 |
sr_11_to_20 |
sr_21_to_100 |
sr_101_to_200 |
sr_201_to_500 |
|
sr_11_to_20 |
-0.25 |
||||
sr_21_to_100 |
-0.49 |
-0.37 |
|||
sr_101_to_200 |
-0.24 |
-0.23 |
-0.22 |
||
sr_201_to_500 |
-0.15 |
-0.15 |
-0.19 |
0.02 |
|
sr_More_than_500 |
-0.06 |
-0.06 |
-0.09 |
-0.03 |
0.02 |
The same data frame after replacement of the non-null values by random scores between 1 and 10:
w <- tab1[tab1 > 0]

w <- sample(x = 1:10, size = length(w), replace = TRUE)

tab.sim <- tab1

tab.sim[tab1 > 0] <- w

fuz.sim <- prep.fuzzy.var(tab.sim, col.blocks = blo)

as.dist(round(cor(fuz.sim[indic == 1]), 2))
sr_Less_than_10 |
sr_11_to_20 |
sr_21_to_100 |
sr_101_to_200 |
sr_201_to_500 |
|
sr_11_to_20 |
-0.26 |
||||
sr_21_to_100 |
-0.49 |
-0.38 |
|||
sr_101_to_200 |
-0.23 |
-0.22 |
-0.22 |
||
sr_201_to_500 |
-0.15 |
-0.14 |
-0.19 |
0.00 |
|
sr_More_than_500 |
-0.06 |
-0.06 |
-0.09 |
-0.03 |
0.02 |
The correlations remain quite stable and do not seem to be substantially affected by the falsification of the original data. Other marine benthic data sets, combining different numbers of taxa and modality columns, exhibit the same numerical symptoms (Table A1).
Conclusively, these data manipulations advocate for simplifying fuzzy coding when intended to multivariate patterns. In no case we reconsider the validity of fuzzy coding for expressing within-species biological variations in quantitative traits when sufficient information is available. However, in the marine benthos, such a perspective seems illusive for the present time.
Table A1Other fuzzy-coded data sets. The column RV indicates matrix correlation between the original data table and its simplified version through 0–1 trait modality scoring.
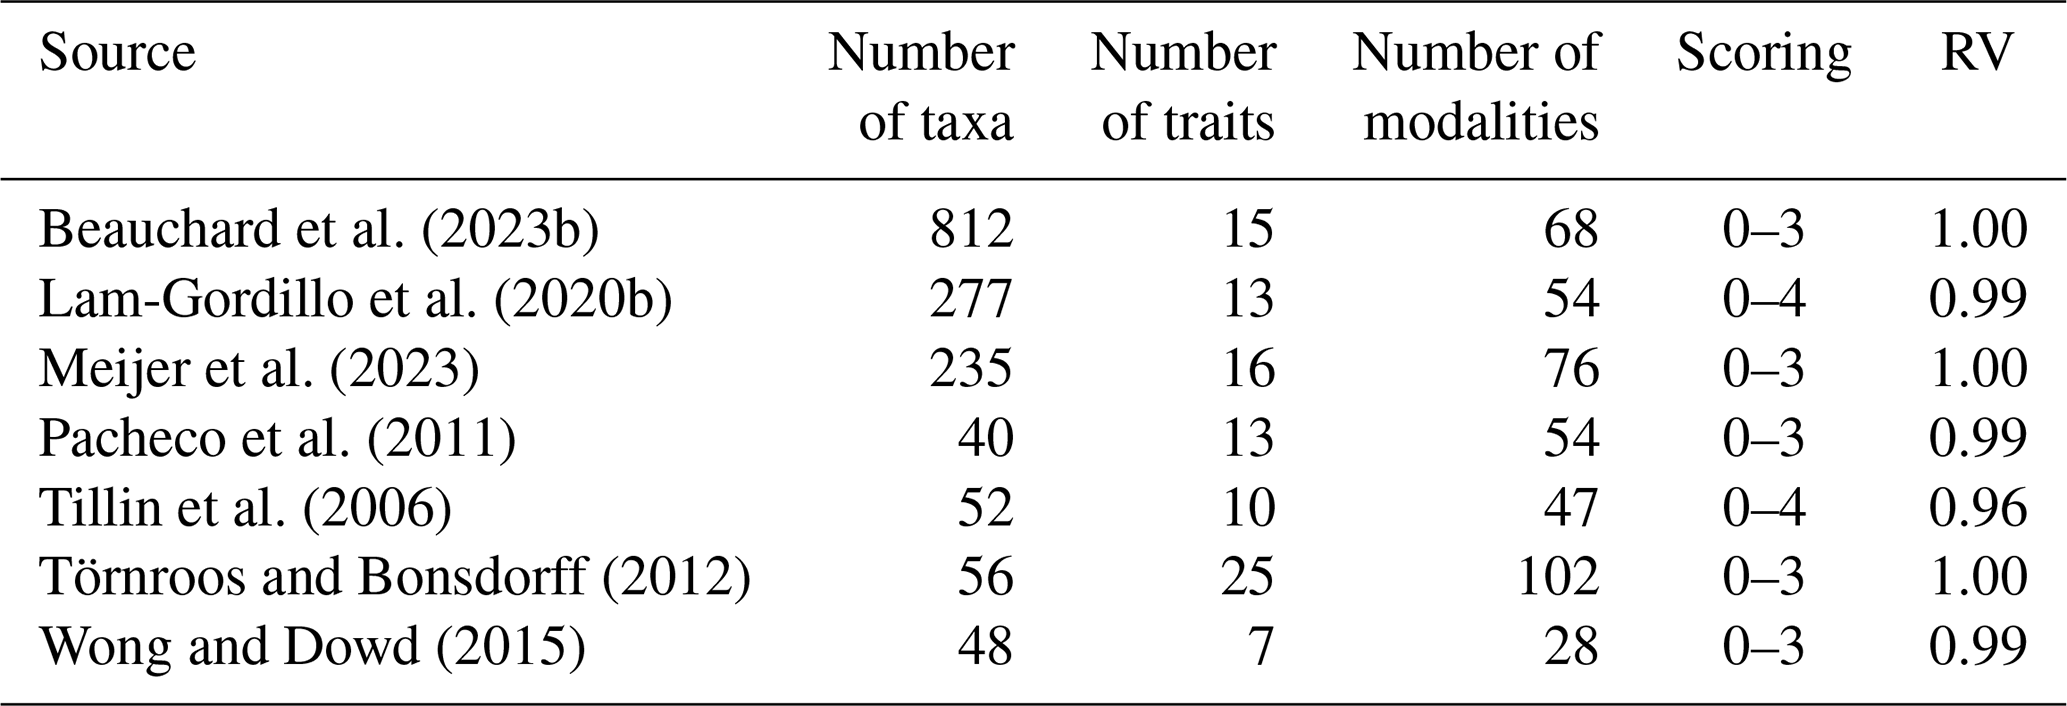
The supplement related to this article is available online at https://doi.org/10.5194/essd-18-8497-2026-supplement.
OB: conceptualisation, data compilation, R package development, data analyses and writing. KS: review and editing.
The contact author has declared that none of the authors has any competing interests.
Publisher's note: Copernicus Publications remains neutral with regard to jurisdictional claims made in the text, published maps, institutional affiliations, or any other geographical representation in this paper. The authors bear the ultimate responsibility for providing appropriate place names. Views expressed in the text are those of the authors and do not necessarily reflect the views of the publisher.
The authors thank two anonymous reviewers for constructive comments on an earlier version of the manuscript.
The finalisation of this work was supported by the European Commission through the NECCTON project (New Copernicus Capability for Trophic Ocean Networks) from the HORIZON EUROPE Framework Programme (grant agreement 101081273).
This paper was edited by Sebastiaan van de Velde and reviewed by two anonymous referees.
Able, K. W.: Natural history: an approach whose time has come, passed, and needs to be resurrected, ICES J. Mar. Sci., 73, 2150–2155, https://doi.org/10.1093/icesjms/fsw049, 2016.
Aller, R. C.: The effects of macrobenthos on chemical properties of marine sediment and overlying water, in: Animal–Sediment Relations, edited by: McCall, P. L. and Tevesz, M. J. S., Plenum Press, New York, 53–102, https://doi.org/10.1007/978-1-4757-1317-6_2, 1982.
Ambrose Jr., W. G.: Role of predatory infauna in structuring marine soft-bottom communities, Mar. Ecol. Prog. Ser., 17, 109–115, https://doi.org/10.3354/meps017109, 1984.
Anger, K.: Salinity as a key parameter in the larval biology of decapod crustaceans, Invertebr. Reprod. Dev., 431, 29–45, https://doi.org/10.1080/07924259.2003.9652520, 2003.
Anker, A., Murina, G. V., Lira, C., Caripe, J. A. V., Palmer, A. R., and Jeng M. S.: Macrofauna associated with echiuran burrows: a review with new observations of the innkeeper worm, Ochetostoma erythrogrammon Leuckart and Rüppel, in Venezuela, Zool. Stud., 44, 157–190, 2005.
Barmuta, L. A.: Interaction between the effects of substratun, velocity and location on stream benthos: an experiment, Aust. J. Mar. Freshw. Res., 41, 557–5573, https://doi.org/10.1071/mf9900557, 1990.
Beasley, J. C., Olson, Z. H., and Devault, T. L.: Carrion cycling in food webs: comparisons among terrestrial and marine ecosystems, Oikos, 121, 92–104, https://doi.org/10.1111/j.1600-0706.2012.20353.x, 2012.
Beauchard, O.: The importance of trait selection on the meaning of functional diversity in benthic studies, Front. Mar. Sci., 10, 1195595, https://doi.org/10.3389/fmars.2023.1195595, 2023.
Beauchard, O. and Soetaert, S.: Bottom fishing assessment tool: an R package to model the effects of bottom trawling on the marine benthos, Ecol. Appl., e70282, https://doi.org/10.1002/eap.70282, 2026a.
Beauchard, O. and Soetaert, S.: MacroTraits: a global trait data and information system for marine benthic ecology, Zenodo [data set], https://doi.org/10.5281/zenodo.24318255, 2026b.
Beauchard, O., Veríssimo, H., Queirós, A. M., and Herman, P. M. J.: The use of multiple biological traits in marine community ecology and its potential in ecological indicator development, Ecol. Indic., 76, 81–96, https://doi.org/10.1016/j.ecolind.2017.01.011, 2017.
Beauchard, O., Brind'Amour, A., Schratzberger, M., Laffargue, P., Hintzen, N. T., Somerfield, P. J., and Piet, G.: A generic approach to develop a trait-based indicator of trawling-induced disturbance, Mar. Ecol. Prog. Ser., 675, 35–52, https://doi.org/10.3354/meps13840, 2021.
Beauchard, O., Mestdagh, S., Koop, L., Ysebaert, T., and Herman, P. M. J.: Benthic synecology in a soft sediment shelf: habitat contrasts and assembly rules of life strategies, Mar. Ecol. Prog. Ser., 682, 31–50, https://doi.org/10.3354/meps13928, 2022.
Beauchard, O., Bradshaw, C., Bolam, S., Tiano., J, Garcia, C., De Borger, E., Laffargue, P., Blomqvist, M., Tsikopoulou, I., Papadopoulou, N. K., Smith, C. J., Claes, J., Soetaert, K., and Sciberras, M.: Trawling-induced change in benthic effect trait composition – A multiple case study, Front. Mar. Sci., 10, 1303909, https://doi.org/10.3389/fmars.2023.1303909, 2023a.
Beauchard, O., Thompson, M. S. A., Ellingsen, K., Piet, G. J., Laffargue, P., and Soetaert, K.: Assessing sea floor functional biodiversity and vulnerability, Mar. Ecol. Prog. Ser., 708, 21–43, https://doi.org/10.3354/meps14270, 2023b.
Berg, P., Rysgaard, S., Funch, P., and Sejr, M. K.: Effects of bioturbation on solutes and solids in marine sediments, Aquat. Microb. Ecol., 26, 81–94, https://doi.org/10.3354/ame026081, 2001.
Bergagna, L., Beauchard, O., Riccialdelli, L., Lovrich, G., Diez, M., Risso, S., Soetaert, K., and Sahade, R.: Life strategies, assembly rules and functional diversity patterns in sub-Antarctic benthic communities, Mar. Ecol. Prog. Ser., 793, meps15200, https://doi.org/10.3354/meps15200, 2026.
Beukema, J. J.: Molluscan life spans and long-term cycles in benthic communities, Oecologia, 80, 570–570, https://doi.org/10.1007/bf00380084, 1989.
Bhaud, M. and Duchêne, J. C.: Change from planktonic to benthic development: Is Life cycle evolution an adaptive answer to the constraints of dispersal?, Oceanol. Acta, 19, 335–346, 1996.
Bishop, J. D. D. and Pemberton, A. J.: The third way: spermcast mating in sessile marine invertebrates, Integr. Comp. Biol., 46, 398–406, https://doi.org/10.1093/icb/icj037, 2006.
Blanchard, J. L., Heneghan, R. F., Everett, J. D., Trebilco, R., and Richardson, A. J.: From bacteria to whales: using functional size spectra to model marine ecosystems, Trends Ecol. Evol., 32, 174–186, https://doi.org/10.1016/j.tree.2016.12.003, 2017.
Bleidorn, C.: Recent progress in reconstructing lophotrochozoan (spiralian) phylogeny, Org. Divers. Evol., 19, 557–566, https://doi.org/10.1007/s13127-019-00412-4, 2019.
Bournaud, M., Richoux, P., and Usseglio-Polatera, P.: An approach to the synthesis of qualitative ecological information from aquatic coleoptera communities, Regul. Rivers: Res. Manage., 7, 165–180, https://doi.org/10.1002/rrr.3450070205, 1992.
Bremner, J., Rogers, S. I., and Frid, C. L. J.: Assessing functional diversity in marine benthic ecosystems: a comparison of approaches, Mar. Ecol. Prog. Ser., 254, 11–25, https://doi.org/10.3354/meps254011, 2003.
Brett, C. E. and Walker, S. E.: Predators and predation in Paleozoic marine environments, Paleontolog. Soc. Pap., 8, 93–118, https://doi.org/10.1017/s1089332600001078, 2002.
Bromley, R. G.: Bioerosion of Bermuda reefs, Palaeogeogr. Palaeoclimatol. Palaeoecol., 23, 169–197, https://doi.org/10.1016/0031-0182(78)90093-7, 1978.
Buhl-Mortensen, L., Vanreusel, A., Gooday, A. J., Levin, L. A., Priede, I. G., Buhl-Mortensen, P., Gheerardyn, H., King, N. J., and Raes, M.: Biological structures as a source of habitat heterogeneity and biodiversity on the deep ocean margins, Mar. Ecol., 31, 21–50, https://doi.org/10.1111/j.1439-0485.2010.00359.x, 2010.
Burgess, S. C., Baskett, M. L., Grosberg, R. K., Morgan, S. G., and Strathmann, R. R.: When is dispersal for dispersal? Unifying marine and terrestrial perspectives, Biol. Rev., 91, 867–882, https://doi.org/10.1111/brv.12198, 2015.
Cadotte, M. W., Carboni, M., Si, X., and Tatsumi, S.: Do traits and phylogeny support congruent community diversity patterns and assembly inferences? J. Ecol., 107, 2065–2077, https://doi.org/10.1111/1365-2745.13247, 2019.
Callaway, R.: Tube worms promote community change, Mar. Ecol. Prog. Ser., 308, 49–60, https://doi.org/10.3354/meps308049, 2006.
Calow, P.: Towards a definition of functional ecology, Funct. Ecol., 1, 57–61, https://doi.org/10.2307/2389358, 1987.
Cavender-Bares, J., Kozak, K. H., Fine, P. V. A., and Kembel, S. W.: The merging of community ecology and phylogenetic biology, Ecol. Lett., 12, 693–715, https://doi.org/10.1111/j.1461-0248.2009.01314.x., 2009.
Cernansky, R.: Biodiversity moves beyond counting species, Nature, 546, 22–24, https://doi.org/10.1038/546022a, 2017.
Chapman, A. S., Beaulieu, S. E., Colaço, A., Gebruk, A. V., Hilario, A., Kihara, T. C., Ramirez-Llodra, E., Sarrazin, J., Tunnicliffe, V., Amon, D. J., Baker, M., Boschen-Rose, R. E., Chen, C., Cooper, I. J., Copley, J. T., Corbari, L., Cordes, E. E., Cuvelier, D., Duperron, S., Du Preez, C., Gollner, S., Horton, T., Hourdez, S., Krylova, E. M., Linse, K., LokaBharathi, P. A., Marsh, L., Matabos, M., Wier Mills, S., Mullineaux, L. S., Rapp, H. T., Reid, W. D. K., Rybakova (Goroslavskaya), E., Remya A. T. T., Southgate, S. J., Stöhr, S., Turner, P. J., Watanabe, H. K., Yasuhara, M., and Bates, A. E.: sFDvent: a global trait database for deep-sea hydrothermal-vent fauna, Global Ecol. Biogeogr., 28, 1538–1551, https://doi.org/10.5061/dryad.cn2rv96, 2019.
Charnov, E. L.: Life history invariants. Some explorations of symmetry in evolutionary ecology, Oxford University Press, Oxford, https://doi.org/10.1093/oso/9780198540724.001.0001, 1993.
Cheng, C. H., de Smit, J. C., Fivash, G. S., Hulscher, S. J. M. H., Borsje, B. W., and Soetaert, K.: Sediment shell-content diminishes current-driven sand ripple development and migration, Earth Surf. Dynam., 9, 1335–1346, https://doi.org/10.5194/esurf-9-1335-2021, 2021.
Chessel, D., Dufour, A. B., and Thioulouse, J.: The ade4 package-I – One-table methods, R News, 4, 5–10, 2004.
Chevalier, S., Beauchard, O., Teacǎ, A., Begun, T., Todorova, V., Vandenbulcke, L., Soetaert, K., and Gr'́egoire, M.: A macrozoobenthic data set of the Black Sea northwestern shelf, Sci. Data, 12, 957, https://doi.org/10.1038/s41597-025-05311-2, 2025.
Chevenet, F., Dolédec, S., and Chessel D.: A fuzzy coding approach for the analysis of long-term ecological data, Freshwater Biol., 31, 295–309, https://doi.org/10.1111/j.1365-2427.1994.tb01742.x, 1994.
Chia, F., Gibson, G., and Qian, P.: Poecilogony as a reproductive strategy of marine invertebrates, Oceanol. Acta, 19, 203–208, https://archimer.ifremer.fr/doc/00094/20478, 1996.
Christensen, B., Vedel, A., and Kristensen, E.: Carbon and nitrogen fluxes in sediment inhabited by suspension-feeding (Nereis diversicolor) and non-suspension-feeding (N. virens) polychaetes, Mar. Ecol. Prog. Ser., 192, 203–217, https://doi.org/10.3354/meps192203, 2000.
Clare, D. S., Bolam, S. G., McIlwaine, P. S. O., Garcia, C., Murray, J. M., and Eggleton, J. D.: Biological traits of marine benthic invertebrates in Northwest Europe, Sci. Data, 9, 339, https://doi.org/10.1038/s41597-022-01442-y, 2022.
Clark, R. B.: The origin and formation of the heteronereis, Biol. Rev., 36, 199–236, https://doi.org/10.1111/j.1469-185X.1961.tb01584.x, 1961.
Clarke, A.: Seasonality in the Antarctic marine environment, Comp. Biochem. Physiol. B, 90, 461–473, https://doi.org/10.1016/0305-0491(88)90285-4, 1988.
Clarke, A.: Antarctic marine benthic diversity: patterns and processes, J. Exp. Mar. Bio. Ecol., 366, 48–55, https://doi.org/10.1016/j.jembe.2008.07.008, 2008a.
Clarke, A.: Ecological stoichiometry in six species of Antarctic marine benthos, Mar. Ecol. Prog. Ser., 369, 25–37, https://doi.org/10.3354/meps, 2008b.
Cooper, K. M., Bolam, S. G., Downie, A. L., and Barry, J.: Biological-based habitat classification approaches promote cost-efficient monitoring: an example using seabed assemblages, J. Appl. Ecol., 56, 1085–1098, https://doi.org/10.1111/1365-2664.13381, 2019.
Costello, M. J., Claus, S., Dekeyzer, S., Vandepitte, L., Tuama, E. O., Lear, D., and Tyler-Walters, H.: Biological and ecological traits of marine species, Peer J., 3, e1201, https://doi.org/10.7717/peerj.1201, 2015.
Creutzberg, F., Wapenaar, P., Duineveld, G., and Lopez Lopez, N.: Distribution and density of the benthic fauna in the southern North Sea in relation to bottom characteristics and hydrographic conditions, Rapp. P.-v. R'eun. Cons. Int. Explo. Mer 183, 101–110, https://www.vliz.be/en/imis?module=ref&refid=14729&utm_source=chatgpt.com (last access: 25 March 2026), 1984.
Dammhahn, M., Dingemanse, N. J., Niemelä, P. T., and Réale, D.: Pace-of-life syndromes: a framework for the adaptive integration of behaviour, physiology and life history, Behav. Ecol. Sociobiol., 72, 62, https://doi.org/10.1007/s00265-018-2473-y, 2018.
Darling, E. S., Alvarez-Filip, L., Oliver, T. A., McClanahan, T. R., and Côté, I. M.: Evaluating life-history strategies of reef corals from species traits, Ecol. Lett., 15, 1378–1386, https://doi.org/10.1111/j.1461-0248.2012.01861.x, 2012.
Darwin, C.: On the origin of species, John Murray, London, https://doi.org/10.5962/bhl.title.82303, 1859.
Dawson, S. K., Carmona, C. P., González-Suárez, M., Jönsson, M., Chichorro, F., Mallen-Cooper, M., Melero, Y., Moor, H., Simaika, J. P., and Duthie, A. B.: The traits of “trait ecologists”: An analysis of the use of trait and functional trait terminology, Ecol. Evol., 11, 16434–16445, https://doi.org/10.1002/ece3.8321, 2021.
Dayton, P. K.: The importance of the natural sciences to conservation, Am. Nat., 16, 1–13, https://doi.org/10.1086/376572, 2003.
de Bello, F., Carmona, C. P., Dias, A. T. C., Götzenberger, L., Moretti, M., and Berg, M. P.: Handbook of trait-based ecology. From theory to R tools, Cambridge University Press, Cambridge, https://doi.org/10.1017/9781108628426, 2021a.
de Bello, F., Lavorel, S., Hallett, L. M., Valencia, E., Garnier, E., Roscher, C., Conti, L., Galland, T., Goberna, M., Májeková, M., Montesinos-Navarro, A., Pausas, J. G., Verdú, M., E-Vojtkó, A., Götzenberger, L., and Lepš, J.: Functional trait effects on ecosystem stability: assembling the jigsaw puzzle, Trends Ecol. Evol., 36, 822–836, https://doi.org/10.1016/j.tree.2021.05.001, 2021b.
Degen, R. and Faulwetter, S.: The Arctic Traits Database – a repository of Arctic benthic invertebrate traits, Earth Syst. Sci. Data, 11, 301–322, https://doi.org/10.5194/essd-11-301-2019, 2019.
de Juan, S., Bremner, J., Hewitt, J., Törnroos, A., Mangano, M. C., Thrush, S., and Hinz, H.: Biological traits approaches in benthic marine ecology: dead ends and new paths, Ecol. Evol., 12, e9001, https://doi.org/10.1002/ece3.9001, 2022.
Diaz, R. J. and Rosenberg, R.: Marine benthic hypoxia: a review of its ecological effects and the behavioural responses of benthic macrofauna, Oceanogr. Mar. Biol. Ann. Rev., 33, 245–303, 1995.
Díaz, S. and Cabido, M.: Vive la différence: plant functional diversity matters to ecosystem processes, Trends Ecol. Evol., 16, 646–655, https://doi.org/10.1016/S0169-5347(01)02283-2, 2001.
Dodou, D., Breedveld, P., de Winter, J. C. F., Dankelman, J., and van Leeuwen, J. L.: Mechanisms of temporary adhesion in benthic animals, Biol. Rev., 86, 15–32, https://doi.org/10.1111/j.1469-185X.2010.00132.x, 2011.
Dray, S., Chessel, D., and Thioulouse, J.: Co-inertia analysis and the linking of ecological data tables, Ecology, 84, 3078–3089, https://doi.org/10.1890/03-0178, 2003.
Dray, S., Dufour, A. B., and Chessel, D.: The ade4 Package – II: Two-table and K-table methods, R News, 7, 47–54, 2007.
Enderlein, P.: Effect of substrate composition on burrowing depth and respiratory current in two spatangoids (Echinoidea), Sarsia, 89, 190–195, https://doi.org/10.1080/00364820410006367, 2004.
Engel, M. S., Ceríaco, L. M. P., Daniel, G. M., Dellapé, P. M., Löbl, I., Marinov, M., Reis, R. E., Young, M. T., Dubois, A., Agarwal, I., Lehmann, P. A., Alvarado, M., Alvarez, N., Andreone, F., Araujo-Vieira, K., Ascher, J. S., Baêta, D., Baldo, D., Bandeira, S. A., Barden, P., Barrasso, D. A., Bendifallah, L., Bockmann, F. A., Böhme, W., Borkent, A., Brandão, C. R. F., Busack, S. D., Bybee, S. M., Channing, A., Chatzimanolis, S., Christenhusz, M. J. M., Crisci, J. V., D'Elía, G., Da Costa, L. M., Davis, S. R., De Lucena, C. A. S., Deuve, T., Fernandes Elizalde, S., Faivovich, J., Farooq, H., Ferguson, A. W., Gippoliti, S., Gonçalves, F. M. P., Gonzalez, V. H., Greenbaum, E., Hinojosa-Díaz, I. A., Ineich, I., Jiang, J., Kahono, S., Kury, A. B., Lucinda, P. H. F., Lynch, J. D., Malécot, V., Marques, M. P., Marris, J. W. M., McKellar, R. C., Mendes, L. F., Nihei, S. S., Nishikawa, K., Ohler, A., Orrico, V. G. D., Ota, H., Paiva, J., Parrinha, D., Pauwels, O. S. G., Pereyra, M. O., Pestana, L. B., Pinheiro, P. D. P., Prendini, L., Prokop, J., Rasmussen, C., Rödel, M.-O., Trefaut Rodrigues, M., Rodríguez, S. M., Salatnaya, H., Sampaio, Í., Sánchez-García, A., Shebl, M. A., Santos, B. S., Solórzano-Kraemer, M. M., Sousa, A. C. A., Stoev, P., Teta, P., Trape, J.-F., Van-Dúnem Dos Santos, C., Vasudevan, K., Vink, C. J., Vogel, G., Wagner, P., Wappler, T., Ware, J. L., Wedmann, S., and Zacharie, C. K.: The taxonomic impediment: a shortage of taxonomists, not the lack of technical approaches, Zool. J. Linn. Soc., 193, 381–387, https://doi.org/10.1093/zoolinnean/zlab072, 2021.
Escoufier, Y.: Le traitement des variables vectorielles, Biometrics, 29, 751–760, https://doi.org/10.2307/2529140, 1973.
Etter, R. J. and Mullineaux, L. S.: Deep-Sea Communities, in: Marine Community Ecology, edited by: Bertness, S. D., Gaines, S. D., and Hay, M. E., Sinauer Associates, Sunderland, 367–394, ISBN 9780878930579, 2001.
Fallon, S. J., Thresher, R. E., and Adkins, J.: Age and growth of the cold-water scleractinian Solenosmilia variabilis and its reef on SW Pacific seamounts, Coral Reefs, 33, 31–38, https://doi.org/10.1007/s00338-013-1097-y, 2013.
Fauchald, K.: Life diagram patterns in benthic polychaetes, Proc. Biol. Soc. Wash., 96, 160–177, 1983.
Fauchald, K. and Jumars, P. A.: The diet of worms: a study of polychaete feeding guilds, Oceanogr. Mar. Biol. Ann. Rev., 17, 193–284, 1979.
Faulwetter, S., Markantonatou, V., Pavloudi, C., Papageorgiou, N., Keklikoglou, K., Chatzinikolaou, E., Pafilis, E., Chatzigeorgiou, G., Vasileiadou, K., Dailianis, T., Fanini, L., Koulouri, P., and Arvanitidis, C.: Polytraits: a database on biological traits of marine polychaetes, Biodivers. Data J., 2, e1024, https://doi.org/10.3897/BDJ.2.e1024, 2014.
Fernandez, M. O., Collins, A. G., Gittenberger, A., Roy, K., and Marques A. C.: Traits and depth: What do hydroids tell us about morphology and life-history strategies in the deep sea?, Global Ecol. Biogeogr., 29, 908–924, https://doi.org/10.1111/geb.13074, 2020.
Flammang, P.: Adhesive secretions in echinoderms: an overview, in: Biological Adhesives, edited by: Smith, A. M. and Callow, J. A., Springer-Verlag, Berlin, Heidelberg, 183–206, https://doi.org/10.1007/978-3-540-31049-5_10, 1996.
François, F., Poggiale, J. C., Durbec, J. P., and Stora, G.: A new approach for the modelling of sediment reworking induced by a macrobenthic community, Acta Biotheor., 45, 295–319, https://doi.org/10.1023/A:1000636109604, 1997.
Friedrichs, M., Graf, G., and Springer, B.: Skimming flow induced over a simulated polychaete tube lawn at low population densities, Mar. Ecol. Prog. Ser., 192, 219–228, https://doi.org/10.3354/meps192219, 2000.
Gage, J. D.: Recruitment ecology and age structure of deep-sea invertebrate populations, in: Reproduction, Larval Biology, and Recruitment in the Deep-Sea Benthos, edited by: Young, C. M. and Eckelbarger, K. J., Columbia University Press, New York, 223–242, ISBN 0-231-08004-2, 1994.
Galparsoro, I., Connor D. W., Borja Á., Aish, A., Amorim, P., Bajjouk, T., Chambers, C., Coggan, R., Dirberg, G., Ellwood, H., Evans, D., Goodin, K. L., Grehan, A., Haldin, J., Howell, K., Jenkins, C., Michez, N., Mo, G., Buhl-Mortensen, P., Pearce, B., and Vasquez, M.: Using EUNIS habitat classification for benthic mapping in European seas: present concerns and future needs, Mar. Pollut. Bull., 64, 2630–2638, https://doi.org/10.1016/j.marpolbul.2012.10.010, 2012.
Gaston, G. R.: Benthic Polychaeta of the Middle Atlantic Bight: feeding and distribution, Mar. Ecol. Prog. Ser., 36, 251–262, https://doi.org/10.3354/meps036251, 1987.
Gaston, K. J. and May, R. M.: Taxonomy of taxonomists, Nature, 356, 281–282, 1992.
Gaston, K. J. and Spicer, J. I.: Biodiversity – An introduction, Second edition, Blackwell Publishing, Oxford, ISBN 978-1-405-11857-6, 2004.
Giangrande, A., Geraci, S., and Belmonte, G.: Life-cycle and life-history diversity in marine invertebrates and the implications in community dynamics, Oceanogr. Mar. Biol. Ann. Rev., 32, 305–333, 1994.
Gilbert, F., Kristensen, E., Aller, R. C., Banta, G. T., Archambault, P., Belley, R., Bellucci, L. G., Calder, L., Cuny, P., de Montaudouin, X., Eriksson, S. P., Forster, S., Gillet, P., Godbold, J. A., Glud, R. N., Gunnarsson, J., Hulth, S., Lindqvist, S., Maire, A., Michaud E., and Stora, G.: Sediment reworking by the burrowing polychaete Hediste diversicolor modulated by environmental and biological factors across the temperate North Atlantic. A tribute to Gaston Desrosiers, J. Exp. Mar. Bio. Ecol., 541, 151588, https://doi.org/10.1016/j.jembe.2021.151588, 2021.
Gilbert, M. A.: Growth rate, longevity and maximum size of Macoma balthica (L.), Biol. Bull., 145, 119–126, 1973.
Gili, J. M. and Coma, R.: Benthic suspension feeders: their paramount role in littoral marine food webs, Trends Ecol. Evol., 13, 316–321, https://doi.org/10.1016/s0169-5347(98)01365-2, 1998.
Gimenez, B. C. G., Gusmao, J. B., Petsch, D. K., Fernandes, F. J., and Lana, P. C.: Trait-based approaches to address animal-soft sediment relationships in marine ecosystem: a mini review, Ocean Coast. Res., v72, e24078, https://doi.org/10.1590/2675-2824072.23139, 2024.
Giribet, G.: New animal phylogeny: future challenges for animal phylogeny in the age of phylogenomics, Org. Divers. Evol., 16, 419–426, https://doi.org/10.1007/s13127-015-0236-4, 2016.
Gleason, D. F. and Hofmann, D. K.: Coral larvae: from gametes to recruits, J. Exp. Mar. Biol. Ecol., 408, 42–57, https://doi.org/10.1016/j.jembe.2011.07.025, 2011.
Gontikaki, E., van Oevelen, D., Soetaert, K., and Witte, U.: Food web flows through a sub-arctic deep-sea benthic community, Progr. Oceanogr., 91, 245–259, https://doi.org/10.1016/j.pocean.2010.12.014, 2011.
Goolsby, E. W., Bruggeman, J., and Ané, C.: Rphylopars: Fast multivariate phylogenetic comparative methods for missing data and within-species variation, Meth. Ecol. Evol., 8, 22–27, https://doi.org/10.1111/2041-210X.12612, 2017.
Gower, J. C.: Some distance properties of latent root and vector methods used in multivariate analysis, Biometrika, 53, 325–338, https://doi.org/10.1093/biomet/53.3-4.325, 1966.
Graf, G. and Rosenberg, R.: Bioresuspension and biodeposition: a review, J. Mar. Syst., 11, 269–278, https://doi.org/10.1016/S0924-7963(96)00126-1, 1997.
Grassle, J. F. and Sanders, H. L.: Life histories and the role of disturbance, Deep-Sea Res. Oceanogr. Abstr., 20, 643–659, https://doi.org/10.1016/0011-7471(73)90032-6, 1973.
Gray, J. S.: Animal-sediment relationships, Oceanogr. Mar. Biol. Ann. Rev., 12, 223–261, 1974.
Greene, H. W.: Organisms in nature as a central focus for biology, Trends Ecol. Evol., 20, 23–27, https://doi.org/10.1016/j.tree.2004.11.005, 2005.
Guénard, G., Legendre, P., and Peres-Neto, P.: Phylogenetic eigenvector maps: a framework to model and predict species traits, Meth. Ecol. Evol., 4, 1120–1131, https://doi.org/10.1111/2041-210X.12111, 2013.
Gusha, N. M. C. and McQuaid, C. D.: Traits without boundaries: The environmental influence on biological traits across an intertidal region, J. Sea Res., 203, 102559, https://doi.org/10.1016/j.seares.2024.102559, 2025.
Hall, S. J.: Physical disturbance and marine benthic communities: life in unconsolidated sediments, Oceanogr. Mar. Biol. Ann. Rev., 32, 179–239, 1994.
Heip, C., Basford, D., Craeymeersch, J. A., Dewarumez, J. M., Dorjes, J., de Wilde, P., Duineveld, G., Eleftheriou, A., Herman, P. M. J., Niermann, U., Kingston, P., Künitzer A., Rachor, E., Rumohr, H., Soetaert, K., and Soltwedel, T.: Trends in biomass, density and diversity of North Sea macrofauna, ICES J. Mar. Sci., 49, 13–22, https://doi.org/10.1093/icesjms/49.1.13, 1992.
Herman, P. M. J., Middelburg, J. J., van de Koppel, J., and Heip, C. H. R.: Ecology of estuarine macrobenthos, Adv. Ecol. Res., 29, 195–240, https://doi.org/10.1016/S0065-2504(08)60194-4, 1999.
Hughes, P. W.: Between semelparity and iteroparity: empirical evidence for a continuum of modes of parity, Ecol Evol., 7, 8232–8261, https://doi.org/10.1002/ece3.3341, 2017.
Ingrosso, G., Abbiati, M., Badalamenti, F., Bavestrello, G., Belmonte, G., Cannas, R., Benedetti-Cecchi, L., Bertolino, M., Bevilacqua, S., Bianchi, C. N., Bo, M., Boscari, E., Cardone, F., Cattaneo-Vietti, R., Cau, A., Cerrano, C., Chemello, R., Chimienti, G., Congiu, L., Corriero, G., and Boero, F.: Mediterranean bioconstructions along the Italian coast, Adv. Mar. Biol., 79, 61–136, https://doi.org/10.1016/bs.amb.2018.05.001, 2018.
Jablonski, D. and Lutz R. A.: Larval ecology of marine benthic invertebrates: paleobiological implications, Biol. Rev., 58, 21–89, https://doi.org/10.1111/j.1469-185X.1983.tb00380.x, 1983.
Jacoby, D. M. P., Brown, C., Croft, D. P., Mann, J., and Mourier, J.: Sociality in the marine environment, Front. Mar. Sci., 9, 863595, https://doi.org/10.3389/fmars.2022.863595, 2022.
Johnson, R. G.: Animal-sediment relations in shallow water benthic communities, Mar. Geol., 11, 93–104, https://doi.org/10.1016/0025-3227(71)90069-7, 1971.
Jones, C. G., Lawton, J. H., and Shachak, M.: Organisms as ecosystem engineers, Oikos, 69, 373–386, https://doi.org/10.2307/3545850, 1994.
Jumars, P. A., Dorgan, K. M., and Lindsay, S. M.: Diet of worms emended: an update of polychaete feeding guilds, Annu. Rev. Mar. Sci., 7, 497–520, https://doi.org/10.1146/annurev-marine-010814-020007, 2015.
Keddy, P. A.: A pragmatic approach to functional ecology, Funct. Ecol., 6, 621–626, https://doi.org/10.2307/2389954, 1992a.
Keddy, P. A.: Assembly and response rules: two goals for predictive community ecology, J. Veg. Sci., 3, 157–164, https://doi.org/10.2307/3235676, 1992b.
Kindsvater, H. K., Mangel, M., Reynolds, J. D., and Dulvy, N. K.: Ten principles from evolutionary ecology essential for effective marine conservation, Ecol. Evol., 6, 2125–2138, https://doi.org/10.1002/ece3.2012, 2016.
Kovalenko, K. E., Thomaz, S. M., and Warfe, D. M.: Habitat complexity: approaches and future directions, Hydrobiologia, 685, 1–17, https://doi.org/10.1007/s10750-011-0974-z, 2012.
Kristensen, E.: Direct measurement of ventilation and oxygen uptake in three species of tubiculous polychaetes (Nereis spp.), Comparat. Physiol., 145, 45–50, https://doi.org/10.1007/BF00782592, 1981.
Kristensen, E.: Benthic fauna and biogeochemical processes in marine sediments: microbial activities and fluxes, in: Nitrogen Cycling in Coastal Marine Environments, edited by: Blackburn, T. H. and Sorensen, J., John Wiley & Sons Ltd, Chichester, 275–299, ISBN 9780471914044, 1988.
Kristensen, E. and Kostka, J. E.: Macrofaunal burrows and irrigation in marine sediment: microbiological and biogeochemical interactions, Coast. Estuar. Stud., 60, 125–157, https://doi.org/10.1029/CE060p0125, 2005.
Kristensen, E., Penha-Lopes, G., Delefosse, M., Valdemarsen, T., Quintana, C. O., and Banta, G. T.: What is bioturbation? The need for a precise definition for fauna in aquatic sciences, Mar. Ecol. Prog. Ser., 446, 285–302, https://doi.org/10.3354/meps09506, 2012.
Künitzer, A., Basford, D., Craeymeersch, J. A., Dewarumez, J. M., Dorjes, J., Duineveld, G. C. A., Eleftheriou, A., Heip, C., Herman, P., Kingston, P., Niermann, U., Rachor, E., Rumohr, H., and de Wilde, P. A. J.: The benthic infauna of the North Sea: species distribution and assemblages, ICES J. Mar. Sci., 49, 127–143, https://doi.org/10.1093/icesjms/49.2.127, 1992.
Lackschewitz, D. and Reise, K.: Macrofauna on flood delta shoals in the Wadden Sea with an underground association between the lugworm Arenicola marina and the amphipod Urothoe poseidonis, Helgol. Meeresunters., 52, 147–158, https://doi.org/10.1007/BF02908744, 1998.
Lam-Gordillo, O., Baring, R., and Dittmann, S.: Ecosystem functioning and functional approaches on marine macrobenthic fauna: a research synthesis towards a global consensus, Ecol. Ind., 115, 106379, https://doi.org/10.1016/j.ecolind.2020.106379, 2020a.
Lam-Gordillo, O., Baring, R., and Dittmann, S.: Establishing the South Australian Macrobenthic Traits (SAMT) database: A trait classification for functional assessments, Ecol. Evol., 10, 14372–14387, https://doi.org/10.1002/ece3.7040, 2020b.
Lam-Gordillo, O., Lohrer, A. M., Hewitt, J., and Dittmann, S.: NZTD – The New Zealand Trait Database for shallow-water marine benthic invertebrates, Sci. Data, 10, 502, https://doi.org/10.1038/s41597-023-02414-6, 2023.
Lavorel, S. and Garnier, E.: Predicting changes in community composition and ecosystem functioning from plant traits: revisiting the Holy Grail, Funct. Ecol., 16, 545–556, https://doi.org/10.1046/j.1365-2435.2002.00664.x, 2002.
Levinton, J. and Kelaher, B.: Opposing organizing forces of deposit-feeding marine communities, J. Exp. Mar. Biol. Ecol., 300, 65–82, https://doi.org/10.1016/j.jembe.2003.12.008, 2004.
Levitan, D. R.: The ecology of fertilization in free-spawning invertebrates, in: Ecology of Marine Invertebrate Larvae, edited by: McEdward, L. R., CRC Press, New York, 123–156, https://doi.org/10.1201/9780138758950-4, 1995.
Lim, R., Fourie, S. A., Stout, E. J., Roots, B. J., Cronin-O'Reilly, S., Rodgers, E. M., and Tweedley, J. R.: Testing the Remane diagram: occurrences of benthic macroinvertebrates in oligohaline to hyperhaline salinities, Water, 17, 1642, https://doi.org/10.3390/w17111642, 2025.
Lindroth, A.: Atmungsventilation der Polychäten, Z. Vgl. Physiol., 28, 485–532, https://doi.org/10.1007/BF00297957, 1941.
Little, S., Wood, P. J., and Elliott, M.: Quantifying salinity-induced changes on estuarine benthic fauna: The potential implications of climate change, 198, 610–625, https://doi.org/10.1016/j.ecss.2016.07.020, 2017.
Lively, C. M. and Johnson, S. G.: Brooding and the evolution of parthenogenesis: strategy models and evidence from aquatic invertebrates, P. Roy. Soc. Lond. B, 256, 89–95, https://doi.org/10.1098/rspb.1994.0054, 1994.
Lopez, G. R. and Levinton, J. S.: Ecology of deposit-feeding animals in marine sediments, Quart. Rev. Biol., 62, 235–260, https://doi.org/10.1086/415511, 1987.
Love, A. C.: Marine invertebrates, model organisms, and the modern synthesis: epistemic values, evo-devo, and exclusion, Theory Biosci., 128, 19–42, https://doi.org/10.1007/s12064-009-0063-2, 2009.
Luckenbach, M. W.: Sediment stability around animal tubes: the roles of hydrodynamic processes and biotic activity, Limnol. Oceanogr., 31, 779–787, https://doi.org/10.4319/lo.1986.31.4.0779, 1986.
Mantel, N.: The detection of disease clustering and a generalized regression approach, Cancer Res., 27, 209–220, 1967.
Marshall, D. J. and Keough, M. J.: The evolutionary ecology of offspring size in marine invertebrates, Adv. Mar. Biol., 53, 1–60, https://doi.org/10.1016/S0065-2881(07)53001-4, 2007.
Martini, S., Larras, F., Boyé, A., Faure, E., Aberle, N., Archambault, P., Bacouillard, l., Beisner, B. E., Bittner, l., Castella, E., Danger, M., Gauthier, O., Karp-Boss, L., Lombard, F., Maps, F., Stemmann, L., Thiébaut, E., Usseglio-Polatera, P., Vogt, M., Laviale, M., and Ayata, S. D.: Functional trait-based approaches as a common framework for aquatic ecologists, Limnol. Oceanogr., 66, 965–994, https://doi.org/10.1002/lno.11655, 2021.
Mazzei, R. and Rubenstein, D. R.: Larval ecology, dispersal, and the evolution of sociality in the sea, Ethology, 127, 808–820, https://doi.org/10.1111/eth.13195, 2021.
McEdward, L. R.: Reproductive strategies of marine benthic invertebrates revisited: facultative feeding by planktotrophic larvae, Am. Nat., 150, 48–72, https://doi.org/10.1086/286056, 1997.
McHugh, D. and Fong, P. P.: Do life history traits account for diversity of polychaete annelids?, Invertebr. Biol., 121, 325–338, https://doi.org/10.1111/j.1744-7410.2002.tb00133.x, 2002.
McHugh, D. and Rouse, G. W.: Life history evolution of marine invertebrates: new views from phylogenetic systematics, Trends Ecol. Evol., 13, 182–186, https://doi.org/10.1016/S0169-5347(97)01285-8, 1998.
Meadows, P. S., Meadows, A., West, F. J. C., Shand, P. S., and Shaikh, M. A.: Mussels and mussel beds (Mytilus edulis) as stabilizers of sedimentary environments in the intertidal zone, J. Geol. Soc., 139, 331–347, https://doi.org/10.1144/GSL.SP.1998.139.01.26, 1998.
Meijer, K. J., Gusmao, J. B., Bruil, L., Franken, O., Grimm, I. A., van der Heide, T., Hijner, N., Holthuijsen, S. J., Hübner, L., Thieltges, D. W., Olff, H., Eriksson, B. K., and Govers, L. L.: The seafloor from a trait perspective. A comprehensive life history dataset of soft sediment macrozoobenthos, Sci. Data, 10, 808, https://doi.org/10.1038/s41597-023-02728-5, 2023.
Mendes, S. L. D. S. D., Paiva, P. C., and Nascimento, R. L.: Seasonal upwelling and depth-driven gradients foster functional overdispersion in Southwestern Atlantic annelid assemblages, Mar. Ecol. Prog. Ser., 765, 53–72, https://doi.org/10.3354/meps14896, 2025.
Meyer, D. L., Townsend, E. C., and Thayer, G. W.: Stabilization and Erosion Control Value of Oyster Cultch for Intertidal Marsh. Restor. Ecol., 5, 93–99, https://doi.org/10.1046/j.1526-100X.1997.09710.x, 1997.
Meysman, F. J. R., Middelburg J. J., and Heip C. H. R.: Bioturbation: a fresh look at Darwin's last idea, Trends Ecol. Evol., 21, 688–695, https://doi.org/10.1016/j.tree.2006.08.002, 2006.
Miatta, M., Bates, A. E., and Snelgrove, P. V. R.: Incorporating biological traits into conservation strategies, Annu. Rev. Mar. Sci., 13, 421–443, https://doi.org/10.1146/annurev-marine-032320-094121, 2021.
Mlambo, M. C.: Not all traits are “functional”: insights from taxonomy and biodiversity-ecosystem functioning research, Biodivers. Conserv., 23, 781–790, https://doi.org/10.1007/s10531-014-0618-5, 2014.
Montero-Serra, I., Linares, C., Doak, D. F., Ledoux, J. B., and Garrabou, J.: Strong linkages between depth, longevity and demographic stability across marine sessile species, P. Roy. Soc. B, 285, 20172688, https://doi.org/10.1098/rspb.2017.2688, 2018.
Morim, T., Henriques, S., Vasconcelos, R., and Dolbeth, M.: A roadmap to define and select aquatic biological traits at different scales of analysis, Sci. Rep., 13, 22947, https://doi.org/10.1038/s41598-023-50146-9, 2023.
Mouillot, D., Graham, N. A. J., Villéger, S., Mason, N. W. H., and Bellwood, D. R.: A functional approach reveals community responses to disturbances, Trends Ecol. Evol., 28, 167–177, https://doi.org/10.1016/j.tree.2012.10.004, 2013.
Mouquet, N., Devictor, V., Meynard, C. N., Munoz, F., Bersier, L. F., Chave, J., Couteron, P., Dalecky, A., Fontaine, C., Gravel, D., Hardy, O. J., Jabot, F., Lavergne, S., Leibold, M., Mouillot, D., Münkemüller, T., Pavoine, S., Prinzing, A., Rodrigues, A. S. L., Rohr, R. P., Thébault, E., and Thuiller, W.: Ecophylogenetics: advances and perspectives, Biol. Rev., 87, 769–785, https://doi.org/10.1111/j.1469-185X.2012.00224.x, 2012.
Murtagh, F. and Legendre, P.: Ward's hierarchical agglomerative clustering method: which algorithms implement Ward's criterion?, J. Classif., 31, 274–295, https://doi.org/10.1007/s00357-014-9161-z, 2014.
Nanglu, K., de Carle, D., Cullen, T. M., Anderson, E. B., Arif, S., Castañeda, R. A., Chang, L. M., Iwama, R. E., Fellin, E., Manglicmot, R. C., Massey, M. D., and Astudillo-Clavijo, V.: The nature of science: the fundamental role of natural history in ecology, evolution, conservation, and education, Ecol. Evol., 13, e10621, https://doi.org/10.1002/ece3.10621, 2023.
Oliver, T. H., Heard, M. S., Isaac, N. J. B., Roy, D. B., Procter, D., Eigenbrod, F., and Bullock, J. M.: Biodiversity and resilience of ecosystem functions, Trends Ecol. Evol., 30, 673–684, https://doi.org/10.1016/j.tree.2015.08.009, 2015.
Pacheco, A. S., González, M. T., Bremner, J., Oliva, M., Heilmayer, O., Laudien, J., and Riascos, J. M.: Functional diversity of marine macrobenthic communities from sublittoral soft-sediment habitats off northern Chile, Helgol. Mar. Res., 65, 413–424, https://doi.org/10.1007/s10152-010-0238-8, 2011.
Pavoine, S. and Ricotta, C.: Testing for phylogenetic signal in biological traits: the ubiquity of cross-product statistics, Evolution, 67, 828–840, https://doi.org/10.1111/j.1558-5646.2012.01823.x, 2013.
Pavoine, S., Dufour, A. B., and Chessel, D.: From dissimilarities among species to dissimilarities among communities: a double principal coordinate analysis, J. Theor. Biol., 228, 523–537, https://doi.org/10.1016/j.jtbi.2004.02.014, 2004.
Pearson, T. H.: Functional group ecology in soft-sediment marine benthos: the role of bioturbation, Oceanogr. Mar. Biol. Ann. Rev., 39, 233–267, https://doi.org/10.1201/b12588, 2001.
Pearson, T. H. and Rosenberg, R.: Macrobenthic succession in relation to organic enrichment and pollution of the marine environment, Oceanogr. Mar. Biol. Ann. Rev., 16, 229–311, 1978.
Pechenik, J. A.: Delayed metamorphosis by larvae of benthic marine invertebrates: does it occur? Is there a price to pay?, Ophelia, 32, 63–94, https://doi.org/10.1080/00785236.1990.10422025, 1990.
Pechenik, J. A.: On the advantages and disadvantages of larval stages in benthic marine invertebrate life cycles, Mar. Ecol. Prog. Ser., 177, 269–297, https://doi.org/10.3354/meps177269, 1999.
Peterson, C. H.: Intertidal zonation of marine invertebrates in sand and mud, Am. Sci., 79, 236–249, 1991.
Piepenburg, D.: Recent research on Arctic benthos: common notions need to be revised, Polar Biol., 28, 733–755, https://doi.org/10.1007/s00300-005-0013-5, 2005.
Podbielski, I., Hiebenthal, C., Hajati, M. C., Bock, C., Bleich, M., and Melzner, F.: Capacity for cellular osmoregulation defines critical salinity of marine invertebrates at low salinity, Front. Mar. Sci., 9, 898364, https://doi.org/10.3389/fmars.2022.898364, 2022.
Powell, E. N. and Cummins, H.: Are molluscan maximum life spans determined by long-term cycles in benthic communities?, Oecologia, 67, 177–182, https://doi.org/10.1007/BF00384281, 1985.
Queirós, A. M., Birchenough, S. N. R., Bremner, J., Godbold, J. A., Parker, R. E., Romero-Ramirez, A., Reiss, H., Solan, M., Somerfield, P. J., Van Colen, C., Van Hoey, G., and Widdicombe, S.: A bioturbation classification of European marine infaunal invertebrates, Ecol. Evol., 3, 3958–3985, https://doi.org/10.1002/ece3.769, 2013.
Ramirez Llodra, E.: Fecundity and life history strategies in marine invertebrates, Adv. Mar. Biol., 43, 87–170, https://doi.org/10.1016/S0065-2881(02)43004-0, 2002.
Ramón, M. and Richardson, A.: Age determination and shell growth of Chamelea gallina (Bivalvia: Veneridae) in the western Mediterranean, Mar. Ecol. Prog. Ser., 89, 15–23, https://doi.org/10.3354/meps089015, 1992.
R Core Team: R: A language and environment for statistical computing. R Foundation for Statistical Computing, Vienna, Austria. URL https://www.R-project.org/, 2025.
Rech, S., Thiel, M., Ruiz, G. M., Haram, L. E., and Carlton, J. T.: Ocean rafting: marine litter and benthic stopovers mmplify species dispersal opportunities, Global Ecol. Biogeogr., 34, e70031, https://doi.org/10.1111/geb.70031, 2025.
Remane, A.: Die Brackwasserfauna, Verh. Dtsch. Zool. Ges., 36, 34–74, 1934.
Resh, V. H., Hildrew, A. G., Statzner, B., and Townsend, C. R.: Theoretical habitat templets, species traits, and species richness: a synthesis of long-term ecological research on the Upper Rhône River in the context of concurrently developed ecological theory, Freshwater Biol., 31, 539–554. https://doi.org/10.1111/j.1365-2427.1994.tb01756.x, 1994.
Rhoads, D. C., McCall, P. L., and Yingst, J. Y.: Disturbance and production on the estuarine seafloor: dredge-spoil disposal in estuaries such as Long Island Sound can be managed in ways that enhance productivity rather than diminish it, Am. Sci., 66, 577–586, 1978.
Ricciardi, A. and Bourget, E.: Weight-to-weight conversion factors for marine benthic macroinvertebrates, Mar. Ecol. Prog. Ser., 63, 245–251, https://doi.org/10.3354/meps163245, 1998.
Ricklefs, R. E. and Wikelski, M.: The physiology/life history nexus, Trends Ecol. Evol., 17, 462–468, https://doi.org/10.1016/S0169-5347(02)02578-8, 2002.
Ricotta, C., Podani, J., Schmera, D., Bacaro, G., Maccherini, S., and Pavoine, S.: The ternary diagram of functional diversity, Meth. Ecol. Evol., 14, 1168–1174, https://doi.org/10.1111/2041-210X.14100, 2023.
Roberts, J. M., Wheeler, A. J., and Freiwald, A.: Reefs of the deep: the biology and geology of cold-water coral ecosystems, Science, 312, 543–547, https://doi.org/10.1126/science.1119861, 2006.
Robertson, A. I.: The relationship between annual production: biomass ratios and lifespans for marine macrobenthos, Oecologia, 38, 193–202, https://doi.org/10.1007/BF00346563, 1979.
Salonen, K., Sarvala, J., Hakala, I., and Vilianen, M. L.: The relation of energy and organic carbon in aquatic invertebrate?, Limnol. Oceanogr., 21, 724–730, https://doi.org/10.4319/lo.1976.21.5.0724, 1976.
San Vincente, C.: Life history perspectives on voltinism, in: The Natural History of the Crustacea Series – Life histories, Volume 5, edited by: Wellborn G. A. and Thiel, M., Oxford University press, New York, 125–150, https://doi.org/10.1093/oso/9780190620271.003.0005, 2018.
Savage, V. M., Gillooly, J. F., Brown, J. H., West, G. B., and Charnov, E. L.: Effects of body size and temperature on population growth, Am. Nat., 163, 429–441, https://doi.org/10.1086/381872, 2004.
Sebens, K. P.: Habitat structure and community dynamics in marine benthic systems, Habitat Structure, in: Population and Community Biology Series, edited by: Bell, S. S., McCoy, E. D., and Mushinsky, H. R., Springer, Dordrecht, 211–234, https://doi.org/10.1007/978-94-011-3076-9_11, 1991.
Seibold, E. and Berger, W. (Eds.): The sea floor. An introduction to marine geology, Springer, Cham, 268 pp., https://doi.org/10.1007/978-3-319-51412-3, 2017.
Simberloff, D.: Community ecology: is it time to move on?, Am. Nat., 163, 787–799, https://doi.org/10.1086/420777, 2004.
Sirenko, B. I.: Main differences in macrobenthos and benthic communities of the arctic and antarctic, as illustrated by comparison of the Laptev and Weddell sea faunas, Russ. J. Mar. Biol., 35, 445–453, https://doi.org/10.1134/S1063074009060017, 2009.
Snelgrove, P. V. R.: Getting to the bottom of marine biodiversity: sedimentary habitats, BioScience, 49, 129–138, https://doi.org/10.2307/1313538, 1999.
Snelgrove, P. V. R. and Butman, C. A.: Animal-sediment relationships revisited: cause versus effect, Oceanogr. Mar. Biol. Ann. Rev., 32, 111–177, 1994.
Solan, M., Cardinale, B. J., Downing, A. L., Engelhardt, K. A. M., Ruesink, J. L., and Srivastava, D. S.: Extinction and ecosystem function in the marine benthos, Science, 306, 1177–1180, https://doi.org/10.1126/science.1103960, 2004.
Southwood, T. R. E.: Tactics, strategies and templets, Oikos, 52, 3–18, https://doi.org/10.2307/3565974, 1988.
Spalding, M., Fox, H. E., Allen, G. R., Davidson, R., Ferdaña, Z. A., Finlayson, M., Halpern, B. S., Jorge, M. A., Lombana, A. L., Lourie, S. A., Martin, K. D., McManus, E., Molnar, J., Recchia, C. A., and Robertson, J.: Marine ecoregions of the World: a bioregionalization of coastal and shelf areas, BioScience, 57, 573–583, https://doi.org/10.1641/B570707, 2007.
Statzner, B., Hoppenhaus, K., Arens, M. F., and Richoux, P.: Reproductive traits, habitat use and templet theory: synthesis on world-wide data on aquatic insects, Freshwater Biol., 38, 109–135, https://doi.org/10.1046/j.1365-2427.1997.00195.x, 1997.
Statzner, B. and Bêche, L. A.: Can biological invertebrate traits resolve effects of multiple stressors on running water ecosystems?, Freshwater Biol., 55, 80–119, https://doi.org/10.1111/j.1365-2427.2009.02369.x, 2010.
Stearns, S. C.: The evolution of life histories, Oxford University Press, Oxford, https://doi.org/10.1093/oso/9780198577416.001.0001, 1992.
Stott, I., Salguero-Gómez, R., Jones, O. R., Ezard, T. H. G., Gamelon, M., Lachish, S., Lebreton, J. D., Simmonds, E. G., Gaillard, J. M., and Hodgson, D. J.: Life histories are not just fast or slow, Trends Ecol. Evol., 39, 9, https://doi.org/10.1016/j.tree.2024.06.001, 2024.
Strathmann, R. R.: Egg size, larval development, and juvenile size in benthic marine invertebrates, Am. Nat., 111, 373–376, https://doi.org/10.1086/283168, 1977.
Strathmann, R. R.: Why life histories evolve differently in the sea?, Am. Zool., 30, 197–207, https://doi.org/10.1093/icb/30.1.197, 1990.
Strathmann, R. R. and Strathmann, M. F.: The relationship between adult size and brooding in marine invertebrates, Am. Nat., 119, 91–101, https://doi.org/10.1086/283892, 1982.
Susini, I., Tillin, H. M., Anderson, L., Robertson, C. M., Rees, S., and Howell, K. L.: Towards greater standardisation in benthic trait research to support application to environmental management, Ecol. Evol., 15, e71072, https://doi.org/10.1002/ece3.71072, 2025.
Sutton, L., Mueter, F. J., Bluhm, B. A., and Iken, K.: Environmental filtering influences functional community assembly of epibenthic communities, Front. Mar. Sci., 8, 736917, https://doi.org/10.3389/fmars.2021.736917, 2021.
Swift, D. J.: The macrobenthic infauna off Sellafield (north-eastern Irish Sea) with special reference to bioturbation, J. Mar. Biol. Assoc. UK, 73, 143–162, https://doi.org/10.1017/S0025315400032690, 1993.
Tenenhaus, M. and Young, F. W.: An analysis and synthesis of multiple correspondence analysis, optimal scaling, dual scaling, homogeneity analysis and other methods for quantifying categorical multivariate data, Psychometrika, 50, 91–119, https://doi.org/10.1007/BF02294151, 1985.
Thiel, M. and Gutow, L.: The ecology of rafting in the marine environment. I. The floating substrata, Oceanogr. Mar. Biol. Ann. Rev., 42, 181–264, https://doi.org/10.1201/9780203507810.ch6, 2005a.
Thiel, M. and Gutow, L.: The ecology of rafting in the marine environment. II. The rafting organisms and community, Oceanogr. Mar. Biol. Ann. Rev., 43, 276–418, https://doi.org/10.1201/9781420037449.ch7, 2005b.
Thiel, M. and Gutow, L.: The ecology of rafting in the marine environment. III. Biogeographical and evolutionary consequences, Oceanogr. Mar. Biol. Ann. Rev., 44, 323–429, https://doi.org/10.1201/9781420006391.ch7, 2006.
Thrush, S. F. and Dayton, P. K.: Disturbance to marine benthic habitats by trawling and dredging: implications for marine biodiversity, Annu. Rev. Ecol. Evol. Syst., 33, 449–473, https://doi.org/10.1146/annurev.ecolsys.33.010802.150515, 2002.
Tillin, H. M., Hiddink, J. G., Jennings, S., and Kaiser, M. J.: Chronic bottom trawling alters the functional composition of benthic invertebrate communities on a sea-basin scale, Mar. Ecol. Prog. Ser., 318, 31–45, https://doi.org/10.3354/meps318031, 2006.
Tomanek, L. and Helmuth, B.: Physiological ecology of rocky intertidal organisms: a synergy of concepts, Integr. Comp. Biol., 42, 771–775, https://doi.org/10.1093/icb/42.4.771, 2002.
Törnroos, A. and Bonsdorff, E.: Developing the multitrait concept for functional diversity: lessons from a system rich in functions but poor in species, Ecol. Appl., 22, 2221–2236, https://doi.org/10.1890/11-2042.1, 2012.
Townsend, C. R. and Hildrew, A. G.: Species traits in relation to a habitat templet for river systems, Freshwater Biol., 31, 265–275, https://doi.org/10.1111/j.1365-2427.1994.tb01740.x, 1994.
Trudgill, S.: Bioerosion of intertidal limestone, Co. Clare, Eire – 3: Zonation, process and form, Mar. Geol., 74, 111–121, https://doi.org/10.1016/0025-3227(87)90009-0, 1987.
Trudgill, S.: Integrated geomorphological and ecological studies on rocky shores in southern Britain, Field Stud., 7, 239–279, 1988.
Tseng, L. C., Huang, S. P., Das, S., Chen, I. S., Shao, K. T., and Hwang, J. S.: A slender symbiotic goby hiding in burrows of mud shrimp Austinogebia edulis in western Taiwan, PLOS ONE, 14, e0219815, https://doi.org/10.1371/journal.pone.0219815, 2019.
Tyler, E. H. M., Somerfield, P. J., Berghe, E. V., Bremner, J., Jackson, E., Langmead, O., Palomares, M. L. D., and Webb, T. J.: Extensive gaps and biases in our knowledge of a well-known fauna: implications for integrating biological traits into macroecology, Global Ecol. Biogeogr., 21, 922–934, https://doi.org/10.1111/j.1466-8238.2011.00726.x, 2012.
Usseglio-Polatera, P., Bournaud, M., Richoux, P., and Tachet, H.: Biological and ecological traits of benthic freshwater macroinvertebrates: relationships and definition of groups with similar traits, Freshwater Biol., 43, 175–205, https://doi.org/10.1046/j.1365-2427.2000.00535.x, 2000.
Vance, R. R.: On reproductive strategies in marine benthic invertebrates, Am. Nat., 107, 339–352, https://doi.org/10.1086/282838, 1973.
Varpe, Ø. and Ejsmond, M. J.: Semelparity and iteroparity, in: The Natural History of the Crustacea Series – Life histories, Volume 5, edited by: Wellborn, G. A. and Thiel, M., Oxford University press, New York, 97–123, https://doi.org/10.1093/oso/9780190620271.001.0001, 2018.
Vellend, M.: Conceptual synthesis in community ecology, Quart. Rev. Biol., 85, 183–206, https://doi.org/10.1086/652373, 2010.
Violle, C., Navas, M. L., Vile, D., Kazakou, E., Fortunel, C., Hummel, I., and Garnier, E.: Let the concept of trait be functional!, Oikos, 116, 882–892, https://doi.org/10.1111/j.0030-1299.2007.15559.x, 2007.
Volkenborn, N., Meile, C., Polerecky, L., Pilditch, C. A., Norkko, A., Norkko, J., Hewitt, J. E., Thrush, S. F., Wethey, D. S., and Woodin, S. A.: Intermittent bioirrigation and oxygen dynamics in permeable sediments: an experimental and modeling study of three tellinid bivalves, J. Mar. Res., 70, 794–823, https://doi.org/10.1357/002224012806770955, 2012.
Volkenborn, N., Woodin, S. A., Wethey, D. S., and Polerecky, L.: Bioirrigation in marine sediments, in: Reference Module in Earth Systems and Environmental Sciences, edited by: Elias, S. A., Elsevier, 1–10, https://doi.org/10.1016/B978-0-12-409548-9.09525-7, 2016.
Walker, K. R. and Bambach, R. K.: Feeding by benthic invertebrates: Classification and terminology for paleoecological analysis, Lethaia, 7, 67–78, https://doi.org/10.1111/j.1502-3931.1974.tb00886.x, 1974.
Walsh, D. M.: Fitness and function, Brit. J. Philos. Sci., 47, 553–574, https://doi.org/10.1093/bjps/47.4.553, 1996.
Ward, J. E. and Shumway, S. E.: Separating the grain from the chaff: particle selection in suspension- and deposit-feeding bivalves, J. Exp. Mar. Biol. Ecol., 300, 83–130, https://doi.org/10.1016/j.jembe.2004.03.002, 2004.
Warwick, R. M.: Species size distributions in marine benthic communities, Oecologia, 61, 32–41, https://doi.org/10.1007/BF00379085, 1984.
Webb, T. J., Tyler, E. H. M., and Somerfield, P. J.: Life history mediates large-scale population ecology in marine benthic taxa, Mar. Ecol. Prog. Ser., 396, 293–306, https://doi.org/10.3354/meps08253, 2009.
Weiss, K. C. B. and Courtenay R. A.: Unifying functional trait approaches to understand the assemblage of ecological communities: Synthesizing taxonomic divides, Ecography, 42, 2012–2020, https://doi.org/10.1111/ecog.04387, 2019.
Wentworth, C. K.: A scale of grade and class terms for clastic sediments, J. Geol., 30, 377–392, https://doi.org/10.1086/622910, 1922.
White, E. P., Ernest, S. K. M., Kerkhoff, A. J., and Enquist, B. J.: Relationships between body size and abundance in ecology, Trends Ecol. Evol., 22, 323–330, https://doi.org/10.1016/j.tree.2007.03.007, 2007.
Wiesebron, L. E., Steiner, N., Morys, C., Ysebaert, T., and Bouma, T. J.: Sediment bulk density effects on benthic macrofauna burrowing and bioturbation behavior, Front. Mar. Sci. 8, 707785, https://doi.org/10.3389/fmars.2021.707785, 2021.
Wildish, D. J.: Factors controlling marine and estuarine sublittoral macrofauna, Helgoländer Wiss. Meeresunters., 30, 445–454, https://doi.org/10.1007/bf02207853, 1977.
Wildish, D. L. and Peer, D.: Tidal current speed and production of benthic macrofauna in the lower Bay of Fundy, Can. J. Fish. Aquat. Sci., 40, 309–321, https://doi.org/10.1139/f83-292, 1983.
Willby, N. J., Abernethy, V. J., and Demars, B. O. L.: Attribute-based classification of European hydrophytes and its relationship to habitat utilization, Freshwater Biol., 43, 43–74, https://doi.org/10.1046/j.1365-2427.2000.00523.x, 2000.
Williams, G. C.: Sex and Evolution, Princeton University Press, Princeton, ISBN 9780691081526, 1975.
Wong, M. C. and Dowd, M.: Patterns in taxonomic and functional diversity of macrobenthic invertebrates across seagrass habitats: a case study in Atlantic Canada, Estuar. Coasts, 38, 2323–2336, https://doi.org/10.1007/s12237-015-9967-x, 2015.
Woodin, S. A.: Refuges, disturbance, and community structure: a marine soft-bottom example, Ecology, 59, 274–284, https://doi.org/10.2307/1936373, 1978.
WoRMS Editorial Board: World Register of Marine Species, VLIZ, https://doi.org/10.14284/170, 2026.
Wrede, A., Beermann, J., Dannheim, J., Gutow L., and Brey, T.: Organism functional traits and ecosystem supporting services – A novel approach to predict bioirrigation, Ecol. Indic., 91, 737–743, https://doi.org/10.1016/j.ecolind.2018.04.026, 2018.
Yamanaka, T., White, P. C. L., Spencer, M., and Raffaelli, D.: Patterns and processes in abundance–body size relationships for marine benthic invertebrates, J. Anim. Ecol., 81, 463–471, https://doi.org/10.1111/j.1365-2656.2011.01921.x, 2012.
Yonge, C. M.: Feeding mechanisms in invertebrates, Biol. Rev., 3, 21–76, https://doi.org/10.1111/j.1469-185X.1928.tb00882.x, 1928.
Young, D. K. and Rhoads, D. C.: Animal-sediment relations in Cape Cod Bay, Massachusetts I. A transect study, Mar. Biol., 11, 242–254, https://doi.org/10.1007/BF00401272, 1971.
Ysebaert, T., Walles, B., Haner, J., and Hancock, B.: Habitat modification and coastal protection by ecosystem-engineering reef-building bivalves, in: Goods and Services of Marine Bivalves, edited by: Smaal, A. C., Ferreira, J. G., Grant, J., Petersen, J. K., and Strand, Ø., Springer, Cham, 253–273, https://doi.org/10.1007/978-3-319-96776-9_28, 2019.
- Abstract
- Introduction
- Research purposes and trait data classification
- Trait relevance and terminology
- Trait quantification
- Data overview
- Discussion
- Data availability
- Conclusions
- Appendix A: Are scores greater than one needed in fuzzy coding?
- Author contributions
- Competing interests
- Disclaimer
- Acknowledgements
- Financial support
- Review statement
- References
- Supplement
- Abstract
- Introduction
- Research purposes and trait data classification
- Trait relevance and terminology
- Trait quantification
- Data overview
- Discussion
- Data availability
- Conclusions
- Appendix A: Are scores greater than one needed in fuzzy coding?
- Author contributions
- Competing interests
- Disclaimer
- Acknowledgements
- Financial support
- Review statement
- References
- Supplement