Articles | Volume 18, issue 11
https://doi.org/10.5194/essd-18-8345-2026
© Author(s) 2026. This work is distributed under
the Creative Commons Attribution 4.0 License.
the Creative Commons Attribution 4.0 License.
https://doi.org/10.5194/essd-18-8345-2026
© Author(s) 2026. This work is distributed under
the Creative Commons Attribution 4.0 License.
the Creative Commons Attribution 4.0 License.
Data description article
| 
17 Nov 2026
Data description article |
| 17 Nov 2026
| 17 Nov 2026
Global consumption-based deforestation carbon emissions and regional hotspots: 2001–2020
Dongmei Tang
Key Laboratory of Geographic Information Science (Ministry of Education), School of Geographic Sciences, East China Normal University, Shanghai, 200241, China

Key Laboratory of Geographic Information Science (Ministry of Education), School of Geographic Sciences, East China Normal University, Shanghai, 200241, China
Rui Li
Key Laboratory of Geographic Information Science (Ministry of Education), School of Geographic Sciences, East China Normal University, Shanghai, 200241, China
Key Laboratory of Geographic Information Science (Ministry of Education), School of Geographic Sciences, East China Normal University, Shanghai, 200241, China
Related authors
Rui Li, Yumeng Shao, Dongmei Tang, Yining Gao, and Hongfang Zhao
Atmos. Chem. Phys., 25, 14501–14511, https://doi.org/10.5194/acp-25-14501-2025, https://doi.org/10.5194/acp-25-14501-2025, 2025
Short summary
Short summary
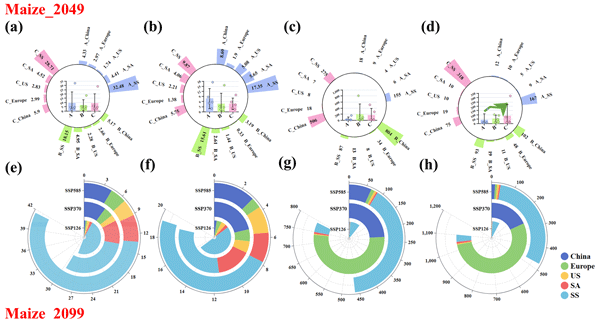
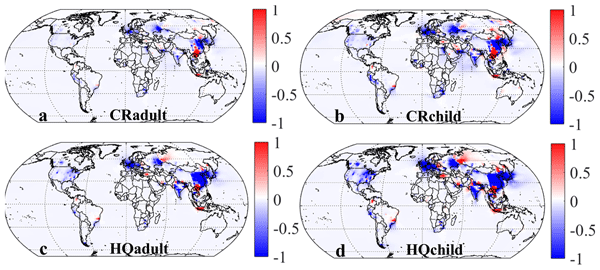
In both of historical and future scenarios, Sub-Sahara Africa (SS) and South America (SA) showed the highest fire-sourced maximum daily 8 h average (MDA8) O3 concentrations. However, the crop production losses (CPL) caused by O3 exposure reached the highest values in China. The emission control measures largely decreased the O3 damage to crop in China instead of SS and SA.
Dongmei Tang, Yuanzhi Yao, and Xia Li
Earth Syst. Sci. Data Discuss., https://doi.org/10.5194/essd-2024-619, https://doi.org/10.5194/essd-2024-619, 2025
Manuscript not accepted for further review
Short summary
Short summary
We developed a global consumption-based carbon emissions gridded dataset (1 km) for deforestation from 2001 to 2015. Our dataset shows that trade-related emissions account for 31 % of global deforestation emissions, with high-income countries driving most of the emissions. This research highlights the importance of addressing consumption patterns in climate change strategies and offers valuable data to inform global policy and emission reduction efforts.
Kaitao Chen, Zheng Li, Rui Li, Luyao Chen, Rongjie Li, Binyu Xiao, Shaojun Lv, Can Wu, Rui Li, Junke Zhang, and Gehui Wang
Atmos. Chem. Phys., 26, 14329–14343, https://doi.org/10.5194/acp-26-14329-2026, https://doi.org/10.5194/acp-26-14329-2026, 2026
Short summary
Short summary
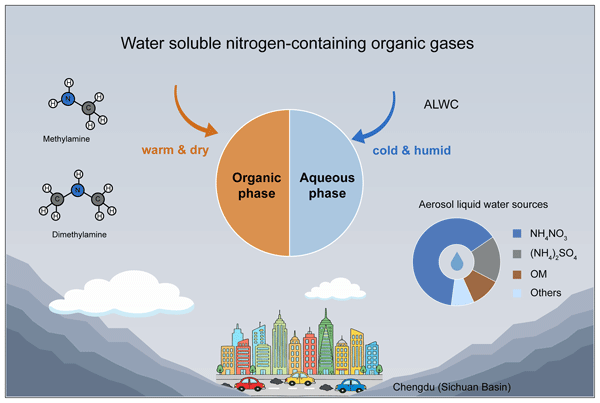
During winter haze in Chengdu, water-soluble organic nitrogen compounds shift from gas to particles, with concentrations more than doubling. The main driver is particle water content, not acidity or temperature. As particles absorb water, they take up these compounds, fueling aerosol growth. This study reveals how nitrogen-rich organic aerosols form in humid air, aiding pollution control strategies.
Zihao Bian, Hao Shi, Rui Li, Fei Lun, Francesco N. Tubiello, Nathaniel D. Mueller, Shiyu You, Rong Hao, Jiageng Ma, Longhui Li, Changchun Huang, Bing He, Yuanzhi Yao, and Hanqin Tian
Earth Syst. Sci. Data, 18, 7125–7141, https://doi.org/10.5194/essd-18-7125-2026, https://doi.org/10.5194/essd-18-7125-2026, 2026
Short summary
Short summary
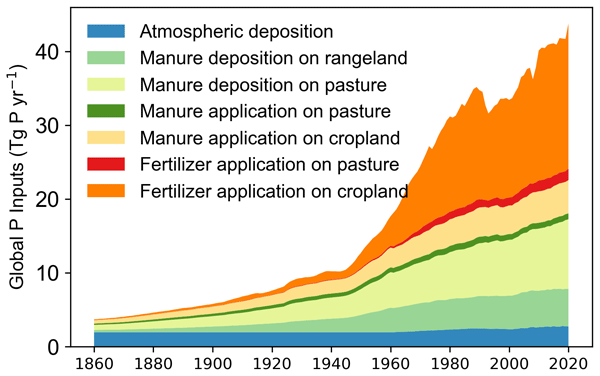
The History of Anthropogenic Phosphorus Inputs (HaPi) provides a dataset of global human-driven phosphorus fluxes to terrestrial biosphere from 1860–2020 at a resolution of 5 arcmin. This comprehensive dataset consists of phosphorus fertilizer/manure application to cropland, manure application/deposition to pasture, manure deposition to rangeland, and atmospheric phosphorus deposition. It supports analyses of nutrient budgets and provides essential forcing data for Earth system models.
Fan Yang, Guanpeng Dong, Xiaoyu Meng, Richard A. Houghton, Yang Gao, Fanneng He, Meijiao Li, Wenjin Li, Bing Li, Zhihao Liu, Qinqin Mao, Pengfei Wu, Yuanzhi Yao, Xudong Zhai, Hongjuan Zhang, and Chao Yue
Earth Syst. Sci. Data, 18, 875–902, https://doi.org/10.5194/essd-18-875-2026, https://doi.org/10.5194/essd-18-875-2026, 2026
Short summary
Short summary
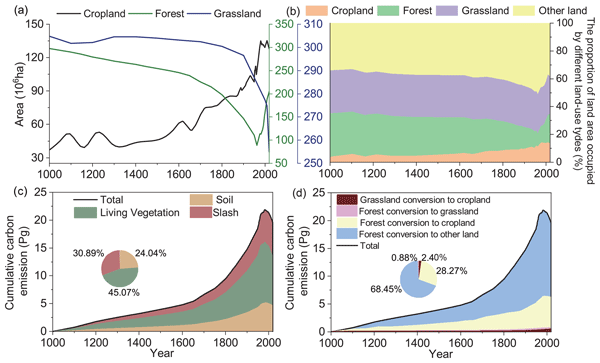
We used a millennial dataset of land-use change in China, combined with comprehensive soil and vegetation carbon density datasets, to quantify China’s annual carbon emissions resulting from land-use change between 1000 and 2019 using a bookkeeping model. The annual carbon emission flux provides a robust historical baseline for assessing terrestrial ecosystem carbon budgets at national and provincial scales, both in the present and future.
Rui Li, Yumeng Shao, Dongmei Tang, Yining Gao, and Hongfang Zhao
Atmos. Chem. Phys., 25, 14501–14511, https://doi.org/10.5194/acp-25-14501-2025, https://doi.org/10.5194/acp-25-14501-2025, 2025
Short summary
Short summary
In both of historical and future scenarios, Sub-Sahara Africa (SS) and South America (SA) showed the highest fire-sourced maximum daily 8 h average (MDA8) O3 concentrations. However, the crop production losses (CPL) caused by O3 exposure reached the highest values in China. The emission control measures largely decreased the O3 damage to crop in China instead of SS and SA.
Wenwen Sun, Xing Liu, and Rui Li
Atmos. Chem. Phys., 25, 13007–13018, https://doi.org/10.5194/acp-25-13007-2025, https://doi.org/10.5194/acp-25-13007-2025, 2025
Short summary
Short summary
We predicted global variations in atmospheric nine hazardous trace metal levels and assess their responses to COVID-19 lockdown measures. The rise in Pb and Zn concentrations during lockdowns was primarily linked to sustained coal combustion and non-ferrous smelting activities. The reduced emissions of Pb and As during the lockdown period yielded the greatest health benefits. Targeting fossil fuel combustion should be prioritized in Pb and As mitigation strategies.
Rui Li, Xing Liu, Yubing Shen, Yumeng Shao, Yining Gao, Ziwei Yao, Xi Liu, and Guitao Shi
Atmos. Chem. Phys., 25, 9263–9274, https://doi.org/10.5194/acp-25-9263-2025, https://doi.org/10.5194/acp-25-9263-2025, 2025
Short summary
Short summary
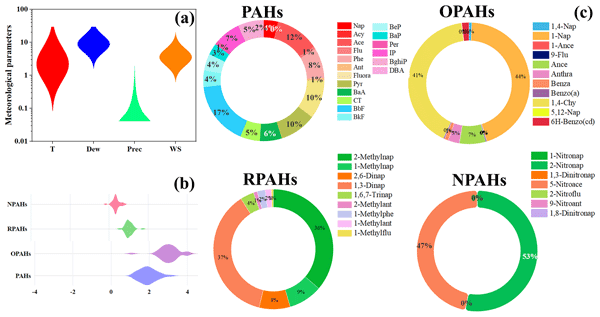
We reveal for the first time the global variations of PAHs and derivatives in marine air. We found that marine aerosols in East China Sea (ECS) and Western Pacific (WP) were significantly affected by coal and engine combustion, while those in Bismarck Sea (BS) and East Australian Sea (EAS) were mainly influenced by wildfire and coal combustion. The Antarctic Ocean (AO) was dominated by biomass burning and local shipping emissions. This finding helps elucidate the mechanism of the global PAH cycle.
Binyu Xiao, Fan Zhang, Zeyu Liu, Yan Zhang, Rui Li, Can Wu, Xinyi Wan, Yi Wang, Yubao Chen, Yong Han, Min Cui, Libo Zhang, Yingjun Chen, and Gehui Wang
Atmos. Chem. Phys., 25, 7053–7069, https://doi.org/10.5194/acp-25-7053-2025, https://doi.org/10.5194/acp-25-7053-2025, 2025
Short summary
Short summary
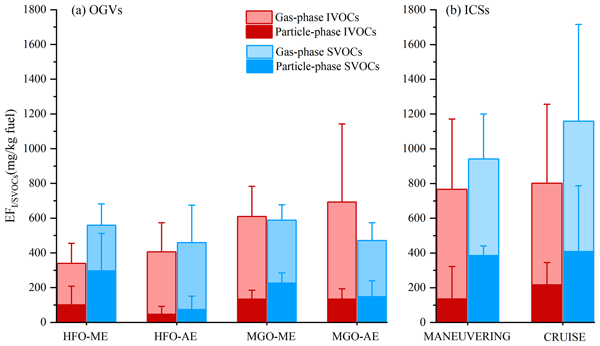
Intermediate-volatility/semi-volatile organic compounds in gas and particle phases from ship exhausts are enhanced due to the switch of fuels from low sulfur to ultra-low sulfur. The findings indicate that optimization is necessary for the forthcoming global implementation of an ultra-low-sulfur oil policy. Besides, we find that organic diagnostic markers of hopanes in conjunction with the ratio of octadecanoic to tetradecanoic could be considered potential tracers for heavy fuel oil exhausts.
Dongmei Tang, Yuanzhi Yao, and Xia Li
Earth Syst. Sci. Data Discuss., https://doi.org/10.5194/essd-2024-619, https://doi.org/10.5194/essd-2024-619, 2025
Manuscript not accepted for further review
Short summary
Short summary
We developed a global consumption-based carbon emissions gridded dataset (1 km) for deforestation from 2001 to 2015. Our dataset shows that trade-related emissions account for 31 % of global deforestation emissions, with high-income countries driving most of the emissions. This research highlights the importance of addressing consumption patterns in climate change strategies and offers valuable data to inform global policy and emission reduction efforts.
Baoye Hu, Naihua Chen, Rui Li, Mingqiang Huang, Jinsheng Chen, Youwei Hong, Lingling Xu, Xiaolong Fan, Mengren Li, Lei Tong, Qiuping Zheng, and Yuxiang Yang
Atmos. Chem. Phys., 25, 905–921, https://doi.org/10.5194/acp-25-905-2025, https://doi.org/10.5194/acp-25-905-2025, 2025
Short summary
Short summary
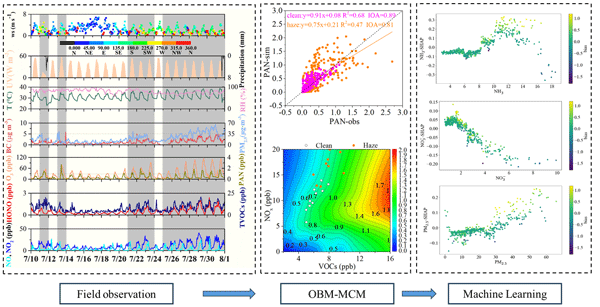
Box modeling with the Master Chemical Mechanism (MCM) was used to explore summertime peroxyacetyl nitrate (PAN) formation and its link to aerosol pollution under high-ozone conditions. The MCM model is effective in the study of PAN photochemical formation and performed better during the clean period than the haze period. Machine learning analysis identified ammonia, nitrate, and fine particulate matter as the top three factors contributing to simulation bias.
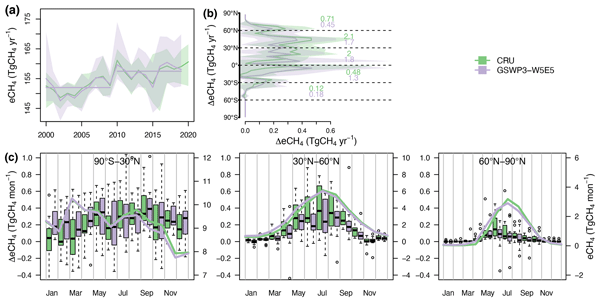
Zhen Zhang, Benjamin Poulter, Joe R. Melton, William J. Riley, George H. Allen, David J. Beerling, Philippe Bousquet, Josep G. Canadell, Etienne Fluet-Chouinard, Philippe Ciais, Nicola Gedney, Peter O. Hopcroft, Akihiko Ito, Robert B. Jackson, Atul K. Jain, Katherine Jensen, Fortunat Joos, Thomas Kleinen, Sara H. Knox, Tingting Li, Xin Li, Xiangyu Liu, Kyle McDonald, Gavin McNicol, Paul A. Miller, Jurek Müller, Prabir K. Patra, Changhui Peng, Shushi Peng, Zhangcai Qin, Ryan M. Riggs, Marielle Saunois, Qing Sun, Hanqin Tian, Xiaoming Xu, Yuanzhi Yao, Yi Xi, Wenxin Zhang, Qing Zhu, Qiuan Zhu, and Qianlai Zhuang
Biogeosciences, 22, 305–321, https://doi.org/10.5194/bg-22-305-2025, https://doi.org/10.5194/bg-22-305-2025, 2025
Short summary
Short summary
This study assesses global methane emissions from wetlands between 2000 and 2020 using multiple models. We found that wetland emissions increased by 6–7 Tg CH4 yr-1 in the 2010s compared to the 2000s. Rising temperatures primarily drove this increase, while changes in precipitation and CO2 levels also played roles. Our findings highlight the importance of wetlands in the global methane budget and the need for continuous monitoring to understand their impact on climate change.
Si Zhang, Yining Gao, Xinbei Xu, Luyao Chen, Can Wu, Zheng Li, Rongjie Li, Binyu Xiao, Xiaodi Liu, Rui Li, Fan Zhang, and Gehui Wang
Atmos. Chem. Phys., 24, 14177–14190, https://doi.org/10.5194/acp-24-14177-2024, https://doi.org/10.5194/acp-24-14177-2024, 2024
Short summary
Short summary
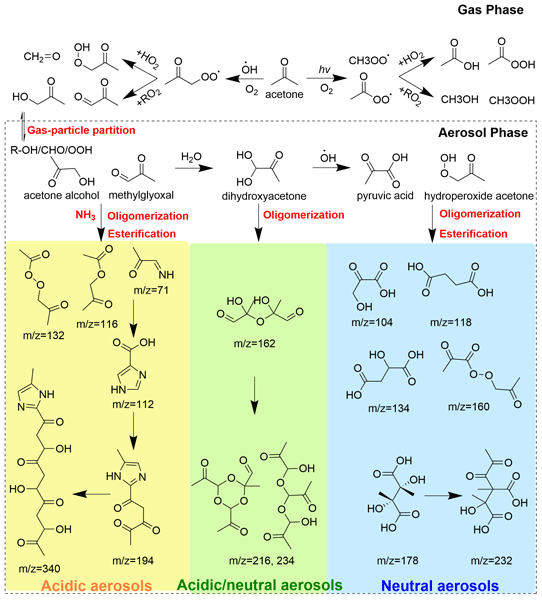
Secondary organic aerosols (SOAs) from acetone photooxidation in the presence of various seeds were studied to illustrate SOA formation kinetics under ammonia-rich conditions. The oxidation mechanism of acetone was investigated using an observation-based model incorporating a Master Chemical Mechanism model. A higher SOA yield of acetone was observed compared to methylglyoxal due to an enhanced uptake of the small photooxidation products of acetone.
Xinbei Xu, Yining Gao, Si Zhang, Luyao Chen, Rongjie Li, Zheng Li, Rui Li, and Gehui Wang
EGUsphere, https://doi.org/10.5194/egusphere-2024-3046, https://doi.org/10.5194/egusphere-2024-3046, 2024
Preprint archived
Short summary
Short summary
This work systematically explained the nonlinear effect of NOx level on isoprene-SOA mass yield through a series of chamber experiments. We found that the turning point under various oxidants was smaller than previous reported in the presence of OH precursors, which could be attributed to the RO2 pathway competition in nucleation and condensation of low volatile products. The highest SOA yield was at a branching ratio β of 0.5, which can be used as a reference for field campaign and modeling.
Can Wu, Xiaodi Liu, Ke Zhang, Si Zhang, Cong Cao, Jianjun Li, Rui Li, Fan Zhang, and Gehui Wang
Atmos. Chem. Phys., 24, 9263–9275, https://doi.org/10.5194/acp-24-9263-2024, https://doi.org/10.5194/acp-24-9263-2024, 2024
Short summary
Short summary
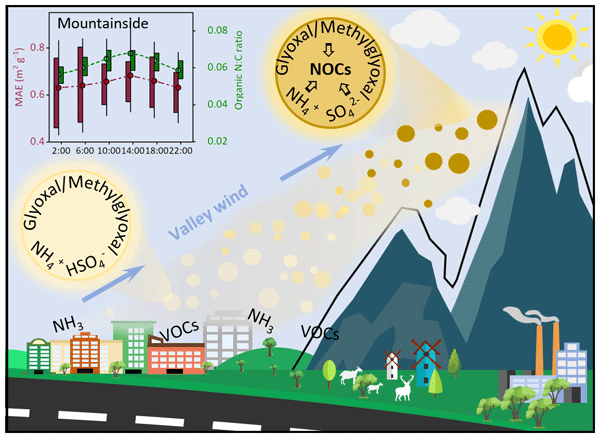
Brown carbon (BrC) is prevalent in the troposphere and can efficiently absorb solar and terrestrial radiation. Our observations show that the enhanced light absorption of BrC relative to black carbon at the tropopause can be attributed to the formation of nitrogen-containing organic compounds through the aqueous-phase reactions of carbonyls with ammonium.
Fan Zhang, Binyu Xiao, Zeyu Liu, Yan Zhang, Chongguo Tian, Rui Li, Can Wu, Yali Lei, Si Zhang, Xinyi Wan, Yubao Chen, Yong Han, Min Cui, Cheng Huang, Hongli Wang, Yingjun Chen, and Gehui Wang
Atmos. Chem. Phys., 24, 8999–9017, https://doi.org/10.5194/acp-24-8999-2024, https://doi.org/10.5194/acp-24-8999-2024, 2024
Short summary
Short summary
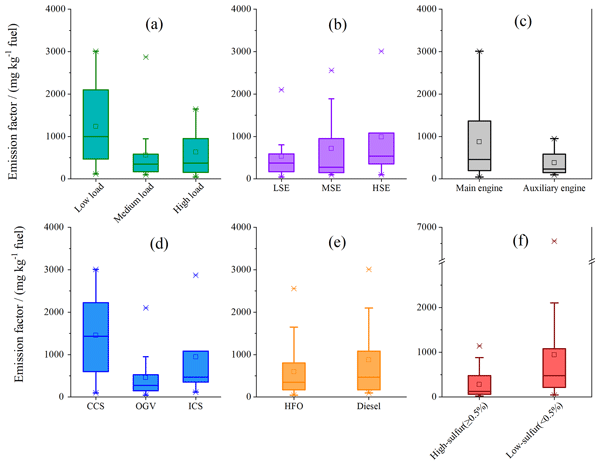
Mandatory use of low-sulfur fuel due to global sulfur limit regulations means large uncertainties in volatile organic compound (VOC) emissions. On-board tests of VOCs from nine cargo ships in China were carried out. Results showed that switching from heavy-fuel oil to diesel increased emission factor VOCs by 48 % on average, enhancing O3 and the secondary organic aerosol formation potential. Thus, implementing a global ultra-low-sulfur oil policy needs to be optimized in the near future.
Shijie Liu, Xinbei Xu, Si Zhang, Rongjie Li, Zheng Li, Can Wu, Rui Li, Guiqin Zhang, and Gehui Wang
EGUsphere, https://doi.org/10.5194/egusphere-2024-1599, https://doi.org/10.5194/egusphere-2024-1599, 2024
Preprint archived
Short summary
Short summary
We conducted α-pinene photooxidation experiments in an atmospheric chamber at different NOx concentrations. The increased distribution coefficient of the oxidation products between the aerosol and gas phases with NOx was responsible for the increased SOA yields with NOx under low-NOx conditions. We also found the fraction of SOA made up of nitrogen-containing organic compounds (NOCs) increased with NOx.
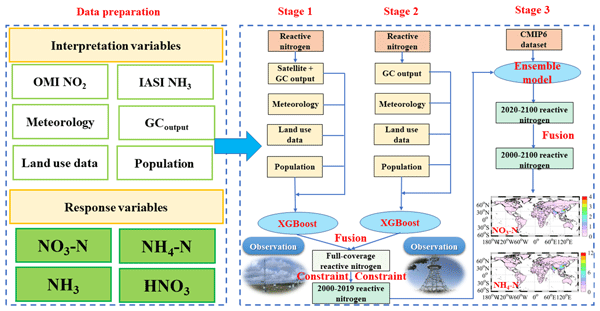
Rui Li, Yining Gao, Lijia Zhang, Yubing Shen, Tianzhao Xu, Wenwen Sun, and Gehui Wang
Atmos. Chem. Phys., 24, 7623–7636, https://doi.org/10.5194/acp-24-7623-2024, https://doi.org/10.5194/acp-24-7623-2024, 2024
Short summary
Short summary
A three-stage model was developed to obtain the global maps of reactive nitrogen components during 2000–2100. The results implied that cross-validation R2 values of four species showed satisfactory performance (R2 > 0.55). Most reactive nitrogen components, except NH3, in China showed increases during 2000–2013. In the future scenarios, SSP3-7.0 (traditional-energy scenario) and SSP1-2.6 (carbon neutrality scenario) showed the highest and lowest reactive nitrogen component concentrations.

Hanqin Tian, Naiqing Pan, Rona L. Thompson, Josep G. Canadell, Parvadha Suntharalingam, Pierre Regnier, Eric A. Davidson, Michael Prather, Philippe Ciais, Marilena Muntean, Shufen Pan, Wilfried Winiwarter, Sönke Zaehle, Feng Zhou, Robert B. Jackson, Hermann W. Bange, Sarah Berthet, Zihao Bian, Daniele Bianchi, Alexander F. Bouwman, Erik T. Buitenhuis, Geoffrey Dutton, Minpeng Hu, Akihiko Ito, Atul K. Jain, Aurich Jeltsch-Thömmes, Fortunat Joos, Sian Kou-Giesbrecht, Paul B. Krummel, Xin Lan, Angela Landolfi, Ronny Lauerwald, Ya Li, Chaoqun Lu, Taylor Maavara, Manfredi Manizza, Dylan B. Millet, Jens Mühle, Prabir K. Patra, Glen P. Peters, Xiaoyu Qin, Peter Raymond, Laure Resplandy, Judith A. Rosentreter, Hao Shi, Qing Sun, Daniele Tonina, Francesco N. Tubiello, Guido R. van der Werf, Nicolas Vuichard, Junjie Wang, Kelley C. Wells, Luke M. Western, Chris Wilson, Jia Yang, Yuanzhi Yao, Yongfa You, and Qing Zhu
Earth Syst. Sci. Data, 16, 2543–2604, https://doi.org/10.5194/essd-16-2543-2024, https://doi.org/10.5194/essd-16-2543-2024, 2024
Short summary
Short summary
Atmospheric concentrations of nitrous oxide (N2O), a greenhouse gas 273 times more potent than carbon dioxide, have increased by 25 % since the preindustrial period, with the highest observed growth rate in 2020 and 2021. This rapid growth rate has primarily been due to a 40 % increase in anthropogenic emissions since 1980. Observed atmospheric N2O concentrations in recent years have exceeded the worst-case climate scenario, underscoring the importance of reducing anthropogenic N2O emissions.
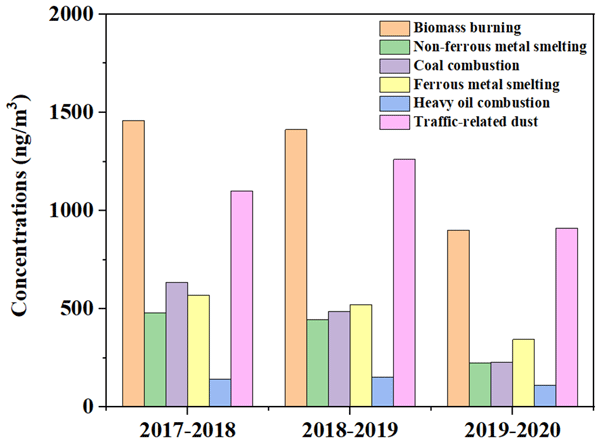
Rui Li, Yining Gao, Yubao Chen, Meng Peng, Weidong Zhao, Gehui Wang, and Jiming Hao
Atmos. Chem. Phys., 23, 4709–4726, https://doi.org/10.5194/acp-23-4709-2023, https://doi.org/10.5194/acp-23-4709-2023, 2023
Short summary
Short summary
A random forest model was used to isolate the effects of emission and meteorology to trace elements in PM2.5 in Tangshan. The results suggested that control measures facilitated decreases of Ga, Co, Pb, Zn, and As, due to the strict implementation of coal-to-gas strategies and optimisation of industrial structure and layout. However, the deweathered levels of Ca, Cr, and Fe only displayed minor decreases, indicating that ferrous metal smelting and vehicle emission controls should be enhanced.
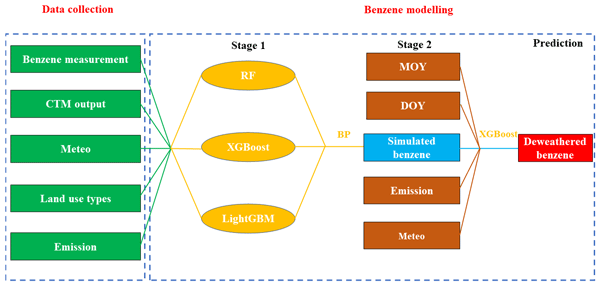
Chaohao Ling, Lulu Cui, and Rui Li
Atmos. Chem. Phys., 23, 3311–3324, https://doi.org/10.5194/acp-23-3311-2023, https://doi.org/10.5194/acp-23-3311-2023, 2023
Short summary
Short summary
An ensemble machine-learning model coupled with chemical transport models (CTMs) was applied to assess the impact of COVID-19 on ambient benzene. The change ratio of the deweathered benzene concentration from the pre-lockdown to lockdown period was in the order of India (−23.6 %) > Europe (−21.9 %) > the United States (−16.2 %) > China (−15.6 %), which might be associated with local serious benzene pollution and substantial emission reduction in the industrial and transportation sectors.
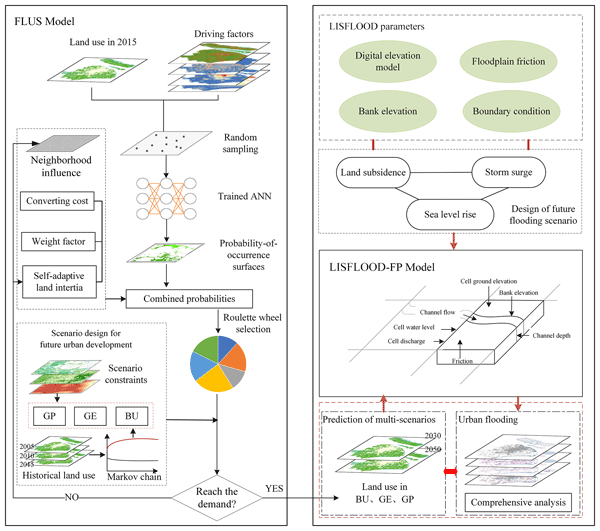
Qinke Sun, Jiayi Fang, Xuewei Dang, Kepeng Xu, Yongqiang Fang, Xia Li, and Min Liu
Nat. Hazards Earth Syst. Sci., 22, 3815–3829, https://doi.org/10.5194/nhess-22-3815-2022, https://doi.org/10.5194/nhess-22-3815-2022, 2022
Short summary
Short summary
Flooding by extreme weather events and human activities can lead to catastrophic impacts in coastal areas. The research illustrates the importance of assessing the performance of different future urban development scenarios in response to climate change, and the simulation study of urban risks will prove to decision makers that incorporating disaster prevention measures into urban development plans will help reduce disaster losses and improve the ability of urban systems to respond to floods.

Bowen Cao, Le Yu, Xuecao Li, Min Chen, Xia Li, Pengyu Hao, and Peng Gong
Earth Syst. Sci. Data, 13, 5403–5421, https://doi.org/10.5194/essd-13-5403-2021, https://doi.org/10.5194/essd-13-5403-2021, 2021
Short summary
Short summary
In the study, the first 1 km global cropland proportion dataset for 10 000 BCE–2100 CE was produced through the harmonization and downscaling framework. The mapping result coincides well with widely used datasets at present. With improved spatial resolution, our maps can better capture the cropland distribution details and spatial heterogeneity. The dataset will be valuable for long-term simulations and precise analyses. The framework can be extended to specific regions or other land use types.
Cited articles
Cook-Patton, S. C., Leavitt, S. M., Gibbs, D., Harris, N. L., Lister, K., Anderson-Teixeira, K. J., Briggs, R. D., Chazdon, R. L., Crowther, T. W., Ellis, P. W., Griscom, H. P., Herrmann, V., Holl, K. D., Houghton, R. A., Larrosa, C., Lomax, G., Lucas, R., Madsen, P., Malhi, Y., Paquette, A., Parker, J. D., Paul, K., Routh, D., Roxburgh, S., Saatchi, S., van den Hoogen, J., Walker, W. S., Wheeler, C. E., Wood, S. A., Xu, L., and Griscom, B. W.: Mapping carbon accumulation potential from global natural forest regrowth, Nature, 585, 545–550, https://doi.org/10.1038/s41586-020-2686-x, 2020.
Curtis, P. G., Slay, C. M., Harris, N. L., Tyukavina, A., and Hansen, M. C.: Classifying drivers of global forest loss, Science, 361, 1108–1111, https://doi.org/10.1126/science.aau3445, 2018.
DeFries, R. S., Rudel, T., Uriarte, M., and Hansen, M.: Deforestation driven by urban population growth and agricultural trade in the twenty-first century, Nat. Geosci., 3, 178–181, https://doi.org/10.1038/ngeo756, 2010.
FAO: Global Forest Resources Assessment, Rome, https://doi.org/10.4060/cd6709en, 2025.
Friis, C. and Nielsen, J. Ø.: Telecoupling: Exploring land-use change in a globalised world, Palgrave Studies in Natural Resource Management, Springer, Switzerland, https://doi.org/10.1007/978-3-030-11105-2, 2019.
Gries, T., Naudé, W., and Matthee, M.: The optimal distance to port for exporting firms, J. Regional Sci., 49, 513–528, https://doi.org/10.1111/j.1467-9787.2008.00599.x, 2009.
Hansen, M. C., Potapov, P. V., Moore, R., Hancher, M., Turubanova, S. A., Tyukavina, A., Thau, D., Stehman, S. V., Goetz, S. J., Loveland, T. R., Kommareddy, A., Egorov, A., Chini, L., Justice, C. O., and Townshend, J. R.: High-resolution global maps of 21st-century forest cover change, Science, 342, 850–853, https://doi.org/10.1126/science.1244693, 2013.
Harris, N. L., Gibbs, D. A., Baccini, A., Birdsey, R. A., de Bruin, S., Farina, M., Fatoyinbo, L., Hansen, M. C., Herold, M., Houghton, R. A., Potapov, P. V., Suarez, D. R., Roman-Cuesta, R. M., Saatchi, S. S., Slay, C. M., Turubanova, S. A., and Tyukavina, A.: Global maps of twenty-first century forest carbon fluxes, Nat. Clim. Change, 11, 234–240, https://doi.org/10.1038/s41558-020-00976-6, 2021.
He, K., Mi, Z., Coffman, D. M., and Guan, D.: Using a linear regression approach to sequential interindustry model for time-lagged economic impact analysis, Struct. Change Econ. D., 62, 399–406, https://doi.org/10.1016/j.strueco.2022.03.017, 2022.
Henders, S., Persson, U. M., and Kastner, T.: Trading forests: land-use change and carbon emissions embodied in production and exports of forest-risk commodities, Environ. Res. Lett., 10, 125012, https://doi.org/10.1088/1748-9326/10/12/125012, 2015.
Hoang, N. T. and Kanemoto, K.: Mapping the deforestation footprint of nations reveals growing threat to tropical forests, Nat. Ecol. Evol., 5, 845–853, https://doi.org/10.1038/s41559-021-01417-z, 2021.
Hochard, J. and Barbier, E.: Market accessibility and economic growth: Insights from a new dimension of inequality, World Dev., 97, 279–297, https://doi.org/10.1016/j.worlddev.2017.04.018, 2017.
Hong, C., Zhao, H., Qin, Y., Burney, J. A., Pongratz, J., Hartung, K., Liu, Y., Moore, F. C., Jackson, R. B., Zhang, Q., and Davis, S. J.: Land-use emissions embodied in international trade, Science, 376, 597–603, https://doi.org/10.1126/science.abj1572, 2022.
Hosseiny, B., Zaboli, M., and Homayouni, S.: Forest Change Mapping using Multi-Source Satellite SAR, Optical, and LiDAR Remote Sensing Data, ISPRS Annals of the Photogrammetry, Remote Sensing and Spatial Information Sciences, 163–168, https://doi.org/10.5194/isprs-annals-X-4-2024-163-2024, .
Kanemoto, K., Moran, D., and Hertwich, E. G.: Mapping the Carbon Footprint of Nations, Environ. Sci. Technol., 50, 10512–10517, https://doi.org/10.1021/acs.est.6b03227, 2016.
Lambin, E. F., Gibbs, H. K., Heilmayr, R., Carlson, K. M., Fleck, L. C., Garrett, R. D., le Polain de Waroux, Y., McDermott, C. L., McLaughlin, D., Newton, P., Nolte, C., Pacheco, P., Rausch, L. L., Streck, C., Thorlakson, T., and Walker, N. F.: The role of supply-chain initiatives in reducing deforestation, Nat. Clim. Change, 8, 109–116, https://doi.org/10.1038/s41558-017-0061-1, 2018.
Lenzen, M., Moran, D., Kanemoto, K., and Geschke, A.: Building Eora: a global multi-region input-output database at high country and sector resolution, Econ. Syst. Res., 25, 20–49, https://doi.org/10.1080/09535314.2013.769938, 2013.
Lenzen, M., Sun, Y.-Y., Faturay, F., Ting, Y.-P., Geschke, A., and Malik, A.: The carbon footprint of global tourism, Nat. Clim. Change, 8, 522–528, https://doi.org/10.1038/s41558-018-0141-x, 2018.
Liu, W., Zhang, X., Zhao, T., Wang, J., Li, Z., and Liu, L.: Revealing the proximate drivers behind global tree cover loss using multisourced remote sensing products during 2000–2020, Forest Ecol. Manag., 579, https://doi.org/10.1016/j.foreco.2025.122501, 2025.
Liu, X., Zhang, J., Zhang, H., Tang, D., Hu, G., and Li, X.: China's Mismatch of Public Awareness and Biodiversity Threats under Economic Trade, Environ. Sci. Technol., 56, 9784–9796, https://doi.org/10.1021/acs.est.2c00844, 2022.
Meijer, J. R., Huijbregts, M. A. J., Schotten, K. C. G. J., and Schipper, A. M.: Global patterns of current and future road infrastructure, Environ. Res. Lett., 13, 064006, https://doi.org/10.1088/1748-9326/aabd42, 2018.
Moran, D., Giljum, S., Kanemoto, K., and Godar, J.: From Satellite to Supply Chain: New Approaches Connect Earth Observation to Economic Decisions, One Earth, 3, 5–8, https://doi.org/10.1016/j.oneear.2020.06.007, 2020.
Nelson, A., Weiss, D. J., van Etten, J., Cattaneo, A., McMenomy, T. S., and Koo, J.: A suite of global accessibility indicators, Sci. Data, 6, 266, https://doi.org/10.1038/s41597-019-0265-5, 2019.
Pendrill, F., Persson, U. M., Godar, J., and Kastner, T.: Deforestation displaced: trade in forest-risk commodities and the prospects for a global forest transition, Environ. Res. Lett., 14, 055003, https://doi.org/10.1088/1748-9326/ab0d41, 2019a.
Pendrill, F., Persson, U. M., Godar, J., Kastner, T., Moran, D., Schmidt, S., and Wood, R.: Agricultural and forestry trade drives large share of tropical deforestation emissions, Global Environ. Chang., 56, 1–10, https://doi.org/10.1016/j.gloenvcha.2019.03.002, 2019b.
Souza Jr., C.: Assessing the scale of rubber deforestation in southeast Asia, Nature, 623, 256–257, https://doi.org/10.1038/d41586-023-03153-9, 2023.
Tang, D., Yao, Y., Li, R., and Li, X.: Consumption-based Carbon Emissions for Deforestation (2001–2020), figshare [data set], https://doi.org/10.6084/m9.figshare.28091879, 2024.
Tang, D., Yao, Y., Shi, H., Xu, Y., Liu, X., Gao, M., Xie, B., and Li, X.: High-resolution mapping of global deforestation footprints and livelihood inequalities: Toward equitable forest governance, Land Use Policy, 171, 108281, https://doi.org/10.1016/j.landusepol.2026.108281, 2026.
Tubiello, F. N., Branthomme, A., Obli-Laryea, G., Piccoli, M., Ramadan, N., Condor, R. D., Wanner, N., Brivio, R., Jonsson, Ö., Conchedda, G., and Pekkarinen, A.: FAO estimates of net forest emissions and removals, 1990–2025, Earth Syst. Sci. Data, 18, 6799–6813, https://doi.org/10.5194/essd-18-6799-2026, 2026.
Verburg, P. H., Ellis, E. C., and Letourneau, A.: A global assessment of market accessibility and market influence for global environmental change studies, Environ. Res. Lett., 6, 034019, https://doi.org/10.1088/1748-9326/6/3/034019, 2011.
Wang, Y., Hollingsworth, P. M., Zhai, D., West, C. D., Green, J. M. H., Chen, H., Hurni, K., Su, Y., Warren-Thomas, E., Xu, J., and Ahrends, A.: High-resolution maps show that rubber causes substantial deforestation, Nature, 623, 340–346, https://doi.org/10.1038/s41586-023-06642-z, 2023.
Weiss, D. J., Nelson, A., Gibson, H. S., Temperley, W., Peedell, S., Lieber, A., Hancher, M., Poyart, E., Belchior, S., Fullman, N., Mappin, B., Dalrymple, U., Rozier, J., Lucas, T. C. D., Howes, R. E., Tusting, L. S., Kang, S. Y., Cameron, E., Bisanzio, D., Battle, K. E., Bhatt, S., and Gething, P. W.: A global map of travel time to cities to assess inequalities in accessibility in 2015, Nature, 553, 333–336, https://doi.org/10.1038/nature25181, 2018.
Wiedmann, T. and Lenzen, M.: Environmental and social footprints of international trade, Nat. Geosci., 11, 314–321, https://doi.org/10.1038/s41561-018-0113-9, 2018.
Yang, Y., Qu, S., Cai, B., Liang, S., Wang, Z., Wang, J., and Xu, M.: Mapping global carbon footprint in China, Nat. Commun., 11, 2237, https://doi.org/10.1038/s41467-020-15883-9, 2020.
Short summary
We present a global, gridded dataset (1 km resolution) of consumption-based deforestation carbon emissions for the period 2001 to 2020. Our dataset shows that deforestation emissions embodied in international trade account for 31.8 % of global deforestation emissions. It provides spatially explicit information to support analyses of consumption-driven deforestation emissions and inform climate mitigation and policy assessments.
We present a global, gridded dataset (1 km resolution) of consumption-based deforestation carbon...


Altmetrics
Final-revised paper
Preprint